
Acoustic Modal Characteristics of Pump Tower Structures Based on Fluid–Structure Coupling Effects


Abstract
1. Introduction
1.1. Research Background and Significance
1.2. Research Status
1.3. Research Objectives and Methods
- Analyzing the influence of internal and external fluid on modal behavior via dry and wet modal simulations.
- Investigating the effect of decreasing liquid level on the structure’s natural frequencies and mode shapes.
- Studying variations in the relative positions of identical mode shapes at different liquid levels.
2. Model Development and Validation
2.1. Research Object
2.2. Simulation Tools and Methods
2.2.1. Structural Modal Analysis
2.2.2. Mesh Independence Verification
2.2.3. Experimental Method
3. Modal Analysis of the Pump Tower Structure Under Fluid Effects and the Influence of Liquid Level Variation
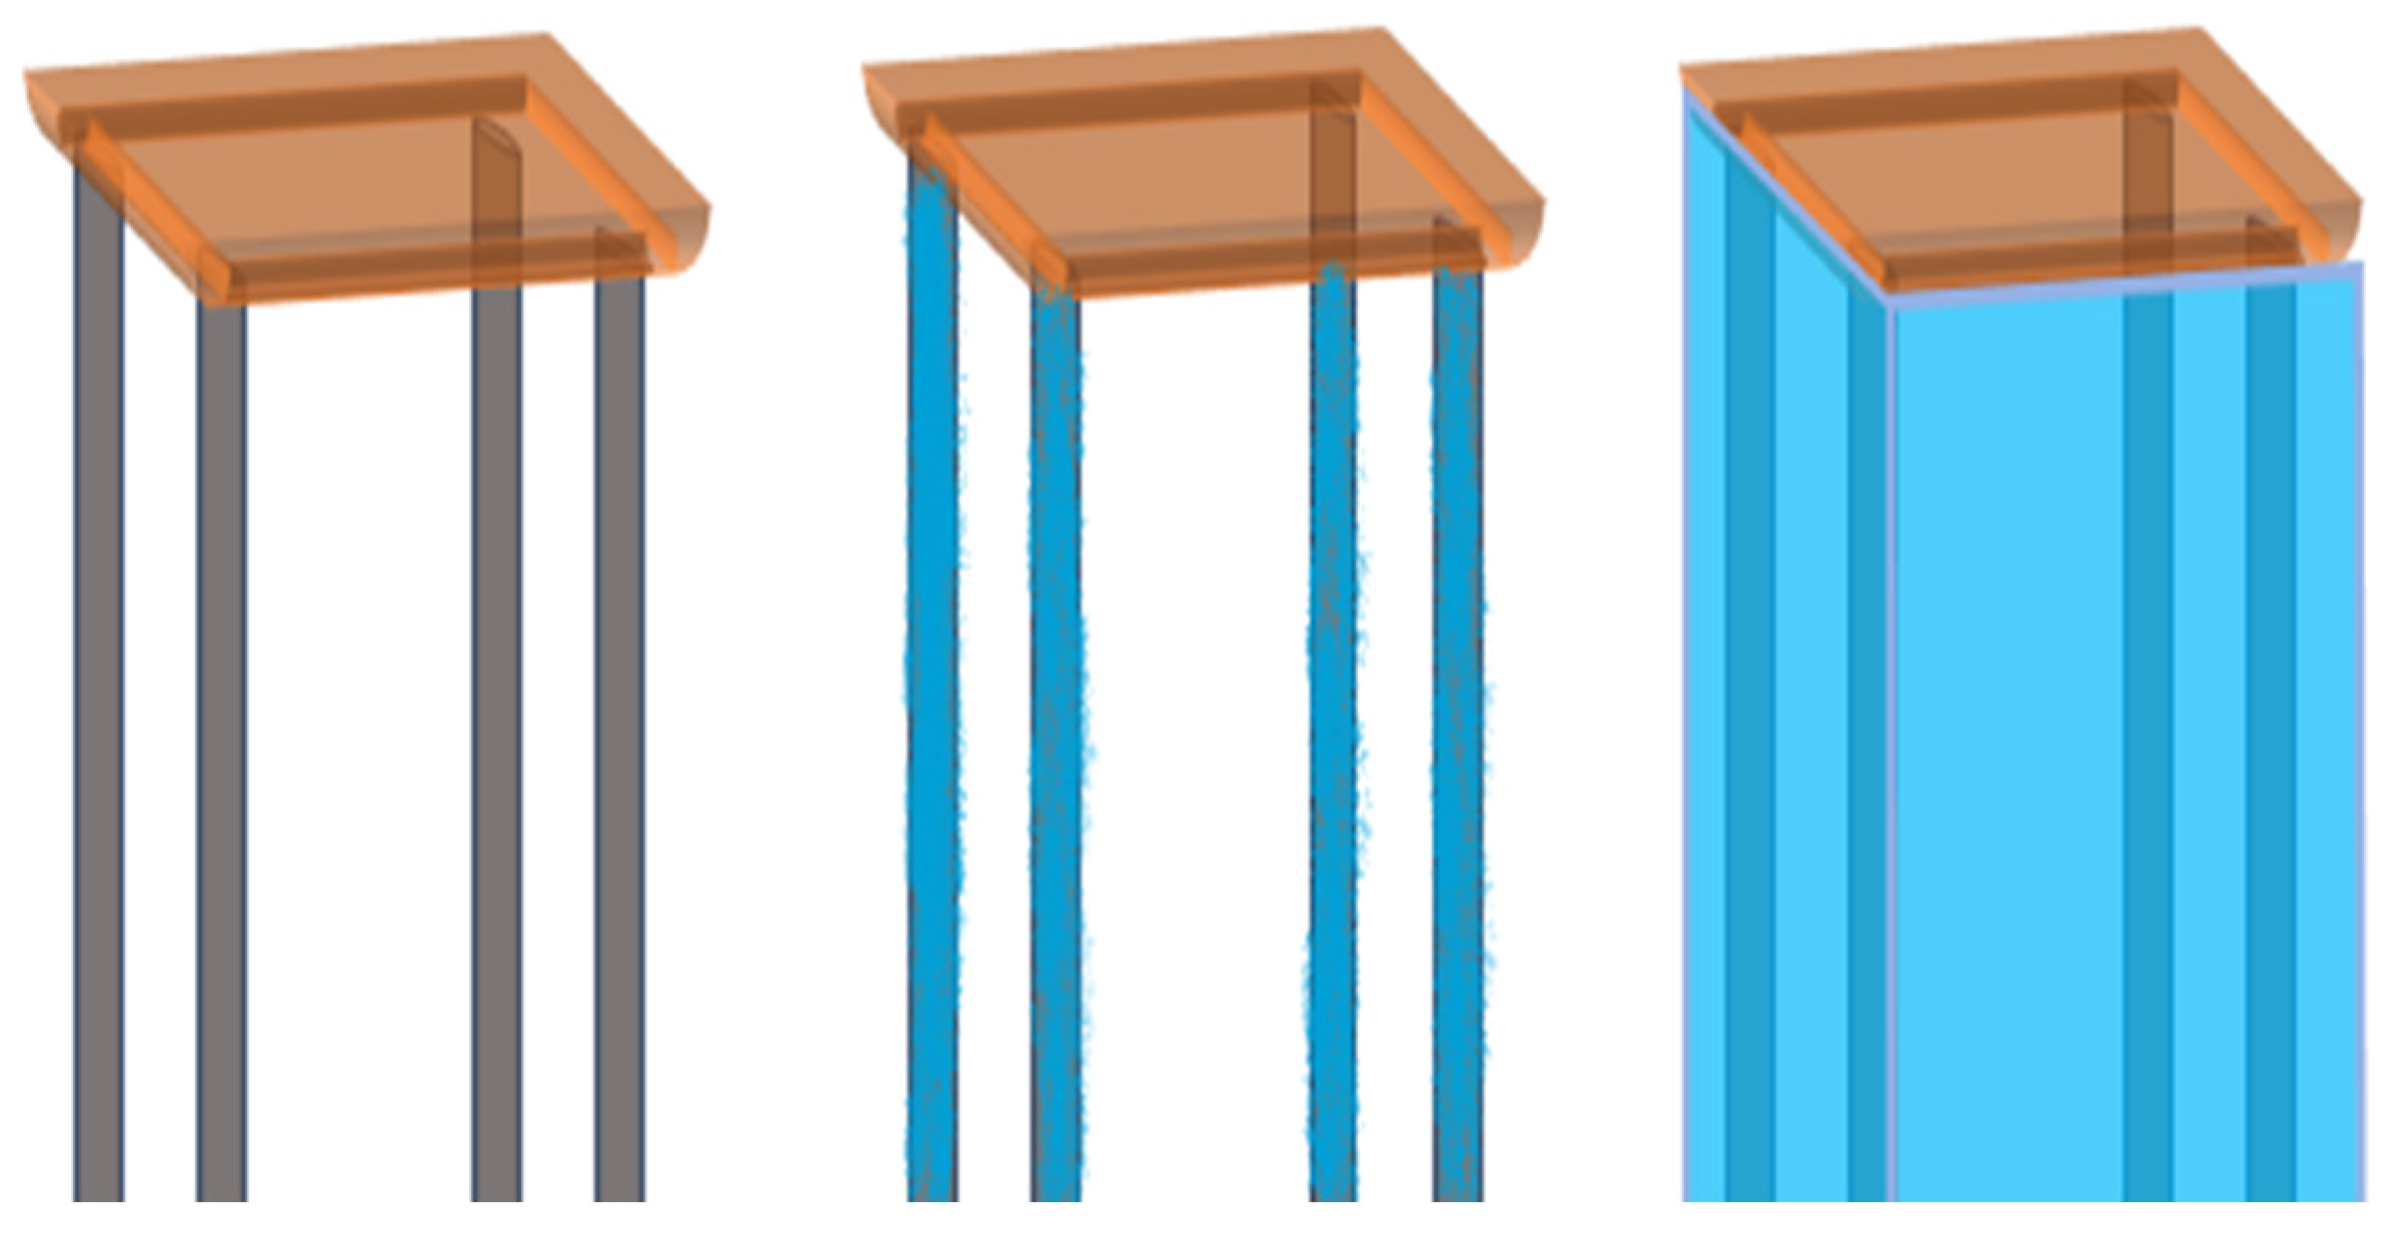
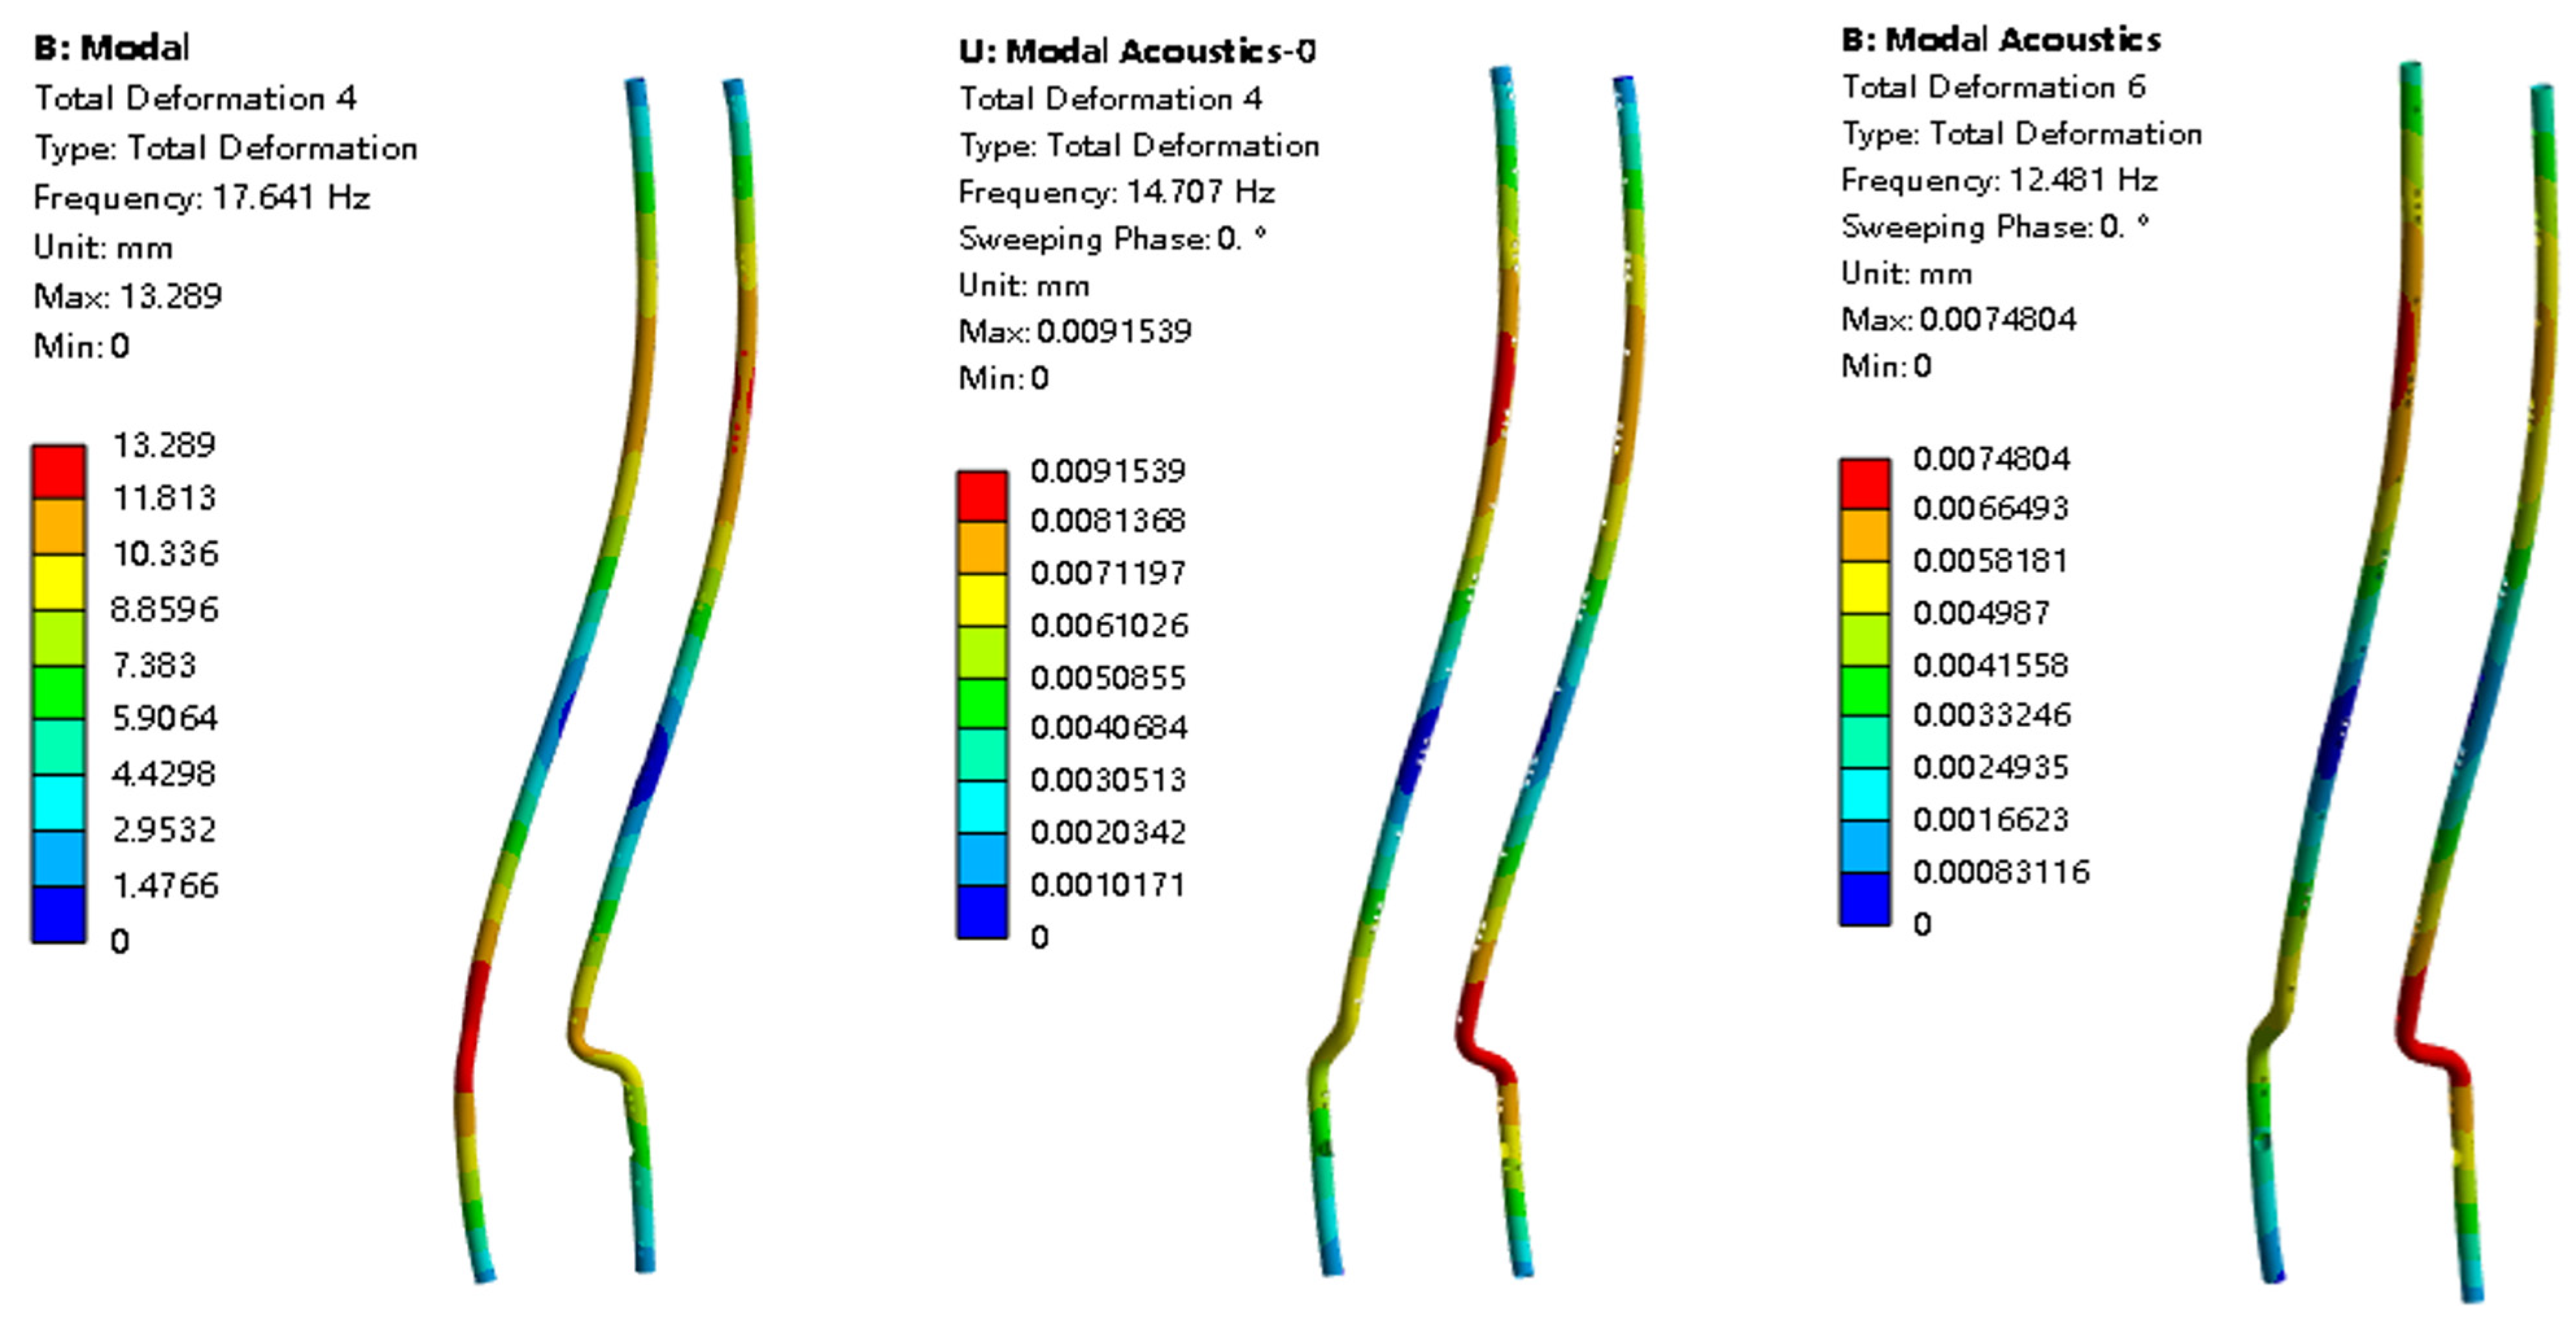
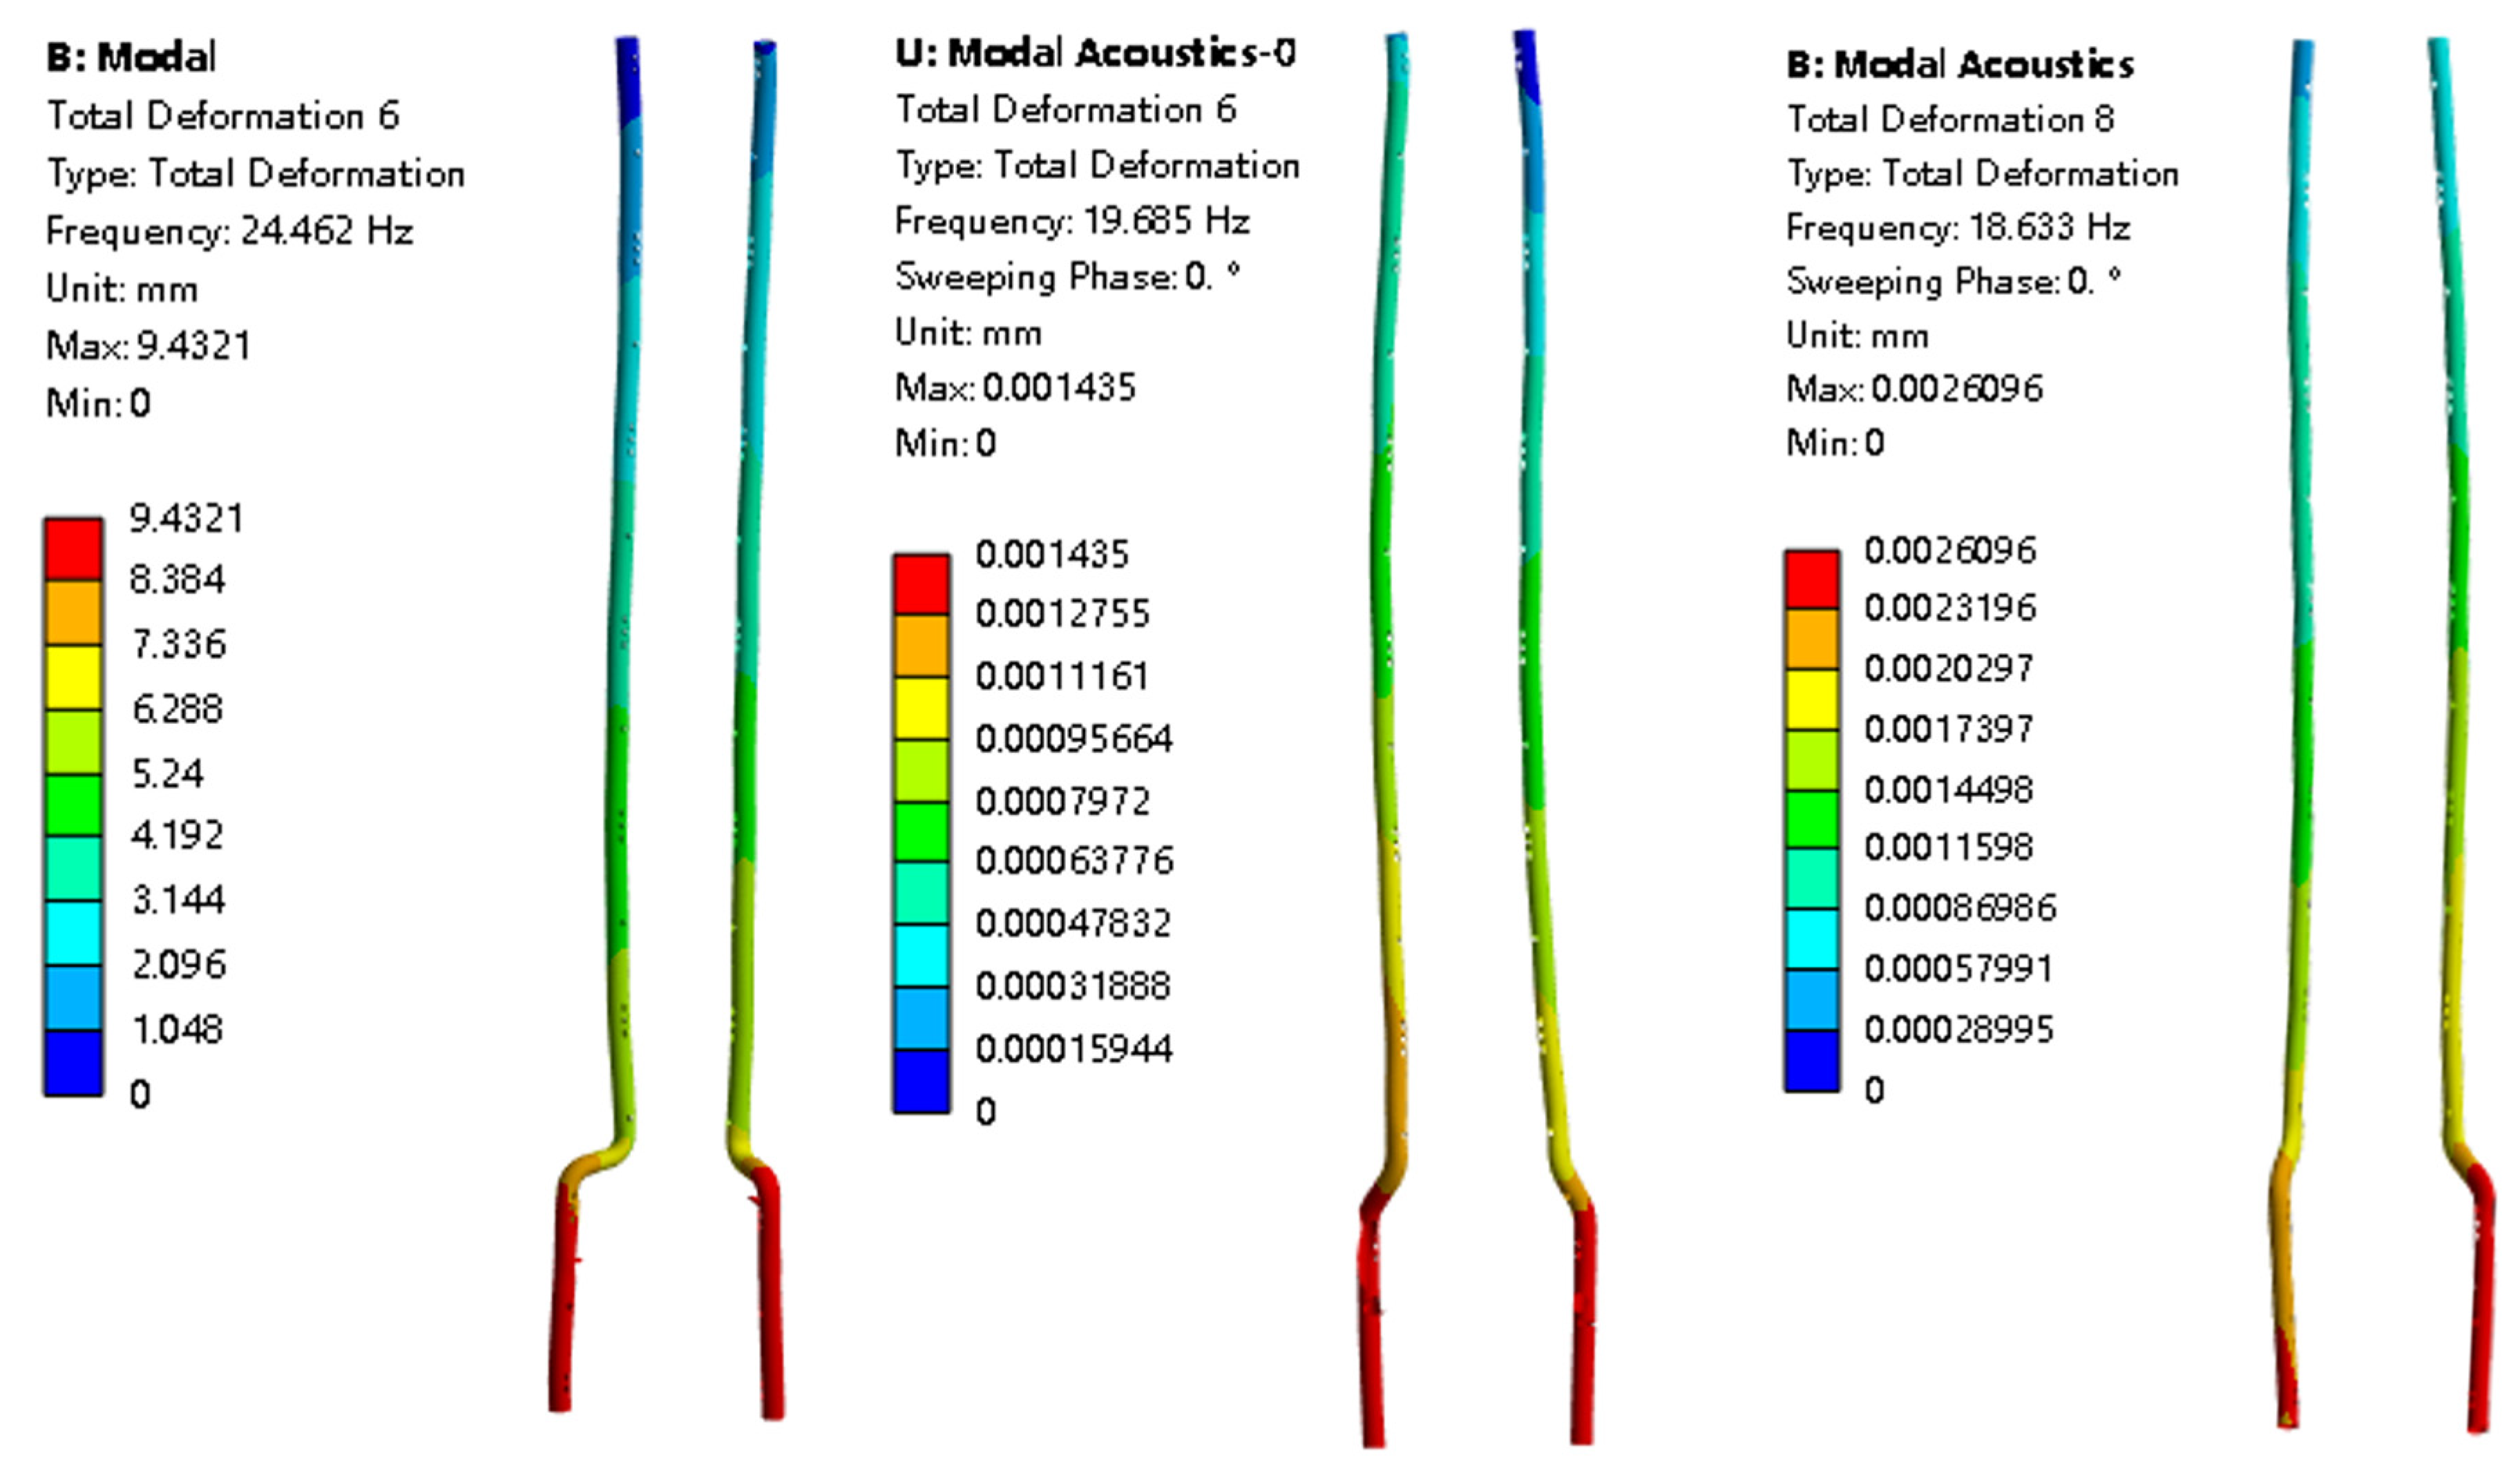
3.1. Influence of Internal and External Fluids on the Modal Characteristics of the Pump Tower
- Compared with external fluid, the internal liquid in the pipeline has a greater influence on the mode shapes, especially the maximum deformation during vibration.
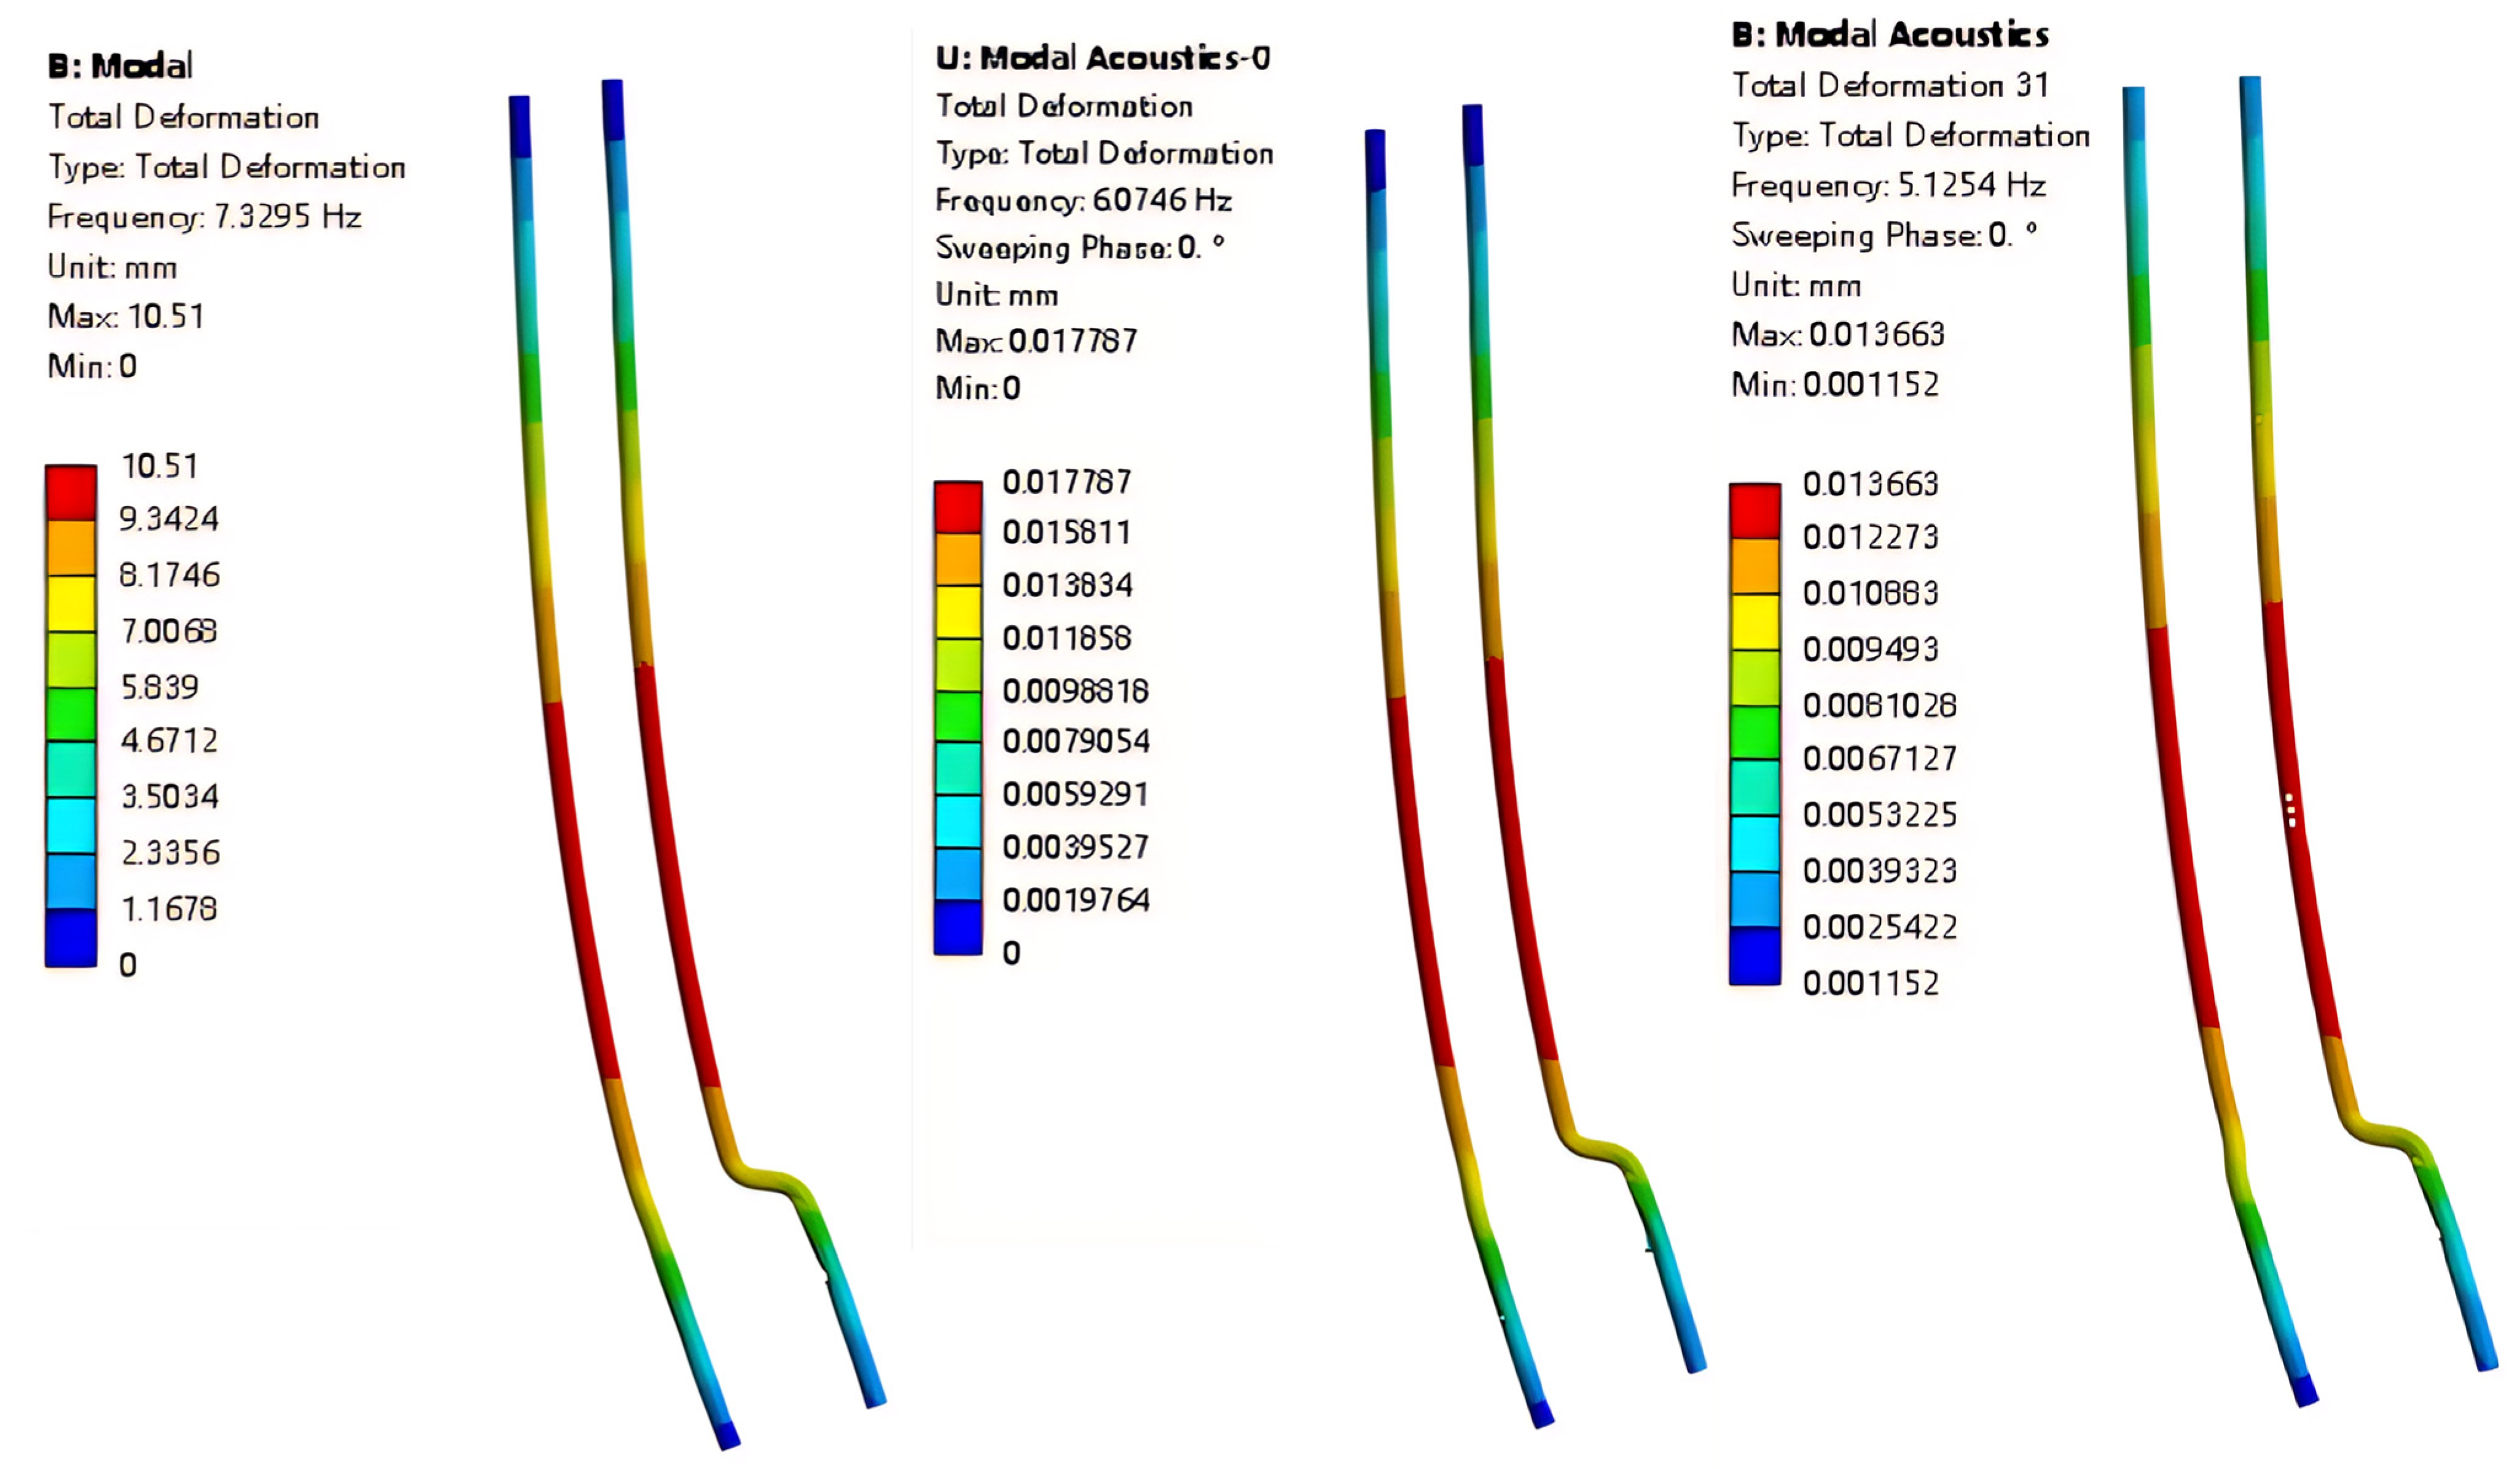
- The internal liquid in the pipeline also has a much greater effect on the decrease in frequency than the external liquid (when the internal pipeline changes from no liquid to full of liquid, the decrease rates of the first three mode frequencies are 17.12%, 16.8%, and 19.5%, respectively; when the liquid level changes from zero to fully immersed, the decrease rates of the first three mode frequencies are 15.6%, 15.1%, and 5.3%, respectively).
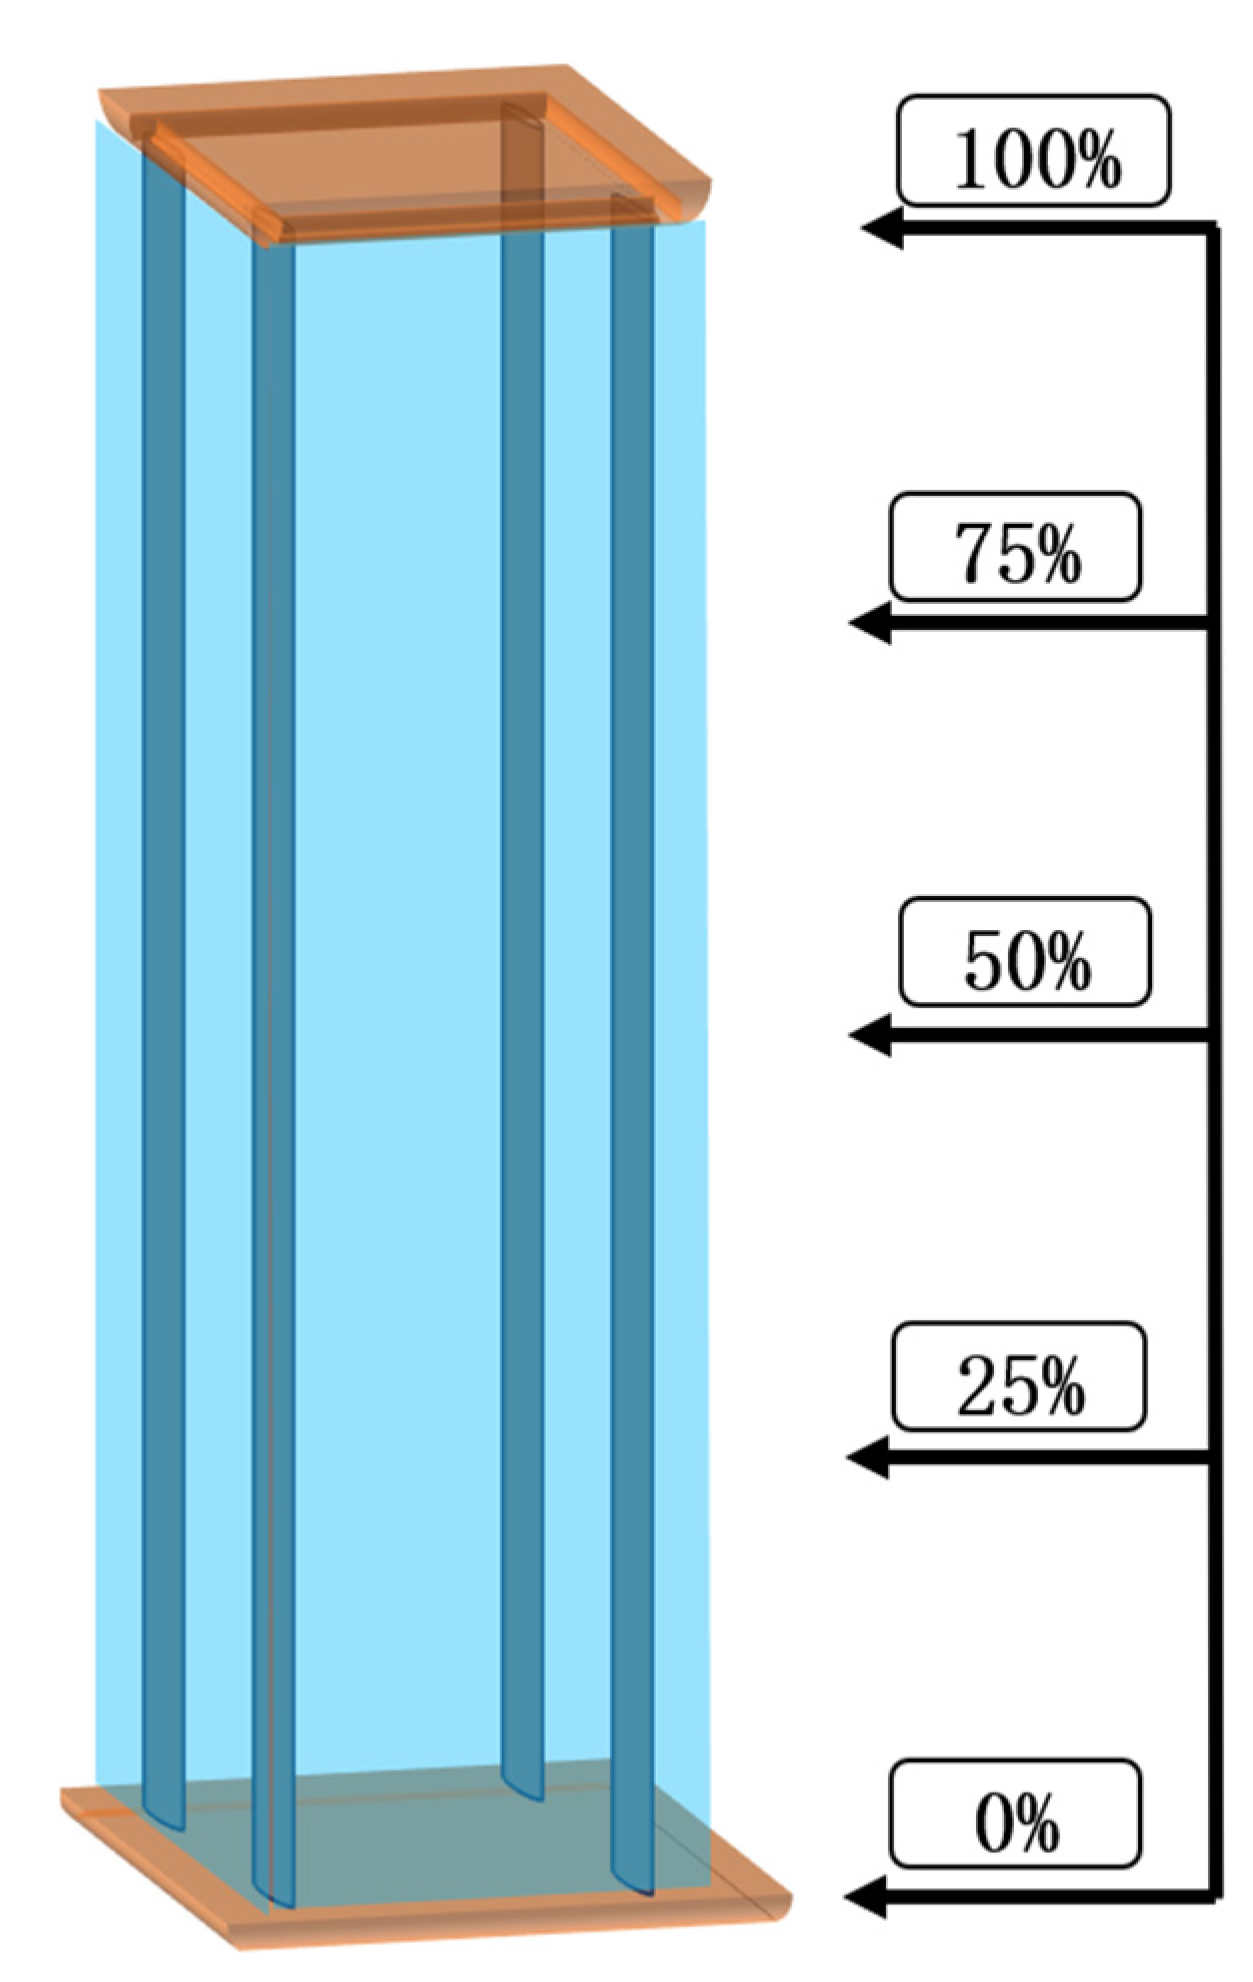
3.2. Law of Influence of Liquid Level Drop on Pump Tower Modal Characteristics
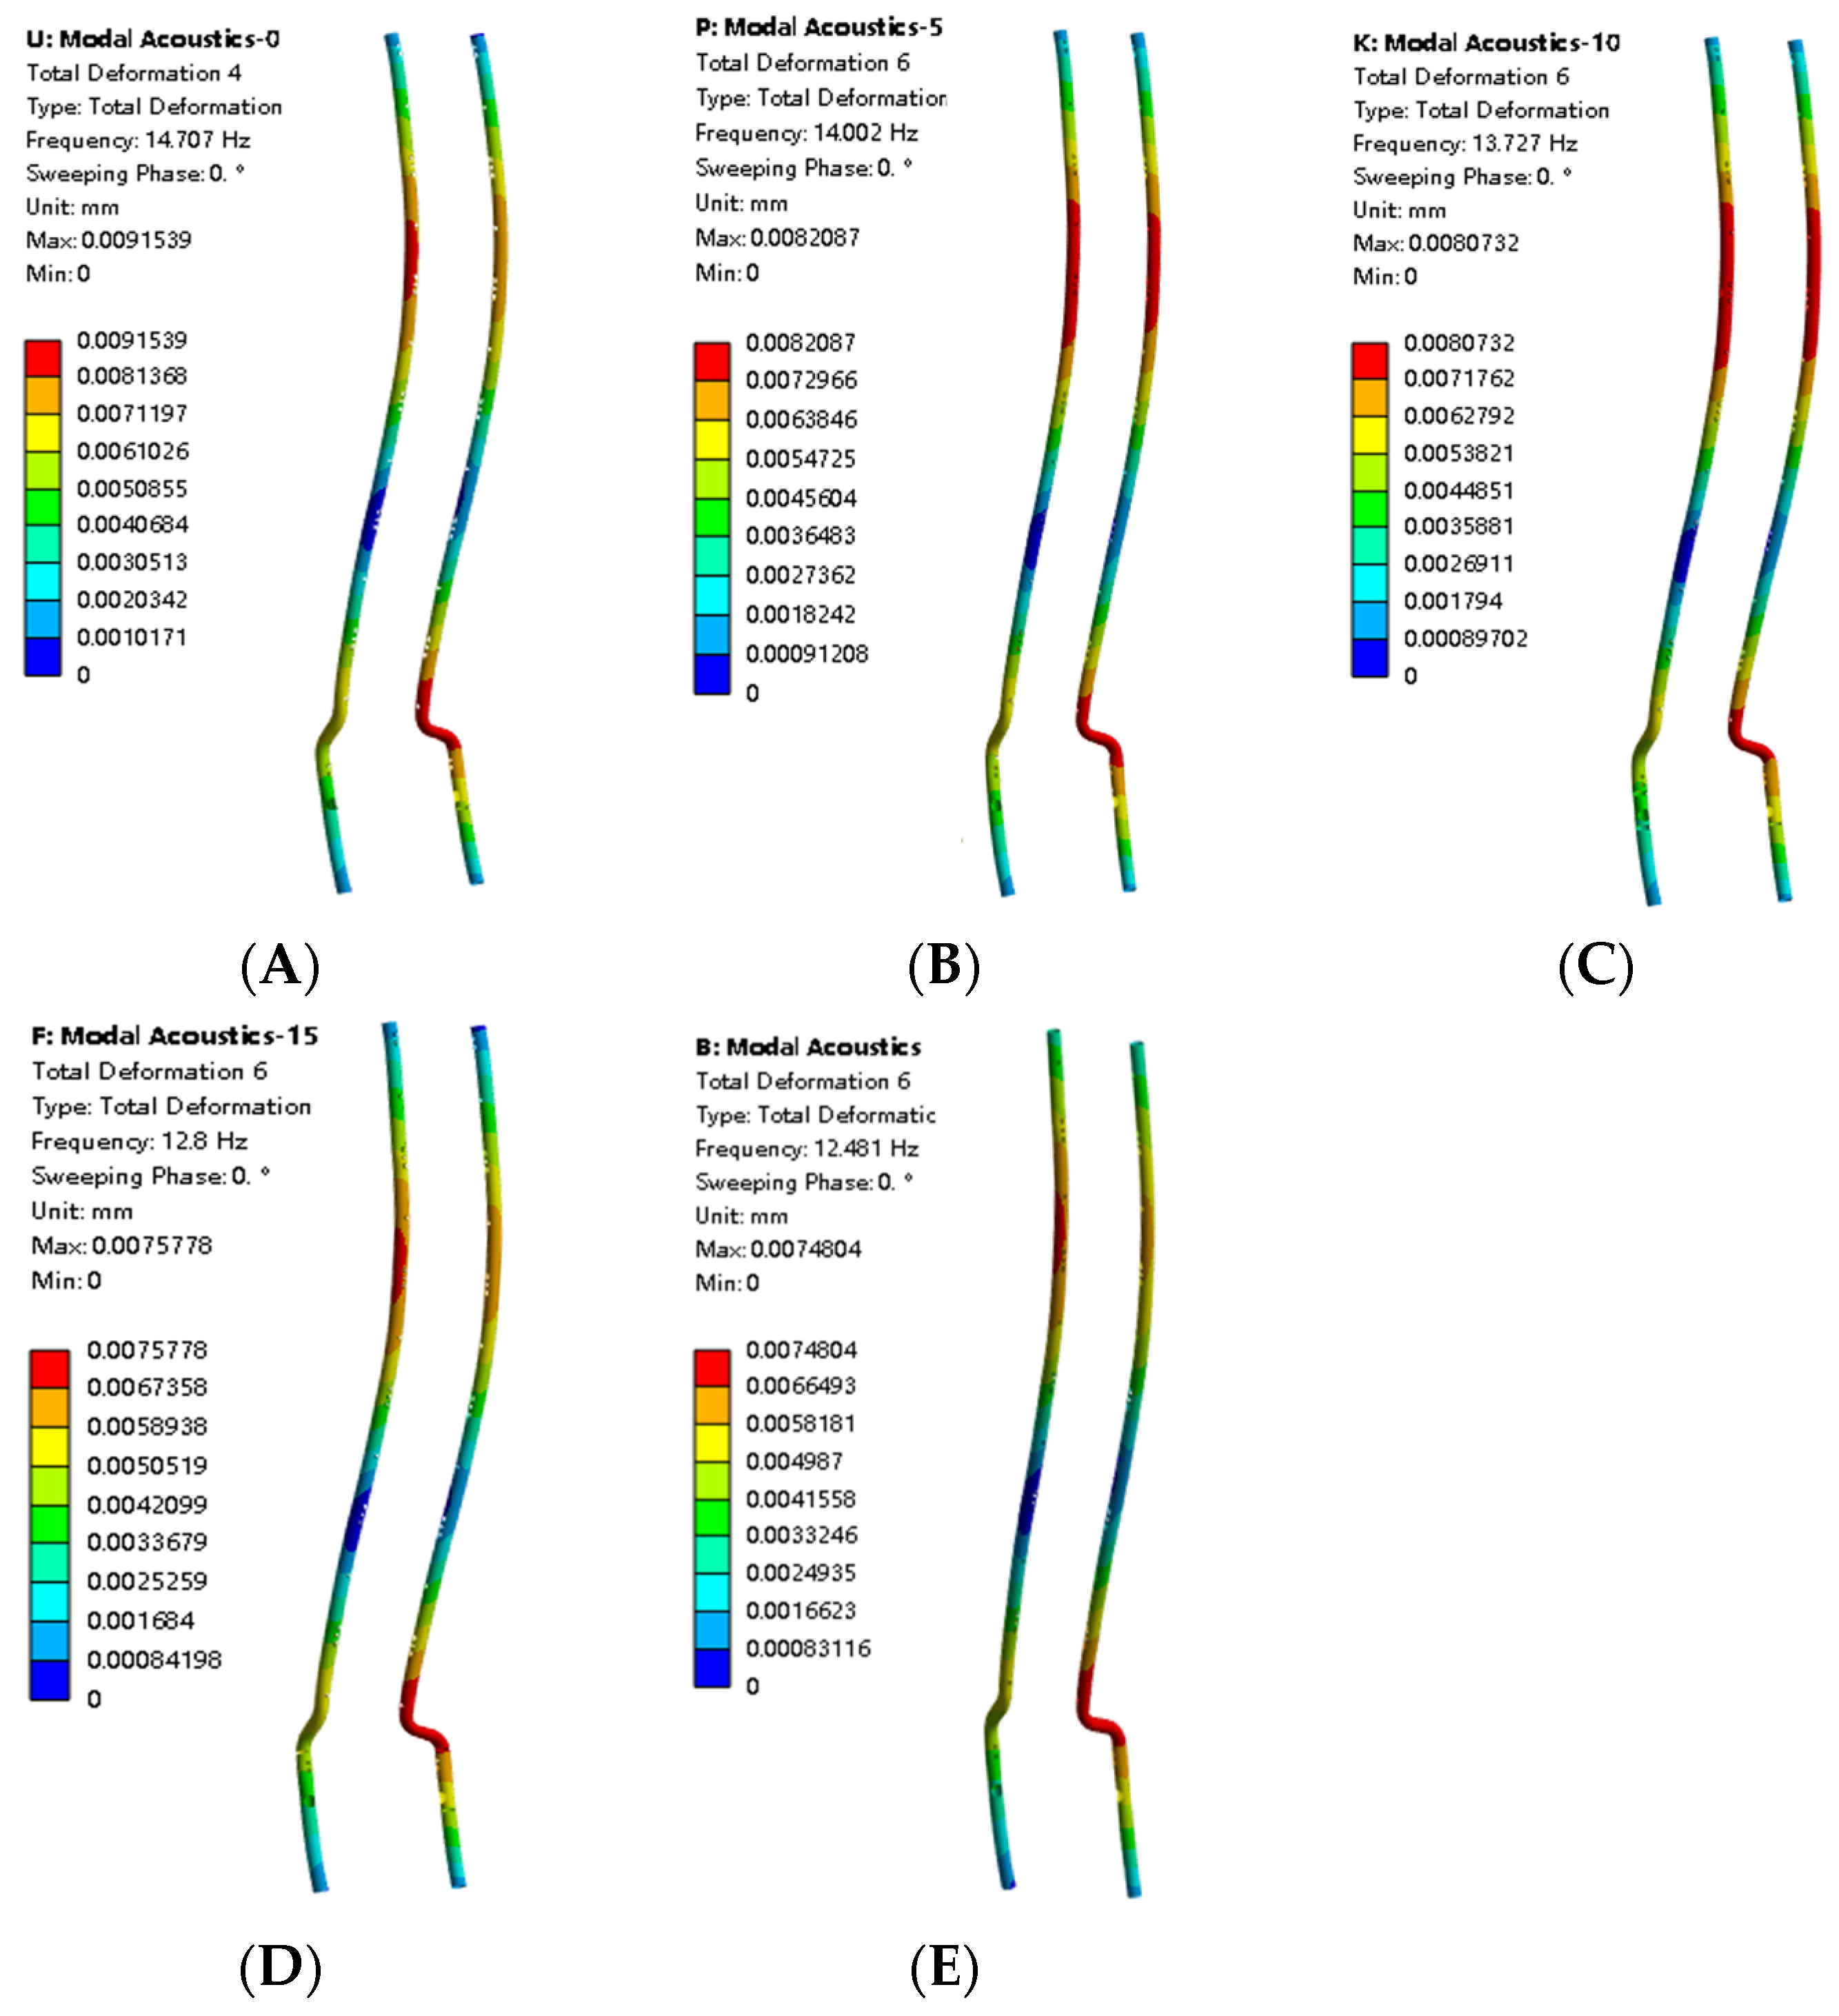
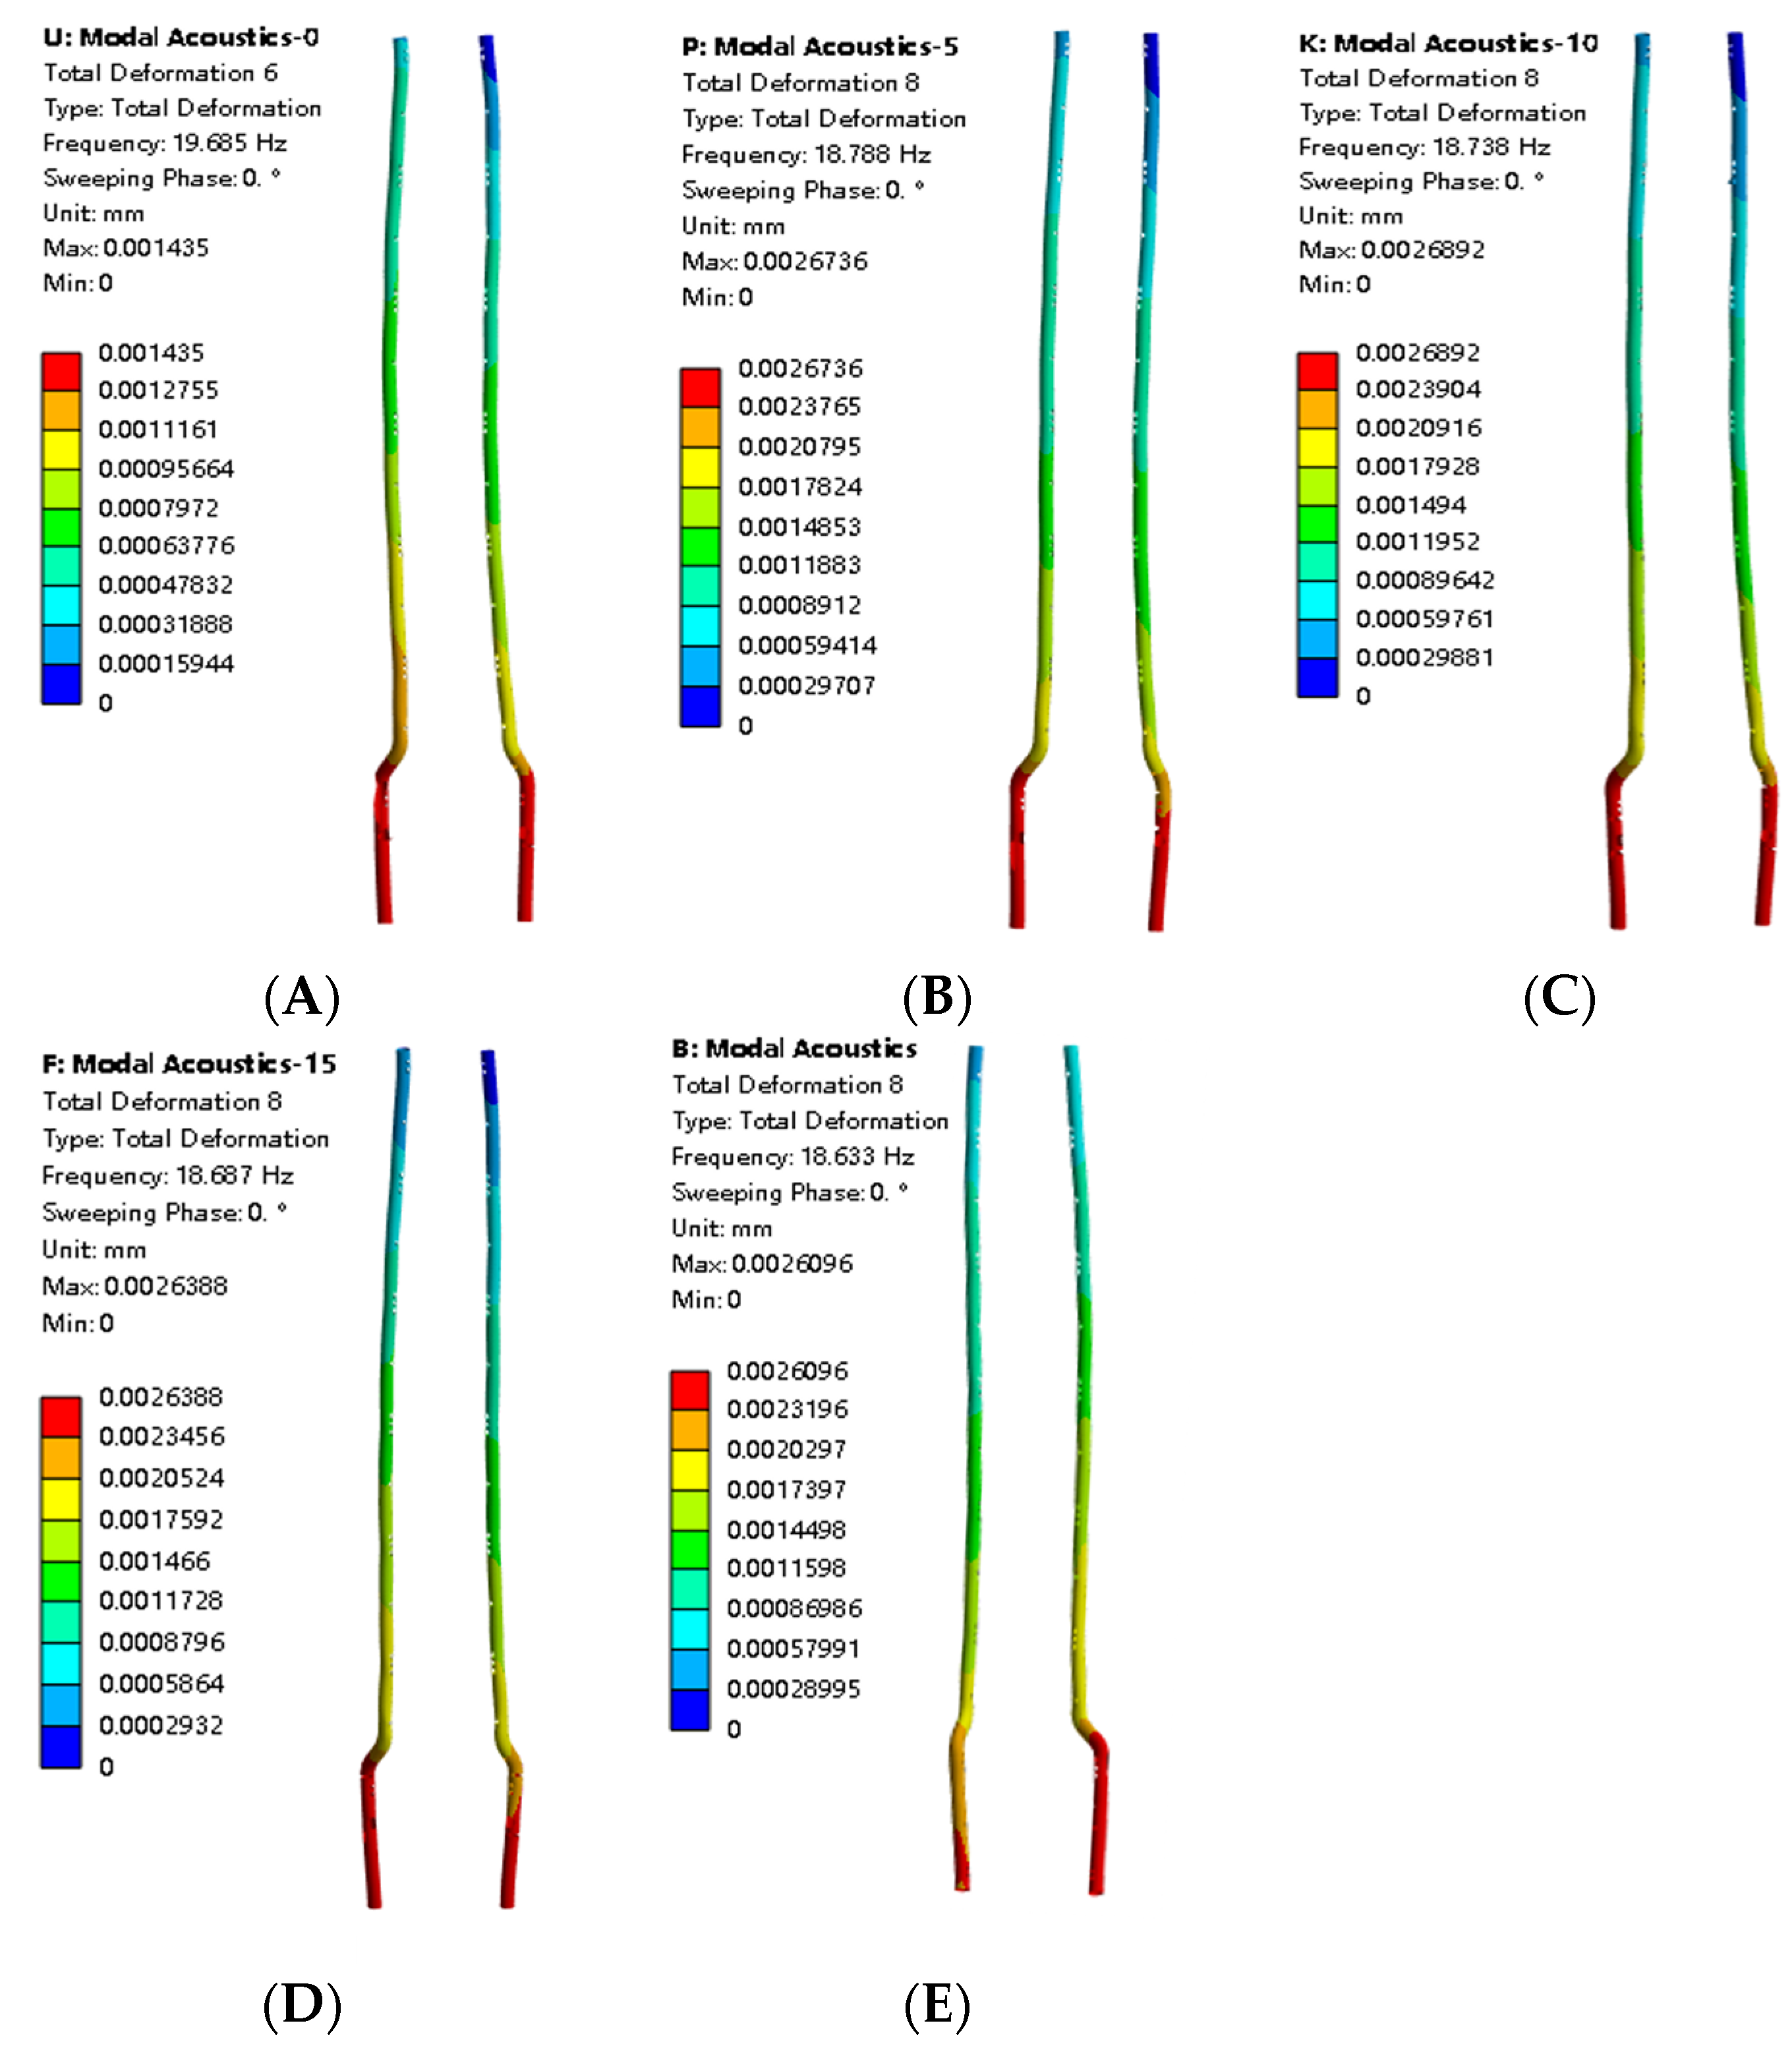
3.2.1. Mode Shape Comparison Analysis
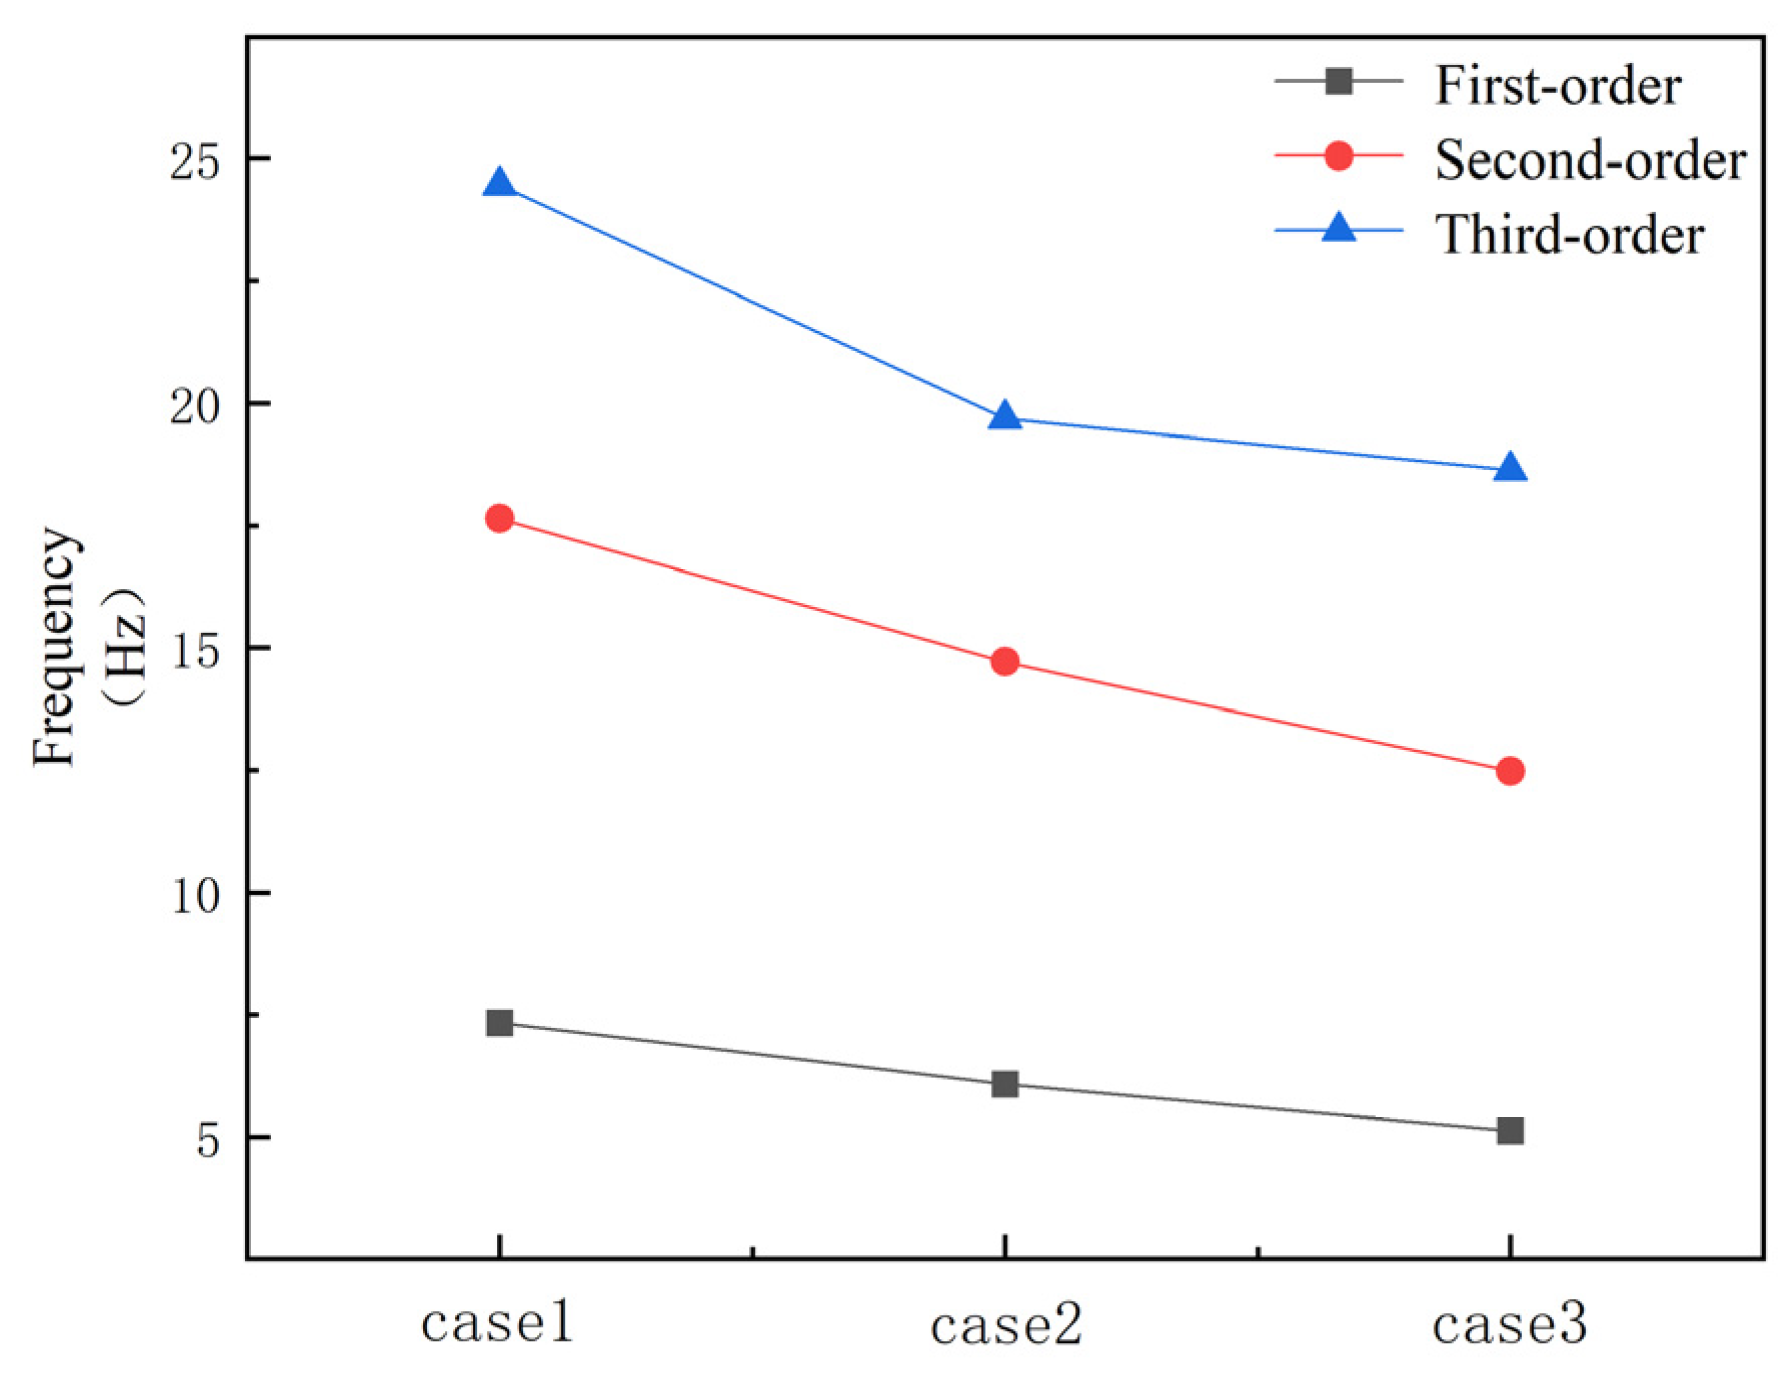
3.2.2. Influence of Liquid Level on Natural Frequency
- In the range of 50–75% liquid level, the frequency drops the fastest, indicating that the added mass effect of the fluid is most significant in this interval.
- The higher the mode order, the lower the frequency reduction rate caused by the liquid level rise.
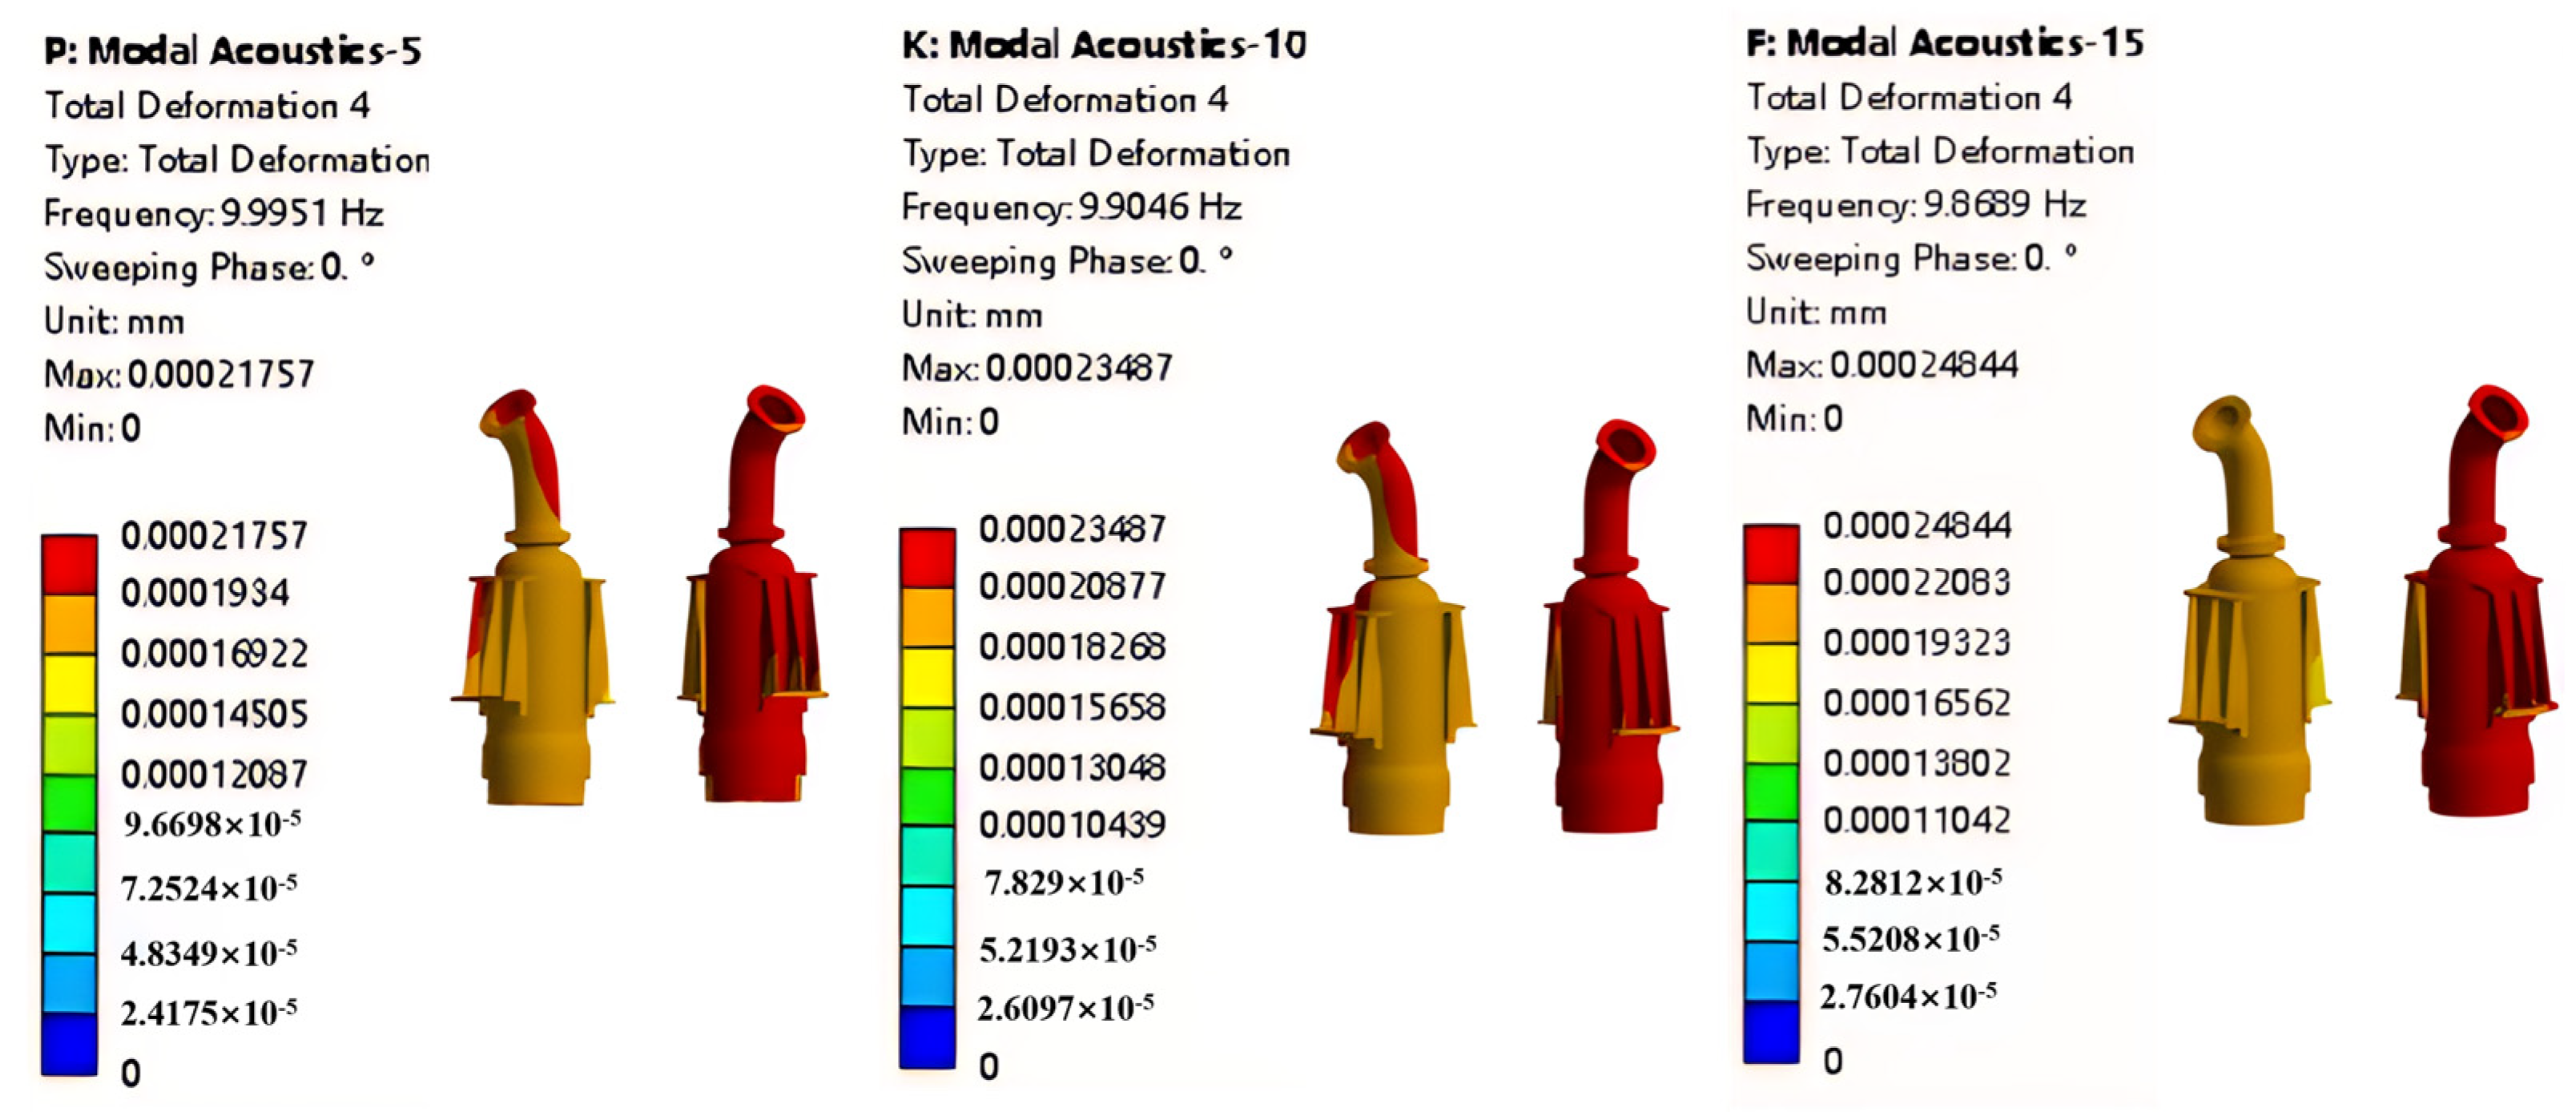
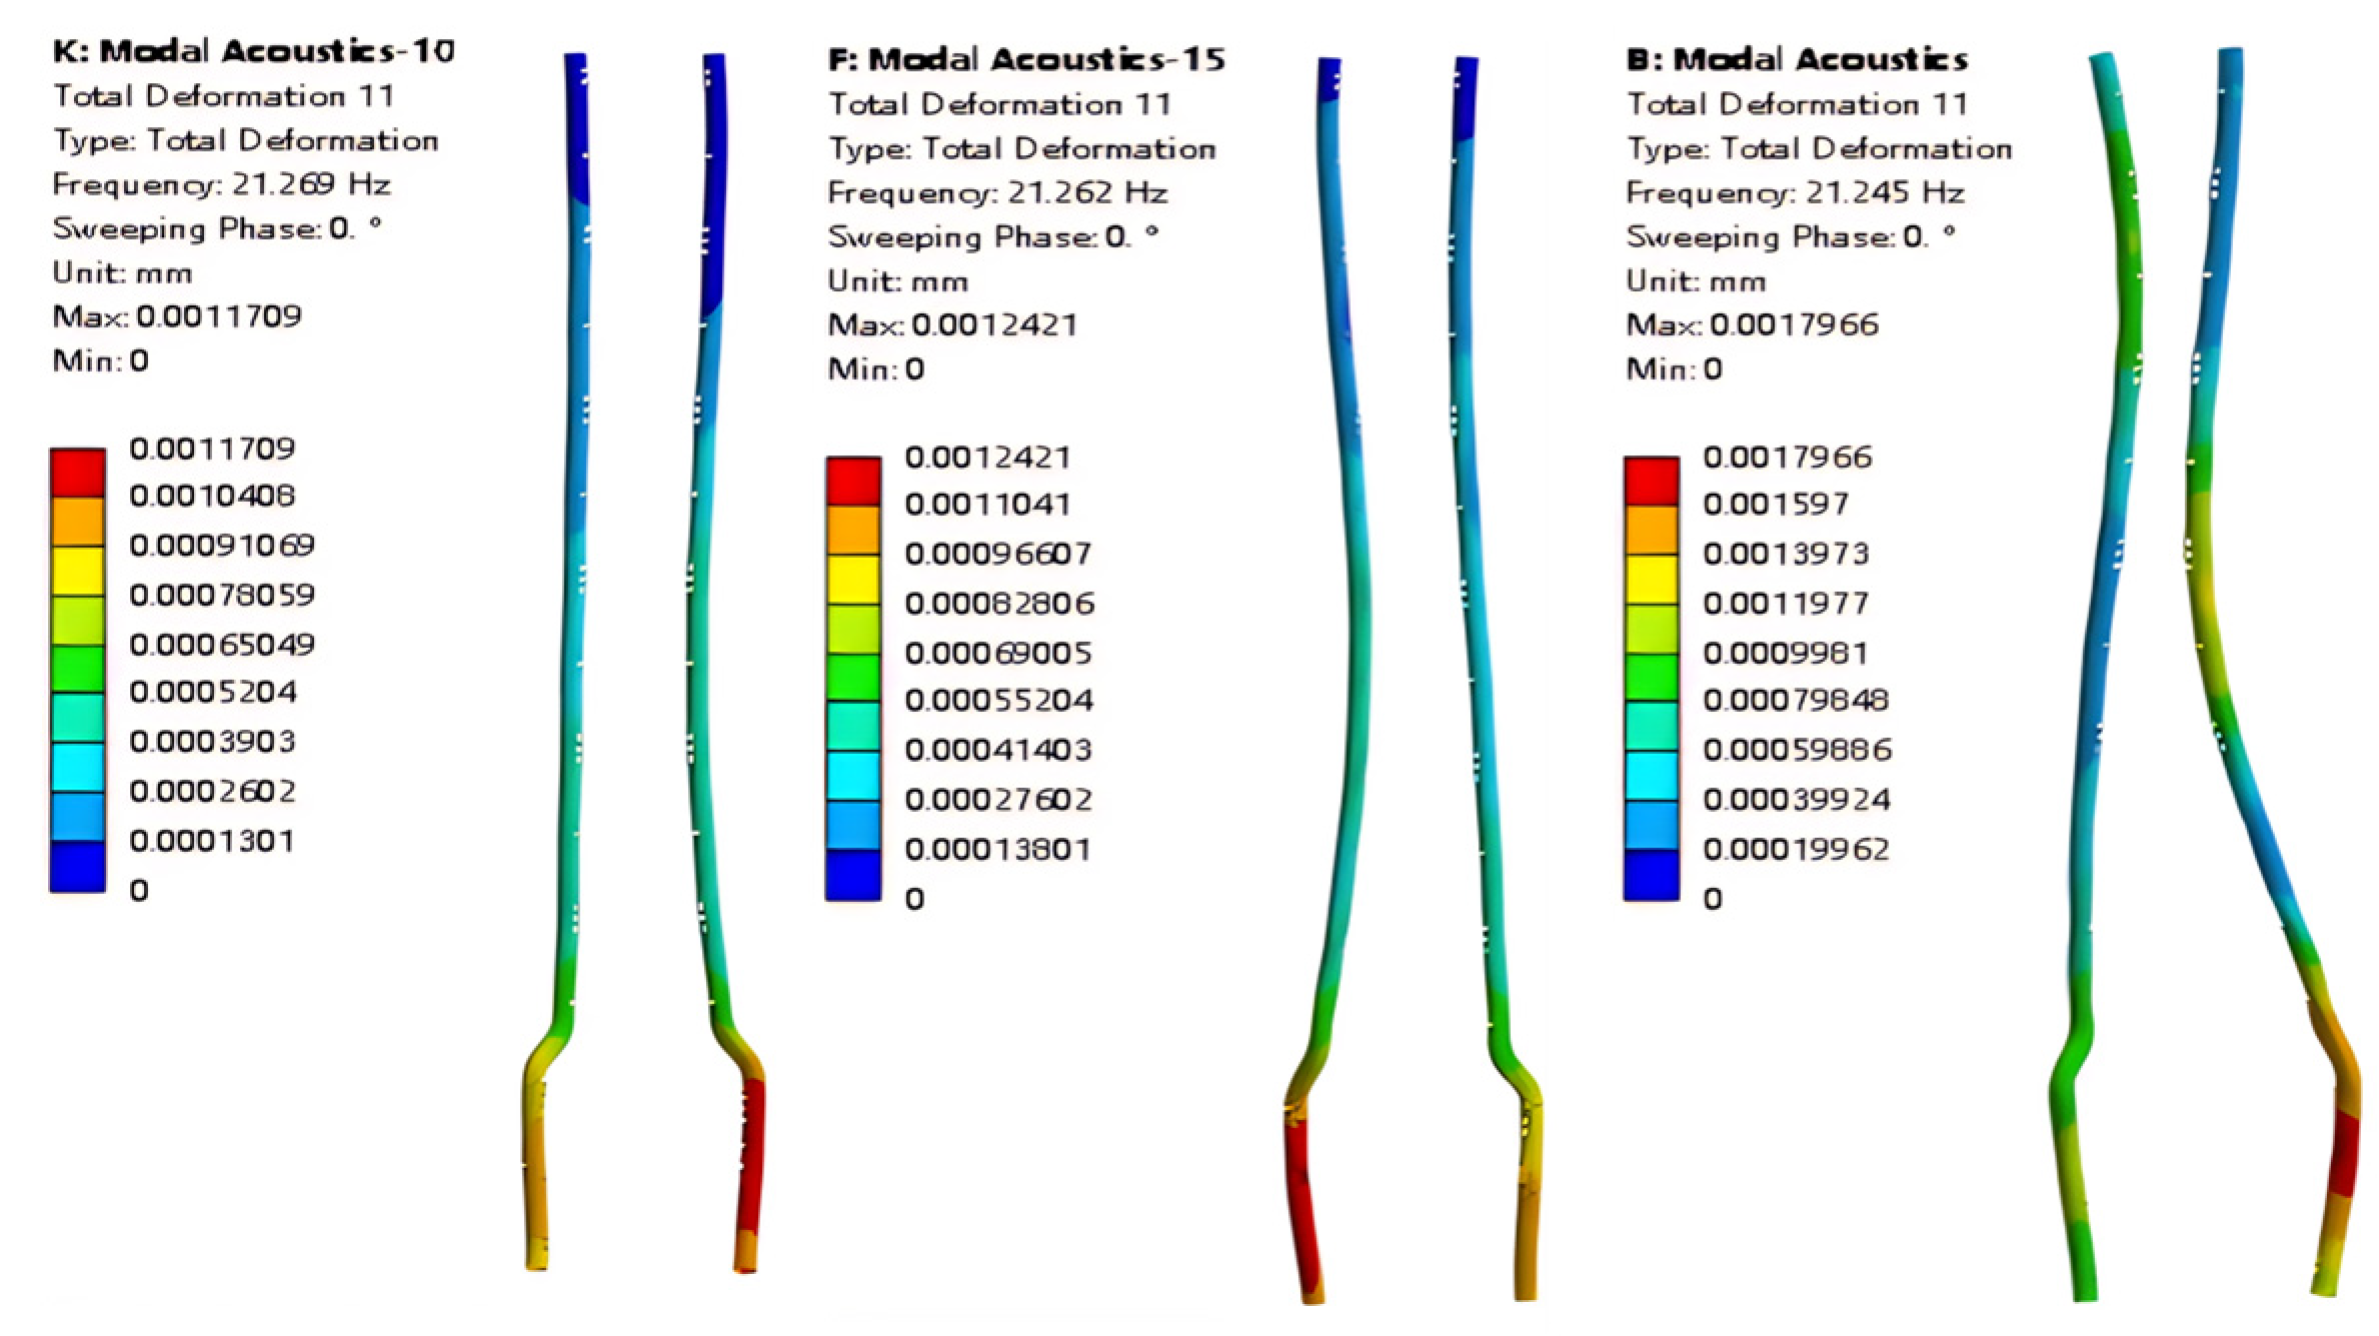
3.3. Relative Position Variation in the Same Mode Shape
4. Conclusions
- Influence of Fluid on the Modal Characteristics of the Pump Tower: the vibration characteristics of the pump tower structure vary significantly under different fluid environments. The internal liquid in the pipeline has a much greater influence on the mode shapes and natural frequencies than the external liquid. By comparing dry and wet modal conditions, it is found that wet modes, which fully consider the added mass and damping effects of the fluid, exhibit significantly lower low-order natural frequencies compared to dry modes. Meanwhile, the mode shapes in wet modes also present smoother and more global deformation distributions.
- Influence of Liquid Level Variation on the Modal Characteristics of the Pump Tower: as the liquid level gradually increases, the natural frequencies of the pump tower show a continuous downward trend. Particularly in the 50% to 75% liquid level range, the effect of fluid added mass is most significant, and the frequency variation in low-order modes (such as the first and second modes) is especially obvious. In addition, liquid level changes also affect the mode shapes, causing slight adjustments in local displacement distributions and deformation magnitudes.
- Influence of Liquid Level on Local Mode Shapes: under varying liquid levels, local mode shapes of the pump tower also change accordingly. Especially in the connection regions between the pump units and pipelines, the amount and location of deformation change with increasing liquid level. Moreover, liquid level variation can lead to the redistribution of vibration energy across different parts of the structure, which may affect the overall vibration coordination and cause local stress concentrations. The higher the mode order, the lower the frequency reduction rate caused by liquid level rise.
Author Contributions
Funding
Data Availability Statement
Conflicts of Interest
References
- Ma, F. Structural Analysis of Pump Tower in LNG Carrier Based on Sloshing Dynamic Load. Master’s Thesis, Dalian University of Technology, Dalian, China, 2010. [Google Scholar]
- Sun, C.; Huang, J.; Zhou, Q. Modal Calculation and Influence Law Study of Cylindrical Containers under Fluid Action. Chin. J. Appl. Mech. 2021, 38, 2079–2083. [Google Scholar] [CrossRef]
- Wang, L.; Zhu, L.; Li, J.; Zhao, T.; Sun, W. Vibration Modal Simulation Analysis of Outlet Pipeline of Piston Pump. J. Mech. Eng. Technol. 2023, 12, 177–187. [Google Scholar] [CrossRef]
- Dehkharqani, A.S.; Aidanpä, J.-O.; Engström, F.; Cervantes, M.J. A Review of Available Methods for the Assessment of Fluid Added Mass, Damping, and Stiffness with an Emphasis on Hydraulic Turbines. Appl. Mech. Rev. 2018, 70, 050801. [Google Scholar] [CrossRef]
- Wang, B.; Zhu, S.; Hao, P.; Bi, X.; Du, K.; Chen, B.; Ma, X.; Chao, Y.J. Buckling of quasi-perfect cylindrical shell under axial compression: A combined experimental and numerical investigation. Int. J. Solids Struct. 2018, 130, 232–247. [Google Scholar] [CrossRef]
- Lu, Y.; Guo, Z.; Zheng, Z.; Wang, W.; Wang, H.; Zhou, F.; Wang, X. Underwater propeller turbine blade redesign based on developed inverse design method for energy performance improvement and cavitation suppression. Ocean. Eng. 2023, 277, 114315. [Google Scholar] [CrossRef]
- Chiba, M.; Matsushima, T.; Yamaki, N. Free vibration of a partially liquid-filled cylindrical tank. J. Sound Vib. 1985, 98, 235–255. [Google Scholar]
- Ning, D.; Su, P.; Zhang, C. Hydrodynamic Characteristics of Floater-Type Anti-Sloshing Structure in a 3D Liquid Tank. J. Hebei Univ. Eng. 2018, 40, 154–161. [Google Scholar]
- Zhou, L.; Hou, Y.; Wang, W.; Yang, Y. Numerical modal analysis of multistage centrifugal pump based on LMS Virtual Lab. J. Fluid Mach. 2017, 45, 21–25. [Google Scholar] [CrossRef]
- Chen, S.; Zhou, Y.; Tang, Z.; Lu, S. Modal vibration response of rice combine harvester frame under multi-source excitation. Biosyst. Eng. 2020, 194, 177–195. [Google Scholar] [CrossRef]
- Cao, J.; Luo, Y.; Shi, Y.; Liu, X.; Xu, D.; Wang, Y.; Zhai, L.; Wang, Z. A review of hydro-turbine unit rotor system dynamic behavior: Multi-field coupling of a three-dimensional model. Phys. Fluids 2024, 36, 121304. [Google Scholar] [CrossRef]
- Wang, F. Study on Propeller Acoustic Radiation Under Hull-Propeller Coupling. Master’s Thesis, Harbin Institute of Technology, Harbin, China, 2024. [Google Scholar]
- Wang, X.; Li, K.; Bai, C.; Li, Y. Modal analysis of cabin seat structure for large commercial aircraft. Today’s Manuf. Upgrad. 2022, 11, 167–170. [Google Scholar]
- Lu, Y.; Xin, L.; Hu, N.; Zhu, Z.; Xia, W. Influences of floating ice on the water entry process of slender body on the cavity evolution and hydrodynamic characteristics. Phys. Fluids 2025, 37, 42103. [Google Scholar] [CrossRef]
- Wang, X.; Hong, T.; Liu, Y.; Yu, Z.; Guo, J.; Liu, Y. Optimized design for vibration reduction in a residual film recovery machine frame based on modal analysis. Agriculture 2024, 14, 543. [Google Scholar] [CrossRef]
- Liang, Z.; Li, Y.; Xu, L.; Zhao, Z.; Tang, Z. Optimum design of an array structure for the grain loss sensor to upgrade its resolution for harvesting rice in a combine harvester. Biosyst. Eng. 2017, 157, 24–34. [Google Scholar] [CrossRef]
- Zhou, D.; Zhang, N.; Zheng, F.; Gad, M.; Gao, B. Experimental investigation on the effect of the rotor-stator matching mode on velocity pulsation in the centrifugal pump with a vaned diffuser. Nucl. Eng. Technol. 2024, 57, 103255. [Google Scholar] [CrossRef]
- Li, D.; Zhang, N.; Jiang, J.; Gao, B.; Alubokin, A.A.; Zhou, W.; Shi, J. Numerical investigation on the unsteady vortical structure and pressure pulsations of a centrifugal pump with the vaned diffuser. Int. J. Heat Fluid Flow 2022, 98, 109050. [Google Scholar] [CrossRef]


| Material | Density (kg/m3) | Young’s Modulus (pa) | Thermal Expansion Coefficient (°C−1) |
|---|---|---|---|
| Aluminum | 2770 | 7.1 × 10¹⁰ | 2.3 × 10⁻⁵ |
| 304L | 7930 | 2.01 × 10¹¹ | 1.2 × 10⁻⁵ |
| Mesh Scheme | Total Elements | 1st-Order Frequency | 2nd-Order Frequency | Error vs. C (1st) | Error vs. C (2nd) |
|---|---|---|---|---|---|
| A | 211,063 | 7.45 Hz | 8.02 Hz | +2.05% | +3.89% |
| B | 397,655 | 7.32 Hz | 7.78 Hz | +0.27% | +0.78% |
| C | 723,458 | 7.30 Hz | 7.72 Hz | —— | —— |
| Modal Type | Experiment | Simulation | Deviation | |
|---|---|---|---|---|
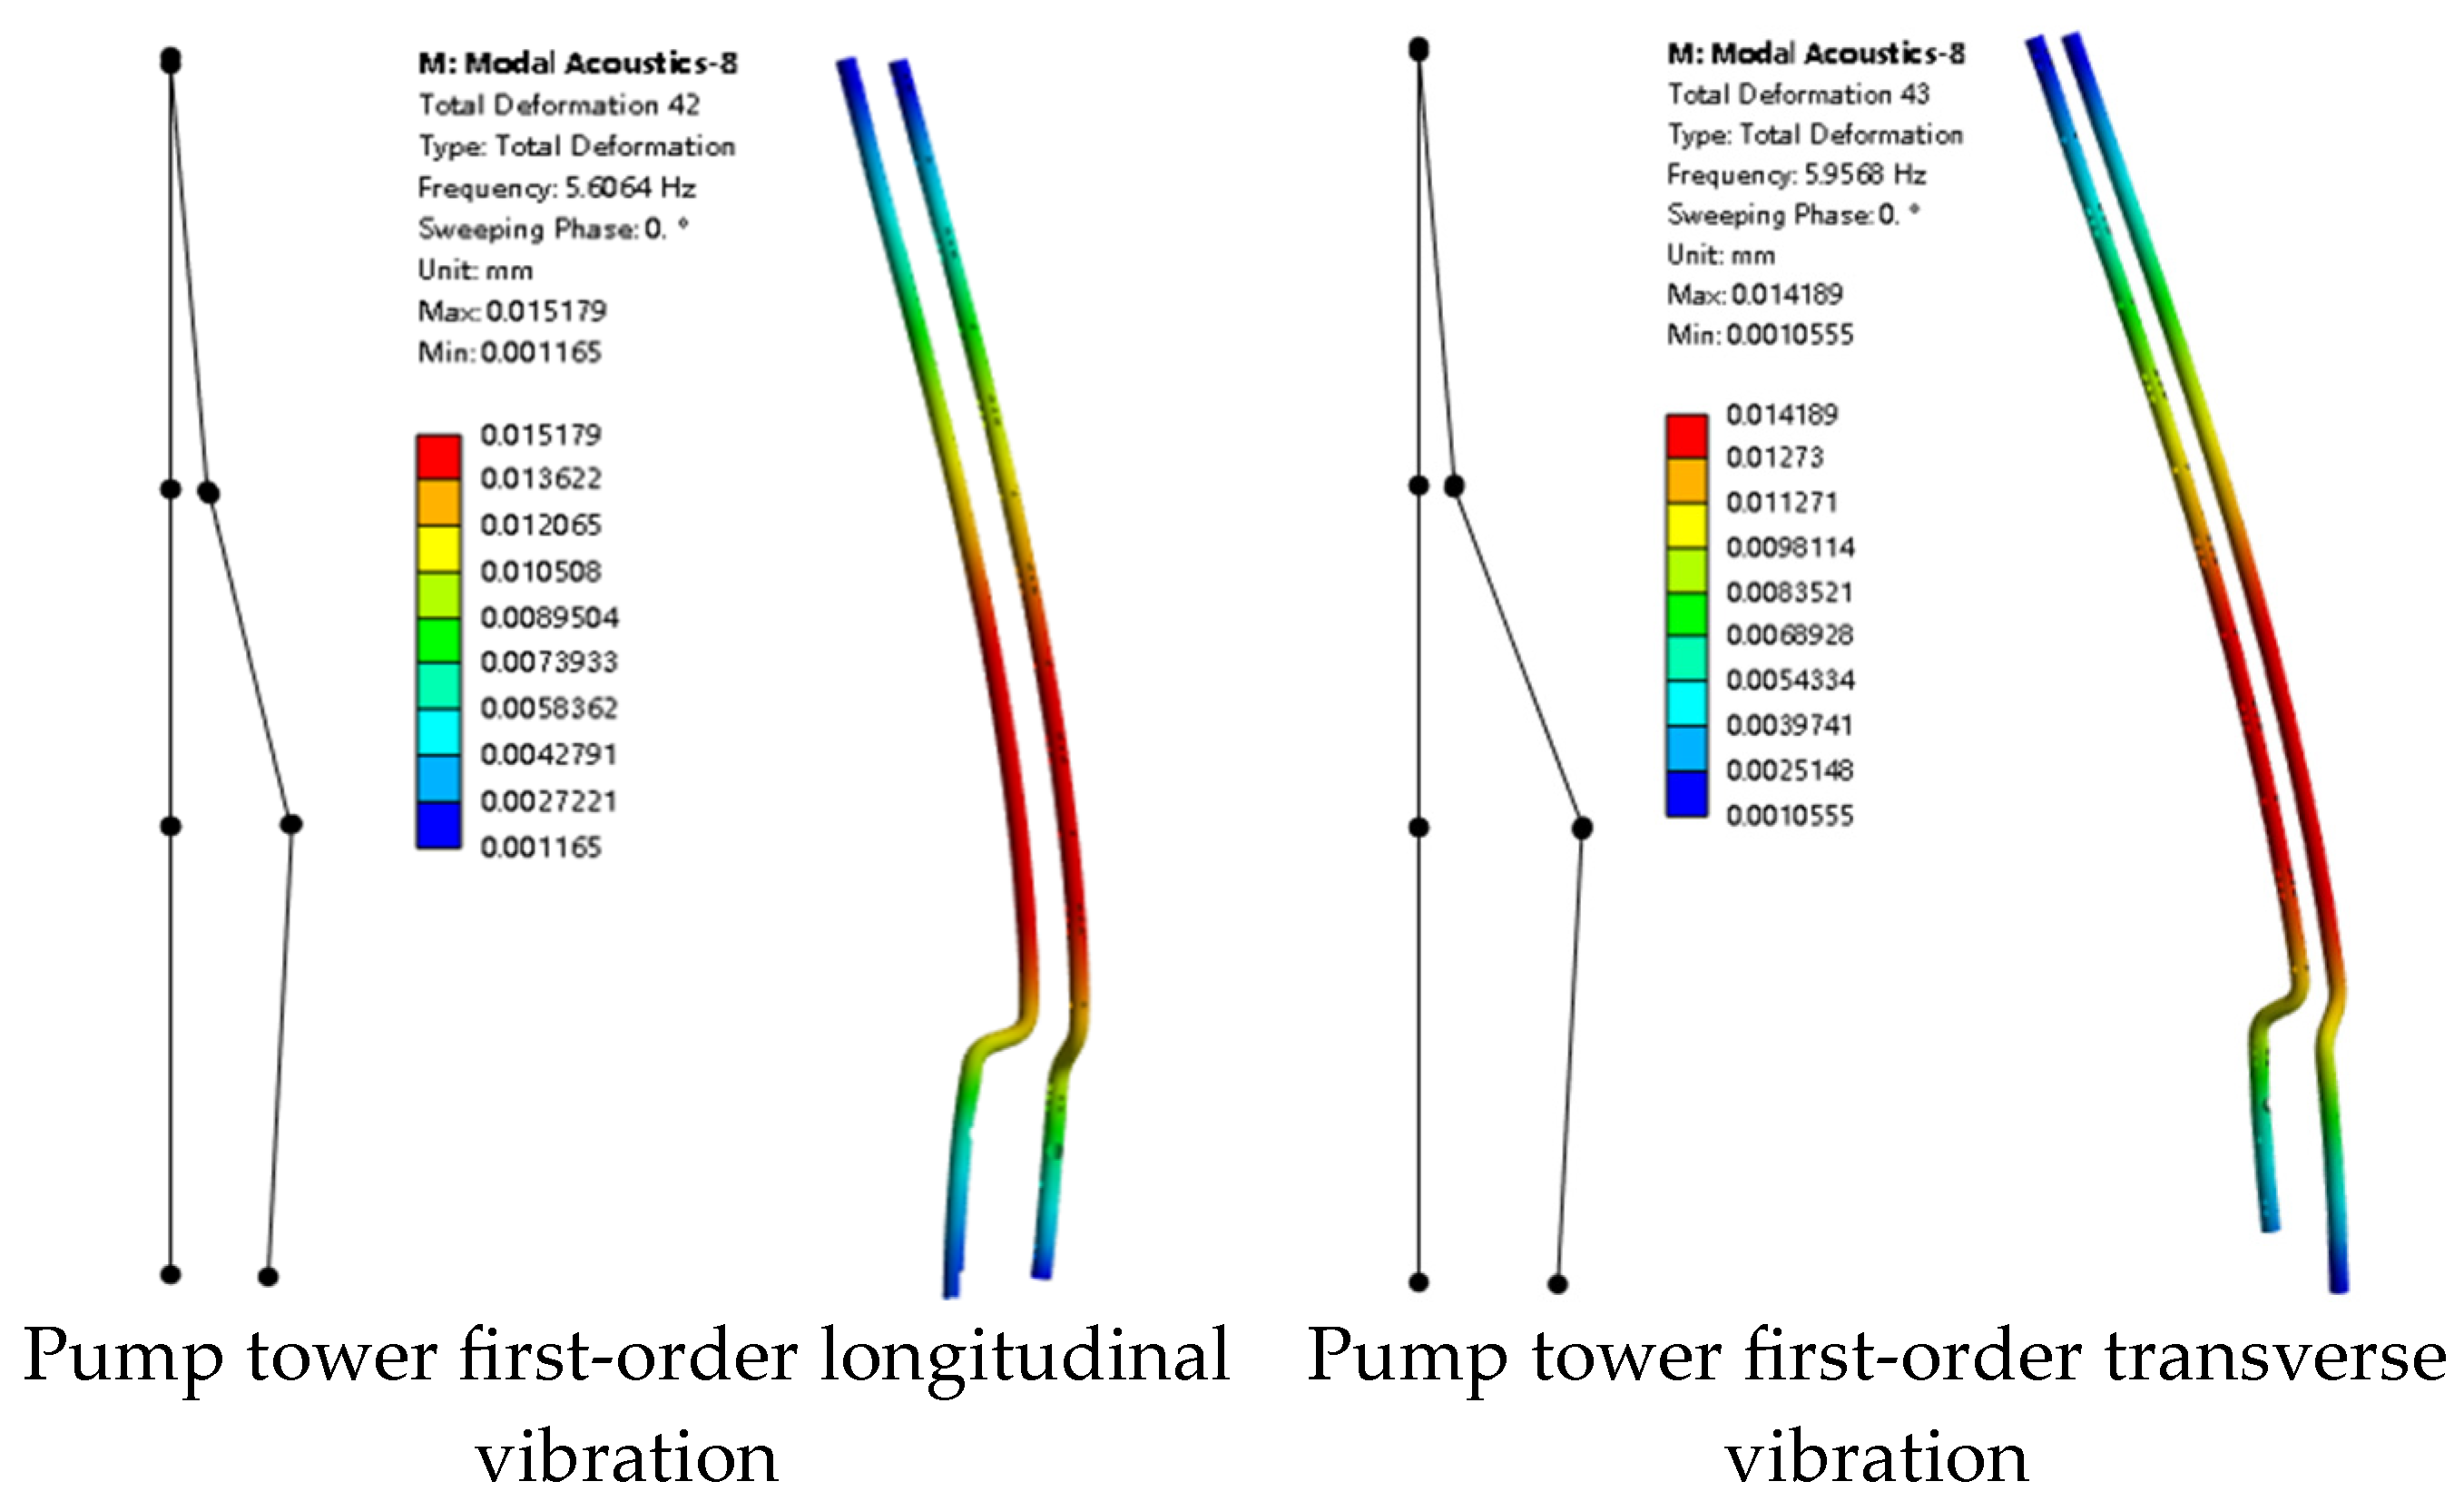
| Longitudinal Vibration | First-order | 5.57 Hz | 5.61 Hz | 0.7% |
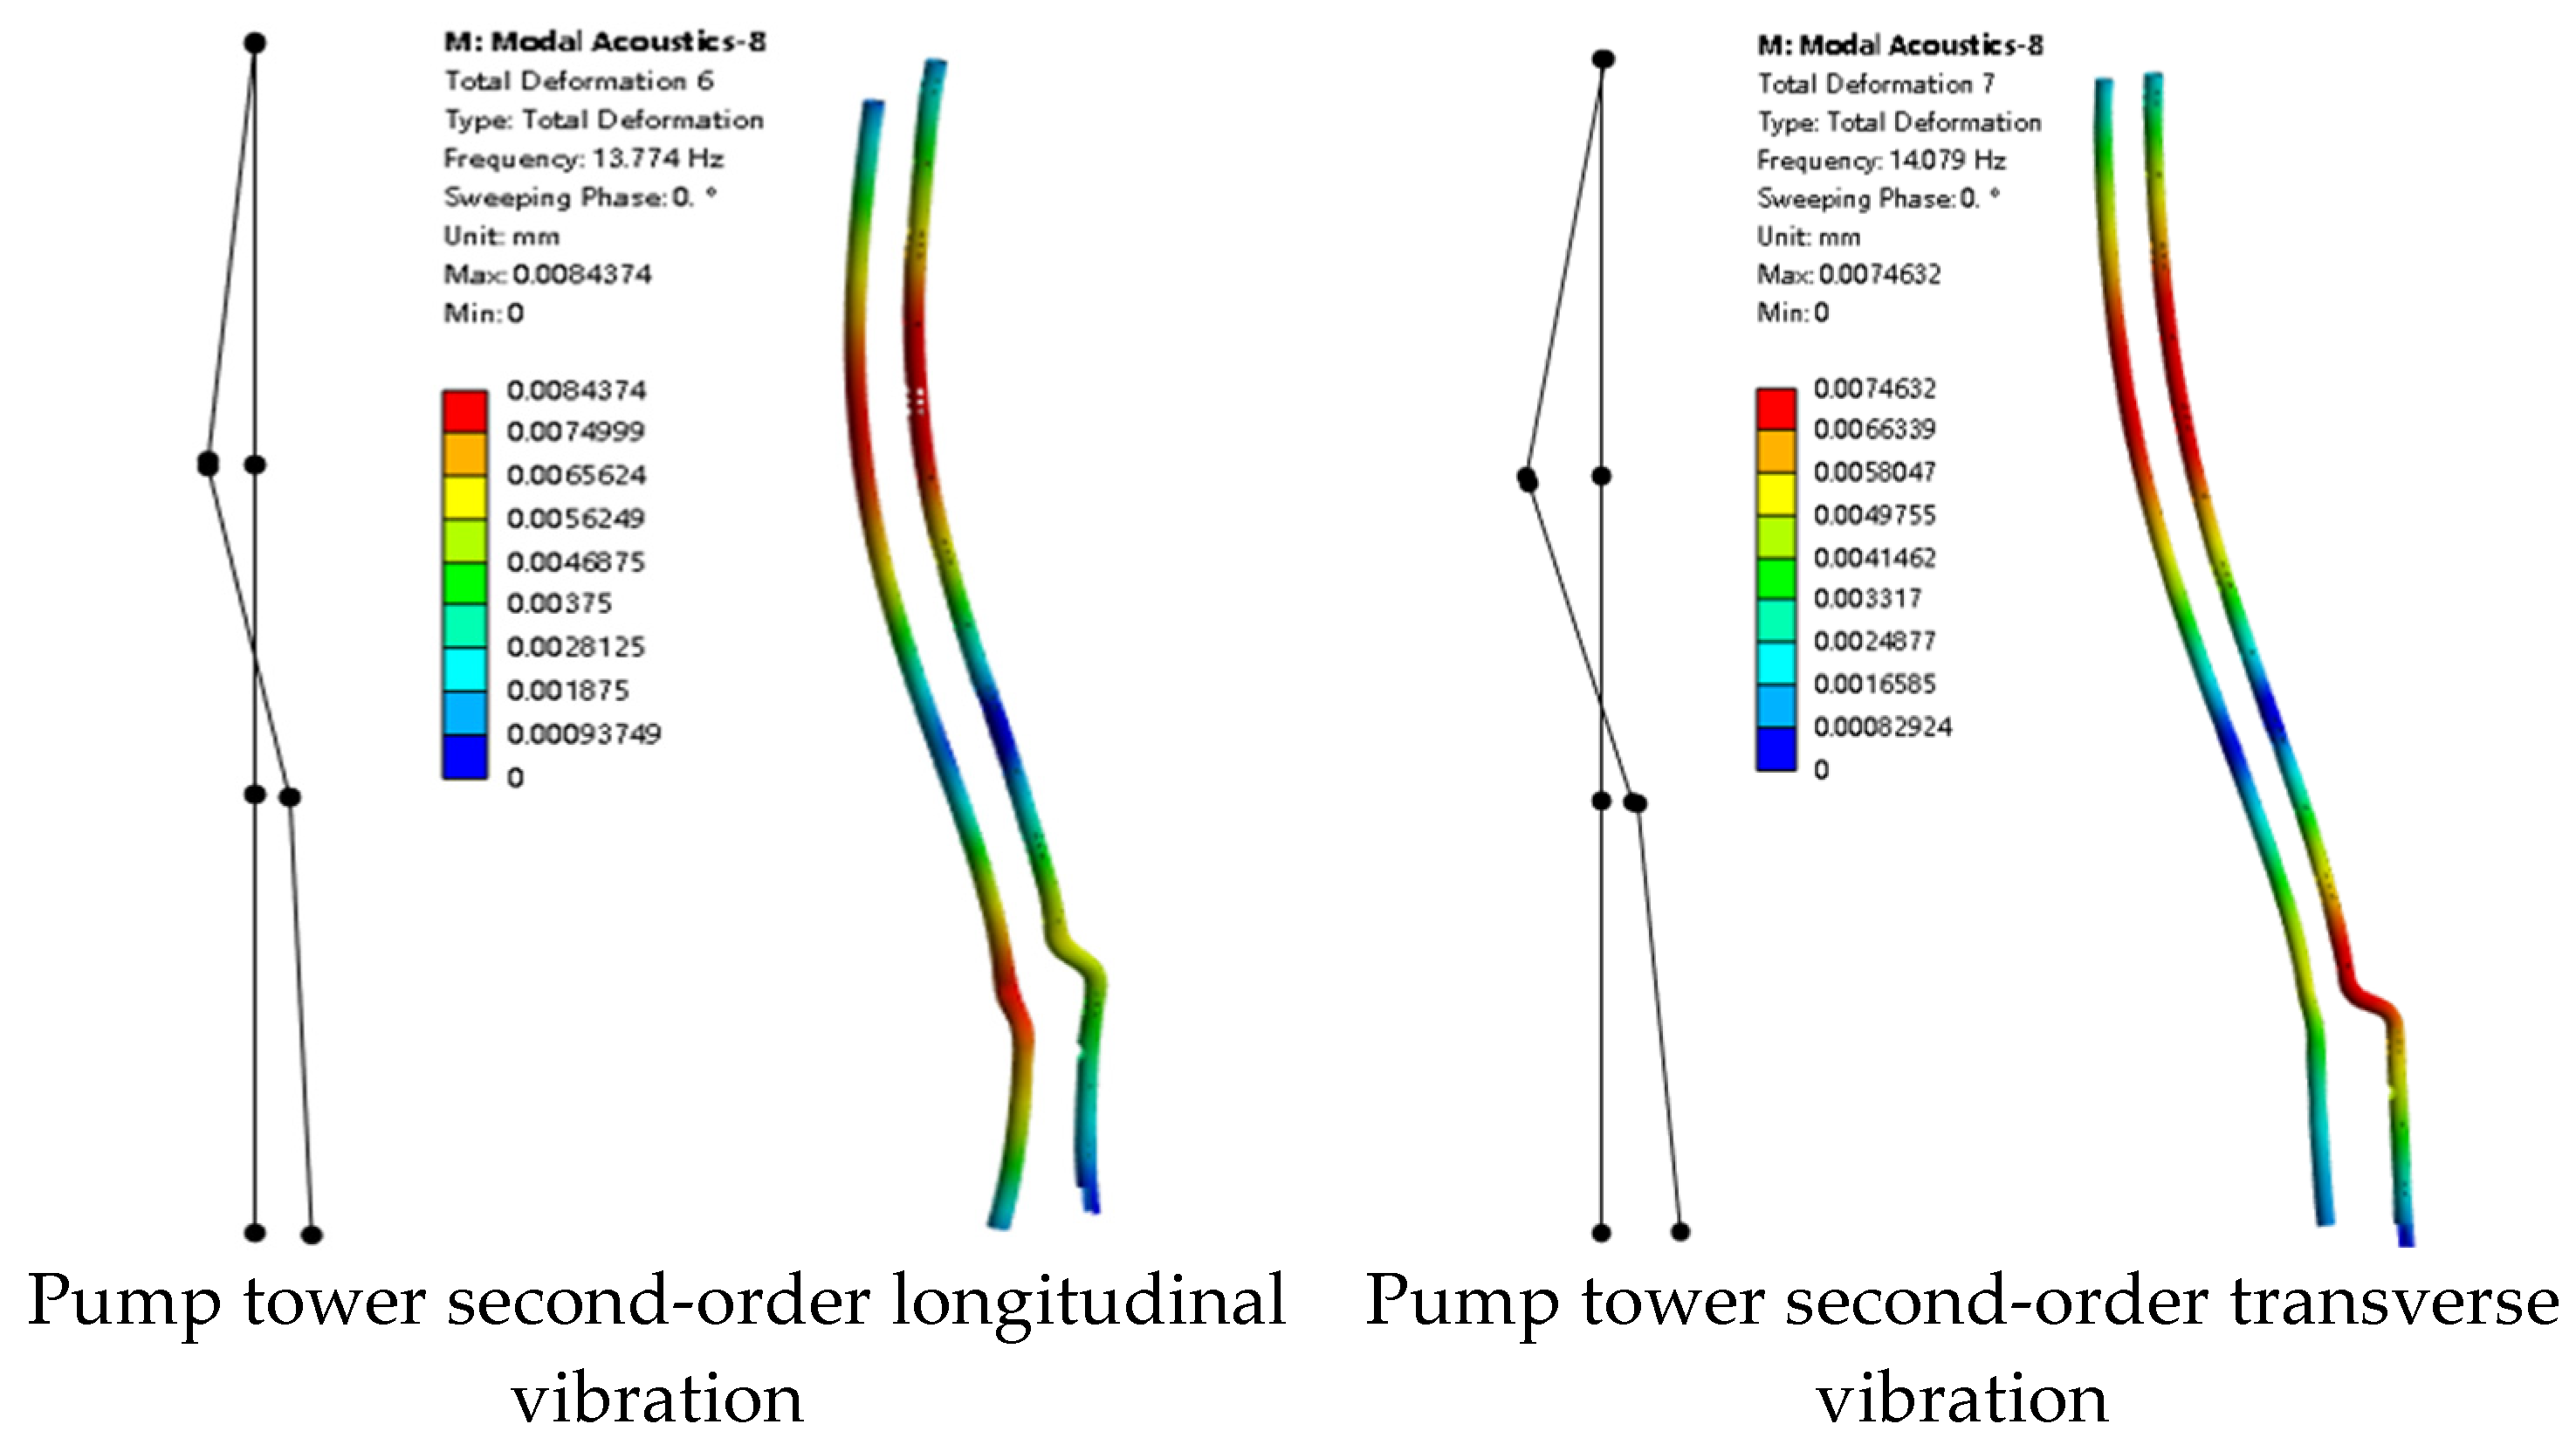
| Second-order | 11.33 Hz | 13.78 Hz | 21.6% | |
| Transverse Vibration | First-order | 6.25 Hz | 5.96 Hz | 4.6% |
| Second-order | 11.33 Hz | 14.08 Hz | 24.2% | |
| Frequency (Hz) | |||||
|---|---|---|---|---|---|
| Liquid Level (%) | 0 | 25 | 50 | 75 | 100 |
| First-order | 6.07 | 5.90 | 5.41 | 5.16 | 5.13 |
| Second-order | 14.71 | 14.00 | 13.73 | 12.8 | 12.48 |
| Third-order | 19.69 | 18.79 | 18.74 | 18.68 | 18.63 |
Disclaimer/Publisher’s Note: The statements, opinions and data contained in all publications are solely those of the individual author(s) and contributor(s) and not of MDPI and/or the editor(s). MDPI and/or the editor(s) disclaim responsibility for any injury to people or property resulting from any ideas, methods, instructions or products referred to in the content. |
© 2025 by the authors. Licensee MDPI, Basel, Switzerland. This article is an open access article distributed under the terms and conditions of the Creative Commons Attribution (CC BY) license (https://creativecommons.org/licenses/by/4.0/).
Share and Cite
Song, W.; Xie, A.; Lu, Y.; Zhao, Y.; Wang, Z. Acoustic Modal Characteristics of Pump Tower Structures Based on Fluid–Structure Coupling Effects. Water 2025, 17, 1864. https://doi.org/10.3390/w17131864
Song W, Xie A, Lu Y, Zhao Y, Wang Z. Acoustic Modal Characteristics of Pump Tower Structures Based on Fluid–Structure Coupling Effects. Water. 2025; 17(13):1864. https://doi.org/10.3390/w17131864
Chicago/Turabian StyleSong, Wei, Aoyu Xie, Yonggang Lu, Yun Zhao, and Zhengwei Wang. 2025. "Acoustic Modal Characteristics of Pump Tower Structures Based on Fluid–Structure Coupling Effects" Water 17, no. 13: 1864. https://doi.org/10.3390/w17131864
APA StyleSong, W., Xie, A., Lu, Y., Zhao, Y., & Wang, Z. (2025). Acoustic Modal Characteristics of Pump Tower Structures Based on Fluid–Structure Coupling Effects. Water, 17(13), 1864. https://doi.org/10.3390/w17131864