Article

Research on the Spatiotemporal Characteristics and Driving Factors of Water Quality in the Midstream of the Chishui River

1
School of Civil and Architectural Engineering, Guizhou University of Engineering Science, Bijie 551700, China
2
Kweichou Moutai Co., Ltd., Renhuai 564501, China
3
Chishui River Middle Basin, Watershed Ecosystem, Observation and Research Station of Guizhou Province, Qiankehe Platform YWZ[2024]007, Renhuai 564500, China
4
State Key Laboratory of Environmental Geochemistry, Institute of Geochemistry, Chinese Academy of Sciences, Guiyang 550081, China
5
College of Biological and Environmental Engineering, Guiyang University, Guiyang 550005, China
6
University of Chinese Academy of Sciences, Beijing 100049, China
7
Guizhou Province Field Scientific Observation and Research Station of Hongfenghu Reservoir Ecosystem, Guiyang 551499, China
*
Author to whom correspondence should be addressed.
Water 2025, 17(12), 1837; https://doi.org/10.3390/w17121837
Submission received: 19 March 2025 / Revised: 10 May 2025 / Accepted: 13 May 2025 / Published: 19 June 2025
(This article belongs to the Section Soil and Water)

Abstract

This study investigated the spatiotemporal dynamics and driving forces governing water quality variationsin the Midstream of the Chishui River, a pivotal area for China’s iconic liquor production, focused on its mainstream and tributaries. Through monthly intensive sampling and monitoring, combined with water quality assessment methods (single-factor evaluation and the Nemerow index method) and hydrochemical analysis, the spatiotemporal patterns and driving mechanisms of the water environment were systematically analyzed. The key findings reveal three distinct patterns. 1. Spatial heterogeneity: There is a notable difference in water quality between the main stream and tributaries, with the main stream exhibiting better water quality, while some tributaries show poorer water quality during certain months. 2. Seasonal ion variability: The proportions of Mg2+, Cl, and SO32 peaked during winter and spring, while concentrations of cations and anions decreased in summer and autumn. 3. Driving factors: The spatial disparity between mainstream and tributary water quality was primarily controlled by anthropogenic activities, whereas temporal variations in ionic composition were jointly influenced by basin lithology and seasonal environmental-climatic changes. Enhanced tributary management and climate adaptive monitoring strategies are proposed to safeguard water resources critical for both ecosystem integrity and specialty beverage manufacturing.

1. Introduction

Chishui River is an important tributary of the Yangtze River that has not been dammed and maintains its natural river characteristics well [1,2,3,4]. The low development and favorable ecological environment in the basin have laid a solid foundation for the green development of watershed industries. The superior water quality characteristics of the Midstream of the Chishui River serve as a fundamental guarantee for the high-quality development of Jiangxiang-style liquor production. Investigating the spatiotemporal variations of its water quality and driving factors will facilitate the protection and sustainable utilization of its water resources and aquatic environments. Many scholars have conducted single [4,5,6] or multiple sampling [7,8] studies on the spatiotemporal evolution characteristics and driving factors of the Chishui River water environment, using a partial watershed [9,10] or the entire watershed [11,12,13].
Clarifying the physicochemical indicators, mapping the spatiotemporal water quality distribution, and comprehending the hydrological transport-evolution mechanisms form essential foundations for analyzing the spatiotemporal characteristics and driving factors of aquatic environments [14,15,16]. The hydrochemical characteristics of the Chishui River are primarily governed by three factors: regional lithology [17], land use patterns [11,18,19], and anthropogenic activities [20,21]. Carbonate weathering constitutes the dominant source of cations and anions in the basin [6,22], where water quality generally remains favorable, with tributaries exhibiting superior quality compared to the main channel. However, intensified human activities have triggered a gradual deterioration of water quality since the early 2010s. Notably, the water classification in the Midstream of the Chishui River—the core production zone of Jiangxiang-style liquor (a Chinese liquor with a soy sauce aroma)—was downgraded from Class I to Class II between 2012 and 2020 [23,24]. Industrialization and urban expansion have significantly altered the physicochemical properties of the river [25,26], with critical parameters such as COD and nutrient concentrations exceeding regulatory thresholds in recent surveys [27,28]. An analysis of the literature revealed that the aforementioned studies exhibit extensive spatial coverage but rely solely on quarterly sampling frequency. This approach does not align with the actual demands of Jiangxiang-style liquor production in the Chishui River basin, where the concentrated geographical distribution of distilleries and the critical influence of monthly water quality variations necessitate higher-resolution monitoring. The State Council’s 2022 policy document (Guofa [2022] No. X) explicitly mandates: “Leverage the geographical advantages of the Chishui River Basin as the origin and primary production area of Jiangxiang-style liquor to establish a world-class distilled spirit production base.” Within this context, understanding the spatiotemporal patterns and drivers of water quality in the Midstream of the Chishui River Section becomes imperative for sustainable liquor production. Previous studies employing large-scale, low-frequency sampling regimes have proven inadequate to address current management needs, while targeted investigations focusing on the Midstream of the Chishui River remain conspicuously scarce in the literature.
Therefore, this study conducted a small-scale (focusing on the core production area of Jiangxiang-style liquor), high-frequency (monthly water quality monitoring), and full-cycle (spanning a complete brewing period) sampling and monitoring program in the Midstream of the Chishui River. First, the Nemerow Comprehensive Pollution Index (NCPI) and Single-Factor Evaluation Method were employed to analyze the spatial–temporal evolution of water quality in the main channel and its tributary (Yanjin River, located 2 km downstream of the Maotai Hotel). Subsequently, from the perspective of hydrochemical ion migration, we conducted a comprehensive analysis of the driving factors influencing the temporal variations in anion and cation concentrations. These approaches aim to provide actionable insights for the protection and sustainable management of the water environment in the Midstream of the Chishui River.

2. Materials and Methods

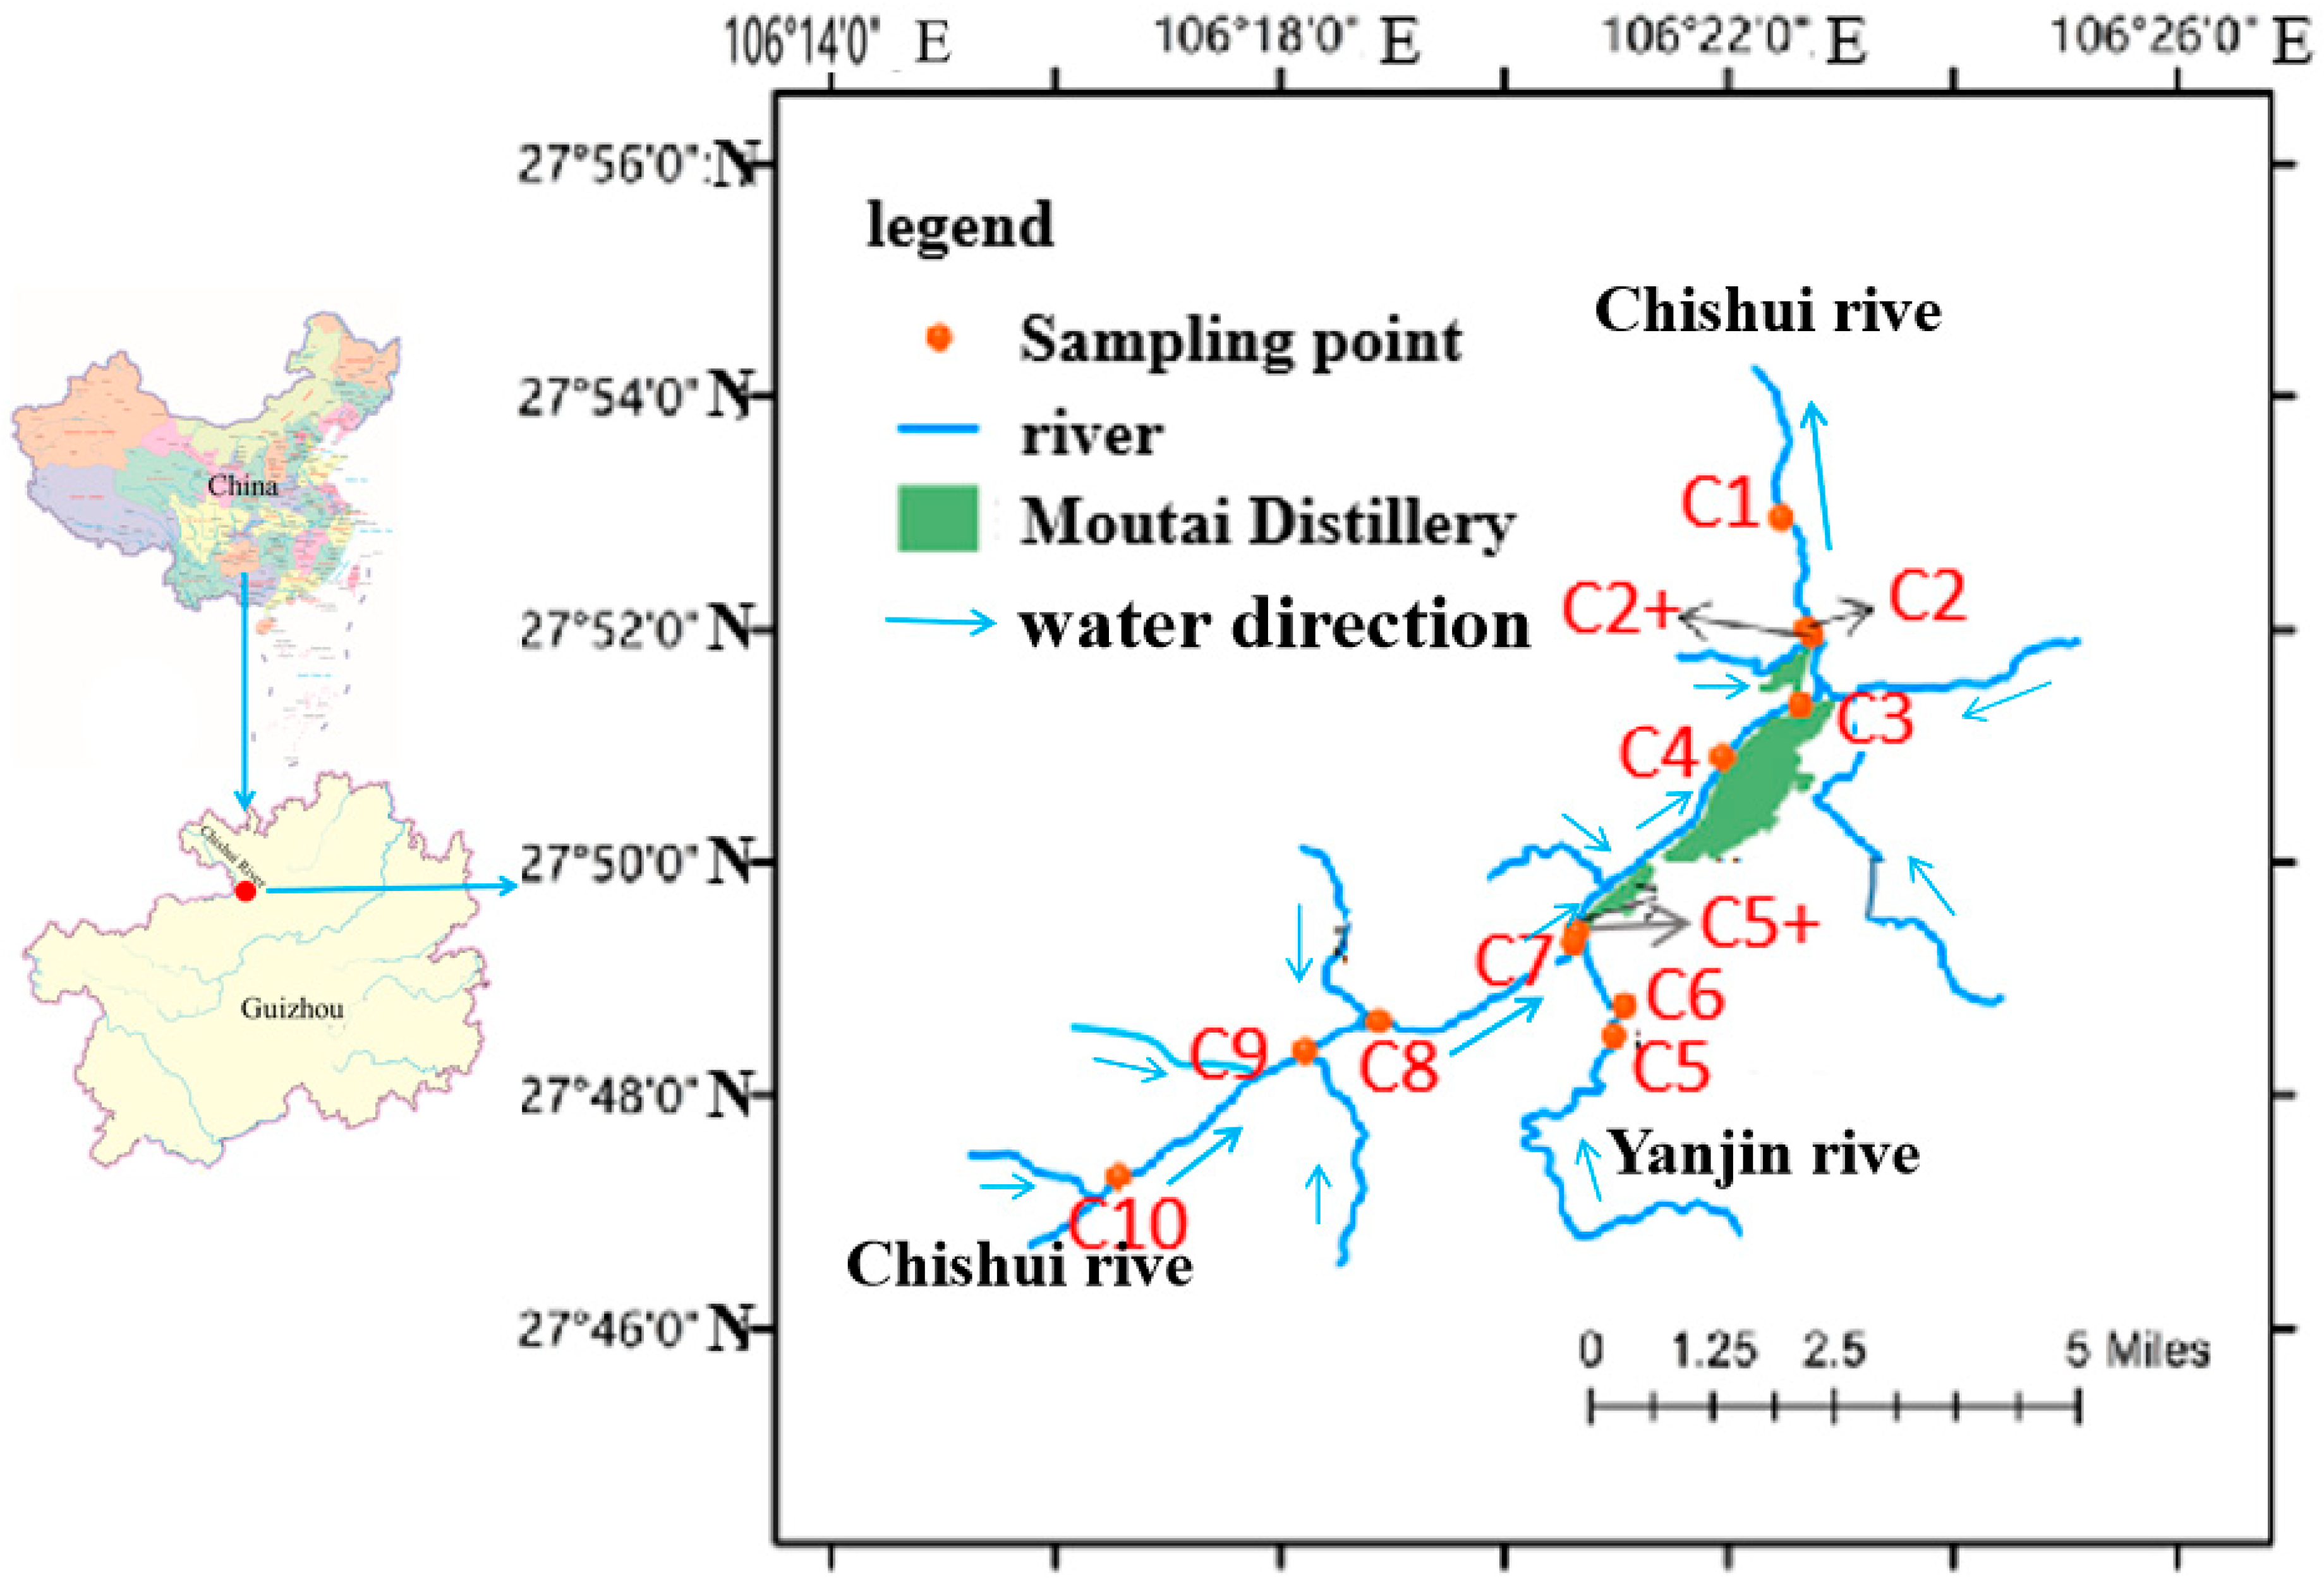
2.1. Overview of the Research Area

Study area is situated in Maotai Town, Renhuai City, Guizhou Province, China. Composed of a trunk stream (the Chishui River) with minimal anthropogenic disturbance, and multiple tributaries, including the Yanjin Tributary and the tributary downstream of Maotai Hotel, among others. The tributaries show localized water quality degradation due to the proliferation of small-scale distilleries. The annual average temperature is 16 °C and the annual precipitation is 1300~1500 mm. Research region is predominantly composed of sandy shale, siliceous rock, and carbonate rock. The land in the study area is predominantly designated as agricultural land, specifically cultivated for growing sorghum—the primary raw material used in brewing Jiangxiang-style liquor (a soy sauce flavored liquor). It is the main production area of r soy sauce flavored types of liquor.

2.2. Sampling Point Setting

Considering the fluctuation of water quality in different months throughout the year inthe Midstream of the Chishui River, samples were taken once a month from October 2022 to November 2023 from the lower (C1, C2, C2+), middle (C1, C2, C7), upper (C8, C9, C10) and Yanjin River (C5+, C5, C6) water bodies of the Midstream of the Chishui River. The sampling sites designated as (C2+) and (C5+) correspond to locations where tributaries converge with the main river channel as shown in Figure 1. Surface water samples (0–15 cm depth) were collected from the Chishui River banks using 10 L polyethylene sampling bags. These samples were collected near the river bank, filtered through 0.45 μm cellulose acetate (CA) filter membranes, acidified with nitric acid to pH < 2, refrigerated at 4 °C, and subsequently analyzed at the Institute of Geochemistry, Chinese Academy of Sciences (IGCAS).

2.3. Testing Methods

A YSI EXO2 multi parameter water quality analyzer was used to detect 7 indicators in situ, including pH value, temperature, dissolved oxygen, conductivity, redox potential, salinity (SAL), and total dissolved solids. A 5B-6C (V12) multi parameter water quality analyzer was used to detect chromaticity and suspended particulate (SS), matter indicators in the laboratory. The measurement methods for the other indicators are shown in Table 1.
We tested the distribution characteristics of pH, temperature (WT), dissolved oxygen (DO), oxidation–reduction potential (ORP), salinity (SAL), total dissolved solids (TDS = K+ + Na+ + Ca2+ + Mg2+ + HCO3 + SO32− + NO3 + Cl + SiO2), chromaticity, suspended particles (SS), total phosphorus (TP), dissolved reactive phosphorus (SRP), ammonia nitrogen (NH3-N), total nitrogen (TN), chemical oxygen demand (COD), and soluble organic carbon (DOC) in 12 samples of water environmentthe Midstream of the Chishui River.

2.4. Data Analysis Methods

Data classification and statistical analysis were performed using Microsoft Excel 2020. Trace element concentration distribution maps were generated using Origin 2020, while box plots were created with the VennDiagram package in R version 4.1 (R Core Team) to plot Venn plots. A ternary diagram of molar concentration ratios was used to represent the relative abundance and distribution characteristics of the major ions in the river water solutes.

2.5. Evaluation of Water Quality of Main and Tributary

Due to different focuses, there are some differences in the evaluation results of various evaluation methods. Accordingly, this study used both the Nemerow Comprehensive Pollution Index method and the single factor index evaluation method to evaluate the water quality of the main and tributary streams of the Midstream of the Chishui River.
The Nemerow Comprehensive Pollution Index method considers the combined impact of all evaluation factors on water quality evaluation, highlighting the contribution of pollution severity factors to the rating. It is a comprehensive evaluation system that takes into account the combined elements and main contributing factors [39,40]. The calculation formula is as follows:
P n e i = ( ( 1 n i = 1 n P i ) 2 + P m a x 2 ) / 2
where P n e i   is the comprehensive pollution index, P i is the single factor pollution index, and P m a x is the maximum value of the single factor pollution index of all pollutants.
The general grading standards [41] are shown in Table 2.
The single factor index evaluation method compares the environmental indicators of the sampling point with the category indicators in the “Surface Water Environmental Quality Standards” (GB3838-2002) [38] and determines the water quality classification based on the most severely exceeded item. This method is simple and applicable. The calculation formula is as follows:
P = P i M A X
where P i = A i / B i ,     A i   represents the actual monitoring value of evaluation factor i, and B i   represents the standard value of the selected water quality category in the Midstream of the Chishui River must meet the functional requirements of surface water category III. The grading criteria are shown in Table 3.

3. Results and Discussion

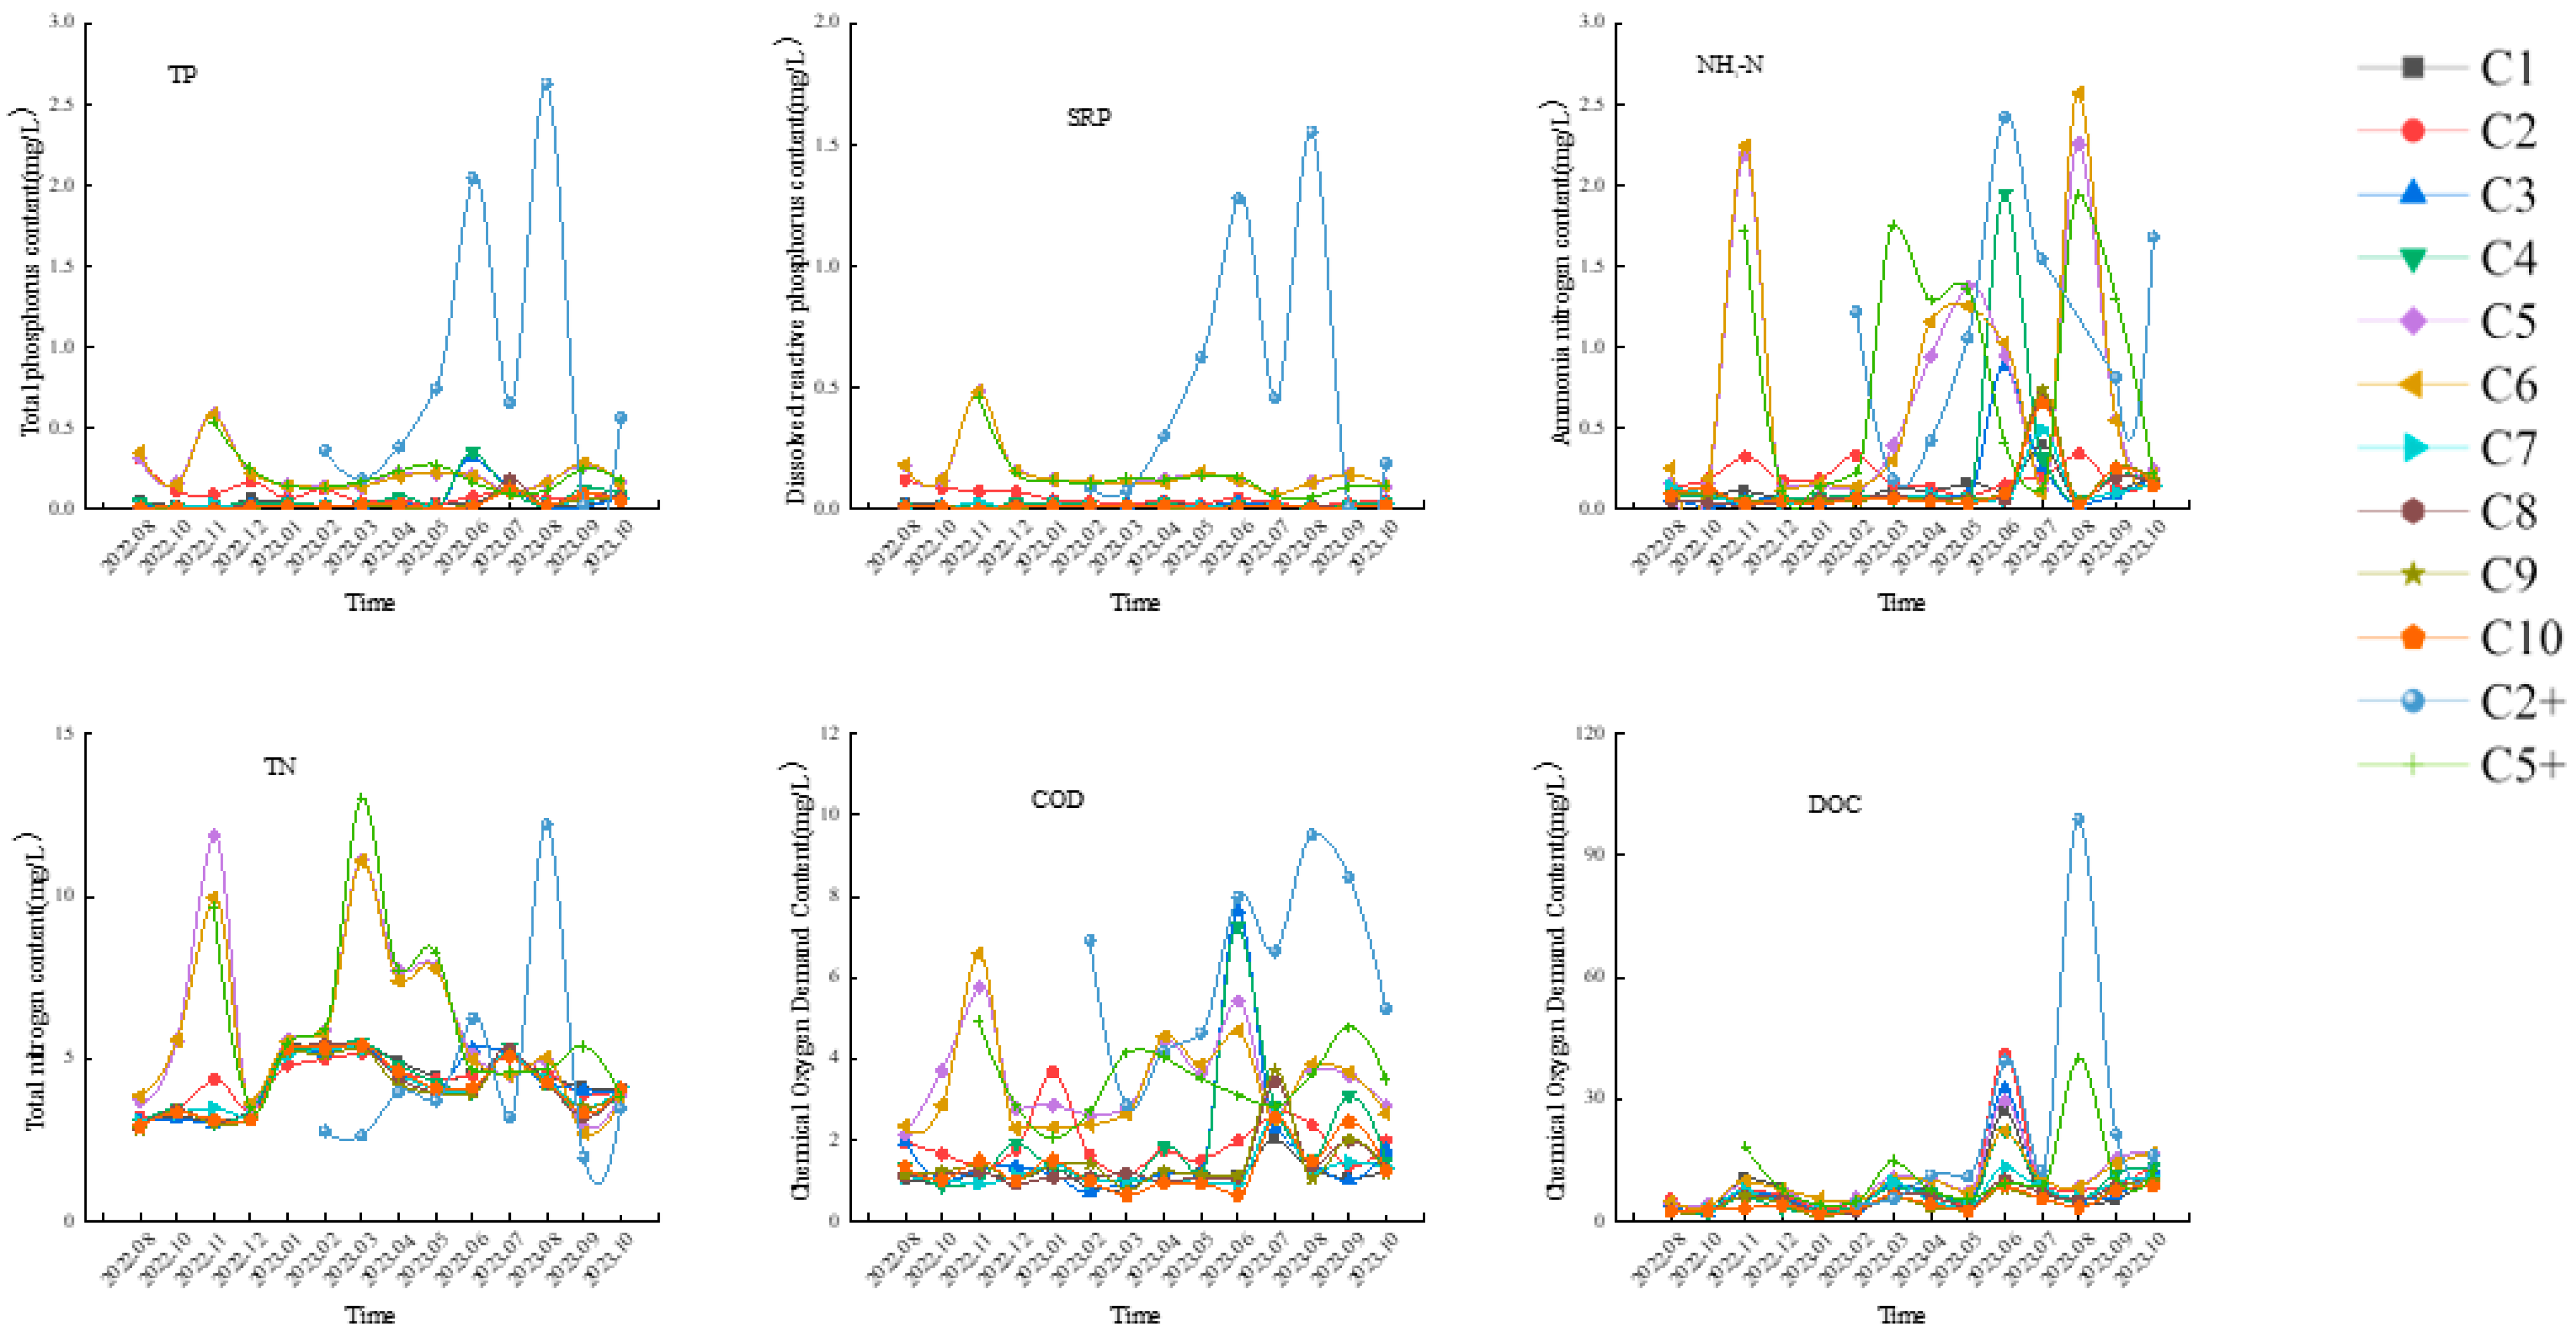
3.1. Analysis of Basic Indicators of Main and Tributary Rivers
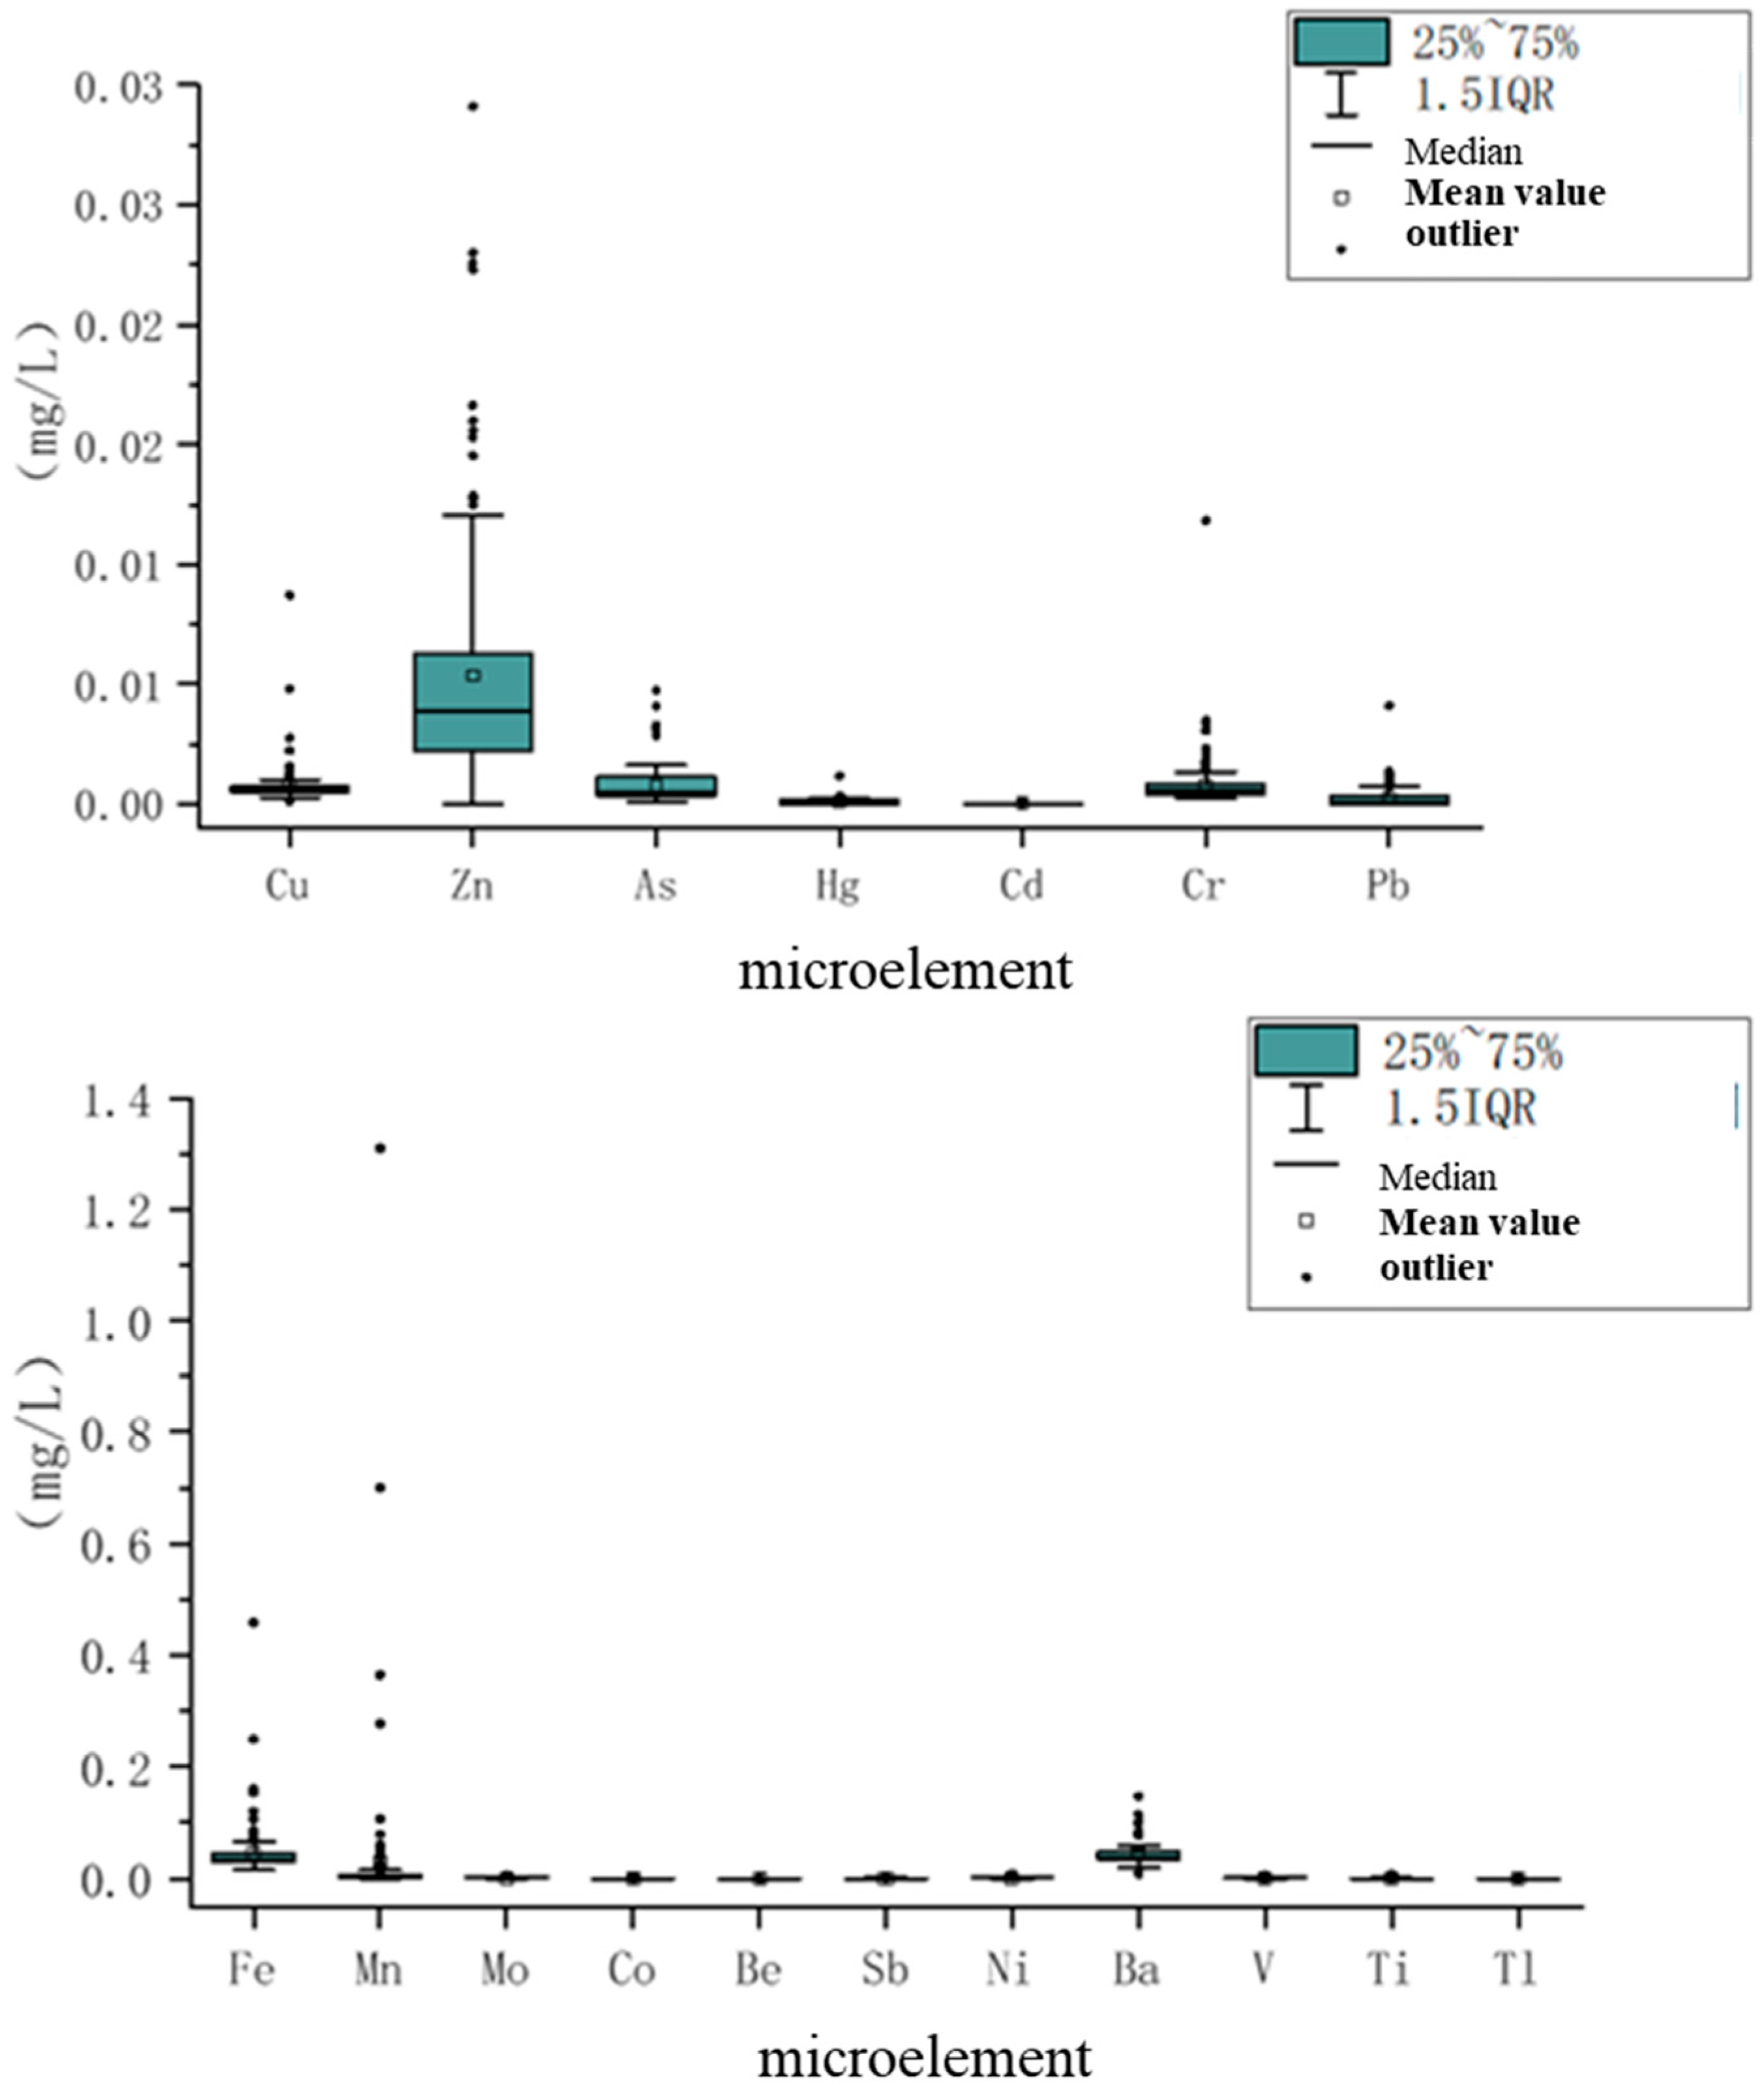
The water environment in the Midstream of the Chishui River exhibited pH values ranging from 7.16 to 9.00 (mean: 8.25) and temperatures between 11.48 °C and 32.29 °C. Dissolved oxygen (DO) concentrations varied from 1.44 to 16.24 mg/L (mean: 8.40 mg/L), peaking in winter, followed by autumn and summer, with the lowest values observed in spring. Notably, DO concentrations at Yanjin River Point 2 and the 2 km tributary downstream of the Grand Hotel stabilized at 5–6 mg/L. Salinity and total dissolved solids (TDS) displayed trends analogous to DO, but concentrations in the 2 km tributary downstream of Maotai Hotel and Yanjin River remained elevated year-round compared to other sites. In the Chishui River mainstream, TDS ranged from 270 to 637 mg/L (mean: 347 mg/L), significantly exceeding values reported by Xu et al. (2018) [22] for the entire Chishui River basin (267–335 mg/L; mean: 306 mg/L). Tributary-specific TDS means were 433 mg/L (Yanjin River) and 531 mg/L (2 km tributary downstream of Maotai Hotel). Field investigations identified industrial and urban wastewater inputs into the tributary, with localized sewage characteristics such as a foul odor. Chromaticity and suspended particulate matter (SPM) exhibited seasonal coherence, with higher levels in summer and autumn than in spring and winter, likely influenced by hydrological dynamics during high-flow periods.
Figure 2 illustrates nutrient dynamics in the water environment of the Midstream of the Chishui River. Overall, concentrations were consistently higher in the Yanjin River (tributary) and the 2 km tributary downstream of Maotai Hotel than at other sampling points, exhibiting pronounced fluctuations and anthropogenic influences. Total phosphorus (TP) and soluble reactive phosphorus (SRP) followed analogous trends, with SRP concentrations averaging 50% of TP levels. Notably, TP and SRP at the C2+ sampling point exceeded other locations, necessitating enhanced regulatory oversight of industrial activities within its catchment. Ammonia nitrogen (NH3-N) concentrations were elevated in Yanjin River and the 2 km tributary downstream of the Grand Hotel but lower in the Chishui River mainstream, with wet-season values significantly surpassing dry-season measurements. Total nitrogen (TN) consistently exceeded China’s surface water quality standards, particularly in the Yanjin River, where concentrations reached >10 mg/L in October 2022, March 2023, and September 2023. Intriguingly, TN in the 2 km tributary downstream of the hotel showed no concurrent increase, potentially linked to localized industrial practices. Chemical oxygen demand (COD) remained significantly higher in tributaries than the mainstream, with wet-season concentrations exceeding dry-season levels across all sites. Dissolved organic carbon (DOC) ranged from 0.66 to 9.52 mg/L (mean: 2.27 mg/L), peaking in June 2023 due to heavy rainfall. August 2023 data revealed anomalously high pollutant levels in the 2 km tributary downstream of the hotel, likely attributable to upstream anthropogenic disturbances during this period.
Collectively, the water quality parameters in in the Midstream of the Chishui River demonstrated that the tributaries (Yanjin River, 2 km tributary downstream of Maotai Hotel) exhibited significantly higher pollutant loads compared to the mainstream. The annual variations in these parameters (spanning 12 months) revealed marked spatiotemporal heterogeneity in water quality characteristics across the study area.

3.2. Trace Elements

The concentrations of 18 trace elements (Cu, Zn, As, Hg, Cd, Cr, Pb, Fe, Mn, Mo, Co, Be, Sb, Ni, Ba, V, Ti, and Tl) in the Midstream of the Chishui River are presented in Figure 3. Based on China’s Environmental Quality Standards for Surface Water (GB3838-2002), the measured concentrations of Cu, Zn, As, Cd, and Pb all complied with Class I water quality standards. For Hg, 50% of the samples met Class I/II standards. Notably, the 2 km downstream tributary near the hotel exceede in May 2023. Chromium (Cr) concentrations generally adhered to Class I standards, except for a value of 0.012 mg/L recorded in the same tributary in July 2023. Similarly, Fe, Mo, Co, Be, Sb, Ni, Ba, V, Ti, and Tl concentrations remained below regulatory limits across all monitoring periods, with the exception of Fe (0.3 mg/L) in August 2023 in the hotel’s downstream tributary. Additionally, Mn concentrations in this tributary exceeded permissible limits during May, June, and August–October 2023.
A comparative analysis with background values reported for the entire Chishui River basin across dry and wet seasons [42] revealed distinct temporal variations in metal concentrations in the Midstream of the Chishui River. Notably, Zn (peaking at 3.15 μg/L in 2017) and As (peaking at 1.01 μg/L in 2017) concentrations exhibited marked increases from 2022 to 2023, whereas Cd and Sb levels remained relatively stable. This differential pattern suggests anthropogenic origins for the observed Zn and As elevations. Concurrently, Fe (34.91 μg/L peak in 2017) and Mn (6.41 μg/L peak in 2017) concentrations demonstrated significant augmentation, attributable to combined geogenic and anthropogenic sources. While rock weathering and pedogenesis [42,43] represent persistent natural contributors, municipal wastewater inputs [6,44] are likely predominant given the stability of geological processes during the 2017–2023 observation period.

3.3. Differences in Water Quality Between Main and Tributary Rivers and Their Driving Factors

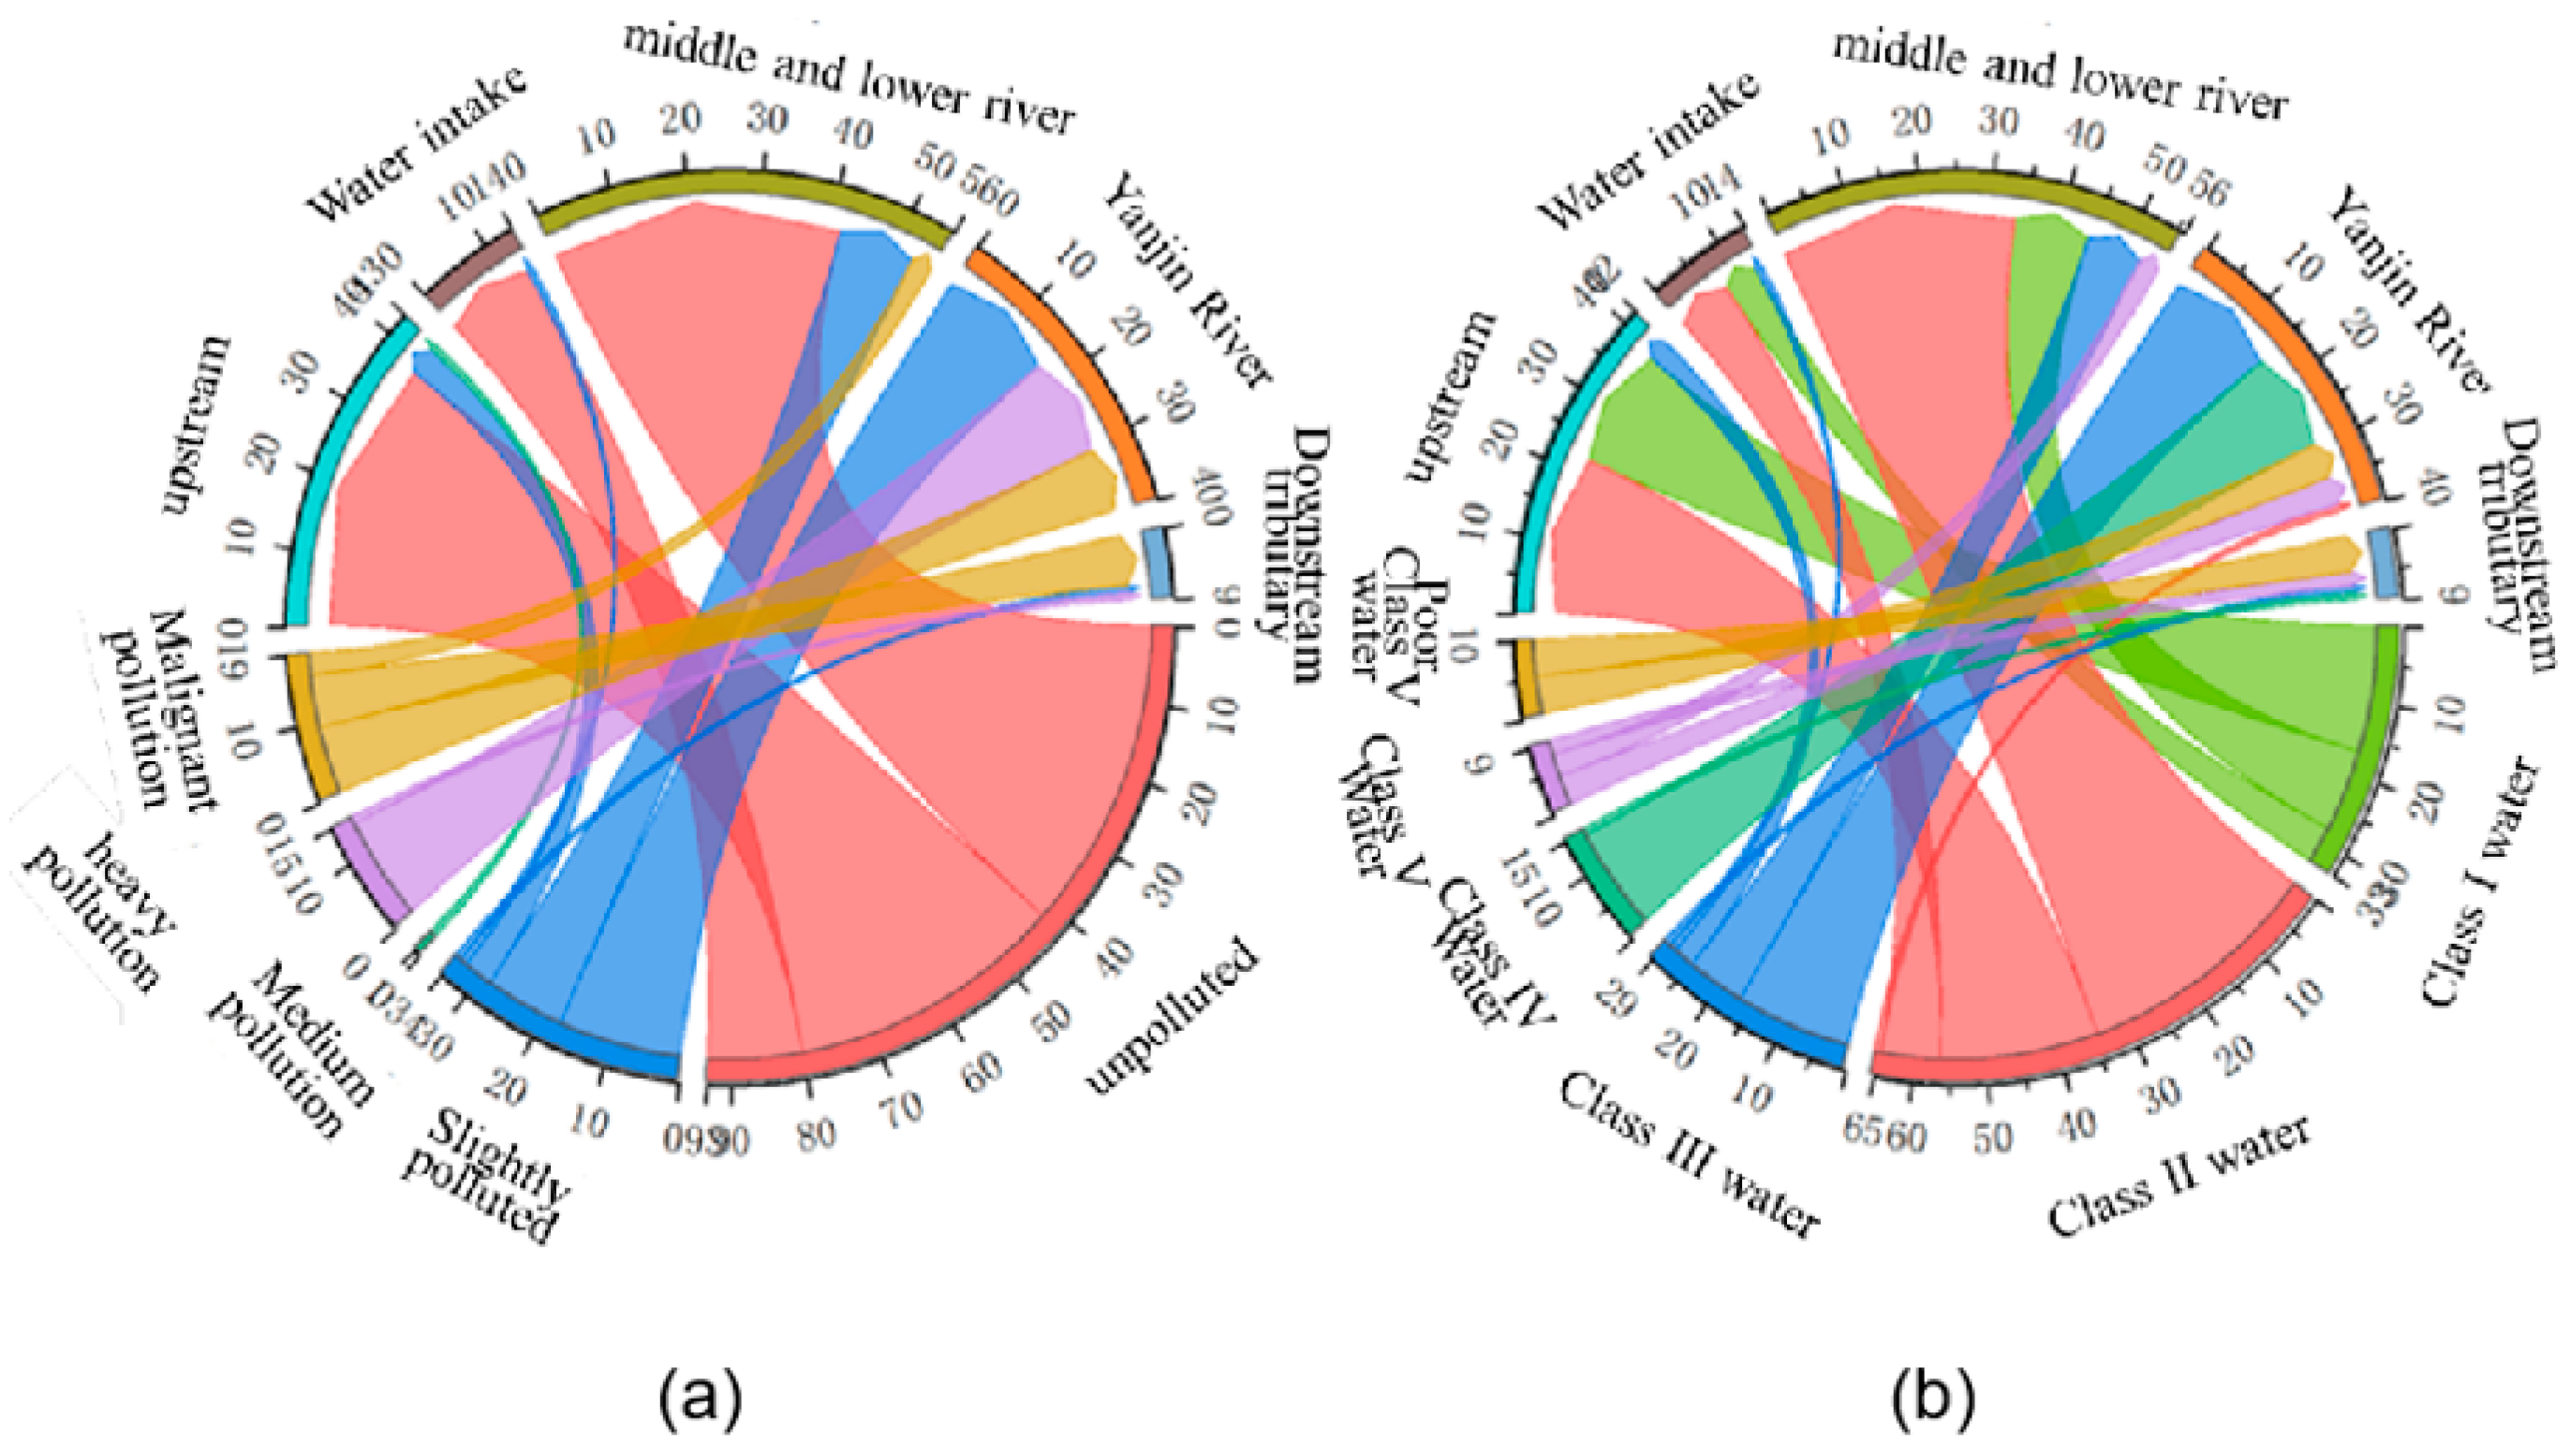
3.3.1. Evaluation of Water Quality of Main and Tributary Rivers

Figure 4a shows the results of the Nemerow Comprehensive Pollution Index method [45], and b shows the results of the single factor index evaluation method [46]. The results of the two evaluation methods are generally consistent. The overall water quality of tin the Midstream of the Chishui River was good, while the water quality of its tributaries (Yanjin River, 2 km below Maotai Hotel) was relatively poor.There is a notable difference in water quality between the main stream and tributaries, with the main stream exhibiting better water quality, while some tributaries show poorer water quality during certain months.The pollution of tributaries has become a key factor affecting the water quality of the Midstream of the Chishui River.

3.3.2. Differences in Water Quality (Spatially) Between Main and Tributary Rivers and Their Driving Factors

The Midstream of the Chishui River, a core production zone for Jiangxiang-style liquor, features eight permanent monitoring stations that underwent 96 annual sampling events. Water quality parameters exceeded surface water standards in 98% of measurements, demonstrating exceptional baseline conditions for ecological sustainability. Notably, only two stations exhibited episodic degradation: Maotai Hotel (C3) and the Yanjin River confluence (C5+) each recorded moderate pollution during June 2023 flood conditions. Hydrological analysis revealed this seasonal deterioration coincides with intensified surface runoff transporting anthropogenic loads—including urban particulate matter, domestic waste residues, and untreated effluents—into the main channel. A distinct spatial gradient emerged from the longitudinal monitoring data: water quality progressively declines from the pristine upper reaches (C8–C10) through moderately impacted mid-reaches (C4/C5+/C7) to impaired lower reaches (C1–C3). This pattern correlates strongly with anthropogenic pressures. The upper section’s sustained excellence [1] stems from an absence of industrial clusters and hydrological barriers [47], while mid-reach degradation reflects cumulative inputs from Yanjin River basin wastewater [48]. The lower (C1–C3) section’s compromised status originates from concentrated urban activities in Maotai Town, particularly pollution funneling through a 2 km tributary adjacent to Maotai Hotel (C2+) that exacerbates mainstream contamination.
The tributary(C5/C5+/C6/C2+) network of the Midstream of the Chishui River demonstrates critical water quality challenges, as evidenced by 48 annual measurements across four monitoring stations. Only 38% of samples (n = 18) met Class III compliance standards, revealing systemic contamination. Particularly alarming is the 2 km lower tributary adjacent to Maotai Hotel (C2+), which exhibited Category V/V+ standards for seven consecutive months, with pollution severity escalating from mild (11%) to severe (11%) and acute contamination (78%). Elevated total phosphorus and ammonia nitrogen levels correlated with suspected upstream industrial malpractice, including unauthorized discharges or containment failures. Parallel issues afflicted the Yanjin River tributary(C5/C5+/C6+), displaying mild (43%), severe (35%), and acute (23%) contamination gradients. Field investigations identified 23 unregulated small-scale distilleries within a 2.33 km riverine corridor lacking wastewater treatment infrastructure that were identified as principal contamination vectors. Decadal monitoring confirmed these tributaries (Yanjin River (C5/C5+/C6+) and Maotai Hotel (C2+) lower reach) persistently underperform the mainstream, maintaining Category V status since 2010 [49]. Despite substantial government and corporate investments in regulatory frameworks, fiscal allocations, and technological remediation [50], liquor production effluents and municipal sewage remain intractable pollution sources. Targeted mitigation strategies, particularly precision monitoring of clandestine industrial emissions and upgraded treatment capacity for small enterprises, are imperative to reverse the documented 10-year degradation trend and ensure basin-scale ecological security.

3.4. Differences in Time Between Cations and Anions and Their Driving Factors

Figure 5 presents a temporal ternary diagram illustrating anion–cation concentration ratios in the Midstream of the Chishui River. Hydrochemical signatures consistently cluster near the Ca2+–Mg2+–HCO3 vertex, with particular affinity toward the Ca2+ pole across monitoring periods. Quantitative analysis revealed the mainstream and tributary water salts were predominantly composed of Ca2+ (1.5–7.7 meq/L range; mean 3.57 meq/L), followed by Mg2+ (0.24–2.62 meq/L; mean 1.4 meq/L), collectively accounting for >80% of the total cationic content. Anionic composition demonstrated analogous dominance, with HCO3 (0.17–9.03 meq/L) and SO₄2− (0.54–3.83 meq/L; mean 1.76 meq/L) constituting over 80% of anionic species. The characteristic Ca2+–HCO3 pairing (mean SO42/HCO3 ratio = 0.55) strongly reflects carbonate weathering processes governing the regional hydrochemistry.
From a temporal perspective, the composition points of anions and cations varied in different months. In February (FEB) and March (MAR), Mg2+, Cl, and SO32 accounted for a higher proportion compared to other months. In spring, ion concentrations are mainly influenced by the lithology of the sampling points and industrial and domestic wastewater. The proportion of Ca2+ and HCO3 increased significantly in June (JUN), July (JUL), and August (AUG). During the wet season in summer, the ion composition points are affected by rainfall, and a large amount of Ca2+ enters rivers with rainwater after rock weathering. Cl decreases compared to February (FEB) and March (MAR), and rainfall dilutes the Cl brought about by human activities. From a spatial perspective, in the anion (HCO3–SO32–Cl) triangle diagram, the component points mainly fall on the HCO3 end. In the cation triangle diagram, the combination points C1, C2, C3, C4, C7, C8, C9, and C10 are located near the Ca2+~Mg2+ line, close to the Ca2+ end element, mainly controlled by limestone weathering. It should be noted that the C2+, C5, C5+, and C6 component points are located on the HCO3–SO32 line side and close to the SO32 terminal element. These points may have other external inputs, and industrial control of tributaries should be strengthened.
Hydrochemical characterization of the Midstream of the Chishui River reveals diagnostic karstic signatures distinct from basin-wide patterns reported by Peng et al. (2014) [20]. Marked seasonal heterogeneity manifests through dual control mechanisms: precipitation-driven non-point source dominance during monsoon months (June–September) versus dry season regulation by coupled lithostratigraphic controls (Permian carbonate aquifers) and anthropogenic forcing. This temporal dichotomy is evidenced by a 32% increase in Ca2+/Na+ ratios during wet periods (p < 0.05) contrasting with elevated Cl/HCO3 indices (1.8 ± 0.4) in low-flow phases, indicative of wastewater intrusion pathways.

3.5. The Primary Driving Factors of Monthly Variations in Water Quality

Overall, the intra-annual monthly variation patterns of parameters are governed by both anthropogenic activities and watershed geological conditions. While the tributary basin contains scattered townships and small wineries, the mainstream basin is predominantly characterized by agricultural activities. The more pronounced monthly fluctuations in mainstream water quality compared to tributaries suggest that geological conditions predominantly influence the main river, whereas tributary variations are more strongly associated with human interventions.
Certainly, subsequent studies may explore continuous monitoring of water quality using monthly data over 3–5 years, or even weekly measurements, to enhance the accuracy of tracking and forecasting water quality dynamics in Jiangxiang’s core production zone.

4. Conclusions

Through monthly sampling conducted over a continuous 12-month period, this study elucidated the spatiotemporal patterns and driving factors of water quality in the Midstream of the Chishui River, encompassing both the mainstream and tributaries. The key conclusions are outlined as list:
(1)
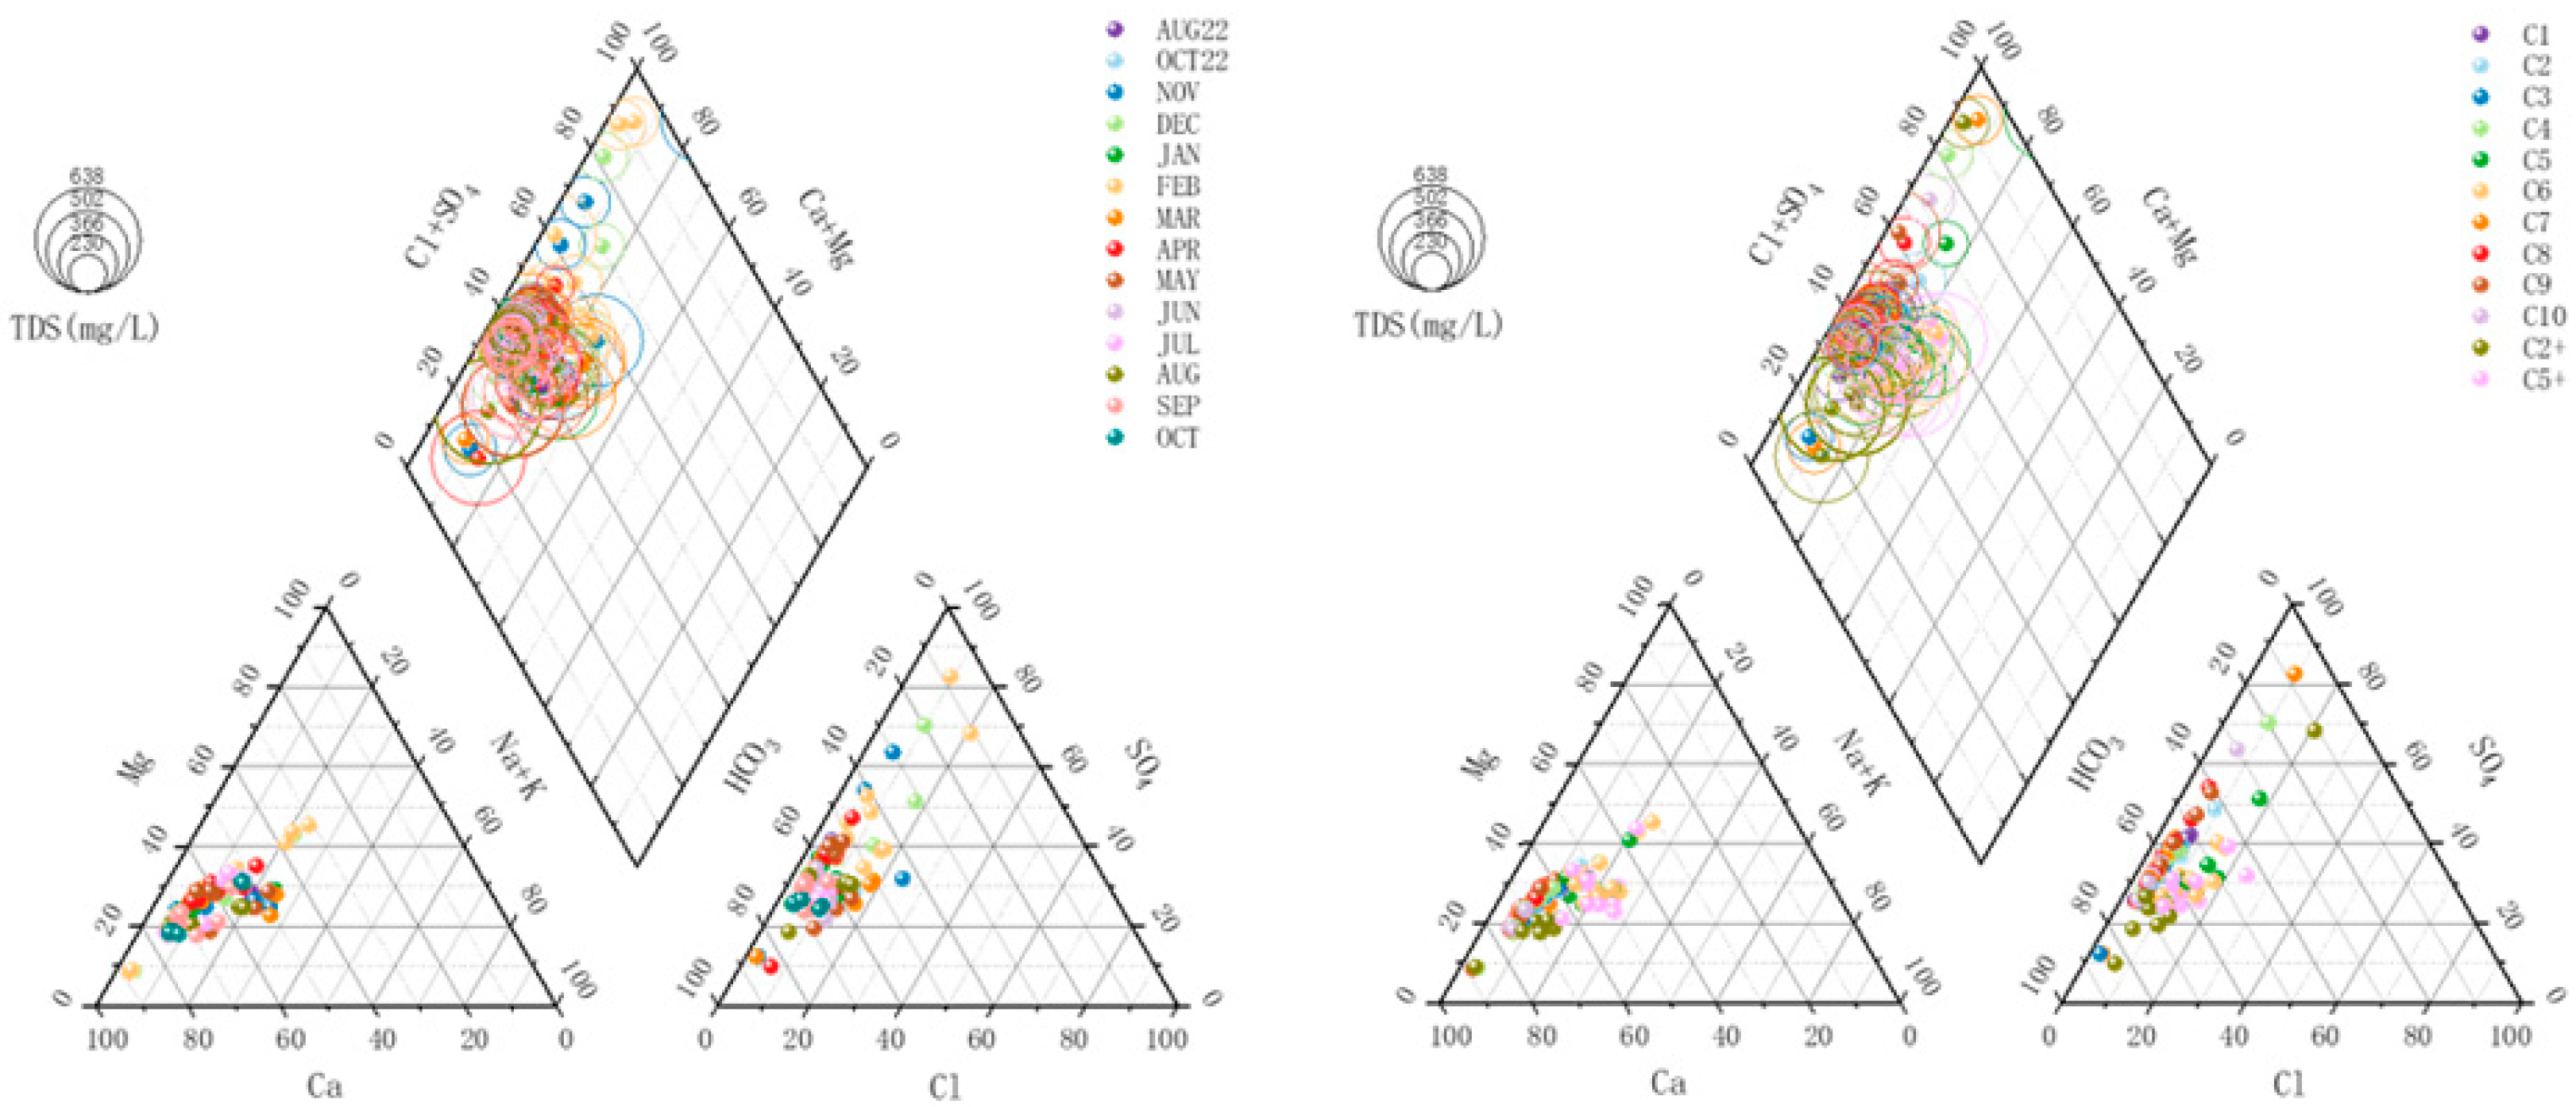
Most of the water bodies in the Midstream of the Chishui River belong to Class II water according to the “Environmental Quality Standards for Surface Water” (GB3838-2002), indicating relatively good overall water quality. The ionic composition of the river water is dominated by Ca2+ and HCO3, followed by Mg2+ and SO32, with the ionic composition primarily controlled by regional lithology.
(2)
Spatially, the water quality of the main river is superior to that of tributaries more significantly affected by human activities. Both the single-factor evaluation method and the Nemerow comprehensive evaluation method demonstrate good overall water quality in the Midstream of the Chishui River. The main river maintains water quality better than Class II surface water standards throughout the year, accounting for 98% of monitoring results. However, tributaries near Maotai Hotel and the Yanjin River estuary each showed one instance of water quality below Class II standards or moderate pollution.
(3)
Temporally, the water quality is better in winter and spring than in summer and autumn. Most indicators show higher values during summer, with precipitation and human activities exerting significant impacts on water quality during this period.
We acknowledge that our findings may contain potential biases due to spatially sparse sampling coverage and temporal constraints. Future studies could consider implementing higher-density spatial sampling (e.g., comprehensive coverage of all tributaries) and adopting continuous high-frequency monitoring over 3–5 years. Nevertheless, our results provide valuable annual variation data for water quality in the Chishui River, which could serve as a reference for riverine conservation efforts in China’s primary production region of Jiangxiang-style liquor (an iconic Chinese liquor with a soy sauce aroma).

Author Contributions

Writing—original draft, M.B., J.Z., B.C., Z.L., F.W., Y.X. and J.W. All authors have read and agreed to the published version of the manuscript.

Funding

Major Special Project of Guizhou Provincial Science and Technology Program (No. [2024]006); Science and Technology Program of Kweichow Moutai Co., Ltd. (Nos. GFJS20220896, GFJS20231990); Guizhou Provincial Basic Research Program (Natural Science)-ZK (2024) General 600; Bijie Joint Fund (Bijie Joint [2025] No. 19). The funder was not involved in the study design, collection, analysis, interpretation of data, the writing of this article or the decision to submit it for publication.

Data Availability Statement

The original contributions presented in this study are included in the article. Further inquiries can be directed to the corresponding author.

Conflicts of Interest

Author Jianguo Zhou and Bi Chen were employed by the company Kweichou Moutai Co., Ltd. The remaining authors declare that the research was conducted in the absence of any commercial or financial relationships that could be construed as a potential conflict of interest.

References

  1. Lei, Y.; Dong, F.; Liu, X.; Ma, B.; Huang, W. Short-term variations and correlations in water quality after dam removal in the chishui river basin. J. Environ. Manag. 2023, 327, 116917. [Google Scholar] [CrossRef]
  2. Li, J.; Cao, Y.; Pattison, Z.; Fu, W.; Sun, J. Does dam construction increase the biotic homogenization of riparian vegetation along a regulated river? River Res. Appl. 2024, 40, 1437–1444. [Google Scholar] [CrossRef]
  3. Ji, R.; Wang, C.; Wang, P.; Wang, W.; Chen, N. Quantitative analysis of spatiotemporal disparity of urban water use efficiency and its driving factors in the Yangtze River Economic Belt, China. J. Hydrol. Reg. Stud. 2024, 51, 101647. [Google Scholar] [CrossRef]
  4. Li, J.; Ouyang, Z.; Liu, P.; Zhao, X.; Wu, R.; Zhang, C.; Lin, C.; Li, Y.; Guo, X. Distribution and characteristics of microplastics in the basin of Chishui River in Renhuai, China. Sci. Total Environ. 2021, 773, 145591. [Google Scholar] [CrossRef] [PubMed]
  5. An, Y.L.; Lv, J.M.; Luo, J.; Wu, Q.X.; Jiang, H.; Peng, W.B.; Yu, X. Hydro-chemical Characteristics of Upper Chishui River Basin in Dry Season. Environ. Sci. Technol. 2015, 38, 117–122. (In Chinese) [Google Scholar]
  6. Xu, S.; Li, S.L.; Zhong, J.; Su, J.; Chen, S. Hydrochemical characteristics and chemical weathering processes in Chishui River Basin. Chin. J. Ecol. 2018, 37, 667–678. (In Chinese) [Google Scholar]
  7. Ge, X.; Wu, Q.; Wang, Z.; Gao, S.; Wang, T. Sulfur isotope and stoichiometry–based source identification of major ions and risk assessment in Chishui River Basin, Southwest China. Water 2021, 13, 1231. [Google Scholar] [CrossRef]
  8. Min, Y. Temporal and Spatial Distribution Characteristics and Interrelationships of Runoff, Sediment and Total Phosphorus in the Mainstream of Chishui River. Master’s Thesis, Changjiang River Scientific Research Institute, Wuhan, China, 2021. (In Chinese). [Google Scholar]
  9. Xu, S.; Lang, Y.; Zhong, J.; Xiao, M.; Ding, H. Coupled controls of climate, lithology and land use on dissolved trace elements in a karst river system. J. Hydrol. 2020, 591, 125328. [Google Scholar] [CrossRef]
  10. Jiang, Y.F.; An, Y.L.; Wang, Z.H.; Wu, Q.X.; Qin, L.; Zhang, J.; Shen, Y.Y. Analysis Spatial Distribution and Sources of Dissolved Trace Elements in the Water of Chishui River. Resour. Environ. Yangtze Basin 2021, 30, 1202–1210. (In Chinese) [Google Scholar]
  11. Xu, S.; Li, S.; Zhong, J.; Li, C. Spatial scale effects of the variable relationships between landscape pattern and water quality: Example from an agricultural karst river basin, southwestern china. Agric. Ecosyst. Environ. 2020, 300, 106999. [Google Scholar] [CrossRef]
  12. An, Y.L.; Jiang, H.; Wu, Q.X.; Yang, R.D.; Lang, X.; Luo, J. Assessment of water quality in the chishui river basin during low water period. Resour. Environ. Yangtze Basin 2014, 23, 1472–1478. (In Chinese) [Google Scholar]
  13. Cui, M.; Guo, Q.; Wei, R.; Tian, L. Human-driven spatiotemporal distribution of phosphorus flux in the environment of a mega river basin. Sci. Total Environ. 2021, 752, 141781. [Google Scholar] [CrossRef] [PubMed]
  14. Song, Y. P2P Evaluated Priority based Data Scheduling Mechanism Research in P2P Streaming Media System. Master’s Thesis, Ocean University of China, Qingdao, China, 2011. (In Chinese). [Google Scholar]
  15. Shi, K.; Zhao, Y.; Wu, C.; Geng, Y.; Zhou, S.; Chai, B. Revealing the distribution characteristics and key driving factors of dissolved organic matter in baiyangdian lake inflow rivers from different seasons and sources. Sci. Total Environ. 2024, 951, 175768. [Google Scholar] [CrossRef]
  16. Yang, L.; Liu, L.; Liu, Y.; Chen, G.; Liang, L. Hydrodynamic Groundwater Modeling and Hydrochemical Conceptualization of the Closure Mining Area of the WuMa River Watershed of China. ACS Omega 2023, 9, 520–537. [Google Scholar] [CrossRef]
  17. Zhao, Z.; Shen, Y.; Wang, Q.; Jiang, R. The temporal stability of soil moisture spatial pattern and its influencing factors in rocky environments. CATENA 2020, 187, 104418. [Google Scholar] [CrossRef]
  18. Zhu, J.; Peng, S.; Shen, X.; Lin, Z.; Gong, L.; Zhang, R.; Huang, B. Multiple scale impacts of land use intensity on water quality in the chishui river source area. Ecol. Indic. 2024, 166, 112396. [Google Scholar] [CrossRef]
  19. Luo, R.; Yang, S.; Wang ZZhang, T.; Gao, P. Impact and trade off analysis of land use change on spatial pattern of ecosystem services in Chishui River Basin. Environ. Sci. Pollut. Res. 2022, 29, 20234–20248. [Google Scholar] [CrossRef]
  20. Luo, J.; An, Y.-L.; Wu, Q.-I.; Yang, R.-D.; Jiang, H.; Peng, W.-B.; Yu, X.; Liu, J.-M. Spatial Distribution of Surface Water Chemical Components in the Middle and Lower Reaches of the Chishui River Basin. Earth Environ. 2014, 42, 297–305. (In Chinese) [Google Scholar]
  21. Pu, X.; Cheng, Q. Unraveling the impacts of multiscale landscape patterns and socioeconomic development on water quality: A case study of the national sustainable development agenda innovation demonstration zone in Lincang City, Southwest China. J. Hydrol. Reg. Stud. 2024, 51, 101660. [Google Scholar] [CrossRef]
  22. Yang, Y.; Yuan, J.; Bi, G.; Song, R.; Chen, H.; Chen, B.; Yang, F.; Wang, Y.; Wang, L. Fe(ii)/fe(iii) cycle actuating a novel process to remove organics in waste pit mud from maotai: Performance and mechanism. J. Water Process Eng. 2024, 62, 105365. [Google Scholar] [CrossRef]
  23. Zhan, J.; Wu, Z. Effects of liquor production wastewater discharge on water quality and health risks in the Chishui River Basin, Southwest China. J. Clean. Prod. 2023, 418, 138136. [Google Scholar] [CrossRef]
  24. Min, W.W.; Huang, F.J.; Wang, W. Situation of Water Environment and Evaluation of Water Quality in Chishui River Basin. Acta Agric. Jiangxi 2021, 33, 87–91. (In Chinese) [Google Scholar]
  25. Di, F.; Han, D.; Wang, G.; Zhao, W.; Zhou, D.; Rong, N.; Yang, S. Characteristics of bacterial community structure in the sediment of chishui river (china) and the response to environmental factors. J. Contam. Hydrol. 2024, 263, 104335. [Google Scholar] [CrossRef] [PubMed]
  26. Jiang, K.; Zhang, J.; Zhang, L.; Wang, D.; Wang, Y. Sustainable cooperation in the watershed ecological compensation public-private partnership project: Lessons from china’s chishui river basin. Socio-Econ. Plan. Sci. 2023, 90, 101730. [Google Scholar] [CrossRef]
  27. Wu, T.Y.; Li, J.; Yang, A.J.; Li, Y.C.; Chen, Y.; He, Q.; Ma, K.; Hu, X.; Wang, B.; Ai, J.; et al. Characteristics and Risk Assessment of Antibiotic Contamination in Chishui River Basin, Guizhou Province, China. Huan Jing ke Xue = Huanjing Kexue 2022, 43, 210–219. (In Chinese) [Google Scholar] [PubMed]
  28. Xiao, Y.; Zhou, J.; Wu, F.; Yang, F.; Chen, B.; Li, Z.; Liu, Y.; Wang, D.; Wang, J. Spatial and Temporal Characteristics of Riverine Fungal Communities and Their Responses to Environmental Factors in China’s Largest Jiang-Flavor Baijiu-Producing Region. Curr. Microbiol. 2025, 82, 150. [Google Scholar] [CrossRef]
  29. GB/T 11893-1989; Water Quality—Determination of Total Phosphorus—Ammonium Molybdate Spectrophotometric Method. China Environmental Science Press: Beijing, China, 1989.
  30. GB/T 7479-1987; Water Quality—Determination of Ammonium—Nessler’s Reagent Colorimetric Method. China Environmental Science Press: Beijing, China, 1987.
  31. GB/T 11913-1989; Water Quality—Determination of Dissolved Oxygen—Electrochemical Probe Method. China Environmental Science Press: Beijing, China, 1989.
  32. GB/T 13193-1991; Water Quality—Determination of TOC by Nondispersive Infrared Absorption Method. China Environmental Science Press: Beijing, China, 1991.
  33. HJ/T84-2001; Determination of Inorganic Anions in Water by Ion Chromatography. China Environmental Science Press: Beijing, China, 2001.
  34. HJ/812-2016; Water Quality—Determination of Soluble Cations by ion Chromatography. China Environmental Science Press: Beijing, China, 2016.
  35. GB/T 7475-1987; Water Quality—Determination of Copper, Zinc, Lead and Cadmium—Atomic Absorption Spectrometry. China Environmental Science Press: Beijing, China, 1987.
  36. GB/T 43098.2-2023; Analysis of Water Treatment Chemicals—Part 2: Determination of Arsenic, Mercury, Cadmium, Chromium, Lead, Nickel and Copper—Inductively Coupled Plasma Mass Spectrometry (ICP-MS). China Environmental Science Press: Beijing, China, 2023.
  37. GB 3838-2002; Environmental Quality Standards for Surface Water. China Environmental Science Press: Beijing, China, 2002.
  38. GB/T 11911-1989; Water Quality—Determination of Iron and Manganese—Flame Atomic Absorption Spectrometric Method. China Environmental Science Press: Beijing, China, 1989.
  39. Wu, Z.; Lai, X.; Li, K. Water quality assessment of rivers in lake Chaohu Basin (China) using water quality index. Ecol. Indic. 2021, 121, 107021. [Google Scholar] [CrossRef]
  40. Ning, Y.M.; Yin, F.N.; Li, X.B. Application of Several Evaluation Methods for River Water Quality in the Yangtze River Mainstream. J. Southwest Univ. (Nat. Sci.) 2020, 42, 126–133. (In Chinese) [Google Scholar]
  41. Chen, Y.S.; Yan, Y.T.; Zhu, Y.T.; Zhang, W.L.; Zhao, Y.P. Characteristics of rainfall-induced runoff pollution and its social influencing factors in main urban area of Chongqing City. Water Resour. Prot. 2024, 40, 117–125, 133. (In Chinese) [Google Scholar]
  42. Wu, J.; Wu, Q.X.; An, Y.L.; Gao, S.L.; Ke, X.H.; Zhou, J.X.; Qin, L. Iifluence of Urbranization on Trace Elements in Natural River—A Case Study of Chishui River Basin. Earth Environ. 2023, 50, 57–66. (In Chinese) [Google Scholar]
  43. Li, S.; Lu, X.X.; He, M.; Zhou, Y.; Bei, R.; Li, L.; Ziegler, A.D. Major element chemistry in the upper Yangtze River: A case study of the Longchuanjiang River. Geomorphology 2011, 129, 29–42. [Google Scholar] [CrossRef]
  44. Chai, N.; Yi, X.; Xiao, J.; Liu, T.; Liu, Y.; Deng, L.; Jin, Z. Spatiotemporal variations, sources, water quality and health risk assessment of trace elements in the fen river. Sci. Total Environ. 2021, 757, 143882. [Google Scholar] [CrossRef] [PubMed]
  45. Xun, B.; Lin, C.Y.; Mao, X.W. Analysis of applicability Nemerow pollution index to evaluation of water quality of Taihu Lake. Water Resour. Protect. 2014, 30, 38–40. [Google Scholar]
  46. Zhu, L.F.; Wang, Y.; Zhang, N.; Chen, M.; Chen, G.; Zhang, Z. Water quality evaluation of Hailang River based on single factor index method. Jiangsu Agric. Sci. 2012, 40, 326–327. (In Chinese) [Google Scholar] [CrossRef]
  47. Zhang, W.; Yang, B. Analysis of Influencing Factors on Main Stream Water Environment of Chishui River. J. Anhui Agric. Sci. 2019, 47, 80–83. (In Chinese) [Google Scholar]
  48. Pan, X.-D.; Tang, L.; Pu, X.C.; Feng, J.-J.; Li, R. Calculation of Allowable Assimilative Capacity of Yanjin River Based on One Dimensional Water Quality Model. China Rural. Water Hydropower 2020, 72–75, 81. (In Chinese) [Google Scholar]
  49. Zhou, F.-C.; Dong, Z.-Q.; Wang, H.-H.; Zhang, S. Status of water Enviroment Quality in the Middle Part of the Chishui River. China Popul. Resour. Environ. 2010, 20, 4. (In Chinese) [Google Scholar]
  50. Ji, Y.-H.; Fang, H.-P.; Shen, X.-P.; Sheng, H.-G.; Zhao, Q. Trend of Water Environment Quality in Maotai section of the Chishui River. Guizhou Chem. Ind. 2012, 37, 37–38, 41. (In Chinese) [Google Scholar]
Figure 1. Map of distribution of sampling points in the Midstream of the Chishui River.
Water 17 01837 g001
Figure 2. Water quality indicator course of the Midstream of the Chishui River monthly data from August 2022 to October 2023.
Water 17 01837 g002
Figure 3. Spatiotemporal characteristics of microelements in the Midstream of the Chishui River.
Water 17 01837 g003
Figure 4. (a) Evaluation Results of the Nemero Comprehensive Pollution Index Method in the Midstream of the Chishui River. (b) Evaluation Results of the Single Factor Index Method in the Midstream of the Chishui River.
Water 17 01837 g004
Figure 5. Spatial characteristics of anions and cations in the Midstream of the Chishui River. Note: The unit of F, Cl, SO42+, K+, Na+, Ca2+, and Mg2+ is mg/L.
Water 17 01837 g005
Table 1. Methods for determining the physical and chemical properties of water bodies.
NumberFactorAnalysis MethodMethod Source
1TPAmmonium molybdate spectrophotometric methodGB11893-89 [29]
2NH3-NNessler’s reagent colorimetric methodGB7479-87 [30]
3CODMnpermanganometryGB 3838-2002 [31]
4DOCNon dispersive infrared absorption methodGB13193-1991 [32]
5FIon chromatographyHJ/T84-2001 [33]
6ClIon chromatographyHJ/T84-2001 [33]
7SO42−Ion chromatographyHJ/T84-2001 [33]
8K+Ion chromatographyHJ/812-2016 [34]
9Na+Ion chromatographyHJ/812-2016 [34]
10Ca2+Ion chromatographyHJ/812-2016 [34]
11Mg2+Ion chromatographyHJ/812-2016 [34]
12Cu/Zn/NiGeneral rules for high-frequency plasma mass spectrometry analysisGB/T 7475-1987 [35]
13As/Hg/CdGeneral rules for high-frequency plasma mass spectrometry analysisGB/T 43098.2-2023 [36]
14V/Mo/TiGeneral rules for high-frequency plasma mass spectrometry analysisGB 3838-2002 [37]
15Be/Co/BaGeneral rules for high-frequency plasma mass spectrometry analysisGB 3838-2002 [37]
16Pb/CrGeneral rules for high-frequency plasma mass spectrometry analysisGB/T 43098.2-2023 [36]
17Fe/MnGeneral rules for high-frequency plasma mass spectrometry analysisGB11911-89 [38]
18Sb/TlGeneral rules for high-frequency plasma mass spectrometry analysisGB 3838-2002 [37]
Table 2. Classification standards of Nemerow Comprehensive Pollution Index method.
GradePneiPollution AssessmentGradePPollution Assessment
I≤0.7CleanIV(2.0,3]Heavy pollution
II(0.7, 1.0)Slightly pollutedV>3.0Malignant pollution
III(1.0, 2.0)Moderate Pollution
Table 3. Classification criteria for assessment of single-factor method.
GradePPollution Assessment GradePPollution Assessment
I≤1No pollutionIV(3, 5)Moderate pollution
II(1, 2)Slight pollutionV>5Severe pollution
III(2, 3)Slight pollution
Disclaimer/Publisher’s Note: The statements, opinions and data contained in all publications are solely those of the individual author(s) and contributor(s) and not of MDPI and/or the editor(s). MDPI and/or the editor(s) disclaim responsibility for any injury to people or property resulting from any ideas, methods, instructions or products referred to in the content.

