Article

Study on the Characteristics of TPH in Groundwater and Its Biodegradation Mechanism in Typical Petrochemical Enterprises in Jiangbei New Area, Nanjing

1
Nanjing Institute of Environmental Sciences, Ministry of Ecology and Environment, Nanjing 210042, China
2
Anhui Provincial Academy of Eco-Environmental Science Research, Hefei 230061, China
*
Authors to whom correspondence should be addressed.
These authors contributed equally to this work.
Water 2025, 17(12), 1803; https://doi.org/10.3390/w17121803
Submission received: 10 April 2025 / Revised: 6 June 2025 / Accepted: 12 June 2025 / Published: 16 June 2025

Abstract

Through sampling and analysis of 20 groundwater monitoring wells from nine oil storage enterprises in the Jiangbei New District of Nanjing, the pollution characteristics and chemical spatial distribution of total petroleum hydrocarbons (TPH) in the groundwater of the study area were revealed. TPH was detected in all 20 groundwater samples, with concentrations ranging from 0.26 to 90.24 mg/L. A factor analysis identified two principal factors, F1 and F2, representing the biodegradation processes of iron–manganese reduction and sulfate reduction, respectively. A correlation analysis showed that TPH was significantly positively correlated with total dissolved solids (TDS), total hardness, Fe, Mn2+, and oxygen consumption, but its correlation with sulfides and SO42− was not significant. A further multiple regression analysis indicated that the relative contribution rates of electron acceptors followed the order of iron reduction (90.62%) > manganese reduction (9.35%) > sulfate reduction (0.032%), suggesting that TPH biodegradation is primarily dominated by iron–manganese reduction. Additionally, the study found that microbial growth was more robust in freshwater environments, facilitating TPH degradation, whereas saline environments inhibited microbial activity, thereby hindering TPH degradation.

1. Introduction

Since the 1980s, the total petroleum hydrocarbon (TPH) contamination in groundwater at gas stations has attracted significant attention from scholars both domestically and internationally, with TPH being listed as a priority environmental pollutant in Europe and the United States [1]. By 2018, the total number of gas stations in China had reached 120,000 [2]. Leakage issues at gas stations have become increasingly severe due to long-term use, poor maintenance, and material corrosion. Leaked petroleum products can gradually migrate into the soil and aquifers, leading to groundwater contamination [3]. For example, 53% of the 167 storage tanks at the Karamay Petroleum Company in Xinjiang had varying degrees of corrosion and leakage issues [4]; in Tianjin, the detection rate of TPH in groundwater samples from some gas stations was 85%, with 40% of the samples exceeding the standard [5].
The migration and transformation of petroleum hydrocarbon pollutants in groundwater environments result from physical, chemical, and biological interactions, including convection, dispersion, adsorption, degradation, and volatilization. Among these, petroleum hydrocarbon pollutants can be oxidized into low-molecular-weight compounds or completely decomposed into CO2 and H2O under microbial action, making biodegradation a crucial factor in the removal of petroleum hydrocarbon pollutants [6]. Microorganisms in groundwater environments can utilize electron acceptors, such as O2, nitrate, sulfate, and iron–manganese oxides [7], degrading TPH pollutants through different metabolic pathways. Meanwhile, various electron acceptors (O2, NO3, SO42−, and iron–manganese oxides) are reduced to lower valence states (NO2, N2, Fe2+, Mn2+, etc.), forming different redox environments [8,9]. Additionally, metabolic processes may lead to the precipitation or dissolution of minerals [10]. Therefore, some scholars have used changes in electron acceptors (O2, NO3, SO42−, and iron–manganese oxides), the presence of intermediate products (NO2), inorganic carbon (DIC), pH, and changes in calcium and magnesium ions to determine whether biodegradation has occurred [11,12,13]. Other scholars have considered the complexity and interconnections of groundwater chemical components by using multivariate statistical analysis to identify the biodegradation of petroleum hydrocarbons and water–rock interactions [14,15]. For example, Lee et al. [16] used principal component analysis to reveal that the primary mechanisms of petroleum pollutant attenuation were biodegradation and precipitation infiltration. Lü Hang et al. [17] used principal factor analysis to determine that the biodegradation of petroleum hydrocarbons in the study area mainly included aerobic respiration, sulfate reduction, and nitrate reduction, and used principal factor scores to determine that the groundwater chemical composition was primarily influenced by biodegradation, followed by mineral dissolution.
Currently, there are numerous studies on the migration and transformation of petroleum hydrocarbons in groundwater, but there is limited research on the relative contribution rates of electron acceptors (O2, NO3, Fe3+, Mn, and SO42−) during the biodegradation of petroleum hydrocarbons, especially in developed regions with concentrated petrochemical industries.
This study, based on an investigation of gas stations and hydrogeological conditions in the study area, analyzed groundwater samples from 20 wells across 9 oil storage enterprises located in different hydrogeological conditions to examine the contamination characteristics and spatial distribution of petroleum hydrocarbons in groundwater at gas stations, as well as the chemical spatial distribution characteristics of groundwater in the study area. A correlation analysis and a multiple regression analysis were used to further reveal the biodegradation mechanisms of TPH in groundwater at gas stations. The research results support improved strategies for groundwater protection for the prevention and control of petroleum hydrocarbon contamination in groundwater at gas stations.
The Changlu Subdistrict of the Nanjing Jiangbei New Materials Science and Technology Park covers an area of 32.6 km2, with an industrial focus on six major fields: petroleum and natural gas chemicals, basic organic chemical raw materials, fine chemicals, polymer materials, life sciences, and new chemical materials. The Changlu Subdistrict is dominated by basic chemical raw material manufacturing and specialty chemical product manufacturing, accounting for 53.5% of the industry. Additionally, there are enterprises involved in synthetic material manufacturing, pesticide manufacturing, paint and similar product manufacturing, petroleum product manufacturing, chemical reagent and auxiliary manufacturing, and chemical pharmaceutical raw material manufacturing. Centered around Yangzi Petrochemical, the Changlu Subdistrict of Jiangbei New Area has numerous small petrochemical enterprises that store petrochemical products. Due to a lack of unified management, these small petrochemical enterprises face various environmental issues, with petroleum products leaking into the soil, posing potential contamination risks to the soil and groundwater.

2. Materials and Methods

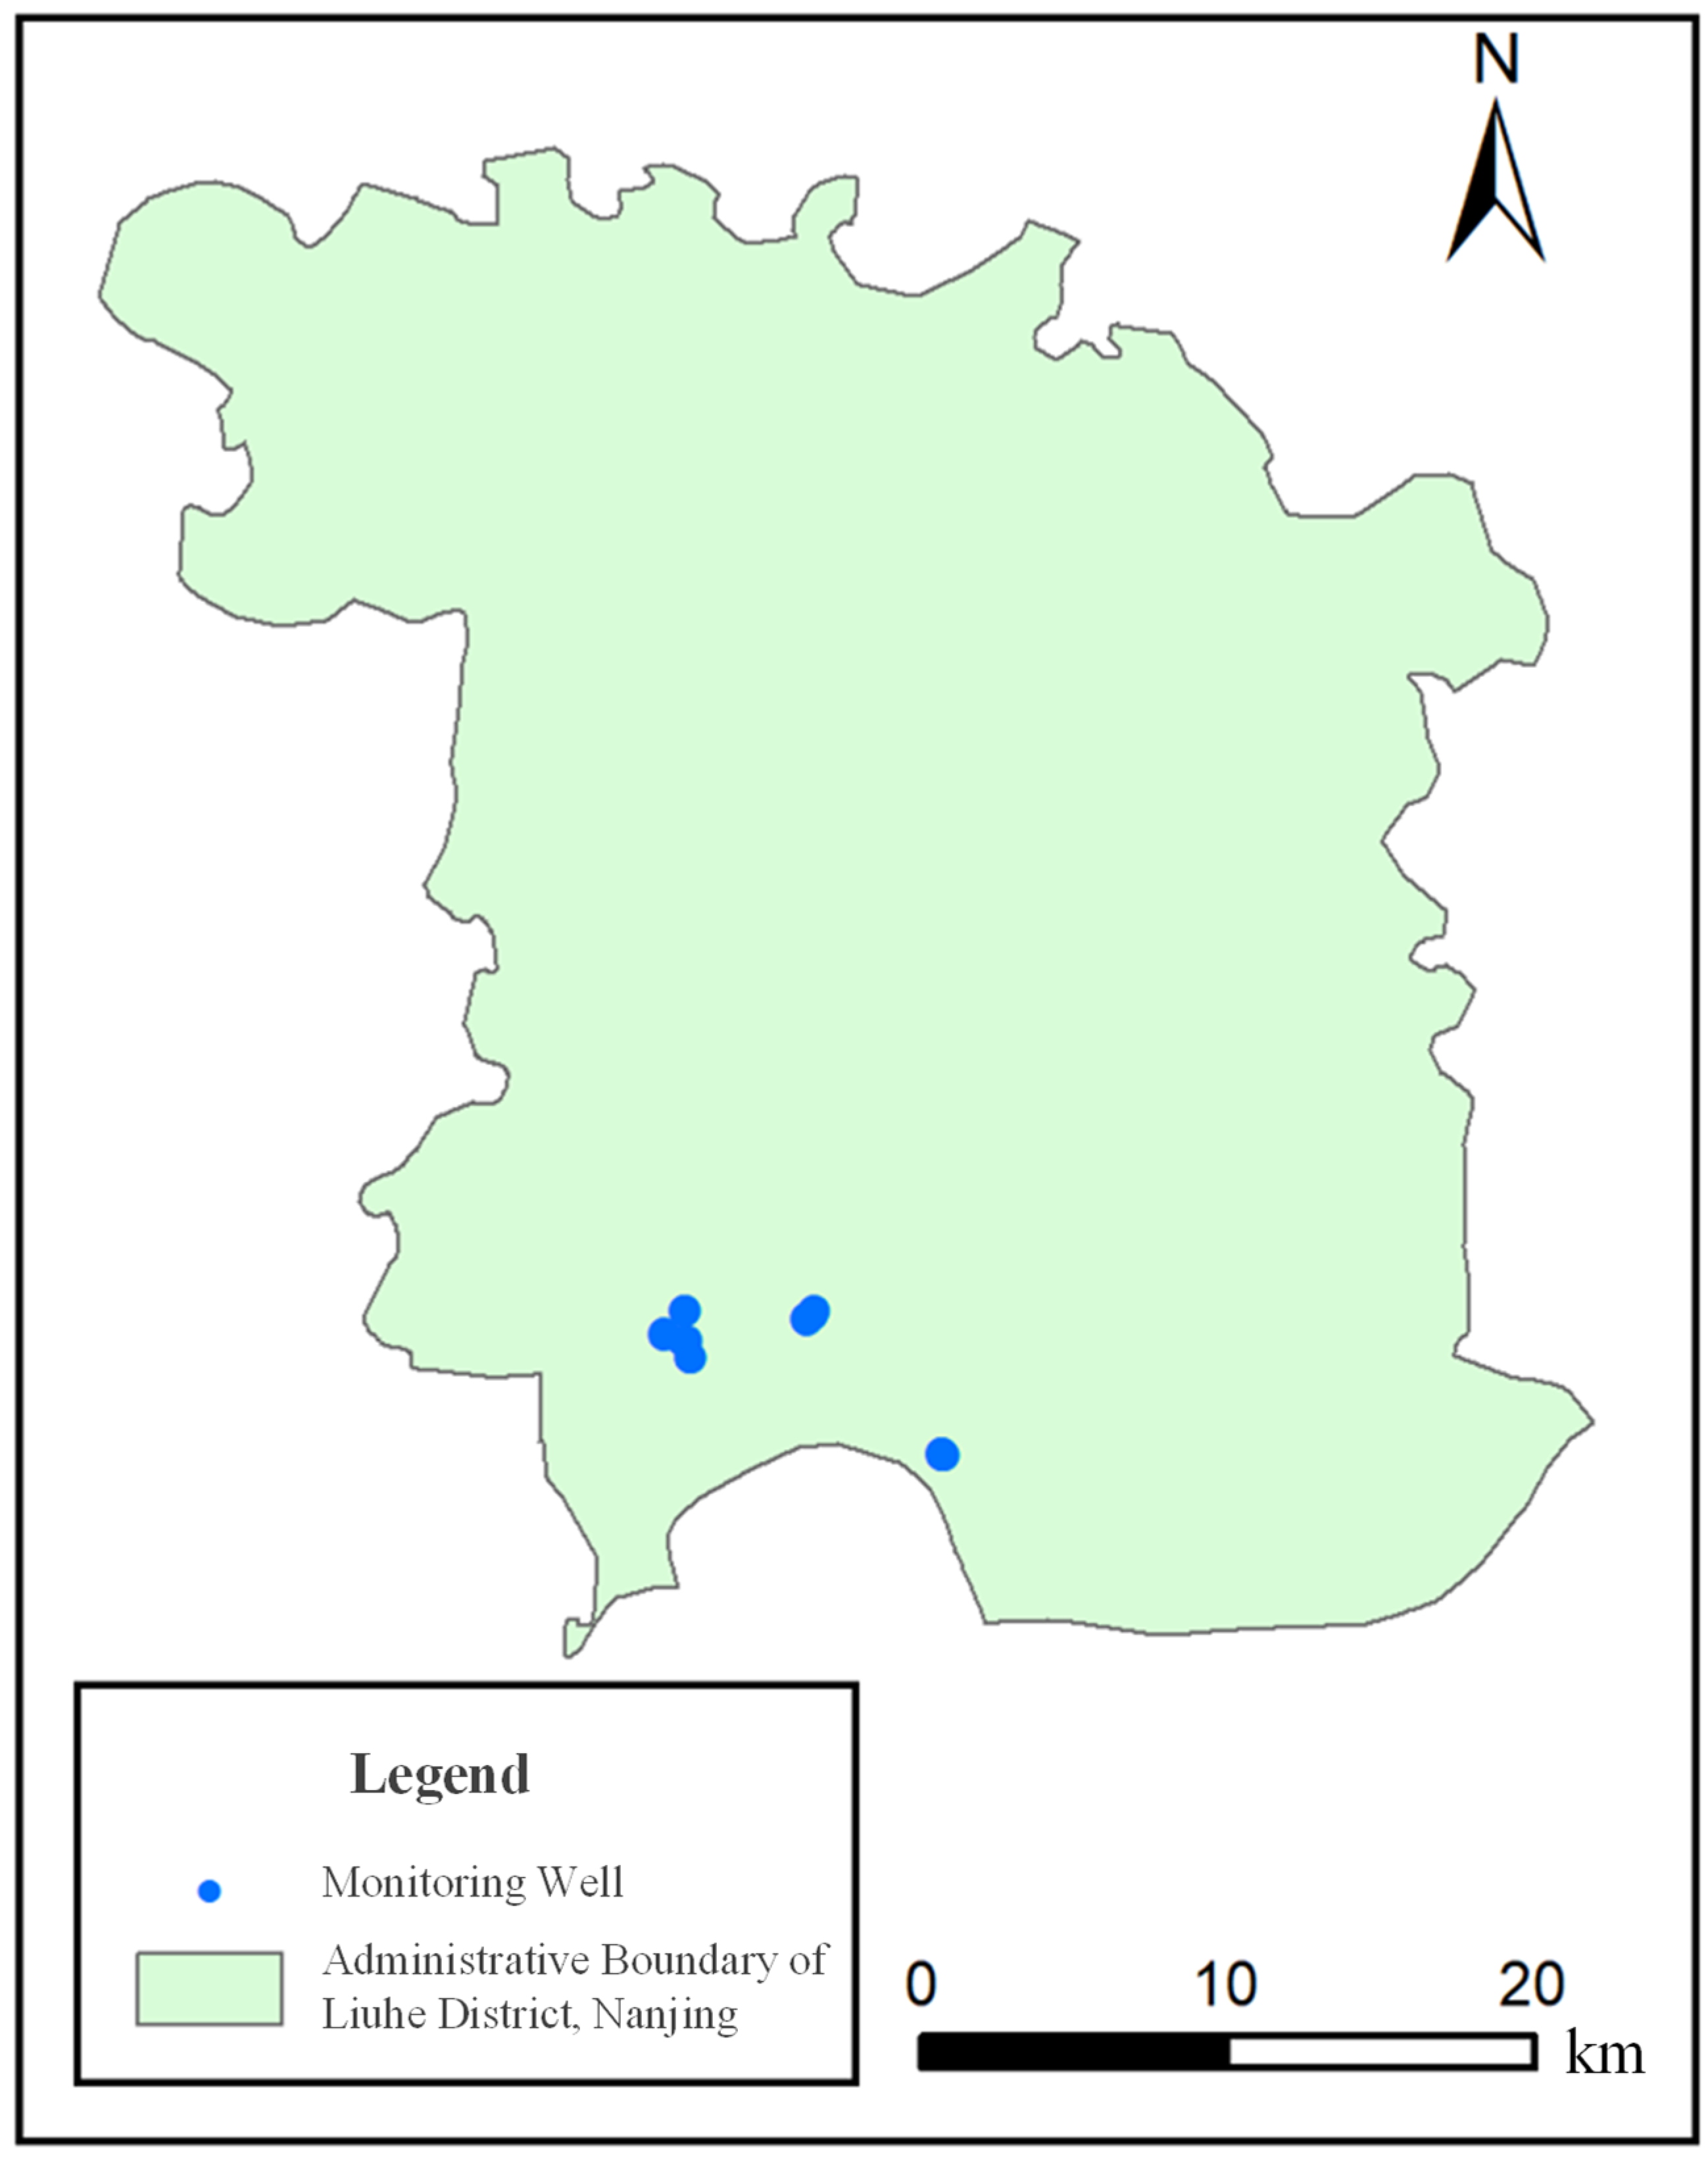
2.1. Regional Hydrogeological Conditions

Jiangbei New Area is located north of the Yangtze River in Nanjing, covering Pukou District, Luhe District, and the Bagua Subdistrict of Qixia District. It is situated at the intersection of the eastern developed regions and the central and western regions, serving as a core area of the Nanjing Metropolitan Circle and the Ningzhengyang Integration. The total area is approximately 2451 km2. The study area features a landscape dominated by low mountains, hills, plains, and terraces, with a relatively flat terrain. It has a subtropical monsoon climate, with an average annual temperature of 15.4 °C and an average annual rainfall of 1106.5 mm.
The study area is located in the Changlu Subdistrict of Jiangbei New Area, near the Yangtze River, within the Yangtze River Valley alluvial plain. Based on the aquifer medium, Jiangbei New Area is divided into three types of aquifer groups: the loose rock pore aquifer group, the carbonate rock karst water aquifer group, and the bedrock fissure aquifer group. According to the 1:200,000 comprehensive hydrogeological map of Nanjing, the study area mainly consists of the loose rock pore aquifer group (Q4al), composed of Cenozoic loose sediments widely distributed in terraces and alluvial plains. Pore phreatic water is distributed in the shallow parts of river valley floodplains and the edges of floodplains and terraces, belonging to the loose rock pore aquifer group, generally buried within 5 m of the surface, with lithology mainly consisting of silty clay, silt, and fine sand interlayers. Thin layers of gravelly sand are commonly found in the middle and lower parts of hill valleys. Pore-confined water is mainly distributed in the Yangtze River floodplain and the Chu River floodplain.
The Quaternary system in the Yangtze River alluvial plain is well-developed, primarily consisting of Holocene deposits. The thickness of the Quaternary system in the plain area is generally 40–80 m (locally reaching up to 90 m in some areas along the river). Due to tectonic uplift and subsidence, the Quaternary system in the plain area is incomplete, with most areas missing Middle and Lower Pleistocene deposits.
The study area belongs to the Yangtze stratigraphic region, with sporadic bedrock outcrops in the vicinity, and the surface is covered by Quaternary deposits. According to regional data, the strata distributed in the study area and its vicinity include:
Cretaceous (K): Upper Cretaceous Pukou Formation (K2p), with upper layers of brick-red siltstone, fine sandstone, and mudstone, and lower layers of purple–red conglomerate and sandstone, with a thickness exceeding 450 m;
Paleogene (E): Eocene Funing Formation (E1f), with upper layers of brown–gray and gray–yellow calcareous siltstone and fine sandstone, and lower layers of gray–white, purple–red, and brown–red mudstone, exhibiting wormhole structures;
Neogene (N): Pliocene (N2): Gravel layer, gray and gray–white, with a gravel-to-sand ratio of 5:5, topped by gray–green and gray–white mudstone interbedded with thin layers of siltstone, lens-shaped, 58 cm thick, with a surface of brown iron sandstone;
Quaternary (Q): Lower Pleistocene (Q1): Upper layers of yellow–brown silty clay, middle layers of yellow medium-coarse sand and medium-fine sand, and lower layers of gray–yellow and gray–blue clay. Middle Pleistocene (Q2): Upper layers of gray–yellow and yellow–brown silty clay interbedded with silt, and lower layers of gray medium-fine sand and medium-coarse sand, locally interbedded with thin layers of silty clay. Upper Pleistocene (Q3): Upper layers of gray fine sand, and lower layers of dark gray and brown–yellow medium-fine sand, locally interbedded with thin layers of silty clay and silt. Holocene (Q4): Upper layers of gray-brown silty clay, middle layers of muddy silty clay and silty clay interbedded with thin layers of sand, and lower layers of gray-yellow fine sand, interbedded with thin layers of silty clay.
The study area is located along the Yangtze River, with groundwater types primarily consisting of loose rock pore aquifer groups. Based on the groundwater type distribution, the main types include Yangtze River Valley floodplain pore water, Chu River floodplain pore water, Luhe area pore water, and basalt pore water.
The chemical types of Yangtze River Valley floodplain pore water are relatively simple, mainly HCO3-Ca·Mg type, with a mineralization degree of 0.4~0.75 g/L, pH of 6.9~8.3, and total hardness of 291–828 mg/L. The chemical types of Chu River floodplain pore water are mainly the HCO3-Ca·Na·Mg type, with a mineralization degree of 0.34~0.62 mg/L and total hardness of 191~442 mg/L. The chemical types of Luhe area pore water and basalt pore water are mainly HCO3-Ca·Na or HCO3-Ca·Mg type, with the northernmost Dasheng–Dongwang area being HCO3·Cl-Ca·Mg type water, with a mineralization degree of 0.19~0.581 g/L, pH of 6.5~8.8, and total hardness of 103~420 mg/L.

2.2. Oil Storage Enterprises Overview

This study involved 9 oil storage enterprises located in the Changlu Subdistrict of Jiangbei New Area, Nanjing. Most were built around 2005 and were demolished around 2019. The enterprises consisted of horizontal tanks, vertical tanks, and office areas, with storage tanks made of stainless steel. The specific locations of the 9 enterprises are shown in Figure 1, and their basic information is listed in Table 1. The lithology of the 9 enterprises mainly consists of fill and silty clay, with a large thickness and relatively stable distribution. The permeability coefficient is generally 1 × 10⁻⁶~1.2 × 10⁻⁴ cm/s, indicating poor permeability. The groundwater flow direction is roughly from northwest to southeast, with a water level depth of 0.59~3.17 m, varying with the season, and a water level elevation of 12.24~18.78 m, with an annual variation of 0.50~1.00 m. This study primarily focused on the loose rock pore aquifer group, with phreatic water mainly recharged by atmospheric precipitation.

2.3. Sample Collection and Analysis

Based on factors such as groundwater flow direction, enterprise operation duration, and land area, 20 groundwater monitoring wells were set up across 9 oil storage enterprises. Two monitoring wells were set up at TD Corporation, two at TH Corporation, one at SP Corporation, two at ZY Corporation, three at DT Corporation, five at HY Corporation, two at PW Corporation, two at YP Corporation, and one at ZL Corporation. The depth of the monitoring wells was generally 7.5 m. A total of 21 groundwater samples were collected in 2020, with the testing indicators mainly including heavy metals, conventional indicators, volatile organic pollutants, semi-volatile organic pollutants, and petroleum hydrocarbons. The laboratory quality control results of the samples met the national standards. The testing parameters for groundwater samples are presented in Table 2, and the analytical methods are shown in Table 3.

2.4. Factor Analysis

Factor analysis is a dimensionality reduction technique that uses the correlation matrix information of original variables to classify variables with complex relationships into a few main factors, which can replace the original variables. These main factors not only reflect the information of the original variables to the greatest extent but are also independent of each other [18].
Factor analysis can be divided into two types based on the research object: R-type factor analysis, which studies the relationships between variables, and Q-type factor analysis, which studies the relationships between samples. The former mainly groups variables based on the correlation between the original variables, so that variables within the same group have a high correlation, while variables in different groups have a low correlation [19]. Each group of variables represents a basic structure, known as a common factor. This is a commonly used statistical method in hydrogeochemical and environmental geology studies, which can reveal hydrogeochemical processes and biodegradation reaction mechanisms by determining the relationships between various hydrochemical indicators [20,21,22]. The main modeling idea is as follows.
Suppose there are n samples and m variables, and there is a set of potential factors F1, F2, …, Fp (p < m), such that each variable Xi can be expressed as a linear combination of potential factors Fp and special factors em:
X 1 = α 11 F 1 + α 12 F 2 + + α 1 P F P + e 1 X 2 = α 21 F 1 + α 22 F 2 + + α 2 P F P + e 2 X m = α m 1 F 1 + α m 2 F 2 + + α m P F P + e m
In the equation, em is the specific factor, unique to the vector Xi, and the specific factors are independent of each other and of the common factors; αij is the factor loading, where i is the sample size, and j is the number of variables; and p is the number of common factors. This study uses groundwater chemical indicators (TPH, TDS, total hardness, Fe, Mn2+, oxygen consumption, sulfides, and SO42−) as the original variables. The principal component analysis method is applied to extract the main factors from these indicators, and the variance maximization orthogonal rotation method is used to rotate the factors to identify the actual meaning of each main factor.

2.5. Correlation Analysis

Correlation analysis is mainly used to study the correlation between two or more variables, which can explain the causal relationship between variables and the degree of closeness between variables, thereby revealing the intrinsic connections between things [23]. Generally, Pearson, Kendall, and Spearman correlation coefficients are used to represent the correlation between variables. The Pearson correlation coefficient requires the original variables to follow a normal distribution, while the Spearman correlation coefficient does not require a specific distribution type. The correlation coefficient ranges from −1 to 1. If the coefficient is greater than 0, it indicates a positive correlation between the two variables. If it is less than 0, it indicates a negative correlation. If the coefficient equals 0, it indicates no correlation between the two variables. Based on this, this paper uses SPSS 27.0 software to conduct Spearman correlation analysis between TPH and groundwater chemical indicators (TDS, total hardness, Fe, Mn2+, oxygen consumption, sulfides, and SO42−) to further reveal the biodegradation mechanism of TPH in groundwater at gas stations.

2.6. Relative Contribution Rate Analysis

Based on the research of Li et al. [24], this paper uses multiple regression analysis to calculate the relative contribution rate of each electron acceptor. The calculation formula is as follows:
Y = c + a 1 X 1 + a 2 X 2 + a 3 X 3 + + a n X n
η i = | a i | a 1 + a 2 + + a n , i = 1 , 2 , 3 , , n
where Y is the dependent variable, representing the concentration of TPH in groundwater; X is the independent variable, representing the concentration of each electron acceptor (Mn, Fe, SO42−); c is the constant in the multiple regression model; ai is the regression coefficient in the multiple regression model; and ηi is the relative contribution rate of each electron acceptor.

3. Results and Discussion

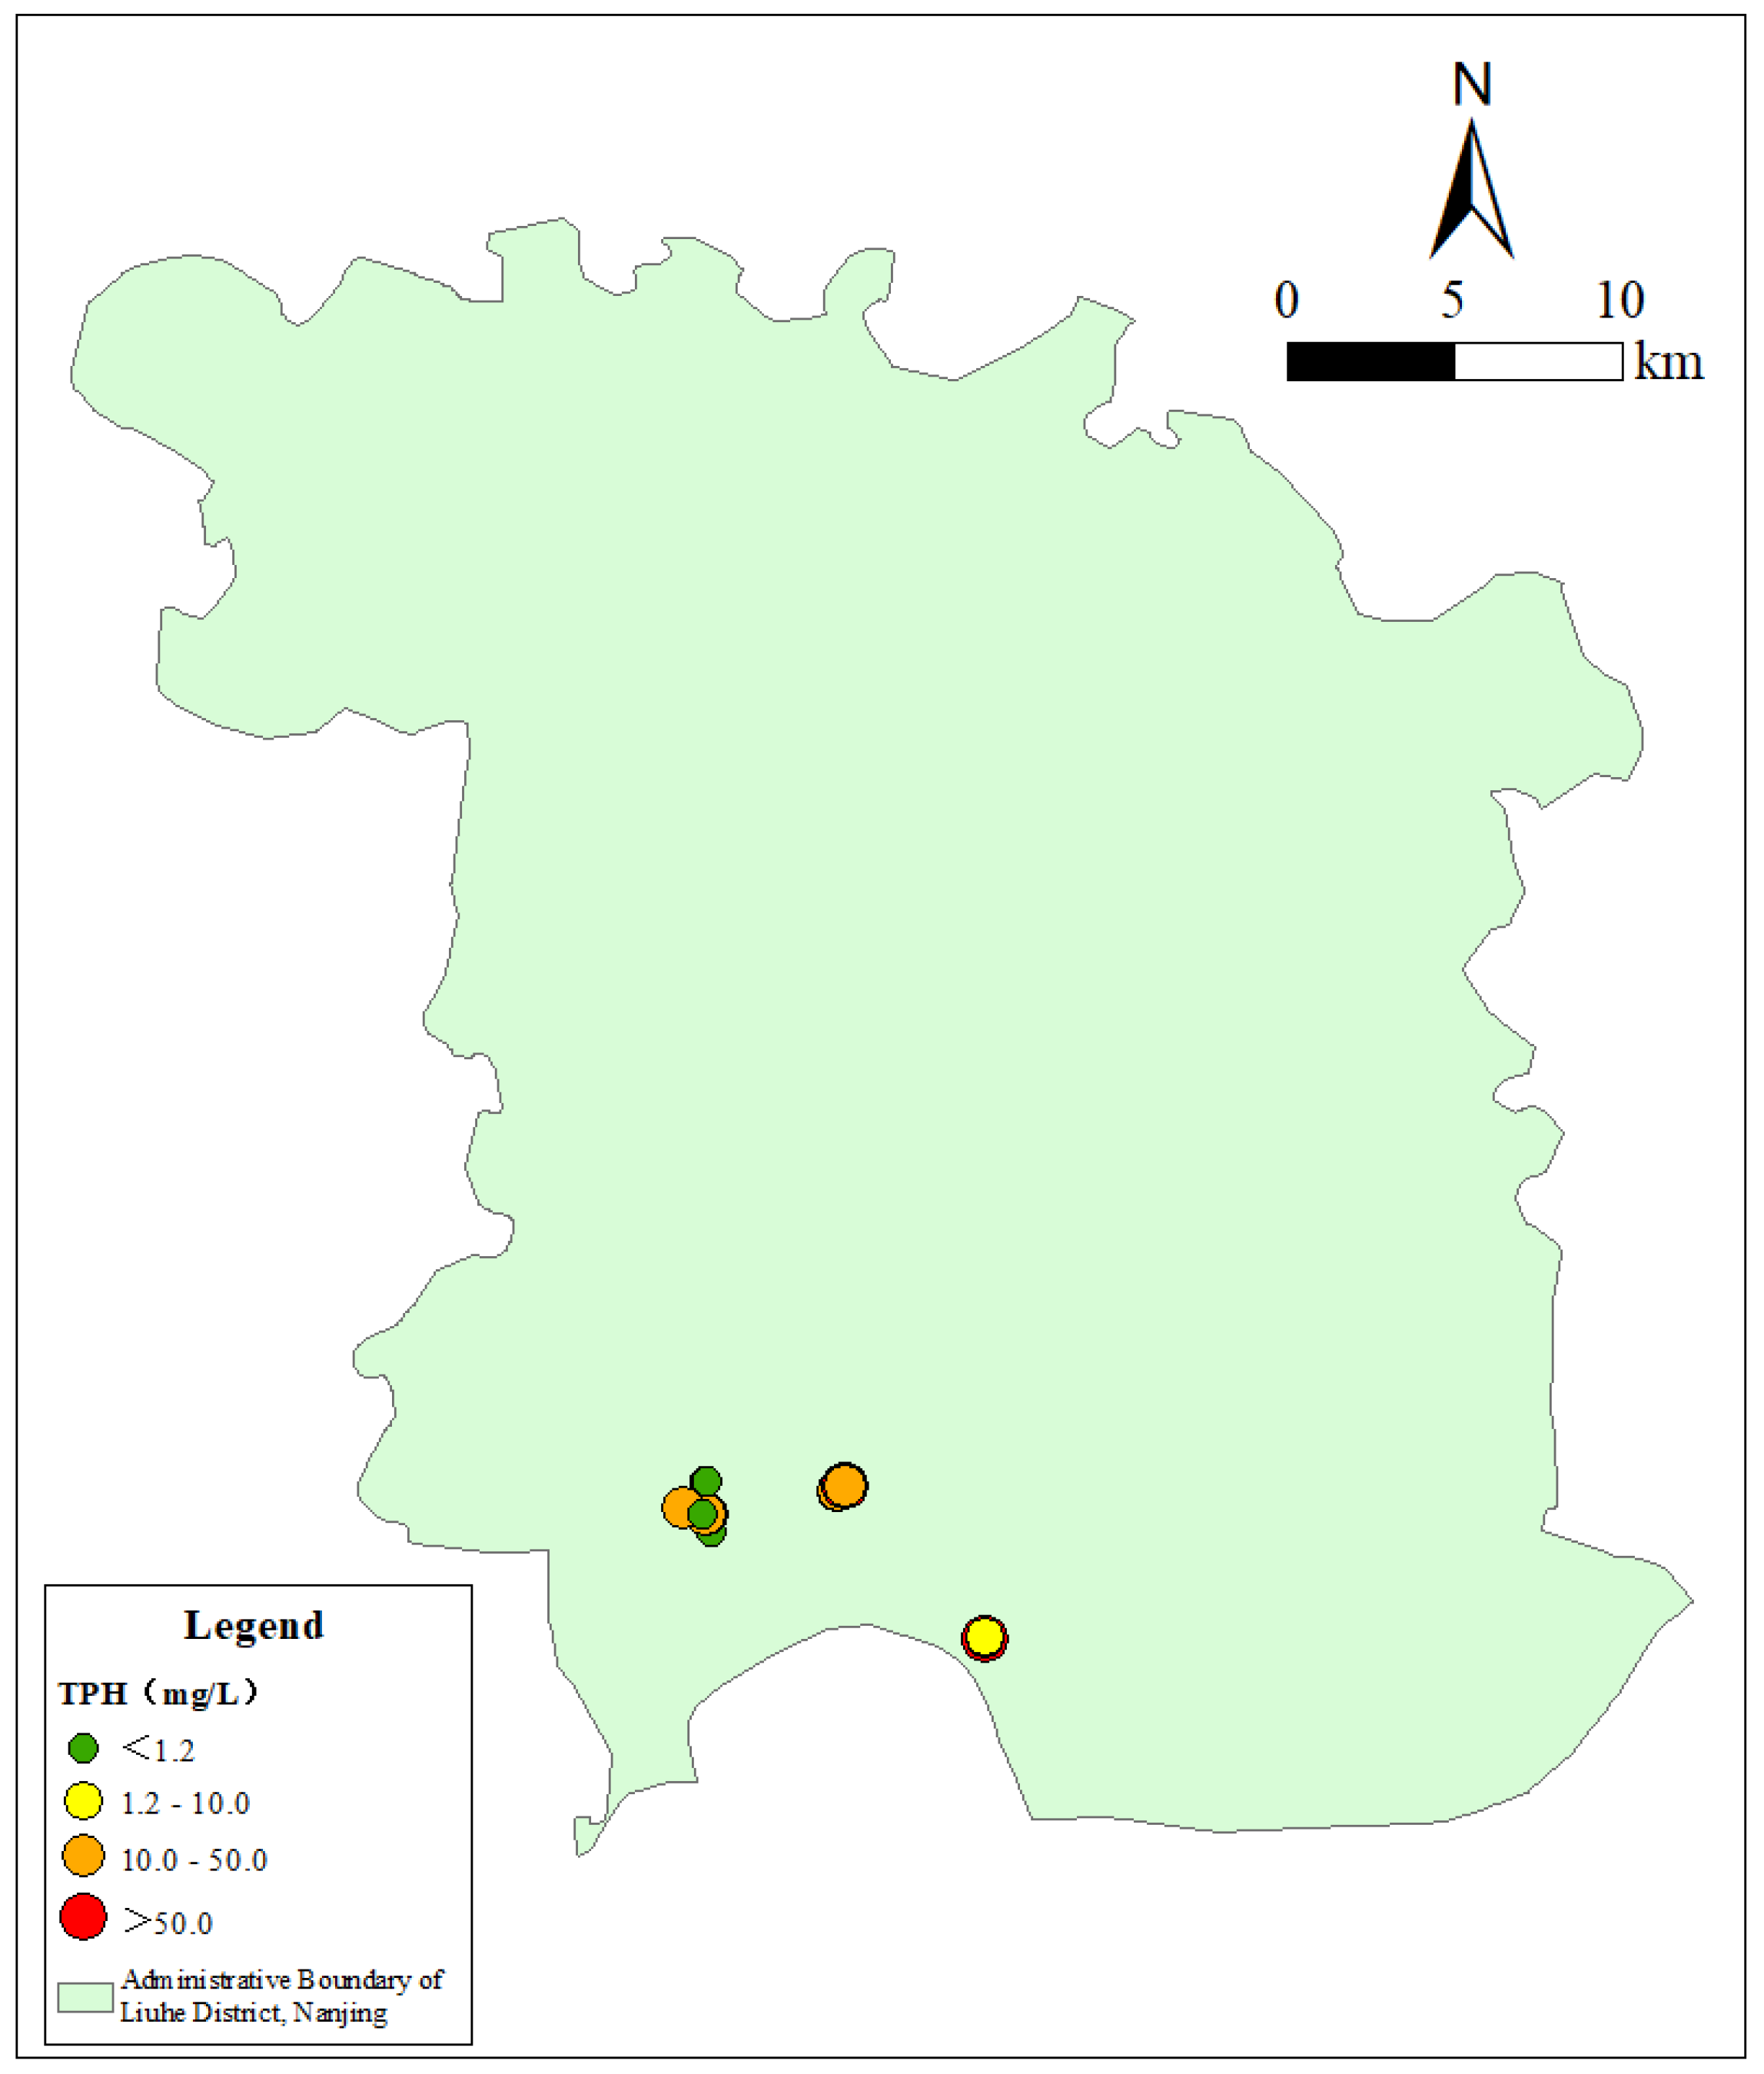
3.1. Spatial Distribution Characteristics of TPH in Groundwater in the Study Area

Based on the test results of 20 groundwater samples in the study area, the detection rate of TPH was 100%, with a concentration range of 0.26~90.24 mg/L and an average of 12.87 mg/L. The detection of TPH in groundwater from nine oil storage enterprises (TD, TH, SP, ZY, DT, HY, PW, YP, and ZL) is as follows. The spatial distribution of TPH is shown in Figure 2.
TD Corporation: There are two groundwater monitoring wells, with TPH concentrations of 0.67 mg/L and 0.78 mg/L;
TH Corporation: There are two groundwater monitoring wells, with TPH concentrations of 0.66 mg/L and 1.07 mg/L;
SP Corporation: There is one groundwater monitoring well, with a TPH concentration of 1.32 mg/L;
ZY Corporation: There are two groundwater monitoring wells, with TPH concentrations of 0.26 mg/L and 15.70 mg/L;
DT Corporation: There are three groundwater monitoring wells, with TPH concentrations of 4.49 mg/L, 28.52 mg/L, and 53.60 mg/L;
HY Corporation: There are five groundwater monitoring wells, with TPH concentrations of 0.61 mg/L, 1.47 mg/L, 1.50 mg/L, 7.88 mg/L, and 90.24 mg/L;
PW Corporation: There are two groundwater monitoring wells, with TPH concentrations of 2.12 mg/L and 18.92 mg/L;
YP Corporation: There are two groundwater monitoring wells, with TPH concentrations of 10.63 mg/L and 16.52 mg/L;
ZL Corporation: There is one groundwater monitoring well, with a TPH concentration of 0.40 mg/L.

3.2. Groundwater Chemical Characteristics

As shown in Table 4, the pH range of the groundwater in the study area is 6.39−7.63, with an average of 7.01, indicating a neutral environment. The TDS in the groundwater shows significant differences, with a concentration range of 325−3130 mg/L and an average of 1000.45 mg/L. The main cation concentrations are in the order of Na+, Mn2+, Fe, Cu2+, and the main anion concentrations are in the order of SO42−, Cl. The coefficients of variation for Fe, Mn2+, SO42−, and Cl are large, indicating a high degree of dispersion in the study area’s groundwater. The average concentration of Fe is 0.25 mg/L, with a detection rate of only 25%, and a high degree of dispersion, indicating significant spatial variability in the Fe concentration in the study area’s groundwater. Generally, Fe and Mn in groundwater can reflect the anaerobic biodegradation process of organic pollutants (iron and manganese reduction).

3.3. Groundwater Factor Analysis

Factor analysis was conducted on eight indicators in groundwater (TPH, TDS, total hardness, Fe, Mn2+, oxygen consumption, sulfides, and SO42−). The Kaiser–Meyer–Olkin (KMO) test and Bartlett’s sphericity test were performed on the data, with a KMO value of 0.665 and a Bartlett’s test significance < 0.001, indicating that the data support the factor analysis. The correlation coefficients between the indicators are shown in Table 5, and the eigenvalues, contribution rates, cumulative variance contribution rates, and rotated factor loading matrix calculated from the original data are shown in Table 6.
This study selected two main factors with eigenvalues greater than one for analysis. As shown in Table 6, the cumulative contribution rate of these two main factors reached 76.418%, reflecting 76.418% of the basic information of the original data.
The first main factor, F1, includes Fe, oxygen consumption, TPH, Mn2+, and sulfides, with a contribution rate of 44.748%. Fe, oxygen consumption, and TPH have large loadings, and all indicators are positively correlated with F1, with good correlation among them. This indicates that TPH in the study area’s groundwater may have undergone iron and manganese reduction biodegradation, producing Fe2+ and Mn2+. The positive correlation between oxygen consumption and F1 also confirms the existence of the reduction process. Since the TDS concentration in the study area’s groundwater is large (325–3130 mg/L), it indicates that there are many cations and anions in the groundwater. Studies have shown that the higher the TDS concentration, the easier it is to release Mn into the groundwater through ion exchange adsorption, thereby increasing the Mn concentration in the groundwater. Therefore, the main factor F1 represents the possible iron and manganese reduction biodegradation of TPH, and also represents the influence of ion adsorption on the chemical composition of groundwater.
The second main factor, F2, includes SO42−, TDS, and total hardness, with a contribution rate of 31.670%. All indicators have large loadings and are positively correlated with F1. In the study area’s groundwater, microorganisms may use SO42− as an electron acceptor to degrade TPH pollutants, and CO2 may be produced during the degradation process, increasing the DIC in the groundwater environment. According to Le Chatelier’s principle, the increase in DIC concentration may cause Ca2+ precipitation, contributing to the increase in water hardness (expressed in CaCO3 equivalents) in the groundwater. Therefore, the main factor, F2, represents the possible sulfate reduction biodegradation of TPH.

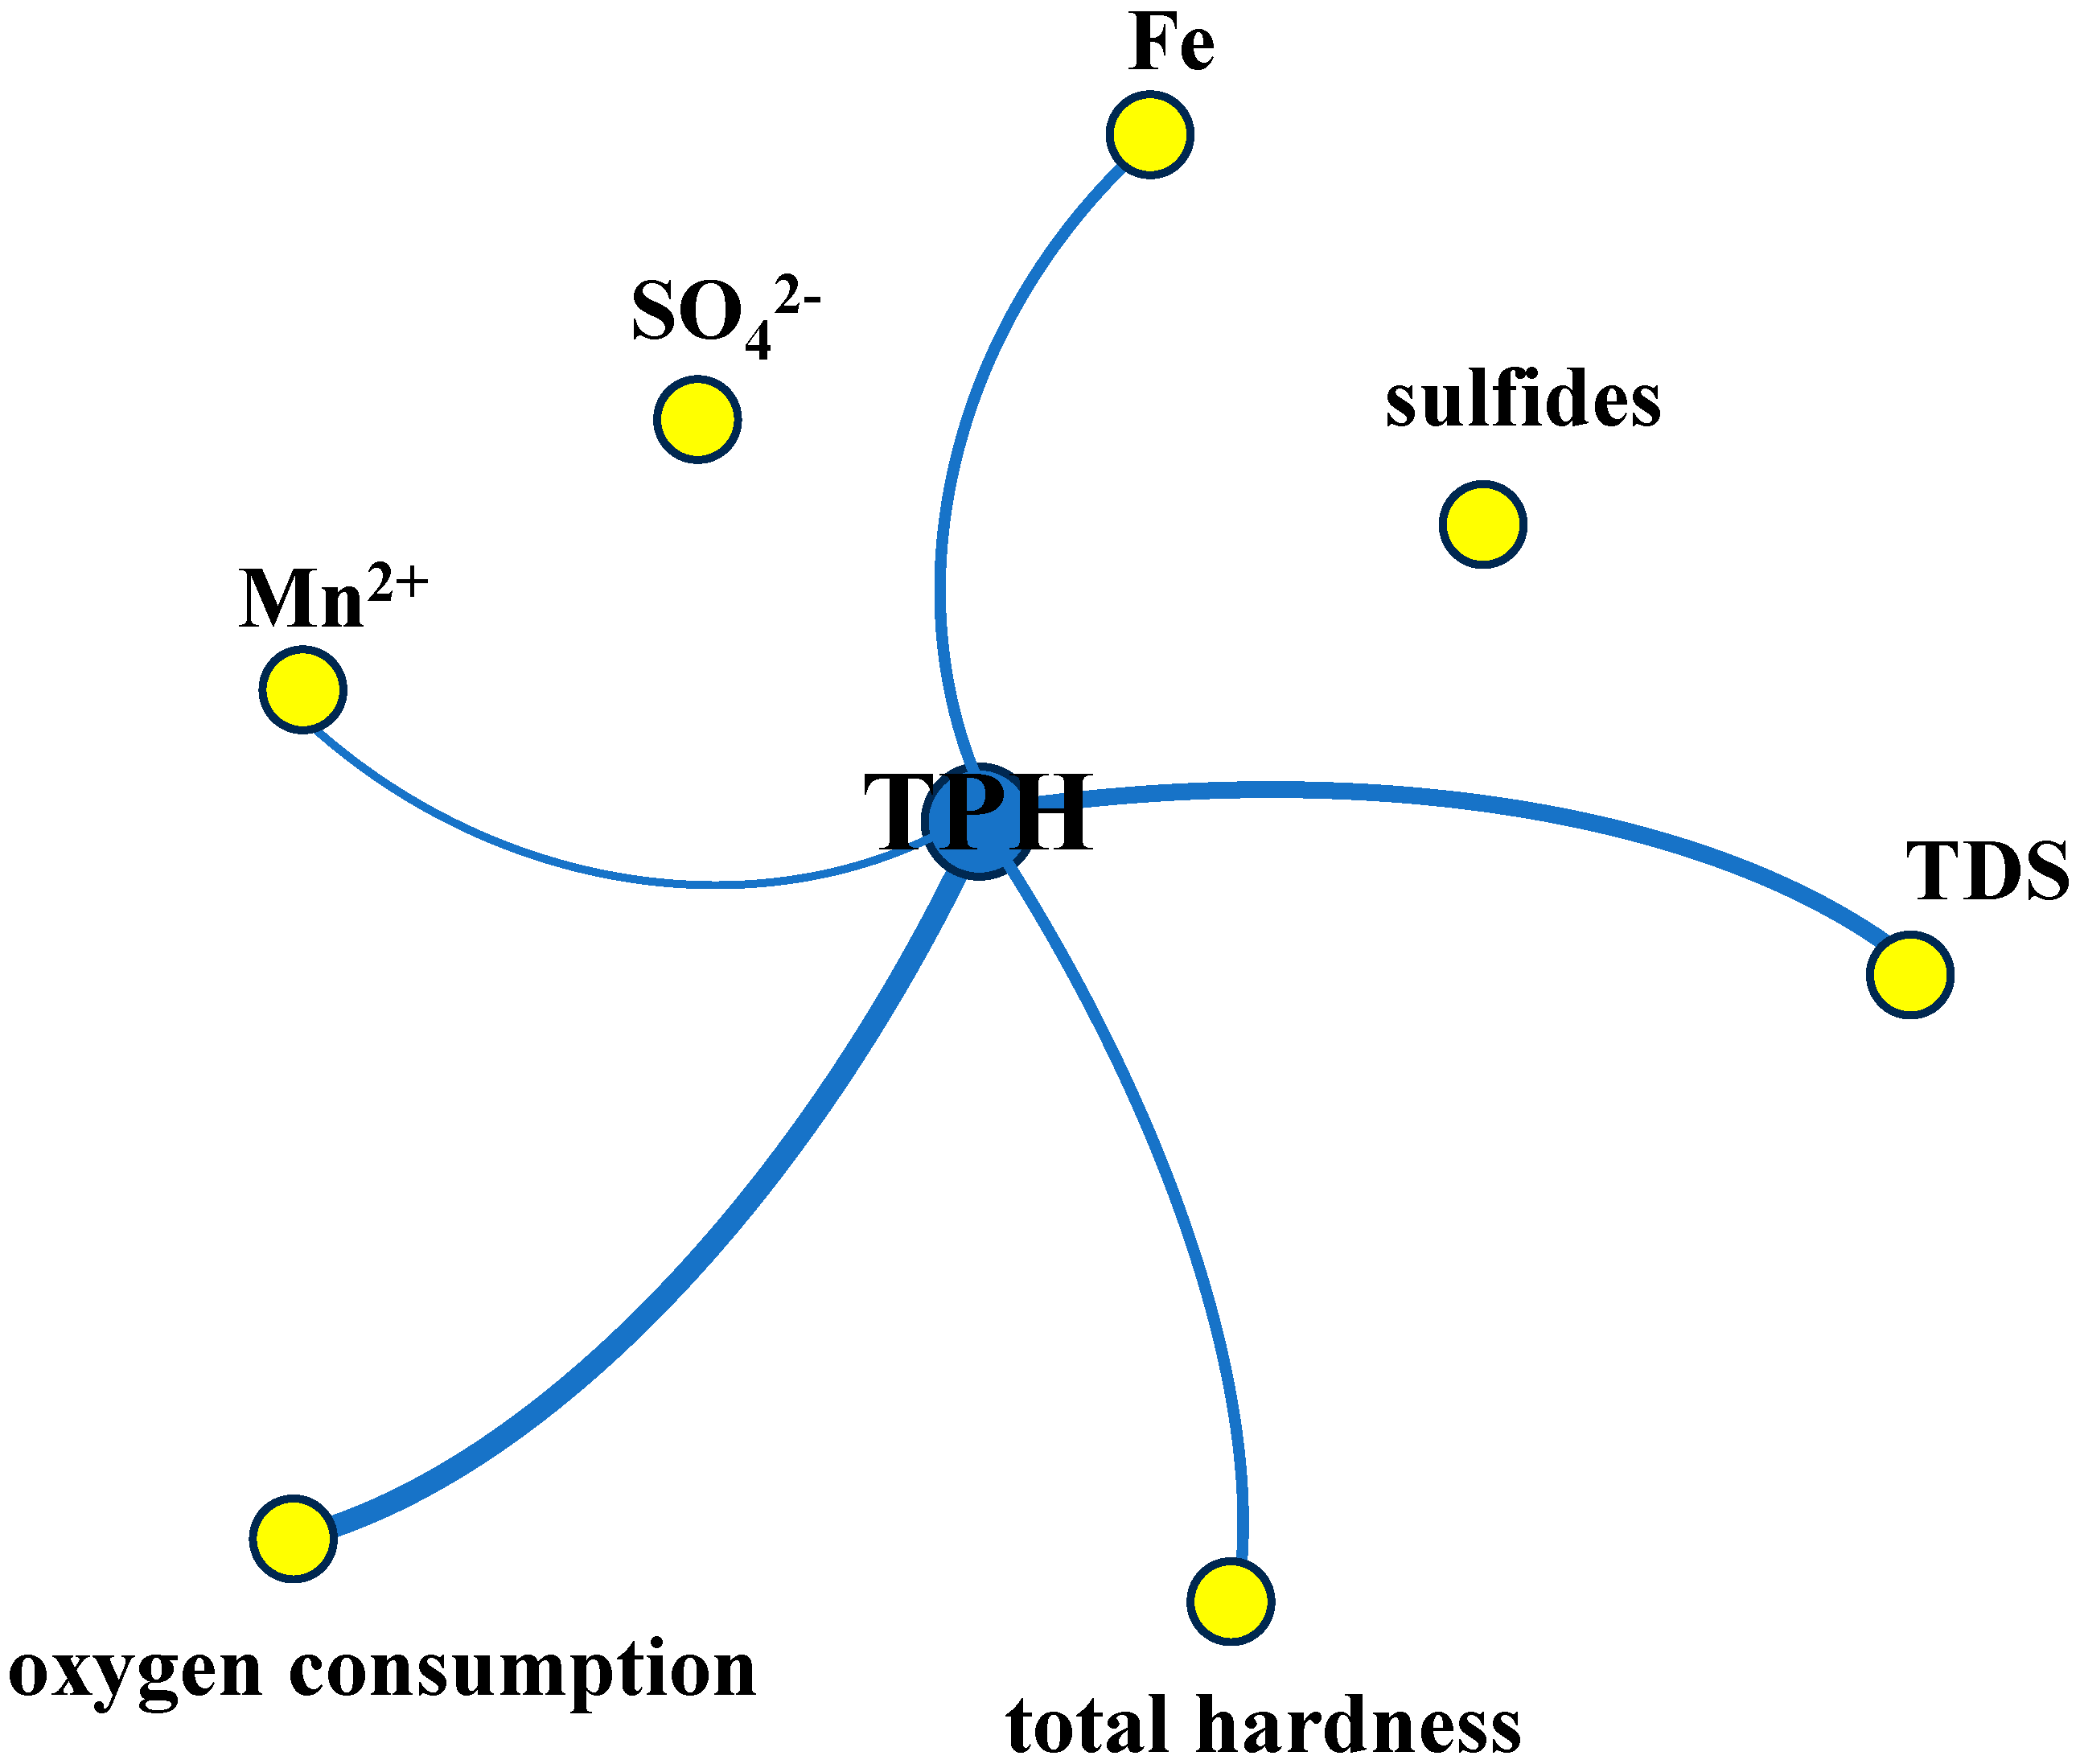
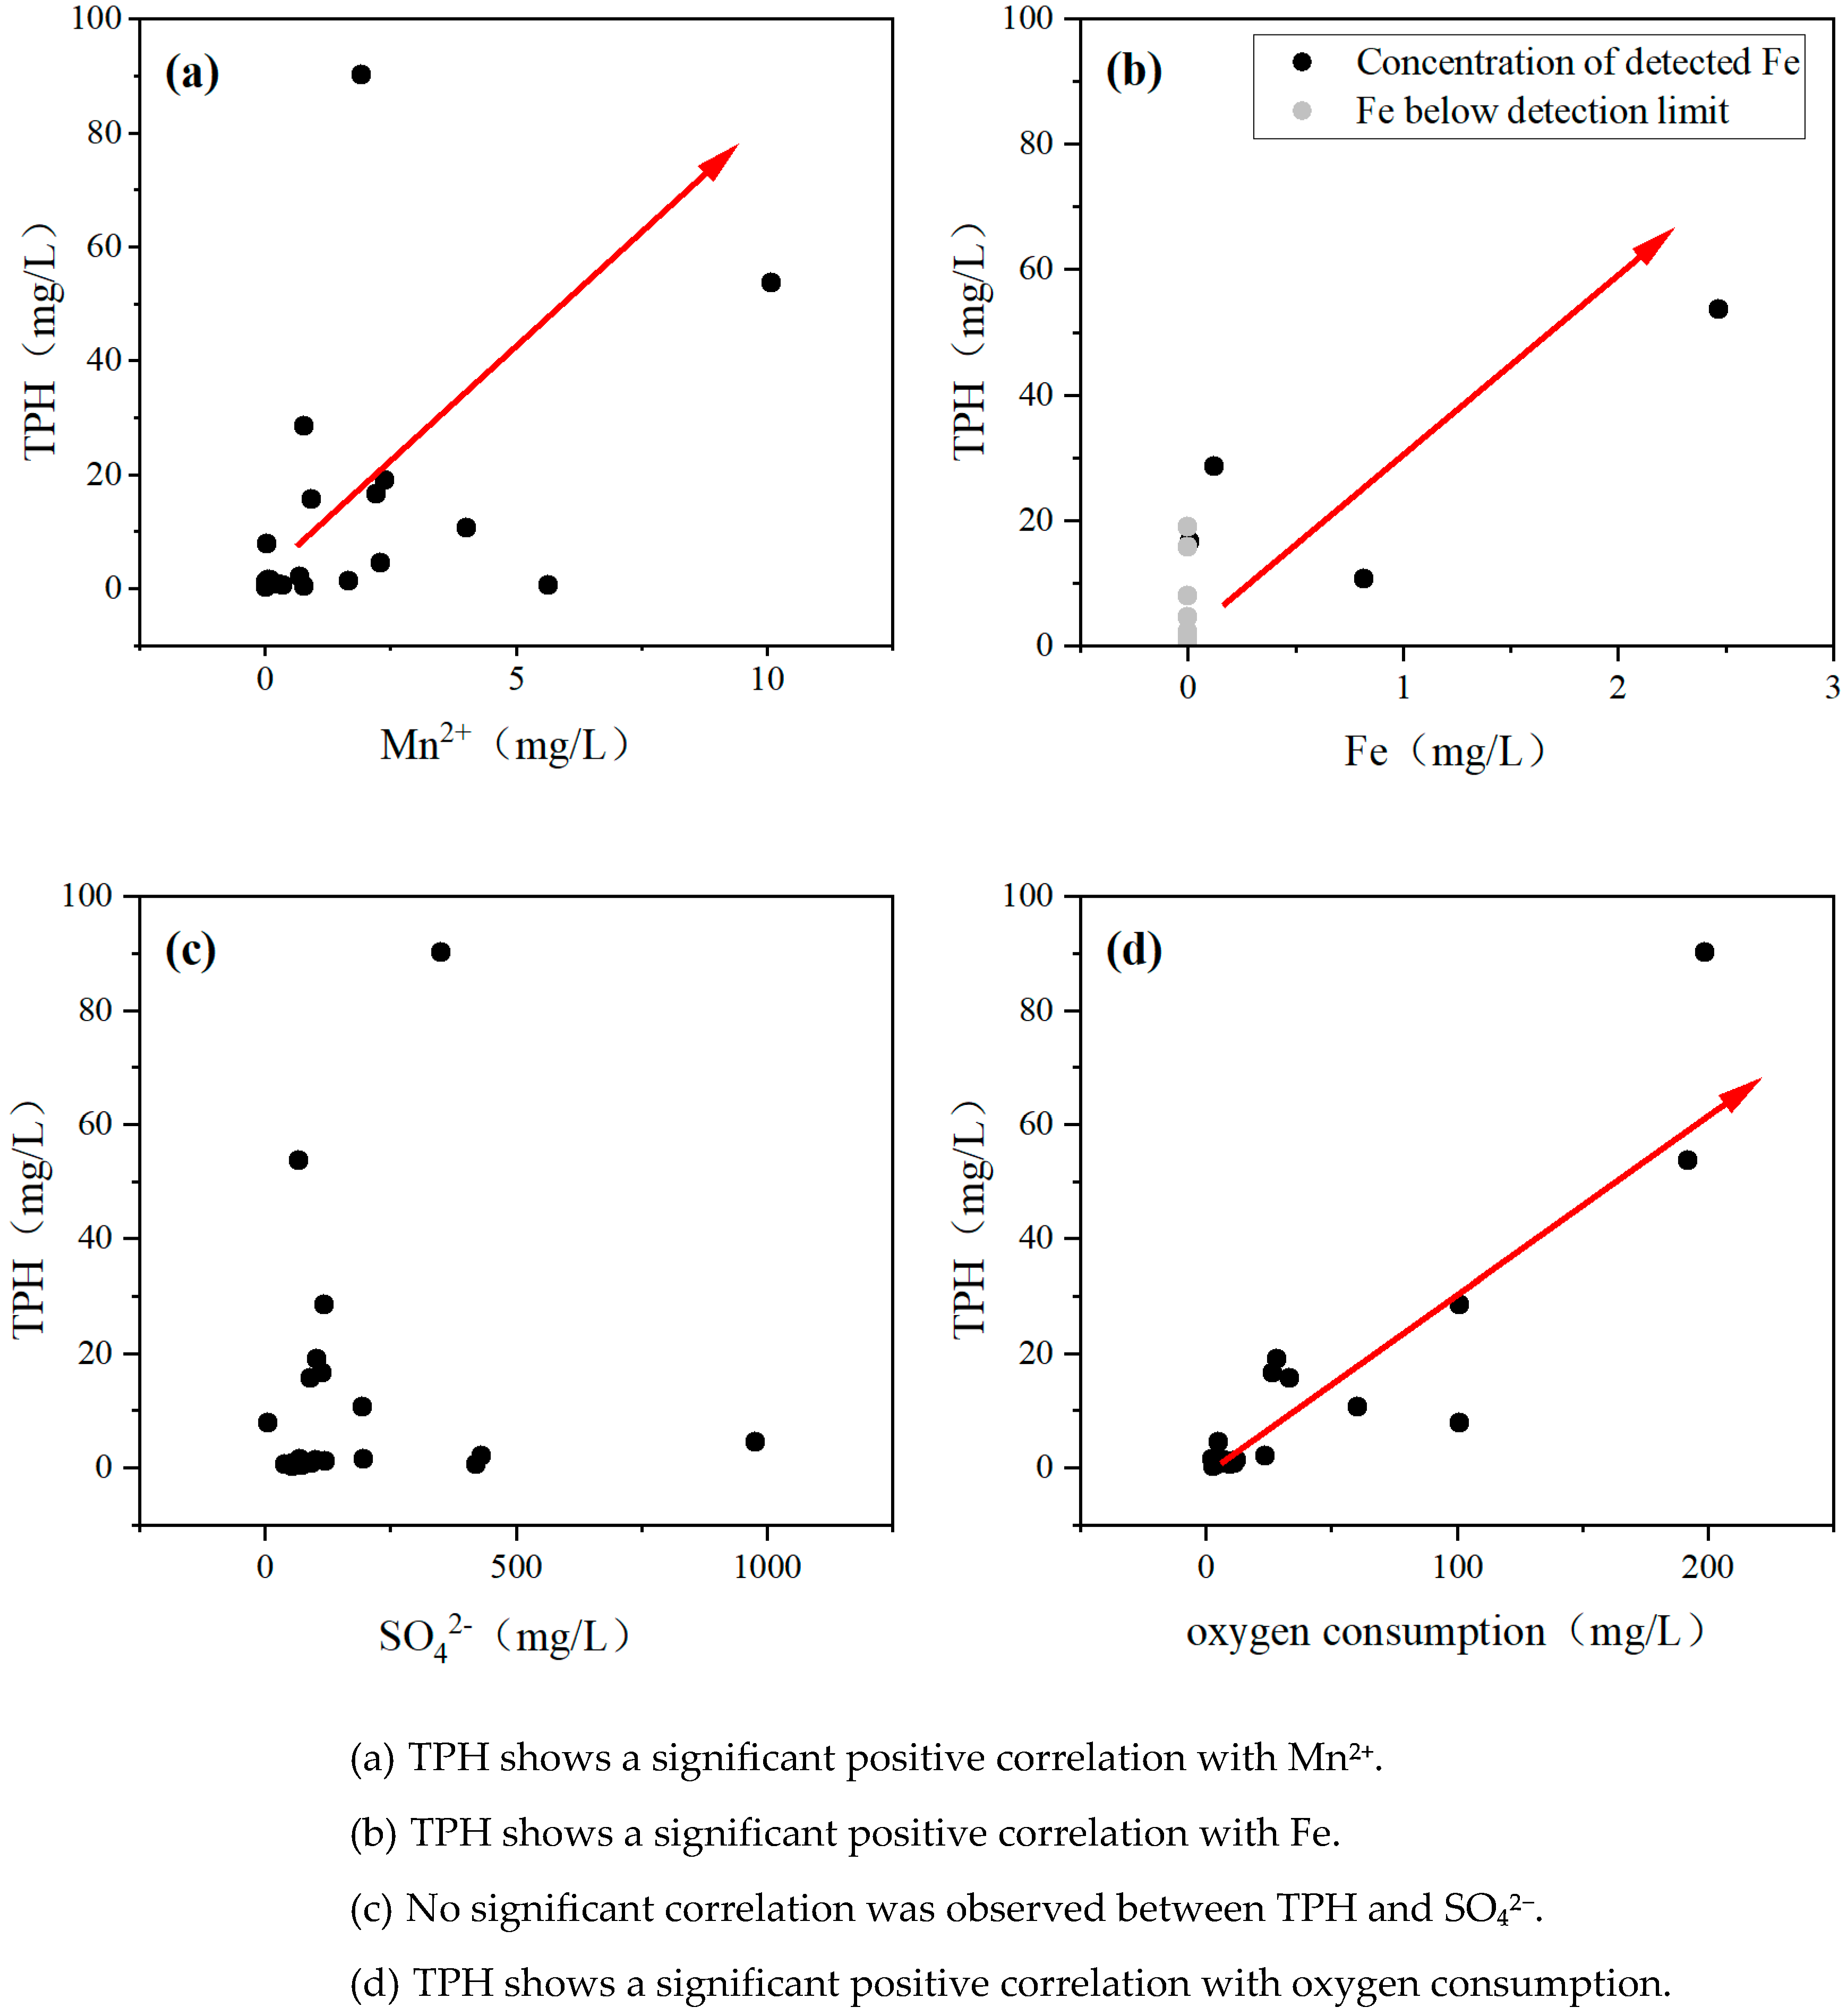
3.4. Influence of Groundwater Chemical Indicators on TPH

As mentioned above, microorganisms in groundwater oxidize and decompose TPH through aerobic respiration, iron and manganese reduction, sulfate reduction, and methanogenesis to obtain the energy needed for growth (see Table 7) [25]. At the same time, the degradation of TPH by microorganisms also changes the chemical composition of the surrounding groundwater environment, and the changes in groundwater chemical composition, in turn, affect the growth of microorganisms. Therefore, this paper further reveals the biodegradation mechanism of TPH in the study area’s groundwater by studying the correlation between TPH and groundwater chemical indicators.
This paper uses SPSS 27.0 software to conduct a Spearman correlation analysis between TPH and other chemical indicators (TDS, total hardness, Fe, Mn2+, oxygen consumption, sulfides, and SO42−). The analysis results are shown in Table 8. The results show that TPH has a significant positive correlation with TDS, total hardness, Fe, Mn2+, and oxygen consumption, with correlation coefficients of 0.761, 0.696, 0.698, 0.515, and 0.819, respectively. There is no significant correlation between TPH and sulfides or SO42−. The microbial degradation of TPH primarily occurs through aerobic processes, during which a significant amount of oxygen is consumed. Therefore, TPH exhibits the strongest correlation with oxygen consumption. The co-occurrence network diagram of TPH in groundwater within the study area is presented in Figure 3.

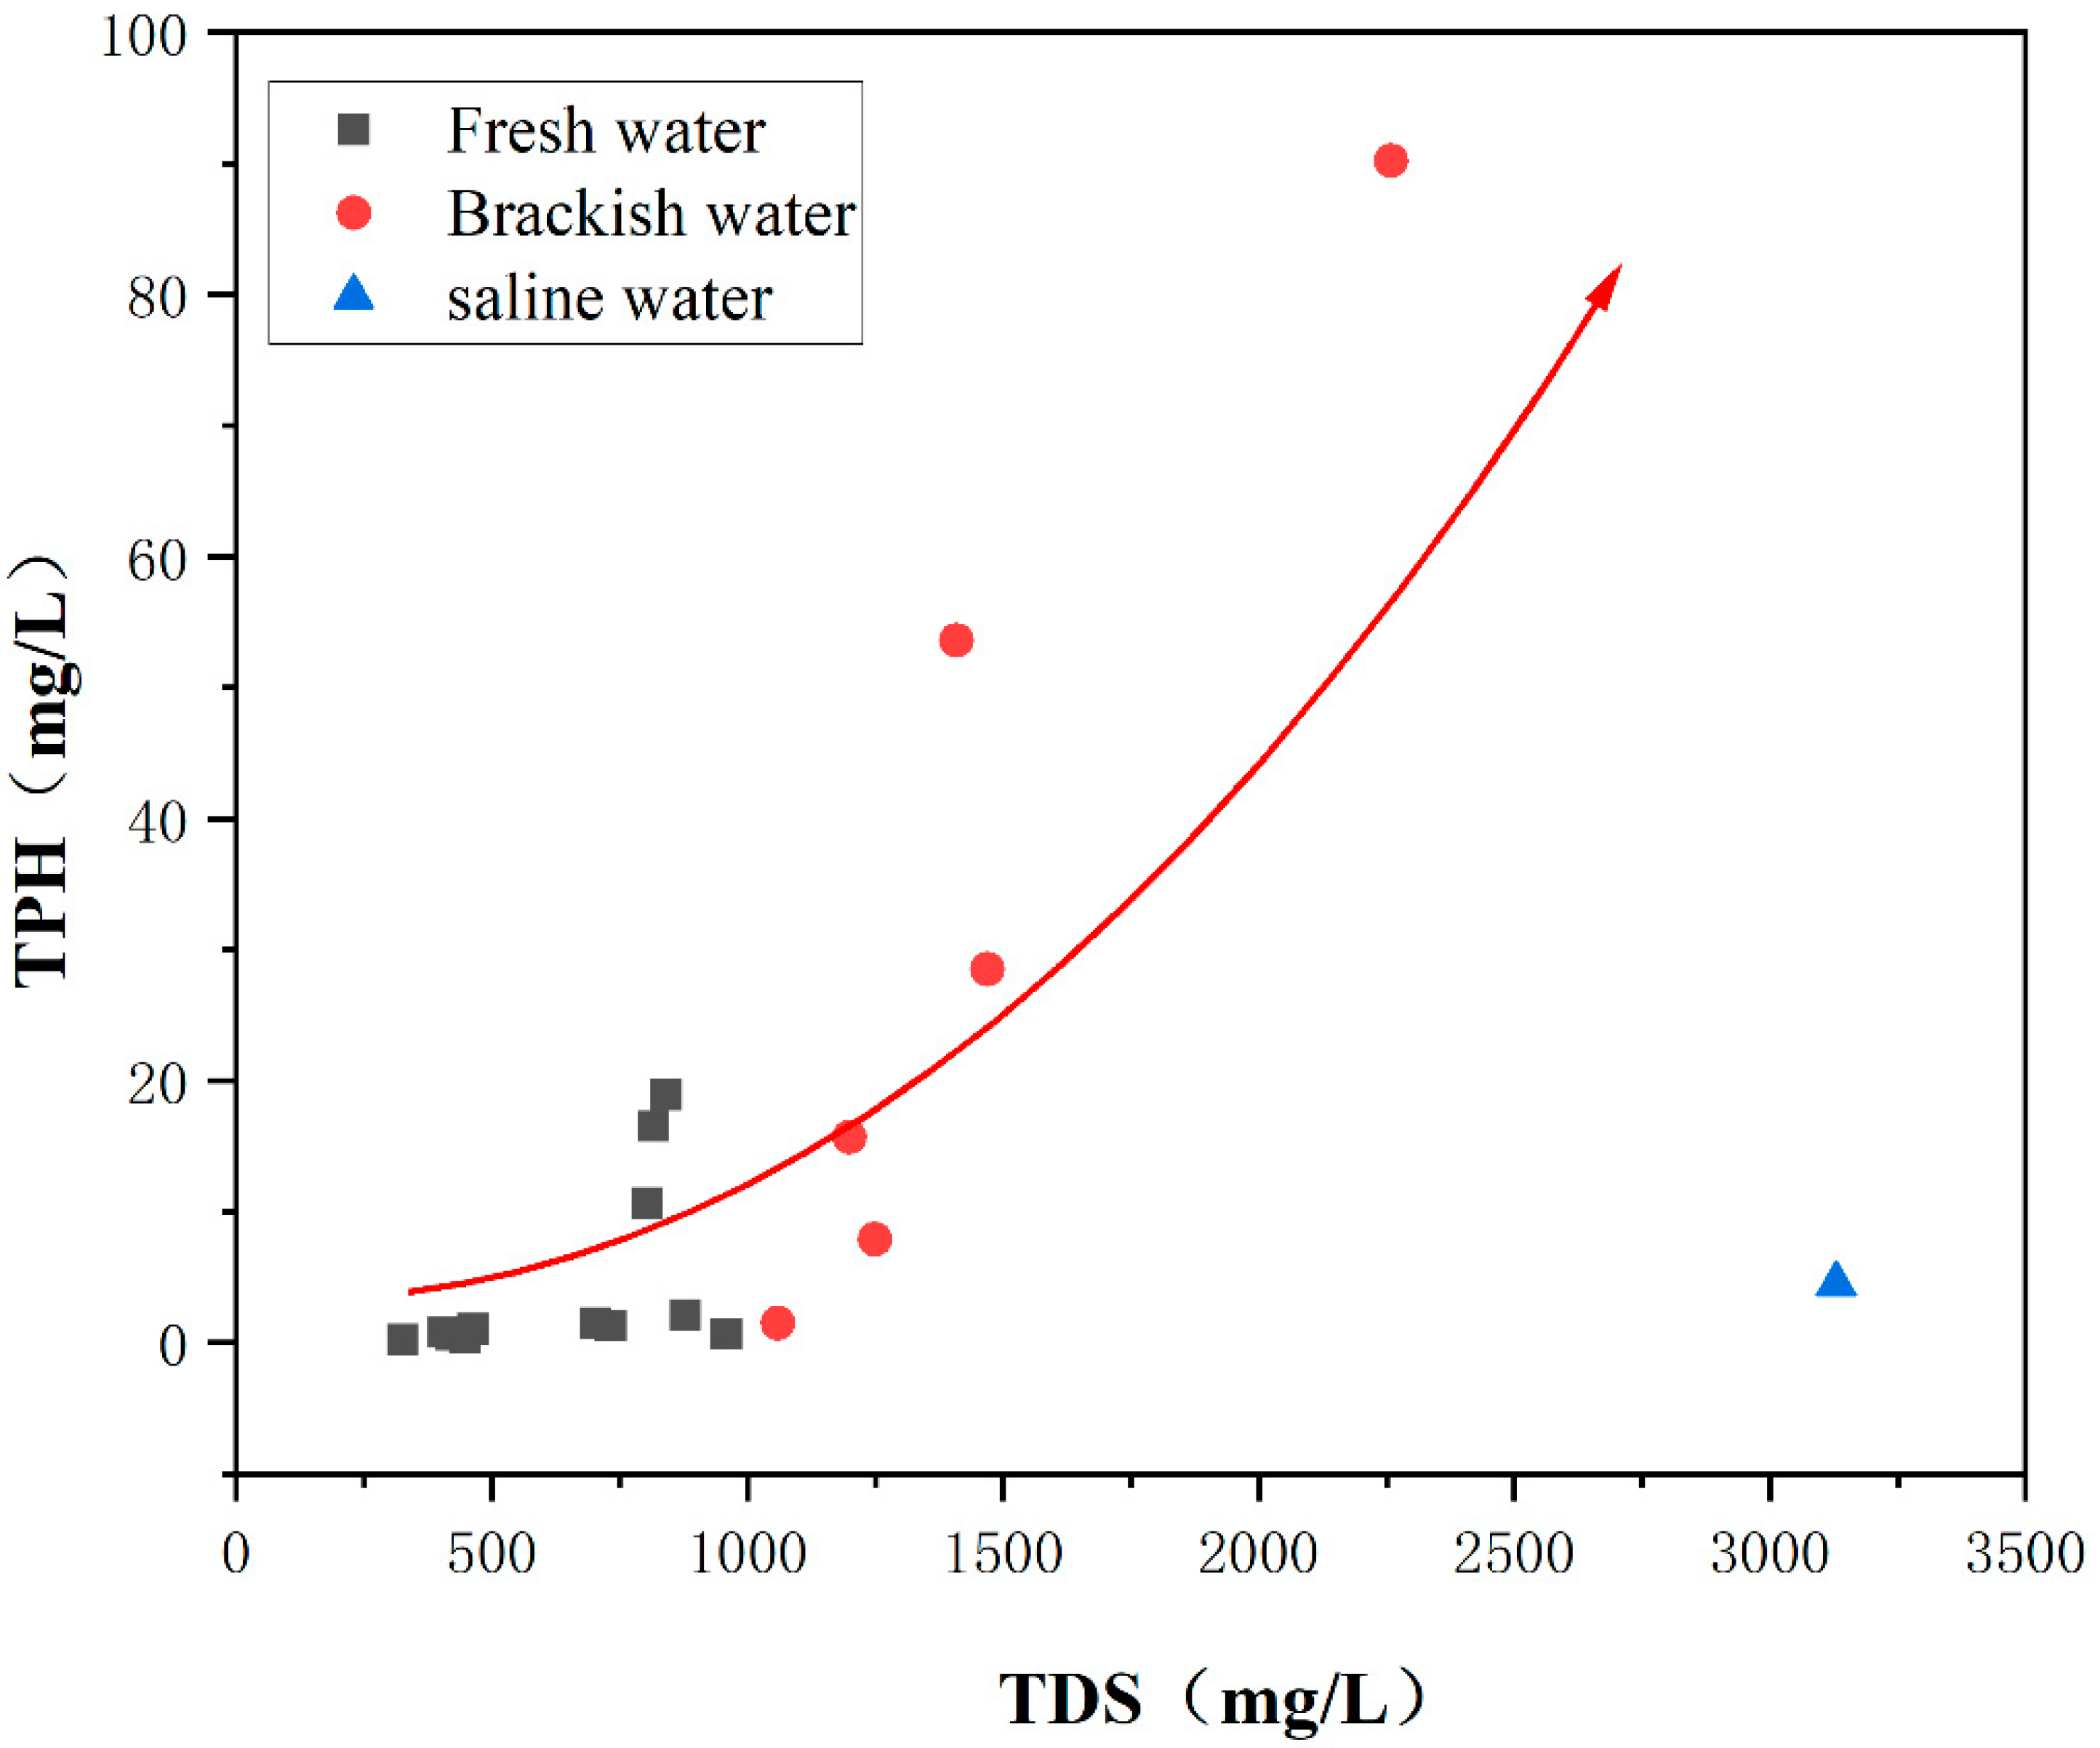
3.5. Influence of Salinity on TPH Degradation

According to the TDS classification standard for groundwater (see Table 9), 65% of the monitoring wells in the study area are located in the freshwater zone, 30% are in the brackish water zone, and 5% are in the saline water zone. This indicates that the majority of the monitoring wells in the study area are located in the freshwater and brackish water zones.
As shown in Table 8, there is a significant positive correlation between TPH and TDS in the study area’s groundwater (r = 0.761). When the TDS concentration increases, the TPH concentration also increases. At the same time, as shown in Figure 4, as the TDS concentration increases, the increase in the TPH concentration gradually accelerates. In the freshwater environment, the increase in the TPH concentration is very slow with the increase in the TDS concentration, but in the brackish water environment, the increase in the TPH concentration gradually accelerates with the increase in the TDS concentration. This indicates that, in the freshwater environment, microbial growth is better, which is conducive to the degradation of TPH, so TPH is maintained at a low concentration range. In the saline water environment, microbial growth is unfavorable, and as the TDS concentration increases, microbial activity gradually decreases, the degradation of TPH gradually weakens, and the TPH concentration gradually increases, showing a positive correlation between the two.

3.6. TPH Biodegradation and Electron Acceptor Contribution Rate

The correlation between TPH and groundwater chemical indicators shows that TPH has a significant positive correlation with TDS, total hardness, Fe, Mn2+, and oxygen consumption, but the correlation with sulfides and SO42− is not significant. As the concentrations of Mn2+, Fe, and oxygen consumption increase, the concentration of TPH gradually increases. This indicates that the biodegradation of TPH in the groundwater of the study area may involve iron–manganese reduction and sulfate reduction. However, according to Figure 5b, Fe in the groundwater of most oil storage enterprises was either undetected or present in very low concentrations. This is likely due to the precipitation of the reduction product Fe2+ during the migration process in the iron reduction biodegradation, which reduces the concentration of Fe2+ in the groundwater. However, in the W1 monitoring well of DT Corporation, the concentrations of TPH, Fe, and Mn2+ were all high, at 53.60 mg/L, 2.47 mg/L, and 10.10 mg/L, respectively, while the concentration of SO42− was relatively low. This suggests that sulfate reduction biodegradation was the primary process in this area, while iron–manganese reduction biodegradation was weaker.
According to thermodynamic principles, microorganisms generally prefer to use Mn and Fe as electron acceptors for TPH degradation, followed by SO42− (Table 7). To further explore the contribution rates of electron acceptors (Mn, Fe, SO42−) in the TPH degradation process by microorganisms, this study, based on Li et al.’s research [24], used a multiple regression analysis to calculate the relative contribution rates of each electron acceptor. According to the relative contribution rate formula in Section 2.5, the relative contribution rates of each electron acceptor were calculated as follows: iron reduction (90.62%) > manganese reduction (9.35%) > sulfate reduction (0.032%). This indicates that the biodegradation of TPH in the groundwater of the study area is mainly dominated by iron–manganese reduction. This may be due to the varying impacts of energy production, organic pollutants, and the supply and availability of electron acceptors on the biodegradation pathways [26].

4. Conclusions

(1)
Using factor analysis, two principal factors (F1, F2) with eigenvalues greater than one were selected. F1 includes Fe, oxygen consumption, TPH, Mn2+, and sulfides, representing that TPH may have undergone biodegradation via iron–manganese reduction, while also indicating that ion adsorption has influenced the chemical composition of the groundwater. F2 includes SO42−, TDS, and total hardness, representing that TPH may have undergone biodegradation via sulfate reduction;
(2)
In the study area, the strongest correlation between TPH and oxygen consumption indicates that the microbial degradation of TPH is predominantly aerobic, a process that consumes substantial amounts of oxygen. There is a significant positive correlation between TPH and TDS in groundwater. In freshwater environments, as TDS concentrations increase, TPH concentrations rise slowly. However, in brackish water environments, the rate of TPH concentration increase gradually accelerates with rising TDS levels. This indicates that biodegradation rates slow down with increasing mineralization. In freshwater environments, microbial growth is more favorable, promoting TPH degradation, whereas in brackish and saline water environments, microbial activity decreases, leading to reduced TPH degradation efficiency;
(3)
Through a multiple regression analysis, the relative contribution rates of electron acceptors (Mn, Fe, SO42−) utilized by microorganisms in the biodegradation of TPH were determined as follows: iron reduction (90.62%) > manganese reduction (9.35%) > sulfate reduction (0.032%). This indicates that the biodegradation of TPH in the study area’s groundwater is primarily driven by iron–manganese reduction;
(4)
It is recommended that petrochemical enterprises monitor the TDS levels in groundwater to prevent excessive mineralization and create a favorable environment for microbial growth;
(5)
Although this study has confirmed that iron–manganese reduction is the predominant pathway for TPH biodegradation in groundwater, the influence of different microbial communities and their underlying mechanisms remain unclear and require further investigation.

Author Contributions

Conceptualization, Q.L., B.X., W.J., Z.H. and R.H.; Methodology, B.X., L.K. and X.Z. (Xiaopeng Zhao); Validation, Q.L. and A.Y.; Formal analysis, X.Z. (Xiaoyu Zhang); Investigation, W.J., Y.X., X.Z. (Xiaoyu Zhang) and Y.L.; Resources, X.Z. (Xiaoyu Zhang), C.Z., Y.L. and R.H.; Data curation, Y.X. and Y.F.; Visualization, X.Z. (Xiaopeng Zhao); Supervision, Y.F. and Z.H.; Project administration, L.K., C.Z. and T.L.; Funding acquisition, A.Y. and T.L. All authors have read and agreed to the published version of the manuscript.

Funding

This research received no external funding.

Data Availability Statement

The original contributions presented in this study are included in the article. Further inquiries can be directed to the corresponding author.

Conflicts of Interest

The authors declare no conflict of interest.

References

  1. Kang, L.; Sun, C.J.; Yang, Q.; Chen, X.; Zhao, Z.; Chen, M. Characteristics of Pollutants from Underground Storage Tank Leakage. Environ. Sci. Manag. 2014, 39, 53–57. [Google Scholar]
  2. Wu, Q.; Zhang, X.; Zhang, Q. Current situation and control measures of groundwater pollution in gas station. IOP Conf. Ser. Earth Environ. Sci. 2017, 94, 012005. [Google Scholar] [CrossRef]
  3. Bai, X.; Song, K.; Liu, J.; Mohamed, A.K.; Mou, C.; Liu, D. Health Risk Assessment of Groundwater Contaminated by Oil Pollutants Based on Numerical Modeling. Int. J. Environ. Res. Public Health 2019, 16, 3245. [Google Scholar] [CrossRef]
  4. Zuo, H.; Jin, W.; Gao, J. Investigation on Corrosion Status and Anti-Corrosion Strategies for Storage Tanks in Karamay Petrochemical Company. J. Xinjiang Pet. Inst. 2002, 14, 70–73. [Google Scholar]
  5. Li, C.; Wu, Q. Research Advances in Organic Contamination of Groundwate. Geotech. Investig. Surv. 2007, 7, 27–30. [Google Scholar]
  6. Jiao, X.; Su, X.; Lü, X. Geochemical indicators of intrinsic biodegradation in a petroleum hydrocarbon-contaminated aquifer. Chin. J. Geol. 2012, 47, 499–506. [Google Scholar]
  7. Borden, R.C.; Gomez, C.A.; Becker, M.T. Geochemical indicators of intrinsic bioremediation. Ground Water 1995, 33, 180–189. [Google Scholar] [CrossRef]
  8. Lu, Y. Mechanisms of Biodegradation for Petroleum Hydrocarbons in Shallow Groundwater Systems. Ph.D Thesis, Jilin University, Changchun, China, 2013. [Google Scholar]
  9. Schreiber, M.; Carey, G.; Feinstein, D.; Bahr, J. Mechanisms of electron acceptor utilization: Implications for simulating anaerobic biodegradation. J. Contam. Hydrol. 2004, 73, 99–127. [Google Scholar] [CrossRef] [PubMed]
  10. Heron, G.; Crouzet, C.; Bourg, A.C.M.; Christensen, T.H. Speciation of Fe(II) and Fe(III) in Contaminated Aquifer Sediments Using Chemical Extraction Techniques. Environ. Sci. Technol. 1994, 28, 1698–1705. [Google Scholar] [CrossRef]
  11. Zhao, Q.; Su, X.; Zuo, E.; Wu, X.; Ma, F. TPH pollution characteristics in vadose zone and water-bearing medium at a petroleum contaminated site. Sci. Technol. Rev. 2015, 33, 25–29. [Google Scholar]
  12. Su, X.; Lü, H.; Zhang, W.; Zhang, Y.; Jiao, X. 13C and 34S Isotope Evidence for Biodegradation of a Petroleum Hydrocarbon-Contaminated Aquifer in the Northeast of China. J. Jilin Univ. (Earth Sci. Ed.) 2011, 41, 847–854. [Google Scholar] [CrossRef]
  13. Kukharova, T.; Maltsev, P.; Novozhilov, I. Development of a Control System for Pressure Distribution During Gas Production in a Structurally Complex Field. Appl. Syst. Innov. 2025, 8, 51. [Google Scholar] [CrossRef]
  14. Dang, J. Variation Characteristics of Water Environmental Elements and Enhanced bioremediation of Slightly Petroleum Contaminated Groundwater. Master’s Thesis, Jilin University, Changchun, China, 2015. [Google Scholar]
  15. Báez-Cazull, S.E.; McGuire, J.T.; Cozzarelli, I.M.; Voytek, M.A. Determination of dominant biogeochemical processes in a contaminated aquifer-wetland system using multivariate statistical analysis. J. Environ. Qual. 2008, 37, 30–46. [Google Scholar] [CrossRef] [PubMed]
  16. Lee, J.-Y.; Cheon, J.-Y.; Lee, K.-K.; Lee, S.-Y.; Lee, M.-H. Factors affecting the distribution of hydrocarbon contaminants and hydrogeochemical parameters in a shallow sand aquifer. J. Contam. Hydrol. 2001, 50, 139–158. [Google Scholar] [CrossRef]
  17. Lü, H.; Liu, M.; Su, X.; Lin, G. Determination of biogeochemical processes in oil-contaminatedaquifer using principal component analysis. J. Cent. South Univ. (Sci. Technol.) 2013, 44, 3552–3560. [Google Scholar]
  18. Farnham, I.M.; Johannesson, K.H.; Singh, A.K.; Hodge, V.F.; Stetzenbach, K.J. Factor analytical approaches for evaluating groundwater trace element chemistry data. Anal. Chim. Acta 2003, 490, 123–138. [Google Scholar] [CrossRef]
  19. Wu, C.; Su, X.; Guo, J.; Dong, W. Multivariate statistical analysis of hydrogeochemical evolution of groundwater in Cretaceous aquifer Ordos desert plateau. Glob. Geol. 2011, 30, 244–253. [Google Scholar]
  20. Liu, C.W.; Lin, K.H.; Kuo, Y.M. Application of factor analysis in the assessment of groundwater quality in a blackfoot disease area in Taiwan. Sci. Total Environ. 2003, 313, 77–89. [Google Scholar] [CrossRef]
  21. Yuan, J.; Deng, G.; Xu, F.; Tang, Y.; Li, P. The multivariate statistical analysis of chemical characteristics and influencing factors of karst groundwater in the northern part of Bijie City, Guizhou Province. Geol. China 2016, 43, 1446–1456. [Google Scholar]
  22. Cui, J.Q.; Li, X.Y.; Shi, H.B.; Sun, Y.N.; An, H.J.; Xing, J.P. Chemical Evolution and Formation Mechanism of Groundwater in Hetao Irrigation Area. Environ. Sci. 2020, 41, 4011–4020. [Google Scholar] [CrossRef]
  23. Gao, Y. Spatio-Temporal Evolution of Hydrochemical Components and Human Health Risk Assessment of Groundwater in Guanzhong Plain. Ph.D. Thesis, Chang’an University, Xi’an, China, 2020. [Google Scholar]
  24. Li, Z.; Chen, Y.; Yang, J.; Wang, Y. Potential evapotranspiration and its attribution over the past 50 years in the arid region of Northwest China. Hydrol. Process. 2014, 28, 1025–1031. [Google Scholar] [CrossRef]
  25. Xuena, L.; Haiming, L.; Mengdi, L.; Weihua, Z.; Han, X. Pollution characteristics and biodegradation mechanism of petroleum hydrocarbons in gas station groundwater in the Tianjin Plain. Earth Sci. Front. 2022, 29, 227–238. [Google Scholar] [CrossRef]
  26. Dong, J. Study of Landfill Leachate Redox Zones and Degradation Mechanisms of Pollutants in the Subsurface Environment. Ph.D. Thesis, Jilin University, Changchun, China, 2006. [Google Scholar]
Figure 1. Monitoring well layout map of Liuhe District, Nanjing.
Water 17 01803 g001
Figure 2. Spatial distribution of TPH in the study area.
Water 17 01803 g002
Figure 3. Co-occurrence network diagram of TPH in the groundwater of the study area.
Water 17 01803 g003
Figure 4. The relationship diagram between TPH and TDS in the groundwater of the study area.
Water 17 01803 g004
Figure 5. The relationship diagram between TPH and Mn, Fe, SO42−, and oxygen consumption in the groundwater of the study area.
Water 17 01803 g005
Table 1. Basic information statistics of small oil storage enterprises.
No.AbbreviationBasic InformationNumber of Monitoring Wells
1TD Corporation① Business scope: Chemical products, fuel oil sales;
② Tank conditions: 8 vertical tanks (empty), 5 horizontal tanks (2# horizontal tank stores about 45 cubic meters of diesel, the rest are empty);
③ Total site area: 5794 m2;
④ Material situation: Stored 45 cubic meters of diesel (now transported to storage units, tanks on site are empty).
2
2TH Corporation① Business scope: Chemical product sales;
② Tank conditions: 7 vertical tanks (empty), 6 horizontal tanks (3# vertical tank stores 6 tons of ethylene tar, the rest are empty);
③ Total site area: 2882.52 m2;
④ Material situation: Stored ethylene tar and carbon nine (currently all tanks are empty).
2
3SP Corporation① Business scope: Wholesale of hazardous chemicals;
② Tank conditions: 2 vertical tanks (1# tank stores about 6 tons of carbon nine, 2# tank stores about 7 tons of carbon nine), 11 horizontal tanks (2# stores about 4 tons of carbon nine, 3# stores about 5 tons of ethylene tar, 6# stores about 2 tons of ethylene tar, the rest are empty);
③ Total site area: 2134.4 m2.
1
4ZY Corporation① Business scope: Chemical products, fuel oil sales;
② Tank conditions: 2 vertical tanks (1# stores about 30 tons of mixed oil, 2# stores about 30 tons of mixed oil), 7 horizontal tanks (2# stores about 50 tons of mixed oil, 4# stores about 40 tons of mixed oil, 8# stores about 60 tons of mixed oil, 7# stores about 30 tons of mixed oil, 9# stores about 60 tons of mixed oil), 1 ground pool;
③ Total site area: 2668 m2.
2
5DT Corporation① Business scope: Petroleum products and chemical product sales;
② Tank conditions: 13 horizontal tanks (3# tank stores about 5 tons of ethylene tar, 5# tank stores about 20 tons of ethylene tar, 6# tank stores about 30 tons of ethylene tar, 7# tank stores about 2 tons of carbon nine, the rest are empty);
③ Total site area: 2668 m2.
3
6HY Corporation① Business scope: Chemical product sales (excluding hazardous chemicals);
② Tank conditions: 19 horizontal tanks (empty);
③ Total site area: 5336 m2.
5
7PW Corporation① Business scope: Petroleum products and chemical product sales;
② Tank conditions: Used for storage and transportation of petroleum products (carbon nine, fuel oil, mixed aromatics, ethylene tar); 3 vertical tanks and 15 horizontal tanks, as well as office areas;
③ Total site area: 2133 m2.
2
8YP Corporation① Business scope: Petroleum products and chemical product sales;
② Tank conditions: 2 vertical tanks, 9 horizontal tanks, and 3 ground tanks (buried ground pools). The results show that the site previously had 2 vertical tanks, each with a volume of 200 cubic meters. 9 horizontal tanks, including 5 with a volume of 65 cubic meters, 3 with a volume of 35 cubic meters, and 1 with a volume of 30 cubic meters. The vertical and horizontal tanks stored carbon nine and ethylene tar. The 3 ground tanks each had a volume of 170 cubic meters, storing ethylene tar. 2000 tons/year of carbon nine, 3000 tons/year of ethylene tar;
③ Total site area: 1267 m2.
2
9ZL Corporation① Business scope: Petroleum products and chemical product sales;
② Tank conditions: Storage and transportation of petroleum products (carbon nine, carbon ten, ethylene tar, fuel oil). The site has 6 vertical tanks, including 4 with a volume of 400 cubic meters and 2 with a volume of 1000 cubic meters; 6 horizontal tanks, including 4 with a volume of 90 cubic meters and 2 with a volume of 30 cubic meters;
③ Total site area: 3246 m2.
2
Table 2. Groundwater sample-testing indicators.
No.Indicator CategorySpecific Indicators
1Conventional IndicatorspH, color, turbidity, odor and taste, visible matter, total hardness (as CaCO3), total dissolved solids, anionic surfactants, sulfate (SO42−), chloride (Cl), sulfide, volatile phenols, permanganate index, ammonia nitrogen, arsenic, cadmium, copper, lead, mercury, nickel, zinc, iron, manganese, sodium, aluminum, hexavalent chromium
2Volatile Organic Compounds (VOCs)Chloromethane, vinyl chloride, 1,1-dichloroethylene, dichloromethane, trans-1,2-dichloroethylene, 1,1-dichloroethane, chloroprene, cis-1,2-dichloroethylene, 2,2-dichloropropane, bromochloromethane, chloroform, 1,1,1-trichloroethane, 1,1-dichloropropene, carbon tetrachloride, benzene, 1,2-dichloroethane, trichloroethylene, 1,2-dichloropropane, dibromomethane, bromodichloromethane, epichlorohydrin, cis-1,3-dichloropropene, toluene, trans-1,3-dichloropropene, 1,1,2-trichloroethane, tetrachloroethylene, 1,3-dichloropropane, dibromochloromethane, 1,2-dibromoethane, chlorobenzene, 1,1,1,2-tetrachloroethane, ethylbenzene, m,p-xylene, o-xylene, styrene, bromoform, isopropylbenzene, 1,1,2,2-tetrachloroethane, bromobenzene, 1,2,3-trichloropropane, n-propylbenzene, 2-chlorotoluene, 1,3,5-trimethylbenzene, 4-chlorotoluene, tert-butylbenzene, 1,2,4-trimethylbenzene, sec-butylbenzene, 1,3-dichlorobenzene, 4-isopropyltoluene, 1,4-dichlorobenzene, n-butylbenzene, 1,2-dichlorobenzene, 1,2-dibromo-3-chloropropane, 1,2,4-trichlorobenzene, 1,2,3-trichlorobenzene
3Semi-Volatile Organic Compounds (SVOCs)N-Nitrosodimethylamine, phenol, aniline, bis(2-chloroethyl) ether, 2-chlorophenol, 2-methylphenol, bis(2-chloroisopropyl) ether, 4-methylphenol, N-Nitrosodi-n-propylamine, hexachloroethane, nitrobenzene, isophorone, 2-nitrophenol, 2,4-dimethylphenol, bis(2-chloroethoxy)methane, 2,4-dichlorophenol, naphthalene, 4-chloroaniline, hexachlorobutadiene, 4-chloro-3-methylphenol, 2-methylnaphthalene, hexachlorocyclopentadiene, 2,4,6-trichlorophenol, 2,4,5-trichlorophenol, 2-chloronaphthalene, 2-nitroaniline, dimethyl phthalate, 2,6-dinitrotoluene, acenaphthylene, 3-nitroaniline, acenaphthene, 2,4-dinitrophenol, 4-nitrophenol, dibenzofuran, 2,4-dinitrotoluene, diethyl phthalate, 4-chlorophenyl phenyl ether, fluorene, 4-nitroaniline, 4,6-dinitro-2-methylphenol, azobenzene, 4-bromodiphenyl ether, hexachlorobenzene, pentachlorophenol, phenanthrene, anthracene, carbazole, di-n-butyl phthalate, fluoranthene, pyrene, butyl benzyl phthalate, benzo(a)anthracene, chrysene, di(2-ethylhexyl) phthalate, di-n-octyl phthalate, benzo(b)fluoranthene, benzo(k)fluoranthene, benzo(a)pyrene, indeno(1,2,3-cd)pyrene, dibenzo(a,h)anthracene, benzo(ghi)perylene
4Petroleum HydrocarbonsPetroleum hydrocarbons (C6–C9), petroleum hydrocarbons (C10–C40)
Table 3. Testing methods for groundwater samples.
No.Testing IndicatorTesting MethodDetection LimitUnit
1pHWater Quality—Determination of pH—Electrode Method (HJ 1147-2020)/Dimensionless
2ColorWater Quality—Determination of Color (GB 11903-1989)/Degree
3TurbidityStandard Examination Methods for Drinking Water—Sensory and Physical Indicators—Visual Turbidity Method (GB/T 5750.4-2006, 2.2)1NTU
4Odor and TasteStandard Examination Methods for Drinking Water—Sensory and Physical Indicators—Odor and Taste Test (GB/T 5750.4-2006, 3.1)//
5Visible ParticlesStandard Examination Methods for Drinking Water—Sensory and Physical Indicators—Direct Observation Method (GB/T 5750.4-2006, 4.1)//
6Total Hardness (as CaCO3)Water Quality—Determination of Calcium and Magnesium—EDTA Titrimetric Method (GB/T 7477-1987)5mg/L
7Total Dissolved Solids (TDS)Standard Examination Methods for Drinking Water—Sensory and Physical Indicators—Gravimetric Method (GB/T 5750.4-2006, 8.1)/mg/L
8Anionic SurfactantsWater Quality—Determination of Anionic Surfactants—Methylene Blue Spectrophotometric Method (GB/T 7494-1987)0.05mg/L
9Sulfate (SO42−)Water Quality—Determination of Inorganic Anions (F Cl, NO2, Br, NO3, PO43−, SO32−, SO42−)—Ion Chromatography (HJ 84-2016)0.018mg/L
10Chloride (Cl)Water Quality—Determination of Inorganic Anions (F Cl, NO2, Br, NO3, PO43−, SO32−, SO42−)—Ion Chromatography (HJ 84-2016)0.007mg/L
11SulfideWater Quality—Determination of Sulfide—Methylene Blue Spectrophotometric Method (GB/T 16489-1996)0.005mg/L
12Volatile PhenolsWater Quality—Determination of Volatile Phenols—4-Aminoantipyrine Spectrophotometric Method (HJ 503-2009)0.003mg/L
13Permanganate IndexWater Quality—Determination of Permanganate Index—Acidic Permanganate Method (GB/T 11892-1989)0.5mg/L
14Ammonia NitrogenWater Quality—Determination of Ammonia Nitrogen—Nessler’s Reagent Spectrophotometry (HJ 535-2009)0.025mg/L
15Arsenic (As)Water Quality—Determination of 65 Elements—Inductively Coupled Plasma Mass Spectrometry (HJ 700-2014)0.12μg/L
16Cadmium (Cd)Water Quality—Determination of 65 Elements—Inductively Coupled Plasma Mass Spectrometry (HJ 700-2014)0.05μg/L
17Copper (Cu)Water Quality—Determination of 65 Elements—Inductively Coupled Plasma Mass Spectrometry (HJ 700-2014)0.08μg/L
18Lead (Pb)Water Quality—Determination of 65 Elements—Inductively Coupled Plasma Mass Spectrometry (HJ 700-2014)0.09μg/L
19Mercury (Hg)Water Quality—Determination of Mercury, Arsenic, Selenium, Bismuth, and Antimony—Atomic Fluorescence Spectrometry (HJ 694-2014)0.04μg/L
20Nickel (Ni)Water Quality—Determination of 65 Elements—Inductively Coupled Plasma Mass Spectrometry (HJ 700-2014)0.06μg/L
21Zinc (Zn)Water Quality—Determination of 65 Elements—Inductively Coupled Plasma Mass Spectrometry (HJ 700-2014)0.67μg/L
22Iron (Fe)Water Quality—Determination of 32 Elements—Inductively Coupled Plasma Optical Emission Spectrometry (HJ 776-2015)0.01mg/L
23Manganese (Mn)Water Quality—Determination of 32 Elements—Inductively Coupled Plasma Optical Emission Spectrometry (HJ 776-2015)0.01mg/L
24Sodium (Na)Water Quality—Determination of 65 Elements—Inductively Coupled Plasma Mass Spectrometry (HJ 700-2014)0.12mg/L
25Aluminum (Al)Water Quality—Determination of 32 Elements—Inductively Coupled Plasma Optical Emission Spectrometry (HJ 776-2015)1.15μg/L
26Hexavalent Chromium (Cr6+)Water Quality—Determination of Hexavalent Chromium—Diphenylcarbazide Spectrophotometric Method (GB/T 7467-1987)0.004mg/L
27Petroleum Hydrocarbons (C6–C9)Water Quality—Determination of Petroleum—Ultraviolet Spectrophotometry (Trial) (HJ 970-2018)0.01mg/L
28Petroleum Hydrocarbons (C10–C40)Water Quality—Determination of Extractable Petroleum Hydrocarbons (C10–C40)—Gas Chromatography (HJ 894-2017)0.01mg/L
29Volatile Organic Compounds (VOCs)
(1)
Standard Examination Methods for Drinking Water—Organic Indicators—Purge and Trap/Gas Chromatography-Mass Spectrometry (GB/T 5750.8-2006)
0.13μg/L
(2)
Water Quality—Determination of Volatile Organic Compounds—Purge and Trap/Gas Chromatography-Mass Spectrometry (HJ 639-2012)
30Semi-Volatile Organic Compounds (SVOCs)Water Quality—Determination of Semi-Volatile Organic Compounds—Liquid–Liquid Extraction/Gas Chromatography–Mass Spectrometry (HX-D067-2018, referencing US EPA 3510C-1996, 8270E-2018)1μg/L
Table 4. Statistical data of groundwater chemical indicators in oil storage enterprises in the study area.
No.IndicatorSample SizeDetection RateMinimum Value (mg/L)Maximum Value (mg/L)Mean Value (mg/L)Standard Deviation (mg/L)Coefficient of Variation
1TPH20100%0.2690.2412.8722.48174.72%
2pH20100%6.397.637.010.314.44%
3sulfides2075%ND0.170.030.04153.77%
4SO42−20100%5.04977183.46222.92121.51%
5Cl20100%11.820851.8749.0694.58%
6TDS20100%32531301000.45686.4768.62%
7total hardness20100%1491350588.26269.245.76%
8Fe2025%ND2.470.250.64260.92%
9Mn2+20100%0.0110.11.712.47144.4%
10Cu2+2075%ND0.00280.0010.0008582.26%
11Na+20100%18.9387.146.4920.0743.17%
12oxygen consumption20100%2.3319941.960.34143.99%
Note: ND indicates below the detection limit, and no specific concentration value was detected. It is treated as zero in calculations.
Table 5. Correlation coefficients between groundwater indicators in the study area.
TPHTDSTotal HardnessFeMn2+Oxygen ConsumptionSulfidesSO42−
TPH1.000
TDS0.5201.000
total hardness0.2890.8561.000
Fe0.7910.3340.2991.000
Mn2+0.4300.2740.3980.7561.000
oxygen consumption0.9080.4690.3630.8540.5211.000
sulfides0.4610.2660.1750.4510.4410.4131.000
SO42−0.0540.7540.673−0.0130.163−0.0520.0241.000
Table 6. Rotated factor-loading matrix of groundwater indicators.
IndicatorF1F2
Fe0.940
oxygen consumption0.9190.121
TPH0.8780.160
Mn2+0.7100.201
sulfides0.619
SO42−−0.1170.923
TDS0.3370.899
total hardness0.2550.885
eigenvalues4.1112.003
contribution rates44.748%31.670%
cumulative variance contribution rates44.748%76.418%
Table 7. Biodegradation reaction processes of TPH.
Electron AcceptorBiodegradation ReactionFree Energy (kJ·mol−1)Reaction Order
Mn4+CH2O + 3CO2 + 2MnO2 + H2O → 2Mn2+ + 4HCO3−3491
Fe3+CH2O + 7CO2 + 4Fe(OH)3 → 4Fe2+ + 8HCO3 + 3H2O−1142
SO42−2CH2O + SO42− → H2S + 2HCO3−773
Table 8. Correlation between TPH and other chemical indicators.
Other Chemical IndicatorsTDSTotal HardnessFeMn2+Oxygen ConsumptionSulfidesSO42−
TPH0.761 *0.696 *0.698 *0.515 *0.819 *0.3370.277
Note: * indicates significant correlation.
Table 9. Classification standard of TDS in groundwater.
CategoryFresh WaterBrackish WaterSaline WaterSaltwater
TDS concentration<1 g/L1~3 g/L3~10 g/L>10 g/L
Disclaimer/Publisher’s Note: The statements, opinions and data contained in all publications are solely those of the individual author(s) and contributor(s) and not of MDPI and/or the editor(s). MDPI and/or the editor(s) disclaim responsibility for any injury to people or property resulting from any ideas, methods, instructions or products referred to in the content.

