Article

Study of the Applicability of CMADS Data Based on the BTOPMC Model in the South Yunnan Region—An Example from the Jinping River Basin

1
Faculty of Electric Power Engineering, Kunming University of Science and Technology, Kunming 650500, China
2
Huaihua Flood and Drought Disaster Prevention Affairs Center, Huaihua 418000, China
3
Yunnan Provincial Hydrology and Water Resources Bureau Honghe Branch, Honghe 661600, China
4
Ruili City Water Conservancy Bureau, Ruili 678699, China
5
Mile City Water Conservancy Project Construction Service Center, Mile 652300, China
*
Author to whom correspondence should be addressed.
Water 2025, 17(12), 1802; https://doi.org/10.3390/w17121802
Submission received: 13 May 2025 / Revised: 8 June 2025 / Accepted: 11 June 2025 / Published: 16 June 2025
(This article belongs to the Special Issue Remote Sensing of Spatial-Temporal Variation in Surface Water)

Abstract

:
Data-driven distributed hydrological models utilizing atmospheric assimilation are crucial for simulating hydrological processes, particularly in regions lacking historical observational data, and for managing and developing local water resources due to the impacts of climate change and human activities. The southern part of Yunnan is located at the southwestern border of China, and the small number of observation stations poses a major obstacle to local water-resource management and hydrological research. This paper carries out an evaluation of the accuracy of the China Atmospheric-Assimilation Dataset (CMADS) in southern Yunnan and uses CMADS data and measured data to drive the BTOPMC model to investigate hydrological processes in the Jinping River basin, a representative local sub-basin. The study shows that the probability density function statistic (SS) between CMADS data and the measured precipitation data is 0.941, and their probability density curves of precipitation are basically the same. The relative error of daily precipitation is −19%, with 90% of the daily precipitation error concentrated within ±10 mm/day, which increases as daily precipitation increases. This paper examines three precipitation scenarios to drive the hydrological model, resulting in Nash–Sutcliffe efficiency (NSE) coefficients of 66.8%, 81.0%, and 83.9% for calibration, and 54.5%, 70.2%, and 74.5% for validation. These results indicate that CMADS data possesses a certain degree of applicable accuracy in southern Yunnan. Furthermore, the CMADS-driven BTOPMC model is suitable for simulating hydrological processes and conducting water-resource research in the region. The integration of CMADS data with actual measurement data can enhance the accuracy of hydrological simulations. Overall, the CMADS data have good applicability in southern Yunnan, and the CMADS-driven BTOPMC model can be used for hydrological modeling studies and water-resource management applications in southern Yunnan.

1. Introduction

Atmospheric-assimilation data-driven distributed hydrological models for rainfall-runoff simulation have become an important way to address hydrologic and water-resource responses in data-poor areas under the influence of climate change and human activities [1]. Hydrometeorological information is one of the fundamental and core raw materials for hydrological modeling, and its scarcity has been limiting the progress of local hydrological and water-resource research on a global scale, especially in developing countries [2]. Although meteorological information is more readily available than hydrological information, the amount of meteorological data collected by ground-based stations is often insufficient to reflect the regional or basin-scale spatial distribution of precipitation due to complex factors such as the uneven spatial and temporal distribution of precipitation and subsurface conditions [3]. The southwest region of China is characterized by deep valleys and mountains, complex terrain, and a severe lack of ground-based hydrometeorological observation stations because of financial limitations. This leads to a specific lack of meteorological data, which makes local water-resource research and evaluation extremely difficult [4].
At the same time, the global atmospheric and terrestrial water cycles are changing with the impact of global climate change and human activities on subsurface conditions, and the quantity, quality, and spatial and temporal distribution of water resources are also changing [5], making the study of water resources in resource-poor areas even more complex. Atmospheric-assimilation data-driven distributed hydrological modeling is an effective way to solve this problem [6]. It can not only address the problem of insufficient meteorological data but also reflect the heterogeneity of spatial distribution of precipitation more realistically and provide more accurate meteorological data for local areas [7]. The distributed hydrophysical model not only reflects the temporal heterogeneity of meteorological conditions such as rainfall but also describes the differences in topography, soil, and vegetation conditions in the subsurface, thus allowing accurate simulation of the spatial and temporal distribution of catchment production and sink flows, and calculating more accurate runoff processes at different cross-sections, providing more accurate local results on the amount and distribution of water resources. Atmospheric-assimilation data-driven distributed hydrological models can, therefore, be an effective solution to the dilemma of water-resource evaluation studies in local areas, especially in areas where information is scarce.
At present, well-known foreign reanalysis datasets include ERA-5, ERA-15, and ERA-40, developed by the European Center for Medium-Range Weather Forecasts [8,9,10]; the CUR climate dataset developed by the National Center for Atmospheric Science in the UK [11]; and JRA-25 and JAR-25 developed by the Japan Meteorological Agency [12,13]. In China, five atmospheric-assimilation datasets have been developed: CLDAS land-surface assimilation data [14] and HRCLDAS high-resolution land-surface data-assimilation products [15] by the National Meteorological Information Center of the China Meteorological Administration; Western China land-surface data-assimilation products developed by the Institute of Cold and Arid Regions of the Chinese Academy of Sciences; the China Regional Surface Meteorological Element Drive Dataset [16] by the Institute of Qinghai–Tibet Plateau Research of the Chinese Academy of Sciences; and the China atmospheric-assimilation-driven datasets [17].
Scholars at home and abroad have conducted research on the accuracy and applicability of precipitation products. The research methods can be divided into two categories: (1) selecting statistical indicators to construct an evaluation system and comparing them directly with measured data, and (2) using the data to drive hydrological models and evaluating the data based on simulation results [18,19]. Common statistical indicators in the evaluation system include deviation, relative error, and correlation coefficient. For precipitation data, relevant continuous statistical indicators such as accuracy and critical success rate are also used [20,21,22,23,24,25,26,27,28]. Evaluation indicators for hydrological simulation typically include the Nash coefficient (Nash) and the coefficient of determination (R2) [29,30]. Using these evaluation methods, Ao Xue et al. evaluated the accuracy of wind speed data from three datasets, ERA-Interim, JRA-55 and CFSR [31]; Li Jian evaluated summer precipitation data from JRA, ERA, and NCEP/DOE datasets in mainland China [32]; and Alexandra Hamm et al. studied the accuracy of nine precipitation datasets, including ERA, on the Qinghai–Tibet Plateau [33]. From the research results, these precipitation products have been widely praised by scholars at home and abroad. It is believed that atmospheric-assimilation data is an effective meteorological data source and plays an important role in hydrological cycle simulation, water-resource evaluation, and non-point-source pollution research. Although these products have achieved good application in the world, there are some limitations in the hydrological simulation of China’s river basins. Because of its high precision and localization optimization for China, CMADS has made up for the lack of data in some remote areas and has been applied in many river basins in China. The results are satisfactory.
CMADS data are a precipitation product developed by Professor Meng Xianyong’s team at the China Agricultural University. It is produced by integrating LAPS/STMAS technology using methods such as factor recalculation, quality control, circular nesting, resampling, and bilinear interpolation, and covers East Asia from 60 to 160° E and 0 to 65° N [17]. Compared to other atmospheric-assimilation data, CMADS data are characterized by a wide range of data sources, multiple time scales, and high resolution [34]. Currently, CMADS data have been applied in several basins in China. For example, Meng Xianyong used CMADS data to drive the SWAT model to simulate the hydrological processes in the Heihe and Jingbo river basins in Northwest China, and the results showed that the simulation results of CMADS and SWAT model can accurately reflect the hydrological processes and the spatial and temporal distribution characteristics of each surface component in the Heihe and Jingbo river basins, which is more accurate than the traditional meteorological data and CFSR satellite data [17,35]. Zhang Limin used the CMADS data-driven SWAT model to simulate daily and monthly scale runoff processes at four hydrological stations in the Hun River basin, and the simulation results were more accurate, indicating that the CMADS + SWAT model is suitable for hydrological simulation in alpine mountainous areas in China, and can also provide a useful tool for hydrological simulation in areas where meteorological data are scarce [36]. In addition, CMADS data have also been used for accuracy studies and hydrological simulations in the basins of the Huotong River, Manas River, Aojiang River, Chaobai River, Bitter Water River, etc. The results of both studies and applications indicate that CMADS data have high accuracy in the corresponding basins and can be used as a meteorological driver for basin hydrological simulations [37,38,39,40,41].
Moreover, CMADS data are currently being used in more studies in the north and less in the south, especially in the southwest. In the southwest, CMADS data have only been applied in the Jinsha River basin, the Chishui River basin, and the Erhai Sea basin, all with good application results. In the Jinsha River basin application, CMADS data can better reflect the spatial and temporal distribution of precipitation in the basin than TMPA 3B42V7 satellite data and IMERG satellite data and drive the simulation results of the SWAT model with higher accuracy than the other two satellite precipitation data [42]. In the case of the Chishui River, the CMADS data-driven SWAT model better simulates the hydrological cycle of the Chishui River, and the CMADS + SWAT model provides a new tool for the study of surface source pollution in the river basin [43]. In the study of the Erhai basin, the CMADS data were in good agreement with the ground station data, which drove the SWAT model to better simulate the hydrological processes and the spatial distribution of blue–green water in the basin [44,45].
Southern Yunnan, an ecological core region in southwest China, is rich in biological diversity but has a delicate ecological environment and is heavily reliant on water resources due to soil and water conditions. Changes in water resources, which are vital to human survival, will have an impact on the local ecological environment and socio-economic development. At the same time, the local area is impacted by geographical location and other factors, with a weak economic base and a low level of social and economic development security [46].
Therefore, hydrological and water-resource response studies in southern Yunnan are of great importance to the local ecology and socio-economy and can be used as a basis for local development planning.
Furthermore, the West is developing more rapidly as a result of China’s increasing emphasis on it, and construction projects related to infrastructure, transportation, and economic growth are in progress.
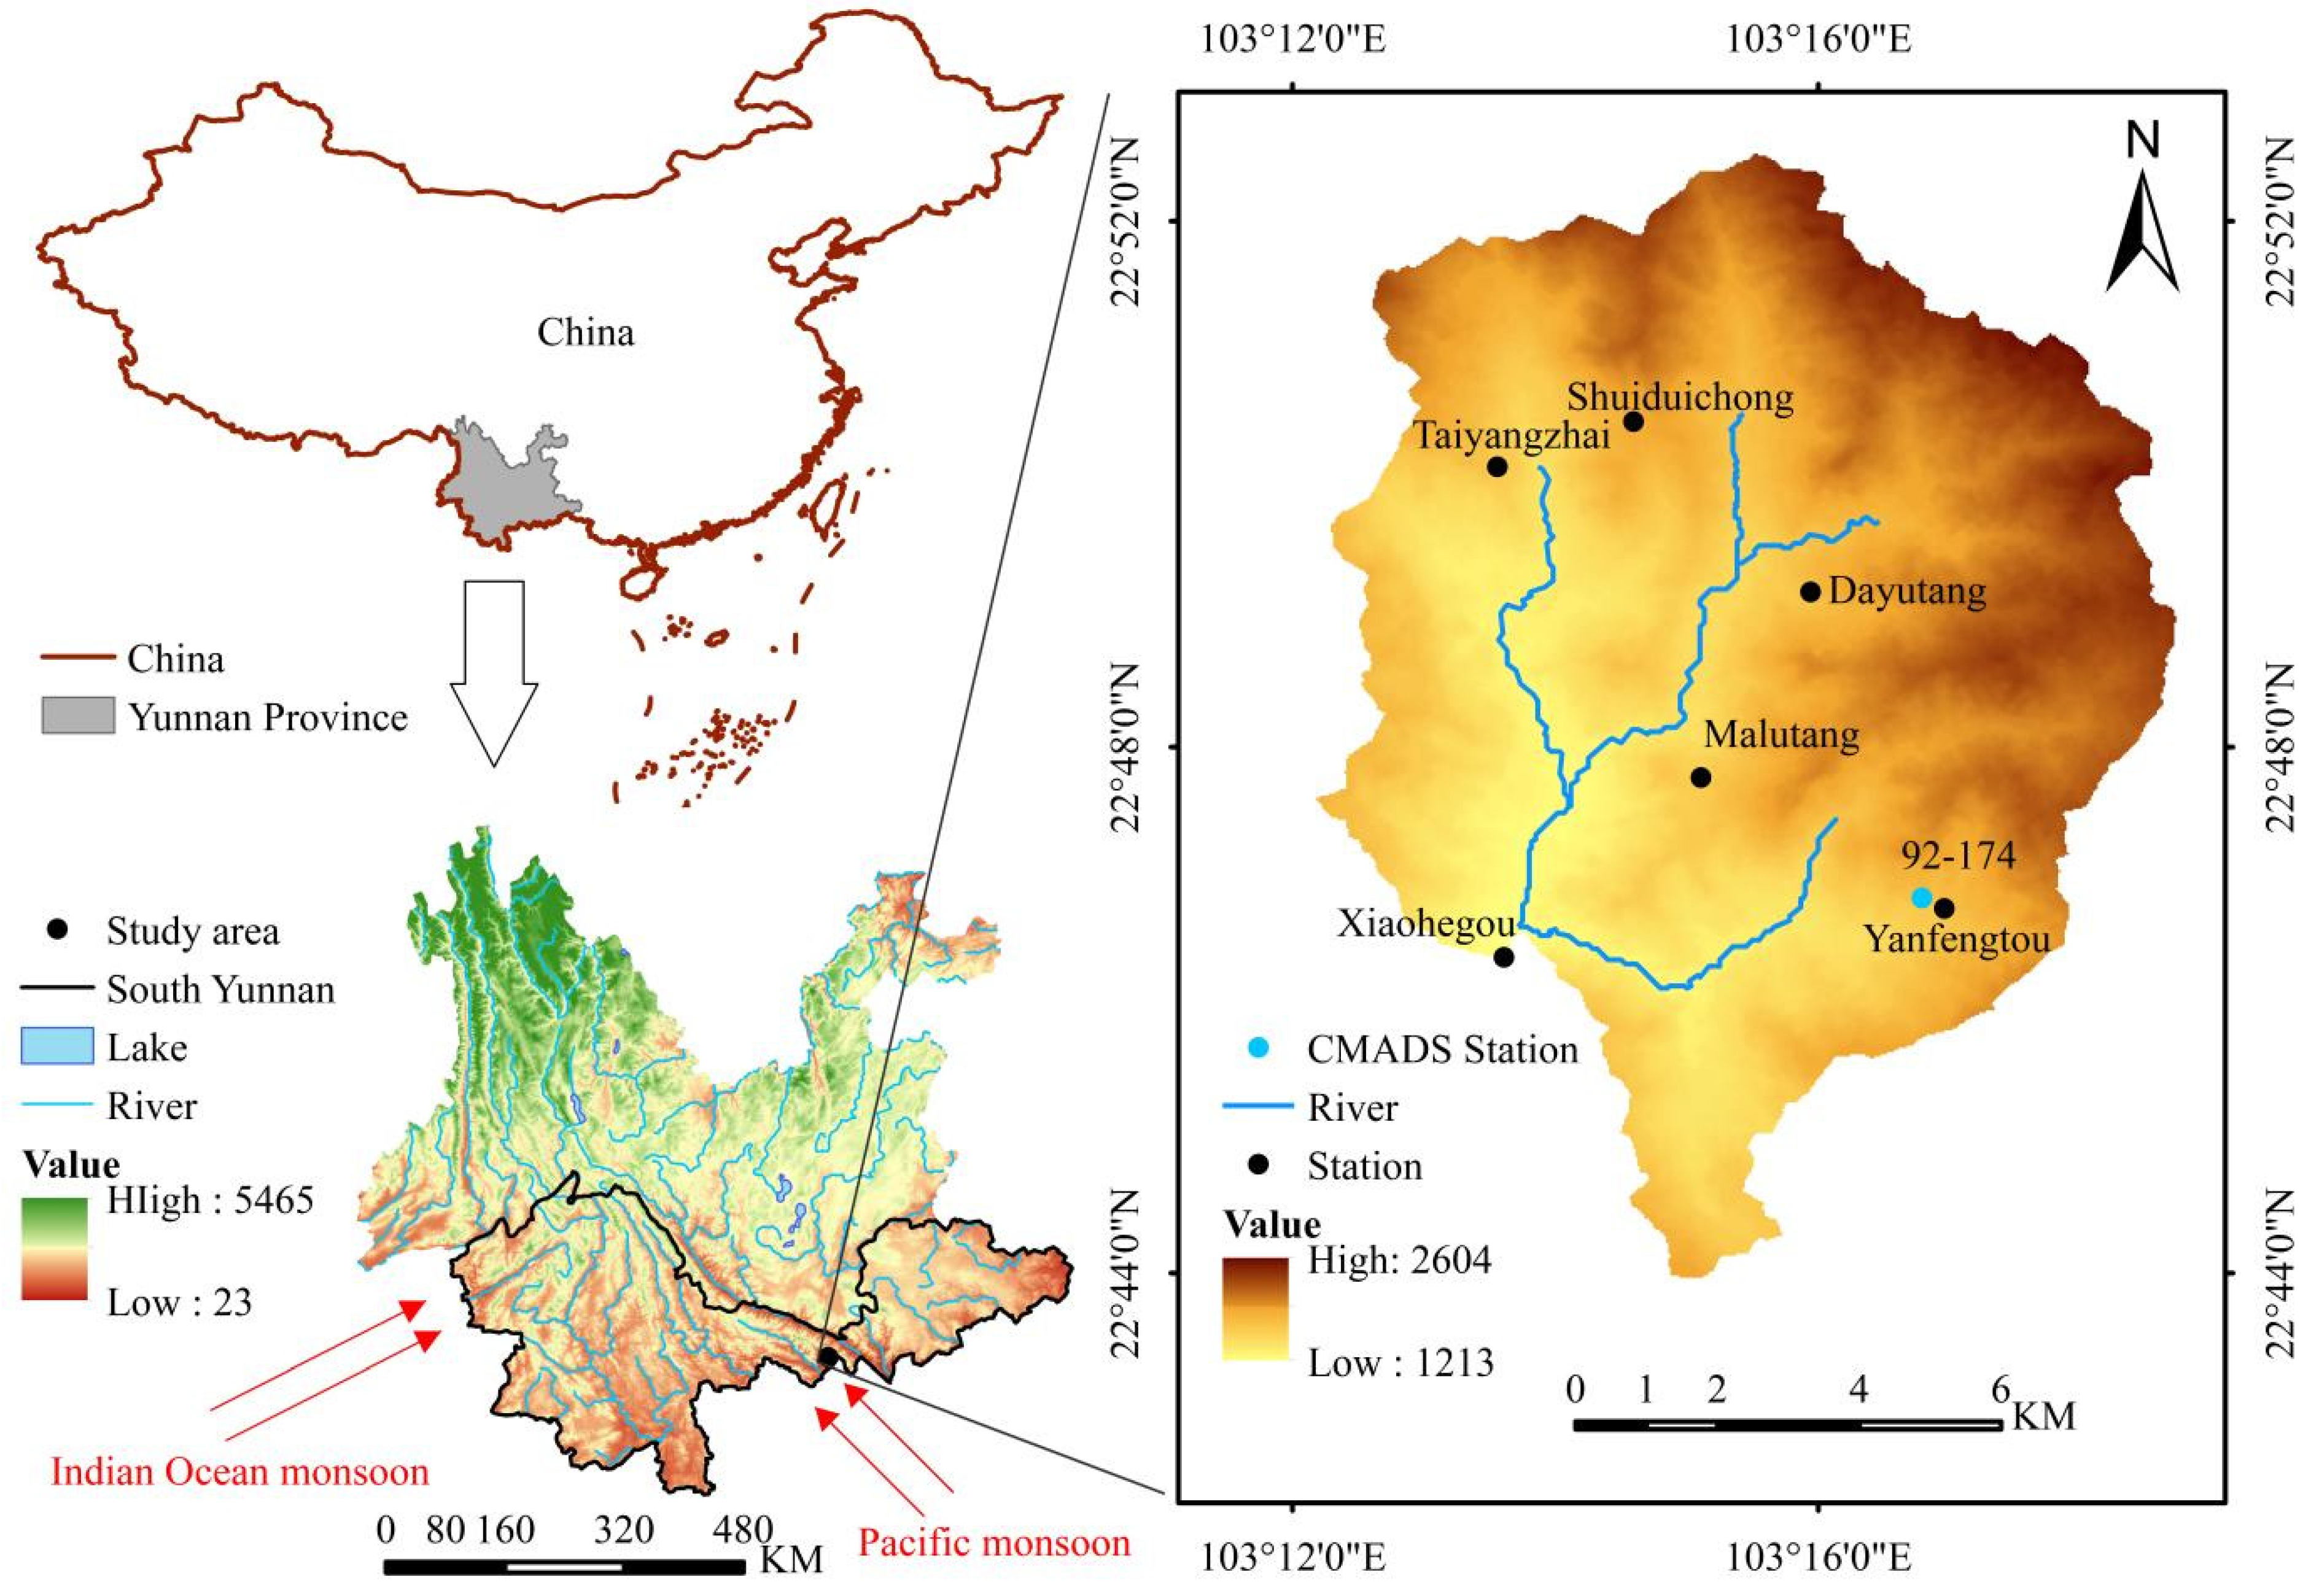
The results of hydrological and water-resource evaluation and prediction will be used to support local development planning and design, thus reducing the contradiction between the water demand for human development and ecological water demand and planning the scale of human activities in the area using water to determine development. However, the meteorological and hydrological conditions in Yunnan are complex, with multiple sources of water vapor, mainly from the Pacific Ocean in eastern Yunnan and from the Indian Ocean in western Yunnan, making water vapor conditions very complex [47], while southern Yunnan has a combination of water vapor from both the Pacific and Indian Oceans.
High mountains and deep valleys characterize the southern Yunnan region’s complex topography and geology, which also contributes to its extremely fluctuating production and sink conditions as well as meteorological elements.
The complex production and catchment conditions pose a huge challenge to rainfall-runoff modeling studies due to the wide variety of vegetation, pronounced vertical zonation, the diverse and complex spatial distribution of land use and ground cover due to topography and climate, as well as the wide variety of soils [48,49]. It is of great importance to carry out rainfall-runoff simulation studies in the region with distributed hydrological models driven by atmospheric-assimilation data.
The BTOPMC model is a distributed hydrophysical model developed by the hydrological research team at the University of Yamanashi (Japan). It is a more advanced distributed hydrophysical model that uses a distributed, gridded production and sink model, a TOPMODEL model production mechanism, and a Muskingum–Cunge sink model [50]. The BTOPMC model has been widely used in production and research worldwide with good results. For example, Shrestha et al. used it to simulate runoff in the MOPEX basin in the USA [51]; Takeuchi et al. used it to simulate flood processes in the Fuji River basin in Japan [52]; Hapuarachchi et al. investigated the applicability of satellite data and the BTOPMC model in the Mekong River basin [53]; Zhang Hongbo used the BTOPMC model to predict floods in mountainous areas of the Ming River and Shiting River basins in China [54]; Will Weiwei coupled the porosity method hydrodynamic model with the BTOPMC model for flood forecasting in small mountainous basins [55], etc.
CMADS data are atmospheric-assimilation data specifically designed to drive the SWAT model. The input format was developed in accordance with the SWAT model [56], but with some formatting modifications and information additions, it can also be used to drive BTOPMC model simulations. This paper attempts to use CMADS data to drive the BTOPMC model for runoff simulation studies in southern Yunnan. On the one hand, the BTOPMC model differs from SWAT in terms of the flow production mechanism, which mainly uses the SCS model [57]. In contrast, the BTOPMC model mainly uses the TOPMODEL model [50], which uses a relatively clearer physical mechanism for the concept of variable source area and topographic index. Secondly, CMADS data are mostly used to drive the SWAT model, and this paper uses it to drive the BTOPMC model in an attempt to extend the application of CMADS to make it more useful. The comparison of SWAT model and BTOPMC model mechanism is shown in Table 1.
Therefore, this paper selects the distributed hydrophysical model BTOPMC driven by CMADS atmospheric-assimilation data and selects the Jinping River basin, a representative and relatively well-documented area in southern Yunnan, to carry out the evaluation of the accuracy of CMADS data and the evaluation of the runoff simulation effect of the distributed hydrophysical model BTOPMC driven by CMADS, in order to carry out the preliminary work for the evaluation and research of hydrological and water resources in southern Yunnan by the distributed hydrophysical model driven by atmospheric-assimilation data.

2. Study Area Overview and Data Collection

2.1. Overview of the Study Area

Southern Yunnan refers to the southern part of Yunnan Province, mainly involving the administrative regions of Wenshan Prefecture, Honghe Prefecture, Xishuangbanna Prefecture, and Pu’er City, between 98 ° 40 53 106 ° 11 33   E ,   21 ° 8 35 24 ° 27 35   N , with a total area of about 101,900 km2. Southern Yunnan is located in the southern part of the Yunnan–Kweichow Plateau, which is subject to the collision and extrusion of the Indian Ocean plate and is vertically arranged with high mountains such as Laobie Mountains, Bangma Mountains, Wuquan Mountains, and Qiaolun Mountains, etc. The topography is undulating, forming the topographic features of high mountains and deep valleys and the topography of the mountains and rivers; it is also in the humid monsoon area of the low latitude subtropical plateau, with complex atmospheric circulation characteristics and is influenced by the monsoons of both the Indian Ocean and the Pacific Ocean in summer. Affected by the topography and climate, the regional vegetation is various, the vertical zonality is obvious, the spatial distribution of land use and ground cover is complex and diverse, the hydrological conditions are complex, the dependence on water resources is strong, and the social and economic development is low. The change in water resources affects the local ecological environment and social and economic development. As the ecological core area of southwest China, the study on the response of hydrology and water resources in southern Yunnan is of great significance to the local ecology and social economy.
In this paper, the Jinping River basin, a representative watershed in southern Yunnan, was selected as the study area. Jinping River is a first-class tributary of the Vine River, belongs to the Red River Basin, and originates at the end of the Wailun Mountain Range. The catchment area above the control section of Xiaohegou hydrological station in the Jinping River basin is about 108 km2, accounting for 54.19% of the Jinping River basin, geographically located between 22 ° 75 22 ° 87   N , 103 ° 20 103 ° 31   E . The study area is vertically arranged with three large mountains, high mountains and deep valleys, undulating terrain, and significant elevation changes, with the highest elevation of 2595 m and the lowest elevation of 1189 m; located in the subtropical monsoon region, precipitation is controlled by the Indian Ocean and Pacific Ocean air currents, coupled with the influence of topography, the three-dimensional climate features are obvious, and the spatial and temporal distribution of precipitation is relatively complex. According to statistics, the study area has abundant precipitation, with an average annual precipitation of about 2000 mm, mostly concentrated in a period from May to November, which can account for 85% of the annual precipitation. The middle and upper reaches of the Jinping River are high in elevation, less populated, and have a high rate of primitive forest cover; the lower reaches have intense human activities, more terraces, average vegetation, and a more complex land cover. In recent years, the spatial and temporal distribution characteristics of water resources in southern Yunnan have changed to some extent due to climate and land cover changes, resulting in ecological and environmental problems in southern Yunnan becoming prominent, such as water shortage and land desertification.

2.2. Data Collection

2.2.1. Hydrometeorological Data

(1)
Meteorological Data
The atmospheric-assimilation data used in this paper is CMADS V1.1 version, which is derived from the official website of China Atmospheric-Assimilation Dataset (http://www.cmads.org/, accessed on 10 September 2024). The spatial resolution is 1/4°, with 260 × 400 grid points, and contains 104,000 stations. The station data include daily maximum and minimum temperature (2 m), daily cumulative precipitation (20–20 h), daily average solar radiation, daily average atmospheric pressure, daily average relative humidity, and average wind speed (10 m) from 2008 to 2016. The CMADS grid number covering the Jinping River basin is 92–174.
There are five sites with measured precipitation data in the study area—Yanfengtou, Dafutang, Sunzhai, Malutang, and Shuiduchong, with daily precipitation data from 2008 to 2016, sourced from the Honghe Branch of Yunnan Hydrological and Water Resources Survey Bureau. Among them, the accuracy evaluation of the atmospheric-assimilation data was used to evaluate the rainfall station of Yanfengtou, and the driving rainfall-runoff model used the actual measured hydrological data from all five stations.
(2)
Hydrological Data
There is only one hydrological station in the Jinping River basin: Xiaohegou hydrological station, located in the middle reaches of the Jinping River, with daily runoff data from 2008 to 2011, which comes from the Honghe Branch of Yunnan Hydrological and Water Resources Survey Bureau, and after collation and verification by China’s hydrometeorological department, the accuracy of the data has been well verified. The distribution of precipitation stations and hydrological stations in the study area is detailed in Figure 1.

2.2.2. Geospatial Data

(1)
Topographic data resolution of 30 M GDEMV2 data from Geospatial Data Cloud (http://www.gscloud.cn/, accessed on 10 September 2024).
(2)
The resolution of land use data is 1 km, and the International Geosphere Biosphere Program at United States Geological Survey (IGBP), developed by the USGS, is used (http://lpdaac.usgs.gov/, accessed on 10 September 2024).
(3)
The soil data resolution is 1 km, using the Digital Soil Map of the World (DSMW) produced by the Food and Agriculture Organization of the United Nations. The soil types in the catchment area above the small river gully are the same. All are clayey sandy soils.
(4)
NDVI data, downloaded from the Resource and Environmental Science and Data Center of the Chinese Academy of Sciences (https://www.resdc.cn/Default.aspx, accessed on 16 September 2024), with time series from January 2008 to December 2016.

2.3. Research Methodology

2.3.1. Precision Evaluation Method

Collecting and analyzing existing research results [20,21,22,23,24,25,26,27,28], this paper evaluates the accuracy of CMADS precipitation data from two aspects: the evaluation of the probability of precipitation events and the quantitative evaluation of precipitation amounts. The probability evaluation indicators of precipitation events are the probability of detection (POD), false alarm rate (FAR), critical success rate (TS), and probability density function statistic (SS). The quantitative evaluation indexes of precipitation include absolute error (E), relative error (RB), root mean square error (RMSE), correlation coefficient (CC), and coefficient of determination (R2), and the formula for the nine evaluation indexes are shown in Table 2:
POD denotes the ratio of simultaneous precipitation occurrences between CMADS data and stations to the total precipitation occurrences at stations, indicating the temporal accuracy of CMADS precipitation data; FAR represents the ratio of CMADS precipitation occurrences without corresponding station precipitation to the total CMADS precipitation occurrences, illustrating the prevalence of false alarms in CMADS data; TS signifies the ratio of simultaneous precipitation occurrences between CMADS data and stations to the overall precipitation occurrences, reflecting both accuracy and false alarm rates of CMADS data; SS indicates the ratio of CMADS data to actual precipitation data. The absolute error E indicates the deviation degree of CMADS data from the measured data; RB is used to measure the systematic error of CMADS data; RMSE shows the dispersion degree between CMADS data and station data; the correlation coefficient CC evaluates the linear correlation degree between CMADS data and station data; and the decision coefficient R2 evaluates the linear fit degree between CMADS data and station data.
Using the above evaluation indexes, this paper quantitatively evaluates the data accuracy of CMADS precipitation data at daily and monthly scales and evaluates the accuracy of CMADS data and the accuracy of precipitation event probability under different precipitation intensities, and the precipitation intensity classification criteria are shown in Table 3.

2.3.2. BTOPMC Model Principle

BTOPMC model is a distributed hydrophysical model developed by Kuniyo Takeuchi’s team at the University of Yamanashi, Japan. Its production module is developed based on the TOPMODEL model, and the sink module is developed based on the Muskingen–Conch algorithm. The model is capable of chunking the watershed, i.e., dividing sub-basins, and can be applied to the simulation of hydrological processes in large watersheds (≥100 km2). BTOPMC has been widely used in the world, such as the Mekong River basin (Aotianqi et al., 2001 [59].), the Fuji River basin in Japan (Takeuchi et al., 1999 53; Ishidaira et al., 2003 [60]; Hapuarachchi et al., 2005 [61]), the Mae Chaem watershed in Thailand (Ao Tianqi et al., 2006 [62]), the MOPEX basin in the United States (Shrestha et al., 2007 [51].) and the Yellow River Basin in China (Wang Guoqiang et al., 2009 [63]; Wang Guoqiang et al., 2010 [64]) etc., and all of them have achieved good application results.
The BTOPMC model has only five rate-determining parameters, all of which have physical significance: saturated soil hydraulic conductivity T0(m2/s), attenuation factor of saturated soil hydraulic conductivity m(m), maximum water storage in the rhizosphere Smax(m), initial value of the average soil saturation difference Sbar(m), and Manning’s stratification coefficient n0. Smax reflects the effect of vegetation/land use within the watershed on the model simulation, T0, m reflects watershed soil types, Sbar(m) reflects watershed topography, and n0 reflects watershed soil types and vegetation/land use.
The BTOPMC model consists of three core modules (Figure 2), namely the topography submodel, the flow production submodel, and the sink submodel.
(1)
Terrain Sub-Module
The terrain submodel has functions such as depression elimination, digital river network generation, and sub-basin delineation. In sub-basin delineation, the model calculates the grid and sub-basin topographic indices, and the topographic indices are important factors in the calculation of surface runoff and loamy mid-stream. The grid topographic index and the sub-basin average topographic index are calculated by the following equations, respectively.
λ ( i ) = ln ( a i / tan β i )
λ a v ( k ) = 1 N ( k ) i = 1 N ( k ) λ i  
where i is the grid code; tanβi is the slope of the terrain within the grid; ai is the area of water accumulation per unit grid length; k is the code of the sub-basin; N(k) is the number of grids within the kth sub-basin
In the grid, the distance from the ground to the groundwater surface line is expressed as the saturation deficit value S(i), which is one of the key factors influencing the amount of surface runoff and loamy flow generation and is calculated as follows:
S ( i ) = { S a v ( k ) + m [ λ a v ( k ) λ ( i ) ] } +
Sav is the average saturation deficit value; m is the attenuation factor of soil hydraulic conductivity; { }+ denotes Si is a non-negative value, and { } is replaced by 0 if the value inside is negative.
(2)
Flow-Producing Sub-Module
The basic idea of the BTOPMC model yield flow calculation is to apply the yield flow assumptions and concepts of TOPMODEL to the yield flow calculation of each grid and then realize the application of the model in large watersheds. The model divides the soil section of each grid into three layers from top to bottom: root, unsaturated, and saturated layers. The effective precipitation Re(i,t) stored in the root zone at moment t of the model is expressed as:
R e ( i , t ) = R 0 ( i , t ) S r max ( i ) E p ( i , t )
In the formula: Ee(i,t) is the total evapotranspiration loss of soil water; R0(i,t) is the total precipitation calculated according to the Tyson polygon method; Srmax is the maximum water storage in the root layer, which reflects the effects of vegetation interception, soil moisture, and depression water accumulation;
The water content of the unsaturated layer, Suz, is calculated as follows:
S uz ( i , t ) = S uz ( i , t 1 ) R e ( i , t ) q v ( i , t )
In the formula, qv(i,t) is the groundwater recharge volume, which is calculated as:
q v ( i , t )   = T 0 ( k ) exp s ( i , t )   m ( k )  
T0 is the saturated soil permeability in m2/h, and m is the attenuation factor of T0 in m. S(i,t) is the local saturation deficit in meters, which can be considered to be the distance from the groundwater to the surface; the calculation equation is as follows:
S ( i , t ) = S bar ( i , t ) + m ( k ) λ ( k ) λ i
In the formula, Sbar(i,t) is the average saturation rate of the sub-basin in meters, which is calculated as follows:
S bar = S bar ( i , t 1 ) + i = 1 N p ( k ) q b ( i , t ) / N p ( k ) i = 1 N p ( k ) q v ( i , t ) / N p ( k )
In the formula, qb(i,t) is the base flow, which is calculated as follows:
q b ( t ) = T 0 + exp S ( t ) m + tan β i
When t = 1, the initial value of the average saturation loss, Sbar(k,0), is written as Sbar0(k).
(3)
Convergence Sub-Module
Convergence sub-module using Muskingen–Conch algorithm. The method is a physically based flow path approach rather than an empirical one and is equivalent to the convective diffusion model, which is more suitable for large watersheds than the kinematic wave model because the slope of the riverbed is usually gentle. The Maskingen–Conch algorithm has another advantage in that it can provide the output of hydraulic variables (such as flow or water level) for any grid node; for this reason, the model is improved for this purpose to solve the negative flow problem in the Maskingen–Conch algorithm and to ensure the accuracy of the model’s confluence. In the flow calculation, the river cross-section is assumed to be rectangular, and the river width B(i) is approximated as:
B ( i )   = C   A ( i )  
In the formula, C is a constant, taken as 10; A is the watershed area in km2; the equivalent Manning roughness coefficient for each grid cell is estimated as:
n i = n 0 ( k ) tan β i tan β n ( k ) 1 / 3
In the formula, n0 and tanβ0 are the equivalent roughness coefficients and slope of the outlet of sub-basin k. n0 is the model parameter to be estimated.

2.3.3. Hydrological Process Simulation Program and Evaluation Criteria

  • Hydrological Process Simulation Program
In evaluating the effectiveness of CMADS-driven distributed hydrological models for simulating runoff, this paper designs three meteorological data combination schemes to drive BTOPMC models based on CMADS and measured data, namely:
(1)
CMADS separately driven (Scenario 1)
(2)
Actual measurement data driven separately (Scenario 2)
(3)
CMADS data and real measurement data driven simultaneously (Scenario 3)
2.
Evaluation Criteria
In this paper, two evaluation indexes, the Nash coefficient (Nash) and the ratio of simulated total runoff to the corresponding observed runoff (Vol) during the simulation period, are used to evaluate the simulation results. The calculation formula is as follows:
Nash = 1 t = 1 N ( Q sim ( t ) Q obs ( t ) ) 2 t = 1 N ( Q obs ( t ) Q ¯ a v ) 2 × 100 %
V o l = T V sim T V obs × 100 %
In the formula, N is the number of time periods; Qsim and Qobs are the simulated and observed values of flow at time t, respectively; Qav is the average value of observed flow during the study period; TVsim and TVobs are the simulated and observed values of total runoff during the study period.
Nash and Vol are used to evaluate the degree of fit between the observed and simulated values, and the closer the values of the two indicators are to 1, the better the simulation effect is [50,51,52,53,54,55].

3. Results

3.1. CMADS Data Accuracy Evaluation Results

Due to the limited number of observation stations and low resolution of CMADS precipitation products, the precipitation of grid point 92–174 in CMADS precipitation products is used as a representative in this paper to compare with the actual measured precipitation data from the rainfall station of Yanfengtou. In this paper, we evaluate the accuracy of CMADS data in two aspects—the likelihood of precipitation events and the quantitative evaluation of precipitation— three evaluation scales are used—annual, monthly, and daily—and the evaluation period is from January 2008 to December 2016.

3.1.1. Annual Scale Accuracy Evaluation

As shown in Figure 3, the measured and CMADS annual precipitation accumulation curves for 2008–2016 show that the two accumulation curves basically overlap in 2008–2013 and separate more obviously in 2014–2016, indicating that CMADS and measured precipitation are more consistent overall for each year from 2008 to 2013, and the overall difference is larger in 2014–2016. As shown in Table 4, throughout the study time period, the CMADS data were biased a small amount in 2008–2009 but with little deviation; biased a large amount in 2010–2012 with an increase in bias; and biased a small amount in 2013–2016 with a substantial increase in deviation, especially in 2014, reaching 2167 mm; where, despite the large bias in 2013, it offset the large bias in 2008–2012, making the cumulative curve fit better in 2013 and before. Thus, from a multi-year perspective, the absolute error is small for each year from 2008 to 2012 and increases substantially thereafter, resulting in a more pronounced separation of the cumulative curves.

3.1.2. Monthly Scale Accuracy Evaluation

As analyzed from the month-by-month precipitation comparison between CMADS and actual sites in Figure 4 and the absolute error plot in Figure 5, the overall fit is better in the dry period but smaller in the flood period. From 2008 to 2012, CMADS fitted better with the measured-site month-by-month precipitation in the dry months, and the flood months had a certain magnitude of deviation, but the deviation was not large; from 2013, the deviation of flood months increased substantially, especially in 2013 and 2014, when the deviation of flood values was most obvious. Specifically, the precipitation in 2014 was basically lower than the measured precipitation throughout the year, and the flood period was more obvious. This indicates that CMADS underestimates the precipitation during the flood period, especially to a greater extent for the 2013 to 2016 flood period. In addition, it can also be seen from Figure 5 that the absolute error between CMADS and measured monthly precipitation basically fluctuates on both sides of the 0 line from 2008 to 2013, below 0 in 2008–2010 and 2013, and above 0 in 2011–2012, but the fluctuations are small, indicating that the multi-year average rainfall simulation is better in this time period relative to 13 years later. After 2013, the error lines were basically below the 0 line, and the CMADS were all lower than the measured values and the fluctuations increased significantly, especially in June 2014, when the monthly precipitation deviation reached 544.27 mm.
The above analysis shows that CMADS simulates relatively well in the dry period and poorly in the flood period relative to the actual measured data, and there is a general underestimation phenomenon.
The monthly precipitation simulation results were further analyzed, as shown in Figure 6, a plot of the average monthly precipitation for CMADS versus the measured sites from 2008 to 2016. From the comparison of multi-year average precipitation by month, CMADS is basically consistent with the measured values from December to May each year, while it is less effective in the rainy season, especially in the main flood period of June to September.
Figure 7 shows the scatter plot of CMADS versus the measured data on a monthly scale. As can be seen from the Figure, when the precipitation is lower than 150 mm, the data points are basically located near the 45° line, indicating that CMADS is more consistent with the measured data at low precipitation; when the precipitation is greater than 150 mm, the data points start to move away from the 45° line and most of them are located below the 45° line, indicating that as the precipitation value increases, the deviation of CMADS simulation increases and is mostly lower than the measured precipitation. Consistent with previous results, CMADS underestimates the amount of precipitation in months with higher precipitation.
From the statistical data of all months in the time period, as shown in Table 5, the root mean square error RMSE is only 10.808 mm, indicating that the error is moderate considering the monthly total, but the overall underestimation of the measured precipitation, the relative error RB is −19%; the whole shows strong correlation and high fitting degree, the correlation coefficient CC reaches 0.817 and the determination coefficient R2 is 0.668.

3.1.3. Evaluation of Daily Scale Accuracy

  • Statistical Data Analysis
The daily precipitation data from 2008 to 2016 were evaluated overall in terms of quantitative and temporal accuracy. As shown in Table 6, the quantitative evaluation results were lower than the monthly scale. The RMSE was reduced to 0.159 mm, and the RB was still −19%. The overall underestimation of the measured precipitation will also bring deviations to the runoff simulation results. However, due to the complex mechanism of rainfall runoff and many influencing factors of simulation results, it is difficult to accurately and quantitatively analyze the influence of rainfall error on runoff. For the evaluation of local water resources, the error has no obvious effect on the results, and the impact is acceptable for the applicability evaluation of CMADS data and the hydrological modeling. The overall correlation and fit decreased, with the correlation coefficient CC dropping to 0.755 and the determination coefficient R2 dropping to 0.57, but both were acceptable. Evaluated in terms of temporal accuracy, the results were better. The accuracy rate of precipitation event POD reached 0.879, indicating that the detection ability was strong, and 87.9% of the actual precipitation events could be successfully captured. The false alarm rate FAR is only 0.196, and the prediction reliability is high. The key success rate TS reached 0.724, indicating that a good balance was achieved between the correct prediction of precipitation events (hits) and the avoidance of false alarms and missed alarms, and the overall forecast skills were high. From the perspective of precipitation probability distribution, the two are relatively consistent, and the probability density function statistic SS reaches 0.941, which can accurately reproduce the overall probability distribution characteristics of precipitation.
2.
Time Accuracy Evaluation
As shown in Figure 8, the temporal distribution of precipitation between CMADS (top) and the station (bottom) is consistent with the measured precipitation, the interannual precipitation separation is clear and consistent, and the distribution pattern of alternating abundance and depletion is consistent from year to year.
3.
Evaluation of Rainfall Accuracy
As shown in Figure 9 and Figure 10, the absolute daily precipitation error plots and daily scale scatter plots of CMADS versus the measured stations. The analysis found that the daily precipitation error was basically concentrated within 50 mm, a small amount was located between 50 and 100 mm, and there were only precipitation events with an error of more than 100 mm, 109.93 mm on 8 October 2011, 109.48 mm on 10 June 2014, and 110.52 mm on 20 July 2014, respectively. Meanwhile, the precipitation error values are larger during the flood period and after 2013, and the CMADS values are mostly smaller than the measured values during this period, which is consistent with the results of the previous monthly and annual scale analyses.
In addition, from Figure 10, the scatter plot of CMADS and the measured data on the daily scale, it can be found that when the precipitation is within 50 mm, it is mainly concentrated on both sides of the 45° line, but the overall bias is below the 45° line, indicating that CMADS has better simulation accuracy when the precipitation is below 50 mm, but there are more overall small events; while in the precipitation events above 50 mm, the precipitation events are basically small.
In Figure 11, the probability density distribution of CMADS data and station precipitation data shows that the probability density distribution functions of CMADS and station precipitation data almost overlap, and the SS value is as high as 0.941, indicating that CMADS can well reflect the probability density distribution of measured precipitation; at the same time, it also reflects that the majority of precipitation events occur within 20 mm.

3.1.4. Evaluation Results of Classification Accuracy for Different Precipitation Intensities

Based on the precipitation intensity classification standard established by China’s meteorological department, the daily scale CMADS data were categorized into four classifications: light rain, moderate rain, heavy rain, and heavy rainfall. The precipitation events within each intensity interval were assessed individually, with the results presented in Table 7.
From 2008 to 2016, the precipitation intensity of most precipitation events was light and moderate, and the occurrence of precipitation events became less and less with the increase in precipitation intensity, which was in accordance with the precipitation law. In addition, The values of POD, TS, and RB all decreased with the increase of precipitation intensity, indicating that the precipitation accuracy and critical success rate of CMADS decreased with the increase of precipitation intensity, but the relative error gradually decreased; meanwhile, the relative error values revealed that all precipitation intensities were underestimated, except for the simulated overestimation of light rain. The FAR and RMSE increase with increasing precipitation intensity, indicating that the false alarm rate and dispersion of CMADS increase with increasing precipitation intensity. The correlation coefficients CC are all small, but they are greater than other rainfall intensities in light rain, showing the characteristics of light rain > heavy rain > medium rain, indicating that the correlation degree is better in light rain, but there is no pattern in other precipitation intensities. Collectively, the accuracy of CMADS decreases with increasing precipitation intensity.
Figure 12 and Figure 13 illustrate that the CMADS error distribution across various precipitation intensities predominantly occurs within 50 mm, with error amounts confined to ±10 mm, representing approximately 90% of precipitation events. Furthermore, the majority of precipitation error points are situated below the zero line, suggesting that CMADS typically underestimates actual daily precipitation, confirming earlier findings.

3.2. Simulation Results of Hydrological Processes in Jinping River Basin

To evaluate the effect of the CMADS data-driven distributed hydrophysical model for rainfall-runoff simulation, three scenarios of rainfall data combinations were designed to drive the distributed hydrophysical model BTOPMC for rainfall-runoff simulation, and the corresponding daily runoff data of Xiaohegou hydrological station from 2008 to 2011 were used to evaluate the simulation effect of the three scenarios, and the simulation results are shown in Figure 14, Figure 15 and Figure 16 and Table 8.
From the simulated runoff process lines, as shown in Figure 14, Figure 15 and Figure 16, the BTOPMC model can better simulate the daily runoff process of the Xiaohegou hydrological station under all three scenarios. From the Figure 14, Figure 15 and Figure 16, we can see that the simulation effect is better in all three scenarios in the dry period and slightly worse in the flood period, and the flood peak occurrence time is more consistent, but the flood flow values are all deviated. For all three scenarios, the simulated flood flow in 2008 was greater than the measured value, and the simulated flood flow from 2009 to 2011 was smaller than the measured value, while a false flood occurred in 2011. However, in comparison, the effect of Scenario 3 is slightly better, and the fitting degree of dry season and the deviation of flood peak value are smaller.
From the evaluation indicators, as shown in Table 8, Scenario 3 has the best simulation results with Nash coefficients of 83.9% and 74.5% in the rate period and validation period, respectively, both better than the other two scenarios, and the Nash coefficients of the three scenarios are ranked as follows: Scenario 3 > Scenario 2 > Scenario 1. The ratio between simulated and observed values of total runoff during the study period was highest in the validation period for Scenario 3, with 83.5%, and the rate was regularly lower than that of Scenario 2, also up to 88.02%.
In general, under the three scenarios, Nash is greater than 50%. In particular, in the latter two scenarios, Nash is above 80%, and Vol is greater than 60%. Among them, the coupling scenario of measured data and CMADS (Scenario 3) is the best.

4. Discussion

4.1. CMADS Data Accuracy Analysis

CMADS data have been better applied and validated in many regions, especially in the northern part of China, and less applied in the southwestern part of China. In this paper, we try to validate its accuracy and hydrological simulation in the southern part of Yunnan. In this paper, the accuracy of CMADS data is evaluated from three time scales—annual, monthly, and daily—using the measured rainfall data from the Yanfengtou rainfall station in the Jinping River basin, a typical small watershed in southern Yunnan. The results show that the overall accuracy of CMADS data is good, while the simulation is relatively good in the dry period, but there is a large underestimation of the measured precipitation in the flood period.
Compared with the existing CMADS research results, the accuracy performance of CMADS data in the Jinping River basin is basically consistent with its performance in the Erhai and Jinsha River basins in terms of overall statistics [42], and both achieve better results, with the Jinping River basin slightly outperforming the evaluation results in the Erhai and Jinsha River basins. In terms of precipitation temporal accuracy, the statistical parameters of CMADS data in the Jinping River basin, POD (0.879), FAR (0.196), and TS (0.724) are slightly better than those in the Jinsha River basin (0.77, 0.32, and 0.54); in terms of precipitation probability distribution performance, compared with the Erhai basin, the Jinping River basin performs more closely to the actual measured precipitation, with SS in the Jinping River basin being 0.941, which is greater than 0.77 in the Erhai basin [44,45].
From the temporal analysis, through the annual scale evaluation, we see that CMADS has some instability in simulating the interannual variability of precipitation, with the simulated annual precipitation values higher than the measured values during 2010–2012 and lower than the measured values in the remaining other years. The evaluation of the monthly and daily scales yielded that CMADS has better simulation accuracy for periods with less precipitation, but during flood periods, the simulation deviations are larger, and there is a large underestimation throughout the study period.
Overall, CMADS has a good simulation effect and can be used for local water-resource calculation and evaluation, but due to the accuracy performance at different scales, this will result in CMADS having good simulation accuracy when used for water-resource evaluation in the dry period, but will bring some error when used for flood-period calculation; however, flood-prevention calculation in the flood period generally requires hourly scale precipitation data, so CMADS is generally not used for flood calculation.
The poor performance of CMADS during the flood era may be attributed to the raw data it utilizes.
The CMADS data creation process introduced the China Meteorological Administration Atmospheric-Assimilation System (CLDAS) [17], and the precipitation data in the CLADS system are based on the Chinese regional hourly precipitation fusion products produced by the National Meteorological Center (NMC), the National Satellite Meteorological Center (NSMC) using the FY-2E geostationary satellite inversion of hourly precipitation and the CMORPH satellite fused precipitation product produced by the NOAA Climate Prediction Center [65]. The CMORPH satellite fusion precipitation product is an 8 km resolution global half-hourly precipitation product obtained by fusing multiple satellite microwave inversion precipitation products and using infrared cold cloud information for time extrapolation. Previously, CMORPH satellite fused precipitation products have also been studied for applicability in China, and the results showed that the accuracy of CMORPH satellite fused precipitation products decreases with increasing precipitation intensity [66,67], so the characteristic that the accuracy of CMADS data decreases with increasing precipitation intensity may come from CMORPH satellite fused precipitation products.
Taken together, although CMADS performs poorly in flood periods, it will have greater application value when used for water-resource calculation and evaluation, especially during dry periods. In the current context of global climate change and land use being severely affected by human activities, it will play an important role in water-resource evaluation in East Asia, especially in data deficit areas.
This paper only evaluates the accuracy of CMADS precipitation data at present, and further analysis of other meteorological data, such as temperature, radiation, and wind speed, will be conducted later.

4.2. Hydrological Validation of CMADS and BTOPMC Model

In terms of hydrological modeling, the CMADS data format is designed according to the input requirements of the SWAT model, and the SWAT model is mostly used in a large number of CMADS studies and applications and has achieved better research results. In this paper, we try to use CMADS to drive a new distributed hydrological physical model, BTOPMC, and achieve better simulation results. BTOPMC is a distributed hydrophysical model based on the TOPMODEL flow production mechanism and the Muskingum–Conch river-confluence mechanism. As mentioned previously, runoff in the study area was simulated using BTOPMC driven by three combined scenarios of CMADS and measured data, and the results showed that the performance of the three scenarios did not differ significantly and all achieved good overall simulation results, with the best simulation results under the combined use of CMADS and measured data, and the simulation process showed poor simulation results for flood values in all three cases. This suggests that some deviations in the precipitation accuracy of CMADS are not significant in the daily scale runoff simulations, and CMADS can be used alone for water-resource calculation and evaluation in areas with local or missing data. Secondly, for runoff simulation in areas where information is available, the combination of CMADS and actual measurement data can improve the effectiveness of runoff simulation and, thus, the accuracy of water-resource calculation and evaluation. Third, although CMADS was found to be small relative to the measured data during the flood period in the evaluation of CMADS rainfall data accuracy, it did not show the corresponding small flood peak value when the separately driven model was used for runoff simulation (scenario 1) On the contrary.
The flood peak values across all three scenarios demonstrated that the rate consistently exceeded the measured value while the validation period was less than the measured value. This suggests that the observed data may be influenced by various factors during the observation period, leading to potential bias. Additionally, the inadequacy of precipitation observation stations may hinder the accurate representation of rainfall distribution within the basin. However, the incorporation of CMADS enhances the representation of precipitation data concerning its spatial distribution, as demonstrated by the better simulation performance of Scenario 3 compared to the other two separately driven scenarios.
In summary, the CMADS-driven distributed hydrological model is better for rainfall-runoff simulation and can be used for local water-resource calculation and evaluation in areas where information is scarce and can improve the accuracy of water-resource calculation and evaluation in areas where information is sufficient.

4.3. Implications for the Calculation and Evaluation of Water Resources in Southern Yunnan

As an ecological core area in southwest China, the ecological environment in southern Yunnan is fragile and sensitive to water resources. At the same time, as an economically underdeveloped area, the economy will see greater development under the background of western development, and the demand for water resources for economic development will be greatly increased, which will definitely bring about the problem of contradiction between human and ecological water use. However, due to the complex topography of local high mountains and deep valleys and relatively backward economic development, there are few local hydrometeorological monitoring stations, which limits the research and evaluation of local water resources. This study shows that the CMADS data-driven distributed hydrological model can better simulate local hydrological processes and will strongly support local water-resource research and evaluation. The applicability evaluation method of precipitation product data used in this study can provide a reference for the applicability analysis of other precipitation products. The applicability evaluation results, hydrological model, and its parameters can also provide a reference for the application of CMADS precipitation products in other regions. However, due to the differences in topographic characteristics, climatic conditions, and hydrological processes between regions, it is difficult to transplant the results and methodologies from one region to another.
In the future, if more hydrometeorological data can be collected in the southern Yunnan region, the accuracy of CMADS data in the southern Yunnan region of China can continue to be studied.
At the same time, the CMADS + BTOPMC model should be further investigated to analyze the variation patterns of water resources in this area. This research would provide technical support for water-resource management and hydropower development, offer theoretical guidance for addressing water-resource challenges posed by climate change, and assist water administration authorities in coordinating the development and management of international rivers.

5. Conclusions

This paper evaluates the accuracy of the precipitation data in the CMADS dataset from 2008 to 2016 based on measured precipitation data and also compares the hydrological utility of CMADS data in southern Yunnan with the measured data using the BTOPMC model. The main findings of this study are as follows:
(1)
Overall, there is good agreement between the CMADS data and the measured data from the Rocky Peak Head rainfall station. The statistical results show that the CMADS data have a high accuracy in the probability of precipitation events at the daily scale, and the precipitation probability density curve is almost the same as the measured precipitation probability density curve; the quantitative accuracy is lower than that of the probability of precipitation events but within an acceptable range. CMADS data underestimated precipitation by 19% over 2008–2016 compared to measured precipitation, while the quantitative accuracy of CMADS data on the monthly scale was higher than that of precipitation on the daily scale; 90% of the quantitative errors on the daily scale of CMADS data were concentrated within ±10 mm/day, and the quantitative accuracy on the daily scale decreased with increasing precipitation intensity.
(2)
The simulation accuracy of the BTOPMC model under all three scenarios met the applicability criteria of the model, indicating that the CMADS + BTOPMC model can be used to simulate hydrological simulations in the southern Yunnan region. As CMADS data are only from one station in the study area, they cannot fully and accurately reflect the spatial and temporal distribution characteristics of precipitation in the study area. Therefore, in order to improve the accuracy of the hydrological simulation, the BTOPMC model can be driven by a mixture of CMADS data and actual measurement data. The CMADS data and the measured data complement each other to give a more comprehensive and accurate picture of the spatial and temporal distribution of precipitation in the study area.
(3)
The simulation accuracy of the three hydrological simulation schemes all meet the criteria of model applicability, indicating that all three simulation schemes are suitable for hydrological simulation in southern Yunnan, providing research samples and hydrological simulation reference schemes for hydrological simulation in southern Yunnan, but the corresponding simulation schemes should be selected according to the specific requirements and purposes in the process of practical application in order to achieve better simulation results. At the same time, the hydrological modeling scenario of this study can greatly contribute to the water-resource management and development of international rivers in the southern part of Yunnan Province in China and also help China to coordinate the development and management of international rivers in the southern part of Yunnan Province with downstream countries.

Author Contributions

Conceptualization, H.Z. and C.L.; methodology, J.W.; software, H.L.; validation, C.L., G.X. and Y.X.; formal analysis, B.Y. and T.Y.; investigation, H.Z.; resources, J.W.; data curation, B.Y. and T.Y.; writing—original draft preparation, H.Z.; writing—review and editing, C.L.; visualization, H.L. and G.X.; supervision, Y.X. All authors have read and agreed to the published version of the manuscript.

Funding

This research was funded by the National Natural Science Foundation of China (Grant No. 52164009), the Applied Basic Research Key Project of Yunnan province (Grant No. 202401AS070058), and the Belt and Road Special Foundation of The National Key Laboratory of Water Disaster Prevention (Grant No. 2022490411).

Data Availability Statement

Data are contained within the article.

Conflicts of Interest

The authors declare no conflicts of interest.

References

  1. Meng, X.Y.; Wang, H. Significance of the China Meteorological Assimilation Driving Datasets for the SWAT Model (CMADS) of East Asia. Water 2017, 9, 765. [Google Scholar] [CrossRef]
  2. Kumar, V.; Sen, S. Hydrometeorological field instrumentation in Lesser Himalaya to advance research for future water and food security. Environ. Monit. Assess. 2023, 195, 1162. [Google Scholar] [CrossRef] [PubMed]
  3. Liu, J.T.; Xu, Z.X.; Zhao, H.; He, J. Evaluation of precipitation accuracy of different precipitation satellite data inversions--a case study of Yarlung Tsangpo River basin. Plateau Meteor. 2019, 38, 11. [Google Scholar]
  4. Xu, X.Y.; Li, J.Z.; Feng, P. Applicability of different precipitation products to runoff simulations of Luanhe RiverBasin. J. Hydroel. Eng. 2021, 40, 25–39. [Google Scholar]
  5. Onyutha, C.; Nyesigire, R.; Nakagiri, A. Contributions of Human Activities and Climatic Variability to Changes in River Rwizi Flows in Uganda, East Africa. Hydrology 2021, 8, 145. [Google Scholar] [CrossRef]
  6. Yang, W.F.; Wang, L.; Zhang, J. Progress and applicability of multi-scale hydrological forecasting in river basins. Yangtze River 2021, 52, 11. [Google Scholar]
  7. Shi, C.X.; Yang, P.; Gu, J.X.; Xu, B.; Han, S.; Zhu, Z.; Zhang, L.; Sun, S.; Jiang, Z. Progress in the development of multi-source meteorological data fusion grid point live product. Acta Meteor. Sin. 2019, 77, 10. [Google Scholar]
  8. Uppala, S.M.; Kllberg, P.W.; Simmons, A.J.; Andrae, U.; Da Costa Bechtold, V.; Fiorino, M.; Gibson, J.K.; Haseler, J.; Hernandez, A.; Kelly, G.A.; et al. The ERA-40 re-analysis. Q. J. R. Meteorol. Soc. 2005, 131, 2961–3012. [Google Scholar] [CrossRef]
  9. Balsamo, G.; Albergel, C.; Beljaars, A.; Boussetta, S.; Brun, E.; Cloke, H.; Dee, D.; Dutra, E.; Muñoz-Sabater, J.; Pappenberger, F.; et al. ERA-Interim/Land: A global land surface reanalysis data set. Hydrol. Earth Syst. Sci. 2015, 19, 389–407. [Google Scholar] [CrossRef]
  10. Crossett, C.C.; Betts, A.K.; Dupigny-Giroux, L.-A.L.; Bomblies, A. Evaluation of Daily Precipitation from the ERA5 Global Reanalysis against GHCN Observations in the Northeastern United States. Climate 2020, 8, 148. [Google Scholar] [CrossRef]
  11. Collins, B.; Ramezani Etedali, H.; Tavakol, A.; Kaviani, A. Spatiotemporal variations of evapotranspiration and reference crop water requirement over 1957–2016 in Iran based on CRU TS gridded dataset. J. Arid. Land 2021, 13, 858–878. [Google Scholar] [CrossRef]
  12. Ye, M.S.; Yao, X.P.; Zhang, T.; Xu, X.; Wang, S. Intercomparison of CRA-Interim precipitation products with ERA5 and JRA-55. J. Trop. Meteor. 2021, 27, 136–147. [Google Scholar]
  13. Tian, X.; Zhi, X.F.; Xu, H.M. Comparative analysis of potential height between NCEP and JRA reanalysis data and sounding data. Arid. Meteor. 2013, 31, 254–262. [Google Scholar]
  14. Sun, S.; Shi, C.X.; Liang, X.; Han, S.; Jiang, Z.; Zhang, T. Assessment of the applicability of different land surface models for surface temperature simulation in China. J. Appl. Meteor. Sci. 2017, 28, 13. [Google Scholar]
  15. Han, S.; Shi, C.X.; Jiang, Z.W.; Xu, B.; Li, X.; Zhang, T.; Jiang, L.; Liang, X.; Zhu, Z.; Liu, J.; et al. Development and progress of CMA high-resolution land surface data assimilation system (HRCLDAS-V1.0). Adv. Meteor. Sci. Technol. 2018, 8, 102–108+116. [Google Scholar]
  16. Wang, L.J.; Zhang, X.N.; Fang, Y.H.; Xia, D.Z. Assessment of applicability of Chinese regional terrestrial meteorological element datasets in the upper Yangtze River Basin. Water Power 2017, 43, 18–22. [Google Scholar]
  17. Meng, X.Y.; Shi, C.X.; Liu, S.Y.; Wang, H.; Lei, X.H.; Liu, Z.H.; Ji, X.N.; Cai, S.Y.; Zhao, Q.D. CMADS Datasets and Its Application in Watershed Hydrological Simulation: A Case Study of the Heihe River Basin. Pearl River 2016, 37, 1–19. [Google Scholar]
  18. Zhang, J.P.; Wang, J.H.; Li, L.; Chen, M.X. Research on applicability of ERA-5 precipitation data in alpine and gorge region of Lancangjiang River Basin. Water Resour. Power 2021, 39, 14–17+5. [Google Scholar]
  19. Albergel, C.; Dutra, E.; Munier, S.; Calvet, J.-C.; Munoz-Sabater, J.; de Rosnay, P.; Balsamo, G. ERA-5 and ERA-Interim driven ISBA land surface model simulations: Which one performs better? Hydrol. Earth Syst. Sci. 2018, 22, 3515–3532. [Google Scholar] [CrossRef]
  20. Wei, S.; Cui, C.; Tong, S.L.; Guo, Y.G. Meteorological Satellite Precipitation Data Accuracy Test on Time Scale. Water Sav. Irrig. 2017, 55–58+62. [Google Scholar] [CrossRef]
  21. Li, H.; Yang, T.; He, Q.S.; Ren, W.W. Research on accuracy check and correction method of TRMM satellite precipitation data in Tianshan Mountains of Xinjiang. Res. Soil. Water Conserv. 2017, 24, 327–333. [Google Scholar]
  22. Xue, J.; Li, Z.S.; Li, Z.J.; Gui, J. Spatial and temporal distribution characteristics of atmospheric precipitation in Qilian Mountains based on TRMM data. Res. Soil. Water Conserv. 2021, 28, 204–210. [Google Scholar]
  23. Cao, D.J.; Zheng, Z.J.; Tang, S.H.; Wang, Y.X. Examination of satellite snow product dataset in northern China. J. Geogr. Inf. Sci. 2015, 17, 1341–1347. [Google Scholar]
  24. Zhang, C.; Hua, S.B.; Zhu, D.H.; Jin, S.L.; Li, H. Accuracy and runoff simulation evaluation of rainfall products fused with satellite and ground observations. Yangtze River 2019, 50, 70–76. [Google Scholar]
  25. Ni, Q.; Li, Y.; Sun, J.D.; Gao, Y.; Huang, Y.M. Application of fusion of satellite rainfall data and ground station information in hydrological models. Guangxi Water Resour. Hydropower Eng. 2019, 5, 17–22. [Google Scholar]
  26. Sun, L.Q.; Hao, Z.C.; Wang, J.H.; Nistor, I.; Seidou, O. Evaluation and calibration of TMPA satellite precipitation data. J. Hydraul. Eng. 2014, 45, 1135–1146. [Google Scholar]
  27. Yin, J.B.; Guo, S.L.; Wang, J.; Zhu, Q.; Zeng, Q.S.; Liu, H.W. Research on hydrological simulation based on Bayesian mode averaging method to fuse multi-source data. J. Hydraul. Eng. 2020, 51, 1335–1346. [Google Scholar]
  28. Khairul, I.M.; Mastrantonas, N.; Rasmy, M.; Koike, T.; Takeuchi, K. Inter-Comparison of Gauge-Corrected Global Satellite Rainfall Estimates and Their Applicability for Effective Water Resource Management in a Transboundary River Basin: The Case of the Meghna River Basin. Remote Sens. 2018, 10, 828. [Google Scholar] [CrossRef]
  29. Rashid, H.; Yang, K.; Zeng, A.; Ju, S.; Rashid, A.; Guo, F.; Lan, S. The Influence of Landcover and Climate Change on the Hydrology of the Minjiang River Watershed. Water 2021, 13, 3554. [Google Scholar] [CrossRef]
  30. Song, Y.; Zhang, J.; Meng, X.; Zhou, Y.; Lai, Y.; Cao, Y. Comparison Study of Multiple Precipitation Forcing Data on Hydrological Modeling and Projection in the Qujiang River Basin. Water 2020, 12, 2626. [Google Scholar] [CrossRef]
  31. Ao, X.; Zhai, Q.F.; Cui, Y.; Zhou, X.Y.; Yi, X.; Shen, L.D.; Zhao, C.Y.; Liu, R. Comparison and evaluation of three wind field reanalysis data in the coastal zone of Liaoning Province. Plateau Meteor. 2018, 37, 275–285. [Google Scholar]
  32. Li, J.; Yu, R.C.; Chen, H.M.; Yuan, W. Evaluation and analysis of three sets of reanalysis data on summer precipitation over mainland China. Meteor. Mon. 2010, 36, 1–9. [Google Scholar]
  33. Hamm, A.; Arndt, A.; Kolbe, C.; Wang, X.; Thies, B.; Boyko, O.; Reggiani, P.; Scherer, D.; Bendix, J.; Schneider, C. Intercomparison of Gridded Precipitation Datasets over a Sub-Region of the Central Himalaya and the Southwestern Tibetan Plateau. Water 2020, 12, 3271. [Google Scholar] [CrossRef]
  34. Liu, J.; Liu, S.Y.; Shangguan, D.H.; Xu, J.D. Applicability evaluation of three precipitation datasets CMADS, ITPCAS and TRMM 3B42 in Yulongkashi River Basin. J. N. China Univ. Water Resour. Electr. Power 2017, 38, 28–37. [Google Scholar]
  35. Meng, X.Y.; Wang, H.; Lei, X.H.; Cai, S.Y. Simulation, validation and analysis of hydrologically relevant components of Jingbo River basin based on CMDAS-driven SWAT model. Acta Ecol. Sin. 2017, 37, 7114–7127. [Google Scholar]
  36. Zhang, L.M.; Wang, H.; Meng, X.Y. Study on the application of CMADS-driven SWAT model in the Hun River Basin, Liaoning. J. N. China Univ. Water Resour. Electr. Power 2017, 38, 1–9. [Google Scholar]
  37. Xu, Y.; Zeng, Y.Z.; Wang, Y.C.; Li, X.T. Application of CMADS in SWAT model runoff simulation in Huotong Creek watershed. Pearl River 2021, 42, 1–9. [Google Scholar]
  38. Gu, X.C.; Xiao, S.Y.; Yang, G.; He, X.L.; Zhao, Q.; Zhang, L.; Li, D.B. Simulation of hydrological processes in the Manas River basin based on CMADS and SWAT models. J. Water Resour. Water Eng. 2021, 32, 116–123. [Google Scholar]
  39. Tian, Y.; Xiao, G.R. Simulation of runoff in Aojiang River basin based on SWAT model driven by CMADS. J. Yangtze River Sci. Res. Inst. 2020, 37, 27–32. [Google Scholar]
  40. Hong, M.; Lin, H.D. Applicability of CMADS precipitation data in reservoir-controlled watersheds in temperate East Asian monsoon climate zones: The Chaobai River and Dongyang River basins as examples. J. Jilin Univ. 2021, 51, 833–842. [Google Scholar]
  41. Zhang, C.H.; Wang, B.L. Evaluation of SWAT model simulation effects driven by CMADS and traditional weather station data—A case study of the Bitterwater River Basin. China Rural. Water Hydropower 2018, 6, 52–57. [Google Scholar]
  42. Guo, D.; Wang, H.; Zhang, X.; Liu, G. Evaluation and Analysis of Grid Precipitation Fusion Products in Jinsha River Basin Based on China Meteorological Assimilation Datasets for the SWAT Model. Water 2019, 11, 253. [Google Scholar] [CrossRef]
  43. Xue, Y.T.; Sun, W.J.; Zou, C.W.; Gao, S.; Chen, J.P. Study on surface source pollution in Chishui River basin based on SWAT model. J. Subtrop. Resour. Environ. 2020, 15, 17–23. [Google Scholar]
  44. Yuan, Z.; Xu, J.; Meng, X.; Wang, Y.; Yan, B.; Hong, X. Impact of Climate Variability on Blue and Green Water Flows in the Erhai Lake Basin of Southwest China. Water 2019, 11, 424. [Google Scholar] [CrossRef]
  45. Liu, J.L.; Xu, J.J.; Yuan, Z.; Zhou, M.Y. Application of SWAT model driven by CMADS in water cycle simulation of Erhai Basin, Yunnan Province. Yangtze River 2020, 51, 65–72. [Google Scholar]
  46. Zhang, Q.; Li, Y.Q. Climate change characteristics of precipitation and rainy days in southwest China in the last 48 years. Plateau Meteor. 2014, 33, 372–383. [Google Scholar]
  47. Zhang, C.; Wu, S.H. Analysis of water vapor sources of extreme summer precipitation in southwest China. J. Nat. Resour. 2021, 36, 9. [Google Scholar]
  48. Wang, D. Analysis of Vegetation Cover Changes in Southwest China and Its Response to Climate Characteristics at Different Time Scales. Master’s Thesis, Northwest Normal University, Lanzhou, China, 2014. [Google Scholar]
  49. Wang, D.; Zhang, B.; Zhang, D.F.; Zhao, Y.F.; Li, X.Y.; Yin, H.X. Analysis of spatial and temporal patterns of drought in southwest China from 1960 to 2011. Bull. Soil Water Conserv. 2013, 33, 152–156+2+333. [Google Scholar]
  50. Ao, T.Q.; Takeuchi, K.; Ishidaira, H.; Fukami, K.; Kaneki, M. The Naka River floods analyses by BTOPMC method. In Proceedings of the International Symposium on Floods and Droughts, Nanjing, China, 18–21 October 1999; pp. 414–420. [Google Scholar]
  51. Shrestha, S.; Bastola, S.; Babel, M.S.; Dulal, K.N.; Magome, J.; Hapuarachchi, H.A.P.; Kazama, F.; Ishidaira, H.; Takeuchi, K. The assessment of spatial and temporal transferability of a physically based distributed hydrological model parameters in different physiographic regions of Nepal. J. Hydrol. 2007, 347, 153–172. [Google Scholar] [CrossRef]
  52. Hapuarachchi, H.A.P.; Takeuchi, K.; Fukami, K.; Inomata, H.; Zhou, M. Importance of rainfall measurements for the flood forecasting of the Mekong River basin. In Proceedings of the Annual Mekong Flood Forum–5, Ho Chi Minh City, Vietnam, 17–18 May 2007. [Google Scholar]
  53. Takeuchi, K.; Ao, T.Q.; Ishidaira, H. Introduction of block-wise use of TOPMODEL and Muskingum–Cunge method for the hydroenvironmental simulation of a large ungauged basin. Hydrol. Sci. J. 1999, 44, 633–646. [Google Scholar] [CrossRef]
  54. Zhang, H.B.; Ao, T.Q.; Wang, H.T.; Liu, X.; Li, X.; Li, S.D. Application of BTOPMC in early warning forecasting of torrential rainfall floods in mountainous watersheds. J. Sichuan Univ. 2014, 46, 12–19. [Google Scholar]
  55. Jiang, W.W.; Yu, J.S.; Ryosuke, A.; Chen, J.P.; Jiang, Q.; Li, L.Y. Flood forecasting in small mountainous watersheds based on coupled hydrodynamic model. J. China Hydrol. 2020, 40, 28–35. [Google Scholar]
  56. Free instructions for using CMADS dataset. Pearl River 2016, 37, 19.
  57. Hou, W.J.; Gao, J.B. Simulating runoff generation and its spatialcorrelation with environmental factorsin Sancha River Basin:The southern source of the Wujiang River. J. Geog. Sci. 2019, 29, 432–448. [Google Scholar] [CrossRef]
  58. Zhu, J.M. Comparative Application of Xinanjiang, SWAT and BTOPMC Models. Master’s Thesis, South China Agricultural University, Guangzhou, China, 2016. [Google Scholar]
  59. Aotianqi, T.Q. Development of a Distributed Hydrological Model for Large River Basins and Its Application to Southeast Asian Rivers. Ph.D. Thesis, University of Yamanashi, Kofu, Japan, 2001. [Google Scholar]
  60. Ishidaira, H.; Takeuchi, K.; Magome, J.; Kudo, M. Effect of Spatial and Temporal Resolution of Precipitation Data on the Accuracy of Long-Term; International Association of Hydrological Science: Sapporo, Japan, 2003; p. 186. [Google Scholar]
  61. Hapuarachchi, H.; Kiem, A.S.; Takeuchi, K.; Ishidaira, H.; Magome, J.; Tianque, A. Hydrological modeling and flood simulation of the Fuji River basin in Japan. In Proceedings of the 7th International River Symposium, Brisbane, Australia, 8–10 September 2005. [Google Scholar]
  62. Ao, T.Q.; Ishidaira, H.; Takeuchi, K.; Kiem, A.S.; Yoshitari, J.; Fukami, K.; Magome, J. Relating BTOPMC model parameters to physical features of MOPEX basins. J. Hydrol. 2006, 320, 84–102. [Google Scholar] [CrossRef]
  63. Wang, G.; Hapuarachchi, P.; Ishidaira, H.; Kiem, A.S.; Takeuchi, K. Estimation of Soil Erosion and Sediment Yield During Individual Rainstorms at Catchment Scale. Water Resour. Manag. 2009, 23, 1447–1465. [Google Scholar] [CrossRef]
  64. Wang, G.; Hapuarachchi, H.A.P.; Takeuchi, K.; Ishidaira, H. Grid-based distribution model for simulating runoff and soil erosion from a large-scale river basin. Hydrol. Process 2010, 24, 641–653. [Google Scholar] [CrossRef]
  65. Joyce, R.J.; Janowiak, J.E.; Arkin, P.A.; Xie, P.P. CMORPH: A Method that Produces Global Precipitation Estimates from Passive Microwave and Infrared Data at High Spatial and Temporal Resolution. J. Hydrometeorol. 2004, 5, 287–296. [Google Scholar] [CrossRef]
  66. Wang, Y.D.; Chen, H.; Liu, C.R.; Ding, Y. Applicability of two remote sensing precipitation products, ITPCAS and CMORPH, in Shaanxi region. Arid. Zone Res. 2018, 35, 579–588. [Google Scholar]
  67. Liao, J.; Xu, B.; Zhang, H.Z. Evaluation of experimental effects of fusing precipitation data from ground-based stations with CMORPH satellite inversion precipitation products. J. Trop. Meteorol. 2013, 29, 865–873. [Google Scholar]
Figure 1. Overview map of the study area.
Water 17 01802 g001
Figure 2. Structure of BTOPMC model.
Water 17 01802 g002
Figure 3. Comparison of CMADS and measured annual precipitation and annual precipitation accumulation curve.
Water 17 01802 g003
Figure 4. CMADS data and month-by-month precipitation at measured.
Water 17 01802 g004
Figure 5. Absolute error of month-by-month precipitation between CMADS and measured sites.
Water 17 01802 g005
Figure 6. Average monthly precipitation at CMADS and measured sites, 2008–2016.
Water 17 01802 g006
Figure 7. Scatter plot of CMADS versus measured data on a monthly scale.
Water 17 01802 g007
Figure 8. CMADS (top) and station (bottom) measured precipitation map.
Water 17 01802 g008
Figure 9. Error map of daily precipitation between CMADS and measured stations.
Water 17 01802 g009
Figure 10. Scatter plot of CMADS vs. measured data on a daily scale.
Water 17 01802 g010
Figure 11. Probability density distribution of CMADS data and station precipitation data.
Water 17 01802 g011
Figure 12. Error distribution of CMADS data under different precipitation intensities.
Water 17 01802 g012
Figure 13. CMADS precipitation error distribution map.
Water 17 01802 g013
Figure 14. Scenario 1 runoff simulation results.
Water 17 01802 g014
Figure 15. Scenario 2 runoff simulation process.
Water 17 01802 g015
Figure 16. Scenario 3 runoff simulation process.
Water 17 01802 g016
Table 1. Mechanism comparison between the SWAT model and BTOPMC model [58].
SWAT ModelBTOPMC Model
Model typeResponse unit hydrological modelGrid-distributed hydrological model
Runoff moduleSurface runoff was calculated based on the SCS curve number method or Green-Ampt infiltration method.Based on the TOPMODEL’s excess storage runoff theory, combined with the topographic index, the runoff is calculated.
Confluence moduleThe Manning formula is used to calculate the flow and velocity of the river section, and the characteristic river length method or the Muskingum method is used to calculate the river flow.Combining TOPMODEL and Muskingum–Cunge (M–C) method for confluence.
Evapotranspiration calculationSupport Hargreaves, Priestly–Taylor, Penman–Monteith, and other methods.The Shuttleworth–Wallace (S–W) model was used.
ApplicabilitySmall and medium-sized watersheds are sensitive to the HRU division.Large watershed, strong adaptability of grid division
Table 2. Precipitation data accuracy evaluation system.
Indicator CategoryUnitEvaluation IndicatorsCalculation FormulaIdeal Value
Indicators for evaluating the likelihood of precipitation events/Probability of detection POD = A ( A + B ) 1
False alarm rate FAR = C ( A + C ) 0
Critical Success Rate TS = A ( A + B + C ) 1
Probability density function statistics S S = i = 1 n min ( Z m i , Z o i ) 1
Quantitative evaluation indicatorsmmAbsolute error E = P g P s 0
Relative Error R B = ( P s P g ) P g × 100 % 0
Root mean square error RMSE = ( P s P g ) 2 N 0
Correlation coefficient CC = COV ( P s P g ) σ P s σ P g 1
Decision factor R 2 = i = 1 N ( P s P ¯ s ) ( P g P ¯ g ) i = 1 N ( P s P ¯ s ) 2 ( P g P ¯ g ) 2 2 1
Notes: A is the number of days when precipitation was measured at both the station and CMADS; B is the number of days when precipitation was measured at the station but not in CMADS, and C is the number of days when precipitation was present in CMADS data but not at the station. Ps is the precipitation in CMADS data, Pg is the measured precipitation at the station, N is the total number of samples, COV is the covariance, and σ is the standard deviation. Zmi and Zoi are the probabilities of occurrence of CMADS data and measured data in the ith data segment, respectively; n is the length of the probability series. In this paper, n is taken as 100, i.e., it is divided into 100 parts equally according to the magnitude of precipitation in the precipitation series, and then the frequency of occurrence of the original value in each part is calculated as the corresponding probability value.
Table 3. Precipitation intensity classification criteria.
Type of PrecipitationLight RainMedium RainHeavy RainRainstorm
mm/day<10[10,25)[25,50)≥50
Table 4. Absolute errors between CMADS and measured annual precipitation from 2008 to 2016.
Year200820092010201120122013201420152016
Absolute error (mm/year)206.81373.13−464.57−243.4−563.48657.912167.18878.41873.02
Table 5. Quantitative evaluation results of CMADS data on a monthly scale.
Time ScaleQuantitative Evaluation Indicators
RBRMSECC R 2
Monthly scale−1910.8080.8170.668
Table 6. Quantitative evaluation results on a daily scale.
Indicators for Evaluating the Likelihood of Precipitation EventsQuantitative Evaluation Indicators
PODFARTSSSRBRMSECC R 2
0.8790.1960.7240.941−190.1590.7550.57
Table 7. Evaluation results of CMADS data under different precipitation intensity conditions.
Rain TypeSample SizeIndicators for Evaluating the Likelihood of Precipitation EventsQuantitative Evaluation Indicators
PODFARTSRBRMSECC
Light rain7240.7980.2160.683170.1770.417
Medium Rain4080.650.2330.548−180.4870.235
Heavy Rain1730.4270.3220.355−391.5160.269
Rainstorm670.3280.3170.275−435.3610.304
Table 8. BTOPMC model rate determination and validation results under the three scenarios.
ScenarioCalibration (2008–2009)Validation (2010–2011)
NashVolNashVol
Scenario 166.80%63.13%54.50%60.90%
Scenario 281.00%88.60%70.20%81.40%
Scenario 383.90%88.02%74.50%83.50%
Disclaimer/Publisher’s Note: The statements, opinions and data contained in all publications are solely those of the individual author(s) and contributor(s) and not of MDPI and/or the editor(s). MDPI and/or the editor(s) disclaim responsibility for any injury to people or property resulting from any ideas, methods, instructions or products referred to in the content.

