Article

Transcriptional Differences in Gills Provide Insights into the Environmental Acclimatization of Wild Topmouth Gudgeon (Pseudorasbora parva) from Freshwater Invasion to Saline–Alkali Waters

1
Hubei Hongshan Laboratory, College of Fisheries, Huazhong Agricultural University, Wuhan 430070, China
2
Engineering Research Center of Green Development for Conventional Aquatic Biological Industry in the Yangtze River Economic Belt, Ministry of Education, Wuhan 430070, China
3
Hubei Provincial Engineering Laboratory for Pond Aquaculture, Wuhan 430070, China
4
College of Life Sciences and Technology, Tarim University, Alar 843300, China
*
Author to whom correspondence should be addressed.
Water 2025, 17(12), 1794; https://doi.org/10.3390/w17121794
Submission received: 30 April 2025 / Revised: 9 June 2025 / Accepted: 12 June 2025 / Published: 15 June 2025

Abstract

:
Topmouth Gudgeon (Pseudorasbora parva), a typical invasive fish worldwide, has successfully invaded various aquatic ecosystems and colonized saline–alkali waters from freshwater due to its broad environmental tolerances. However, the molecular mechanisms of adaptation to saline–alkali stress for P. parva remain poorly characterized. To explore the potential genetic mechanisms, we conducted differential gene expression analysis using gill transcriptome of wild P. parva populations collected from four waters with different salinity–alkalinity levels. Comparative transcriptomics analysis showed that DEGs involved in osmoregulation, ano6, cftr, aqp1, and aqp3, were down-regulated; DEGs related to ammonia excretion, Rhcg and Rhbg, were up-regulated; DEGs for acid–base accommodation, nhe2, slc4a1, and ca2, were down-regulated while ca4 was up-regulated; and immune-system-related DEGs, il8 and il17, were down- and up-regulated, respectively, in a high saline–alkaline water environment. The DEGs were enriched in multiple KEGG pathways, such as the ribosome, thermogenesis, oxidative phosphorylation, necroptosis, and HIF-1 signaling pathways. In addition, more DEGs were significantly enriched in immune-disease-related pathways in high saline–alkaline water populations. This suggests that P. parva exposed to chronic saline–alkali stress, despite survival, still needed immune system regulation to defend against potential diseases. These results revealed the gill molecular mechanisms underlying P. parva saline–alkaline adaptation and offered valuable insights into the development of saline–alkaline water aquaculture fisheries

1. Introduction

Topmouth Gudgeon (Pseudorasbora parva), a small cyprinid species, originated in East Asia, such as in China, Korea, and Japan [1]. It initially invaded Romanian waters in the 1960s, mainly as an unintentional by-product of the introduction of economic fish [2]. Nevertheless, due to the absence of natural predators and effective management, P. parva has invaded the freshwaters of over 30 countries in Asia, Europe, Africa, and Oceania [3,4]. Therefore, the range of expansion of P. parva is regarded as one of the most paradigmatic cases of global fish invasion [5]. This omnivorous fish thrives in diverse aquatic environments, particularly well-vegetated ponds and small lakes [5]. It exhibits remarkable plasticity in life history traits and habitat utilization, enabling successful invasion and colonization [6]. Although primarily regarded as a freshwater fish, P. parva has become dominant among invasive species and was extensively distributed in the Tarim River—China’s longest inland river with high salinity and alkalinity [7]. Additionally, our long-term monitoring further revealed that their distribution abundance varied under different salinity and alkalinity conditions.
Saline–alkaline water constitutes a substantial proportion of global water resources, with extensive distribution in northwest, northeast, and north China [8,9]. However, its utilization remains insufficient [10]. Moreover, the intensification of freshwater salinization threatens hydrobios, particularly the oligohaline [11]. High salinity, alkalinity, and pH and complex ionic composition in saline–alkaline water environments impose multifaceted stresses on aquatic survival, growth, and reproduction [12,13,14]. Changes in salinity and alkalinity trigger alterations in key physiological indicators, such as the oxygen consumption rate, osmotic pressure, ion concentration, and acid–base balance of aquatic animals [15]. In teleost, the gill, kidney, and intestine exert pivotal functions in the regulation of osmotic pressure. The morphological structures of these organs can experience significant modifications as the fishes adapt to complex external environments, which is essential for developing their adaptive capacity [16,17]. As a unique osmoregulatory organ in fish, the gill is directly exposed to the external environment and mediates diverse physiological processes, such as gas exchange, ion regulation, osmoregulation, acid–base balance, ammonia excretion, and immune defenses [18]. The gill epithelium has abundant ionocytes with specialized membrane structures, and its top and base are assembled with different ion channels (sodium channels, potassium channels, chloride channels, calcium channels, etc.), transporters (Na+/K+ exchanger, Na+/K+/2Cl cotransporter, anoctamin, aquaporin, cystic fibrosis transmembrane conductance regulator, etc.), and transporter enzymes (Na+/K+-ATPase), which collectively orchestrate the above-mentioned functions [19,20,21].
In general, short-term fluctuations in habitat physicochemical characteristics potentially induce plastic acclimation responses, mainly including increased activity of cellular defense mechanisms such as the up-regulation of aquaporin and heat shock proteins [22,23,24,25]. On the other hand, long-term responses to potential sublethal conditions may include heritable adaptations, leading to enhanced population fitness through evolutionary processes in stressful environments [26,27]. Therefore, investigating molecular changes in gills can deepen our understanding of the osmoregulatory processes underlying fish saline–alkaline adaptation. In recent years, transcriptome analysis using gill RNA sequencing has been performed on diverse fish species, mainly including estuarine tapertail anchovy (Coilia nasus) [28], Nile tilapia (Oreochromis niloticus) [29], spotted sea bass (Lateolabrax maculatus) [30], Tibetan naked carps (Gymnocypris przewalskii) [31], half-smooth tongue sole (Cynoglossus semilaevis) [32], marine medaka (Oryzias melastigma) [33], stinging catfish (Heteropneustes fossilis) [34], greater amberjack (Seriola dumerili) [35], Hilsa shad (Tenualosa ilisha) [36], and black-chinned tilapia (Sarotherodon melanotheron) [37], which revealed the effects of saline–alkali stress on gene expression and facilitated the subsequent development of industries. However, as a traditional freshwater fish, there is an absence of gill transcriptomic data to characterize gene expression changes in P. parva in response to saline–alkali stress.
Therefore, this study aimed to reveal all potential gene expression patterns of P. parva under saline–alkali stress. In this study, we conducted second-generation high-throughput sequencing and de novo assembly of the transcriptomes of the P. parva. Our findings provide valuable insights into the adaptation mechanisms of P. parva in saline–alkaline water environments, and establish a theoretical foundation for the future exploitation of saline–alkaline water aquaculture fisheries.

2. Materials and Methods

2.1. Ethics Statement

This study was approved by the Institutional Animal Care and Use Ethics Committee of Huazhong Agricultural University (HZAUFI-2019-043). All fish samples were collected and handled in accordance with approved guidelines.

2.2. Sample Collection and Preparation

Three P. parva populations inhabiting saline waters were sampled at the STR (source of the Tarim River, salinity 1.2), YBZ (YingBazha, salinity 6.12), and TL (Tarim River, salinity 9.53) in Xinjiang, China (Figure 1), respectively. In addition, one P. parva population was collected from its native habitat in TIR (Taizi River, salinity 0.16), Liaoning, China. Detailed physical and chemical indicators of the sampling sites are presented in Table S1. P. parva captured at each sampling site were weighed and measured, and then three individuals were randomly selected for gill tissue collection after sacrifice by rapid freezing. Gill tissue samples were immediately immersed in RNAlater solution (Simgen, Hangzhou, China), stored at −20 °C, and transferred to −80 °C storage in the laboratory until sequencing.

2.3. RNA Extraction, Library Preparation, and RNA Sequencing

Total RNA was extracted from gill tissues using the Trizol Reagent (Invitrogen, Carlsbad, CA, USA) following the manufacturer’s protocols. Subsequently, the concentration and quality of the obtained RNA were assessed using a NanoDrop 2000 spectrophotometer (Thermo Fisher Scientific Inc., Waltham, MA, USA). Additionally, RNA integrity was confirmed via an Agilent 2100 Bioanalyzer (Thermo Scientific, Waltham, MA, USA) with the RNA 6000 Nano kit (catalog number 5067-1511, Agilent Technologies, Santa Clara, CA, USA). RNA samples with RIN values ranging from 6.7 to 8.6 were selected for subsequent experiments. The mRNA harboring polyA tails were selectively enriched using Oligo(dT) magnetic beads (New England Biolabs, Beverly, MA, USA). Double-stranded cDNA libraries were subsequently generated with the NEBNext Ultra II RNA Library Prep Kit (#E7770, New England Biolabs, Beverly, MA, USA) for Illumina, following the manufacturer’s instructions. After undergoing selection and purification processes utilizing AMPure XP beads (Beckman Coulter, Brea, CA, USA), the eligible libraries were subjected to Illumina sequencing with 150 bp paired end reads on the Illumina NovaSeq 6000 platform (Illumina Inc., San Diego, CA, USA) by Shanghai Personal Biotechnology Co. Ltd (Shanghai, China). Three biological replicates were included for each site.

2.4. De Novo Assembly and Functional Annotation

Raw reads were processed using fastp (v0.22.0) and Cutadapt to trim the adaptor sequences from the 3’ ends and filter out reads less than 50 bp in length and with an average quality score below Q20. All the downstream analyses were based on the resulting clean reads. After the data filtration, high-quality clean reads of all samples were assembled using Trinity (v2.15.1) with min_kmer_cov set to 3 and all other parameters at the default setting, to generate a set of unigene sequences for further analysis [38]. For each gene, the longest assembled transcript was designated as the unigene, serving as reference sequences for the wild P. parva gill transcriptome.
Functional annotation of the non-redundant contigs was performed by aligning them against all protein sequences in the UniProt database (https://www.uniprot.org/, accessed on 20 November 2022) of the Animal Big Data Repository (a manually integrated database of data for all known animal species), including NR (NCBI non-redundant protein sequences, http://www.ncbi.nlm.nih.gov/, accessed on 23 November 2022), GO (Gene Ontology, http://geneontology.org/, accessed on 25 November 2022), KEGG (Kyoto Encyclopedia of Genes and Genomes, http://www.kegg.jp/, accessed on 26 November 2022), eggnog (evolutionary genealogy of genes: Non-supervised Orthologous Groups, http://eggnog.embl.de/, accessed on 24 November 2022), Swiss-Prot (a manually annotated and reviewed protein sequence database, http://www.uniprot.org/help/uniprotkb, accessed on 20 November 2022), and Pfam (Protein family: http://pfam.xfam.org/, accessed on 24 November 2022). Pfam annotations were performed using the hmmscan tool within HMMER (v3.3.4) [39]. The GO annotations were conducted with Blast2GO (v2.5) [40]. KAAS (KEGG Automatic Annotation Server: http://www.genome.jp/kegg/kaas/, accessed on 26 November 2022) was employed for the KEGG annotations [41]. The detailed procedures, parameters, and quality control process for the software involved are provided in Table S2.

2.5. Identification of Differentially Expressed Genes

RSEM (v1.3.0) was utilized to quantify unigene read counts and subsequently convert them into FPKM (expected number of fragments per kilobase of transcript per million fragments mapped) [42,43]. Simultaneously, to investigate the effects of salinity and alkalinity on gene expression patterns of P. parva, differential gene expression analyses across populations at different sites were conducted using DEGseq (v 1.38.3) based on a negative binomial generalized linear model (GLM) [44]. Transcripts with |log 2 FoldChange| > 1 and a significant p-value < 0.05 were considered differentially expressed between populations. Based on the functional annotations of unigenes, the potential functions of the differentially expressed genes (DEGs) were deduced to identify candidate genes related to salinity and alkalinity acclimation. GO enrichment analysis was performed using topGO (v2.50.0) [45], and KEGG pathway enrichment analysis was performed using clusterProfiler (v4.6.0) [46], with a significant enrichment standard of p-value < 0.05.

2.6. Gene Co-Expression Network Construction

To characterize correlated gene expression patterns across the saline–alkaline environmental samples, a weighted gene co-expression network analysis (WGCNA) was implemented [47], with stress-responsive modules (SRMs) identified via the WGCNA R package (v1.73) in ImageGP (http://www.ehbio.com/ImageGP/, accessed on 16 May 2025) [48]. Module detection utilized the dynamic tree cut method on gene dendrograms, with parameters set as minimum module size = 25, cutting height = 0.85, and deepSplit = 2. Intramodular connectivity (Bicor, cor-Type Pearson), quantifying a gene’s connection strength to module members, was employed to assess the hubness with modules. Nodes (gene) were interconnected via edges with weighted values, and SRMs were identified through a hypergeometric test for gene set overrepresentation (p-value < 0.05).

2.7. Gene Expression RT-qPCR Validation

To validate the accuracy of RNA-seq results, ten DEGs were randomly selected for qRT-PCR using ABI Stepone Plus Real-Time PCR System with Tower (ABI, Waltham, MA, US). Gene sequences were obtained from the assembled transcriptome, and primers (for detailed sequences, see Table S3) were designed using NCBI Primer-BLAST (https://www.ncbi.nlm.nih.gov/tools/primer-blast/, accessed on 23 November 2022). Total RNA was reverse-transcribed into cDNA using a YEASEN reverse transcription kit following the manufacturer’s protocol (11141ES, YEASEN, Shanghai, China). The RT-qPCR analyses of the genes were performed with a Hieff qPCR SYBR Green Master Mix (High Rox Plus) kit (11203ES, YEASEN, Shanghai, China). In a 20 μL reaction volume, 10 μL Hieff qPCR SYBR Green Master Mix (High Rox Plus), 0.4 μL of each forward and reverse primer (10 μM), and 2 μL of cDNA template were used. Thermal cycling conditions were 95 °C for 5 min, followed by 40 cycles of denaturation at 95 °C for 10 s, annealing at 60 °C for 20 s, and elongation at 72 °C for 30 s. Each sample was analyzed in triplicate, and for each gene, negative controls were run using no cDNA. Melting curve analysis was used to confirm single-product amplification. Relative expression levels were normalized to the internal control gene Rpl13a [49,50] and calculated by the 2 −∆∆Ct method [51].

2.8. Statistical Analysis

One-way analysis of variance (ANOVA) was implemented to determine the significant differences in the experimental data for each treatment between the four populations. Statistical analysis and mapping were conducted on the OmicShare Analysis platform (http://www.omicshare.com/tools, accessed on 20 April 2025) [52].

3. Results

3.1. Overview of Transcriptome Profiles

Details on the acquisition of raw RNA-seq data are provided in the Data Availability Statement, and the summary of transcriptome sequencing results are presented in Table S4. In brief, RNA sequencing of the 12 samples produced approximately 40.20 million to 49.06 million 150 bp paired-end reads. After the data filtration, the high-quality clean reads were consolidated and de novo assembled into about 30.70 million transcripts and 12.02 million unigenes for P. parva. The N50 of the assembled genes was 1582 bp, with a mean length of 968.82 bp and a maximum length reaching 26,244 bp. Moreover, the sequencing data demonstrated a superior quality level, as evidenced by the Q30 base percentage surpassing 92.27%. These findings validated the high quality of the transcriptome assembly for the four P. parva populations, thereby affirming the reliability of RNA-seq for the subsequent differential expression analysis.

3.2. Unigenes and Functional Annotation

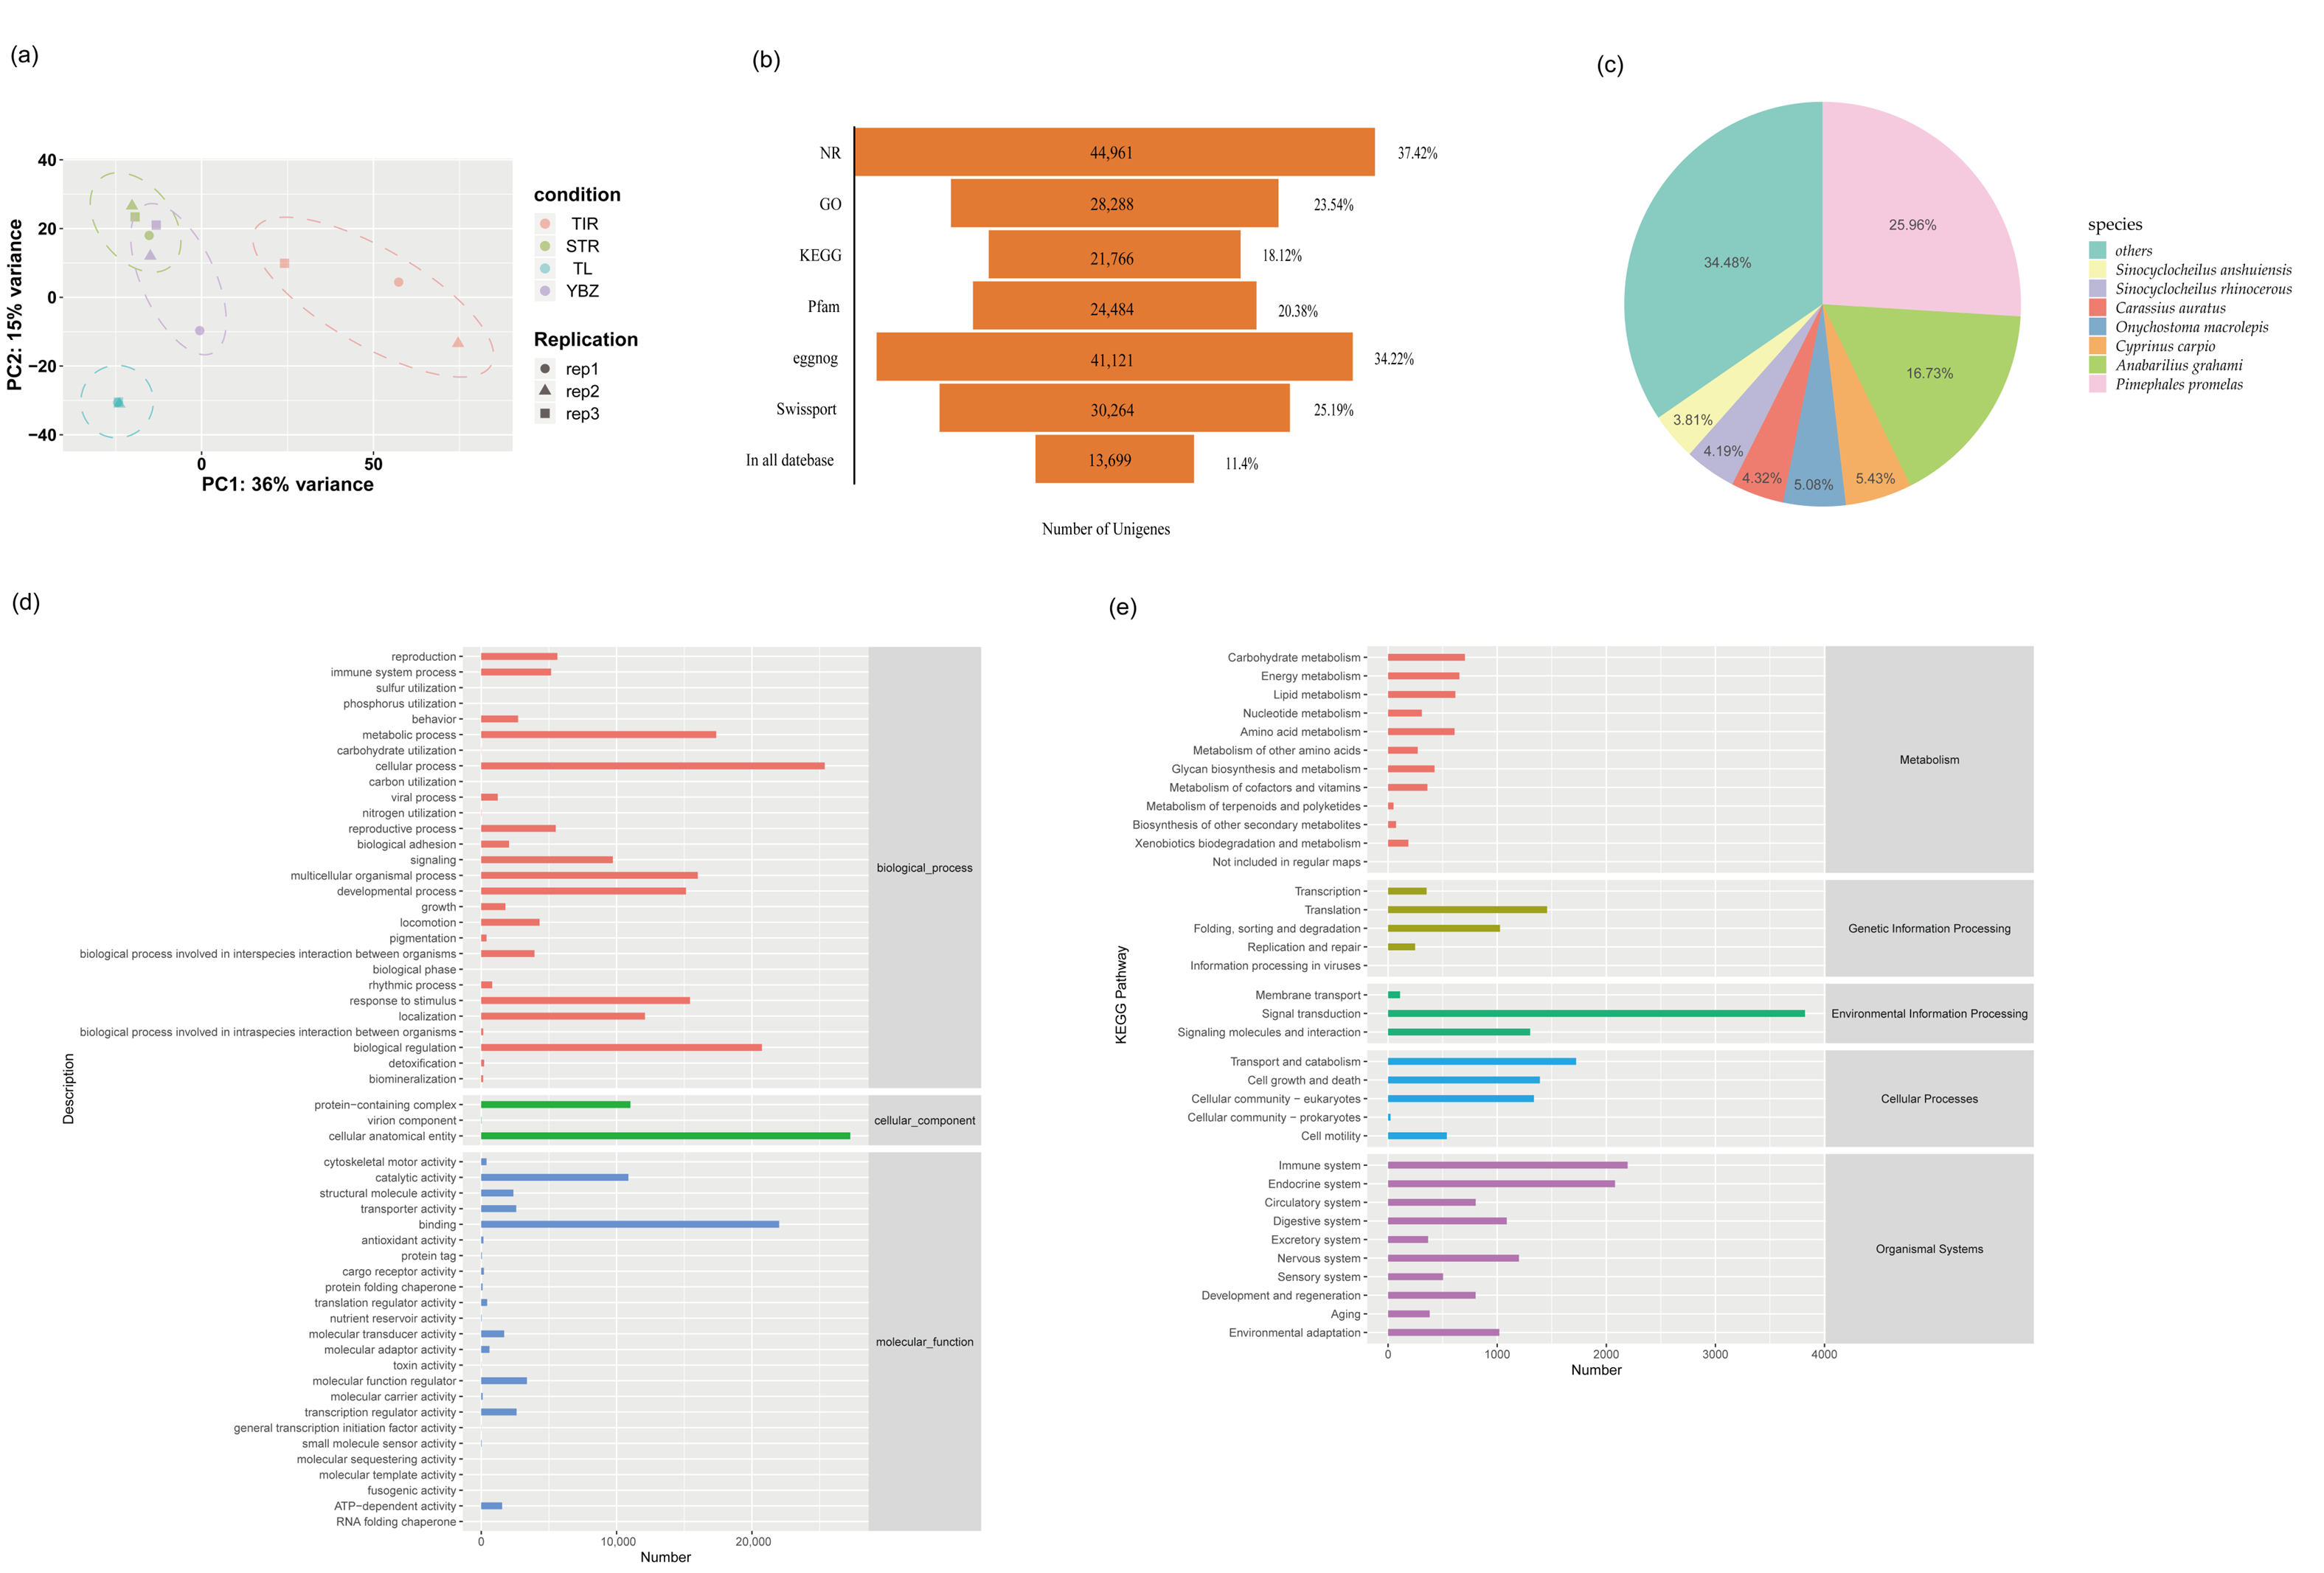
Principal component analysis (PCA, Figure 2a) revealed that P. parva differentially expressed genes clustered differently under varying salinity–alkalinity levels. Significant differences were observed among the four populations. Specifically, TIR exhibited a predominantly positive association with STR and YBZ but a partial negative correlation with TL. This observation indicated that saline–alkali stress profoundly influenced the distribution patterns of P. parva populations. Unigenes were annotated with six functional databases (NR, GO, KEGG, Pfam, eggnog, and Swiss-Port). Among all the unigenes, 13,699 unigenes were annotated simultaneously in these six databases (Figure 2b). The NR database contributed the most annotations (37.42%), followed by GO (28,288, 23.54%) and KEGG (21,766, 18.12%). NR annotation results (Figure 2c, Table S5) showed that over 65.52% of annotations were associated with Cyprinidae, with Pimephales promelas accounting for 25.96%. GO annotation results indicated that unigenes were primarily annotated to “cellular process”, “biological regulation”, and “metabolic process” in Biological Process; “cellular anatomical entity” in Cellular Component; and “binding” in Molecular Function (Figure 2d). KEGG annotation highlighted enrichment in “signal transduction” in Environmental Information Processing, “immune system” and “endocrine system” in Organismal Systems, “transport and catabolism” and “cell growth and death” in Cellular Processes, and “carbohydrate metabolism” and “energy metabolism” in Metabolism (Figure 2e).

3.3. Comparison of DEGs Under Saline Conditions

To explore the gene expression profiles under saline–alkali stress, the unigenes were analyzed for differential expression. The species-specific expression patterns were exhibited by a heatmap after the Z-score normalization of gene expression values across samples (Figure 3a). The clustering of both genes and samples demonstrated distinct gene expression patterns across groups. In this study, a total of nine clusters were identified, with the expression in clusters 2, 6, 8, and 9 under the TL condition resembling that of YBZ, which was divergent from TIR and/or STR (Figure 3b, Table S6). These results suggest that the expression statuses of genes contained in these clusters were profoundly influenced by saline–alkaline conditions. Combined with the PCA results, this indicated intra-group variability in the YBZ1 sample, necessitating its exclusion from subsequent differential gene analyses to preclude interference.
Moreover, we further analyzed the gene expression levels of four P. parva populations exposed to different saline–alkaline environments, with pairwise comparisons conducted among the TIR, STR, YBZ, and TL populations (Figure 3c). Compared with TIR, 8759 (2817 up-regulated, 5942 down-regulated), 8935 (1700 up-regulated, 7235 down-regulated), and 17,190 (5841 up-regulated, 11,349 down-regulated) DEGs were identified in STR, YBZ, and TL, respectively. These results indicate a positive correlation, i.e., the higher the salinity–alkalinity level, the greater the quantity of DEGs, with down-regulated DEGs consistently exceeding up-regulated DEGs, except for the comparison between YBZ and TL. In contrast to TIR, there were 2897 co-DEGs in saline–alkaline water populations (STR, YBZ, and TL) (Figure 3d). Only five differential genes were co-expressed in the comparison among the four populations. Three of them were annotated as ano6 (anoctamin-6, as well as TMEM16F), arhgap20 (rho GTPase-activating protein 20), and rin2 (Ras and Rab interactor 2).

3.4. GO Terms and KEGG Pathways Enrichment Analysis of DEGs

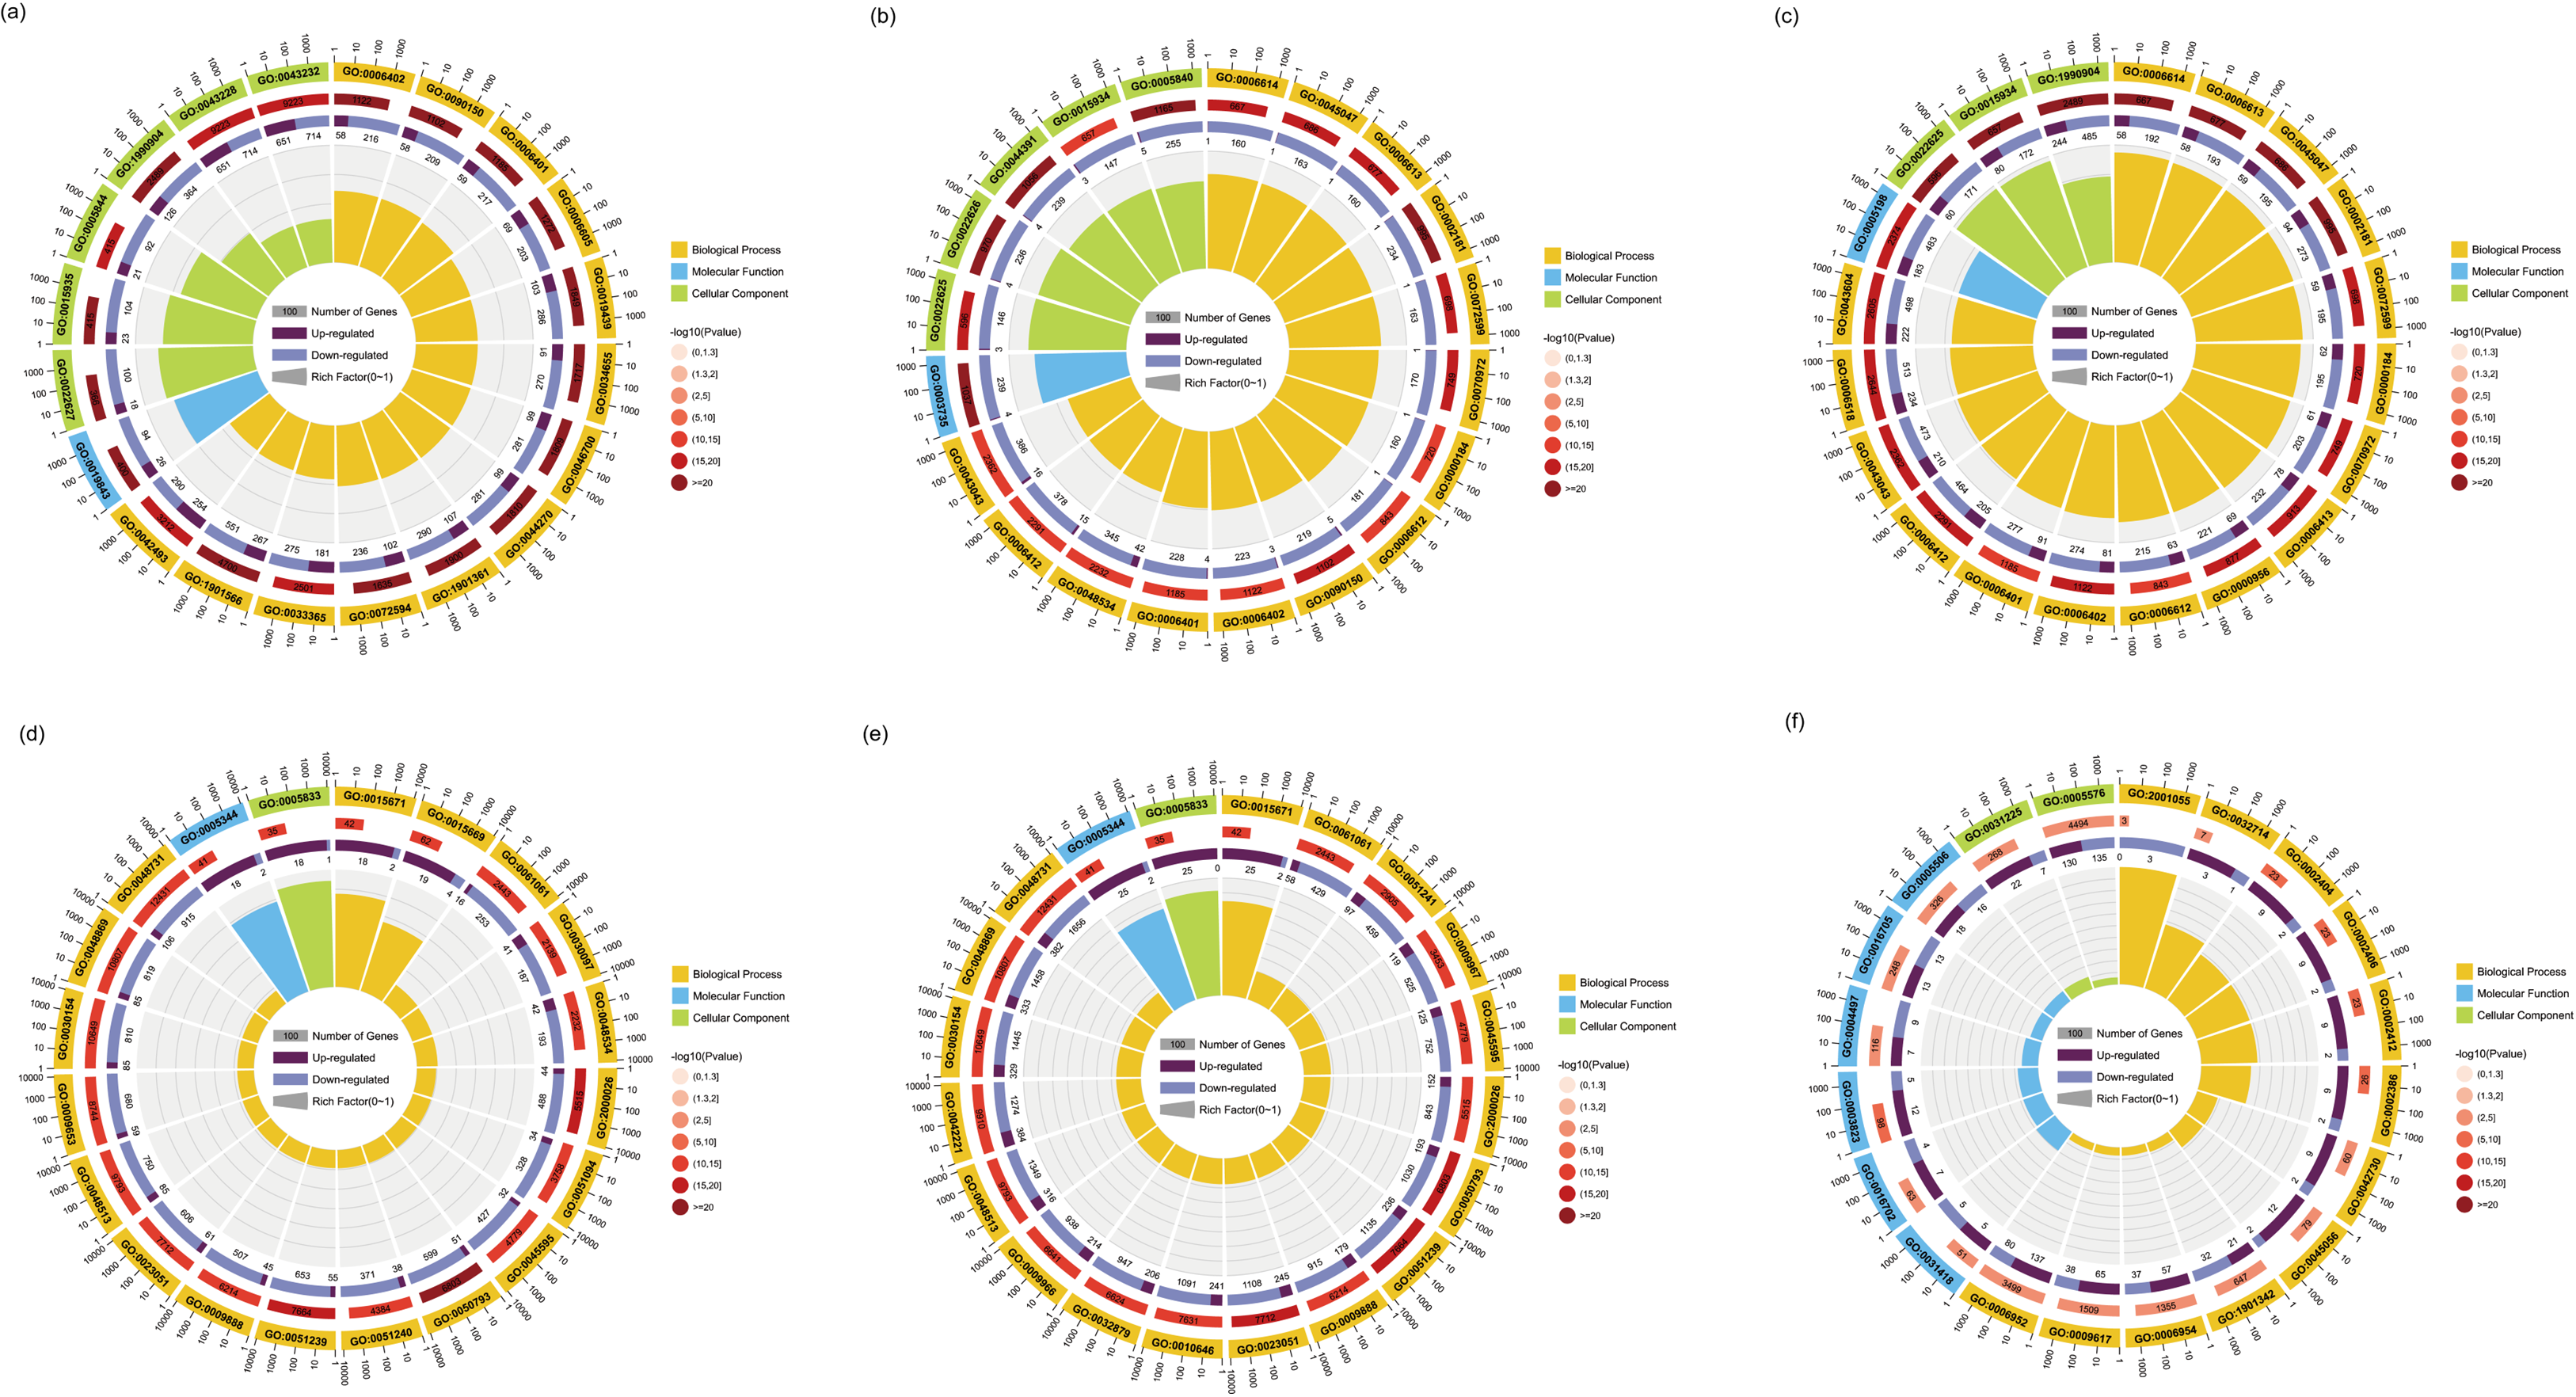
To better evaluate the biological function of the DEGs in four sample groups, we further implemented GO enrichment analysis. The top 20 significant GO terms are shown in Figure 4 and Table S7. Compared with the freshwater population (TIR) and the low-salinity population (STR), the DEGs in YBZ and TL shared major enrichment terms, such as the regulation of developmental process (GO:0050793), the regulation of signaling (GO:0023051), the regulation of cell differentiation (GO:0045595), the hemoglobin complex (GO:0005833), oxygen carrier activity (GO:0005344), protein targeting to ER (GO:0045047), and the peptide biosynthetic process (GO:0043043). These processes were critical for P. parva to grow normally in saline–alkaline water. However, the DEGs between higher salinity populations (YBZ and TL) were predominantly enriched in antigen binding (GO:0003823), defense response (GO:0006952), inflammatory response (GO:0006954), and the negative regulation of interleukin-5 production (GO:0032714), which were primarily connected with immune response mediation.
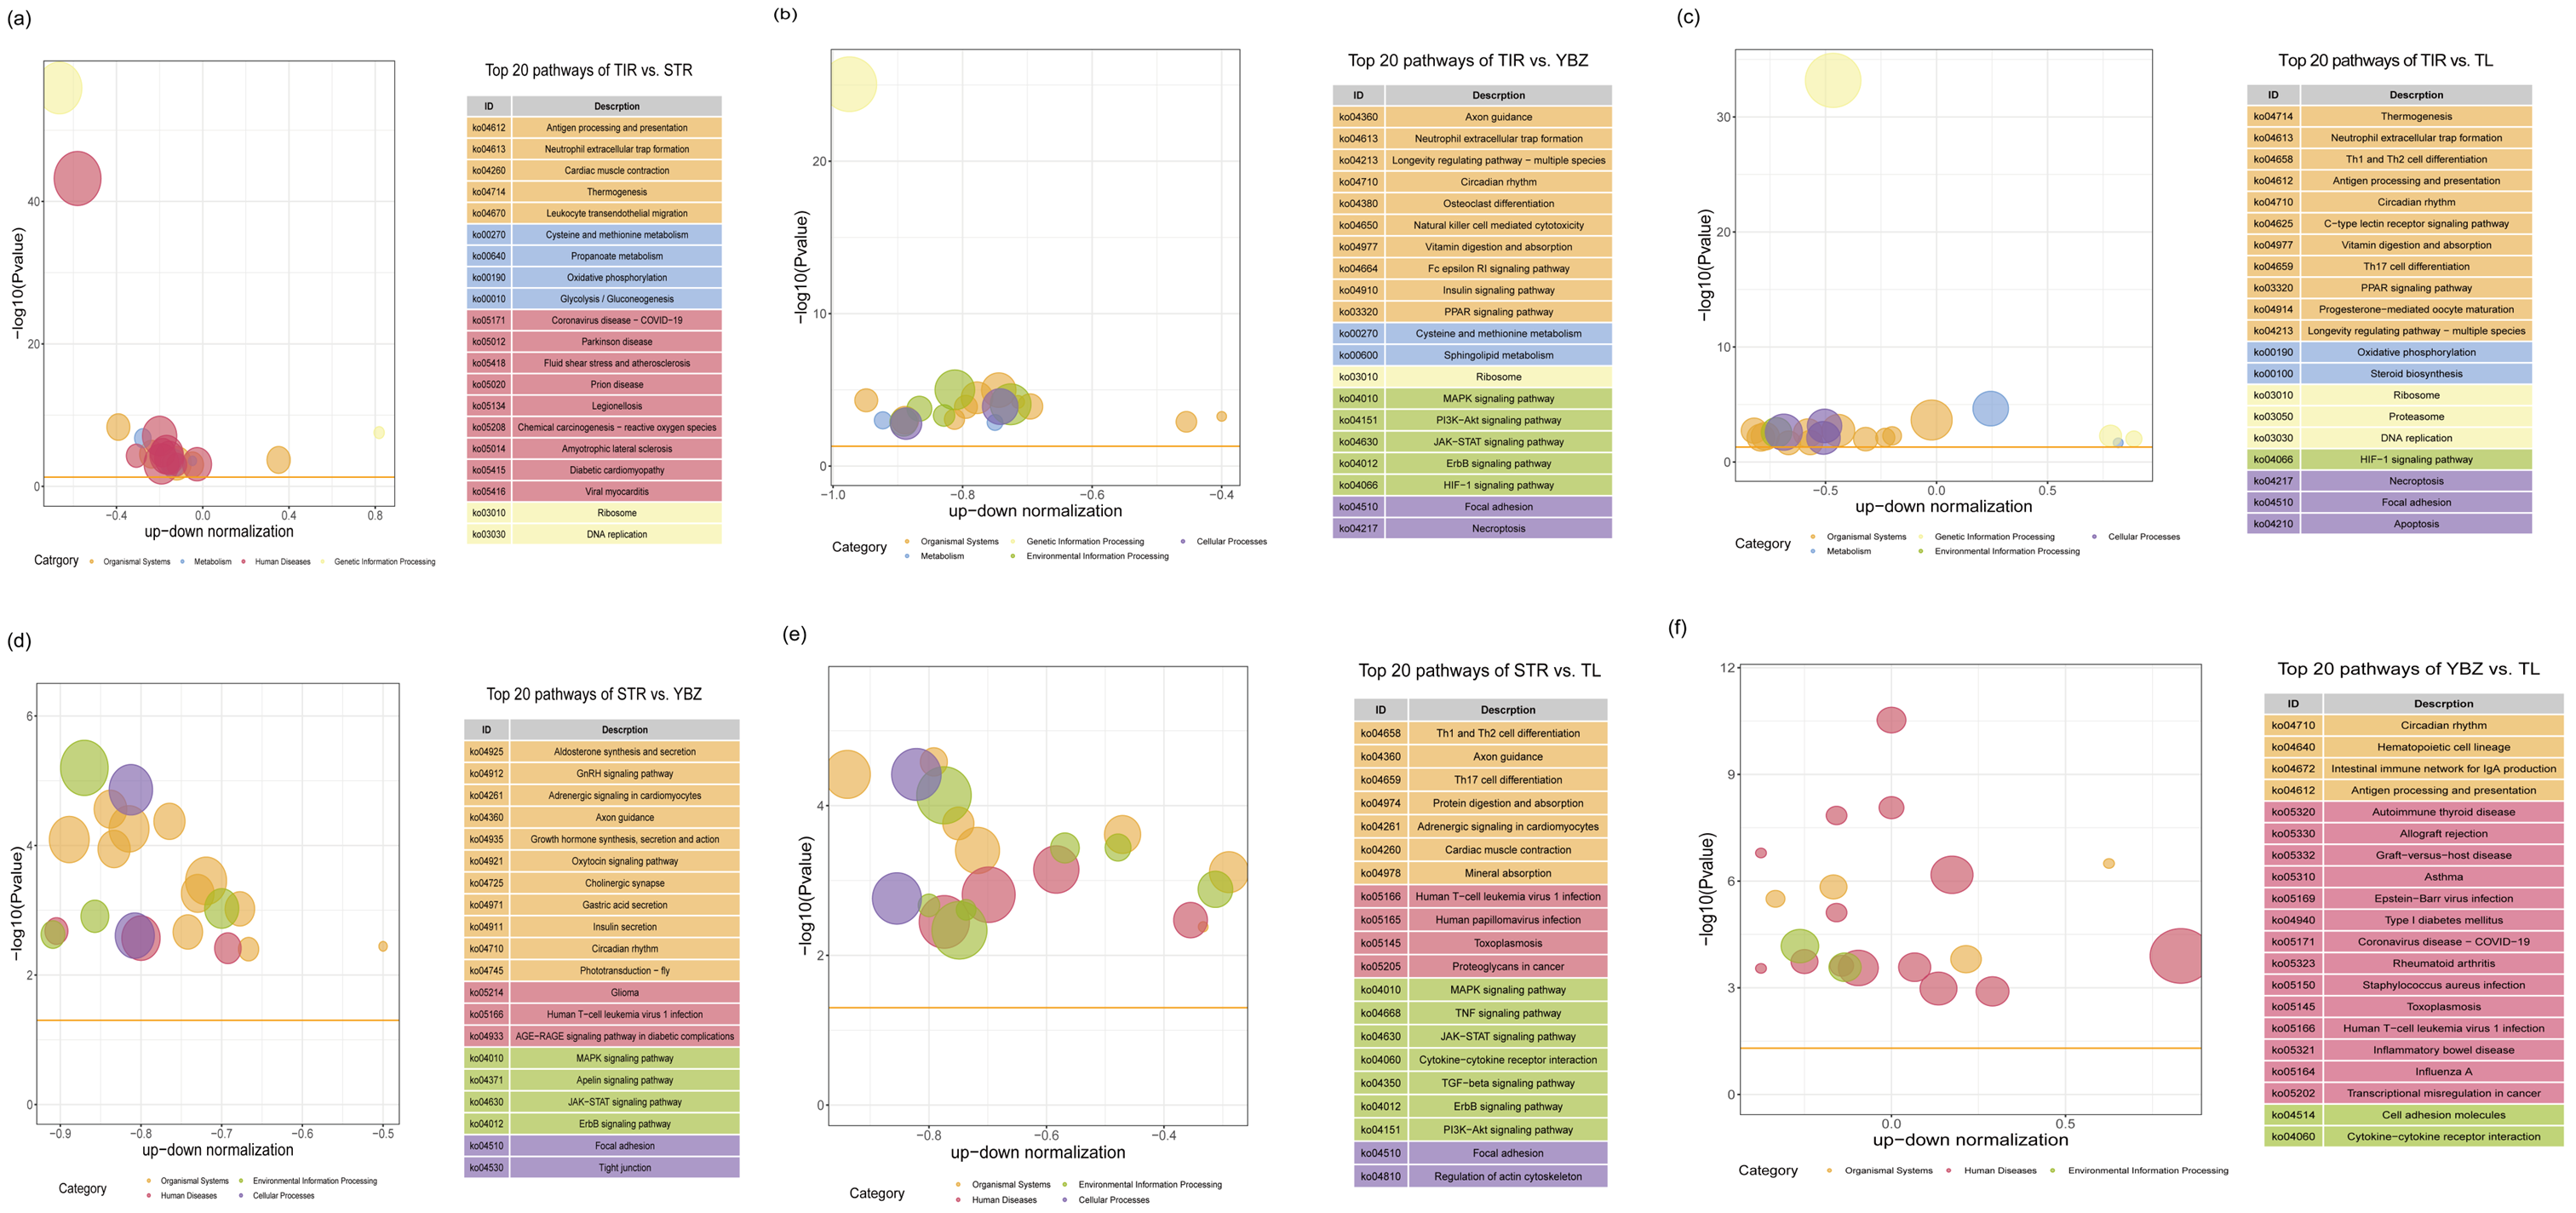
Furthermore, to identify the key signaling pathways, DEGs were further annotated based on the KEGG database, and the top 20 pathways are shown in Figure 5 and Table S8. Firstly, compared to the freshwater population (TIR), the pathway with the highest significance enrichment of DEGs in the invasive population was the ribosome (Figure 5a–c). Then, the same major enrichment pathways in saline–alkaline populations included “thermogenesis” and “circadian rhythm” in Environmental adaptation, “Antigen processing and presentation” and “neutrophil extracellular trap formation” in Immune system, “necroptosis” in Cell growth and death, “HIF-1 signaling pathway” in Signal transduction, “oxidative phosphorylation” in Energy metabolism, “cysteine and methionine metabolism” in Amino acid metabolism, “Vitamin digestion and absorption” in Digestive system, “PPAR signaling pathway” in Endocrine system, “Focal adhesion”, and “Longevity regulating pathway-multiple species”. In particular, the DEGs remained significantly enriched in “axon guidance”, “MAPK signaling pathway”, “JAK-STAT signaling pathway”, and “ErbB signaling pathway” with increasing salinity in the invasive populations (Figure 5d,e). Surprisingly, DEGs in the YBZ vs. TL comparison were enriched in multiple human disease pathways (Figure 5f). This suggested that P. parva exposed to chronic saline–alkali stress, despite their ability to survive in this environment, still required immune system regulation to counter potential diseases, as evidenced by enrichment of “Intestinal immune network for IgA production” and “Hematopoietic cell lineage” in Immune system (Figure 5f).

3.5. Co-Expression Network of DEGs Under Saline–Alkali Stress

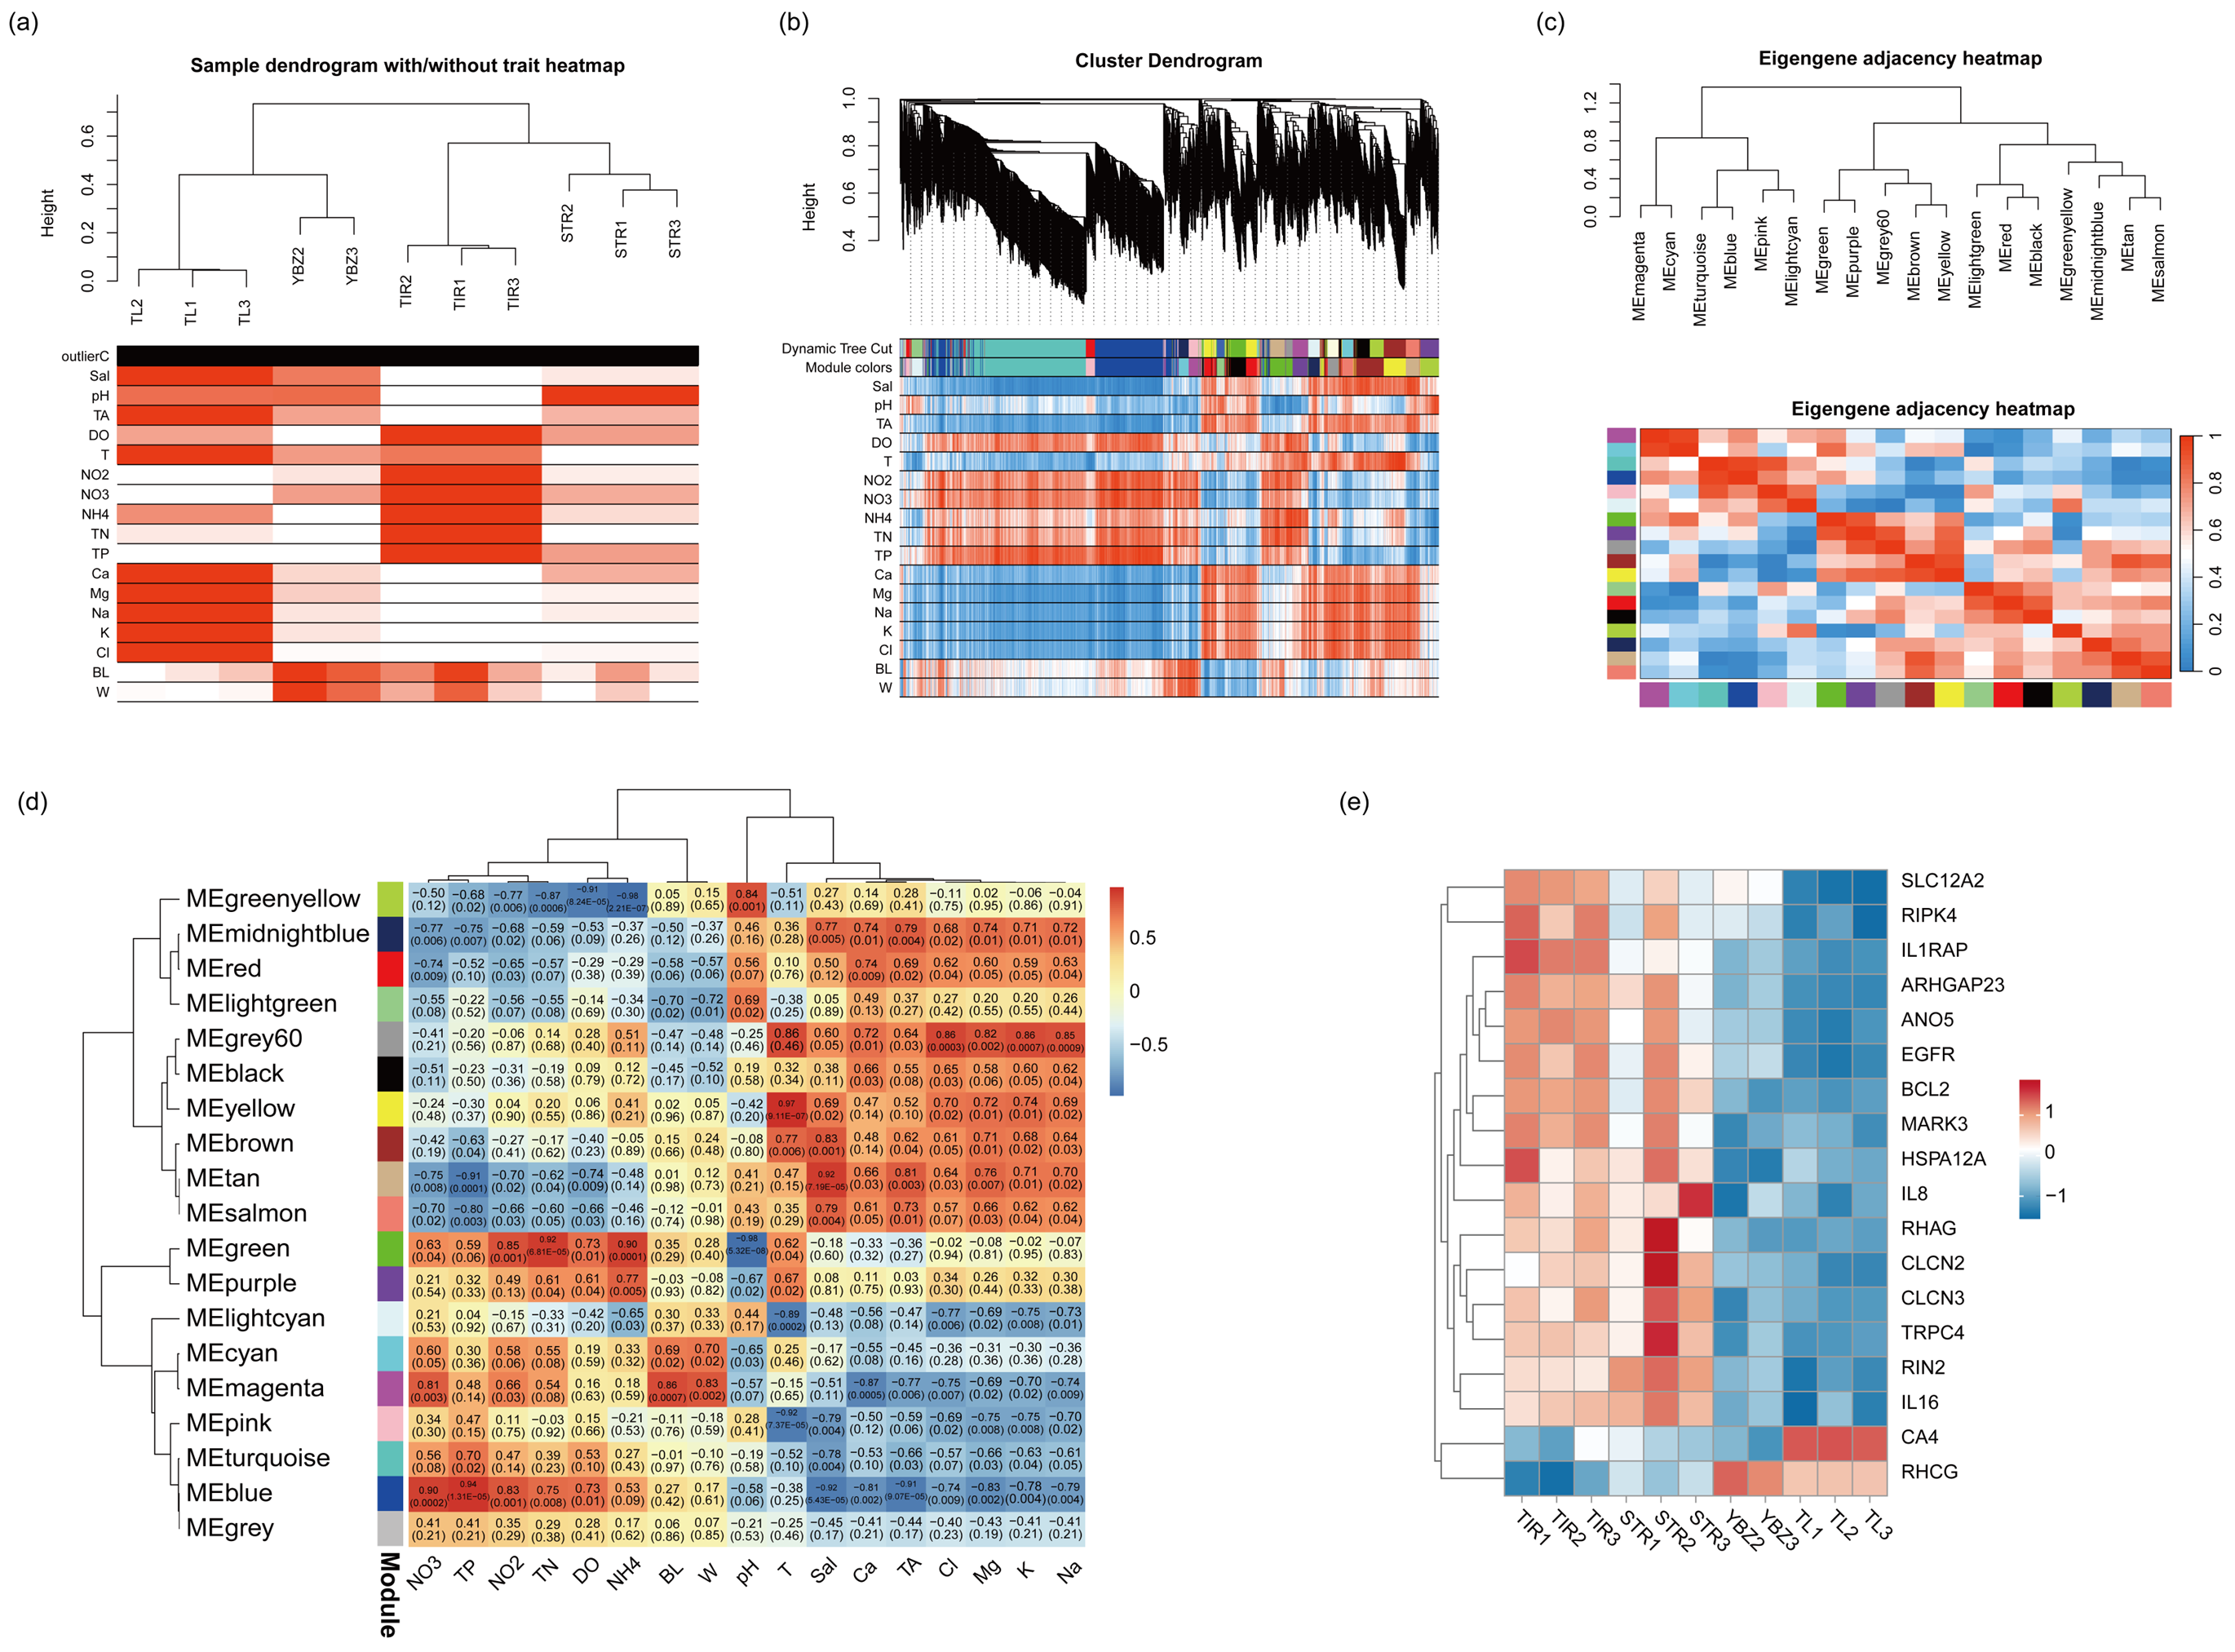
To further dissect the gene regulation networks and interactions in P. parva gills under saline–alkali stress, WGCNA was performed using 22,232 transcripts from the 11 combined transcriptome samples (excluding YBZ1), and these transcripts were assigned to 19 modules (Figure 6 and Table S9). The eigengene dendrogram and heatmap analysis identified meta-modules—clusters of modules with eigengene correlations ≥ 0.5. The dendrogram revealed strong relationships among turquoise, blue, and pink modules and between tan, salmon, and midnight blue modules (Figure 6c and Table S9). A total of seven modules were enriched with DEGs responsive to salinity: four (brown, midnight blue, salmon, and tan) with up-regulated DEGs (p < 0.05) and three (blue, pink, and turquoise) with down-regulated DEGs (p < 0.05). For alkalinity-responsive DEGs, six modules were enriched: four (midnight blue, red, salmon, and tan) with up-regulated DEGs (p < 0.05), and two (blue and turquoise) with down-regulated DEGs (p < 0.05) (Figure 6d and Table S9). Notably, 543 DEGs with annotations, such as ano5 (anoctamin-5), ca4 (carbonic anhydrase 4), trpc4 (short transient receptor potential channel 4), clcn2 (chloride channel protein 2), clcn3 (H+/Cl exchange transporter 3), Rhcg (ammonium transporter Rh type C), Rhag (ammonium transporter Rh type A), il8 (interleukin-8), il1rap (interleukin-1 receptor accessory protein), slc12a2 (solute carrier family 12 member 2), hspa12a (heat shock 70 kDa protein 12A), pipk4 (receptor-interacting serine/threonine-protein kinase 4), arhgap23 (Rho GTPase-activating protein 23), rin2 (Ras and Rab interactor 2), bcl2 (apoptosis regulator Bcl-2), and egfr (epidermal growth factor receptor), mapk3 (MAP/microtubule affinity-regulating kinase 3) (|gene-Trait_Cor| < 0.5, Figure 6e and Table S9), were co-enriched in both salinity- and alkalinity-responsive modules.

3.6. DEGs Related to Saline–Alkaline Tolerance

Since maintaining osmotic homeostasis and activating immune defenses were essential strategies to adapt to the saline–alkali stresses, we focused on genes involved in these functions. Ion-channel-regulatory-related genes (Figure 7a), such as cftr (cystic fibrosis transmembrane conductance regulator), ano6, and ano8 (anoctamin-8), exhibited down-regulation in the TL population. Among the water transporter functional gene Aquaporin (AQP), including aqp1, aqp3, and aqp11, specific down-regulation was observed in TL. For ammonia excretion function genes, Rhcg and Rhbg (ammonium transporter Rh type B) were up-regulated in TL. In acid–base accommodation, nhe2 (sodium/hydrogen exchanger 2) was down-regulated both in YBZ and in TL. ca2 (carbonic anhydrase 2) was down-regulated in YBZ, while ca4 was up-regulated in TL. slc4a1 (band 3 anion exchange protein) was down-regulated in TL. Regarding endocrine-related genes, igf1-x1 (insulin-like growth factor I isoform X1) was up-regulated in TL. In the immune system category (Figure 7b), hsp70 (heat shock 70 kDa protein), il23r (interleukin-23 receptor), il17a (interleukin 17a), and il27b (interleukin-27 subunit beta) were up-regulated in TL. Conversely, the expression levels of il8 were down-regulated in both YBZ and TL. The related DEGs above were enriched in the “Prolactin signaling pathway”, “JAK-STAT signaling pathway”, “HIF-1 signaling pathway”, “Antigen processing and presentation”, “Focal adhesion”, “Th1 and Th2 cell differentiation”, and “Th17 cell differentiation” pathways (Figure 7c). The specific expression, functional annotation, and sequence information of the above DEGs were listed in Tables S10 and S11. An overview schematic diagram of the relevant regulatory mechanisms for saline–alkaline adaptation is presented in Figure 7d.
To validate the reliability of the above de novo transcriptome analysis results, the clean reads were mapped to the reference genome for alignment (Pseudorasbora parva, GCF_024679245.1, Appendix A.1 and Appendix A.2). The comparison results of the reference genome are consistent with the de novo transcriptome assembly results (Figure A1 and Figure S1). These DEGs were mapped to 20 chromosomes of P. parva, respectively (Figure A1g and Table S12). Osmoregulation-related genes are localized on chr1, chr5, chr7, chr9, chr15, chr16, chr20, chr21, chr24, and chr25. Immune-related genes are localized on chr1, chr2, chr5, chr6, chr8, chr9, chr12, chr13, chr18, and chr24. In particular, ano6 responds primarily to “ion transport”, “response to stimulus”, “immune response”, “plasma membrane”, and “chloride channel activity” functions, as well as the “efferocytosis” pathway (Table A1 and Table S12).

3.7. qRT-PCR Validation of DEGs

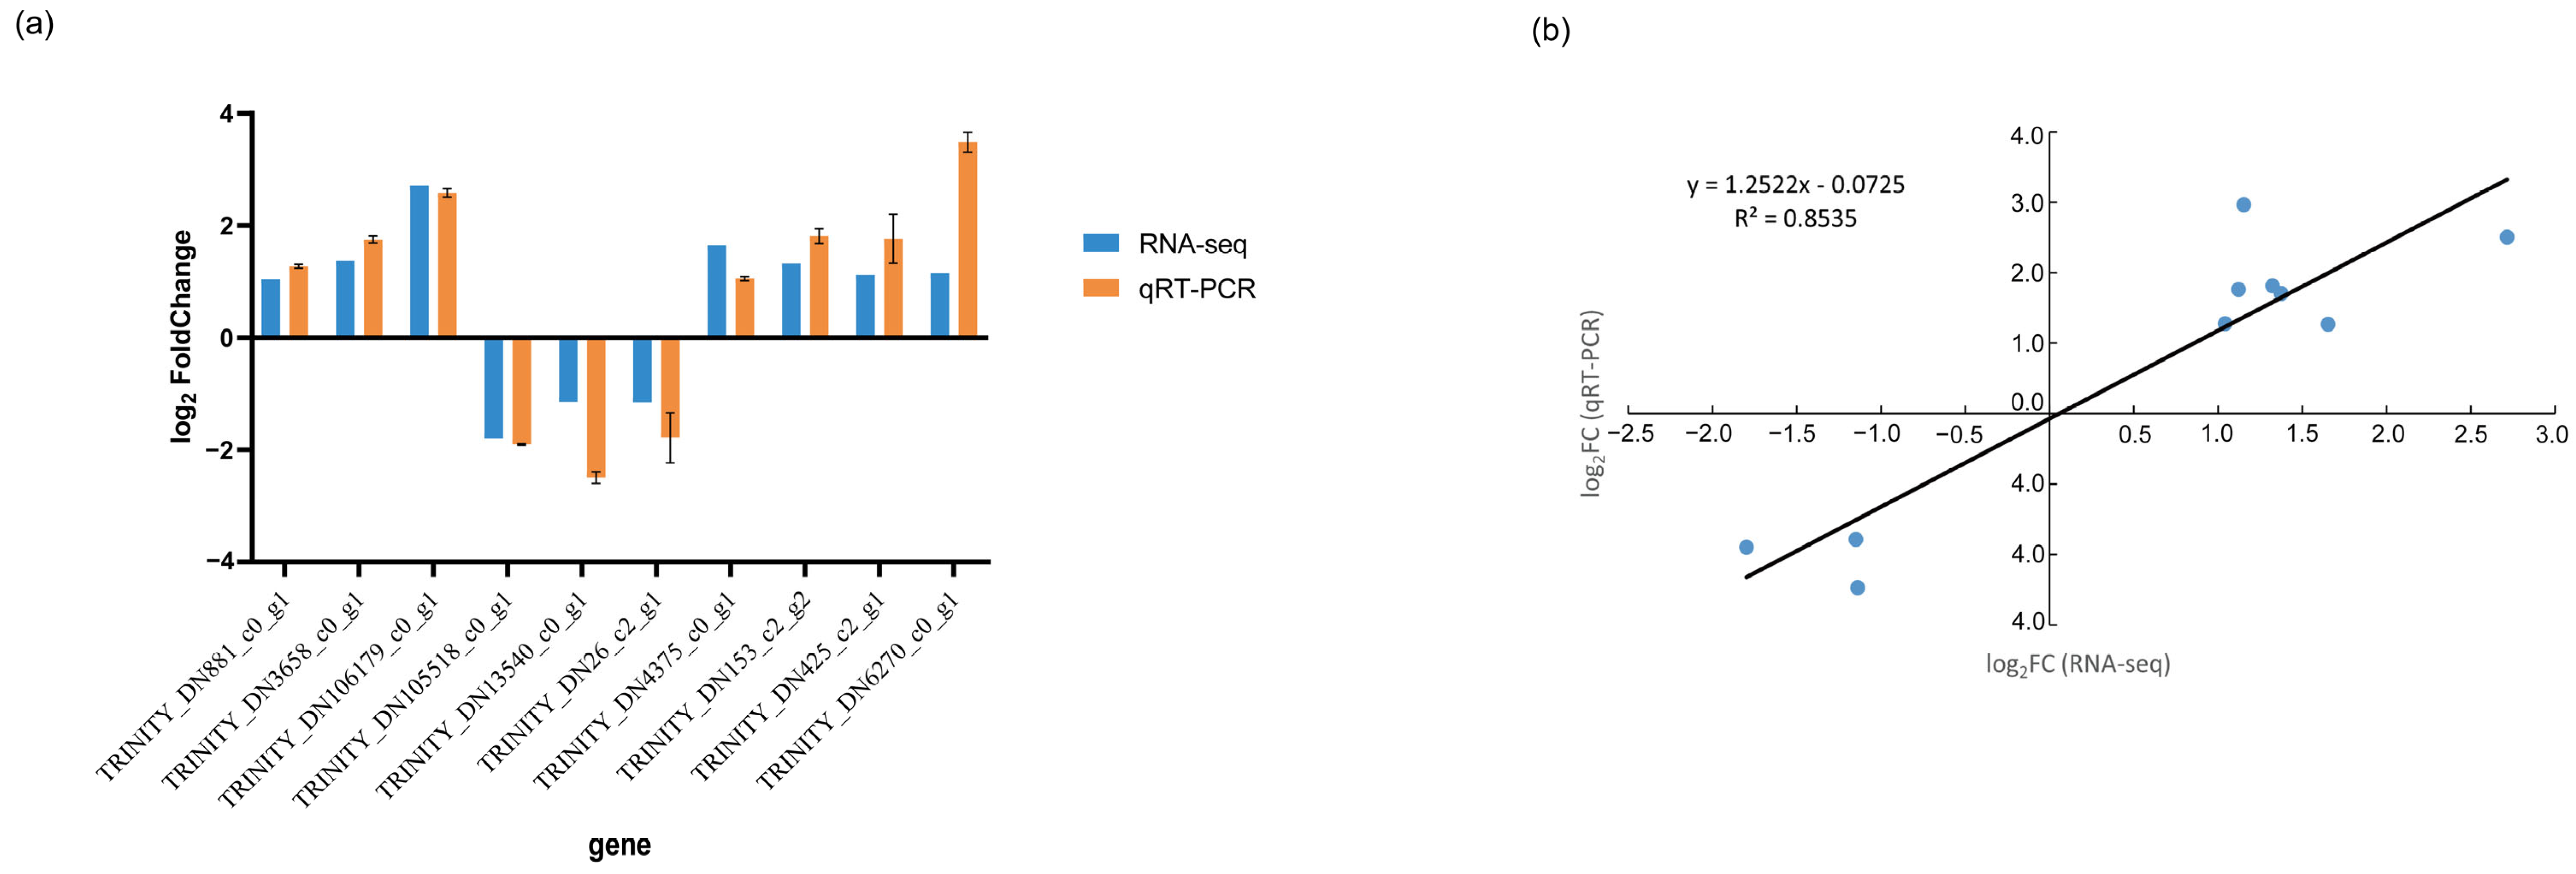
qRT-PCR was conducted on 10 randomly selected DEGs to quantify their transcriptional fold changes between TIR and STR conditions. The expression profiles of these DEGs determined by qRT-PCR were largely consistent with RNA-seq results (Figure 8a). Moreover, a correlation coefficient of 0.85 was calculated between the two datasets, demonstrating a strong agreement between RNA-seq and qRT-PCR analyses (Figure 8b). This result further corroborates the accuracy and reliability of the transcriptomic findings.

4. Discussion

4.1. Ion and Osmotic Regulation

Teleosts generally hypo-osmoregulate in a hypertonic environment, resulting in passive ion invasion and water loss [53]. To acclimatize to saline conditions, fish activate osmoregulatory mechanisms to facilitate water uptake and ion excretion across the gill epithelium [53]. In this study, there were significant differential expressions of numerous genes involved in osmoregulatory functions. In particular, the ion-transport-related gene ano6 and water-transport-related genes aqp1 and aqp3 were significantly down-regulated in saline–alkaline waters (Figure 7a).
As a member of the TMEM16 family of transmembrane proteins, ano6 forms Ca2+-activated phospholipid scramblases and functional Cl channels [54]. In addition, ano6 is activated by low intracellular Cl concentrations and inhibited by high Cl concentrations, positioning it as a cellular osmotic sensor [55]. There was evidence that the co-expression of ano6 with cftr synergizes with ROS-mediated cell death by inducing iron death, and the up-regulation of ano6 activity increases the number of cell deaths [56]. The down-regulation of ano6 was probably reflected in the adaptation to invaded saline–alkaline environments, whereby the species had transitioned from a stress state to physiological homeostasis.
AQPs are a family of transmembrane proteins acting as water transport channels, which allow the free flow of water across cell membranes and play an essential role in maintaining water homeostasis in organs involved in the osmoregulation and homeostasis of body fluids [57]. Up to now, there have been abundant studies conducted on aqp1, and its expression plays an important role in the regulation of water transport in fish. At the same time, aqp3 also transports non-ionic small molecular solutes, such as urea and glycerol [58]. The expression of aqp1 and aqp3 varied in various fishes and tissues, with salinity being a key regulatory factor [59]. For example, the expression level of aqp1 was reduced in the gills of the Chinese tapertail anchovy (Coilia nasus) under high salt stress [60], consistent with this study. This might reflect that under hyperosmotic conditions, aqp1 was expressed mainly in the kidney and intestine [61], where it increased to replenish lost water through urinary reabsorption but had limited osmoregulatory function in the gills of P. parva. Alternatively, under chronic stress, aqp1 declined to reestablish homeostasis in vivo after an initial up-regulation by acute stress [62]. However, aqp3 was mainly expressed in the gills [62]. Previous studies showed declining expression of aqp3 in the gills of Nile tilapia (Oreochromis niloticus) [63] and sea bass (Dicentrarchus labrax) [64] with increasing salinity, while the expression of aqp3 in the gills of silver sea bream (Sparus sarba) [65] and Japanese medaka (Oryzias latipes) [66] was significantly lower in hypertonic environments than in hypo-osmotic environments, aligning with our results. The down-regulation of aqp3 expression in high-salt environments might be attributed to a notable decrease in AQP3 level within the basal epithelial cells of primary lamellae, as well as in the epithelial cells of gill arches [67]. Additionally, it was also possible that the down-regulation of aqp3 served as an adaptive mechanism to prevent urea excretion, thereby facilitating adaptation to an alkaline environment [68].

4.2. Ammonia Nitrogen Excretion

Ammonia toxicity represents a critical determinant of fish survival and adaptation in highly saline–alkaline waters [69,70]. Freshwater and marine teleosts predominantly excreted over 80% of nitrogenous wastes as ammonia via gills, a fundamental process for maintaining physiological homeostasis [71,72,73]. Evidence highlighted the pivotal roles of the AQP family and Rh family in ammonia transmembrane transport, ammonia excretion, and ion regulation [73,74]. Previous studies proved that all four Rh genes (Rhag, Rhbg, Rhcg1, and Rhcg2) involved in the fish ammonia excretion process were enriched and up-regulated in gill tissues of Leuciscus waleckii under saline–alkali stress [75,76]. Our findings further extend this understanding. In the high saline–alkaline water population (TL), Rhcg and Rhbg were up-regulated, aligning with prior reports. Nevertheless, Rhag exhibited contrasting expression patterns, being down-regulated in high saline–alkaline water populations (YBZ and TL), while Rhcg2 was down-regulated only in STR (Figure 7a). These divergent expression profiles might be attributed to the buffering strength (pH) of the water, a key factor influencing fish ammonia nitrogen excretion strategies [77]. The buffer capacity of the water indirectly impacts fish nitrogenous excretion by inhibiting the formation of the acidified layer on gill epithelial cells. This inhibition could prevent the proper function of Rh proteins, even if they were expressed, thereby impeding ammonia exocytosis [78].

4.3. Acid–Base Accommodation

Numerous studies have underscored the intricate interconnection between acid–base accommodation, osmoregulation, and ammonia excretion in fish. High alkalinity in saline–alkaline environments poses a significant threat to freshwater fishes, inducing respiratory and metabolic toxicity, while high pH prevents ammonia excretion [69,70,71]. Consequently, freshwater fishes rely on effective acid–base accommodation mechanisms that synergize with ammonia excretion and osmoregulation to safeguard against alkalosis. The gills, as the primary tissue for acid–base accommodation, contribute to the maintenance of physiological balance by facilitating the transport of acid–base counterparts (H+, NH4+ and HCO3) across the gill epithelium into the surrounding water [79,80,81]. Our study investigated the expression patterns of key genes involved in this process. Notably, nhe2 was down-regulated in saline–alkaline populations (YBZ and TL), ca2 was down-regulated in YBZ, ca4 was up-regulated in the high saline–alkaline population (TL), and slc4a1 was up-regulated in YBZ (Figure 7a). It has been demonstrated that the same CA isoform (ca2) was involved in Na+ uptake and acid excretion in various fish species, such as Platichthys flesus [82], Periophthalmus cantonensis [83], and Tetraodon nigroviridis [84]. The down-regulated expression of CA in gills compensated for respiratory alkalosis [12]. Similarly, the NHE gene was significantly under-expressed in the gills of Leuciscus waleckii, while certain SLC4 genes exhibited up-regulation [77], aligning with our findings. Based on these observations, a potential mechanism for acid–base balance maintenance in fish in saline–alkaline environments could be hypothesized. To avoid alkalosis, fish might adopt a strategy of closing the H+ outward-transporting channel and enhancing active alkaline excretion. This coordinated regulation of gene expression could be a crucial adaptive response, allowing fish to fine-tune their acid–base balance and survive in challenging waters. However, further experimental validation is essential to confirm this speculation.

4.4. Immune Response in an Invasive Environment

Osmotic stress has been widely recognized as a pivotal element influencing the immune response in fish [33,85]. Beyond their osmoregulatory function, gills serve as a crucial structure for the immune response. Osmoregulators, such as interleukins (ILs), are integral components of the osmotic stress signaling network, modulating the response of epithelial cells to salinity [86]. Among them, IL-17 is categorized as one of the pro-inflammatory cytokines that are secreted by helper T cells. It has the ability to trigger the production of diverse cytokines and chemokines, such as IL-1β and IL-8, which strongly indicates its significant involvement in the immune response [33]. IL-17 is required to mediate inflammatory activity through the IL-17 receptor (IL-17R) complex, composed of il17ra and il17rc [87]. Our study revealed distinct gene expression patterns related to the immune response in high saline–alkaline waters. Notably, a number of down-regulated differentially expressed genes among high saline–alkaline populations were significantly enriched in disease-associated pathways. Specifically, il17, il17b, and il23r were up-regulated in the high saline–alkaline population (TL), but il17rc, il8, il17rd, il17re, and il16 were down-regulated (Figure 7b). These down-regulated expression patterns might be the result of complex interactions between osmotic stress and other environmental factors. Under chronic osmotic stress, fish might suppress local immune responses in the gills as an adaptive strategy to reallocate energy resources [37]. This trade-off between immune function and osmoregulatory acclimation became particularly critical when the salinity exceeded a certain threshold; a similar phenomenon was also observed in previous studies on other teleosts [88,89]. Detailed comparative information on studies related to saline–alkaline adaptation are summarized in Table S13.
At present, this study has only preliminarily revealed the potential gene expression patterns of P. parva in saline–alkaline adaptation but lacks explicit evidence of genetic associations. In addition, due to the difficulty in preserving and transporting field survey samples, this study lacks biological trait results that respond to saline–alkali stress or other related traits. Furthermore, the within-group variation in YBZ1 samples necessitated their exclusion from data analysis, indicating that only three biological replicates were insufficient. In subsequent studies, the number of biological replicates should be increased to ensure data stability. Transcriptomics should be integrated with metabolomics and proteomics to characterize the full spectrum of adaptations. Additionally, genome-wide association studies (GWAS) should be implemented to identify genetic variants associated with adaptive expression profiles, thereby clarifying whether the observed transcriptional changes arise from genetic mutations or epigenetic plasticity. Then, through artificial aquaculture stress experiments, the study can simulate saline–alkali stress environmental conditions to confirm the biological trait responses under saline–alkali stress (e.g., transmission electron microscopy observation of gill tissues). Additionally, gene knockout/overexpression experiments (such as CRISPR-Cas9) can be performed to validate the critical roles of key DEGs in saline–alkaline tolerance.

5. Conclusions

In this study, the first transcriptome analysis of the gills of P. parva invading saline–alkali water was described. Through comparative transcriptomics analysis, we found that in three invading P. parva populations with increasing salinity and alkalinity, a total of 8759, 8935 and 17,190 genes were differentially expressed in the gills, respectively. Functional and enrichment analyses of the DEGs uncovered significant expression in several KEGG pathways, such as the ribosome, thermogenesis, oxidative phosphorylation, necroptosis, and HIF-1 signaling pathways. In addition, more DEGs were significantly enriched in multiple immune-disease-related pathways in the high saline–alkali populations. This indicates that while P. parva could survive long-term in saline–alkaline water environments, chronic exposure to salinity and alkalinity imposed persistent stress, necessitating immune system regulation to counter potential pathogens. Furthermore, we conducted a detailed analysis of the expression of genes related to ion transport, osmoregulation, ammonia excretion, acid–base accommodation, and the immune system in invasive populations of P. parva. Collectively, these findings provided molecular insights into genetic mechanisms of environmental adaptation under saline–alkaline stress and could potentially play a cornerstone role in the implementation of freshwater fish culture in saline–alkaline water.

Supplementary Materials

The following supporting information can be downloaded at https://www.mdpi.com/article/10.3390/w17121794/s1, Table S1: Water quality parameters of the sampling sites and biological parameters [90]; Table S2: De novo transcriptome analysis flow; Table S3: Primer for qRT-PCR validation; Table S4: Summary of Illumina RNA-seq data; Table S5: The distribution of annotated species in NR; Table S6: Detailed data of Figure 3b; Table S7: Detailed data of Figure 4; Table S8: Detailed data of Figure 5; Table S9: General information for the modules of WGCNA; Table S10: DEG-related functional information; Table S11: Sequences of DEGs related to saline–alkaline tolerance; Table S12: Reference genome comparison results; Table S13: Research related to saline–alkaline adaptation. Figure S1. Enrichment analysis of the top 20 KEGG pathways in the four comparison groups under the reference transcriptome.

Author Contributions

Conceptualization, L.L. and D.L.; methodology, L.L.; software, L.L., X.L. and Y.D.; validation, L.L.; formal analysis, L.L.; investigation, L.L., X.L., Y.D., B.H. and J.L.; data curation, L.L. and Y.D.; writing—original draft preparation, L.L.; writing—review and editing, L.L. and D.L.; visualization, L.L. and Y.D.; supervision, L.L., R.T. and D.L.; project administration, L.L., R.T. and D.L.; funding acquisition, D.L. All authors have read and agreed to the published version of the manuscript.

Funding

This work was supported by The Finance Special Fund of the Ministry of Agriculture and Rural Affairs “Fisheries Resources and Environment Survey in the Key Water Areas of Northwest China” (No. 2130111).

Institutional Review Board Statement

The animal study protocol was approved by the Institutional Animal Care and Use Ethics Committee of Huazhong Agricultural University (HZAUFI-2019-043, 28 June 2019)

Data Availability Statement

All sequencing data associated with this project were deposited in the National Center for Biotechnology Information (NCBI) Sequence Read Archive database with the BioProject Accession Number: PRJNA1253312 (https://www.ncbi.nlm.nih.gov/sra/ PRJNA1253312, accessed on 28 April 2025).

Acknowledgments

All the authors thank Zhenyi Hu, Zhengyi Lu, Qingyang Liu, Siyuan Sun, Jiacheng She, Jun Xie, and Zhaojun Wu for their help in the resource environment survey and sample collection.

Conflicts of Interest

The authors declare no conflicts of interest. The funders had no role in the study design, data collection and analysis, decision to publish, or preparation of the manuscript.

Appendix A

Appendix A.1. Reference Transcriptome Analysis Methods

RNA extraction, library preparation, and RNA sequencing were the same as Section 2.3 in the main text. Raw reads were processed using fastp (0.22.0) and Cutadapt to trim the adaptor sequences from the 3′ ends and filter out reads less than 50 bp in length and with an average quality score below Q20. The reference genome and gene annotation files were downloaded from a genome website (Pseudorasbora parva, GCF_024679245.1, https://www.ncbi.nlm.nih.gov/datasets/genome/GCF_024679245.1/, accessed on 20 May 2025). The filtered reads were mapped to the reference genome using HISAT2 (v2.1.0). The read count values on each gene were compared with the original gene expression using HTSeq (v0.9.1) statistics and the Burrows–Wheeler Transform (BWT) algorithm with default parameters, and then, the expression was standardized by FPKM (fragments per kilo bases per million fragments). Different expression analysis and enrichment analysis were the same as Section 2.4 and Section 2.5 in the main text.

Appendix A.2. Reference Genome Comparison Results
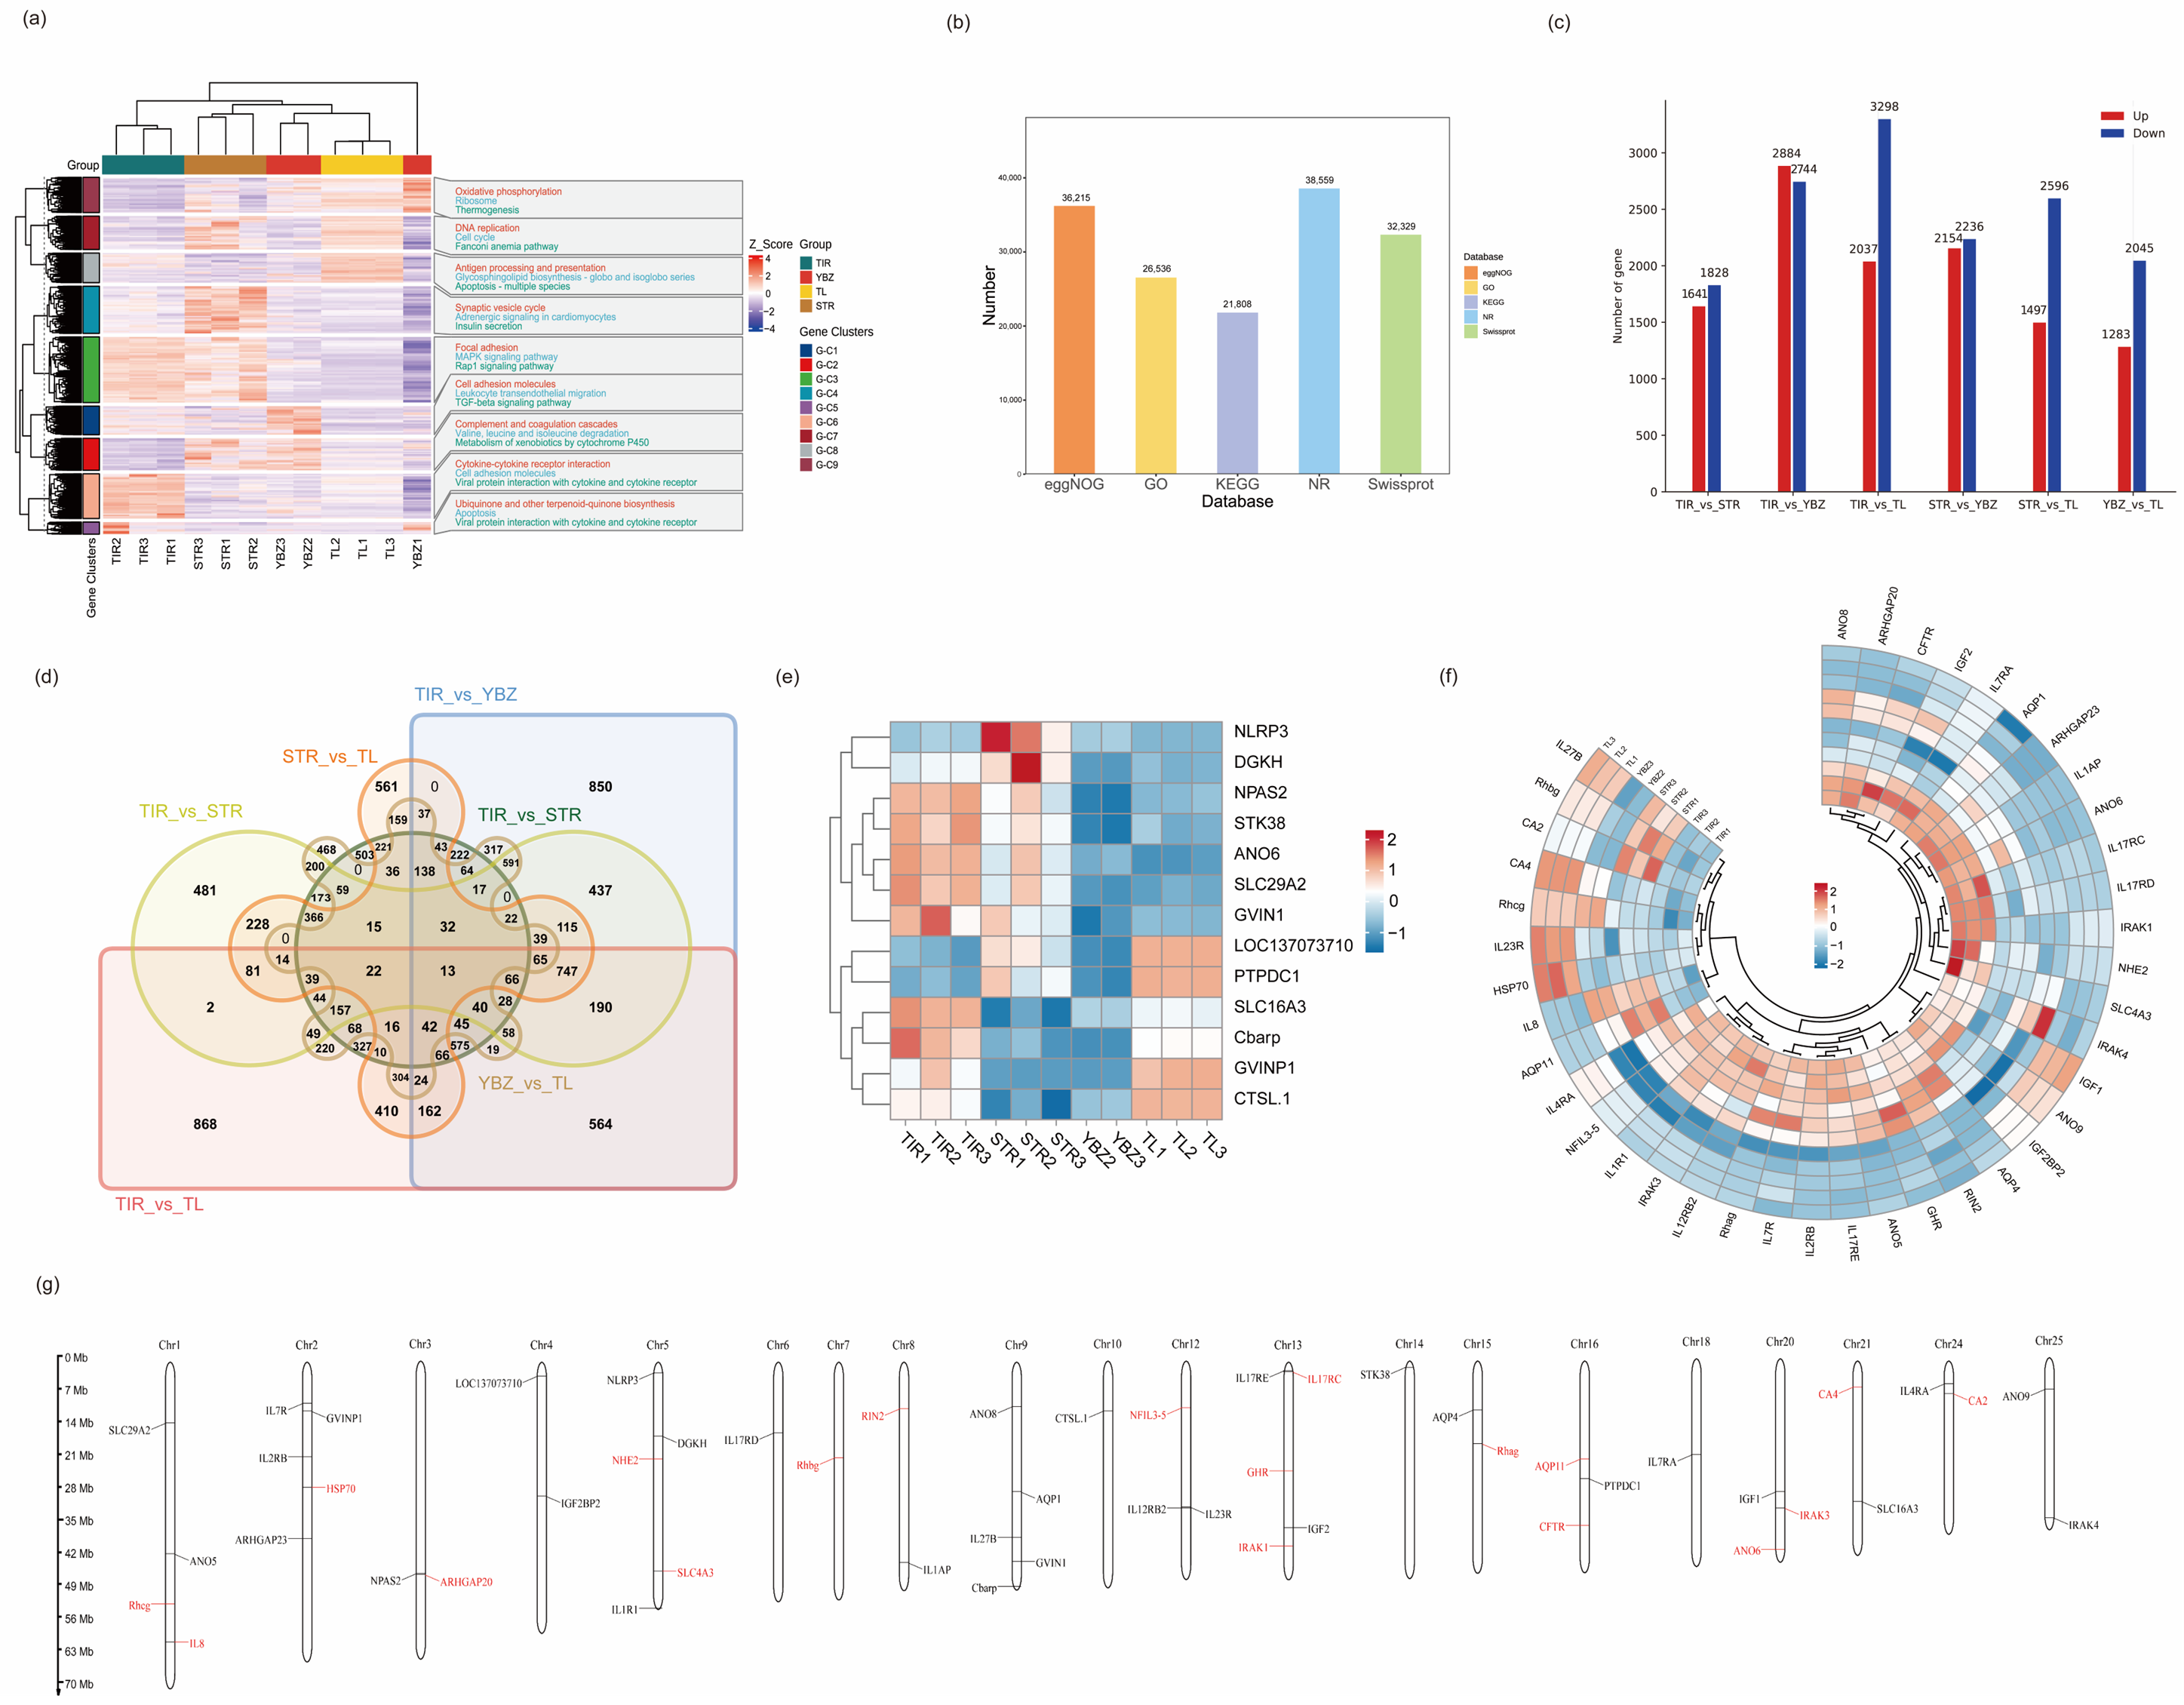
To validate the reliability of the above-mentioned de novo transcriptome assembly analysis results, we mapped the filtered clean reads after splicing to the reference genome for result alignment. The results showed that the total mapping rate exceeded 90%, indicating good assembly quality of the reference genome; the InterGene mapping rate was less than 6%, suggesting good quality of the de novo assembled sequences (Table S12). The results of the reference genome comparison were consistent with the de novo transcriptome assembly results (Figure A1a,b). In pairwise comparisons among the four populations, the number of down-regulated DEGs was greater than that of up-regulated DEGs, and the count of down-regulated DEGs rose progressively with increasing salinity–alkalinity levels (Figure A1c). Among them, a total of 15 genes were differentially expressed in all invasive populations, such as ano6, slc16a3 (monocarboxylate transporter 4), and slc29a2 (equilibrative nucleoside transporter 2 isoform X2) (Figure A1d,e, and Table S12). When compared with freshwater populations (TIR), the pathways significantly and commonly enriched for DEGs in saline–alkali invasive populations (STR, YBZ, and TL) were “cytokine-cytokine receptor interaction”, “Th17 cell differentiation”, “complement and coagulation cascades”, “arachidonic acid metabolism”, “pancreatic secretion”, and “viral protein interaction with cytokine and cytokine receptor” (p-value < 0.05, Figure S1 and Table S12). The expression trends of salinity–alkalinity-tolerance-related DEGs annotated by alignment with the reference genome were consistent with the results of de novo transcriptome assembly analysis (Figure 7a,b, Figure A1f, and Table S12). These DEGs were mapped to 20 chromosomes of P. parva, respectively (Figure A1g and Table S12). Osmoregulation-related genes are localized on chr1, chr5, chr7, chr9, chr15, chr16, chr20, chr21, chr24, and chr25. Immune-related genes are localized on chr1, chr2, chr5, chr6, chr8, chr9, chr12, chr13, chr18, and chr24. In particular, ano6 responds primarily to the “ion transport”, “response to stimulus”, “immune response”, “plasma membrane”, and “chloride channel activity” functions, as well as the “efferocytosis” pathway (Table A1 and Table S12).
Figure A1. Reference genome comparison results. (a) Combined graph of gene expression heatmap and pathway enrichment map. (b) The number of genes with functional annotations in different databases. (c) Differential gene expression analysis showing up- and down-regulated genes across all groups. (d) Venn diagram of all DEGs. (e) Co-DEGs in two-by-two comparisons of four populations. (f) DEGs related to saline–alkaline tolerance. (g) Chromosomal localization of DEGs for saline–alkaline tolerance.
Water 17 01794 g0a1
Table A1. The biological functions and pathways of the key DEGs.
Key DEGsKey Biological ProcessesKey Cellular ComponentsKey Molecular FunctionsKey Pathways
RhcgIon transport
Ammonium transmembrane transport
Epithelium development
Regulation of pH
Apical plasma membrane
Vesicle
Organelle
Ammonium transmembrane transporter activity
Ion transmembrane transporter activity
-
ano6Ion transport
Response to stimulus
Blood coagulation
Cell migration
Immune response
Plasma membrane
Secretory granule
Vesicle
Membrane protein complex
Chloride channel activity
Cation channel activity
Phospholipid scramblase activity
Efferocytosis
aqp1Water transport
Regulation of cell size
Ion transport
Carbohydrate transport
Plasma membrane
Brush border
Extracellular region
Water channel activity
Ammonium transmembrane transporter activity
Ion transmembrane transporter activity
Bile secretion
Proximal tubule bicarbonate reclamation
ca2Ion transport
Carbon dioxide transport
Response to salt stress
Cytoplasm
Organelle
Membrane-bounded organelle
Carbonate dehydratase activity
Catalytic activity
Bile secretion
Pancreatic secretion
cftrIon transport
immune system process
Cellular response to stress
Plasma membrane
Intracellular organelle
Endoplasmic reticulum membrane
Anion transmembrane transporter activity
ATP binding
Bile secretion
Pancreatic secretion
AMPK signaling pathway
hsp70Negative regulation of signal transduction
Positive regulation of interleukin-8 production
Negative regulation of cell death
Immune response
Cytoplasm
Mitochondrion
Endoplasmic reticulum
Ion binding
ATP hydrolysis activity
Carbohydrate derivative binding
Antigen processing and presentation
Endocytosis
MAPK signaling pathway
il8Immune system process
Positive regulation of response to stimulus
Inflammatory response
Regulation of sodium ion transport
Vesicle
Endomembrane system
intracellular organelle
Signaling receptor regulator activity
Cytokine activity
Enzyme regulator activity
IL-17 signaling pathway)
Cytokine-cytokine receptor interaction
il17rcCellular response to stimulus
Interleukin-17-mediated signaling pathway
Cytokine-mediated signaling
Plasma membrane
Cell periphery
Obsolete cell
Interleukin-17 receptor activity
Signaling receptor activity
Cytokine receptor activity
IL-17 signaling pathway
Cytokine-cytokine receptor interaction

References

  1. Banarescu, P.M. On the Relations between Hydrography and the Ranges of Freshwater Fish Species and Subspecies. Ital. J. Zool. 1998, 65, 87–93. [Google Scholar] [CrossRef]
  2. Copp, G.H.; Garthwaite, R.; Gozlan, R.E. Risk Identification and Assessment of Non-Native Freshwater Fishes: A Summary of Concepts and Perspectives on Protocols for the UK. J. Appl. Ichthyol. 2005, 21, 371–373. [Google Scholar] [CrossRef]
  3. Gavriloaie, C.; Bucur, C.; Berkesy, C. Notes Concerning the Distribution of Asian Fish Species, Pseudorasbora parva, in Europe. Aquac. Aquar. Conserv. Legis. Bioflux 2014, 7, 43–50. [Google Scholar]
  4. Simon, A.; Gozlan, R.E.; Robert Britton, J.; Van Oosterhout, C.; Hänfling, B. Human Induced Stepping-Stone Colonisation of an Admixed Founder Population: The Spread of Topmouth Gudgeon (Pseudorasbora parva) in Europe. Aquat. Sci. 2015, 77, 17–25. [Google Scholar] [CrossRef]
  5. Gozlan, R.E.; Andreou, D.; Asaeda, T.; Beyer, K.; Bouhadad, R.; Burnard, D.; Caiola, N.; Cakic, P.; Djikanovic, V.; Esmaeili, H.R.; et al. Pan-Continental Invasion of Pseudorasbora parva: Towards a Better Understanding of Freshwater Fish Invasions: Pan-Continental Invasion of Topmouth Gudgeon. Fish Fish. 2010, 11, 315–340. [Google Scholar] [CrossRef]
  6. Onikura, N.; Nakajima, J. Age, Growth and Habitat Use of the Topmouth Gudgeon, Pseudorasbora parva in Irrigation Ditches on Northwestern Kyushu Island, Japan. J. Appl. Ichthyol. 2013, 29, 186–192. [Google Scholar] [CrossRef]
  7. Chen, G.; Qiu, Y.P.; Li, L. Fish Invasions and Changes in the Fish Fauna of the Tarim Basin. Acta Ecol. Sin. 2017, 37, 700–714. [Google Scholar] [CrossRef]
  8. Xu, W.; Wang, H.; Li, Y. Distribution and Aquaculture Application of Saline Alkali Water at Home and Abroad. China Fish. 2021, 7, 50–53. [Google Scholar]
  9. Wang, F.; Zhu, L.; Wei, Y.; Gao, P.; Liu, Y.; Zhou, K.; Sun, Z.; Lai, Q.; Yao, Z. Intestinal Ion Regulation Exhibits a Daily Rhythm in Gymnocypris przewalskii Exposed to High Saline and Alkaline Water. Sci. Rep. 2022, 12, 807. [Google Scholar] [CrossRef]
  10. Liu, Y.; Fang, H.; Lai, Q.; Liang, L. The Current State and Development Strategy for China’s Saline-Alkaline Fisheries. Strateg. Study Chin. Acad. Eng. 2016, 18, 74–78. [Google Scholar] [CrossRef]
  11. Gao, L.; Yuan, Z.; Mao, X.; Ma, T. Salinity Levels, Trends and Drivers of Surface Water Salinization across China’s River Basins. Water Res. 2025, 281, 123556. [Google Scholar] [CrossRef] [PubMed]
  12. Yao, Z.; Guo, W.; Lai, Q.; Shi, J.; Zhou, K.; Qi, H.; Lin, T.; Li, Z.; Wang, H. Gymnocypris przewalskii Decreases Cytosolic Carbonic Anhydrase Expression to Compensate for Respiratory Alkalosis and Osmoregulation in the Saline-Alkaline Lake Qinghai. J. Comp. Physiol. B 2016, 186, 83–95. [Google Scholar] [CrossRef]
  13. Peng, M.; Li, Z.; Liu, X.; Niu, D.; Li, J. Inland Alkaline Brackish Water Aquaculture of Juvenile Razor Clam: Survival, Growth, Physiology and Immune Responses. Aquac. Rep. 2020, 18, 100463. [Google Scholar] [CrossRef]
  14. Song, L.; Zhao, Y.; Song, Y.; Zhao, L.; Ma, C.; Zhao, J. Effects of Saline-Alkaline Water on Growth Performance, Nutritional Processing, and Immunity in Nile Tilapia (Oreochromis niloticus). Aquaculture 2021, 544, 737036. [Google Scholar] [CrossRef]
  15. Laverty, G.; Skadhauge, E. Adaptation of Teleosts to Very High Salinity. Comp. Biochem. Physiol. A-Mol. Integr. Physiol. 2012, 163, 1–6. [Google Scholar] [CrossRef]
  16. Gao, S.; Chang, Y.; Zhao, X.; Sun, B.; Zhang, L.; Laing, L.; Dong, Z. The effect of different bicarbonate alkalinity on the gill structure of Amur Ide (Leuciscus waleckii). Acta Hydrobiol. Sin. 2020, 44, 736–743. [Google Scholar] [CrossRef]
  17. Gao, S.; Zhao, X.; Chang, Y.; Sun, B.; Liang, L.; Zhang, L.; Dong, Z. Effect of different bicarbonate alkalinities on microstructures of Kidney and Intestine in Amur ide (Leuciscus waleckii). Chin. J. Fish. 2020, 33, 24–30. [Google Scholar] [CrossRef]
  18. Evans, D.H.; Piermarini, P.M.; Choe, K.P. The Multifunctional Fish Gill: Dominant Site of Gas Exchange, Osmoregulation, Acid-Base Regulation, and Excretion of Nitrogenous Waste. Physiol. Rev. 2005, 85, 97–177. [Google Scholar] [CrossRef]
  19. Nilsen, T.O.; Ebbesson, L.O.E.; Madsen, S.S.; McCormick, S.D.; Andersson, E.; Bjornsson, B.T.; Prunet, P.; Stefansson, S.O. Differential Expression of Gill Na+,K+-ATPase Alpha- and Beta-Subunits, Na+,K+,2Cl Cotransporter and CFTR Anion Channel in Juvenile Anadromous and Landlocked Atlantic Salmon Salmo salar. J. Exp. Biol. 2007, 210, 2885–2896. [Google Scholar] [CrossRef]
  20. Kunzelmann, K.; Nilius, B.; Owsianik, G.; Schreiber, R.; Ousingsawat, J.; Sirianant, L.; Wanitchakool, P.; Bevers, E.M.; Heemskerk, J.W.M. Molecular Functions of Anoctamin 6 (TMEM16F): A Chloride Channel, Cation Channel, or Phospholipid Scramblase? Pflugers Arch. 2014, 466, 407–414. [Google Scholar] [CrossRef]
  21. Watanabe, S.; Niida, M.; Maruyama, T.; Kaneko, T. Na+/H+ Exchanger Isoform 3 Expressed in Apical Membrane of Gill Mitochondrion-Rich Cells in Mozambique Tilapia Oreochromis mossambicus. Fish. Sci. 2008, 74, 813–821. [Google Scholar] [CrossRef]
  22. Larsen, P.F.; Nielsen, E.E.; Williams, T.D.; Loeschcke, V. Intraspecific Variation in Expression of Candidate Genes for Osmoregulation, Heme Biosynthesis and Stress Resistance Suggests Local Adaptation in European Flounder (Platichthys flesus). Heredity 2008, 101, 247–259. [Google Scholar] [CrossRef] [PubMed]
  23. Larsen, P.F.; Nielsen, E.E.; Koed, A.; Thomsen, D.S.; Olsvik, P.A.; Loeschcke, V. Interpopulation Differences in Expression of Candidate Genes for Salinity Tolerance in Winter Migrating Anadromous Brown Trout (Salmo trutta L.). BMC Genet. 2008, 9, 12. [Google Scholar] [CrossRef]
  24. Deane, E.E.; Luk, J.C.Y.; Woo, N.Y.S. Aquaporin 1a Expression in Gill, Intestine, and Kidney of the Euryhaline Silver Sea Bream. Front. Physio. 2011, 2, 39. [Google Scholar] [CrossRef]
  25. Bao, X.N.; Mu, C.K.; Zhang, C.; Wang, Y.F.; Song, W.W.; Li, R.H.; Wang, C.L. mRNA Expression Profiles of Heat Shock Proteins of Wild and Salinity-Tolerant Swimming Crabs, Portunus trituberculatus, Subjected to Low Salinity Stress. Genet. Mol. Res. 2014, 13, 6837–6847. [Google Scholar] [CrossRef]
  26. Lee, C.E.; Petersen, C.H. Genotype-by-environment Interaction for Salinity Tolerance in the Freshwater-invading Copepod Eurytemora affinis. Physiol. Biochem. Zool. 2002, 75, 335–344. [Google Scholar] [CrossRef]
  27. DeLong, E.F.; Karl, D.M. Genomic Perspectives in Microbial Oceanography. Nature 2005, 437, 336–342. [Google Scholar] [CrossRef] [PubMed]
  28. Gao, J.; Xu, G.; Xu, P. Gills Full-Length Transcriptomic Analysis of Osmoregulatory Adaptive Responses to Salinity Stress in Coilia nasus. Ecotoxicol. Environ. Saf. 2021, 226, 112848. [Google Scholar] [CrossRef]
  29. Root, L.; Campo, A.; MacNiven, L.; Con, P.; Cnaani, A.; Kültz, D. Nonlinear Effects of Environmental Salinity on the Gill Transcriptome versus Proteome of Oreochromis niloticus Modulate Epithelial Cell Turnover. Genomics 2021, 113, 3235–3249. [Google Scholar] [CrossRef]
  30. Li, X.; Liu, S.; Wang, Y.; Lu, W.; Zhang, Q.; Cheng, J. Genomic and Transcriptomic Landscape and Evolutionary Dynamics of Heat Shock Proteins in Spotted Sea Bass (Lateolabrax maculatus) under Salinity Change and Alkalinity Stress. Biology 2022, 11, 353. [Google Scholar] [CrossRef]
  31. Zhou, B.; Qi, D.; Liu, S.; Qi, H.; Wang, Y.; Zhao, K.; Tian, F. Physiological, Morphological and Transcriptomic Responses of Tibetan Naked Carps (Gymnocypris przewalskii) to Salinity Variations. Comp. Biochem. Physiol. D Genom. Proteom. 2022, 42, 100982. [Google Scholar] [CrossRef]
  32. Zhao, H.; Wang, Q.; Zhao, H.; Chen, C. Transcriptome Profiles Revealed High- and Low-Salinity Water Altered Gill Homeostasis in Half-Smooth Tongue Sole (Cynoglossus semilaevis). Comp. Biochem. Physiol. D-Genom. Proteom. 2022, 42, 100989. [Google Scholar] [CrossRef] [PubMed]
  33. Li, R.; Liu, J.; Leung, C.T.; Lin, X.; Chan, T.F.; Tse, W.K.F.; Lai, K.P. Transcriptomic Analysis in Marine Medaka Gill Reveals That the Hypo-Osmotic Stress Could Alter the Immune Response via the IL17 Signaling Pathway. Int. J. Mol. Sci. 2022, 23, 12417. [Google Scholar] [CrossRef] [PubMed]
  34. Chutia, P.; Das, M.; Saha, N. Transcriptome Analysis of Gills Reveals Novel Insights into the Molecular Response of Stinging Catfish (Heteropneustes fossilis) to Environmental Hypertonicity. Gene 2023, 851, 147044. [Google Scholar] [CrossRef]
  35. Liu, Y.; Yang, Y.; Qin, R.; Peng, Y.; Huang, Y.; Zhu, C.; Li, G.; Jiang, D.; Shi, H. Divergent Molecular Responses of Greater Amberjack (Seriola dumerili) to Acute Salinity Stress Revealed by Comparative Transcriptome Analysis. Front. Mar. Sci. 2023, 10, 1185015. [Google Scholar] [CrossRef]
  36. Mohindra, V.; Chowdhury, L.M.; Chauhan, N.; Paul, A.; Singh, R.K.; Kushwaha, B.; Maurya, R.K.; Lal, K.K.; Jena, J.K. Transcriptome Analysis Revealed Osmoregulation Related Regulatory Networks and Hub Genes in the Gills of Hilsa Shad, Tenualosa ilisha, during the Migratory Osmotic Stress. Mar. Biotechnol. 2023, 25, 161–173. [Google Scholar] [CrossRef]
  37. Blondeau-Bidet, E.; Tine, M.; Gonzalez, A.-A.; Guinand, B.; Lorin-Nebel, C. Coping with Salinity Extremes: Gill Transcriptome Profiling in the Black-Chinned Tilapia (Sarotherodon melanotheron). Sci. Total Environ. 2024, 929, 172620. [Google Scholar] [CrossRef]
  38. Grabherr, M.G.; Haas, B.J.; Yassour, M.; Levin, J.Z.; Thompson, D.A.; Amit, I.; Adiconis, X.; Fan, L.; Raychowdhury, R.; Zeng, Q.; et al. Full-Length Transcriptome Assembly from RNA-Seq Data without a Reference Genome. Nat. Biotechnol. 2011, 29, 644–652. [Google Scholar] [CrossRef] [PubMed]
  39. Finn, R.D.; Clements, J.; Eddy, S.R. HMMER Web Server: Interactive Sequence Similarity Searching. Nucleic Acids Res. 2011, 39, W29–W37. [Google Scholar] [CrossRef]
  40. Götz, S.; García-Gómez, J.M.; Terol, J.; Williams, T.D.; Nagaraj, S.H.; Nueda, M.J.; Robles, M.; Talón, M.; Dopazo, J.; Conesa, A. High-Throughput Functional Annotation and Data Mining with the Blast2GO Suite. Nucleic Acids Res. 2008, 36, 3420–3435. [Google Scholar] [CrossRef]
  41. Moriya, Y.; Itoh, M.; Okuda, S.; Yoshizawa, A.C.; Kanehisa, M. KAAS: An Automatic Genome Annotation and Pathway Reconstruction Server. Nucleic Acids Res. 2007, 35, W182–W185. [Google Scholar] [CrossRef] [PubMed]
  42. Trapnell, C.; Williams, B.A.; Pertea, G.; Mortazavi, A.; Kwan, G.; van Baren, M.J.; Salzberg, S.L.; Wold, B.J.; Pachter, L. Transcript Assembly and Quantification by RNA-Seq Reveals Unannotated Transcripts and Isoform Switching during Cell Differentiation. Nat. Biotechnol. 2010, 28, 511–515. [Google Scholar] [CrossRef]
  43. Li, B.; Dewey, C.N. RSEM: Accurate Transcript Quantification from RNA-Seq Data with or without a Reference Genome. BMC Bioinform. 2011, 12, 323. [Google Scholar] [CrossRef] [PubMed]
  44. Wang, L.; Feng, Z.; Wang, X.; Wang, X.; Zhang, X. DEGseq: An R Package for Identifying Differentially Expressed Genes from RNA-Seq Data. Bioinformatics 2010, 26, 136–138. [Google Scholar] [CrossRef] [PubMed]
  45. Alexa, A.; Rahnenfuhrer, J. Gene Set Enrichment Analysis with topGO. Bioconductor Improv 2009, 27, 776. [Google Scholar]
  46. Yu, G.; Wang, L.-G.; Han, Y.; He, Q.-Y. clusterProfiler: An R Package for Comparing Biological Themes among Gene Clusters. OMICS J. Integr. Biol. 2012, 16, 284–287. [Google Scholar] [CrossRef]
  47. Zhang, B.; Horvath, S. A General Framework for Weighted Gene Co-Expression Network Analysis. Stat. Appl. Genet. Mol. Biol. 2005, 4, 17. [Google Scholar] [CrossRef]
  48. Chen, T.; Liu, Y.; Huang, L. ImageGP: An Easy-to-use Data Visualization Web Serverfor Scientific Researchers. iMeta 2022, 1, e5. [Google Scholar] [CrossRef]
  49. Li, J.; Wang, H.; Li, B.; Zeng, X.; Liu, S.; Zhuang, Z. Screening and Evaluating Reference Genes for Quantitative Real-Time PCR in Striped Jack (Pseudocaranx dentex). Prog. Fish. Sci. 2023, 44, 107–115. [Google Scholar] [CrossRef]
  50. Sun, H.; Lu, X.; Tong, G.; Yin, J.; Xue, S.; Zhang, L.; Han, Y. Screening of Reference Genes for Real-Time Quantitative PCR in Stewart’s Naked High-Asian-Carp Oxygymnocypris stewarti. J. Dalian Ocean. Univ. 2019, 34, 370–375. [Google Scholar] [CrossRef]
  51. Livak, K.J.; Schmittgen, T.D. Analysis of Relative Gene Expression Data Using Real-Time Quantitative PCR and the 2−ΔΔCT Method. Methods 2001, 25, 402–408. [Google Scholar] [CrossRef] [PubMed]
  52. Mu, H.; Chen, J.; Huang, W.; Huang, G.; Deng, M.; Hong, S.; Ai, P.; Gao, C.; Zhou, H. OmicShare Tools: A Zero-code Interactive Online Platform for Biological Data Analysis and Visualization. Imeta 2024, 3, e228. [Google Scholar] [CrossRef]
  53. Fridman, S. Ontogeny of the Osmoregulatory Capacity of Teleosts and the Role of Ionocytes. Front. Mar. Sci. 2020, 7, 709. [Google Scholar] [CrossRef]
  54. Suzuki, J.; Umeda, M.; Sims, P.J.; Nagata, S. Calcium-Dependent Phospholipid Scrambling by TMEM16F. Nature 2010, 468, 834–838. [Google Scholar] [CrossRef] [PubMed]
  55. Sirianant, L.; Ousingsawat, J.; Wanitchakool, P.; Schreiber, R.; Kunzelmann, K. Cellular Volume Regulation by Anoctamin 6: Ca2+, Phospholipase A2 and Osmosensing. Pflüg. Arch.—Eur. J. Physiol. 2016, 468, 335–349. [Google Scholar] [CrossRef] [PubMed]
  56. Simões, F.; Ousingsawat, J.; Wanitchakool, P.; Fonseca, A.; Cabrita, I.; Benedetto, R.; Schreiber, R.; Kunzelmann, K. CFTR Supports Cell Death through ROS-Dependent Activation of TMEM16F (Anoctamin 6). Pflüg. Arch. Eur. J. Physiol. 2018, 470, 305–314. [Google Scholar] [CrossRef]
  57. Gonen, T.; Walz, T. The Structure of Aquaporins. Q. Rev. Biophys. 2006, 39, 361–396. [Google Scholar] [CrossRef]
  58. Ishibashi, K.; Sasaki, S.; Fushimi, K.; Uchida, S.; Kuwahara, M.; Saito, H.; Furukawa, T.; Nakajima, K.; Yamaguchi, Y.; Gojobori, T. Molecular Cloning and Expression of a Member of the Aquaporin Family with Permeability to Glycerol and Urea in Addition to Water Expressed at the Basolateral Membrane of Kidney Collecting Duct Cells. Proc. Natl. Acad. Sci. USA 1994, 91, 6269–6273. [Google Scholar] [CrossRef]
  59. Kim, Y.K.; Lee, S.Y.; Kim, B.S.; Kim, D.S.; Nam, Y.K. Isolation and mRNA expression analysis of aquaporin isoforms in marine medaka Oryzias dancena, a euryhaline teleost. Comp. Biochem. Physiol. A Mol. Integr. Physiol. 2014, 171, 1–8. [Google Scholar] [CrossRef]
  60. Wang, M.; Yang, J.; Xu, P.; Xu, G.; Xu, D.; You, Y.; Liu, K.; Duan, J.; Zhou, Y.; Fang, D.; et al. Molecular Cloning and Expression Analysis of Aquaporin-1 from the Coilia nasus under High-Salinity Conditions. J. Fish. Sci. China 2017, 24, 449–458. [Google Scholar] [CrossRef]
  61. Aoki, M.; Kaneko, T.; Katoh, F.; Hasegawa, S.; Tsutsui, N.; Aida, K. Intestinal Water Absorption through Aquaporin 1 Expressed in the Apical Membrane of Mucosal Epithelial Cells in Seawater-Adapted Japanese Eel. J. Exp. Biol. 2003, 206, 3495–3505. [Google Scholar] [CrossRef] [PubMed]
  62. Zhang, J.; Liu, Z.; Ma, A.; Cui, W.; Qu, J. Response of Aquaporin (AQP1, AQP3) and Ion Channel Protein (CFTR, NHE1) of Turbot (Scophthalmus maximus) to Low-Salinity Stress. Progrees Fish. Sci. 2024, 41, 41–49. [Google Scholar] [CrossRef]
  63. Gan, Y.; Zhao, J.; Thammaratsuntorn, J.; Li, C. cDNA Cloning of Aquaporin 3 in Sarotherodon melanothern and its tissue expression patterns under salinity stresses. Chin. J. Zool. 2014, 49, 560–569. [Google Scholar] [CrossRef]
  64. Giffard-Mena, I.; Boulo, V.; Aujoulat, F.; Fowden, H.; Castille, R.; Charmantier, G.; Cramb, G. Aquaporin Molecular Characterization in the Sea-Bass (Dicentrarchus labrax): The Effect of Salinity on AQP1 and AQP3 Expression. Comp. Biochem. Physiol. Part A Mol. Integr. Physiol. 2007, 148, 430–444. [Google Scholar] [CrossRef] [PubMed]
  65. Deane, E.E.; Woo, N.Y.S. Tissue Distribution, Effects of Salinity Acclimation, and Ontogeny of Aquaporin 3 in the Marine Teleost, Silver Sea Bream (Sparus sarba). Mar. Biotechnol. 2006, 8, 663–671. [Google Scholar] [CrossRef]
  66. Ellis, L.V.; Bollinger, R.J.; Weber, H.M.; Madsen, S.S.; Tipsmark, C.K. Differential Expression and Localization of Branchial AQP1 and AQP3 in Japanese Medaka (Oryzias latipes). Cells 2019, 8, 422. [Google Scholar] [CrossRef]
  67. Cutler, C.P.; Martinez, A.-S.; Cramb, G. The Role of Aquaporin 3 in Teleost Fish. Comp. Biochem. Physiol. A Mol. Integr. Physiol. 2007, 148, 82–91. [Google Scholar] [CrossRef]
  68. Huang, M.; Wu, M.-X.; Zhang, L.-J.; Mi, D.; Zhang, Y.-L. Effects of Carbonate Alkalinity on Branchial Gene Expression in the Large-Scale Loach (Paramisgurnus dabryanus). Front. Mar. Sci. 2022, 9, 983615. [Google Scholar] [CrossRef]
  69. Wilkie, M.P.; Wright, P.A.; Iwama, G.K.; Wood, C.M. The Physiological Adaptations of the Lahontan Cutthroat Trout (Oncorhynchus clarki henshawi) Following Transfer from Well Water to the Highly Alkaline Waters of Pyramid Lake, Nevada (pH 9.4). Physiol. Zool. 1994, 67, 355–380. [Google Scholar] [CrossRef]
  70. Wilkie, M.P.; Wood, C.M. The Adaptations of Fish to Extremely Alkaline Environments. Comp. Biochem. Physiol. B Biochem. Mol. Biol. 1996, 113, 665–673. [Google Scholar] [CrossRef]
  71. Randall, D.J.; Wood, C.M.; Perry, S.F.; Bergman, H.; Maloiy, G.M.O.; Mommsen, T.P.; Wright, P.A. Urea Excretion as a Strategy for Survival in a Fish Living in a Very Alkaline Environment. Nature 1989, 337, 165–166. [Google Scholar] [CrossRef] [PubMed]
  72. Wilkie, M.P. Ammonia Excretion and Urea Handling by Fish Gills: Present Understanding and Future Research Challenges. J. Exp. Zool. 2002, 293, 284–301. [Google Scholar] [CrossRef] [PubMed]
  73. Nakada, T.; Hoshijima, K.; Esaki, M.; Nagayoshi, S.; Kawakami, K.; Hirose, S. Localization of Ammonia Transporter Rhcg1 in Mitochondrion-Rich Cells of Yolk Sac, Gill, and Kidney of Zebrafish and Its Ionic Strength-Dependent Expression. Am. J. Physiol.-Regul. Integr. Comp. Physiol. 2007, 293, R1743–R1753. [Google Scholar] [CrossRef] [PubMed]
  74. Sashaw, J.; Nawata, M.; Thompson, S.; Wood, C.M.; Wright, P.A. Rhesus Glycoprotein and Urea Transporter Genes in Rainbow Trout Embryos Are Upregulated in Response to Alkaline Water (pH 9.7) but Not Elevated Water Ammonia. Aquat. Toxicol. 2010, 96, 308–313. [Google Scholar] [CrossRef]
  75. Chang, Y.-M.; Tang, R.; Dou, X.-J.; Tao, R.; Sun, X.-W.; Liang, L.-Q. Transcriptome and Expression Profiling Analysis of Leuciscus waleckii: An Exploration of the Alkali-Adapted Mechanisms of a Freshwater Teleost. Mol. BioSyst. 2014, 10, 491–504. [Google Scholar] [CrossRef]
  76. He, Q.; Chang, Y.; Su, B.; Sun, B.; Sun, X.; Liang, L. Effects of carbonate alkalinities on oxygen consumption, ammonia excretion and ammonia excretion gene expression in Leuciscus waleckii Dybowski. J. Shanghai Ocean. Univ. 2016, 25, 551–558. [Google Scholar] [CrossRef]
  77. Wang, Y.S.; Gonzalez, R.J.; Patrick, M.L.; Grosell, M.; Zhang, C.; Feng, Q.; Du, J.; Walsh, P.J.; Wood, C.M. Unusual Physiology of Scale-Less Carp, Gymnocypris przewalskii, in Lake Qinghai: A High Altitude Alkaline Saline Lake. Comp. Biochem. Physiol. A Mol. Integr. Physiol. 2003, 134, 409–421. [Google Scholar] [CrossRef]
  78. Chang, Y.; Liang, L. Advances of research of physiological and molecular mechanisms related to alkali-saline adaptation for fish species inhabiting alkali-saline water. J. Fish. China 2021, 45, 798–812. [Google Scholar] [CrossRef]
  79. Wu, S.C.; Horng, J.L.; Liu, S.T.; Hwang, P.P.; Wen, Z.H.; Lin, C.S.; Lin, L.Y. Ammonium-Dependent Sodium Uptake in Mitochondrion-Rich Cells of Medaka (Oryzias latipes) Larvae. Am. J. Physiol. Cell Physiol. 2010, 298, C237–C250. [Google Scholar] [CrossRef]
  80. Hsu, H.-H.; Lin, L.-Y.; Tseng, Y.-C.; Horng, J.-L.; Hwang, P.-P. A New Model for Fish Ion Regulation: Identification of Ionocytes in Freshwater- and Seawater-Acclimated Medaka (Oryzias latipes). Cell Tissue Res. 2014, 357, 225–243. [Google Scholar] [CrossRef]
  81. Liu, S.-T.; Horng, J.-L.; Chen, P.-Y.; Hwang, P.-P.; Lin, L.-Y. Salt Secretion Is Linked to Acid-Base Regulation of Ionocytes in Seawater-Acclimated Medaka: New Insights into the Salt-Secreting Mechanism. Sci. Rep. 2016, 6, 31433. [Google Scholar] [CrossRef] [PubMed]
  82. Sender, S.; Böttcher, K.; Cetin, Y.; Gros, G. Carbonic Anhydrase in the Gills of Seawater-and Freshwater-Acclimated Flounders Platichthys flesus: Purification, Characterization, and Immunohistochemical Localization. J. Histochem. Cytochem. 1999, 47, 43–50. [Google Scholar] [CrossRef]
  83. Wilson, J.M.; Randall, D.J.; Donowitz, M.; Vogl, A.W.; Ip, A.K.-Y. Immunolocalization of Ion-Transport Proteins to Branchial Epithelium Mitochondria-Rich Cells in the Mudskipper (Periophthalmodon schlosseri). J. Exp. Biol. 2000, 203, 2297–2310. [Google Scholar] [CrossRef] [PubMed]
  84. Tang, C.H.; Lee, T.H. The Novel Correlation of Carbonic Anhydrase II and Anion Exchanger 1 in Gills of the Spotted Green Pufferfish, Tetraodon nigrovirids. J. Exp. Zool. Part A Ecol. Genet. Physiol. 2007, 307, 411–418. [Google Scholar] [CrossRef]
  85. Gu, J.; Dai, S.; Liu, H.; Cao, Q.; Yin, S.; Lai, K.P.; Tse, W.K.F.; Wong, C.K.C.; Shi, H. Identification of Immune-Related Genes in Gill Cells of Japanese Eels (Anguilla japonica) in Adaptation to Water Salinity Changes. Fish Shellfish Immunol. 2018, 73, 288–296. [Google Scholar] [CrossRef]
  86. Bekeredjian-Ding, I.; Inamura, S.; Giese, T.; Moll, H.; Endres, S.; Sing, A.; Zähringer, U.; Hartmann, G. Staphylococcus aureus Protein A Triggers T Cell-Independent B Cell Proliferation by Sensitizing B Cells for TLR2 Ligands. J. Immunol. 2007, 178, 2803–2812. [Google Scholar] [CrossRef] [PubMed]
  87. Ho, A.W.; Gaffen, S.L. IL-17RC: A Partner in IL-17 Signaling and Beyond. Semin. Immunopathol. 2010, 32, 33–42. [Google Scholar] [CrossRef]
  88. Houde, A.L.S.; Akbarzadeh, A.; Günther, O.P.; Li, S.; Patterson, D.A.; Farrell, A.P.; Hinch, S.G.; Miller, K.M. Salmonid Gene Expression Biomarkers Indicative of Physiological Responses to Changes in Salinity and Temperature, but Not Dissolved Oxygen. J. Exp. Biol. 2019, 222, jeb198036. [Google Scholar] [CrossRef]
  89. Makrinos, D.L.; Bowden, T.J. Natural Environmental Impacts on Teleost Immune Function. Fish Shellfish Immunol. 2016, 53, 50–57. [Google Scholar] [CrossRef]
  90. Jing, L.B. Analysis of the Characteristics and Changing Trends of Surface Water Chemical Compositions in the Main Stream of the Taizi River in Liaoyang City. Ground Water 2024, 46, 102–104. [Google Scholar] [CrossRef]
Figure 1. Geographical locations of the sampling sites. The exact coordinates are 40°31′23″ N, 81°16′38″ E (STR), 41°10′27″ N, 84°13′39″ E (YBZ), 39°29′38″ N, 88°18′8″ E (TL), and 41°22′51″ N, 123°54′45″ E (TIR). The sampling sites are denoted with a circle (STR), triangle (YBZ), square (TL), and pentagon (TIR).
Water 17 01794 g001
Figure 2. (a) Principal component analysis (PCA) based on the expression of unigenes. (b) Number of unigenes’ functional annotation in different databases. (c) The distribution of annotated species in NR. (d) Number of unigenes annotated to GO terms. (e) Number of unigenes annotated to KEGG pathways.
Water 17 01794 g002
Figure 3. (a) Heatmap of clustering analysis on gene expression pattern comparison. (b) Patterns of gene expressions across four salinity–alkalinity stresses in P. parva. (c) Differential gene expression analysis showing up- and down-regulated genes across all groups. (d) Venn diagram of all DEGs.
Water 17 01794 g003
Figure 4. Enrichment circle map of the top 20 GO terms in the four comparison groups. (a) The top 20 GO terms in TIR vs. STR. (b) The top 20 GO terms in TIR vs. YBZ. (c) The top 20 GO terms in TIR vs. TL. (d) The top 20 GO terms in STR vs. YBZ. (e) The top 20 GO terms in STR vs. TL. (f) The top 20 GO terms in YBZ vs. TL. Four circles from outside to inside. The first circle is the classification of enrichment, the second circle shows the number of genes contained in the term and the p-value, the third circle is a bar chart of the proportion of up- and down-regulated genes, and the fourth circle is the RichFactor value for each classification (the number of DEGs in that classification divided by the number of all genes contained in that term), with each cell of the background auxiliary line indicating 0.1.
Water 17 01794 g004
Figure 5. Enrichment analysis of the top 20 KEGG pathways in the four comparison groups. (a) The top 20 pathways in TIR vs. STR. (b) The top 20 pathways in TIR vs. YBZ. (c) The top 20 pathways in TIR vs. TL. (d) The top 20 pathways in STR vs. YBZ. (e) The top 20 pathways in STR vs. TL. (f) The top 20 pathways in YBZ vs. TL. Different colors represent different KEGG A class categories.
Water 17 01794 g005
Figure 6. WGCNA in P. parva gills with salinity and alkalinity stress. (a) Sample cluster with traits. Sal (salinity), TA (total alkalinity), DO (dissolved Oxygen), T (temperature), NO2 (nitrite nitrogen), NO3 (nitrate nitrogen), NH4 (ammonia nitrogen), TN (total nitrogen), TP (total phosphorus), Ca (calcium), Mg (magnesium), Na (sodium), K (potassium), Cl (chlorine), BL (body length), W (weight). (b) Clustering dendrogram of genes, with dissimilarity based on topological overlap, together with assigned merged module colors and the original module colors. (c) Visualization of the eigengene network representing the relationships among the modules and the trait weight. The top half shows a hierarchical clustering dendrogram of the eigengenes in which the dissimilarity of eigengenes EI and EJ is given by 1 − cor(EI; EJ). The heatmap in the lower half shows the eigengene adjacency AIJ = (1 + cor(EI; EJ))/2. (d) Module–trait associations. Each row corresponds to a module eigengene and each column corresponds to a trait. The table is color-coded by correlation according to the color legend. The number in each cell is the correlation, and the number in parentheses is the p-value. (e) Partial DEGs that are co-enriched in the saline- and alkaline-trait modules.
Water 17 01794 g006
Figure 7. (a) Osmoregulation-related DEGs; (b) immune-system-related DEGs; (c) relevant DEGs enriched to the KEGG pathway. X-axis is the rich factor, which is the number of DEGs enriched to the pathway/the total number of genes annotated to the pathway. (d) Schematic diagram of the regulatory mechanism of saline–alkali adaptation. Red indicates up-regulated genes, and green indicates down-regulated genes.
Water 17 01794 g007
Figure 8. (a) The verification of RNA-seq analysis by qRT-PCR. The blue and orange bars indicate the log2 fold changes measured by qRT-PCR and RNA-seq. (b) The correlation analysis of DEGs expression detected by qRT-PCR and RNA-seq. We generated the scatterplots by the log2 fold changes of RNA-seq (x-axis) and qRT-PCR (y-axis). The reference line represents the linear relationship between the results of RNA-seq and RT-qPCR.
Water 17 01794 g008
Disclaimer/Publisher’s Note: The statements, opinions and data contained in all publications are solely those of the individual author(s) and contributor(s) and not of MDPI and/or the editor(s). MDPI and/or the editor(s) disclaim responsibility for any injury to people or property resulting from any ideas, methods, instructions or products referred to in the content.