Article

Optimizing Landslide Susceptibility Mapping with Non-Landslide Sampling Strategy and Spatio-Temporal Fusion Models

1
Geotechnical Research Institute, College of Civil and Transportation Engineering, Hohai University, Nanjing 210024, China
2
School of Civil and Hydropower Engineering, Bengbu University, Bengbu 233030, China
3
State Laboratory of Intelligent Mining and Equipment of Deep Metal Mines, Shaoxing University, Shaoxing 312000, China
4
Key Laboratory of Rock Mechanics and Geohazards of Zhejiang Province, Shaoxing University, Shaoxing 312000, China
*
Authors to whom correspondence should be addressed.
Water 2025, 17(12), 1778; https://doi.org/10.3390/w17121778
Submission received: 30 April 2025 / Revised: 5 June 2025 / Accepted: 11 June 2025 / Published: 13 June 2025
(This article belongs to the Special Issue Intelligent Analysis, Monitoring and Assessment of Debris Flow)

Abstract

Landslides are among the most destructive geological hazards, necessitating precise landslide susceptibility mapping (LSM) for effective risk management. This study focuses on the northeastern region of Leshan City and investigates the influence of various non-landslide sampling strategies and machine learning (ML) models on LSM performance. Ten landslide conditioning factors, selected by SHAP analysis, and six models were utilized: Convolutional neural networks (CNNs), Long Short-Term Memory (LSTM), CNN-LSTM, CNN-LSTM with an attention mechanism (AM), Random Forest (RF), and eXtreme Gradient Boosting combined with Logistic Regression (XGBoost-LR). Three non-landslide sampling strategies were designed, with the certainty factor-based approach demonstrating superior performance by effectively capturing geological and physical characteristics, applying spatial constraints to exclude high-risk zones, and achieving improved mean squared error (MSE) and area under the curve (AUC) values. The results reveal that traditional ML models struggle with complex nonlinear relationships and imbalanced datasets, often leading to high false positive rates. In contrast, deep learning (DL) models—particularly CNN-LSTM-AM—achieved the best performance, with an AUC of 0.9044 and enhanced balance in accuracy, precision, recall, and Kappa. These improvements are attributed to the model’s ability to extract static spatial features (via CNNs), capture dynamic temporal patterns (via LSTM), and emphasize key features through the attention mechanism. This integrated architecture enhances the capacity to process heterogeneous data and extract landslide-relevant features. Overall, optimizing non-landslide sampling strategies, incorporating comprehensive geophysical information, enforcing spatial constraints, and enhancing feature extraction capabilities are essential for improving the accuracy and reliability of LSM.

1. Introduction

Landslides, widespread geological disasters, are closely linked to socioeconomic development and ecological stability [1]. Their frequency and intensity have risen due to climate change and human activities, making landslide susceptibility assessment crucial for disaster prevention [2]. Current evaluation systems mainly rely on two frameworks: deterministic methods based on physical mechanics and statistical learning methods [3]. Incorporating GIS and remote sensing, LSM aids in land planning and disaster warning [4]. Early assessments used qualitative analysis and statistical methods like AHP and IVM [5]. Yin and Yan applied IVM in the Three Gorges Reservoir Area, but it struggled with high-dimensional data [6]. Yang Qiang’s team combined information value, certainty coefficients, and evidence weight methods with LR and found that the information value–LR model had better accuracy [7].
With computer technology advancement, ML has been widely used in LSM. ML can capture complex relationships among factors via nonlinear mapping, preserve hierarchical data features, and make accurate predictions without prior geological models [8]. LR, artificial neural networks (ANNs), support vector machines (SVMs), and RF have formed a mature technical framework [9,10]. Dang et al. found that RF outperformed LR and SVMs in northern Vietnam [11]. Yesilnacar et al. confirmed LR’s effectiveness in modeling landslide conditioning factor relationships but noted its limitations with nonlinear data [12]. Although SVMs and RF have good predictive performance, SVMs have parameter tuning complexity, and RF has a high computational cost and data dependency [13].
DL, as an emerging multi-layer neural network algorithm, can address some ML shortcomings. DL possess the ability to extract inherent and deep features, with data-driven approaches as their core, without the need for additional prior knowledge or assumptions [14,15,16,17]. Xiao et al. compared decision trees, SVMs, BP neural networks (BP_NN), and LSTM and found that DL performed better in spatio-temporal feature extraction [18]. HABUMUGISHA et al. found that deep neural networks (DNNs) outperformed other models in Maoxian County [19]. Cui et al. proposed a hybrid method of physical probability models and CNNs for rainfall-induced landslide prediction, enhancing LSM stability and reliability [20,21,22,23]. Recently, coupled models have become innovative in LSM. They balance bias–variance trade-off via heterogeneous algorithm collaboration, improving LSM accuracy and generalization [24]. Coupled model implementation includes integrated learning frameworks using Bagging/Boosting [25], multi-level architectures optimizing classifier consensus via meta-learners [26], and feature-level coupling using DNN feature mapping and algorithm decision reconstruction [27]. Zhang Jinming et al. found the IV-LR model to be the best among four coupled models in Sichuan Province [28]. Azarafza et al. showed that CNN-DNN outperformed traditional ML in Iran [29].
Despite the progress on LSM, input factor selection and landslide sampling strategies remain challenges. Sansar Raj Meena et al. found terrain features to be central in prediction, but removing non-critical features had a limited impact [30]. Most studies process spatial and temporal data separately, lacking effective integration [31]. Kalantar et al. found that combining spatial and temporal features improves prediction [32]. Non-landslide sampling strategies vary, and each one has limitations [33,34,35]. Gu et al. found that different strategies yielded different results, with positive-unlabeled bagging plus CatBoost achieving the highest AUC, while K-means overfitted and buffer control sampling performed the worst [36]. In addition, the uncertainty of geotechnical parameters is also a challenge [37,38,39].
In summary, this study first discusses different strategies for non-landslide sampling and compares them to optimize the landslide sample dataset. In terms of the model, the CNN-LSTM-AM coupled model based on the AM framework is constructed to comprehensively consider both static spatial feature data and dynamic temporal feature data. A total of five parallel experiments were conducted using CNNs, LSTM, CNN-LSTM, RF, and XGBoost-LR, and the prediction accuracy of each model was comprehensively evaluated and analyzed using multi-dimensional metrics to provide a scientific basis for disaster prevention and mitigation work in Leshan City.

2. Materials and Methods

2.1. Introduction to the Study Area

The study area is located in the northeastern part of Leshan City, Sichuan Province, characterized by a hilly and plain terrain (see Figure 1). The region has a subtropical monsoon climate, with an annual average temperature of 17.6 °C and annual precipitation of approximately 1500 mm.
The study area is close to the Longmen Mountains, Xianshui River, and Daliang Mountains fault zones, featuring complex geological structures and frequent seismic activity, significantly increasing the likelihood of secondary disasters. For example, on 14 January 2015, a 5.0-magnitude earthquake occurred in the Jinkou River District, further exacerbating the geological disaster risks in the region. According to historical data from the Sichuan Provincial Seismological Bureau, 782 landslide events have been recorded within the study area, accounting for 60% of the historical landslide data of Leshan City. The region possesses extensive historical landslide records, with both the frequency and scale of events exhibiting an increasing trend in recent years. As a vital transportation hub for Leshan City, the study area features a well-developed road network. An analysis of the region’s geological and climatic characteristics—characterized by high rainfall, unconsolidated deposits, and frequent seismic activity—combined with historical landslide data, indicates that the majority of documented events are shallow landslides. Consequently, our model prioritizes shallow landslide mechanisms. It is notable that this area, predominantly consisting of plains, exhibits spatially scattered landslides, an abnormality warranting attention. Coupled with persistent seismic hazards, the region demonstrates high susceptibility to geological disasters, posing a significant threat to local socioeconomic development. Given these distinctive characteristics, the study area represents a critical and representative case for developing the LSM of Leshan City.

2.2. Landslide Conditioning Factors

This study aims to reveal the mechanisms underlying landslide occurrence by integrating key factors such as topography, land cover, hydrological characteristics, and vegetation conditions and by combining spatial and temporal feature data. Spatial feature data selected include elevation (DEM), slope, aspect, land use, road and river buffer zones, plan curvature, lithology, normalized difference vegetation index (NDVI), terrain moisture index (TWI), and other spatial feature data, as well as temporal characteristics such as the monthly average rainfall (rainfall) and temperature (temperature), totaling 12 landslide conditioning factors. The data sources are listed in Table 1.
Elevation [40] indirectly influences landslide probability by affecting vegetation distribution, soil moisture, and surface runoff; steeper slopes result in higher runoff velocity and erosion intensity, significantly increasing landslide risk; aspect [41] affects slope stability by altering light exposure and evaporation conditions; land use type indirectly influences landslide probability by altering surface runoff and soil moisture, indirectly affecting landslide probability.
Road and river buffer zones [42,43] reflect the impact of human and natural disturbances on slope stability; in terms of lithology, gneiss is prone to weathering and instability, sandstone is susceptible to erosion, and mudstone increases landslide risk due to water absorption and expansion. NDVI (from 2015 to 2020, using Landsat 5/8 imagery from the US Landsat satellites, based on the Google Earth Engine (GEE) remote sensing cloud computing platform) [44] is correlated with erosion resistance, with low values indicating sparse vegetation, and higher landslide risk. TWI [45] quantifies surface water accumulation capacity, with higher values indicating greater landslide sensitivity. Rainfall [46] may trigger landslides by increasing soil moisture content and pore pressure, thereby reducing soil shear strength. Temperature [47] influences landslide risk through thermodynamic mechanisms. Low temperatures cause soil freezing and expansion, while high temperatures intensify evaporation.
To analyze the spatio-temporal heterogeneity of dynamic environmental variables, this study selected monthly average rainfall and temperature data from 2015 to 2020.
All landslide conditioning factors were unified to a resolution of 30 m × 30 m, and continuous variables were standardized and reassigned to improve the spatial consistency of the data (see Figure 2). By integrating multi-dimensional data, this study constructed an evaluation system that comprehensively reflects landslide mechanisms, providing a scientific basis for LSM.
The lithology of the slope body [48] is the material basis for landslide occurrence. Different lithologies have varying shear strengths, leading to different degrees of difficulty in landslide occurrence. Based on the 1:200,000 geological map of Leshan City, field geological surveys, and the existing literature [49], the strata in the study area were merged and classified according to lithological similarity. The classification results are detailed in Table 2.

2.3. Convolutional Neural Networks

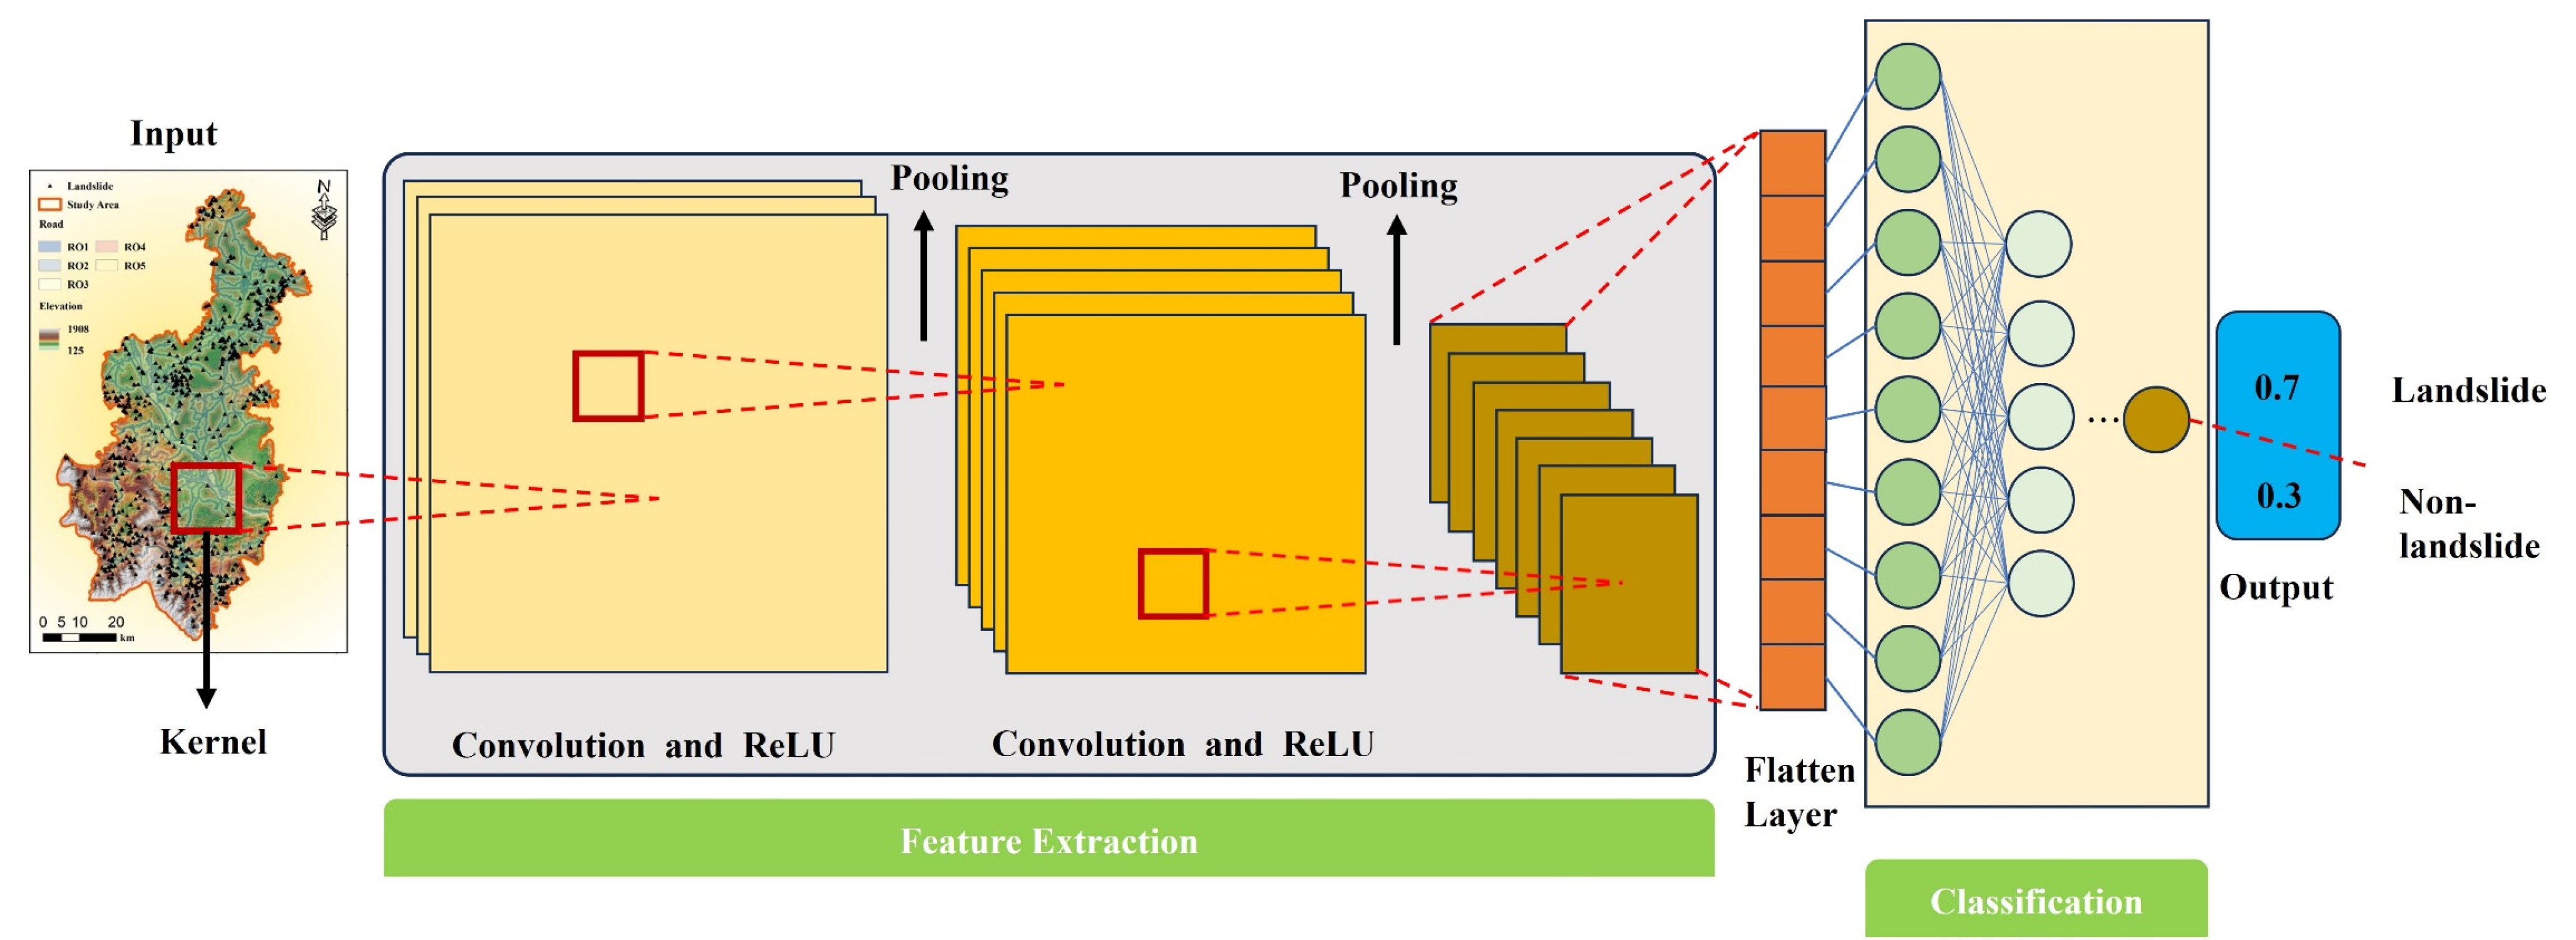
Convolutional neural networks (CNNs) are a type of feedforward neural network with a deep architecture [50]. A typical CNN architecture consists of an input layer, an output layer, and multiple hidden layers. The hidden layers achieve feature abstraction through the collaborative work of modules such as convolution layers, pooling layers, fully connected layers, and normalization layers (see Figure 3).
As a core component of the network, the convolution layer performs feature extraction operations through parameterized filters (convolution kernels). The weight parameters of the convolution kernels are optimized and adjusted through the backpropagation algorithm, and their numerical distribution reflects the significance of different feature patterns. The stride parameter controls the sliding interval of the filter in the input space and directly affects the reduction ratio of the feature map. When the stride is s, the convolution operation can be expressed as:
I K i , j = C = 0 C 1 m = 0 f 1 n = 0 f 1 I c , s i + m , s j + n × K c , m , n
In the equation, ∗ represents the convolution operation, IK is the result of the convolution, [I, j] is the pixel position of the output feature image, I[c, s·i+m, s·j+n] is the pixel value of the original input image in channel c and position (s·i+m, s·j+n), and K[c, m, n] is the value of the convolution kernel in channel c and position (m, n).
The pooling layer serves as a key module for feature dimension reduction, compressing features through a sliding window strategy. This layer uses a downsampling operator to extract the most responsive feature values within a specified region, retaining significant features while discarding redundant spatial information to reduce the dimension of the feature map.
The fully connected layer is responsible for high-level feature integration and pattern recognition. This layer uses a global connection mechanism to achieve feature combination across receptive fields through a densely connected neural network. Each neuron is connected to all other neurons in the network, and the output of the layer is the weighted sum of all connections:
z = w i x i + b
Nonlinear transformations are applied to the features of the previous layer, where the weight matrix wi is a discriminative transformation from the feature space to the category space. Through a multi-layer perceptron architecture, this layer integrates distributed local features into a global semantic representation, effectively eliminating feature space position sensitivity and thereby improving the classifier’s robustness to geometric transformations such as target translation and rotation.

2.4. Long Short-Term Memory Neural Network

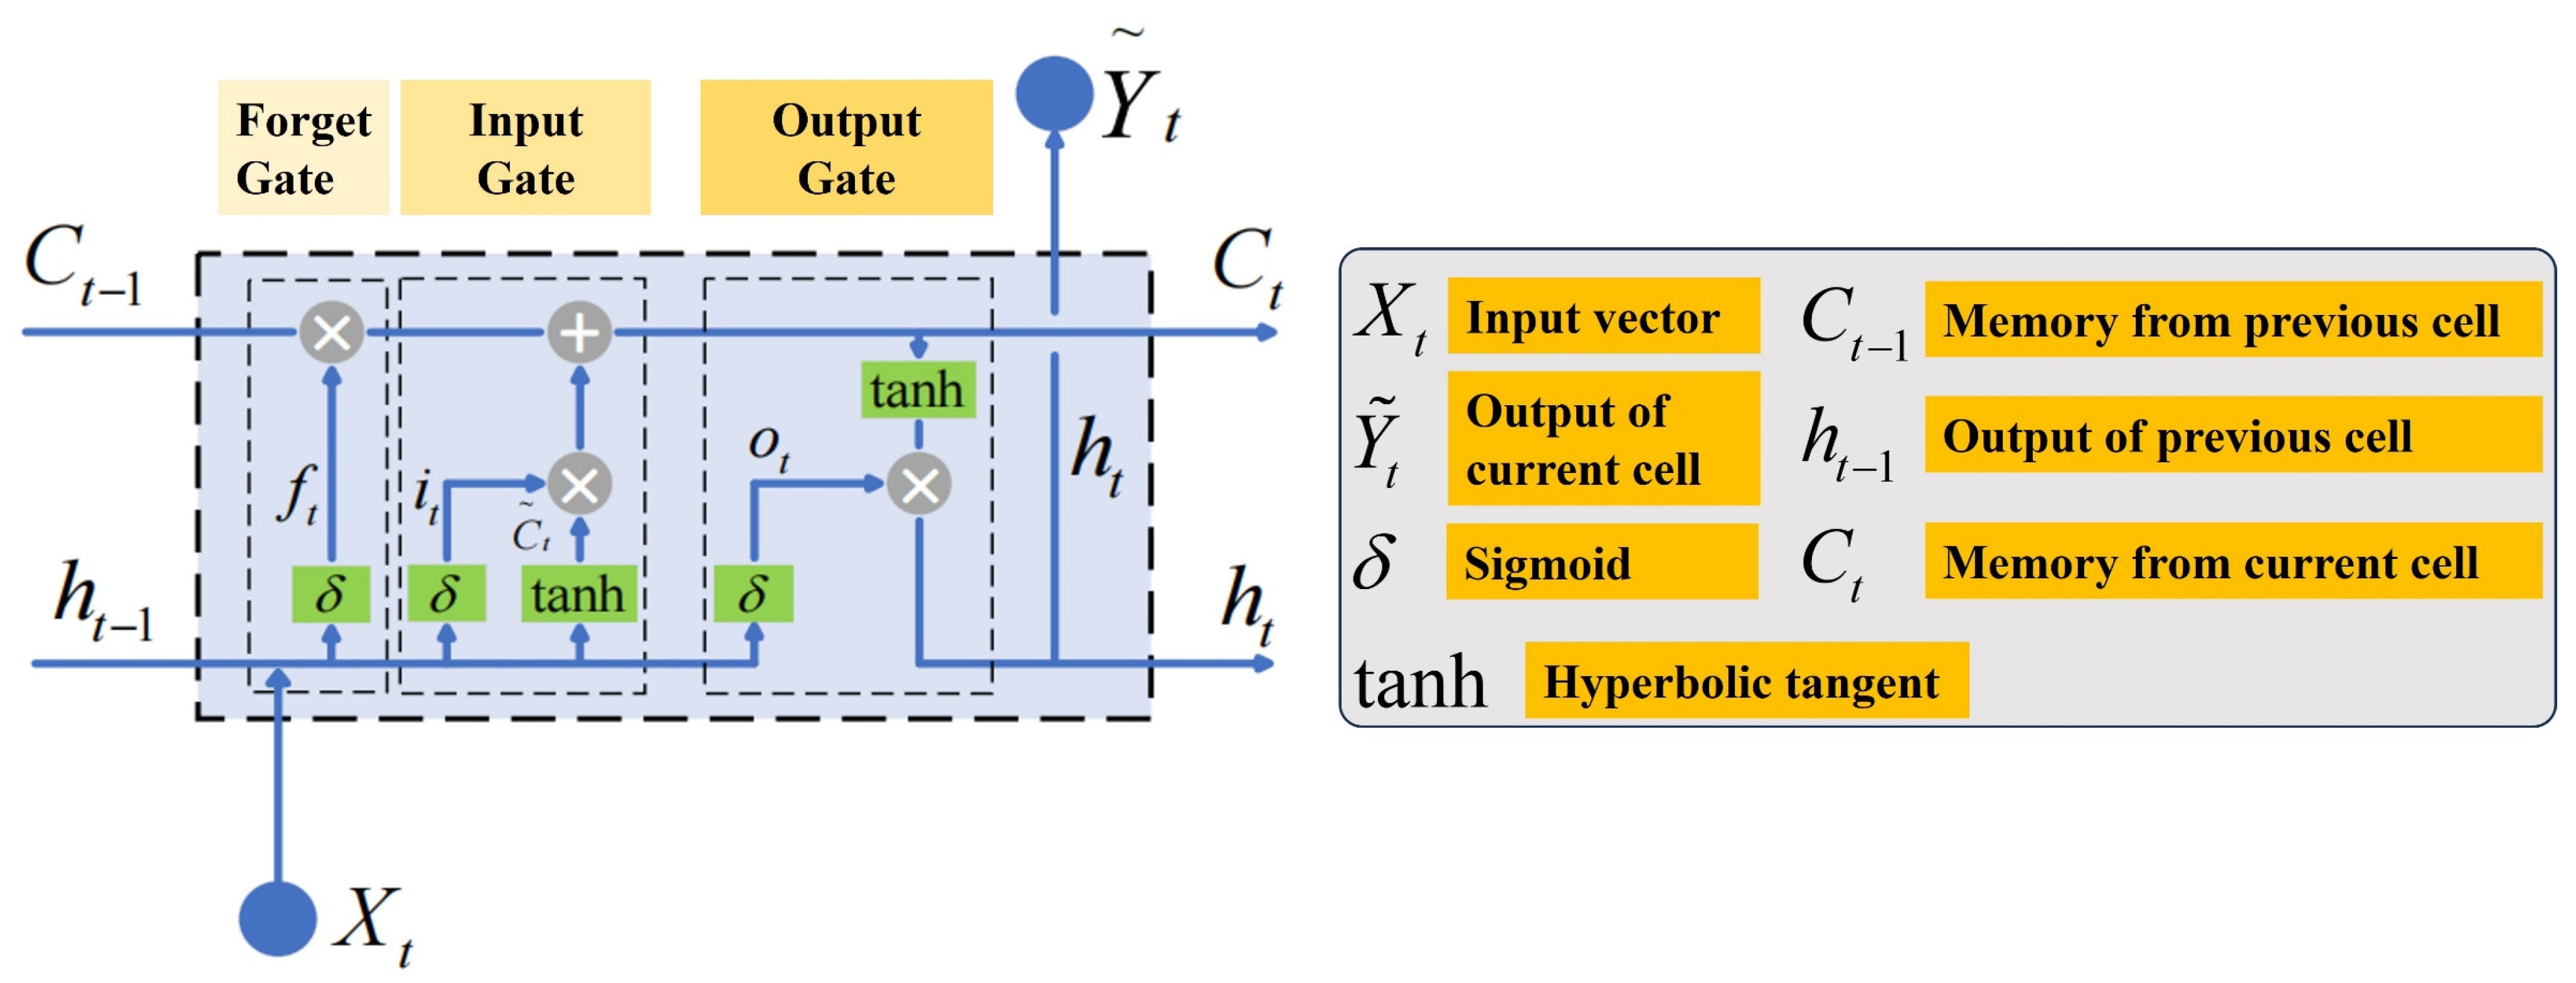
Long Short-Term Memory (LSTM) effectively solves the gradient disappearance problem of RNNs through a learnable gating mechanism [51]. The LSTM unit dynamically regulates the information flow through a gating mechanism (see Figure 4), and its core components include a forget gate, an input gate, and an output gate. The forget gate uses the Sigmoid function to screen the historical hidden state ht−1 and the current input Xt to determine the retention ratio of the cell state Ct−1; the input gate uses a combination of the Sigmoid and tanh functions to calculate the update amount of the current candidate memory; and the two work together to complete the iterative update of the cell state. The output gate performs a nonlinear transformation and selective output on the updated cell state to generate the current hidden state ht.
This architecture achieves stable gradient flow through the differential operation of gate units, where the Sigmoid function is responsible for information filtering and the tanh function provides a nonlinear transformation. The gate parameters are optimized end-to-end through backpropagation, enabling the network to model long-term dependencies:
δ x = 1 1 + e x
tanh x = e x e x e x + e x
For the hidden layer value ht of the LSTM neural network module at time t, the calculation formula is as follows:
The filtering value of the forget gate for information is as follows:
f t = δ W f · h t 1 , X t + b f
In the equation, Xt is the output value at time t; ht−1 is the output value at time t−1; Wf is the weight matrix; and bf is the bias vector.
Input gate retention of information:
i t = δ W t · h t 1 , X t + b i
C ˜ t = tanh W C · h t 1 , X t + b C
In the equation, Wi and WC are weight matrices and bi and bC are bias vectors.
The forget gate and input gate for the memory cell unit information update are as follows:
C t = f t C t 1 + i t C ˜ t
The output gate determines the hidden layer values of the LSTM neural network module:
o t = δ W o · h t 1 , X t + b o
h t = o t tanh C t
In the formula, Wo is the weight matrix and bo is the bias vector.

2.5. Attention Mechanism

The attention mechanism (AM) is a core technology in the field of DL. Its principle is based on simulating selective attention in the human cognitive process, i.e., prioritizing key information when processing massive amounts of information to improve computational efficiency and task performance [52,53].
The mathematical model of the attention mechanism typically includes the following steps: Calculate weights: for a given query and a set of keys, calculate the similarity or relevance scores between them.
e t = tanh W h · h t + b h
Normalization: normalize the scores using the Softmax or Sigmoid function to obtain the weight corresponding to each key.
α t = exp e t t = 1 T exp e t
Weighted sum: weight the corresponding values (value) according to their weights and add them to obtain the final attention output.
c = t = 1 T α t · h t
Among them, et is the attention score, αt is the normalized attention weight, and c is the weighted context vector.

2.6. CNN-LSTM-AM

In the construction of LSM models, establishing a nonlinear mapping relationship between landslide conditioning factors and landslide sample data is key to improving model performance, which places higher demands on the model’s heterogeneous data and feature data mining capabilities [54].
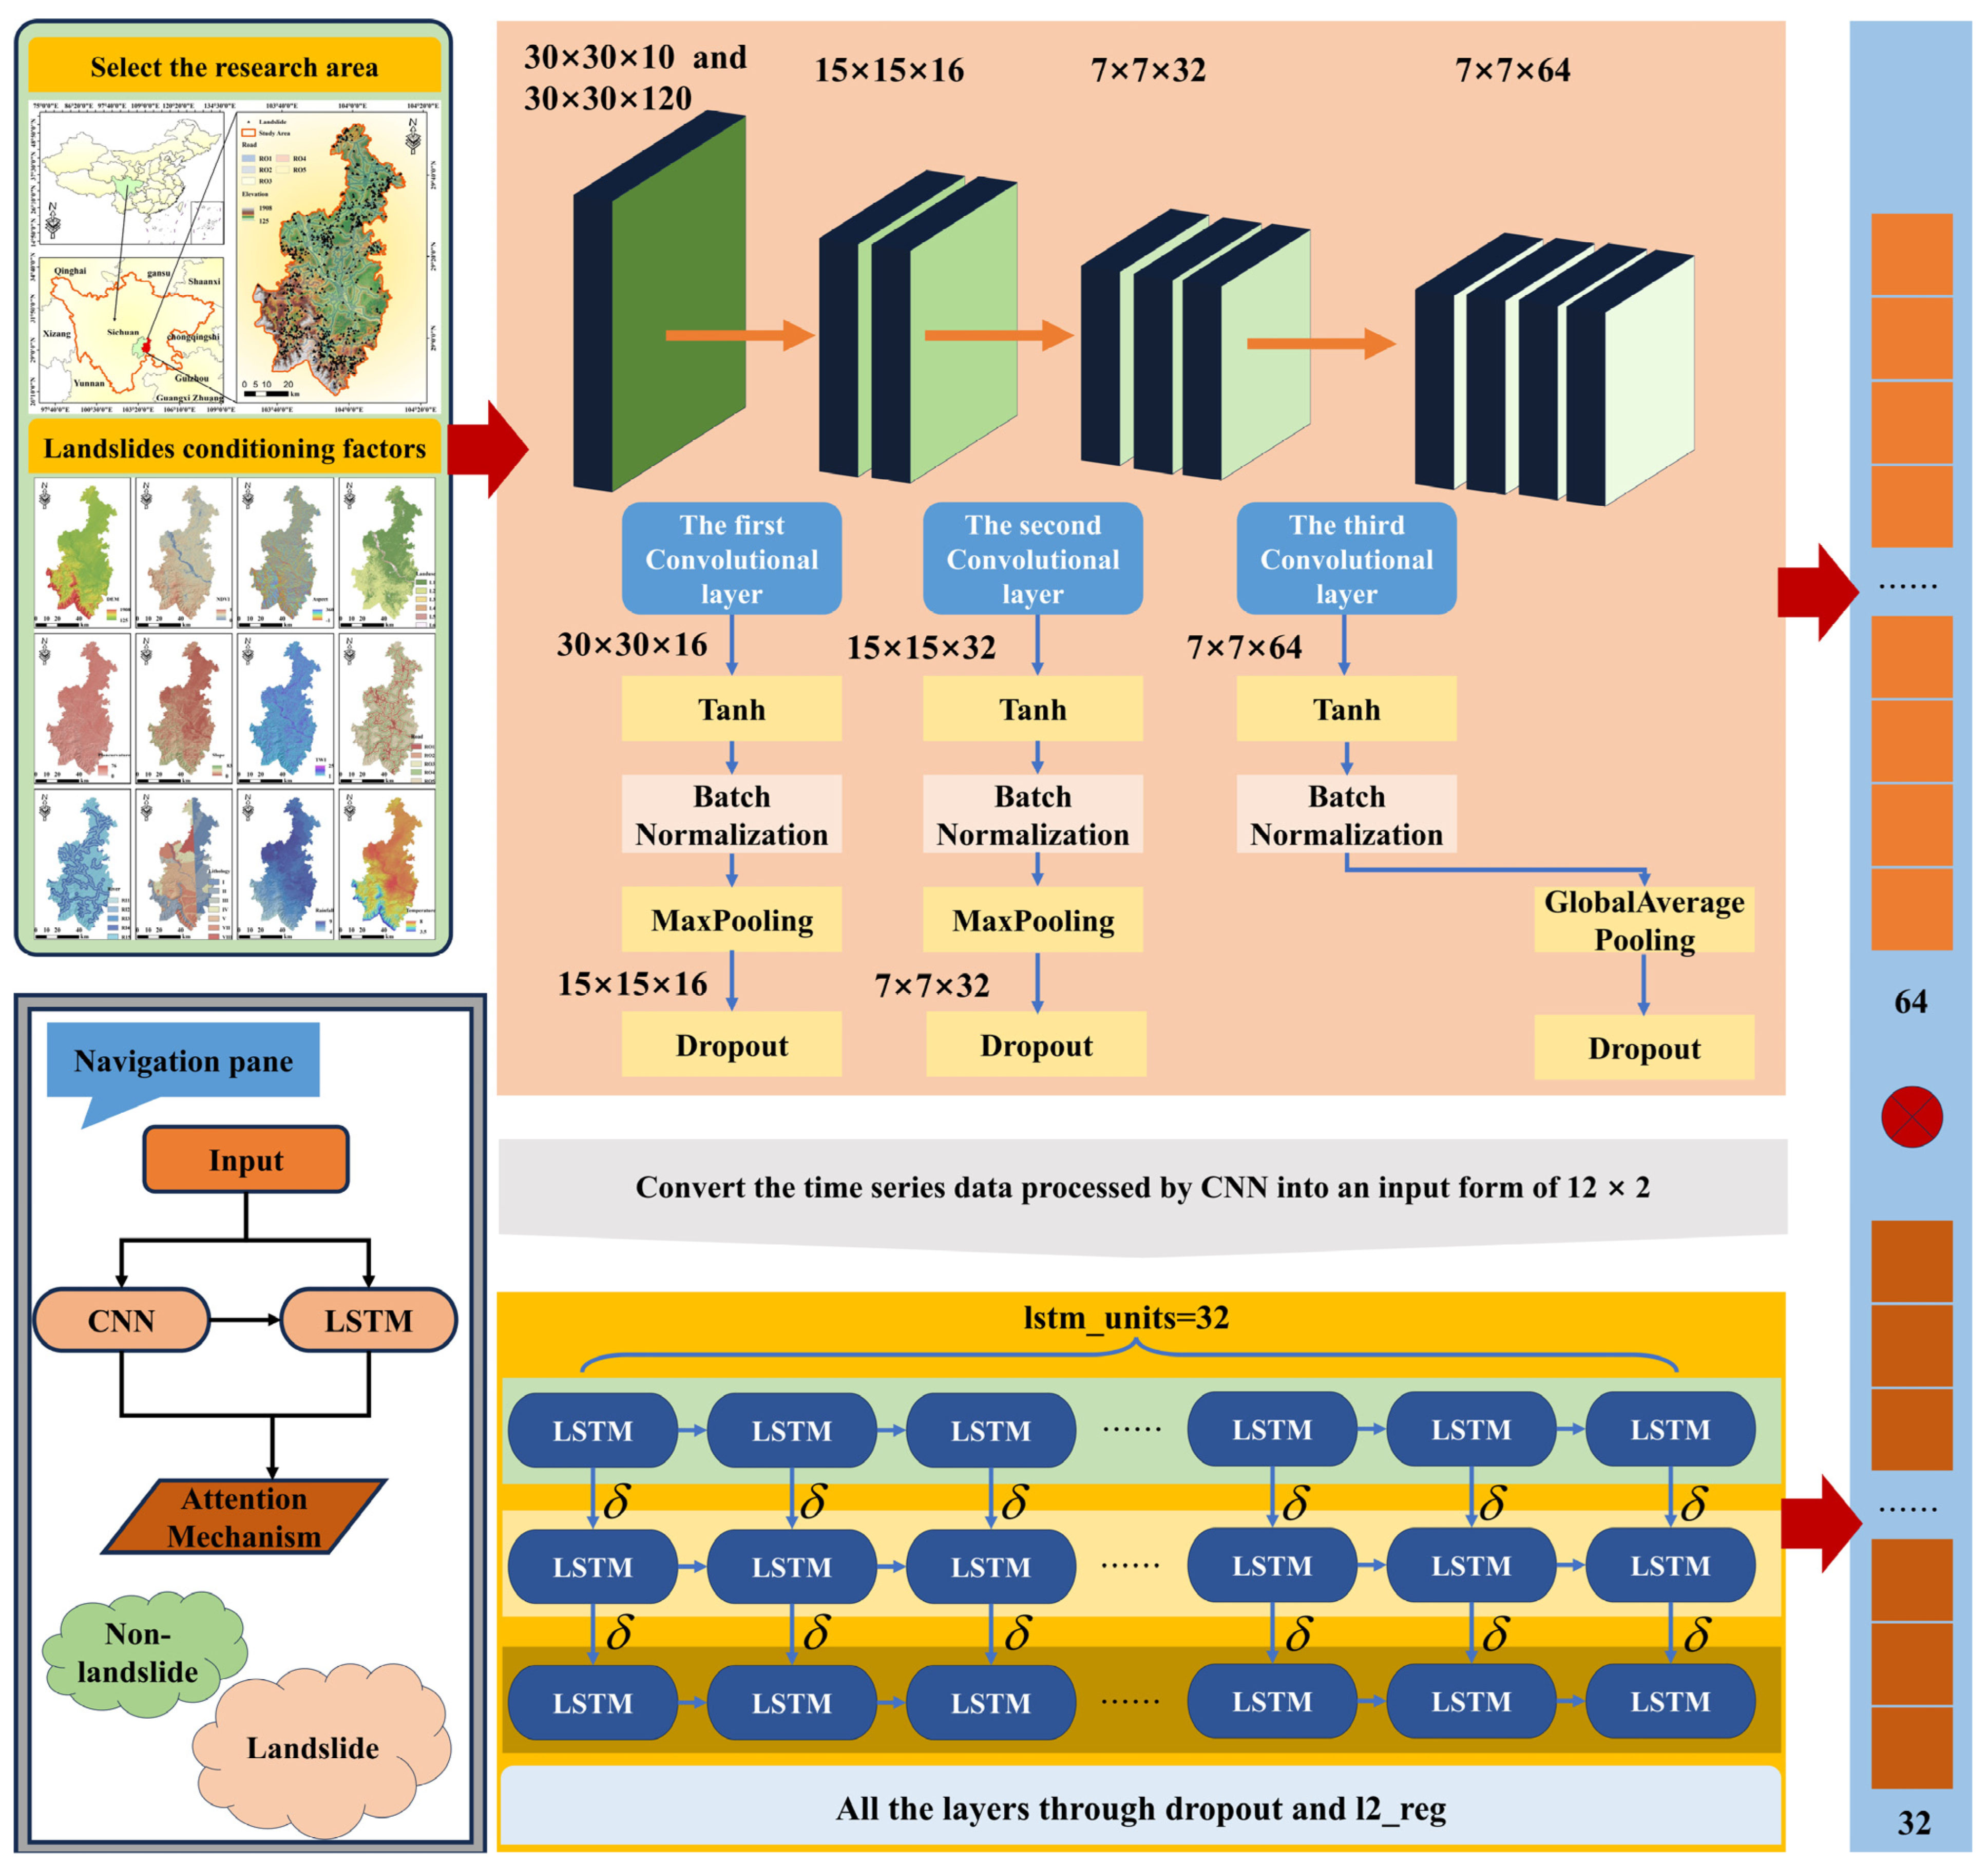
The model architecture proposed in this study consists of a three-stage Bayesian-optimized CNN spatial feature extractor, an LSTM temporal modeling module, and a dynamic attention fusion network. As shown in Figure 5, the CNN focuses on the spatial structure of 2D feature maps, with temporal features reflecting their spatial distribution patterns. Meanwhile, LSTM deals with the temporal dimension of 3D data. During preprocessing, the CNN processes multi-channel feature maps in two forms: spatial factors (30 × 30 × 10) and temporal factors (30 × 30 × 120). All factors were reclassified in ArcGIS, standardized during code reading, and then input as multi-channel grid data; the first layer captures local features through sixteen 3 × 3 filters, which are then activated by tanh and batch-normalized, followed by two 2 × 2 max pooling operations to gradually compress the data to 7 × 7 feature maps. The number of filters doubles in each layer, and cross-layer connections are introduced, ultimately outputting a 64-dimensional global average pooling feature vector. The entire process is dropout-based to suppress overfitting. In this process, the CNN only models the spatial distribution of time features, not their dynamic time–series changes. The temporal modeling module uses a three-layer LSTM network, with the input being the spatial distribution information of the 12 × 2 temporal feature tensor preprocessed by the CNN.
The temporal modeling module uses a three-layer LSTM network, with the input being the 12 × 2 temporal feature tensor preprocessed by the CNN. Each layer is configured with 32 hidden units: the first layer captures short-term fluctuations in rainfall and temperature, while the latter two layers jointly establish cross-period correlations, using dropout and L2 regularization to construct dual constraints. The parameter sharing feature of LSTM complements the local receptive field of the CNN: the former reduces the complexity of temporal modeling by reusing weights in the time dimension, while the latter reduces parameter redundancy by localizing spatial weights. Together, they improve the efficiency of heterogeneous data processing.
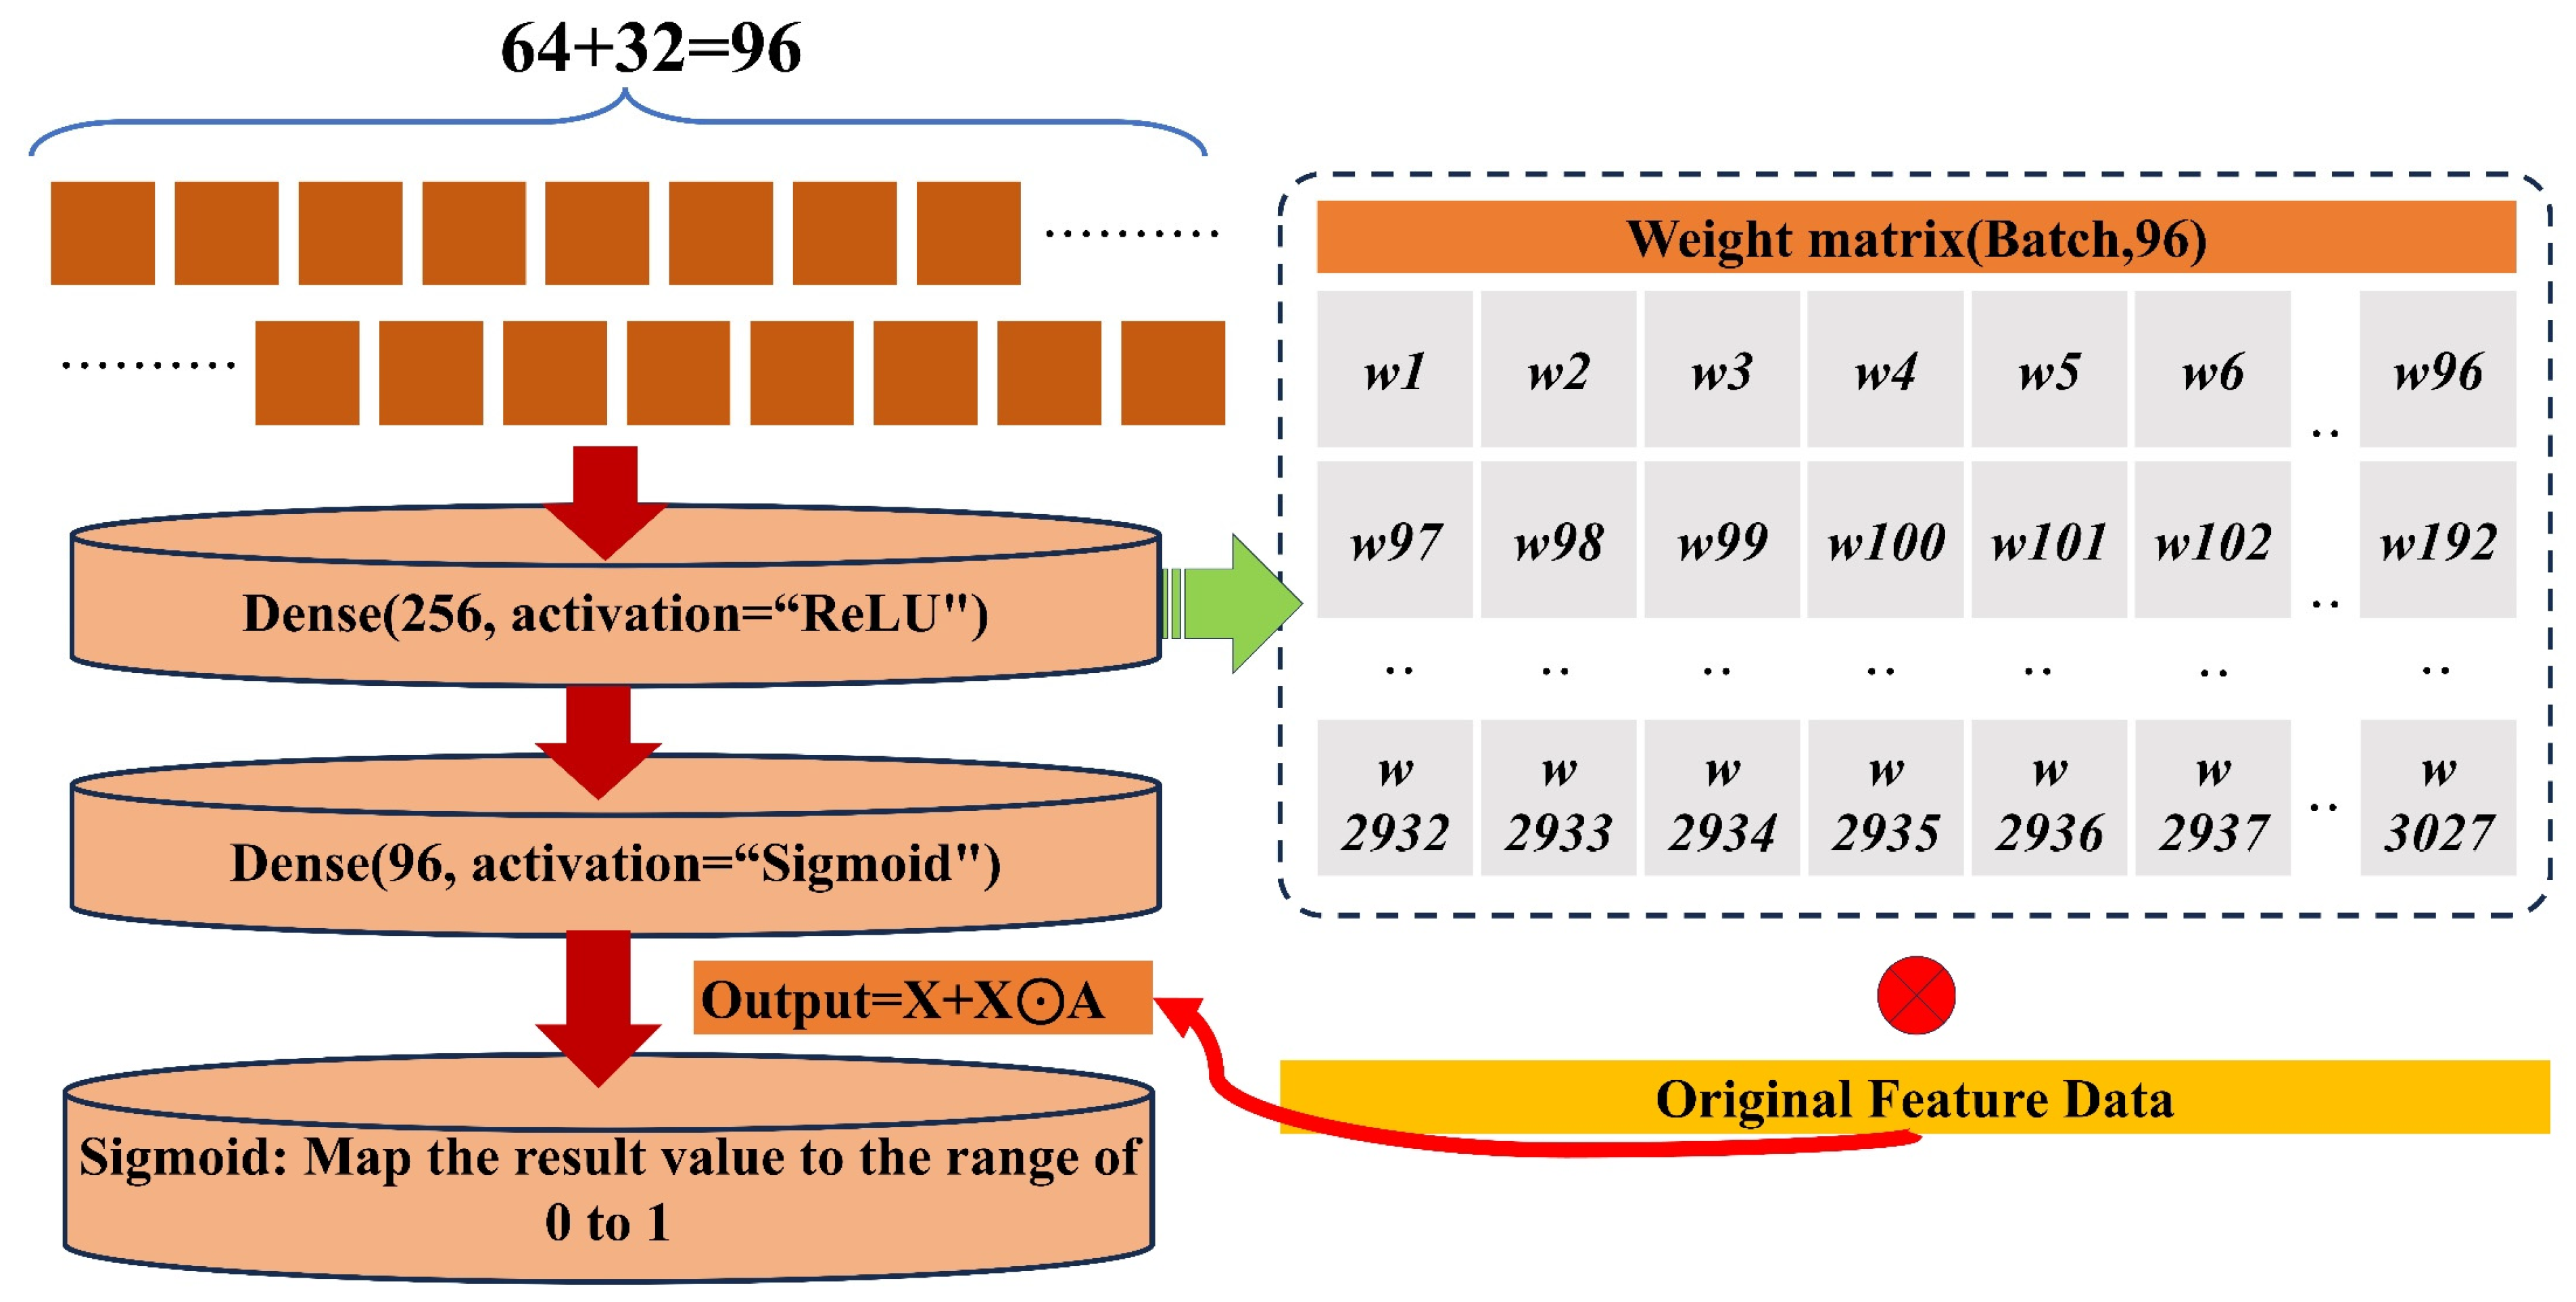
Multimodal fusion uses an interpretable attention mechanism to achieve dynamic feature enhancement, as shown in Figure 6: 64-dimensional spatial features and 32-dimensional temporal features are concatenated into 96-dimensional joint features [55,56], and then a fully connected layer with 256 nodes is used to learn channel associations. After Sigmoid generates an attention weight matrix to implement feature re-labeling, residual connections are used to form enhanced representations, and finally, a fully connected network outputs sensitivity indices in the [0,1] range. It should be noted that designing separate AM modules for spatial and temporal features increases model parameters and computational complexity and may worsen the risk of overfitting. In LSM, separate modules can restrict the interaction between spatial and temporal features, reducing the model’s ability to capture cross-modal relationships. Thus, the current method uses a unified AM module in the 96-dimensional fused feature space to model these interactions, avoiding separate modeling [53].

2.7. Certainty Factor Model

The certainty factor (CF) model was first proposed by Shortliffe and Buchanan and further improved by Heckerman [57]. This model is a probability function that can be used to analyze the sensitivity of disaster events to various influencing factors. Its formula is as follows:
C F = P P a P P s P P a 1 P P s , P P a P P s P P a P P s P P s 1 P P a , P P a P P s
Among these, PPa represents the ratio of the number of disaster points present in the influence factor a to the area of that factor unit; PPs is the prior probability index of disaster events across the entire study area, typically calculated as the ratio of the number of disaster points in the study area to the study area’s total area. The range of CF values is [−1,1]. When the CF value is greater than 0 and closer to 1, it indicates that disasters are more likely to occur under that influence factor; when the CF value is less than 0 and closer to −1, it indicates that disasters are less likely to occur under that influence factor; and when the CF value is close to 0, it is difficult to determine whether the influence factor is likely to trigger disasters.
To eliminate the influence of differences in the number of classification grades for each landslide conditioning factor, this study introduces the concept of sensitivity index (E) to comprehensively reflect the influence of each landslide conditioning factor on landslide disasters [58]. Its formula is as follows:
E = C F max C F min
Among these, CFmax is the maximum value of CF, and CFmin is the minimum value of the CF. The larger the E value, the greater the influence of the landslide conditioning factor on landslide disasters.

2.8. Strategies for Non-Landslide Sampling

In the construction of LSM models, the reasonable selection of input data is a critical step [59]. In addition to selecting appropriate landslide conditioning factors, the construction of a landslide sample dataset is particularly important. A standard landslide sample dataset consists of a training set and a test set, and both contain a certain number of landslide points and non-landslide points.
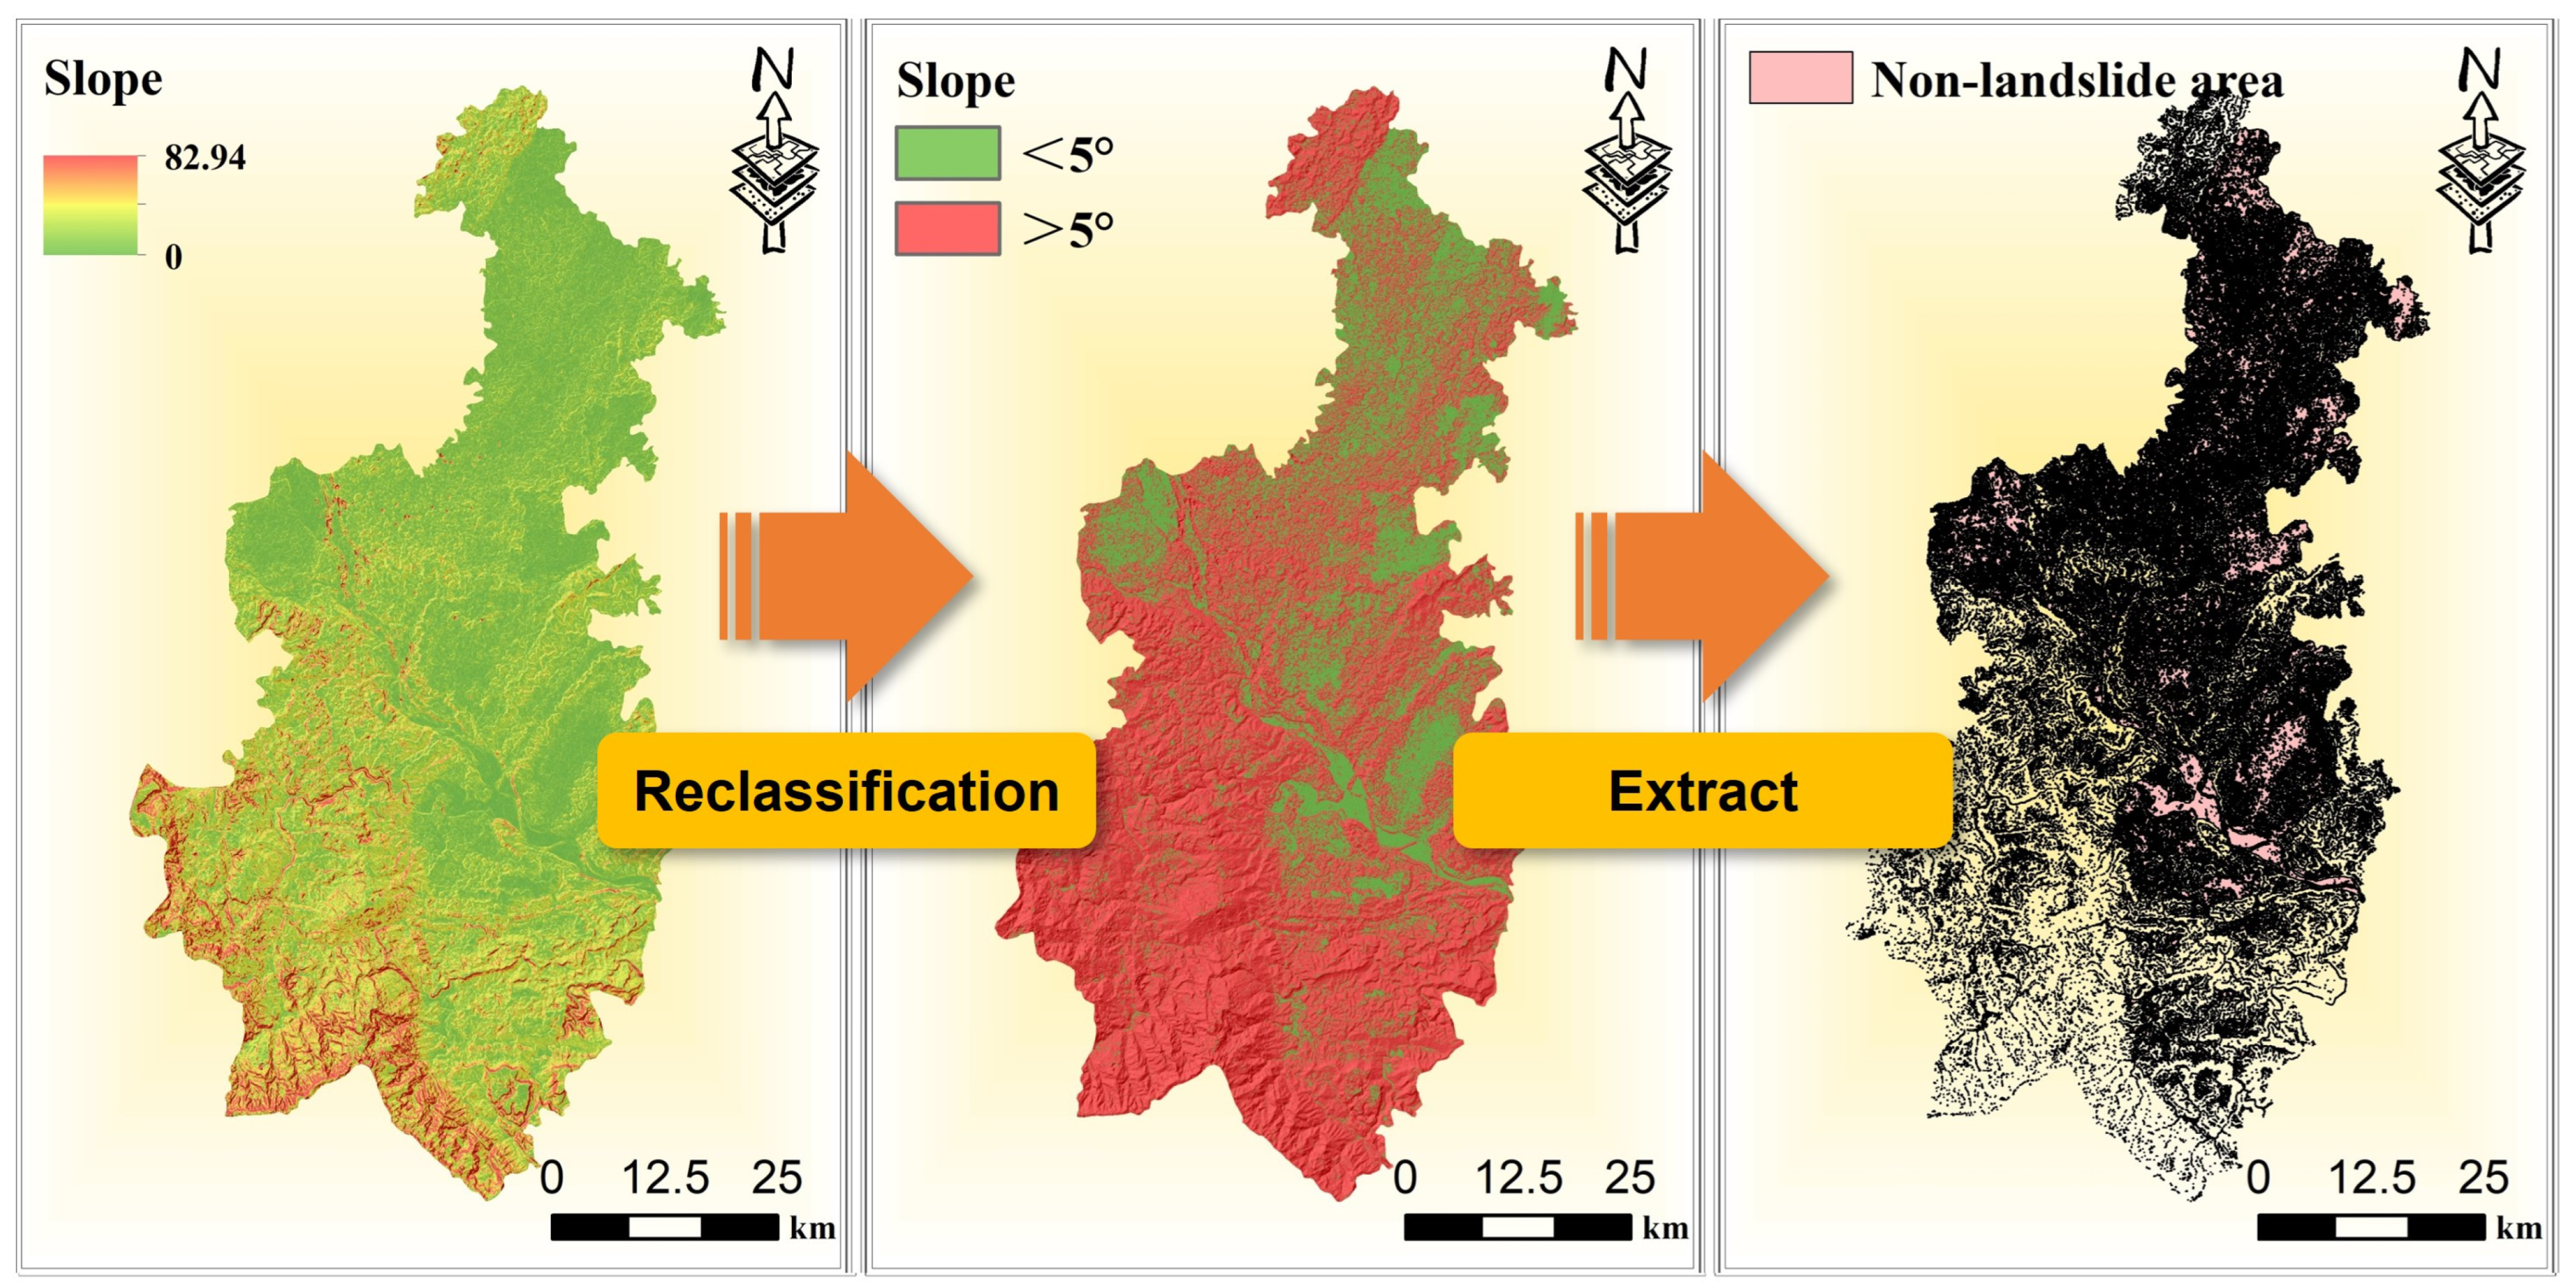
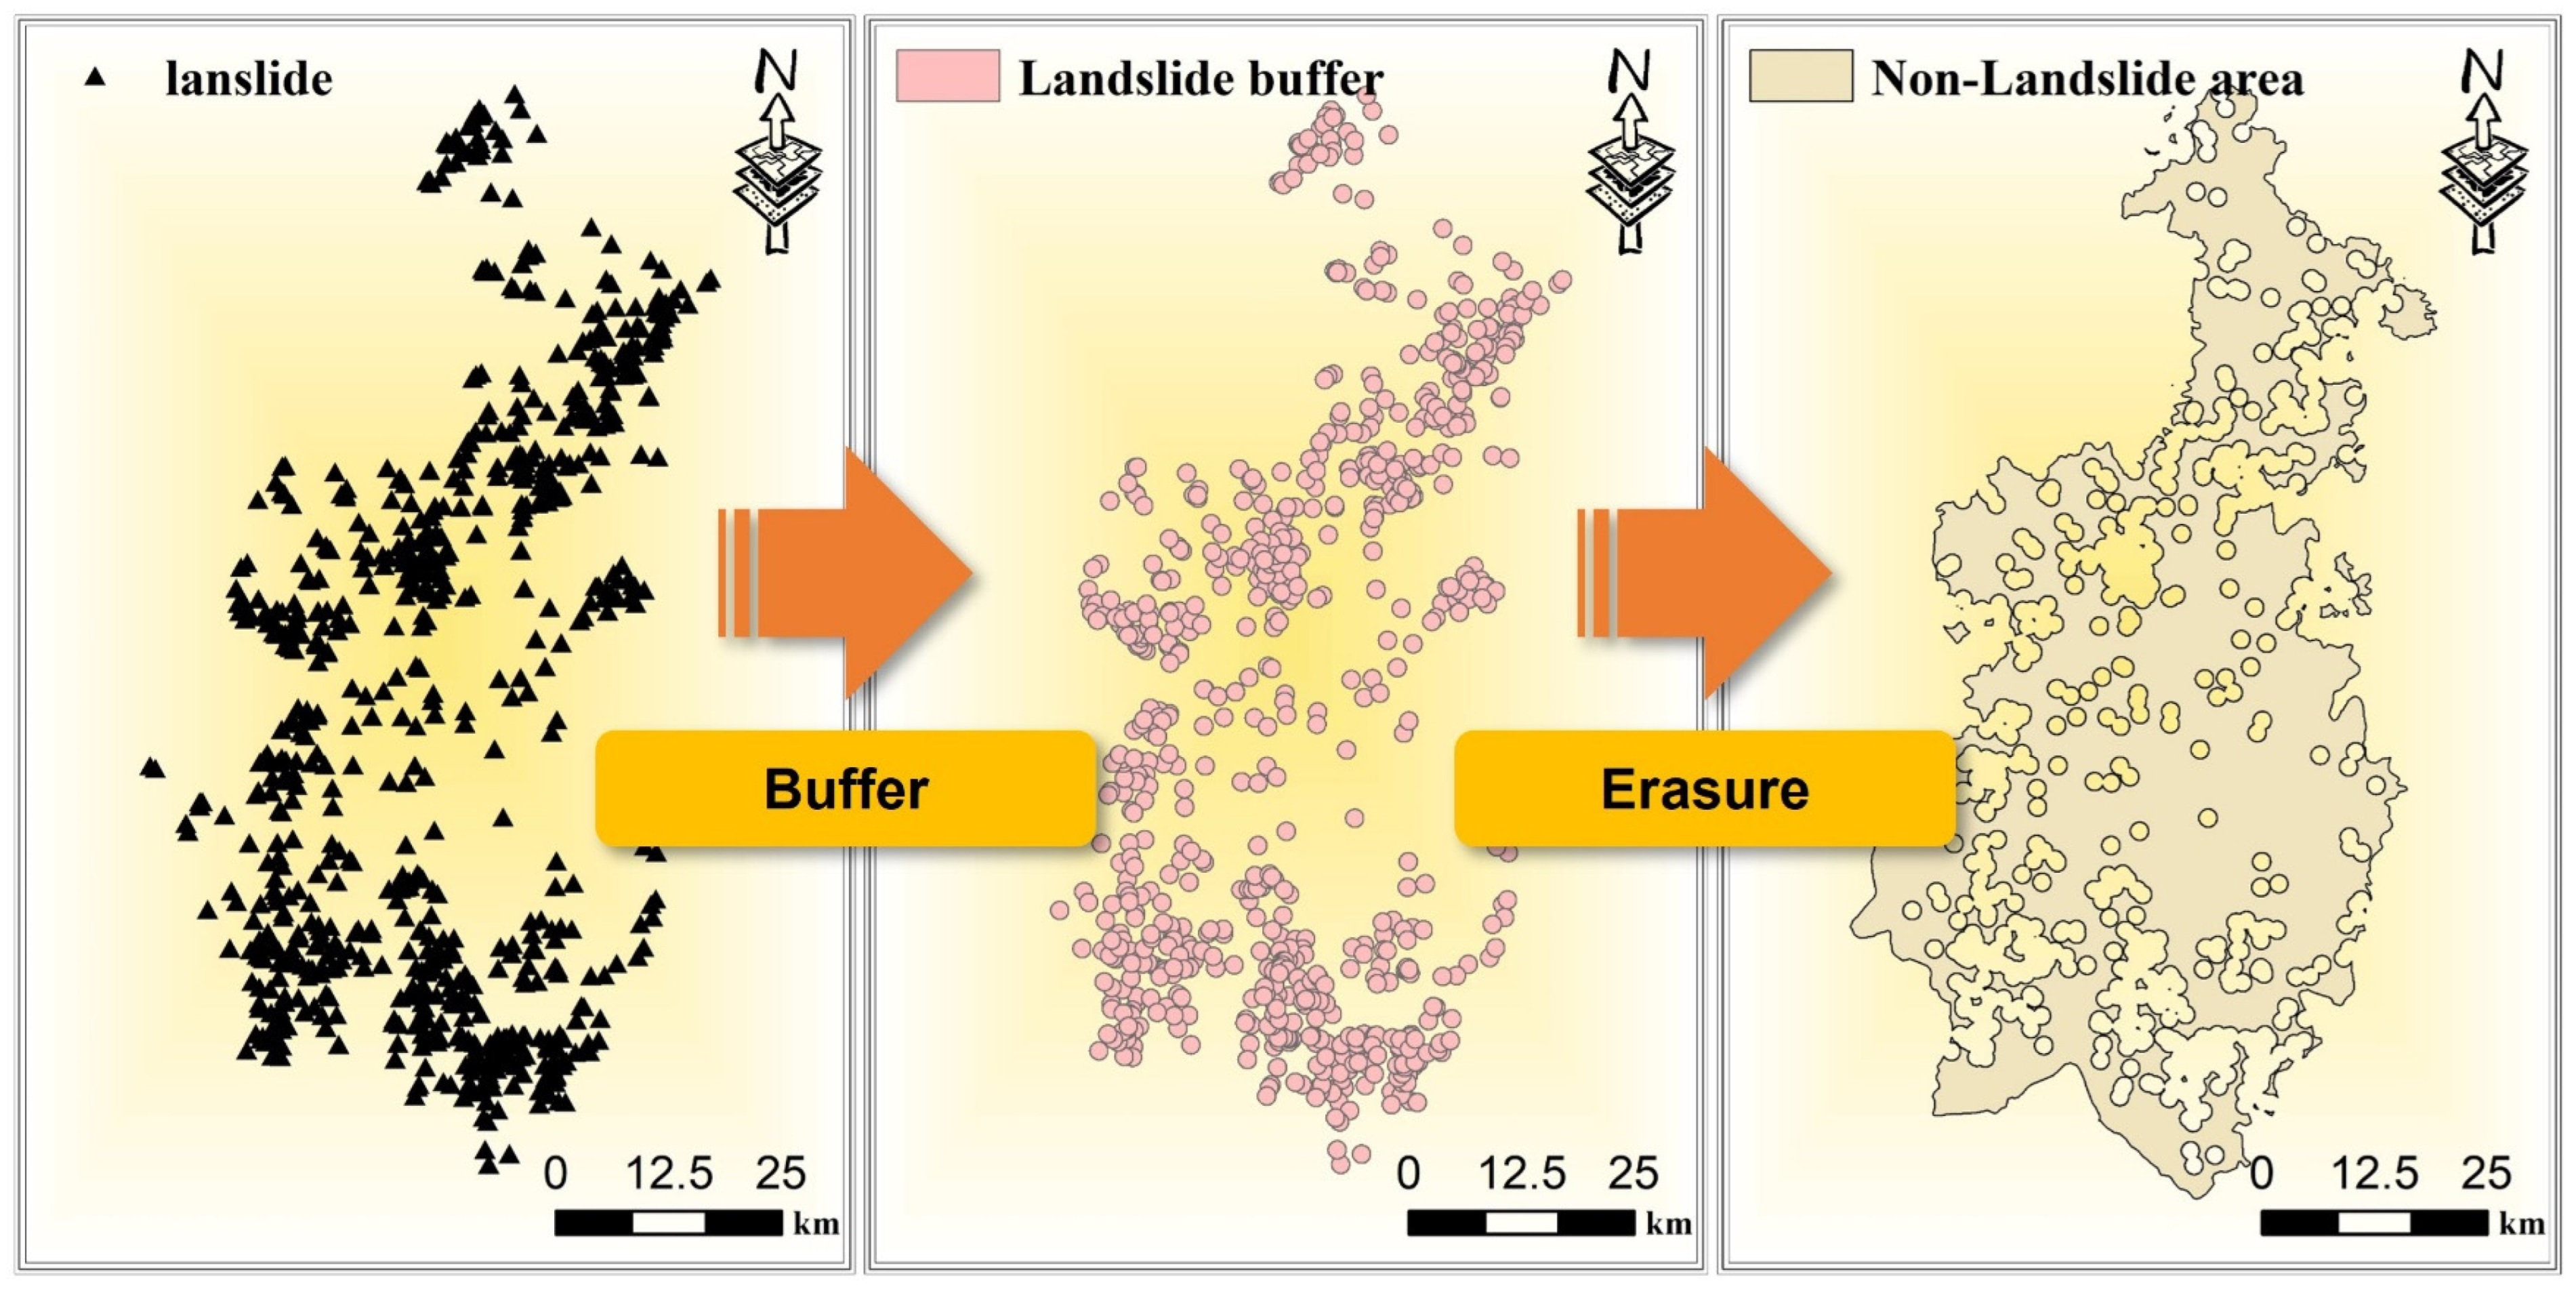
This study proposes the following three methods as strategies for non-landslide sampling: (a) construct a buffer zone centered on historical landslide points with a radius of 1000 m and designate the area outside the buffer zone as a low-risk zone, i.e., non-landslide sampling area; (b) use a slope threshold of 5° to select areas with slopes less than 5° as a non-landslide sampling area [60,61,62]; and (c) use the certainty factor model, a probabilistic model, for preliminary assessment, reclassify the results, and delineate low-risk areas as a non-landslide sampling area. The flowcharts for Methods (a) and (b) are shown in Figure 7 and Figure 8, respectively.

2.9. Bayesian Optimization Model Hyperparameters

Hyperparameter optimization is crucial for improving model performance. Bayesian optimization algorithms are suitable for complex objective function optimization scenarios due to their efficiency. They capture variable correlations through Gaussian process surrogate models and balance exploration and exploitation using acquisition functions (such as EI and UCB) to intelligently select sampling points [63].
This study applies Bayesian optimization to model hyperparameter optimization. A three-fold cross-validation combined with a binary cross-entropy loss function is used for performance evaluation, where lower loss values indicate better optimization results. Table 3 shows the optimized range and the final optimal hyperparameter configuration of the CNN-LSTM-AM model.

2.10. Model Accuracy Evaluation Metrics

This study uses ROC curves, AUC values, POD, ACC, PRC, Kappa, and other metrics to evaluate model performance.
The ROC curve [64] plots the relationship between the true positive rate (TPR) and false positive rate (FPR) of the model at different thresholds to assess the model’s ability to distinguish between positive and negative classes.
F P R = F P F P + T N
T P R = T P T P + F N
To supplement the shortcomings of the ROC curve in specificity assessment, this study introduces recall rate (POD), accuracy rate (ACC), and precision rate (PRC) as supplementary evaluation indicators to comprehensively evaluate model performance. The corresponding calculation formulas are as follows:
P O D = T P T P + F N
A C C = T P + T N T P + T N + F P + F N
P R C = T P T P + F P
In addition, this study uses the Kappa coefficient to measure the consistency between the model prediction results and the actual labels [65].

3. Results

3.1. Importance and Correlation Analysis of Landslide Conditioning Factors

For ML, the quality of input data is of great importance. Most studies conduct importance and correlation analyses of landslide conditioning factors [66]. Importance analysis ensures that the input landslide conditioning factors are necessary for LSM, while correlation analysis ensures that the input landslide conditioning factors have weak correlations with each other.
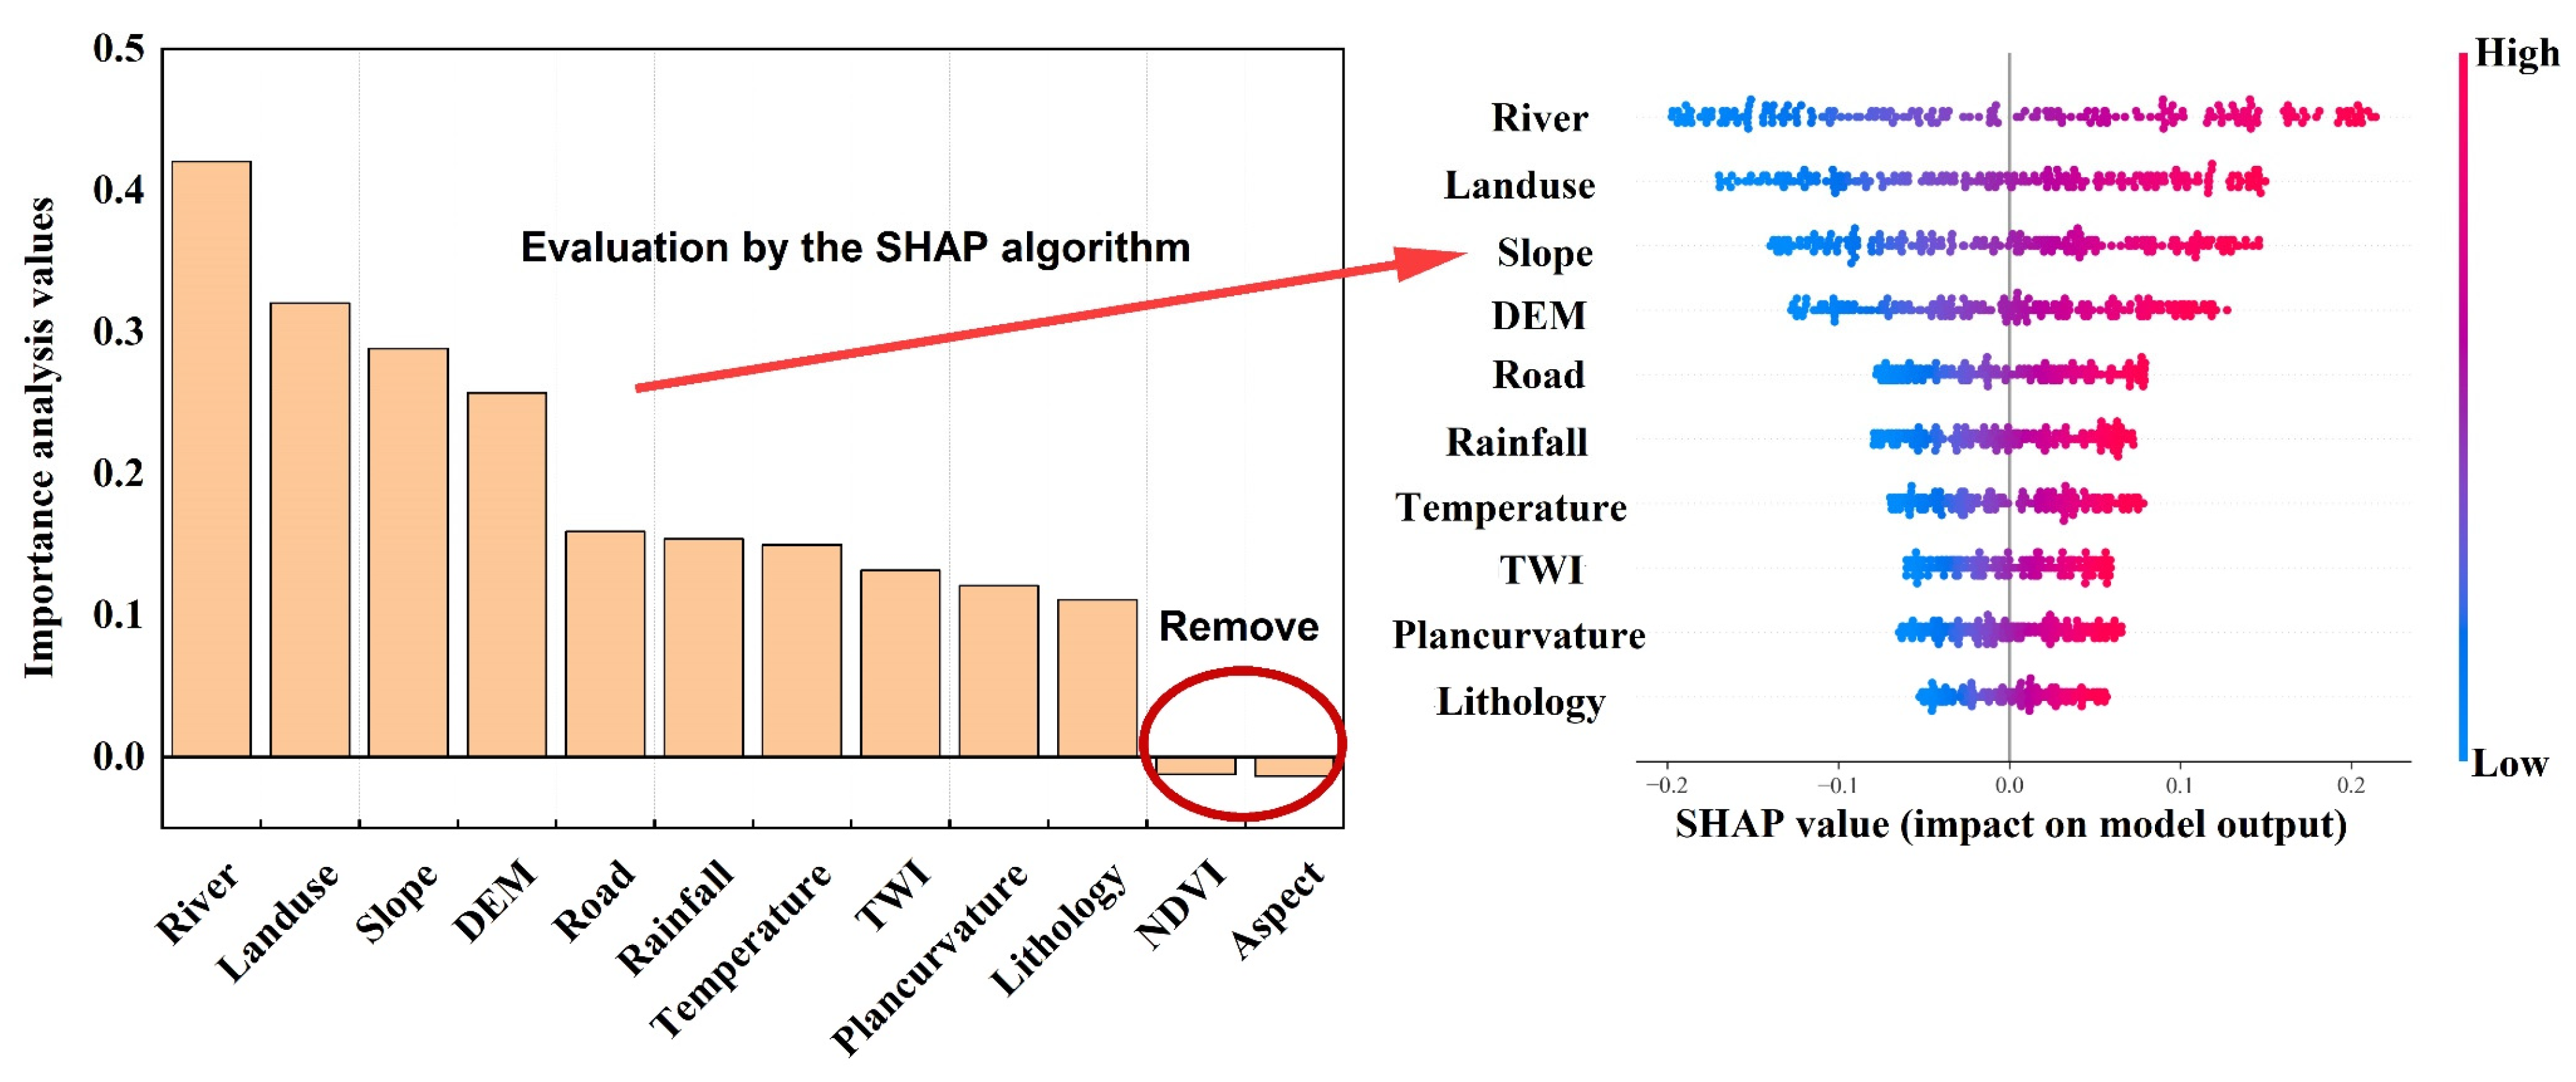
This study conducted an importance analysis for the CNN-LSTM-AM model’s landslide conditioning factors using SHAP (Figure 9). The method quantifies feature contributions through Shapley values derived from cooperative game theory. Our analysis identifies River as the most influential factor (mean |SHAP| = 0.35), followed by land use (0.28), slope (0.15), and DEM (0.12). Notably, NDVI and aspect exhibit negative SHAP values, indicating counterproductive impacts on predictions that warrant their exclusion. To validate the optimized feature set’s rationality, we reapplied SHAP analysis [67,68]. The consistent results confirm that eliminating NDVI and aspect yields a refined feature space, enhancing both predictive efficacy and model interpretability.
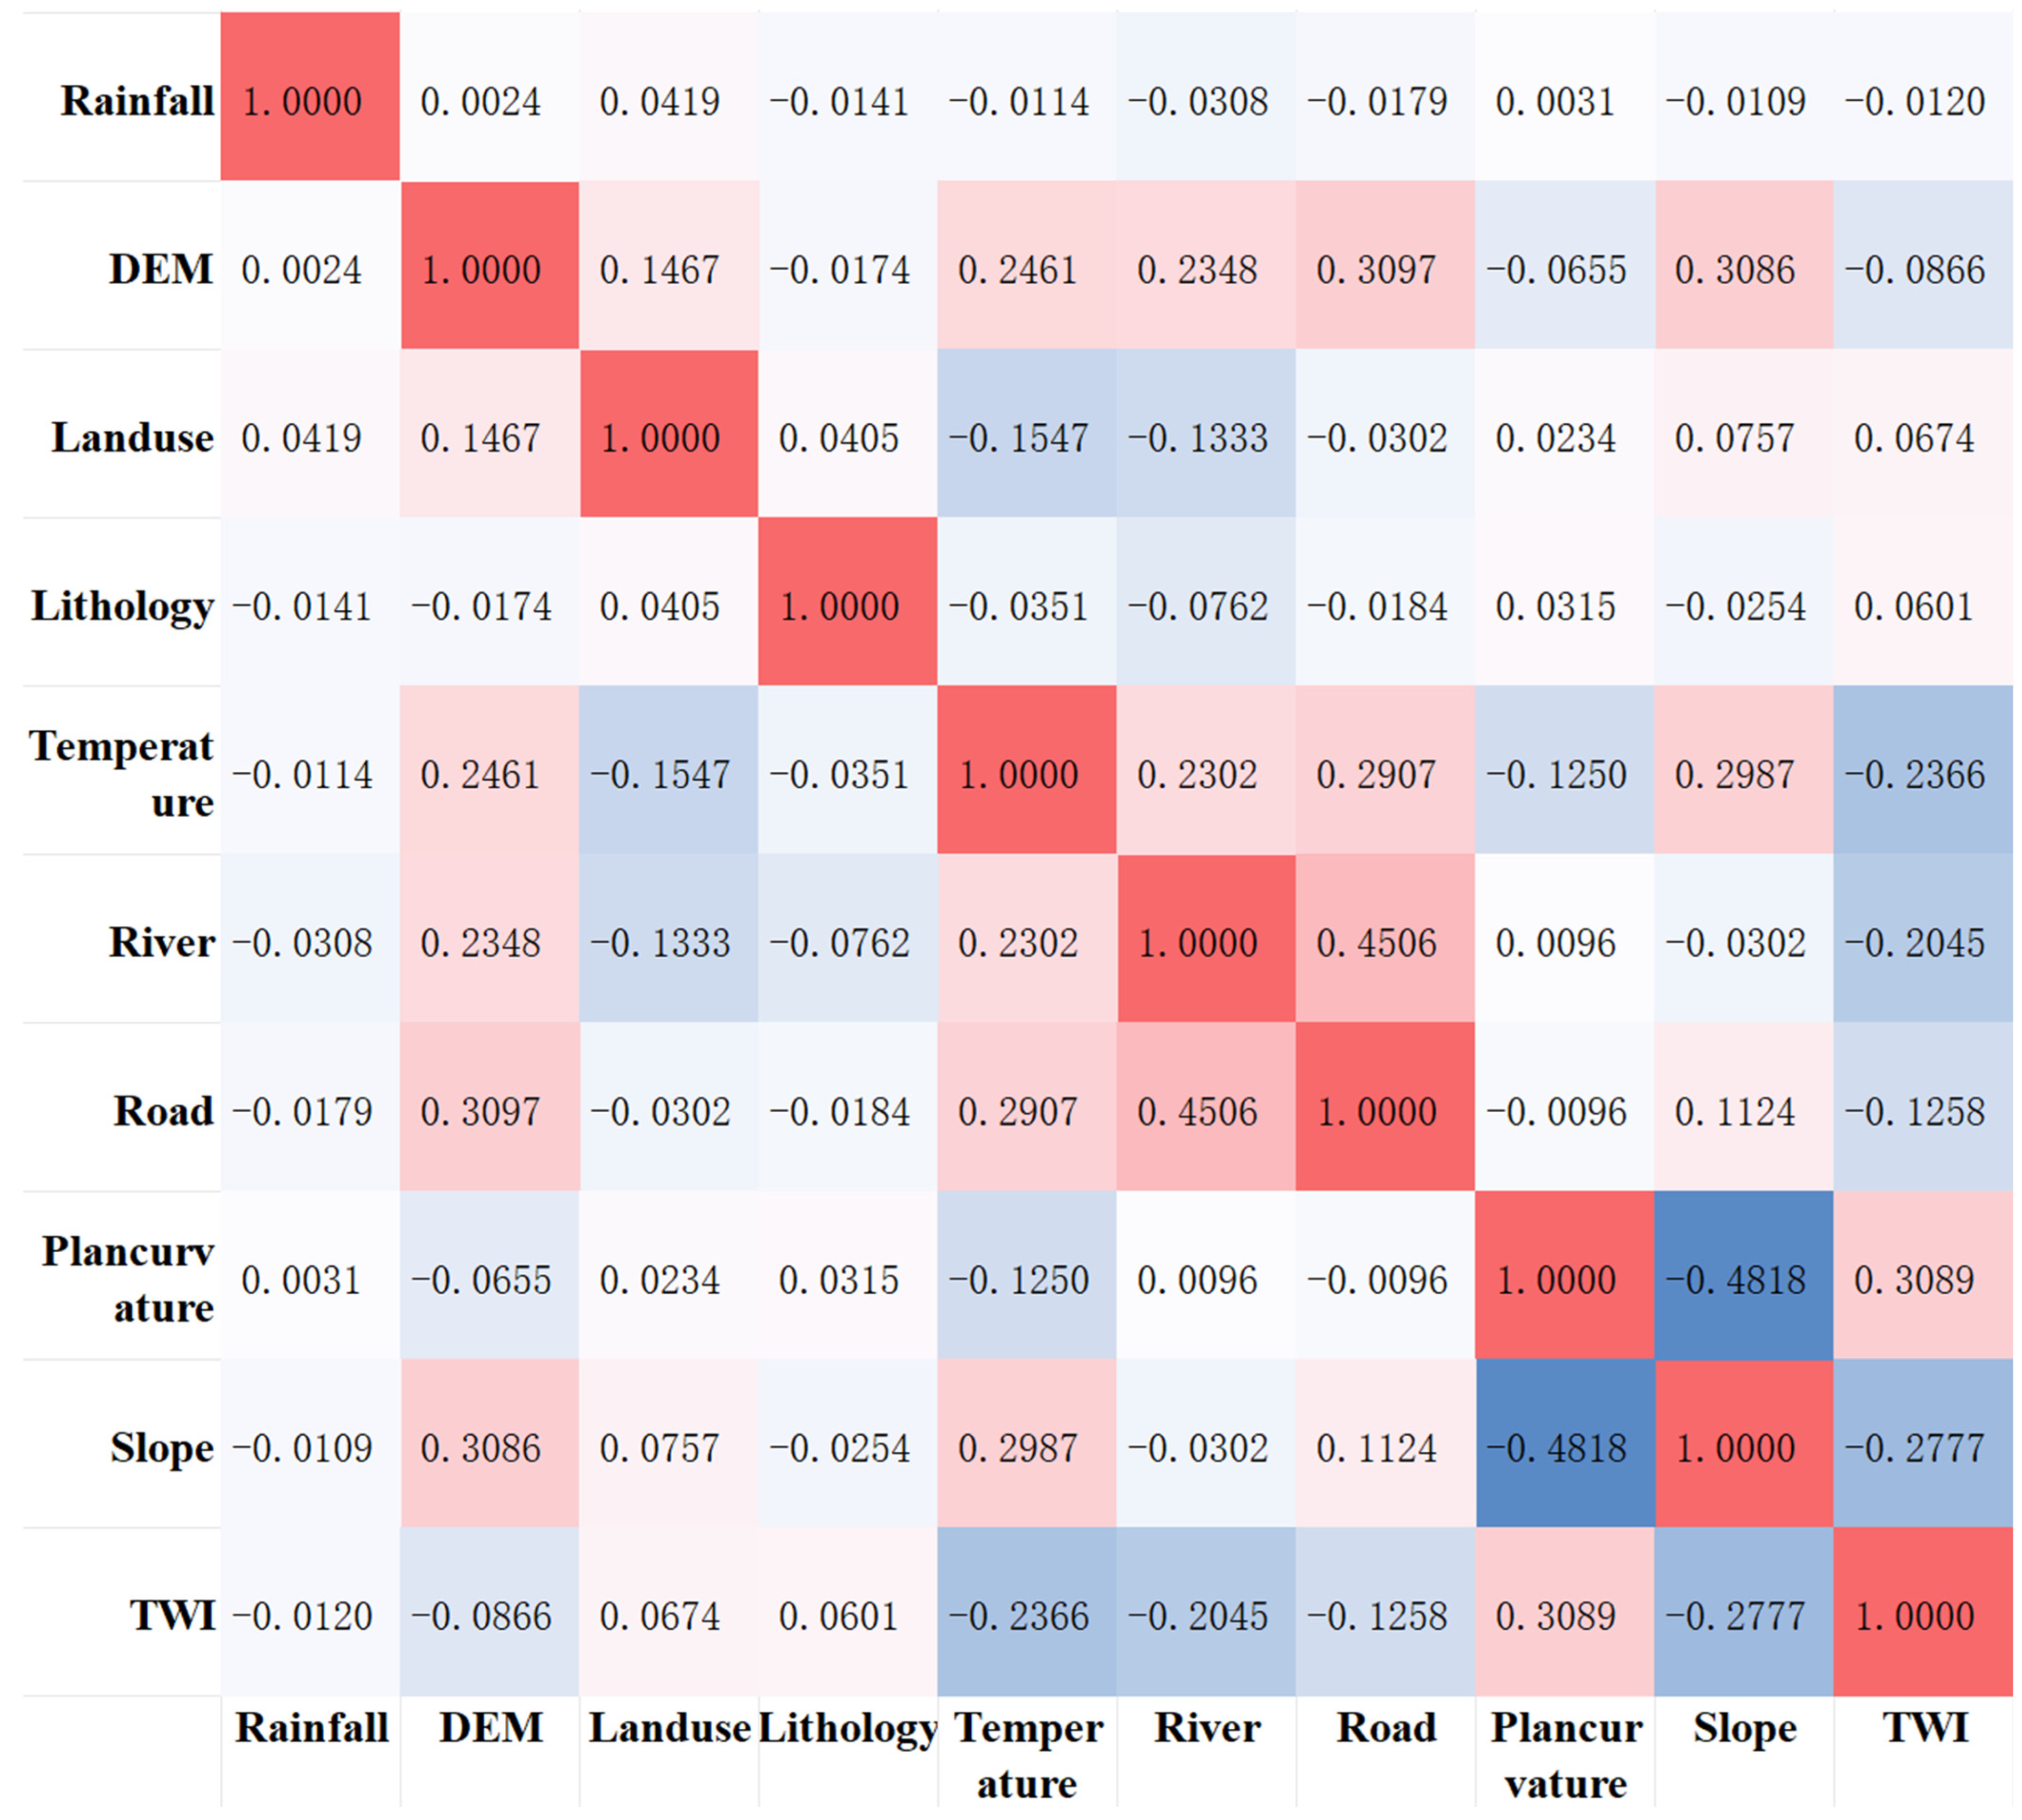
At the same time, ML also requires that the correlations between landslide conditioning factors be relatively weak, thus necessitating correlation analysis. When the correlation coefficient |R| ≥ 0.5, it is considered that there is a strong correlation between two factors; otherwise, the correlation is weak [69].
Figure 10 shows that precipitation is independent. DEM is positively correlated with temperature. Land use relates to both temperature and DEM. Lithology has low correlations. Temperature is correlated with DEM and River. Rivers and roads are strongly correlated. Plan curvature and slope are negatively correlated.

3.2. Comparison of Strategies for Non-Landslide Sampling

When calculating the CF, this study only considered spatial feature factors for landslides: this is because TIF maps of temporal feature factors vary with the month, and their classification and CF are not fixed, which would increase the complexity of the problem.
Additionally, importance analysis indicated that monthly average precipitation and monthly average temperature have a limited impact on LSM and can be temporarily ignored. The CF for each grade was calculated using Equation (15), with the results shown in Table 4. After obtaining E, the E values for each landslide conditioning factor were normalized and used as the weight values for the corresponding landslide conditioning factors, with the results shown in Table 5.
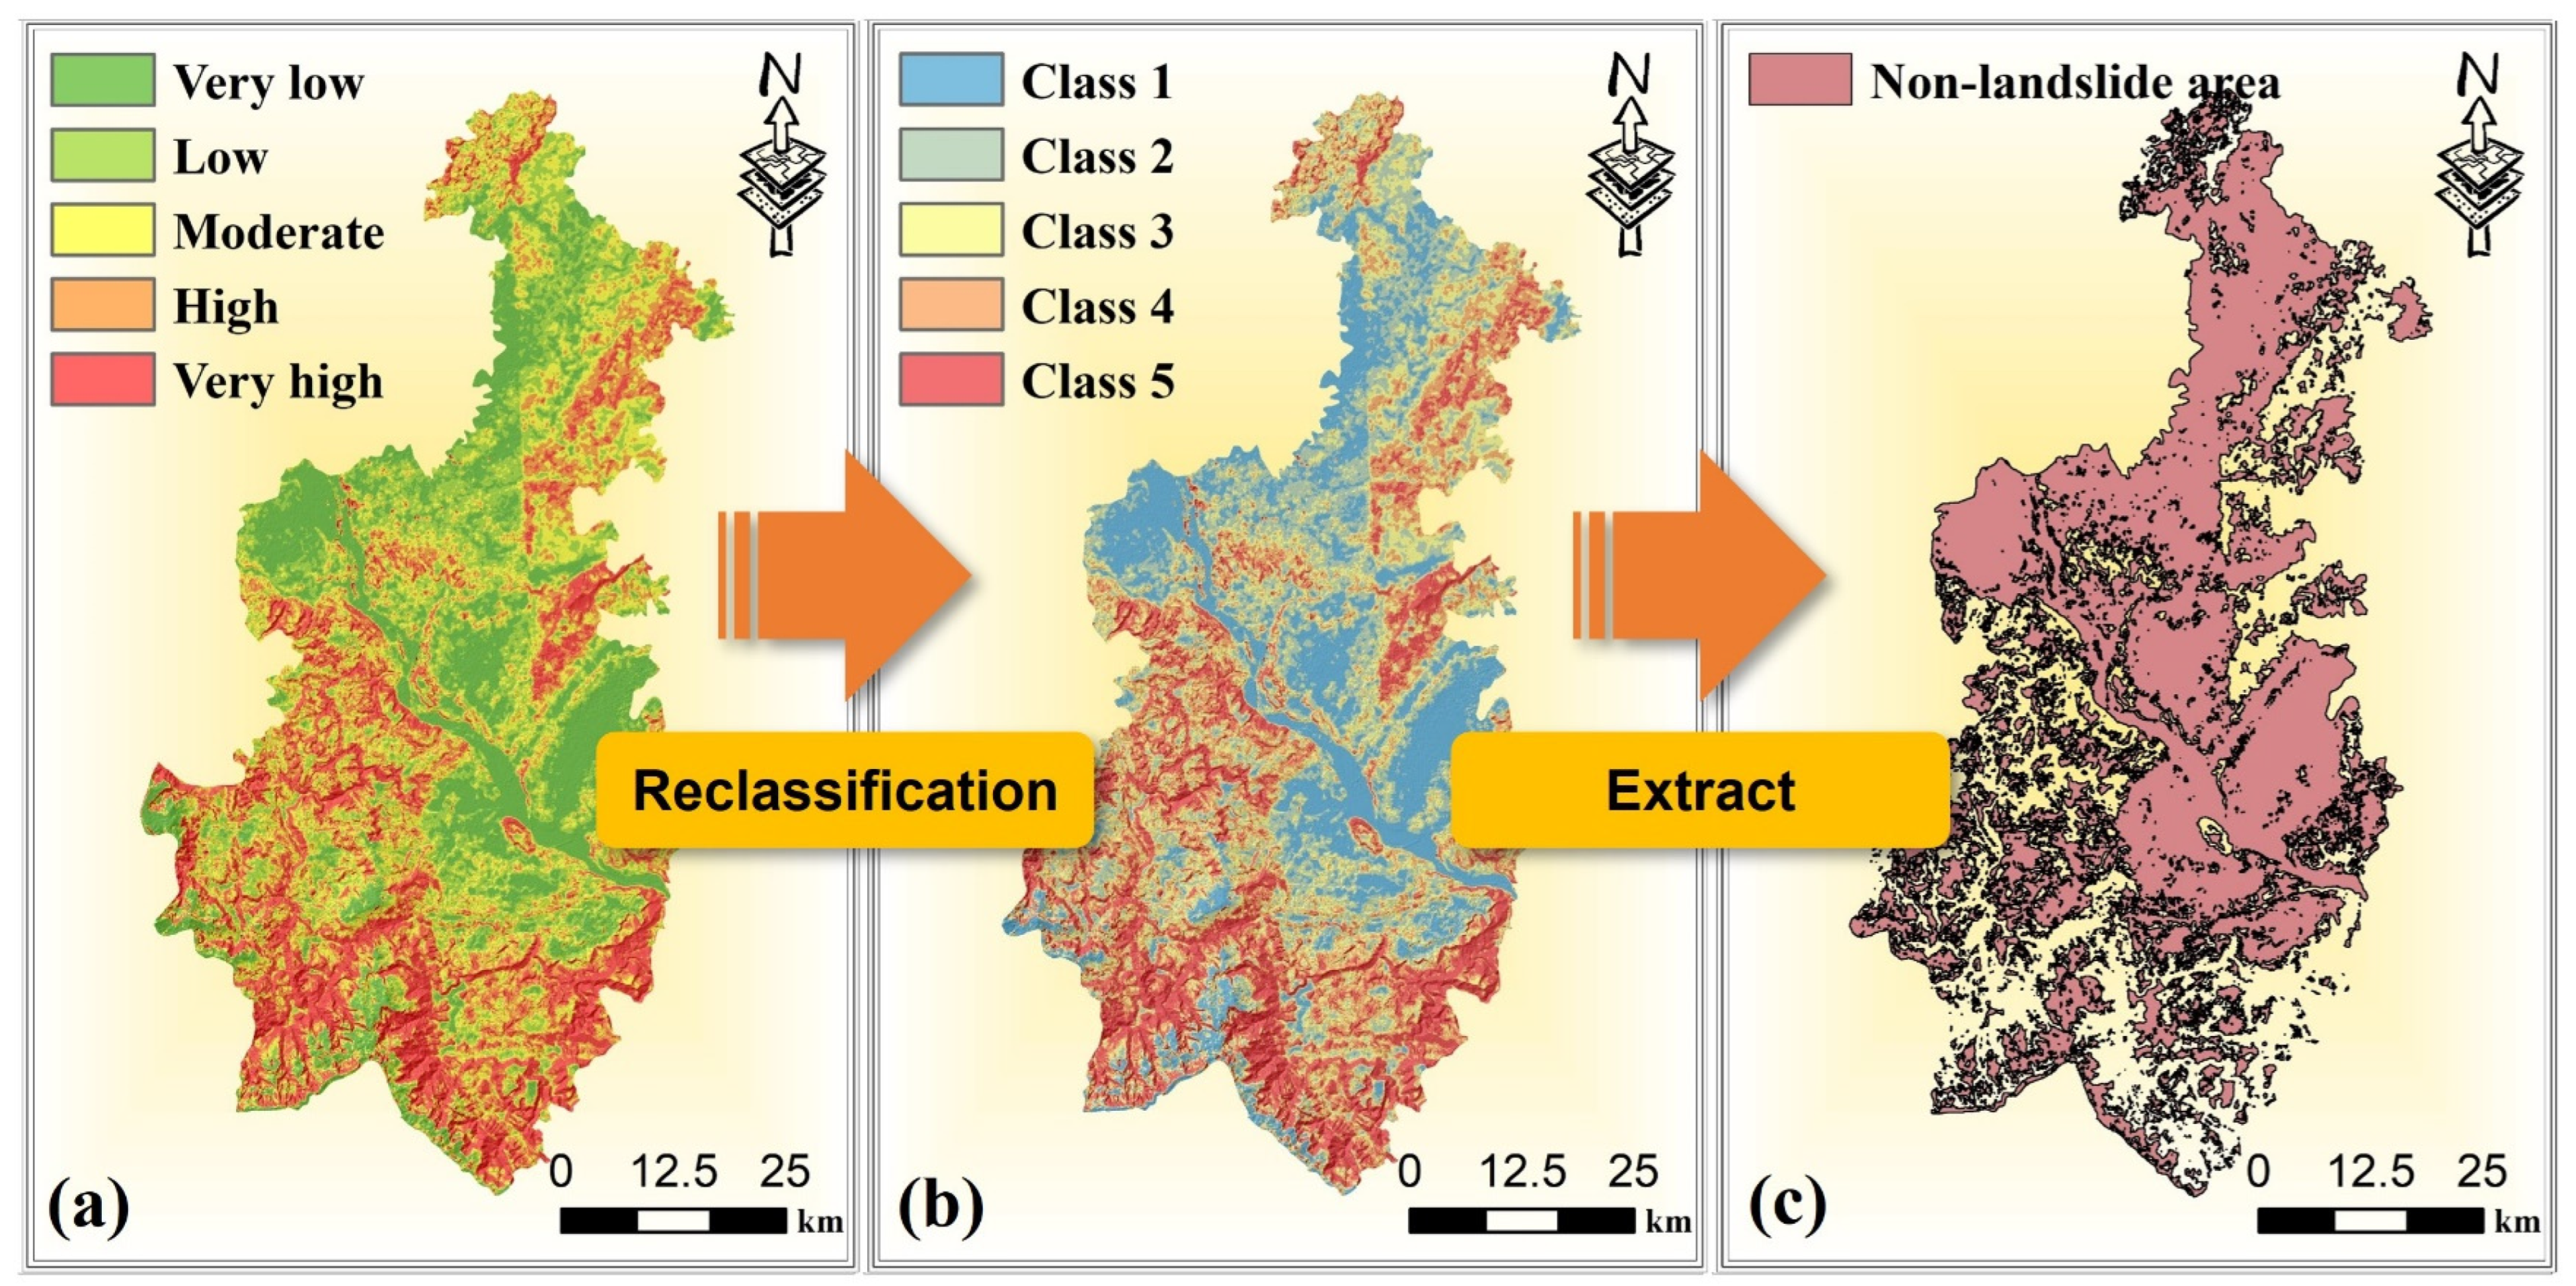
Using the weighted sum function in ArcGIS, the maps of each landslide conditioning factor were overlaid to form a preliminary assessment of landslide sensitivity in the study area. Based on the quantile method, the results were divided into five categories: extremely low susceptibility, low susceptibility, moderate susceptibility, high susceptibility, and extremely high susceptibility, forming an initial landslide susceptibility zoning map, as shown in Figure 11a.
Based on the initial susceptibility evaluation results, high-susceptibility zones, extremely-high-susceptibility zones, and medium-susceptibility zones were excluded, leaving only Class 1 and Class 2, as shown in Figure 11b. The final non-landslide sampling area is depicted in Figure 11c.
To ensure the balance of the sample data and enhance the model’s generalization ability [70], this study adopted a 1:2 ratio for positive and negative sample allocation. Ultimately, 782 landslide samples (positive samples) and 1564 non-landslide samples (negative samples) were selected within the study area. All sample data were uniformly standardized to a consistent spatial resolution, with 70% of the samples used for model training and 30% for model validation.
The landslide sample datasets created using the three strategies were input into CNN-LSTM-AM, and the corresponding mean square error (MSE) and test set AUC were calculated. The statistical results are shown in Table 6.
The results in Table 6 show that the MSE and AUC values of Method (c) are the best among the three parallel experiments. Therefore, the landslide sample dataset sampled by Method (c) is selected as the input data for the model in this study.
Note: (a) Construct a buffer zone with a radius of 1000 m centered on historical landslide points and treat the area outside the buffer zone as non-landslide areas. (b) Select areas with slopes less than 20° as non-landslide areas based on slope as a specific landslide conditioning factor. (c) Conduct a preliminary assessment using the certainty factor model and sample non-landslide areas based on the prediction results.
Significant differences exist in MSE and AUC values between Methods (a) and (c), while discrepancies between Methods (b) and (c) are comparatively smaller. Method (a) lacks spatial constraint mechanisms, resulting in non-landslide points with ambiguous geological characteristics and insufficient representativeness. Conversely, Method (b) over-relies on single-feature factors (e.g., slope angle), potentially distorting feature weight distributions and compromising feature extraction efficacy, which is particularly problematic in contexts like our study area where landslides concentrate in a gentle slope terrain. Such oversimplification introduces substantial sampling bias.
Method (c) addresses these limitations through a comprehensive evaluation of landslide conditioning factors, implementing weighted integration based on their disaster-contributing significance. As demonstrated in Table 5, elevated weights for factors like elevation, road proximity, slope angle, and land use reflect balanced considerations of both natural geological parameters (slope and elevation) and anthropogenic influences (road networks and land use). This approach strengthens spatial constraints by exclusively sampling non-landslide points in validated low-risk zones. Consequently, negative samples exhibit well-defined geological characteristics, effectively mitigating sample-induced model overfitting while significantly enhancing the generalization capability and prediction accuracy.

3.3. Model Performance

This study implemented deep learning models using Python’s TensorFlow framework with 80 training epochs. As shown in Figure 12, all four models exhibit convergent accuracy trends despite minor value differences, indicating comparable overall performance.
Notably, significant divergence emerges in their loss metrics. The CNN model maintained stable accuracy but exhibited pronounced loss fluctuations during training and validation. In contrast, LSTM demonstrated consistent stability in both accuracy and loss, reflecting superior robustness. The CNN-LSTM-AM architecture achieved rapid loss reduction (stabilizing near 0.3) while maintaining training accuracy at approximately 0.85.
Comparative analysis reveals that CNN-LSTM exhibits smoother loss reduction than the CNN during both training and validation phases, indicating enhanced generalization capability. This improvement stems from LSTM’s capacity to capture long-term dependencies and mitigate gradient issues in sequential data processing.
Critically, CNN-LSTM-AM demonstrates superior stability in validation metrics over both CNN-LSTM and CNN, attributable to the attention mechanism’s ability to dynamically prioritize salient features while suppressing noise. Although residual overfitting persists across models, its impact remains effectively constrained, demonstrating favorable optimization trajectories throughout the training cycle.
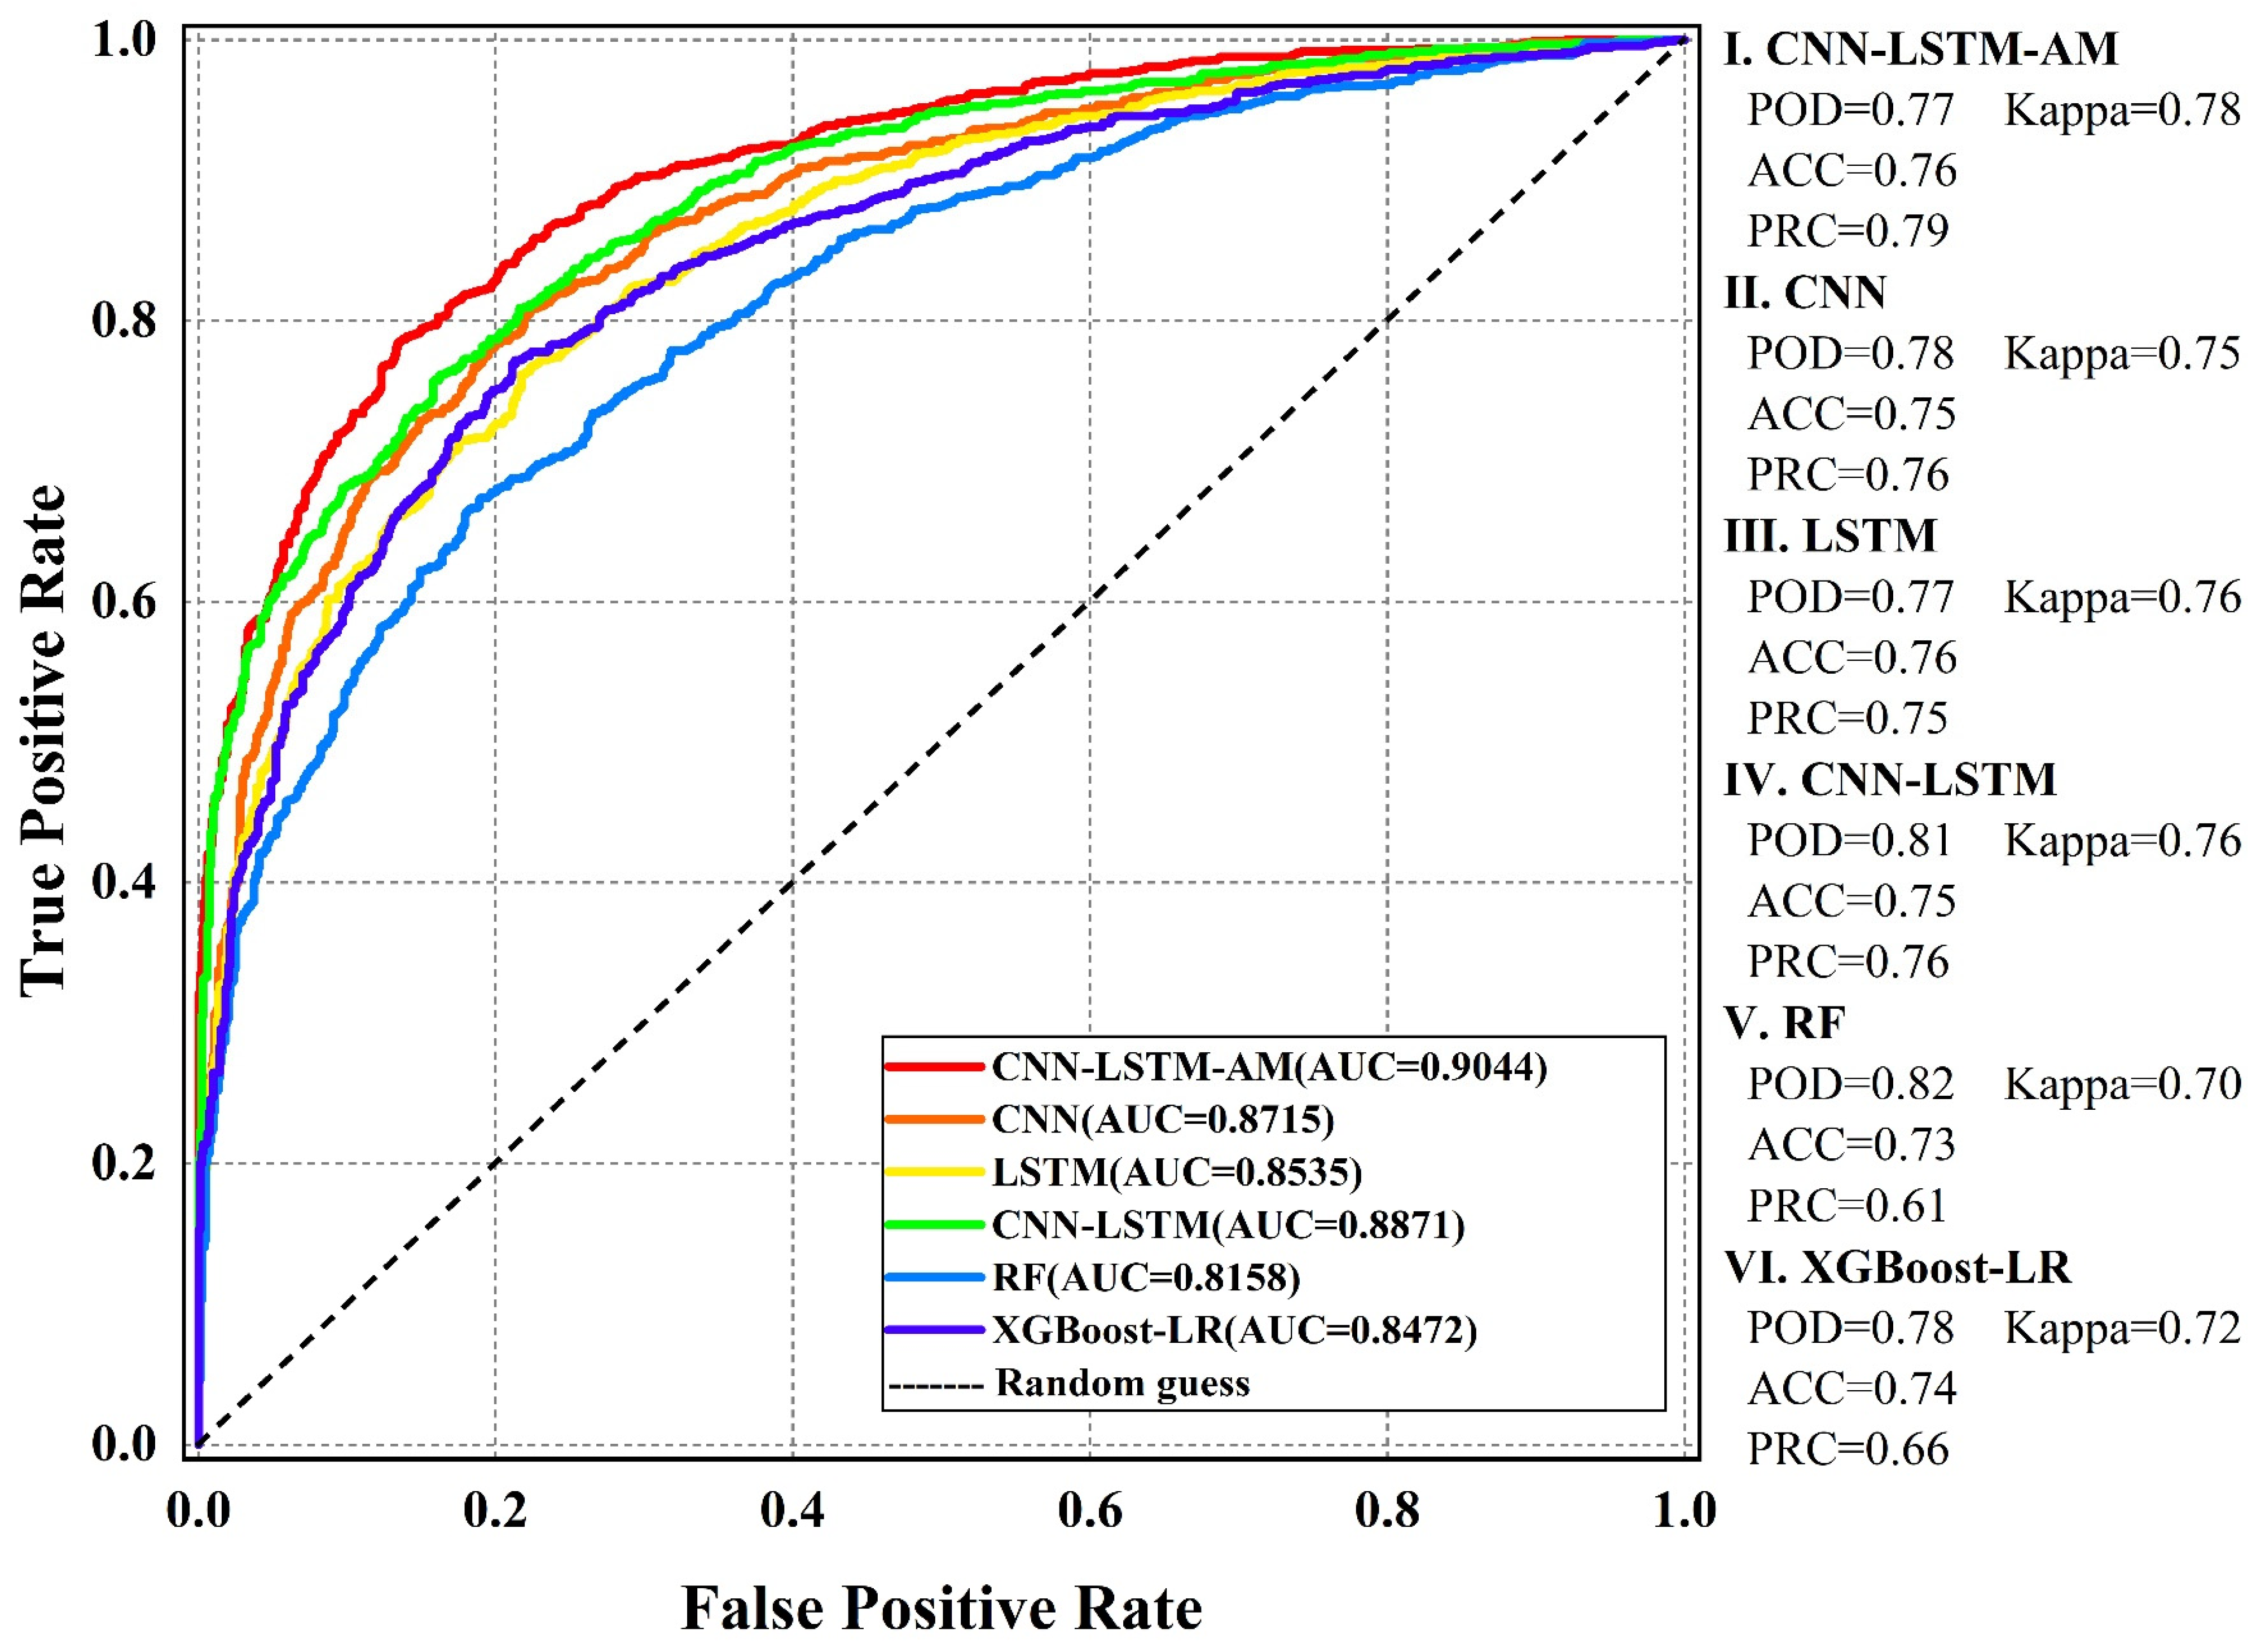
Figure 13 shows the ROC curves and key performance metrics (AUC, POD, PRC, ACC, and Kappa) for each model. The CNN-LSTM-AM model achieved the highest AUC, excelling in distinguishing positive and negative samples. Its Kappa value of 0.78 reflects strong consistency between predicted and actual classifications. This success is due to the model’s integration of CNNs’ spatial feature extraction, LSTM’s temporal modeling, and AM, balancing ACC, PRC, POD, and Kappa effectively. In comparison, CNN-LSTM and LSTM have slightly lower AUC values. While CNN-LSTM’s AUC is close to that of CNN-LSTM-AM, its PRC is lower, with a Kappa of 0.76, likely due to the absence of AM, which limits feature enhancement. LSTM performs well in POD and ACC but has a lower PRC and the same Kappa value, possibly because it lacks CNNs’ spatial feature extraction. CNNs have a lower AUC, acceptable ACC, but inferior POD and PRC compared to LSTM-integrated models, with a Kappa of 0.75, indicating limitations in handling time series data alone. XGBoost-LR has a significantly lower AUC and metrics than deep learning models, with a Kappa of 0.72, likely due to difficulties in modeling complex nonlinear relationships. RF has the lowest AUC, and although it has the highest POD, it lags in PRC and ACC, with a Kappa of 0.70, showing a high false positive rate for imbalanced datasets.

3.4. Comparison of Hazard Maps Under Different Models

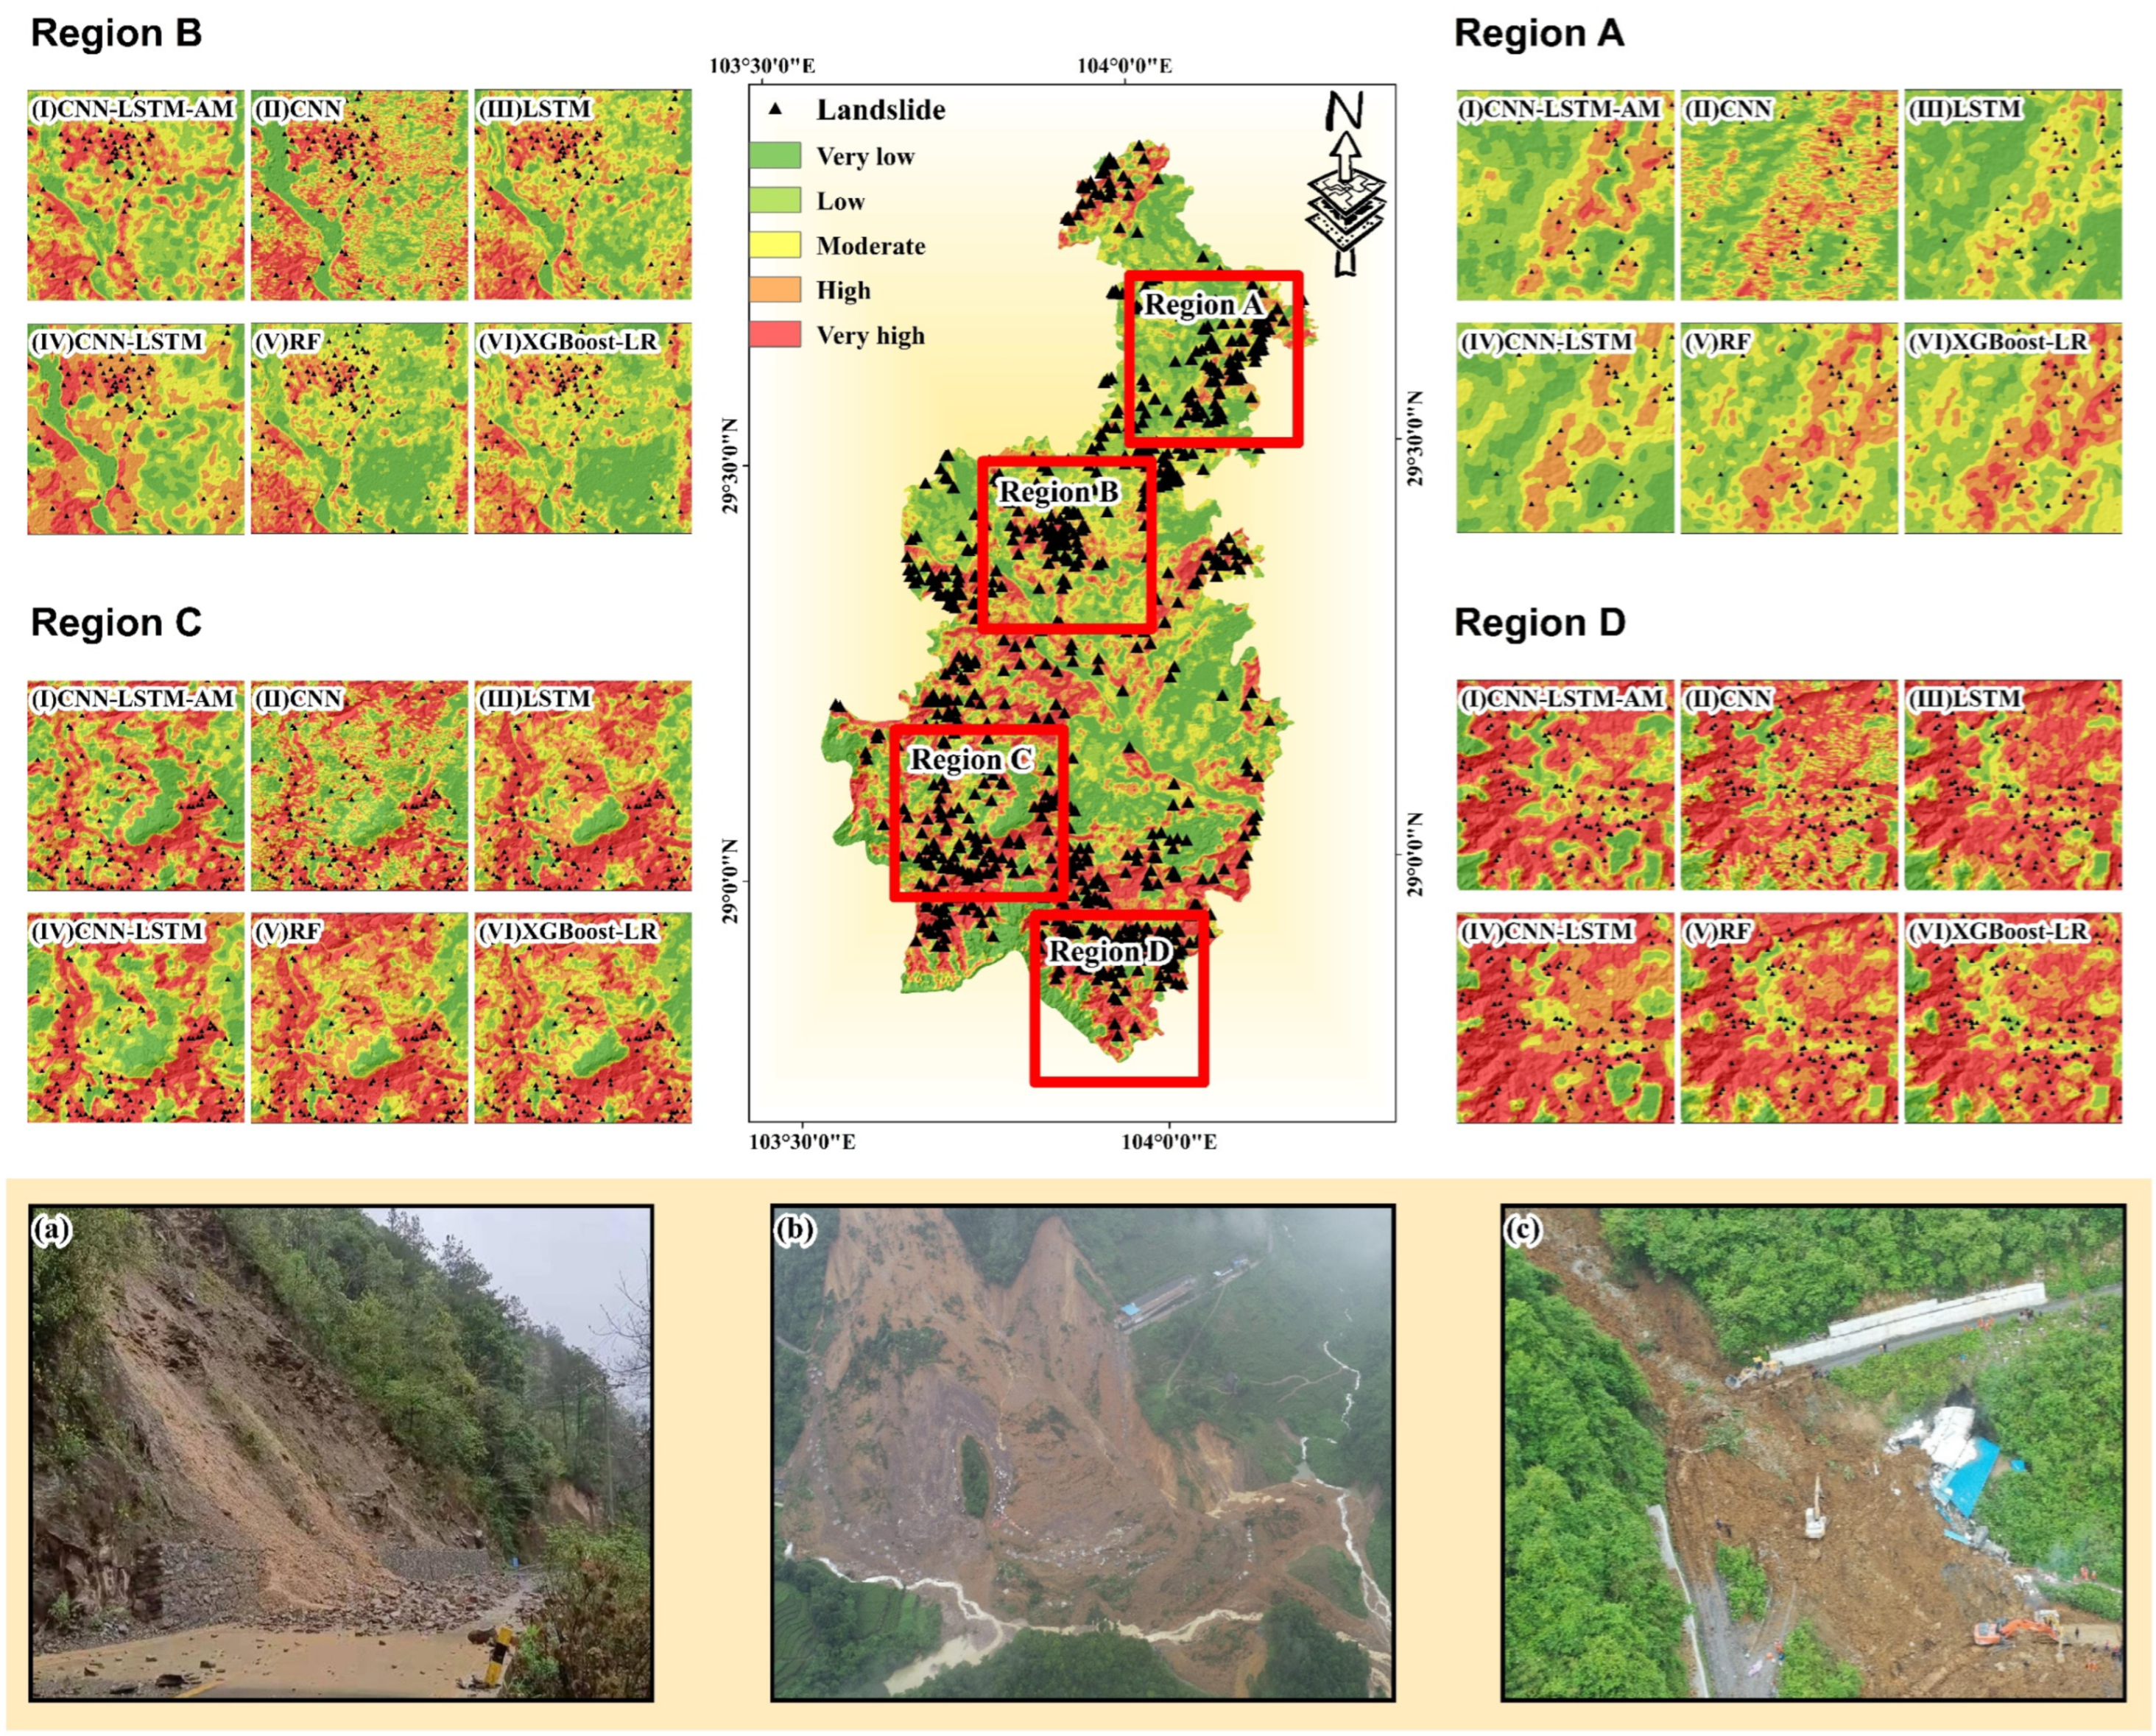
In ArcGIS, the quantile method was used to classify the LSM results of different models (different models employed distinct quantitative thresholds. Taking CNN-LSTM-AM as an example: very low (0–0.02); low (0.02–0.15); moderate (0.15–0.55); high (0.55–0.9); and very high (0.9–1)) into hazard zones, as shown in Figure 14.
Figure 14 shows that the overall prediction performance of all models is good, with most landslide points accurately classified as high risk or extremely high risk. Red and orange zones indicate high-risk areas prone to landslides, requiring special caution. Green zones have a low risk and are suitable for construction or agricultural activities due to rare landslides. These results can guide local governments in planning disaster prevention measures, such as reinforcing riverbanks or establishing early warning systems. However, there are differences in prediction performance across different regions, with relatively lower prediction accuracy in the northeastern part of the study area and relatively better performance in the southwestern part. It is worth noting that some models exhibit overfitting (e.g., traditional ML models, RF, and XGBoost-LR), which may affect their reliability in practical applications. Traditional ML models (such as RF and XGBoost-LR) tend to misclassify certain landslide points as low-risk areas (green) when handling regional data. In contrast, the DL models (such as CNN-LSTM-AM, CNN, LSTM, and CNN-LSTM) exhibit more conservative performance in these regions, with fewer misclassifications, typically categorizing them as medium-risk areas.
The local magnification results in Figure 15 further highlight the advantages of CNN-LSTM-AM in detail handling. The model can cover the same number of landslide points with fewer red and orange areas, indicating its superior generalization ability. Compared to other DL models, such as CNN-LSTM, CNN, and LSTM, the prediction results of CNN-LSTM-AM are smoother and more coherent, with a more accurate distribution of red high-risk areas, and it can cover landslide points that other models failed to identify. This indicates that the model provides more reliable and accurate predictions when handling complex terrain and landslide features. Traditional ML models, however, perform poorly overall, with issues such as misclassifying landslide areas as low risk and an excessive number of red high-risk areas, which may impact their effectiveness and reliability in practical applications.
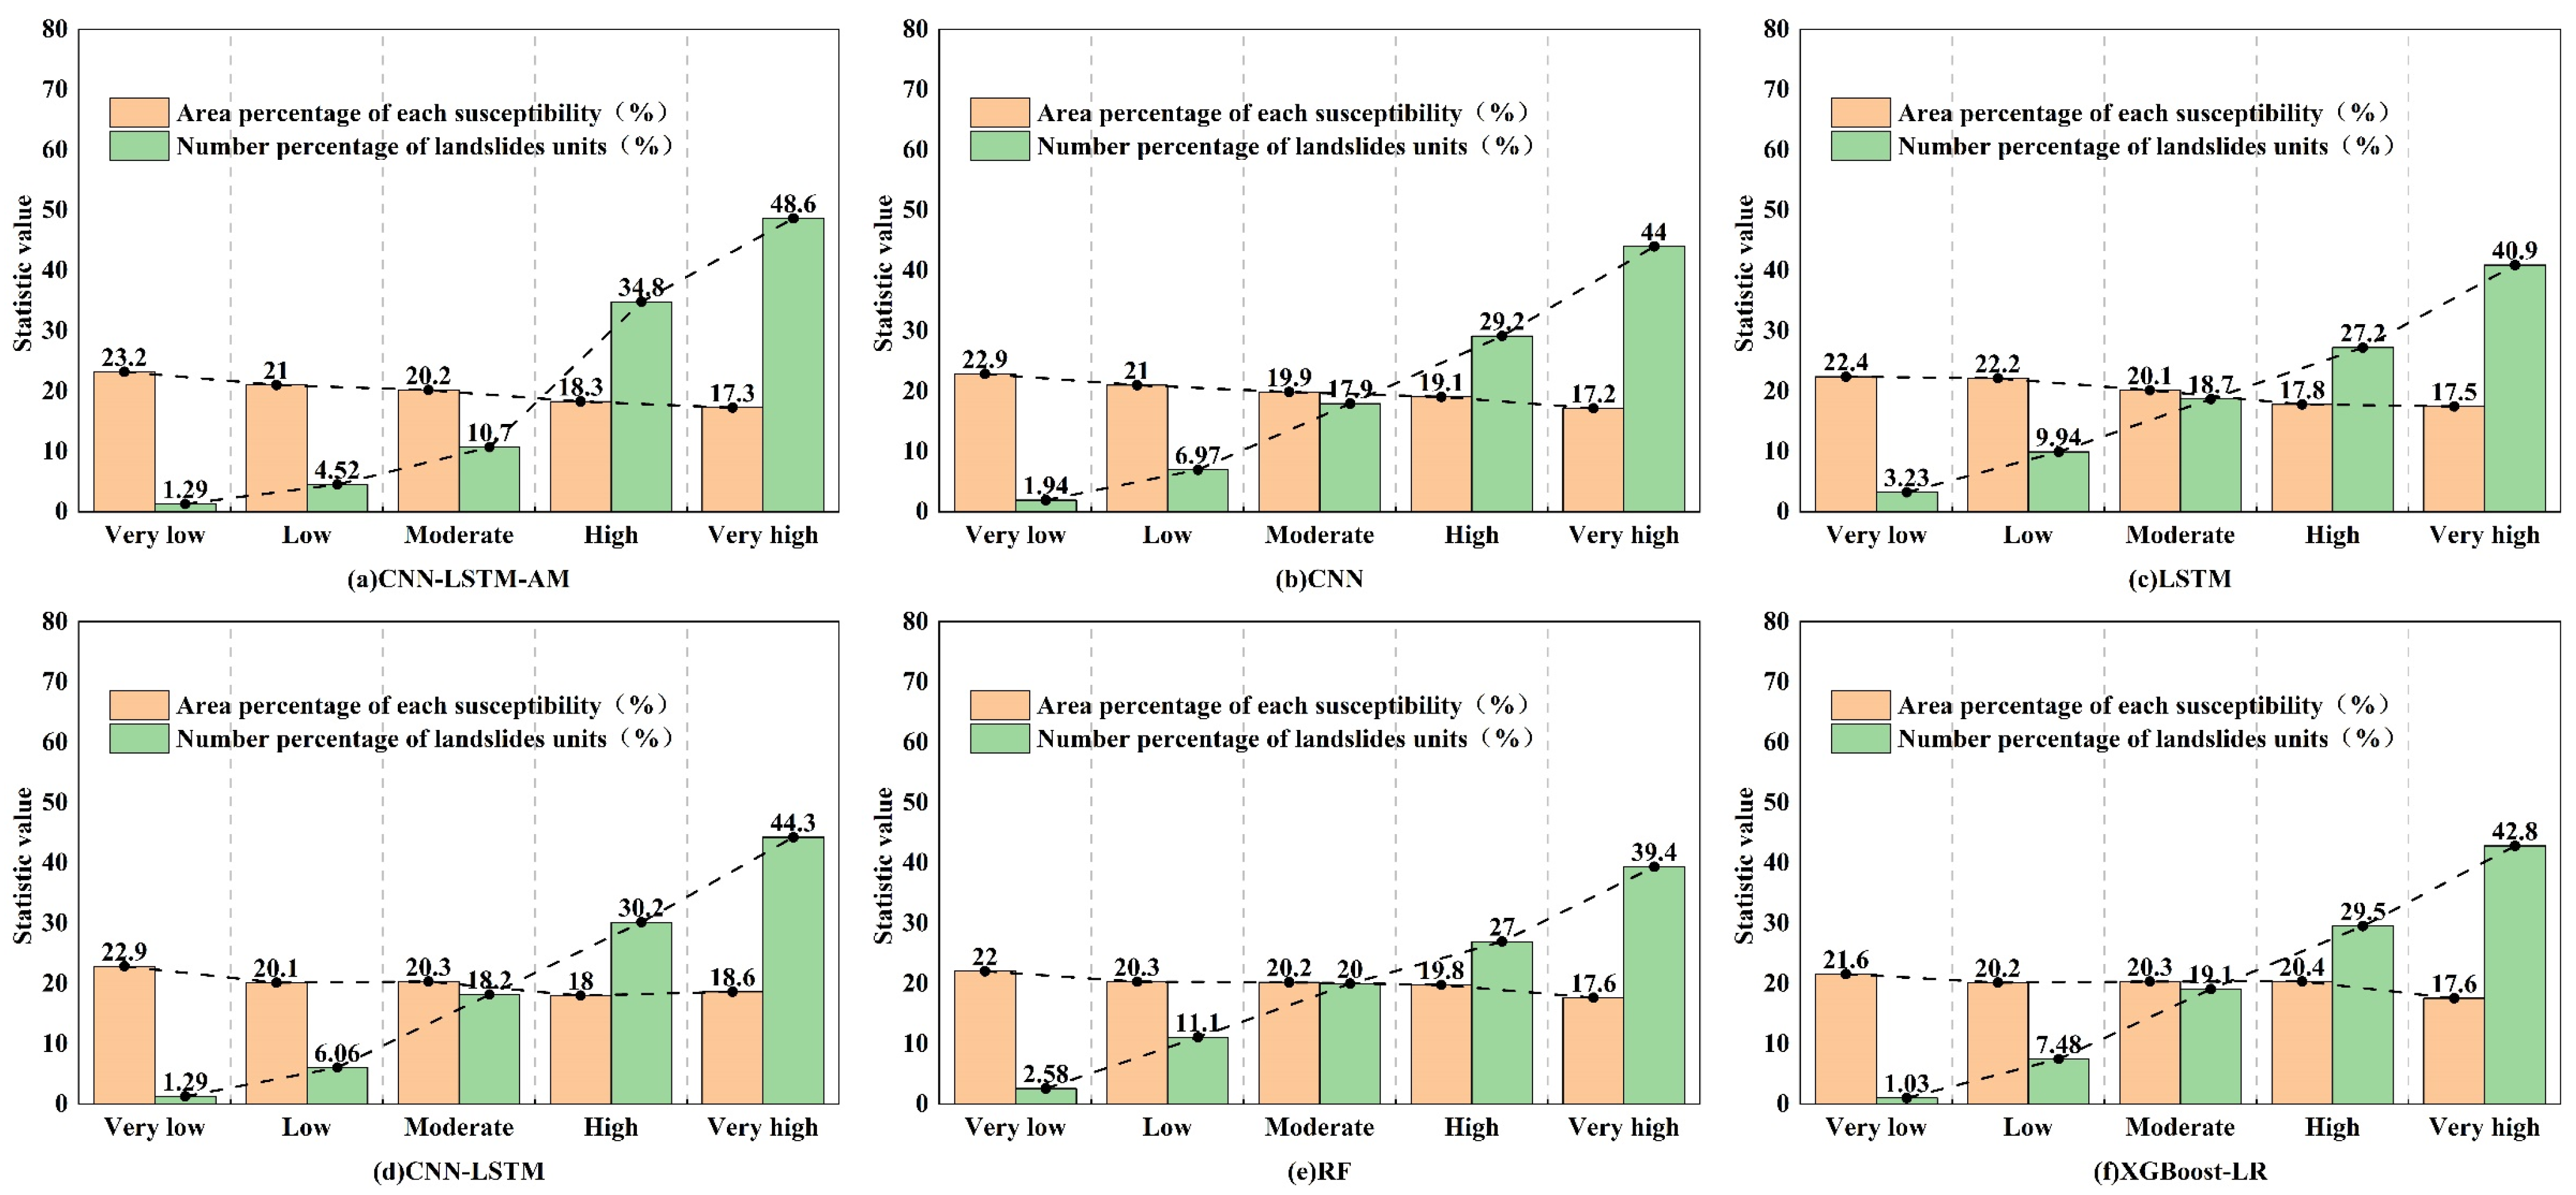
The number of grid cells and landslide events in each grade of the susceptibility zoning map for different models was counted, and the area ratio and landslide proportion for each grade were calculated. The results are shown in Figure 16.
The ideal landslide susceptibility model should cover extensive low-risk areas with minimal landslides and smaller high-risk areas with concentrated landslides. CNN-LSTM-AM performs notably well in low-risk zones, covering 23.2% and 21% of the area with only 1.29% and 4.52% of landslides, reducing false alarms effectively. In contrast, LSTM has a higher false alarm rate, with 9.94% of landslides in the “low” risk grade. CNNs and CNN-LSTM, with 6.97% and 6.06% of landslides, are slightly less effective. RF and XGBoost-LR have relatively high false alarm rates at 11.1% and 7.48%.
In medium-risk zones, CNN-LSTM-AM maintains a balanced performance, covering 20.2% of the area and 10.7% of landslides. CNN, LSTM, and CNN-LSTM show strong recognition but potential over-sensitivity, with 17.9%, 18.7%, and 18.2% of landslides, respectively. RF has the highest landslide ratio at 20%, indicating overfitting risk, while XGBoost-LR accounts for 19.1% of landslides.
CNN-LSTM-AM excels in high-risk zones, covering 18.3% of the area and 34.8% of landslides in the “high” grade and 17.3% of the area with 48.6% of landslides in the “very high” grade, accurately pinpointing high-risk areas. CNNs and CNN-LSTM perform slightly worse with 29.2% and 30.2% of landslides in the “high” grade and 44% and 44.3% in the “very high” grade. LSTM shows weaker identification at 17.8% and 40.9%, respectively. RF and XGBoost-LR exhibit suboptimal performance in the "high" and "very high" grades, correctly identifying 27% and 29.5% of landslides in the "high" grade, and 39.4% and 42.8% in the "very high" grade, respectively.

4. Discussion

This study examines landslide susceptibility modeling (LSM) in northeastern Leshan City, Sichuan Province, assessing how non-landslide sampling methods and machine learning (ML) models affect prediction accuracy. The research shows that using the certainty factor model for initial assessments and defining non-landslide areas based on model predictions can improve dataset reliability and boost model accuracy. The CNN-LSTM-AM model is highlighted for its ability to combine CNNs’ spatial feature extraction, LSTM’s temporal modeling, and attention mechanisms (AMs), thereby enhancing feature learning and generalization. However, this study also has limitations, such as being restricted to a localized area, having limited temporal feature diversity, and facing unresolved overfitting issues.
(1)
Reliance solely on monthly-average precipitation and temperature data presents significant limitations. Critically, monthly aggregation obscures transient hydrological triggers, such as short-duration heavy rainfall and seasonal wet–dry transitions, which are mechanistically critical for rainfall-induced shallow landslides. To rigorously validate the CNN-LSTM-AM model’s robustness, future iterations should integrate higher-resolution climate variables, including:
Sub-daily rainfall intensity (daily/hourly)
Extreme weather event chronologies (e.g., torrential rainfall and typhoon impacts)
Seasonal precipitation regimes (exemplified by Sichuan’s Meiyu/plum rain season)
(2)
Furthermore, integrating high-resolution monitoring data—such as InSAR and drone-derived datasets—enables real-time multiregional analysis essential for evaluating model robustness across diverse environments. Given the developed transportation infrastructure and high population density in northeastern Leshan, future research will prioritize regions with comparable anthropogenic influences. This approach validates the model’s applicability in areas facing elevated socioeconomic risks.
(3)
While this study primarily addresses rainfall-induced shallow landslides, it does not comprehensively evaluate other landslide types. Given the study area’s predominance of loose sediments, limited data exist on deep-seated rockslides, constraining the model’s applicability to diverse failure mechanisms. Future research will extend the framework to incorporate varied failure types, including rockslides and debris flows, and assess its robustness across heterogeneous geological settings to enhance transferability.
(4)
Time features are limited to monthly averages of rainfall and temperature; so, after concatenation, the temporal features’ contribution may be overshadowed by the spatial features (64- vs. 32-dimensional), negatively impacting fusion. Future research could optimize this by experimenting with different dimensional ratios, separate AM modules, or more temporal feature factors.

5. Conclusions

This study uses 10 key landslide conditioning factor variables. After optimizing the input variables through SHAP and correlation analysis, we refined the feature selection process. This allowed us to identify river and land use as key drivers of landslides. Furthermore, we compared various non-landslide sampling strategies to improve the landslide sample dataset. A CNN-LSTM-AM model, which integrates static spatial and dynamic temporal features, is applied and compared with multiple ML models. The key findings are as follows:
(1)
The non-landslide sampling strategy significantly affects model performance. Using the certainty factor model for pre-assessment and randomly sampling non-landslide points in low-risk areas after reclassification incorporates natural and human-made factors, yielding more reasonable features. This approach strengthens spatial constraints on non-landslide points, improving the dataset quality.
(2)
DL and its coupled models leverage multi-layer neural networks to learn hierarchical feature representations and fit complex nonlinear relationships. They outperform individual and traditional ML models in multimodal feature extraction and nonlinear modeling.
(3)
The CNN-LSTM-AM model integrates the spatial feature extraction capability of CNNs with the temporal sequence modeling strength of LSTMs, effectively fusing spatio-temporal characteristics. The AM further optimizes critical feature identification. Specifically, the LSTM’s gating mechanism regulates information flow to preserve essential temporal patterns, while the CNNs’ hierarchical structure mitigates overfitting by suppressing feature redundancy. The AM dynamically recalibrates feature weights to enhance extraction efficiency. This synergistic architecture significantly boosts feature mining and processing capabilities, particularly for rainfall-triggered shallow landslides prevalent in the study area, resulting in improved predictive performance.
Overall, optimizing non-landslide sampling strategies, integrating comprehensive geophysical features, introducing spatial constraints, and strengthening the model’s ability to mine heterogeneous and key feature data can significantly enhance LSM.

Author Contributions

J.-H.D. Writing—Original Draft, Software, Formal Analysis, Writing—Review and Editing, Data Curation, and Visualization; H.-Y.G. Methodology and Software; H.-Z.C. Methodology, Software, and Writing—Review and Editing; and J.J. Conceptualization, Funding Acquisition, Project Administration, and Supervision. All authors have read and agreed to the published version of the manuscript.

Funding

This work was financially supported by the National Natural Science Foundation of China (Grant Nos: U22A20594).

Data Availability Statement

All data, models, or code that support the findings of this study are available from the corresponding author upon reasonable request.

Acknowledgments

The authors would like to acknowledge the use of ChatGPT-4 (OpenAI) for providing valuable assistance in refining the language and improving the clarity of this manuscript. This tool played a supplementary role in enhancing the overall readability and presentation of this paper.

Conflicts of Interest

The authors declare that they have no known competing financial interests or personal relationships that could have appeared to influence the work reported in this paper.

References

  1. Chen, W.; Pourghasemi, H.R.; Panahi, M.; Kornejady, A.; Wang, J.; Xie, X.; Cao, S. Spatial prediction of landslide susceptibility using an adaptive neuro-fuzzy inference system combined with frequency ratio, generalized additive model, and support vector machine techniques. Geomorphology 2017, 297, 69–85. [Google Scholar] [CrossRef]
  2. Brenning, A. Spatial prediction models for landslide hazards: Review, comparison and evaluation. Nat. Hazards Earth Syst. Sci. 2005, 5, 853–862. [Google Scholar] [CrossRef]
  3. Reichenbach, P.; Rossi, M.; Malamud, B.D.; Mihir, M.; Guzzetti, F. A review of statistically-based landslide susceptibility models. Earth-Sci. Rev. 2018, 180, 60–91. [Google Scholar] [CrossRef]
  4. Chang, Z.; Du, Z.; Zhang, F.; Huang, F.; Chen, J.; Li, W.; Guo, Z. Landslide susceptibility prediction based on remote sensing images and GIS: Comparisons of supervised and unsupervised machine learning models. Remote Sens. 2020, 12, 502. [Google Scholar] [CrossRef]
  5. Barman, J.; Soren, D.D.L.; Biswas, B. Landslide susceptibility evaluation and analysis: A review on articles published during 2000 to 2020. In Monitoring and Managing Multi-Hazards—A Multidisciplinary Approach; Springer: Berlin/Heidelberg, Germany, 2022; pp. 211–220. [Google Scholar]
  6. Yin, K. Statistical prediction model for slope instability of metamorphosed rocks. In Proceedings of the 5th International Symposium on Landslides, Lausanne, Switzerland, 10–15 July 1988; pp. 1269–1272. [Google Scholar]
  7. Qiang, Y.; Gaofeng, W.; Weicui, D. Susceptibility and accuracy evaluation of regional landsldie based on multiple hybrid models. J. Nat. Disasters 2021, 30, 36–51. [Google Scholar]
  8. Wang, Y.; Wu, X.; Chen, Z.; Ren, F.; Feng, L.; Du, Q. Optimizing the predictive ability of machine learning methods for landslide susceptibility mapping using SMOTE for Lishui City in Zhejiang Province, China. Int. J. Environ. Res. Public Health 2019, 16, 368. [Google Scholar] [CrossRef]
  9. Youssef, A.M.; Pourghasemi, H.R.; Pourtaghi, Z.S.; Al-Katheeri, M.M. Landslide susceptibility mapping using random forest, boosted regression tree, classification and regression tree, and general linear models and comparison of their performance at Wadi Tayyah Basin, Asir Region, Saudi Arabia. Landslides 2016, 13, 839–856. [Google Scholar] [CrossRef]
  10. Chen, W.; Xie, X.; Wang, J.; Pradhan, B.; Hong, H.; Bui, D.T.; Duan, Z.; Ma, J. A comparative study of logistic model tree, random forest, and classification and regression tree models for spatial prediction of landslide susceptibility. Catena 2017, 151, 147–160. [Google Scholar] [CrossRef]
  11. Dang, V.-H.; Hoang, N.-D.; Nguyen, L.-M.-D.; Bui, D.T.; Samui, P. A novel GIS-based random forest machine algorithm for the spatial prediction of shallow landslide susceptibility. Forests 2020, 11, 118. [Google Scholar] [CrossRef]
  12. Yesilnacar, E.; Topal, T. Landslide susceptibility mapping: A comparison of logistic regression and neural networks methods in a medium scale study, Hendek region (Turkey). Eng. Geol. 2005, 79, 251–266. [Google Scholar] [CrossRef]
  13. Lu, Z.; Liu, G.; Song, Z.; Sun, K.; Li, M.; Chen, Y.; Zhao, X.; Zhang, W. Advancements in Technologies and Methodologies of Machine Learning in Landslide Susceptibility Research: Current Trends and Future Directions. Appl. Sci. 2024, 14, 9639. [Google Scholar] [CrossRef]
  14. Bui, D.T.; Hoang, N.-D.; Martínez-Álvarez, F.; Ngo, P.-T.T.; Hoa, P.V.; Pham, T.D.; Samui, P.; Costache, R. A novel deep learning neural network approach for predicting flash flood susceptibility: A case study at a high frequency tropical storm area. Sci. Total Environ. 2020, 701, 134413. [Google Scholar]
  15. Chen, Y.; Lin, Z.; Zhao, X.; Wang, G.; Gu, Y. Deep learning-based classification of hyperspectral data. IEEE J. Sel. Top. Appl. Earth Obs. Remote Sens. 2014, 7, 2094–2107. [Google Scholar] [CrossRef]
  16. Liu, Y.; Wu, L. Geological disaster recognition on optical remote sensing images using deep learning. Procedia Comput. Sci. 2016, 91, 566–575. [Google Scholar] [CrossRef]
  17. Huang, F.; Zhang, J.; Zhou, C.; Wang, Y.; Huang, J.; Zhu, L. A deep learning algorithm using a fully connected sparse autoencoder neural network for landslide susceptibility prediction. Landslides 2020, 17, 217–229. [Google Scholar] [CrossRef]
  18. Xiao, L.; Zhang, Y.; Peng, G. Landslide susceptibility assessment using integrated deep learning algorithm along the China-Nepal highway. Sensors 2018, 18, 4436. [Google Scholar] [CrossRef] [PubMed]
  19. Habumugisha, J.M.; Chen, N.; Rahman, M.; Islam, M.M.; Ahmad, H.; Elbeltagi, A.; Sharma, G.; Liza, S.N.; Dewan, A. Landslide susceptibility mapping with deep learning algorithms. Sustainability 2022, 14, 1734. [Google Scholar] [CrossRef]
  20. Cui, H.; Ji, J.; Hürlimann, M.; Medina, V. Probabilistic and physically-based modelling of rainfall-induced landslide susceptibility using integrated GIS-FORM algorithm. Landslides 2024, 21, 1461–1481. [Google Scholar] [CrossRef]
  21. Cui, H.; Tong, B.; Wang, T.; Dou, J.; Ji, J. A hybrid data-driven approach for rainfall-induced landslide susceptibility mapping: Physically-based probabilistic model with convolutional neural network. J. Rock Mech. Geotech. Eng. 2024. [Google Scholar] [CrossRef]
  22. Ji, J.; Cui, H.; Zhang, T.; Song, J.; Gao, Y. A GIS-based tool for probabilistic physical modelling and prediction of landslides: GIS-FORM landslide susceptibility analysis in seismic areas. Landslides 2022, 19, 2213–2231. [Google Scholar] [CrossRef]
  23. Cui, H.; Medina, V.; Hürlimann, M.; Ji, J. Fast physically-based probabilistic modelling of rainfall-induced shallow landslide susceptibility at the regional scale considering geotechnical uncertainties and different hydrological conditions. Comput. Geotech. 2024, 172, 106400. [Google Scholar] [CrossRef]
  24. Min, D.-H.; Yoon, H.-K. Suggestion for a new deterministic model coupled with machine learning techniques for landslide susceptibility mapping. Sci. Rep. 2021, 11, 6594. [Google Scholar] [CrossRef] [PubMed]
  25. Hu, X.; Mei, H.; Zhang, H.; Li, Y.; Li, M. Performance evaluation of ensemble learning techniques for landslide susceptibility mapping at the Jinping county, Southwest China. Nat. Hazards 2021, 105, 1663–1689. [Google Scholar] [CrossRef]
  26. Hu, X.; Zhang, H.; Mei, H.; Xiao, D.; Li, Y.; Li, M. Landslide susceptibility mapping using the stacking ensemble machine learning method in Lushui, Southwest China. Appl. Sci. 2020, 10, 4016. [Google Scholar] [CrossRef]
  27. Youssef, K.; Shao, K.; Moon, S.; Bouchard, L.-S. Landslide susceptibility modeling by interpretable neural network. Commun. Earth Environ. 2023, 4, 162. [Google Scholar] [CrossRef]
  28. Zhang, J.; Qian, J.; Lu, Y.; Li, X.; Song, Z. Study on Landslide Susceptibility Based on Multi-Model Coupling: A Case Study of Sichuan Province, China. Sustainability 2024, 16, 6803. [Google Scholar] [CrossRef]
  29. Azarafza, M.; Azarafza, M.; Akgün, H.; Atkinson, P.M.; Derakhshani, R. Deep learning-based landslide susceptibility mapping. Sci. Rep. 2021, 11, 24112. [Google Scholar] [CrossRef]
  30. Meena, S.R.; Puliero, S.; Bhuyan, K.; Floris, M.; Catani, F. Assessing the importance of conditioning factor selection in landslide susceptibility for the province of Belluno (region of Veneto, northeastern Italy). Nat. Hazards Earth Syst. Sci. 2022, 22, 1395–1417. [Google Scholar] [CrossRef]
  31. Moghimi, A.; Singha, C.; Fathi, M.; Pirasteh, S.; Mohammadzadeh, A.; Varshosaz, M.; Huang, J.; Li, H. Hybridizing genetic random forest and self-attention based CNN-LSTM algorithms for landslide susceptibility mapping in Darjiling and Kurseong, India. Quat. Sci. Adv. 2024, 14, 100187. [Google Scholar] [CrossRef]
  32. Kalantar, B.; Ueda, N.; Lay, U.S.; Al-Najjar, H.A.H.; Halin, A.A. Conditioning factors determination for landslide susceptibility mapping using support vector machine learning. In Proceedings of the IGARSS 2019—2019 IEEE International Geoscience and Remote Sensing Symposium, Yokohama, Japan, 28 July–2 August 2019; pp. 9626–9629. [Google Scholar]
  33. Jiang, W.; Li, L.; Niu, R. Impact of non-landslide sample sampling strategies and model selection on landslide susceptibility mapping. Appl. Sci. 2025, 15, 2132. [Google Scholar] [CrossRef]
  34. Xi, C.; Han, M.; Hu, X.; Liu, B.; He, K.; Luo, G.; Cao, X. Effectiveness of Newmark-based sampling strategy for coseismic landslide susceptibility mapping using deep learning, support vector machine, and logistic regression. Bull. Eng. Geol. Environ. 2022, 81, 174. [Google Scholar] [CrossRef]
  35. Okalp, K.; Akgün, H. Landslide susceptibility assessment in medium-scale: Case studies from the major drainage basins of Turkey. Environ. Earth Sci. 2022, 81, 244. [Google Scholar] [CrossRef]
  36. Gu, T.; Duan, P.; Wang, M.; Li, J.; Zhang, Y. Effects of non-landslide sampling strategies on machine learning models in landslide susceptibility mapping. Sci. Rep. 2024, 14, 7201. [Google Scholar] [CrossRef]
  37. Wei, M.; Dai, F.; Liu, Y.; Li, A.; Yan, Z. Influences of loading method and notch type on rock fracture toughness measurements: From the perspectives of T-stress and fracture process zone. Rock Mech. Rock Eng. 2021, 54, 4965–4986. [Google Scholar] [CrossRef]
  38. Xu, Y.; Dai, F. Dynamic response and failure mechanism of brittle rocks under combined compression-shear loading experiments. Rock Mech. Rock Eng. 2018, 51, 747–764. [Google Scholar] [CrossRef]
  39. Liu, Y.; Dai, F. A damage constitutive model for intermittent jointed rocks under cyclic uniaxial compression. Int. J. Rock Mech. Min. Sci. 2018, 103, 289–301. [Google Scholar] [CrossRef]
  40. Sun, D. Landslide Susceptibility Zoning and Rainfall-Induced Landslide Prediction and Early Warning Service Based on Machine Learning; East China Normal University: Shanghai, China, 2019. [Google Scholar]
  41. Yang Le, P.H.M.; Xie, H.; Luo, Z.; Tan, L. Assessment of Geological Environment Carrying Capacity of Fengjie County Based on AHP. J. Chongqing Jiaotong Univ. Nat. Sci. 2014, 33, 95–99. [Google Scholar]
  42. Arsyad, A.; Hamid, W. Landslide susceptibility mapping along road corridors in west Sulawesi using GIS-AHP models. In Proceedings of the IOP Conference Series: Earth and Environmental Science, Bali, Indonesia, 29–30 August 2019; p. 012080. [Google Scholar]
  43. Guo, J. Study on the influence of river erosion on landslide stability. Gansu Water Resour. Hydropower Technol. 2019, 55, 38–41. [Google Scholar]
  44. Niraj, K.; Singh, A.; Shukla, D.P. Effect of the normalized difference vegetation index (NDVI) on GIS-enabled bivariate and multivariate statistical models for landslide susceptibility mapping. J. Indian Soc. Remote Sens. 2023, 51, 1739–1756. [Google Scholar] [CrossRef]
  45. Chen, W.; Chai, H.; Zhao, Z.; Wang, Q.; Hong, H. Landslide susceptibility mapping based on GIS and support vector machine models for the Qianyang County, China. Environ. Earth Sci. 2016, 75, 474. [Google Scholar] [CrossRef]
  46. Dahal, R.K.; Hasegawa, S.; Nonomura, A.; Yamanaka, M.; Masuda, T.; Nishino, K. GIS-based weights-of-evidence modelling of rainfall-induced landslides in small catchments for landslide susceptibility mapping. Environ. Geol. 2008, 54, 311–324. [Google Scholar] [CrossRef]
  47. Gariano, S.L.; Guzzetti, F. Landslides in a changing climate. Earth-Sci. Rev. 2016, 162, 227–252. [Google Scholar] [CrossRef]
  48. Henriques, C.; Zêzere, J.L.; Marques, F. The role of the lithological setting on the landslide pattern and distribution. Eng. Geol. 2015, 189, 17–31. [Google Scholar] [CrossRef]
  49. China Geological Data Library. Available online: http://www.ngac.org.cn/ (accessed on 5 June 2024).
  50. Wang, Y.; Fang, Z.; Hong, H. Comparison of convolutional neural networks for landslide susceptibility mapping in Yanshan County, China. Sci. Total Environ. 2019, 666, 975–993. [Google Scholar] [CrossRef] [PubMed]
  51. Hamedi, H.; Alesheikh, A.A.; Panahi, M.; Lee, S. Landslide susceptibility mapping using deep learning models in Ardabil province, Iran. Stoch. Environ. Res. Risk Assess. 2022, 36, 4287–4310. [Google Scholar] [CrossRef]
  52. Zhang, D.; Yang, J.; Li, F.; Han, S.; Qin, L.; Li, Q. Landslide risk prediction model using an attention-based temporal convolutional network connected to a recurrent neural network. IEEE Access 2022, 10, 37635–37645. [Google Scholar] [CrossRef]
  53. Ge, Q.; Li, J.; Wang, X.; Deng, Y.; Zhang, K.; Sun, H. LiteTransNet: An interpretable approach for landslide displacement prediction using transformer model with attention mechanism. Eng. Geol. 2024, 331, 107446. [Google Scholar] [CrossRef]
  54. Kavzoglu, T.; Sahin, E.K.; Colkesen, I. Selecting optimal conditioning factors in shallow translational landslide susceptibility mapping using genetic algorithm. Eng. Geol. 2015, 192, 101–112. [Google Scholar] [CrossRef]
  55. Peng, M.; Zhang, L.; Sun, X.; Cen, Y.; Zhao, X. A fast three-dimensional convolutional neural network-based spatiotemporal fusion method (STF3DCNN) using a spatial-temporal-spectral dataset. Remote Sens. 2020, 12, 3888. [Google Scholar] [CrossRef]
  56. Liu, H.; Chen, W.; Li, Y. Application of integrated model based on EEMD-CNN-LSTM for landslide-displacement prediction. J. Geomech. 2024, 30, 633–646. [Google Scholar]
  57. Fan, W.; Wei, X.-s.; Cao, Y.-b.; Zheng, B. Landslide susceptibility assessment using the certainty factor and analytic hierarchy process. J. Mt. Sci. 2017, 14, 906–925. [Google Scholar] [CrossRef]
  58. Zhengjun, M.; Jing’e, Z.; Jiaxin, Z. Sensitivity analysis of factors influencing loess terrace landslide potential using certainty factor method. Bull. Soil Water Conserv. 2023, 43, 183–192. [Google Scholar]
  59. Dou, H.; He, J.; Huang, S.; Jian, W.; Guo, C. Influences of non-landslide sample selection strategies on landslide susceptibility mapping by machine learning. Geomat. Nat. Hazards Risk 2023, 14, 2285719. [Google Scholar] [CrossRef]
  60. Ercanoglu, M.; Gokceoglu, C.; Van Asch, T.W. Landslide susceptibility zoning north of Yenice (NW Turkey) by multivariate statistical techniques. Nat. Hazards 2004, 32, 1–23. [Google Scholar] [CrossRef]
  61. Hong, H.; Ilia, I.; Tsangaratos, P.; Chen, W.; Xu, C. A hybrid fuzzy weight of evidence method in landslide susceptibility analysis on the Wuyuan area, China. Geomorphology 2017, 290, 1–16. [Google Scholar] [CrossRef]
  62. Gomez, H.; Kavzoglu, T. Assessment of shallow landslide susceptibility using artificial neural networks in Jabonosa River Basin, Venezuela. Eng. Geol. 2005, 78, 11–27. [Google Scholar] [CrossRef]
  63. Kavzoglu, T.; Sahin, E.K.; Colkesen, I. Landslide susceptibility mapping using GIS-based multi-criteria decision analysis, support vector machines, and logistic regression. Landslides 2014, 11, 425–439. [Google Scholar] [CrossRef]
  64. Cantarino, I.; Carrion, M.A.; Goerlich, F.; Martinez Ibañez, V. A ROC analysis-based classification method for landslide susceptibility maps. Landslides 2019, 16, 265–282. [Google Scholar] [CrossRef]
  65. Sterlacchini, S.; Ballabio, C.; Blahut, J.; Masetti, M.; Sorichetta, A. Spatial agreement of predicted patterns in landslide susceptibility maps. Geomorphology 2011, 125, 51–61. [Google Scholar] [CrossRef]
  66. Kalantar, B.; Pradhan, B.; Naghibi, S.A.; Motevalli, A.; Mansor, S. Assessment of the effects of training data selection on the landslide susceptibility mapping: A comparison between support vector machine (SVM), logistic regression (LR) and artificial neural networks (ANN). Geomat. Nat. Hazards Risk 2018, 9, 49–69. [Google Scholar] [CrossRef]
  67. Zhang, J.; Ma, X.; Zhang, J.; Sun, D.; Zhou, X.; Mi, C.; Wen, H. Insights into geospatial heterogeneity of landslide susceptibility based on the SHAP-XGBoost model. J. Environ. Manag. 2023, 332, 117357. [Google Scholar] [CrossRef] [PubMed]
  68. Van den Broeck, G.; Lykov, A.; Schleich, M.; Suciu, D. On the tractability of SHAP explanations. J. Artif. Intell. Res. 2022, 74, 851–886. [Google Scholar] [CrossRef]
  69. Yang, X.; Liu, R.; Yang, M.; Chen, J.; Liu, T.; Yang, Y.; Chen, W.; Wang, Y. Incorporating landslide spatial information and correlated features among conditioning factors for landslide susceptibility mapping. Remote Sens. 2021, 13, 2166. [Google Scholar] [CrossRef]
  70. Yang, C.; Liu, L.-L.; Huang, F.; Huang, L.; Wang, X.-M. Machine learning-based landslide susceptibility assessment with optimized ratio of landslide to non-landslide samples. Gondwana Res. 2023, 123, 198–216. [Google Scholar] [CrossRef]
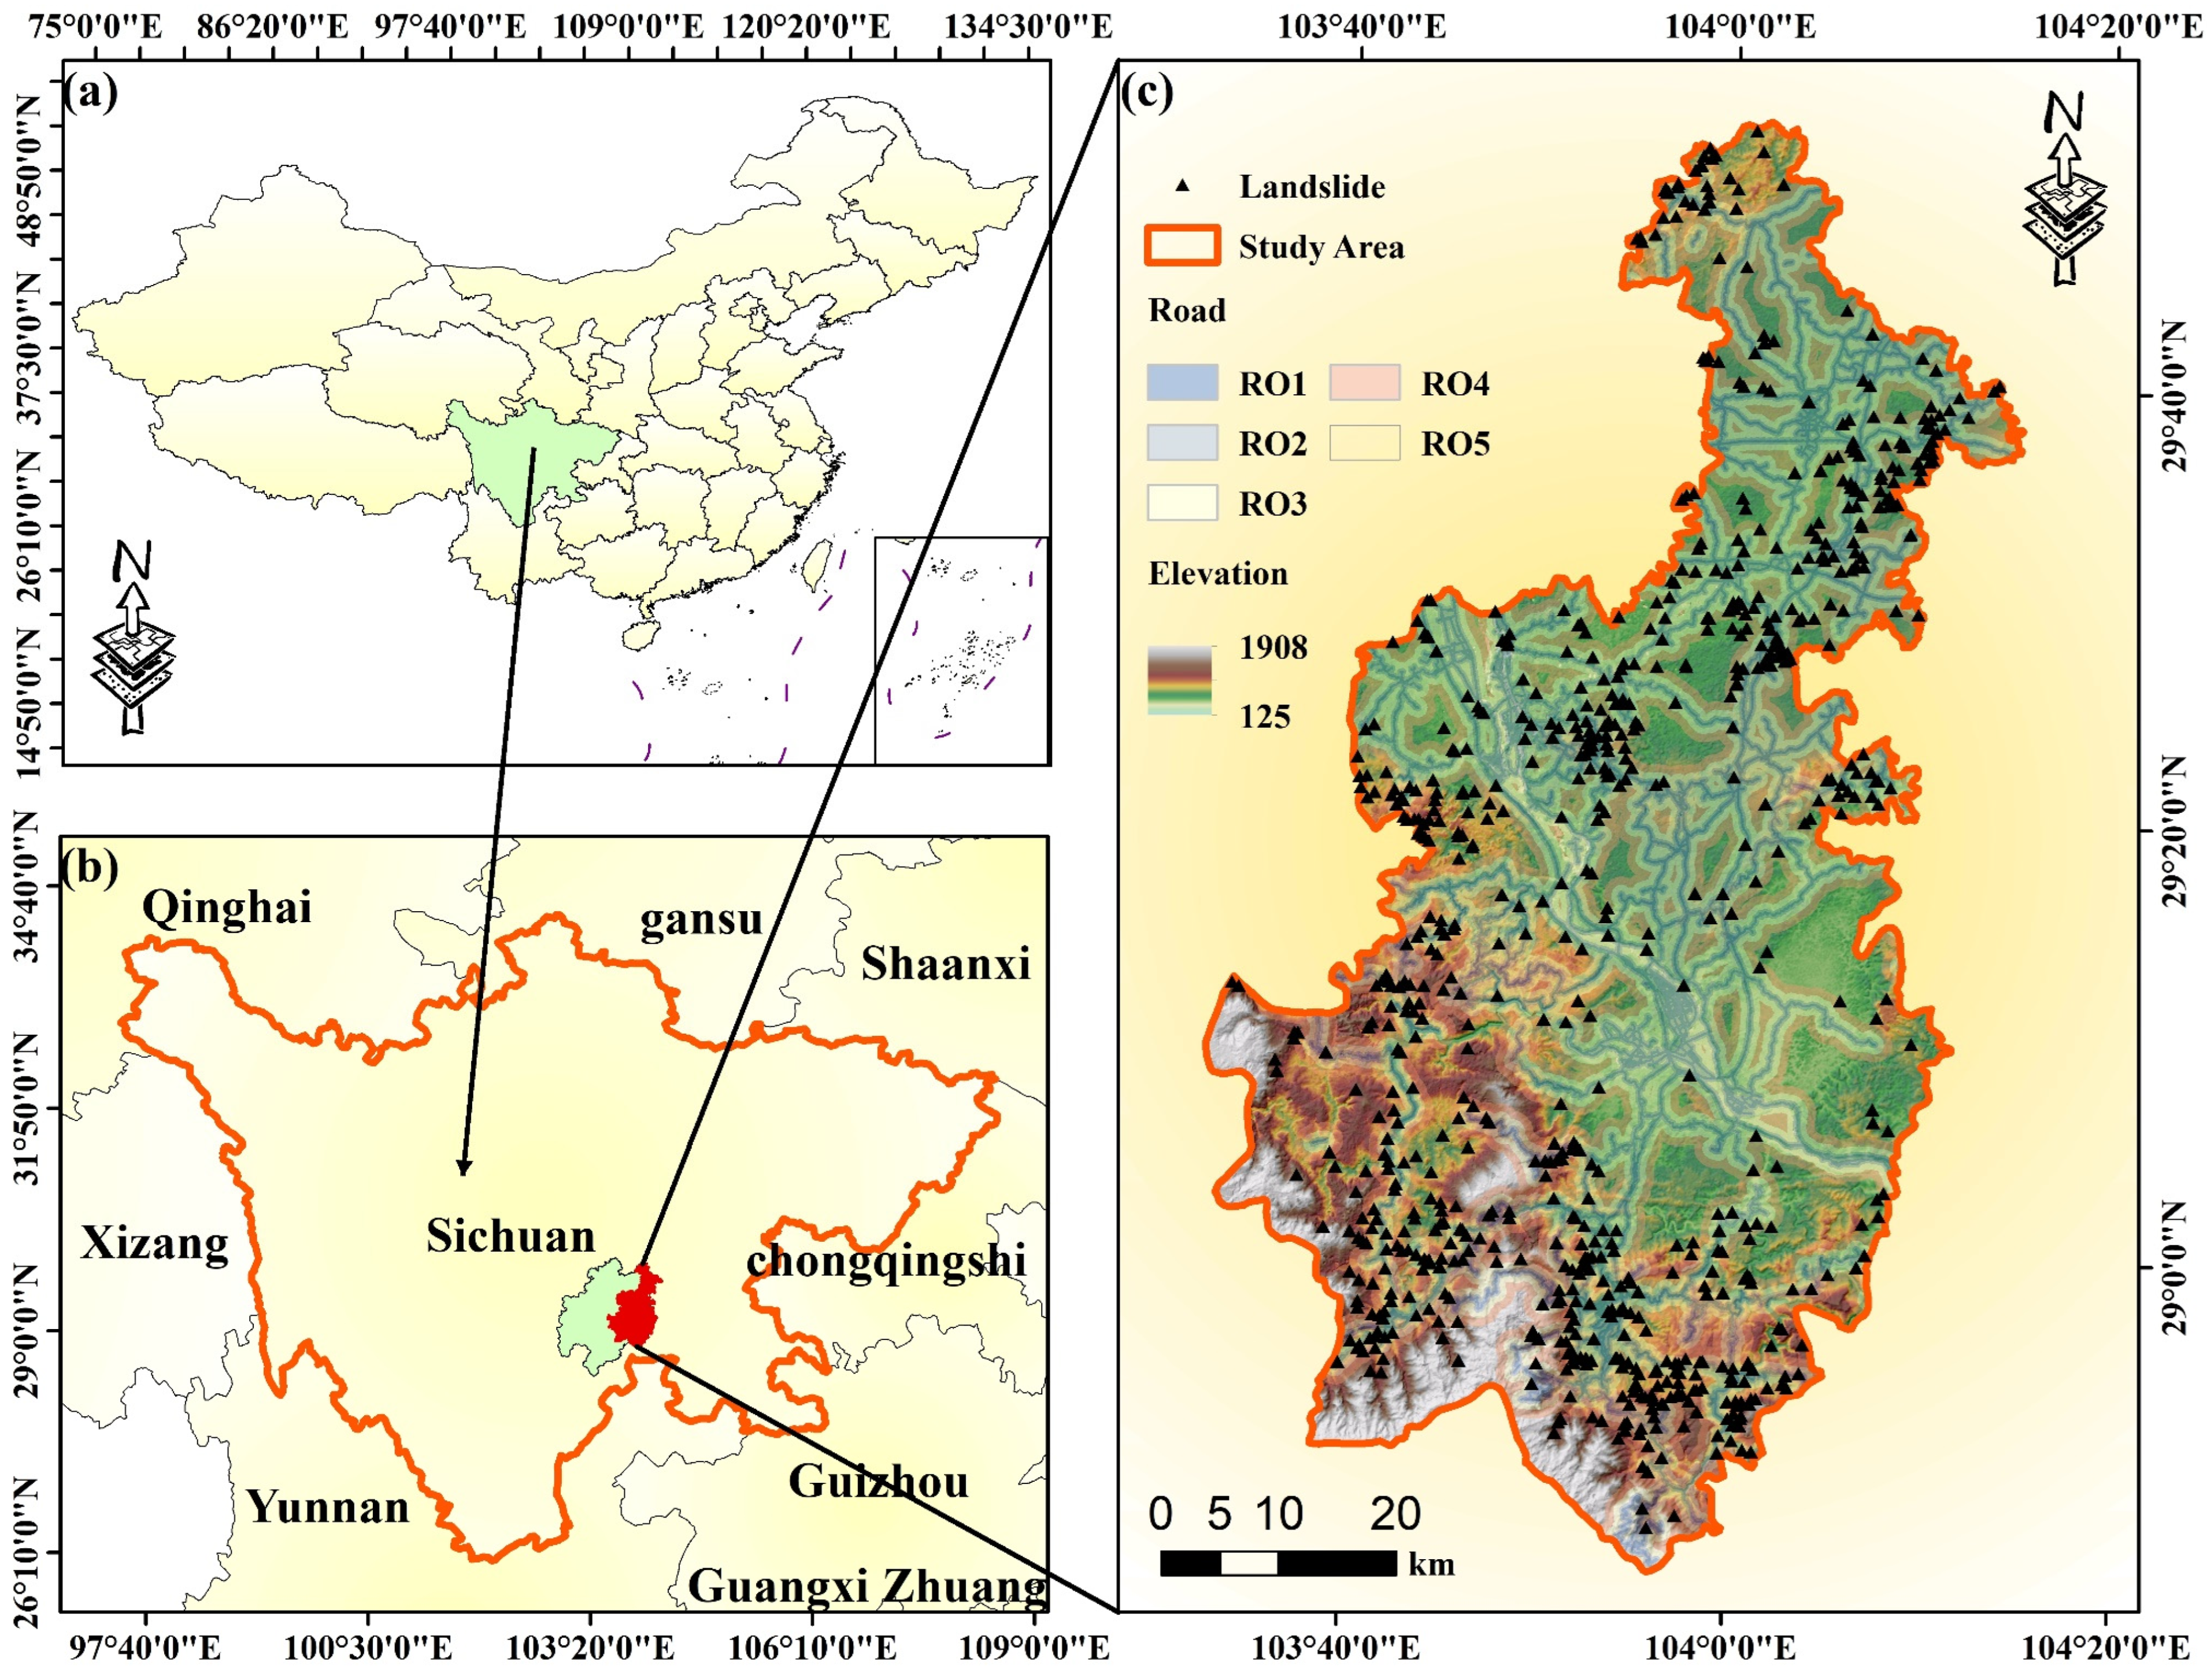
Figure 1. Schematic map of the study area: (a) geographical location of Sichuan Province; (b) geographical location of the study area; and (c) elevation and distribution of historical landslide sites in the study area.
Water 17 01778 g001
Figure 2. Landslide conditioning factors: (a) elevation; (b) normalized difference vegetation index (NDVI); (c) aspect; (d) land use (L1: grassland; L2: forest; L3: unutilized land; L4: cultivated land; L5: water bodies; and L6: residential land); (e) planar curvature; (f) slope; (g) Terrain Wetness Index (TWI); (h) road buffer zone (RO1: 0–400 m; RO2: 400–600 m; RO3: 600–800 m; RO4: 800–1500 m; and RO5: >1500 m); (i) river buffer zone (RI1: 0–100 m; RI2: 100–300 m; RI3: 300–800 m; RI4: 800–1500 m; and RI5: >1500 m); (j) lithology (specific lithology classification is shown in Table 2); (k) rainfall; and (l) temperature.
Water 17 01778 g002
Figure 3. Convolutional neural network flowchart.
Water 17 01778 g003
Figure 4. Schematic diagram of a single LSTM neuron.
Water 17 01778 g004
Figure 5. CNN-LSTM module architecture (The arrows indicate the subsequent meaning or step.).
Water 17 01778 g005
Figure 6. Attention section architecture.
Water 17 01778 g006
Figure 7. Sampling non-landslide areas based on a specific landslide conditioning factor and a specific threshold value (using slope as an example).
Water 17 01778 g007
Figure 8. Diagram of a buffer zone centered on the landslide point, with the area outside the buffer zone as the non-landslide sampling area.
Water 17 01778 g008
Figure 9. Analysis of the importance of landslide conditioning factors.
Water 17 01778 g009
Figure 10. Correlation analysis of landslide conditioning factors (Red indicates a positive correlation, while blue represents a negative correlation, with deeper colors signifying stronger correlations.).
Water 17 01778 g010
Figure 11. Flowchart of non-landslide sampling strategy using the certainty factor model: (a) landslide susceptibility zoning map generated using the certainty factor model; (b) reclassified landslide susceptibility zoning map; and (c) non-landslide sampling area sampled after retaining Class 1 and Class 2.
Water 17 01778 g011
Figure 12. Changes in loss rate and accuracy rate during model training with an increasing number of iterations.
Water 17 01778 g012
Figure 13. ROC curves, AUC values, and POD, ACC, and PRC numerical statistics for each model.
Water 17 01778 g013
Figure 14. Landslide susceptibility zoning maps for different models.
Water 17 01778 g014
Figure 15. Local area magnification and comparison: (a) landslide in Qingsong Village, Jinshijing Town; (b) landslide in Laocai Mountain; and (c) landslide in Luerping state-owned forest farm, Yongsheng Township, Jinkouhe District.
Water 17 01778 g015
Figure 16. Area ratio of landslide-prone zones and landslide proportion statistics for each model.
Water 17 01778 g016
Table 1. Data sources for the study area.
DataSource
DEMGeospatial Data Cloud (http://www.gscloud.cn/)
LithologyChina National Digital Geological Map (Public Version at 1:200,000 Scale) Spatial Database
Road and RiverInstitute of Resource and Environmental Science and Data Center, Chinese Academy of Sciences (https://www.resdc.cn/)
NDVIInstitute of Resource and Environmental Science and Data Center, Chinese Academy of Sciences (https://www.resdc.cn/)
Monthly average rainfall and temperatureNational Qinghai-Tibet Plateau Data Center (https://data.tpdc.ac.cn/)
Table 2. Lithological classification of the study area.
Zone CodeStratigraphic DescriptionLithological Features
IIgneous rockContains pyroxene, plagioclase, feldspar, and mica.
IISedimentary rockClastic sedimentary rocks and chemical sedimentary rocks often contain quartz, clay, fossils, and mineral components, with distinct layered structures.
IITertiary rockLoose alluvial deposits and accumulations, mainly composed of sand, gravel, clay, etc., often accompanied by organic matter and minerals.
IVQuaternary sedimentary rocksAlluvial deposits and wind-blown sand deposits containing gravel and clay, with loose sedimentary structures and distinct bedding planes.
VContemporary rock strata groupsSandstone, shale, limestone, conglomerate, igneous rock, and other clastic or chemical sedimentary rocks.
VIConstructive planeFracture zones, slip zones, contact surfaces, possible contact between igneous and sedimentary rocks, and rock layer fractures and displacements.
VIISpecial stratigraphic unitSpecific biota or mineral-rich layers containing special sediments, such as lake sediments and tidal sediments.
Table 3. Hyperparameters of CNN-LSTM-AM optimized by Bayesian optimization.
HyperparameterOptimization IntervalOptimal Hyperparameters
Convolution filter[16,128]16
CNN layer learning rate[0.0001,0.01]0.01
L2 regularization parameter[0.1,0.5]0.1
CNN layer dropout rate[0.1,0.5]0.01
Activation function[‘relu’, ‘tanh’, ‘sigmoid’]tanh
Number of LSTM units[32,256]32
Number of LSTM layers[1,3]3
LSTM layer dropout rate[0.1,0.5]0.21662988253928206
Table 4. Statistics of CF values for spatial characteristics and landslide conditioning factor classification.
DEMCFTWICF
125–462−0.141.29–6.570.17
462–6380.356.57–9.020.04
638–8840.229.02–12.23−0.43
884–1210−0.5012.23–16.18−0.60
1210–1908−0.5216.18–25.42−0.61
RoadCFSlopeCF
0–4000.360−6.53−0.51
400–6000.236.53–12.980.25
600–8000.0312.98–21.140.31
800–1500−0.1221.14–32.560.28
>1500−0.4432.56–82.940.09
RiverCFPlan curvatureCF
0–100−0.700–160.27
100–3000.6116–280.08
300–8000.1428–410.02
800–15000.1441–56−0.29
>1500−0.5256–76−0.49
LithologyCFLand useCF
I−0.08L10.12
II−0.10L2−0.19
III0.23L3−1.00
IV0.06L4−1.00
V−0.14L5−0.92
VI0.15L6−0.46
VII0.16
Table 5. Landslide sensitivity index E values for various landslide conditioning factors.
Landslide Conditioning FactorENormalized Weight Values
DEM0.870.13
TWI0.780.11
Road0.800.12
Slope0.820.12
River1.310.19
Plan curvature0.760.11
Lithology0.370.05
Land use1.120.16
Table 6. MSE and AUC statistics under three strategies.
StrategyMSEAUC
(a)0.1210.83
(b)0.0650.89
(c)0.0570.91
Disclaimer/Publisher’s Note: The statements, opinions and data contained in all publications are solely those of the individual author(s) and contributor(s) and not of MDPI and/or the editor(s). MDPI and/or the editor(s) disclaim responsibility for any injury to people or property resulting from any ideas, methods, instructions or products referred to in the content.