Article

Evaluating Drought Mitigation Measures for Wetland Management with DEMATEL: A Case Study Report of the Koviljsko–Petrovaradinski Rit Wetland in Serbia

1
Faculty of Agriculture, University of Novi Sad, Trg D. Obradovica 8, 21000 Novi Sad, Serbia
2
Institute for Nature Conservation of Vojvodina Province, Radnička 22a, 21000 Novi Sad, Serbia
3
Public Water Management Company Vode Vojvodine, Bul. Mihajla Pupina 25, 21000 Novi Sad, Serbia
*
Author to whom correspondence should be addressed.
Water 2025, 17(12), 1777; https://doi.org/10.3390/w17121777
Submission received: 6 May 2025 / Revised: 5 June 2025 / Accepted: 10 June 2025 / Published: 13 June 2025
(This article belongs to the Section Water Resources Management, Policy and Governance)

Abstract

Wetlands are among the most valuable yet endangered ecosystems, particularly due to increasingly frequent and intense droughts. To mitigate drought risks, various human-made measures can be applied, with some being causally linked and differing in effectiveness. This study employs the DEMATEL (Decision-Making Trial and Evaluation Laboratory) model to assess and visualize the causal relationships and importance of drought mitigation measures, as evaluated by a multidisciplinary group of experts, focusing on a wetland in Serbia’s Special Nature Reserve ‘Koviljsko–Petrovaradinski Rit’ (Danube floodplain). Twelve experts assessed seven measures: floodplain restoration, habitat improvement, invasive species control, policy changes, environmental education and awareness campaigns, streamlined decision-making and nature-based solutions. Results indicate that environmental education and awareness campaigns and streamlined decision-making are the most influential, while policy changes and nature-based solutions are key drivers of change, suggesting that these four should be prioritized in drought risk management strategies. This study advocates for the DEMATEL-based approach as a structured methodology for evaluating wetland risk management frameworks, emphasizing causality and stakeholder input.

1. Introduction

Wetlands are defined as areas saturated by surface or groundwater, supporting vegetation adapted to saturated soils [1], or as natural/artificial water (bodies—including swamps, ponds, and estuaries) with depths not exceeding six meters at low tide [2]. These ecosystems deliver critical local and global benefits, such as freshwater supply, biodiversity habitats, and food production. However, widespread degradation has severely diminished their ecological productivity, with global losses exceeding 85% [3] and European declines reaching 60–90% [4]. Wetlands face mounting pressures from climate change, land-use shifts, and human activities, particularly due to altered hydrology and drought intensification [5,6]. Inland wetlands are disappearing faster than coastal ones [7], exacerbated by urbanization, pollution, and habitat fragmentation [8]. These challenges threaten wetland biodiversity, water availability, and resilience, even as their societal value (from flood regulation to carbon sequestration) remains underrecognized [9]. Protecting these ecosystems demands urgent, targeted measures to mitigate anthropogenic and climatic impacts, while balancing conservation with sustainable use.
Effective wetland protection, restoration, and management require carefully selected man-made measures, chosen based on their potential benefits—such as carbon sequestration, flood mitigation, water quality improvement, and climate adaptation. The International Commission for the Protection of the Danube River [10] provides a structured Climate Change Adaptation Measures Toolbox, categorizing measures by type, timeframe, and regulatory alignment (EU Flood/Water Framework Directives). Additionally, the Danube floodplain project [11] identified win–win measures balancing flood risk reduction and ecological enhancement, while Hornung et al. [12] analyzed 17 floodplain management measures and their impacts on 23 ecosystem services. Further refinements were made in the IDES project, adapting selected measures for Danube floodplains with a focus on water quality improvement [13].
Given escalating climate threats, robust decision-support tools are essential to evaluate the causal relationships and integrated impacts of regulatory, restorative, and managerial measures. Emerging methodologies like Fuzzy Cognitive Mapping (FCM), DEMATEL (Decision-Making Trial and Evaluation Laboratory), and Bayesian networks enable holistic assessments, addressing interdependencies often overlooked in traditional analyses [14,15]. These approaches help navigate uncertainties in environmental management by uncovering hidden patterns and enhancing decision-making transparency [16,17]. Applying such techniques ensures that wetland strategies align with political, socioeconomic, and ecological realities, fostering sustainable and adaptive solutions.
Studies by Castro [18] and Schön et al. [19] emphasize that to effectively analyze wetland functionality, it is crucial to understand the causes behind changes and identify their effects. Wetlands are complex systems with interconnected factors, and gaining insights into their functioning is essential for establishing protection and improvement standards. Among various methods to analyze causal relationships, the DEMATEL [20] is widely used due to its ability to identify causal links, highlight critical factors, and visualize system interconnections. This helps decision-makers better understand the complexities of the system [21]. DEMATEL has been combined with multi-criteria decision-making (MCDM) methods, such as hierarchical decomposition [22], the AHP [23,24], and Bayesian networks [25], enhancing its applicability in participatory decision-making processes. Despite its broad use, studies applying DEMATEL to analyze causality in wetlands, particularly the interdependence of management measures, remain limited (11% of applications in environmental sciences, per [26]).
The following details from the referenced sources are important to mention in order to provide a clearer understanding of the context we had in mind when applying the DEMATEL group version to assess drought mitigation measures in the SRP KPR.
In Aksakal et al. [21], the authors explored the healthcare system from the perspective of intern doctors, aiming to better understand their feelings and needs. To analyze these perspectives, a hybrid model combining the AHP (Analytic Hierarchy Process) and DEMATEL (Decision-Making Trial and Evaluation Laboratory) methods was applied. These methods are aimed at helping to identify key factors impacting the healthcare system through interns’ experiences and options for providing insights into areas for improvement. By focusing on interns, the study highlights the importance of addressing their concerns and needs to enhance both service quality and patient care in the long term.
Du and Lee [22] argue that while the DEMATEL method is widely used to identify critical factors in simple systems, it struggles to address decision problems in complex systems. This study introduces a hierarchical DEMATEL method to handle complex systems with numerous factors, multiple influences, and hierarchical structures. The approach involves horizontal decomposition to manage various influences and vertical decomposition to address hierarchy and multiple factors. A direct-influence analysis is proposed to build initial direct-relation matrices for subsystems, which are then integrated into a super direct-relation matrix across subsystems. The hierarchical DEMATEL method, incorporating three algorithms, identifies critical factors by using this supermatrix in the decision process. Illustrative examples demonstrate the method’s effectiveness and advantages. In conclusion, the authors argue that ignoring the numerous system factors can reduce the efficiency of the decision-making process, while overlooking multiple types of influences may lead to inconsistent results. Failing to consider the hierarchical structure can render decision-making ineffective. The proposed hierarchical DEMATEL method offers a feasible, comprehensive, and rational approach to address these management challenges.
Gandhi et al. [23] assessed the success factors (SFs) for implementing Green Supply Chain Management (GSCM) in the Indian manufacturing industry. They identified 24 factors through the literature and expert input, then developed a model combining the AHP and DEMATEL methods to evaluate these factors across the tactical, operational, and strategic levels of GSCM adoption. The AHP method helps determine the relative importance of each factor, while DEMATEL analyzes their interrelationships using causal mapping. The authors suggest that this combined approach provides managers with valuable insights for formulating both short- and long-term strategies for managing green supply chains. An example application demonstrates the evaluation of twenty-four factors under five clusters: government, global competition, social, organizational, and external factors. Experts from Indian industries rated the factors, and the resulting data was analyzed through the DEMATEL process. In conclusion, the study’s findings can help managers prioritize GSCM strategies and better understand the interdependencies among factors, ultimately guiding efficient GSCM implementation in India.
Srdjevic and Lakicevic [24] combined the DEMATEL and AHP models to evaluate criteria for sustainable forestry goals. The authors, working as a two-member group, compared individual solutions with aggregated results from both methods. DEMATEL facilitated an understanding of causal relationships between criteria, while the AHP was used to derive criteria weights, assuming their mutual importance in decision-making. The study critically analyzed the combined use of both methods in assessing long-term forestry goals. Seven criteria were considered: biodiversity conservation, forest productivity, ecosystem health, soil and water conservation, global carbon cycles, socioeconomic benefits, and legal/institutional frameworks. The research highlights the strengths and limitations of each method in addressing causality and the importance of criteria for sustainable forestry.
Yazdi et al. [25] discussed the use of DEMATEL for effective safety management decision-making, emphasizing that decision-making is critical in safety and risk analysis. They highlight that decisions are often based on various sources of information, typically elicited from field and subject matter experts. The authors note that many team-based decision-making methods are designed to identify hazards, determine interventions, and prioritize risk-reduction efforts. However, most of these methods are based on idealistic assumptions, such as treating risk factors as independent in a complex system. Because in reality, risk factors are interrelated, and there are interactions between the information sources used in decision-making; to address this, the authors propose integrating DEMATEL with the Best–Worst Method (BWM) and Bayesian networks (BNs). This integration is applied in two stages of the DEMATEL methodology, and a case study in safety management within the high-tech industry is used to illustrate its effectiveness.
The objective of the study published by Si et al. [26] was to systematically review the methodologies and applications of the DEMATEL technique. A total of 346 papers, published between 2006 and 2016 in international journals, were analyzed. A bibliometric analysis was conducted to offer various insights into the different subjects related to DEMATEL. Based on the methodologies used, the publications were categorized into five groups: classical DEMATEL, fuzzy DEMATEL, grey DEMATEL, analytical network process (ANP)–DEMATEL, and other DEMATEL variants. Each category is summarized and analyzed, highlighting implementation procedures, real-world applications, and key findings. The authors conclude that a significant number of studies have been conducted on the application of DEMATEL, and a variety of different variants have been introduced in the literature.
The specific application of DEMATEL to droughts in wetlands is relatively limited but emerging. As noted by the above-referenced sources, some studies have employed DEMATEL to understand the factors and their interactions that affect drought conditions or ecosystem management, but dedicated research focusing solely on droughts within wetlands using DEMATEL is, to our best knowledge, sparse.
This paper explores the application of DEMATEL in analyzing measures to reduce drought risk in wetlands. The approach, which considers both direct and indirect connections between measures, offers a framework for selecting indicators, strategies, and regulatory actions. This study involves 12 experts from diverse sectors, using statistical indicators to assess compliance with group decisions [27]. The DEMATEL model is applied to the Special Nature Reserve ‘Koviljsko–Pertovaradinski Rit’ in the Danube River floodplain in Vojvodina, Serbia, to assess the causality and importance of various management measures for wetland adaptation.

2. Research Methods

2.1. DEMATEL

DEMATEL is a mathematically straightforward method, typically carried out in five steps. These steps are briefly outlined below, following the approach described in [28]. The method is generally applied in a group context involving K participants. When K = 1, the method is used individually, and therefore, the averaging process included in the first step is not applicable.
Step 1: A set of factors, F1, F2, …, Fn, must be established. These factors represent the components of a complex system that may be more or less interconnected or not connected at all. The decision problem can be viewed as a system, with its criteria or alternatives being the factors. In the context of this study, the system refers to the problem of determining causality and importance relationships among alternative regulatory measures in a given wetland, while the factors are the specific measures themselves.
Once the factors are identified, a causality scale should be selected for pairwise comparisons of the factors. The most commonly used scale is as follows: 0—no influence, 1—small influence, 2—medium influence, and 3—high influence. In certain cases, as in this paper, an additional grade (4) may be included to denote extremely significant influence (see Table 1).
Factors and their direct relationships are typically represented using a directed graph, with the associated scale values indicated on the edges.
Step 2: Each group member k (k = 1,…, K) forms the direct-relation matrix Dk = [dij]k, as shown in Table 2. This table contains judgments of the kth member about influential relations between factors F1, F2, …, Fn using the scale from Table 1. Note that the direct-relation matrix is constructed based on participants’ judgments, which depend on their attitudes and sensitivity.
Using individual matrices Dk, the averaged (group) direct-influence matrix D g = d i j g is calculated using Equation (1).
D g = d i j g = [ 1 K k = 1 K d i j k ]
The notation in creating the D g n × n non-negative direct-influence matrix for the group is as follows:
K—number of group members;
n—number of factors;
dijk—degree of influence of factor Fi on factor Fj (i corresponds to the matrix row and j to the column of the matrix) for the kth member of the group;
dijg—degree of influence of factor Fi on factor Fj for the group.
Neither the individual nor the group direct-relation matrices are symmetric. The direct-relation matrix in DEMATEL is asymmetric because it represents the one-way influence (causal relationship) between factors in a system, meaning that the relationship between two factors is not necessarily reciprocal. It is important to note that there are zeros along the main diagonal of both the individual and group matrices.
Remark 1: 
Instead of the additive aggregation defined by Equation (1), the aggregation of individual direct-influence matrices can be performed using the geometric aggregation of individual judgments [29]. The issue with this aggregation, represented by Equation (2), is that if at least one judgment is zero, the geometric average will also be zero, regardless of the other judgments. In principle, this is not problematic, as zero is considered a valid grade, just like any other numerical value in Table 1.
D g = d i j g = k = 1 K d i j k 1 K .
Step 3: The normalization of the group direct-relation matrix ( D g ) consists of mapping the values dijg to the interval [0, 1], that is, to obtain normalized matrix D n :
D n = D g / S ,   S = m a x ( j = 1 n 1 < i < n m a x d i j g ,   i = 1 n 1 < j < n m a x d i j g ) .
Step 4: The total-influence matrix Tg is calculated as
Tg = Dn·(IDn)−1
where ‘I’ represents the identity matrix.
The sums of elements by rows and columns in the matrix Tg are calculated, and vectors Rg and Cg are formed, respectively. The corresponding notation is as follows:
Rg—a vector with sums in rows of matrix Tg
R g = [ r i g ] n x 1 ,   r i g = j = 1 n t i j g
Cg—a vector with sums in columns in matrix Tg
C g = [ c j g ] 1 x n ,   c j g = i = 1 n t i j g
A threshold value is most often determined as the mean value of vectors Rg and Cg, that is, the mean value of all elements in the matrix Tg. On the graph in the next step, the threshold value represents the central vertical line that separates quadrants I and IV from II and III.
The values in the vectors Rg + Cg = [rig + cjg]T and RgCg = [rigcjg]T indicate the significance and net effect of the Fi factor as follows: (rig + cjg) represents the significance of the Fi factor, and (rigcjg) represents the net effect of the same factor.
To better explain the terms ‘significance’ and ‘net effect’, the following example may clarify their meaning: Suppose that the water conservation practices (Factor A) are evaluated for their significance on wetland biodiversity (Factor B). If the matrix value from Factor A to Factor B is high (e.g., 0.9), this indicates a high significance, meaning water conservation significantly influences wetland biodiversity. In contrast, if Factor B to Factor A is low or zero (e.g., 0), this indicates that wetland biodiversity does not have a significant impact on water conservation practices.
The net effect helps identify the driving factors and dependent factors within the system. It represents the overall influence of a given factor, accounting for both how much it influences other factors (so-called outward influence) and how much it is influenced by other factors (inward influence). Referring to the previous example, the net effect for water conservation practices (Factor A) can be calculated as follows: If Factor A has strong outgoing influences on drought management (Factor B) and public awareness (Factor C), but little influence from these factors, then Factor A would have a positive net effect, suggesting that water conservation is a driving force in the system. Conversely, if wetland biodiversity (Factor B) is heavily influenced by water conservation but does not significantly affect other factors, it would have a negative net effect, indicating that it is more of a dependent factor in the system.
Step 5: In this step (commonly considered the final step of classical DEMATEL), a graph with coordinate axes (rig + cjg, rigcjg) is drawn to identify important and less important factors in the system.
Constructing the causal graph in this step illustrates how factors Fi influence other factors Fj. The threshold value, which is the average of all entries in the total relation matrix Tg, helps distinguish important from unimportant effects in the system [30]. Following the discussions and explanations in numerous DEMATEL studies summarized in [26], the causal graph presented in Figure 1 is divided into four quadrants. The positioning of system factors reflects their status within the analyzed system. The dashed line labeled ‘Mean’ corresponds to the threshold value or another value chosen by the group members.
Factors in quadrant I are core factors or “givers,” as they exhibit high prominence and strong interrelations. Factors in quadrant II are also givers but with low prominence despite their high interrelation. Factors in quadrant III have both low prominence and low relation, and since they are relatively disconnected from the system, they are classified as independent factors or autonomous receivers. Factors in quadrant IV exhibit high prominence but low relation and are considered impact factors or intertwined receivers. These factors are influenced by others but cannot be directly connected [24,26].
The terms ‘prominence’ and ‘interrelation’ deserve more detailed explanations. Prominence refers to how important a factor is in a system, based on both its outward and inward influences. It combines both the total outgoing influence and the total incoming influence. A factor with high prominence has a strong role in the system, either because it affects many factors (high outgoing influence) or because it is influenced by many factors (high incoming influence) or both.
On the other hand, ‘interrelation’ refers to the degree of mutual interaction or interdependence between factors in a system. It is based on the overlap or relationship between factors that both influence and are influenced by each other. High interrelation indicates that two factors have a strong mutual influence, meaning they both contribute to and are impacted by each other in a significant way. Low interrelation suggests that the factors operate independently or with minimal reciprocal influence.
Step 6: This step does not belong to the classical DEMATEL method. After the completion of DEMATEL (steps 1–5), its vectors Rg + Cg = [rig + cjg]T and RgCg = [rigcjg]T derived from the total relation matrix Tg can be used to compute the weights of influential factors for later use within the MCDM framework.
There are several reported proposals on how to compute these weights. Equation (7), proposed by [31], is used in this study. It represents the length of the vector in a graph (R + C, RC), starting from the origin to each factor (Figure 2).
w i = r i + c i 2 + r i c i 2 , w i = w i i = 1 n w i i = 1 , , n

2.2. Conformity

Once the DEMATEL process is completed for each member of the group, individual and group weight vectors can be derived by applying Equation (7). To facilitate cross-comparison between the priority vectors of the participants and the group vector (which serves as the reference), the conformity index (Conf) can be employed.
The definition of Conf, also known as the Manhattan distance, quantifies the conformity of a given individual vector with the group vector by measuring the deviation between these two vectors. This can be expressed mathematically by Equation (8).
Conf k = i = 1 n w i k w i g ,   k = 1 ,   ,   K
Conformity indicator (8) can be computed where k is the index of the individual and K is the number of all the individuals used in deriving the corresponding priority vectors. The superscript g represents the priority vector obtained by DEMATEL after all individual direct-relation matrices are aggregated in Step 2.
This step is not part of the classical DEMATEL method. After completing the DEMATEL process (steps 1–5), the vectors are analyzed to assess the conformity of individual judgments with the group’s collective judgment. This analysis allows for evaluating the consistency of the participants’ perspectives and identifying any deviations from the group consensus.
Clearly, the lower the value of Conf, the higher the similarity between the final result obtained by a particular individual and the reference vector. A larger Conf value for an individual may indicate that the individual is an outlier in comparison to the other participants. By identifying outliers, it becomes possible to form clusters of individuals who exhibit similar behaviors [32] or, in some cases, to exclude outliers from the analysis. It is important to note that Conf can only be applied after all individual and group DEMATEL computations have been completed.

2.3. Spearman’s Rank Correlation Coefficient

Spearman’s rank correlation coefficient (S) is a statistical measure of the conformity of ranks assigned by individuals compared to the ranks of an “average” individual. It is used to assess the alignment of an individual’s ordinal rankings with those of the group average. Since ranking is a relative measure rather than an absolute one, two items may have significantly different rank preferences but still be relatively close in terms of absolute preference. This helps eliminate potential misguidance, especially in larger groups.
Spearman’s rank correlation coefficient is calculated as
S = 1 6 i = 1 n D i 2 n ( n 2 1 )
In the above formula, Di represents the rank difference between the rank of an element from the vector wk, derived for a given individual, and the rank of the corresponding element in the reference vector wg, both computed using Formula (7) once the DEMATEL computations are completed for both the individuals and the group. The number of ranked elements is n, which corresponds to the number of system factors addressed by DEMATEL. The Spearman’s rank correlation coefficient S measures the positive or negative correlation between the individual vector wk and the reference vector wg, and it can take a value in the range of [−1, 1]. A value of −1 indicates ideal negative correlation, where the elements in wk and wg have opposite ranks; a value of + 1 indicates perfect positive correlation, where the elements are fully aligned; and if S = 0, it means that the ranks do not correlate.

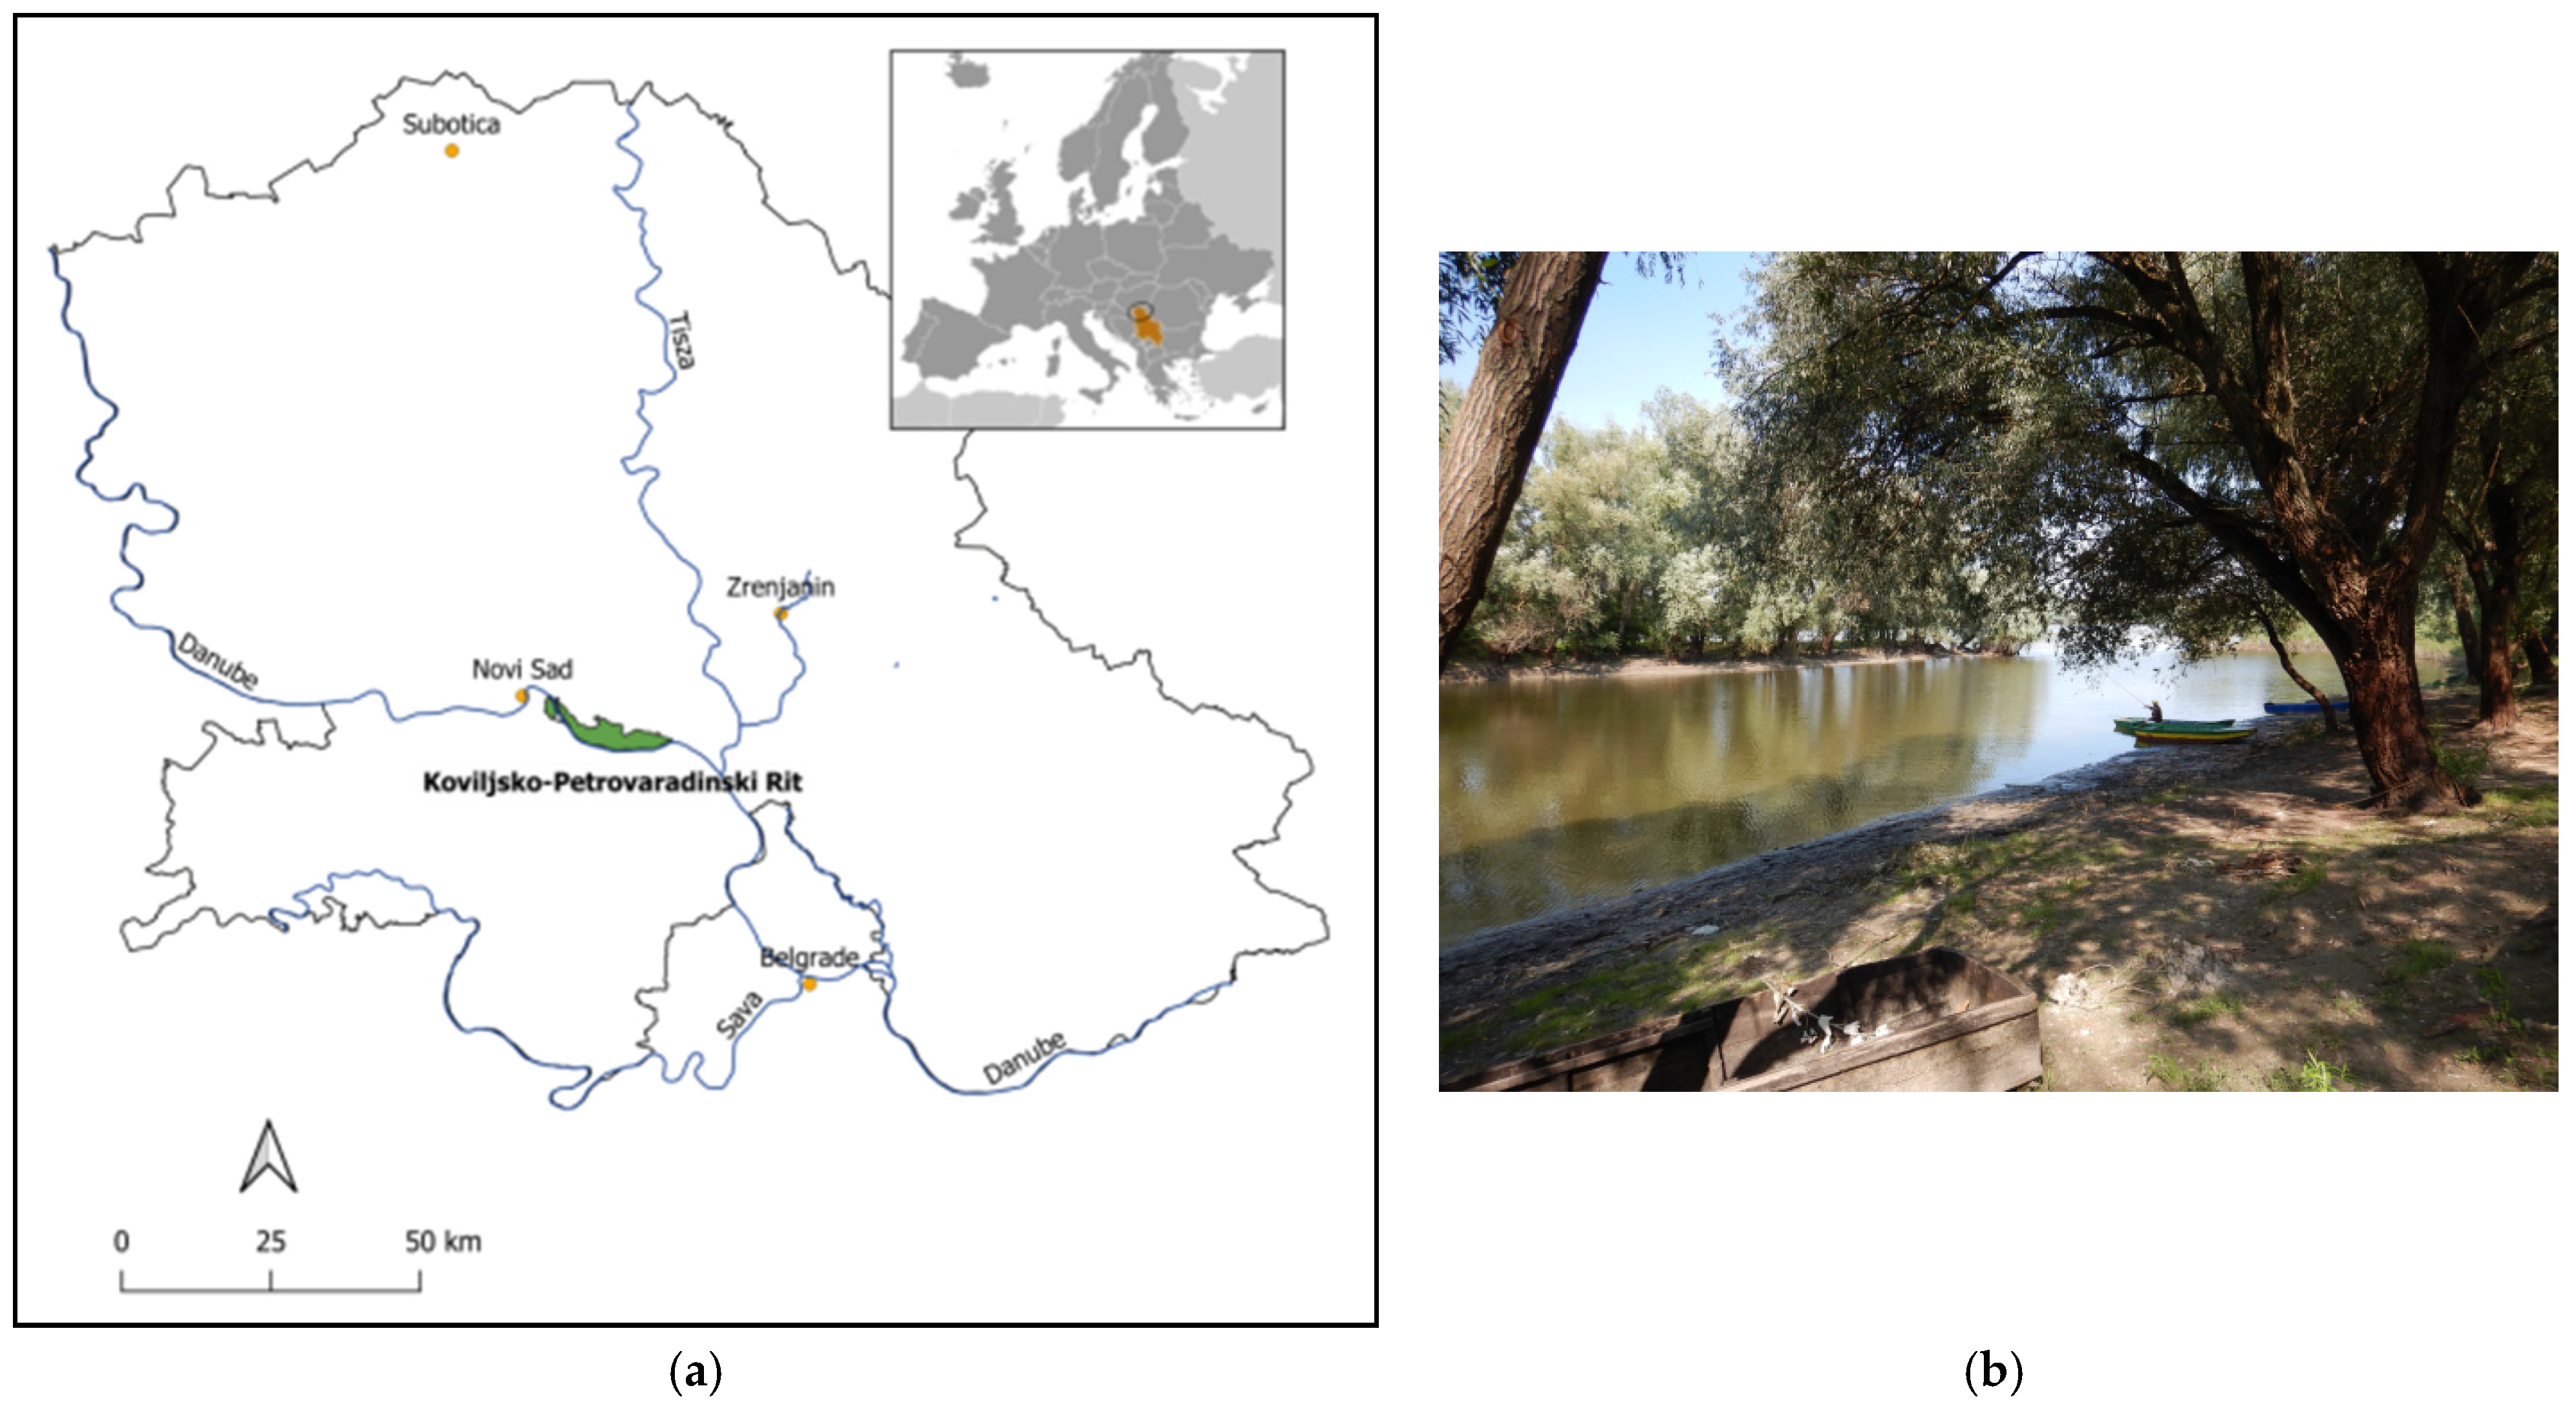
3. Study Area and Problem Description

3.1. The Problem to Be Solved by DEMATEL Methodology

The Special Nature Reserve ‘Koviljsko–Petrovaradinski Rit’ (Figure 3) is a preserved mosaic of wetlands, meadows, and forest habitats, spanning 5895 hectares. Located on the floodplains along both the left and right banks of the Danube River in Serbia, the reserve is renowned for its high natural value. It hosts 443 species of higher plants, 206 bird species, 26 fish species, 26 mammal species, 7 reptile species, and 11 amphibian species. The reserve’s diverse and rich habitats include 39 that are classified as special priority for conservation. In 2004, it was designated as one of the Important Water-Related Protected Areas for Species and Habitat Protection by the ICPDR, and it has been a Ramsar site since 2012.
The area is located within the boundaries of four municipalities, which together have a population of approximately 447,000 inhabitants. Nine settlements are situated along the borders of the Special Nature Reserve, Koviljsko–Petrovaradinski Rit (SNR KPR), meaning that around 56,000 people are directly or indirectly connected to the reserve.
Since 2000, the frequency and intensity of droughts in the region surrounding SNR KPR have increased [33]. Concerns about drought risk are widespread among many stakeholders of SNR KPR, as evidenced by a questionnaire conducted as part of the transnational IDES project. The results revealed that drought is among the top five pressures impacting the sustainability, multifunctionality, and ability of the wetland to provide various ecosystem services [13].
Figure 3. Special Nature Reserve ‘Koviljsko–Petrovaradinski Rit’: (a) position in Europe and Serbia; (b) typical scenery within the reserve (Srdjevic et al. [34]).
Water 17 01777 g003
In this study, the DEMATEL methodology is applied to investigate the causal relationships between measures aimed at reducing drought risk in SNR KPR. The analysis seeks to identify which measures act as drivers of change and to assess the relative importance of different measures. Additionally, the preferences and judgments of various experts evaluating these measures are compared to the group’s aggregated decision. This approach aims to produce more reliable recommendations that may be more readily adopted into policy, with reduced uncertainty.

3.2. Description of Selected Measures and Participating Experts

In this study, seven measures were selected and denoted as M1–M7. These measures are assessed and evaluated using the DEMATEL methodology by a group of 12 experts representing key sectors with a strategic interest in the proper management, protection, and development of the SNR KPR. A preparatory workshop, organized as part of the transnational IDES project, involved numerous stakeholders from various sectors related to the study area. Participants represented sectors such as economics, environment, water management, forestry, agriculture, fisheries, sports and tourism, culture and heritage, academia, religion, and politics.
The experts who participated in the preparatory workshop and demonstrated a strong interest in the strategic management of the SNR KPR were invited to take part in the research presented in this study. These individuals are active professionals employed in various public and private institutions relevant to the study area, and they possess in-depth knowledge of the challenges facing the SNR KPR. Their practical experience in the operational management of the KPR, along with their familiarity with relevant legislation and procedures, is well complemented by the academic expertise of scholars from the fields of agriculture, forestry, and environmental engineering.
The background, professional activity, and field of expertise of the experts are as follows:
ExpertBackground/
Academic Degree
Professional
Activity
Field of Expertise
E1M.Sc.public institutionenvironmental engineering
E2M.Sc.public institutionenvironmental engineering
E3M.Sc./PhD cand.academiawater management/environment
E4M.Sc./PhD cand.academiaagriculture/water management
E5Professoracademiaacademia/water management
E6Professoracademiaacademia/water management
E7B.Sc.public institutionenvironmental engineering
E8M.Sc.public enterprise/private co.forestry engineering
E9M.Sc.public enterprise/private co.forestry engineering
E10Dr.public enterprisewater management
E11Ph.D.public enterprisewater management
E12Professoracademiaacademia/civil engineering
The experts were individually interviewed via phone and email, and they completed the initial direct-relation matrices as the first step of the DEMATEL method.
The primary concern in selecting the most important measures was how to mitigate drought risk under climate change and enhance the overall management and protection of both natural and human-made infrastructure in the area. Based on the analysis of the workshop discussions and the recommendations provided, the following set of measures was selected for a detailed assessment of their importance and potential causal relationships:
MeasureDescription
M1Floodplain restorationRewatering and restoration of wetlands, conservation of mires, near-natural widening of the water body, reforestation, promotion of near-natural floodplain
development, reduction in sealing, rain seepage facilities, green roofs, restoration
of former inundation areas, preserving retention areas, conversion of arable land to
permanent pasture, and demolishing of flood-sensitive facilities [12].
M2Habitat improvementRemoval of bed or bank consolidation, introduction of large wood or stones, creation of gravel spawning grounds, allowing erosion of the shores, re-meandering, reactivating primary floodplains, connecting tributaries or cut-off meanders, fish protection, sediment management, creation of shallow water zones and typical bank structures, and de-sludging [12].
M3Prevention or control of the adverse impacts of invasive speciesPromotion of autochthonous plant communities, combat of ecosystem-damaging neobiota, and protection of native species [12].
M4Policy changesImprovements in the legislative system and enforcement in the area of nature protection, implementation of national and international environmental legislation efforts, conducting of regular evaluations, and improvement in strategies and adaptation measures [10].
M5Environmental education and awareness campaignRaising public awareness of water-saving behavior; awareness raising and support of strong public education and training programs will require major investments in monitoring, research, technology transfer, and education [10].
M6Streamlining the decision-making processImprovements in communication and coordination between different sectors.
M7Application of nature-based solutionsPromotion of nature-based solutions as a sustainable way of reducing drought risk.

4. DEMATEL Application

The following procedure was implemented to solve the problem:
  • The standard DEMATEL methodology, as described in Steps 1–5, is applied to each group member. Corresponding priority (weight) vectors are calculated using Formula (7).
  • Individual direct-relation matrices in principle can be aggregated into a group matrix in three ways: (a) additively; (b) using the rough numbers method; and (c) geometrically. In this study, the standard DEMATEL methodology is applied to the group direct-relation matrix in the same manner as in the previous step, and the corresponding group priority vector is derived by additive aggregation.
  • Conformity coefficients and Spearman’s rank correlation coefficients are computed for each group member to identify potential outliers.
  • All results are collected and discussed.

4.1. DEMATEL Results by Individuals

Each expert returned a completed initial direct-relation matrix of size 7 × 7 to the authors, with both the rows and columns corresponding to the regulating measures M1–M7. The entries in these matrices represented individual judgments about the influences between each pair of measures. Experts used the scale provided in Table 1. For illustration, the assessment of causal relations among measures, as provided by Expert #7, is shown in Table 3.
The individual application of DEMATEL (Steps 1–5) produced the causal relationships between the seven analyzed regulating measures in the KPR, as shown in Table 3. As expected, there are differences in the opinions of the experts, as independent participants in the group. The majority of experts (8 or 9 out of 12) think that measures M6—streamlining the decision process (9), M4—policy changes (8), and M5—education and awareness (8) belong to a cluster of causes. On the other hand, the majority of experts (again, 9 and 8 out of 12) believe that measures M3—control of invasive species (9), M1—floodplain restoration (8), and M2—habitat improvement (8) belong to cluster ‘effects’. Only measure M7—application of nature-based solutions—received half–half recognition of cause or effect status.
The results appear to be a logical outcome, considering both the sets of regulating measures and the diverse profiles of the involved experts. A more detailed analysis could be conducted regarding the values in the (Rk + Ck) and (RkCk) vectors derived from the individual total relation matrices Tk (k = 1, …, 12). K = 1, …, 12). Mapping these values for each expert revealed certain differences in opinions, even among experts with similar educational backgrounds but varying professional engagements and sectoral experiences. To maintain the anonymity of the experts and keep the discussion concise, further elaboration is avoided here. However, some of these differences can be observed in Table 4, without delving into further details. Note only that pluses and minuses in the table relate to values (Rk + Ck) and (RkCk) obtained by experts for a set of analyzed measures.

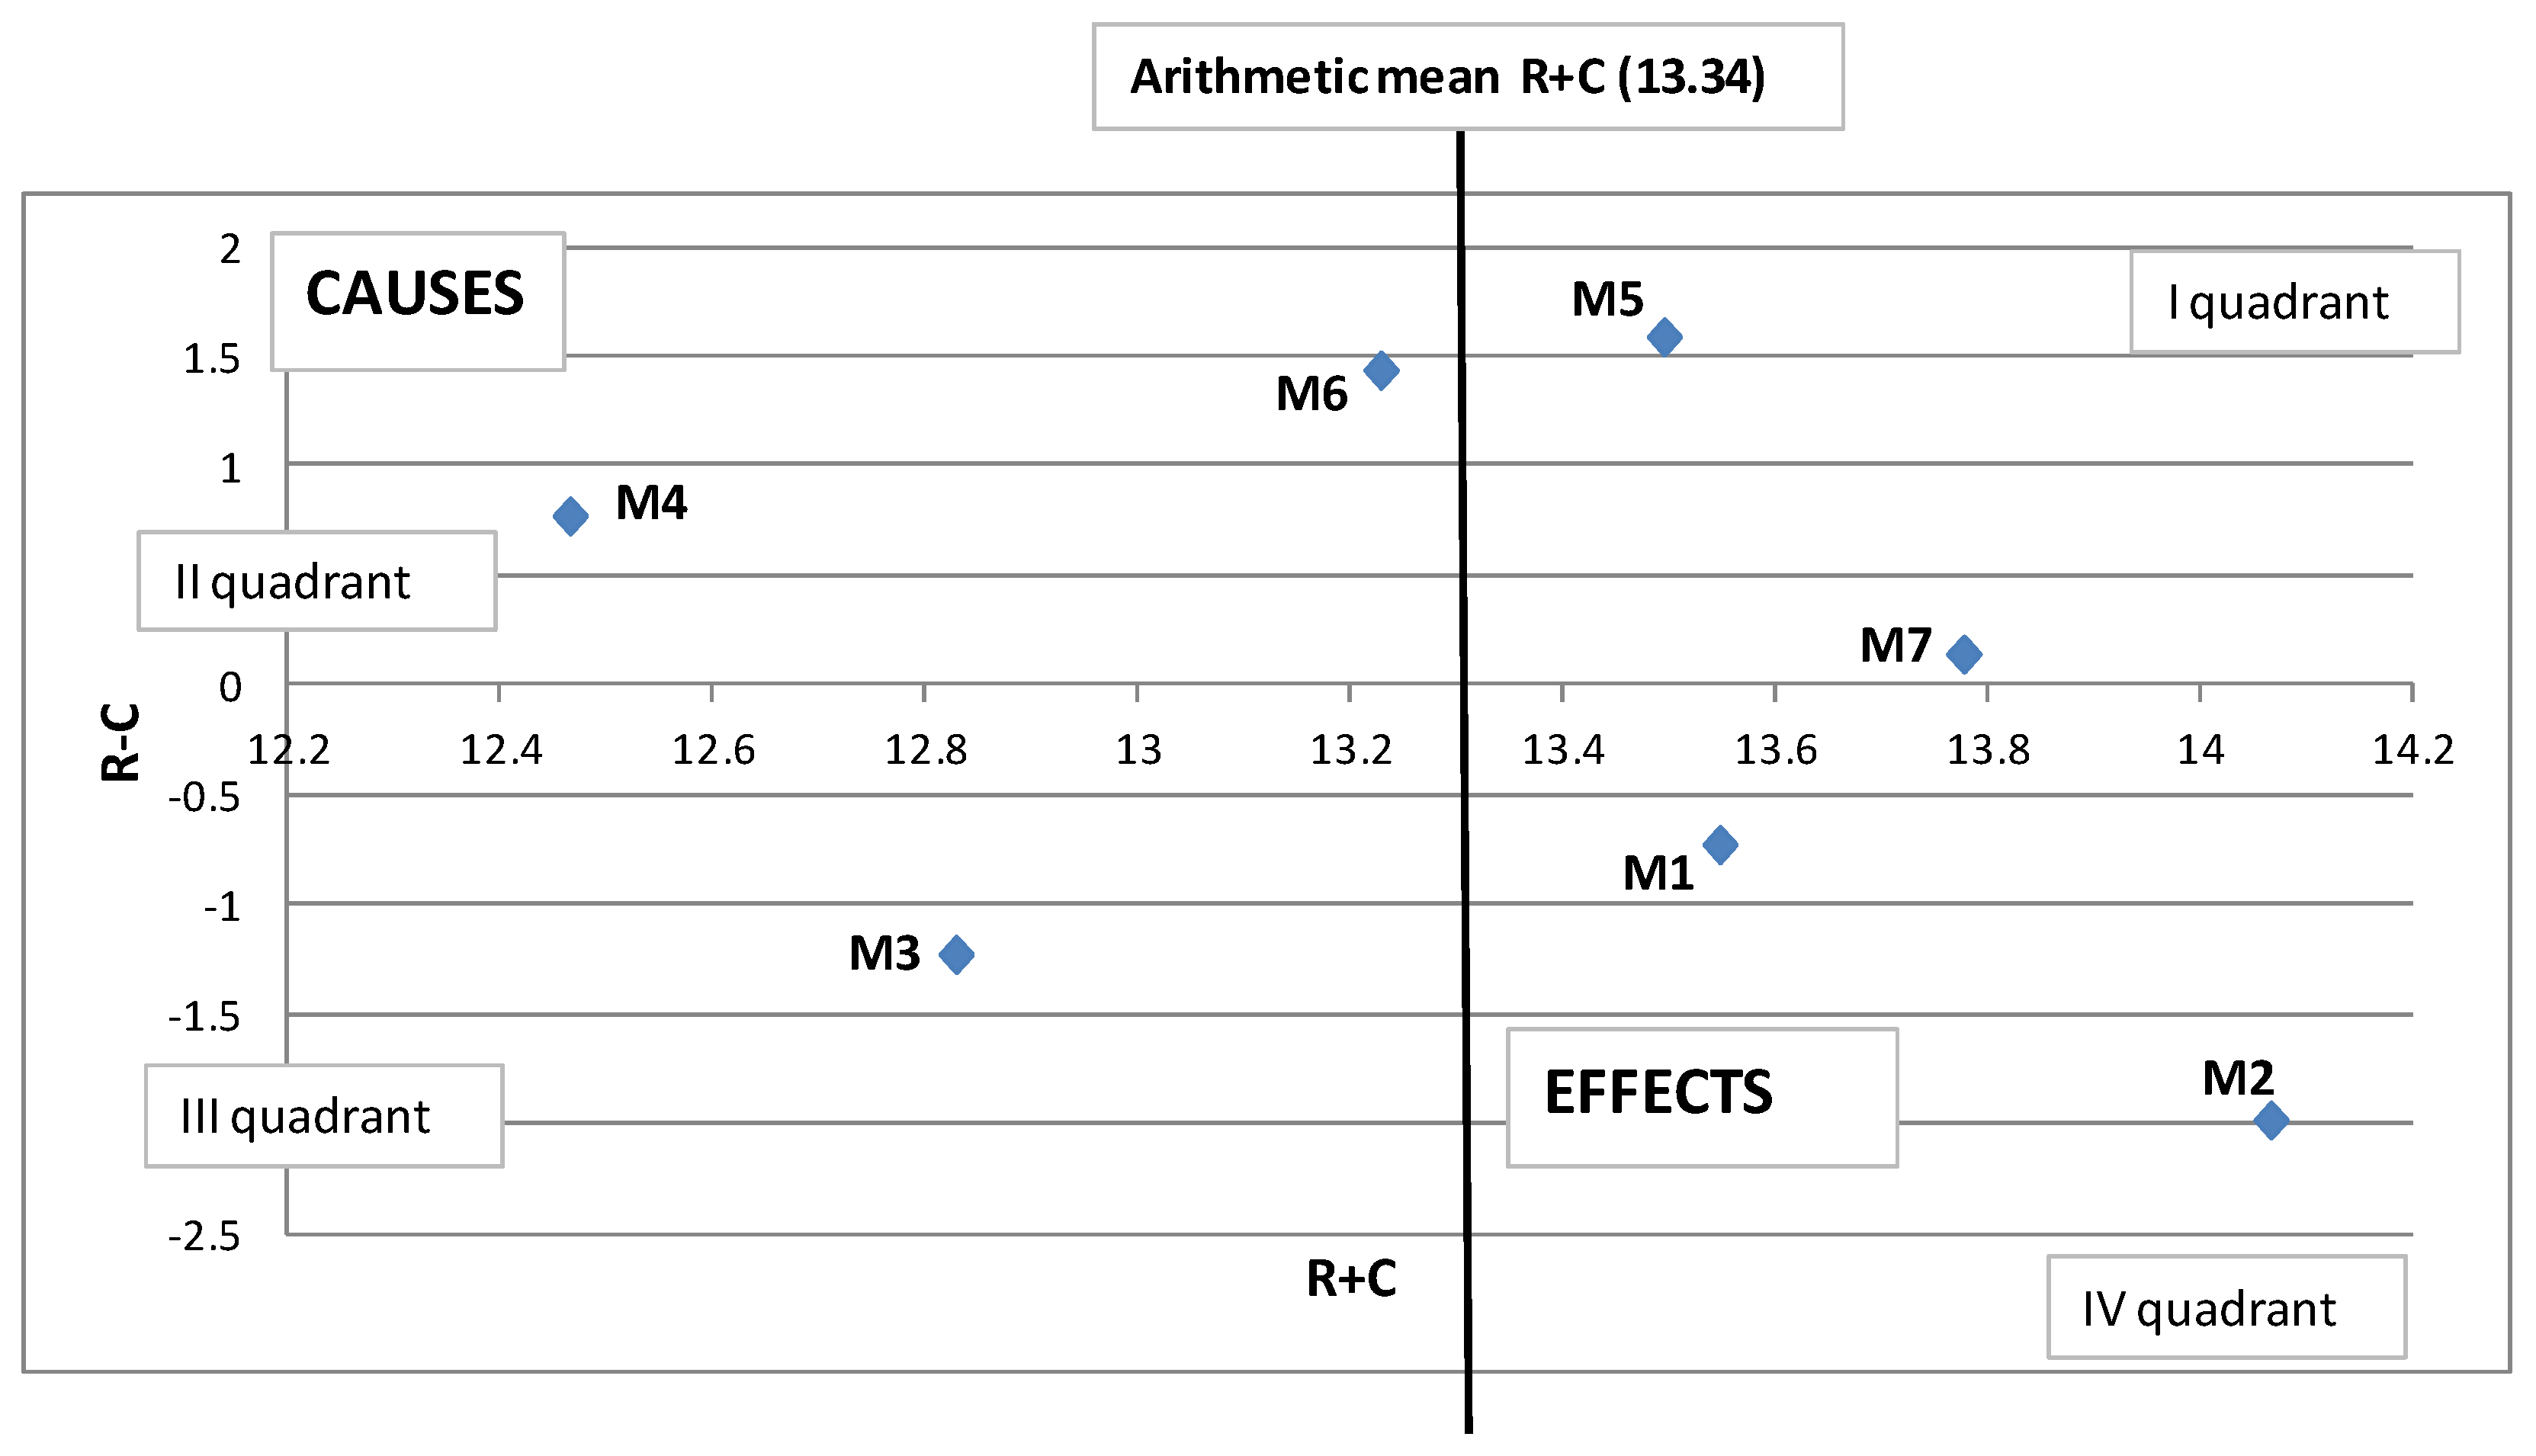
4.2. DEMATEL Results for the Group

The group context has been derived by aggregating individual assessments. By additively averaging values in direct-relation matrices for all 12 experts, the data in Table 5 were obtained and used in the remaining steps of the DEMATEL application.
The total relation matrix for the group is calculated and shown in Table 6.
Based on values in the total relation matrix (Table 6), the threshold value 0.953189 is computed as an average of all the entries in the matrix. Vectors Rg, Cg, Rg + Cg, and RgCg derived from the matrix are presented in Table 7. A positive value of RgCg determines the cause status of a given measure, while a negative value of RgCg relates to the effect status of the measure.
The highest row total (Rg) indicates that the most influential measure is M5, followed by M6, and so on. The highest column total (Cg) represents the order of elements that are most affected. Measure M2 receives the highest rate of influence from the other measures.
To conclude, the joint (group) result prioritizes measure M5—environmental education and awareness campaign—as the most important, closely followed by measure M6—streamlining the decision-making process. The group result highlights M5 and M6 as the most crucial measures, emphasizing the strategic significance of environmental education and increasing societal awareness for the effective management of the SNR KP wetland. Establishing efficient decision-making processes (M6) is also recognized as an important responsibility of relevant institutions at various levels, such as national (strategic directives and legislation), provincial (regional regulations), and municipal (operational). Measure M4—policy changes—is also identified as a causal factor, aligning with the group’s perspective. Finally, measure M7—application of nature-based solutions—is placed within the causal cluster of measures but is considered less important than the previous three. This is reflected in its position near the horizontal axis in Figure 4.
Based on the values in Table 7, the positions of all the measures are shown on the graph in Figure 4. The location of each measure on the graph along the positive R + C direction of the horizontal axis represents the total influence of the measures, both causal and effect. The position of a measure along the vertical axis is determined by the value of R-C. Recall that if R−C is positive, the measure is causal; if negative, it is an effect measure.
When focusing on the prominence and relation aspects in interpreting the DEMATEL results presented in Table 7 and Figure 4, the following conclusions can be drawn:
Measures M5 (education and awareness) and M7 (applications of nature-based solutions), located in quadrant I, correspond to core measures or intertwined givers, as they exhibit high prominence and strong relations. This suggests a distinct relationship between the measures compared to the measures in quadrant IV. Quadrant I is typically characterized by causal factors that influence the behavior and success of other measures and, in turn, are influenced by other measures. The categorization of these two measures as core measures with strong relations suggests that focusing on these areas could be key to the overall success of a broader environmental or sustainability initiative. These measures should be prioritized because they not only contribute to specific outcomes (e.g., improved ecological function, sustainable land management, or increased climate resilience) but they also drive the success of other, more specific measures. To ensure the effectiveness of environmental strategies, it would be essential to prioritize public education and awareness through campaigns, community engagement, and policy initiatives that highlight the importance of nature-based solutions. By implementing scaled nature-based solutions, their benefits could be demonstrated for both the environment and society, making them more widely accepted and replicated. By investing in education and awareness and the application of nature-based solutions, policymakers and stakeholders can establish the foundation for a more resilient and sustainable environmental system.
Measures M4 (policy changes) and M6 (streamlining decision-making processes) are positioned in quadrant II (givers), which means they have low prominence but high relation to other measures. This positioning reveals the specific characteristics of their role in the broader system dynamics. Measures in this quadrant are typically influencing factors that have an indirect yet significant impact on other measures, but they are not as central or dominant themselves. While they may not be as prominent or powerful individually, they play a crucial role in shaping or facilitating other measures. The positioning of M4 and M6 in quadrant II underscores the importance of focusing on the enabling environment. While these measures may not seem as immediately impactful as direct conservation or restoration activities, they are often critical to creating the infrastructure and support systems necessary for other measures to succeed. Regarding what this implies for decision-makers and practitioners, M4 should be viewed as the foundational element that creates the framework for all other measures. Policymakers must ensure that the right regulatory environment is in place, providing incentives, protections, and funding for measures like floodplain restoration or habitat improvement. On the other hand, M6 must be a priority in ensuring that environmental projects are not held up by unnecessary bureaucracy or delays. This might include reforms to approval processes, improving inter-agency coordination, or leveraging digital tools to speed up the decision-making process.
Measure M3 (control invasive species) is placed in quadrant III. It indicates that this measure has low prominence and low relation to other measures. This suggests that M3 operates largely in isolation from the other elements of the system. It does not significantly influence the other measures nor is it heavily influenced by them. As a result, this measure is classified as an independent measure or an autonomous receiver, meaning it stands alone in terms of its implementation and impact in the study area. In practical terms, M3 should be understood as an important but specialized measure that does not require widespread system-wide coordination. It can be best treated as a discrete management action with its own objectives and timelines.
Finally, measures M1 (flood plain restoration) and M2 (habitat improvement) are located in quadrant IV, having high prominence but low relation, and are thus categorized as impact measures or intertwined receivers. These measures are influenced by other measures and cannot be directly improved. In practice, this categorization means that for effective flood plain restoration (M1) and habitat improvement (M2) to be successful, planners, ecologists, and policymakers interested in SNR KPR need to focus on broader environmental strategies, such as improving water management practices, enhancing biodiversity through multi-faceted conservation efforts, and ensuring long-term sustainability. The influence of these measures on others might be limited, but their impact can still be significant, requiring coordinated and indirect approaches rather than immediate or direct modifications of specific actions.

4.3. Weights of Measures

Based on individual DEMATEL applications, derived total relation matrices Tk and calculated row sum and column sum vectors Rk and Ck (k = 1, 2, …, 12), the weights of the measures were computed using Formula 7 and are presented in Table 8.
For the group matrix obtained by aggregating individual direct-relation matrices, the derived total relation matrix Tg, and calculated corresponding Rg and Cg vectors, the application of Equation (1) produced a group vector of the measures’ weights (last row of Table 8). These weights do not differ significantly, ranging from 0.133 to 0.151. This smoothing effect is partly due to averaging across a relatively large number of experts and the use of a relatively short length of the relation scale.

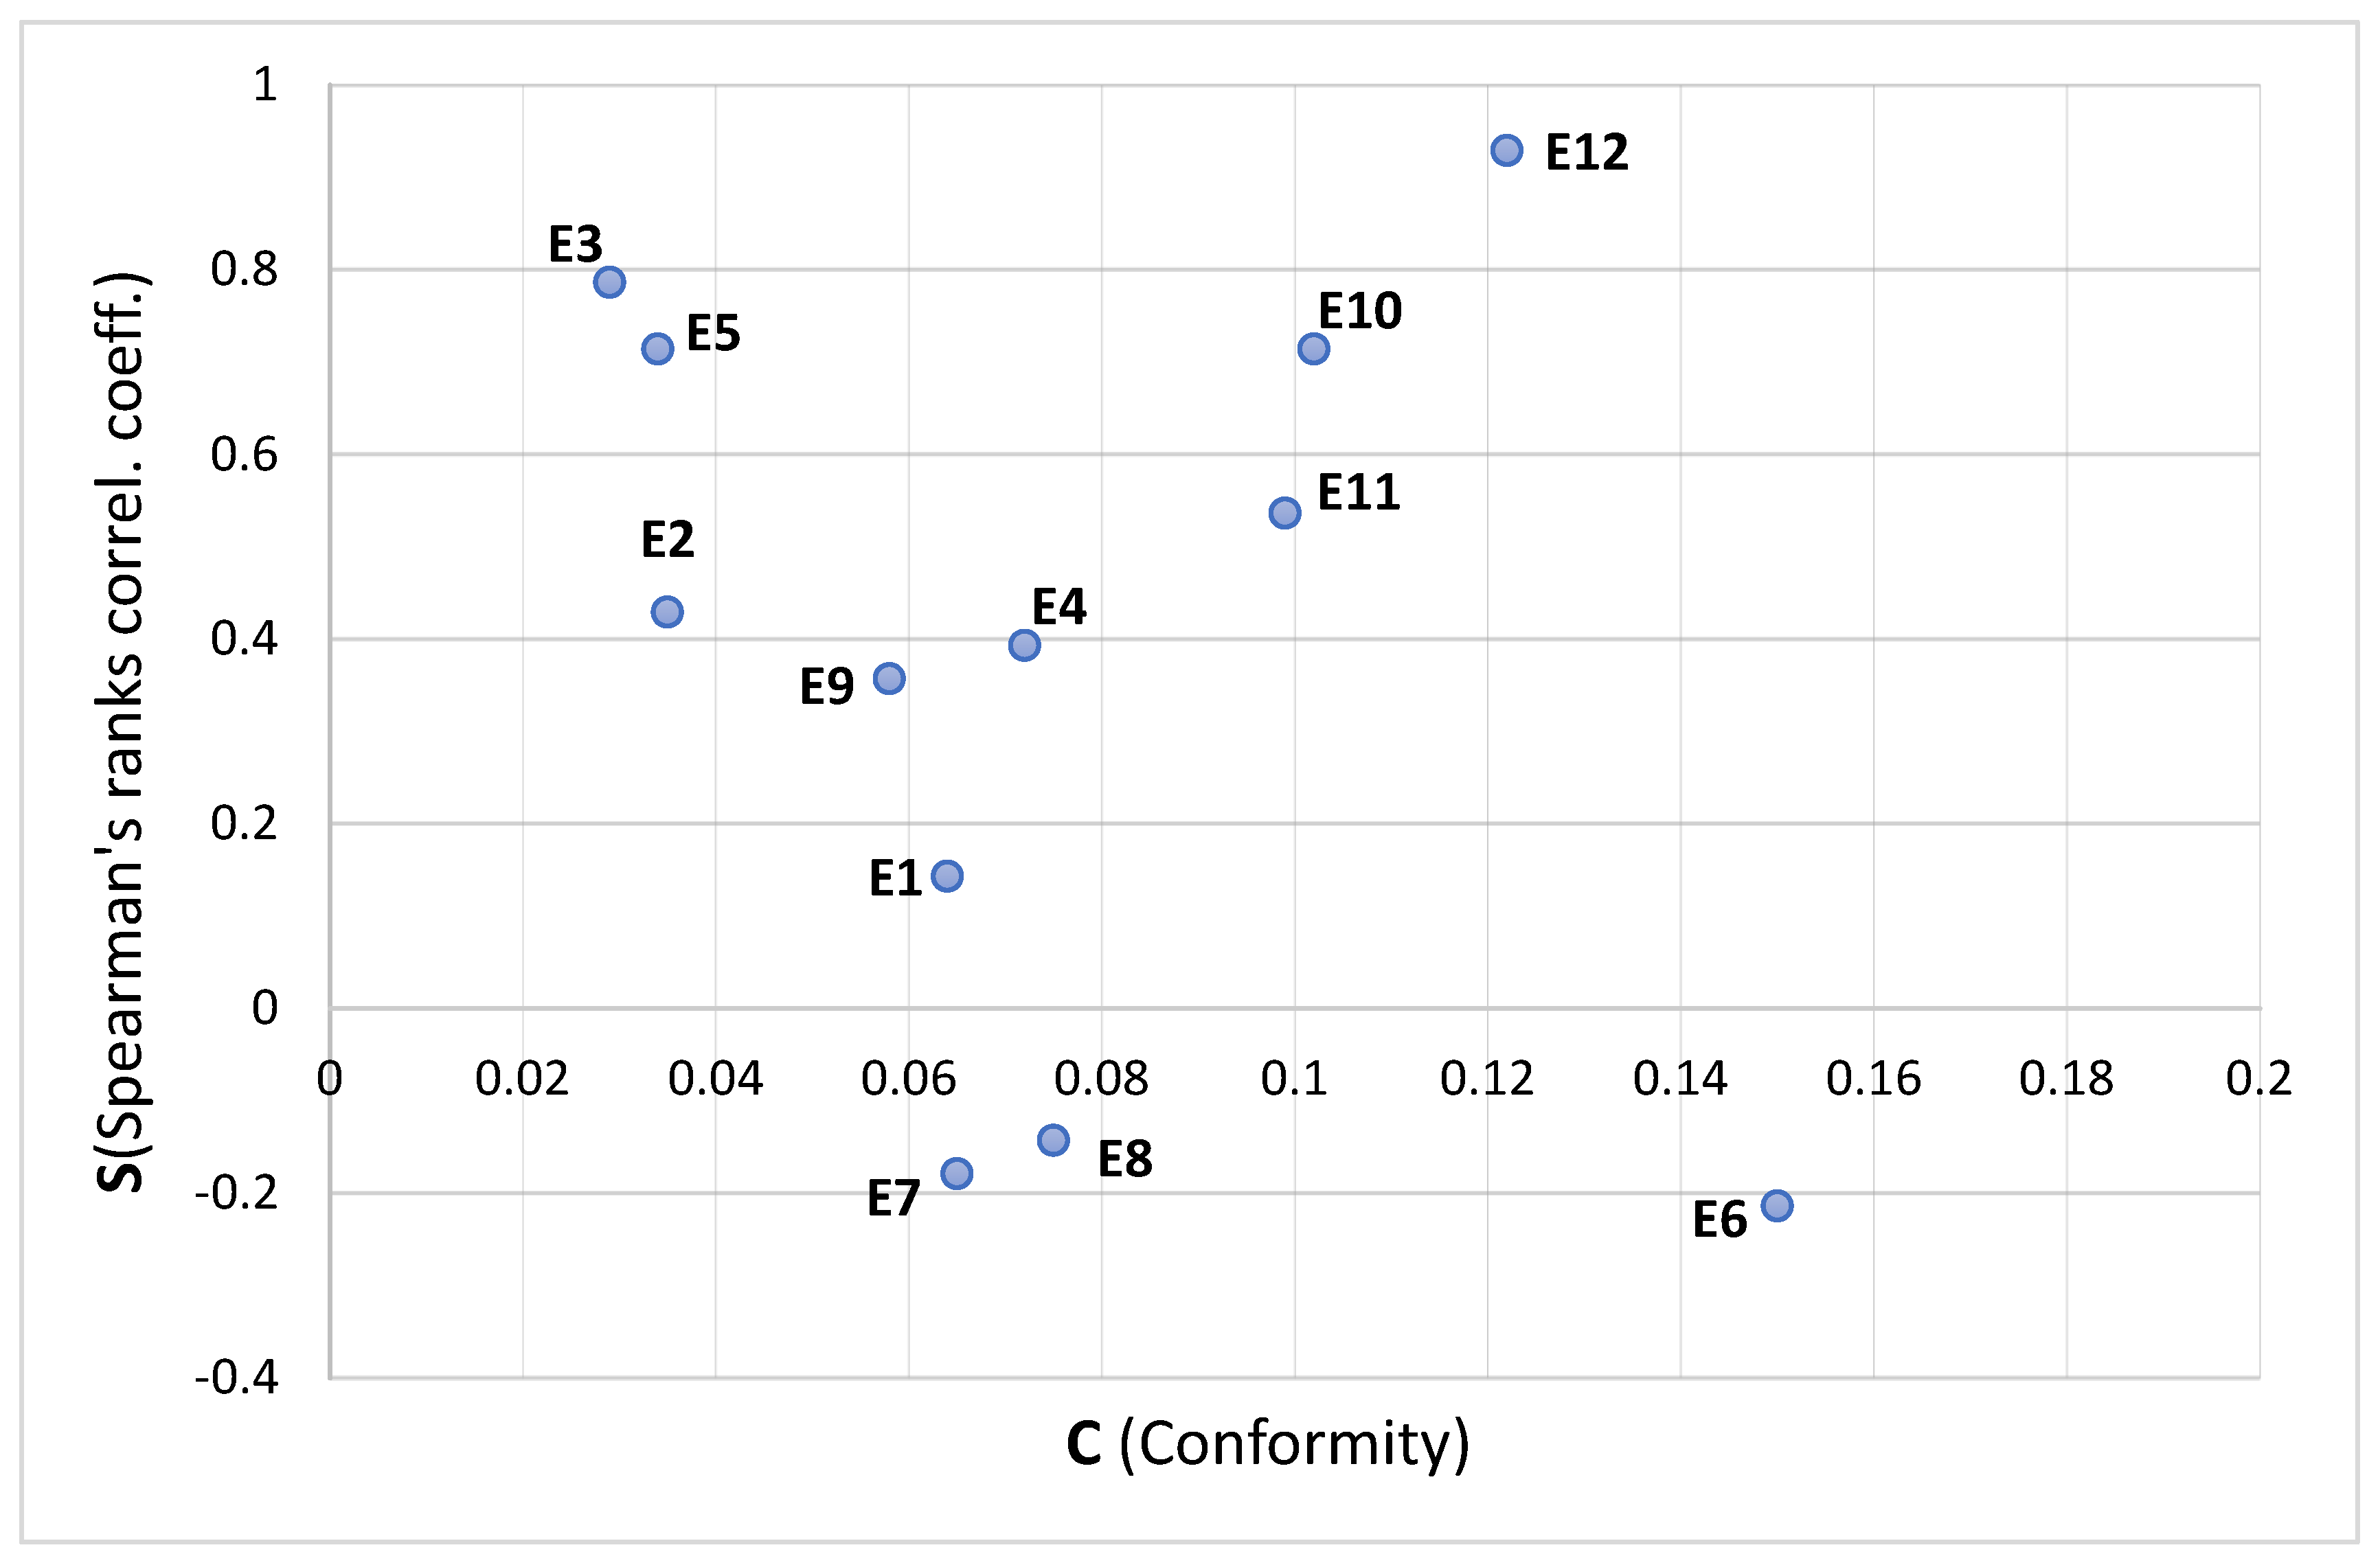
4.4. Analysis of Experts’ Correlation with Group Decision

Since the experts come from different sectors and have diverse goals and backgrounds, an additional analysis of their results was conducted to assess the correlation of each expert’s opinions with the group decision. This analysis helps determine whether the resulting recommendations are trustworthy and can be adapted to future policies or legislation. It also enables the identification of potential expert clustering, outliers, or the possibility of excluding certain experts from the group in later stages of the decision-making process.
In this regard, both cardinal (weights) and ordinal (ranks) information about the importance of measures were used to calculate the Manhattan distance Confk and Spearman’s rank correlation coefficient Sk for each expert (k = 1, …, 12). The values obtained from the application of Equations (8) and (9) are presented in Table 9 and illustrated in Figure 5.
The Manhattan distances indicate that Expert #3 is closest to the group opinion regarding the mutual importance of all measures, with a Conf3 value of 0.029. The next closest is Expert #5, with a value of 0.034, followed by Expert #2, with a value of 0.035. Expert #6 is furthest from the group opinion, with a Conf6 value of 0.150. Expert #12 is closer to the group opinion with a value of 0.122, and Expert #10 ranks third from the bottom, with a distance of 0.102.
Interestingly, when comparing ranks based on the distance of the individual rankings of the measures from the reference ranking of weights in the group vector, Expert #12 is closest to the group opinion (S12 = 0.929). The second closest is Expert #3 (S3 = 0.786), followed by Expert #5 (S5 = 0.714). According to the S values, Expert #6’s ranking most significantly differs from the group’s ranking of measures (S6 = −0.214).

5. Conclusions

Managing ecosystems, including wetlands, often requires decision-making based on variables from social, economic, and ecological sectors, which can be challenging to reconcile. To address these challenges, the fuzzy set theory has been developed and applied to solve problems in complex systems. In such situations, where the relationships between variables are uncertain, imprecise, or open to interpretation, and where subjective knowledge and opinions play a crucial role in the decision-making process, modeling the causal relationships between different decision elements can be highly valuable.
Building upon the set of man-made measures identified for the Special Nature Reserve Koviljsko–Petrovaradinski Rit in Serbia, the authors focused their research on identifying measures aimed at reducing drought risk in this wetland area. The objective was to analyze the causal relationships between these measures and ultimately recommend the most important and influential measures to be included in action plans, policies, and legislation related to the study area.
The causality of seven measures (floodplain restoration, habitat improvement, prevention or control of the adverse impacts of invasive species, policy changes, environmental education and awareness campaigns, streamlining the decision-making process, and application of nature-based solutions) was assessed and evaluated by twelve experts from fields such as environmental and civil engineering, water management, agriculture, academia, and forestry. The causality model was created using the group DEMATEL method, which has been successfully applied in this subject area.
In establishing the research approach and methodology, the inherent assumption was that all involved experts would evaluate measures concerning individually ‘integrated criteria’ relevant when evaluating drought mitigation measures in a given study area. According to the group’s opinion, the importance of validating the environmental education and awareness campaign (M5) and streamlining the decision-making process (M6) are the most prominent causes of change or the most influential measures in this particular wetland. The other two measures, although not as influential as the previous two, are policy changes (M4) and the application of nature-based solutions (M7). The measures floodplain restoration (M1) and habitat improvement (M2) are identified as effects of change, as they have high prominence but low relation, meaning they are influenced by other measures. The results suggest that measures M4, M5, M6, and M7 should be recommended for inclusion in policies, action plans, and management strategies related to reducing drought risk in the wetland.
The high importance and great influence of the environmental education and awareness campaign and streamlining the decision-making process, as recognized by the group of experts, highlight the need for better inclusion of the general public and citizens in management processes, as well as improvements in inter-sectoral communication and cooperation.
An analysis of the experts’ correlation with the group decision regarding weights and the ranks of the measures showed that all experts have acceptable conformity index values (ranging from 0.029 to 0.150). However, experts E6, E7, and E8 have Spearman coefficients outside of the acceptable range, indicating that their evaluations may be outliers. These evaluations should be carefully reviewed, and if necessary, these experts could be excluded from the group in the later stages of the decision-making process.
It is worth noting that our study has several potential limitations. First, for a more comprehensive assessment of strategies to mitigate drought impacts in this specific wetland, involving a larger number of experts could help ensure the sample’s representativeness. Second, the implications of this study should be further evaluated and discussed concerning its applicability to other wetlands facing similar challenges, especially in the context of significant climate change and socioeconomic conditions typical of developing countries. Addressing these aspects will require additional research, utilizing not only DEMATEL but also other decision-making tools to support planning and management actions in wetlands.
To summarize the results of our study, the real-world application of the proposed DEMATEL-based methodology highlights numerous challenges in wetland and environmental management, especially in transitional countries like Serbia, where the system has not fully adapted to the new climate and socioeconomic realities. In addition to what has already been mentioned, future research could focus on implementing co-learning and co-creating practices to better engage stakeholders in identifying and overcoming obstacles to effective climate change adaptation management, as well as pinpointing additional, feasible measures for the case study area.

Author Contributions

All authors (Z.S., B.S., M.I.P., S.Ž., L.G., T.B. and S.P.) contributed to the conception and design of the study, the analysis of data, and the writing of the paper. The model was designed and managed by B.S. and Z.S. All authors have read and agreed to the published version of the manuscript.

Funding

Ministry of Science, Technological Development and Innovation of Serbia, Grant No. 451-03-47/2024-01/200117.

Data Availability Statement

The data presented in this study are available on request from the corresponding author.

Acknowledgments

During the preparation of this manuscript/study, the authors used AI tool ChatGPT (version 4.1 mini) for proofreading, that is, to improve the English language of the study. This tool is used for only limited text editing, grammar checks, spelling, punctuation, and formatting, and it mostly applies to the section ‘Materials and Methods’, where no text generation has been made regarding its content, which is original and part of the authors’ research. The authors have reviewed and edited the output and take full responsibility for the content of this publication.

Conflicts of Interest

Author Sanja Pantelić is employed by the company Public Water Management Company Vode Vojvodine. The remaining authors declare that the research was conducted in the absence of any commercial or financial relationships that could be construed as a potential conflict of interest.

References

  1. EPA. Available online: https://www.epa.gov/cwa-404/how-wetlands-are-defined-and-identified-under-cwa-section-404 (accessed on 1 February 2024).
  2. Mitsch, W.J.; Gosselink, J.G. Wetlands, 2nd ed.; Wiley: New York, NY, USA, 1993; p. 920. [Google Scholar]
  3. Bongaarts, J. Summary for policymakers of the global assessment report on biodiversity and ecosystem services of the Intergovernmental Science-Policy Platform on Biodiversity and Ecosystem Services. Popul. Dev. Rev. 2019, 45, 680–681. [Google Scholar] [CrossRef]
  4. Junk, W.J.; An, S.; Finlayson, C.M.; Gopal, B.; Květ, J.; Mitchell, S.A.; Mitsch, W.J.; Robarts, R.D. Current state of knowledge regarding the world’s wetlands and their future under global climate change: A synthesis. Aquat. Sci. 2013, 75, 151–167. [Google Scholar] [CrossRef]
  5. Gxokwe, S.; Dube, T.; Mazvimavi, D.; Grenfell, M. Using cloud computing techniques to monitor long-term variations in ecohydrological dynamics of small seasonally-flooded wetlands in semi-arid South Africa. J. Hydrol. 2022, 612, 128080. [Google Scholar] [CrossRef]
  6. Ballut-Dajud, G.A.; Sandoval Herazo, L.C.; Fernández-Lambert, G.; Marín-Muñiz, J.L.; López Méndez, M.C.; Betanzo-Torres, E.A. Factors affecting wetland loss: A review. Land 2022, 11, 434. [Google Scholar] [CrossRef]
  7. Davidson, N.C. How much wetland has the world lost? Long-term and recent trends in global wetland area. Mar. Freshw. Res. 2014, 65, 934–941. [Google Scholar] [CrossRef]
  8. Li, Z.T.; Li, M.; Xia, B.C. Spatio-temporal dynamics of ecological security pattern of the Pearl River Delta urban agglomeration based on LUCC simulation. Ecol. Indic. 2020, 114, 106319. [Google Scholar] [CrossRef]
  9. Xu, X.; Chen, M.; Yang, G.; Jiang, B.; Zhang, J. Wetland ecosystem services research: A critical review. Glob. Ecol. Conserv. 2020, 22, 01027. [Google Scholar] [CrossRef]
  10. ICPDR. Available online: http://www.icpdr.org/main/climate-change-adaptation-measures-toolbox (accessed on 14 February 2024).
  11. INTEREG. Available online: https://www.interreg-danube.eu/approved-projects/danube-floodplain/outputs/ (accessed on 9 February 2024).
  12. Hornung, L.K.; Podschun, S.A.; Pusch, M. Linking ecosystem services and measures in river and floodplain management. Ecosyst. People 2019, 15, 214–231. [Google Scholar] [CrossRef]
  13. Stäps, J.; Gericke, A.; Lungu, A.; Stammel, B. (Eds.) Ecosystem Services in Floodplains and Their Potential to Improve Water Quality—A Manual for the IDES Tool, Eichstätt/Berlin/Bucharest, Germany, 2022. [CrossRef]
  14. Chen, V.Y.C.; Lin, J.C.L.; Tzeng, G.H. Assessment and improvement of wetlands environmental protection plans for achieving sustainable development. Environ. Res. 2019, 169, 280–296. [Google Scholar] [CrossRef]
  15. Fonseca, K.; Espitia, E.; Breuer, L.; Correa, A. Using fuzzy cognitive maps to promote nature-based solutions for water quality improvement in developing-country communities. J. Clean. Prod. 2022, 377, 134246. [Google Scholar] [CrossRef]
  16. Mazzuto, G.; Stylios, C.; Ciarapica, F.E.; Bevilacqua, M.; Voula, G. Improved Decision-Making through a DEMATEL and Fuzzy Cognitive Maps-Based Framework. Math. Probl. Eng. 2022, 2022, 2749435. [Google Scholar] [CrossRef]
  17. Mourhir, A. Scoping review of the potentials of fuzzy cognitive maps as a modeling approach for integrated environmental assessment and management. Environ. Model. Softw. 2021, 135, 104891. [Google Scholar] [CrossRef]
  18. Castro, C. Systems-thinking for environmental policy coherence: Stakeholder knowledge, fuzzy logic, and causal reasoning. Environ. Sci. Policy 2022, 136, 413–427. [Google Scholar] [CrossRef]
  19. Schön, F.; Domínguez, A.; Achkar, M. Urban wetlands, their dynamics and management strategies from the perspective of Environmental Geography. Geogr. J. 2022, 188, 415–428. [Google Scholar] [CrossRef]
  20. Gabus, A.; Fontela, E.; Gabus, S. World Problems, an Invitation to Further Thought Within the Framework of DEMATEL; Battelle Geneva Research Center: Geneva, Switzerland, 1972; Volume 1. [Google Scholar]
  21. Aksakal, E.; Dağdeviren, M.; Yüksel, I. A new Hybrid Approach to intern problems: Ahp and Dematel. In Proceedings of the International Symposium on the Analytic Hierarchy Process, Sorrento, Italy, 15–18 June 2011. [Google Scholar]
  22. Du, Y.W.; Li, X.X. Hierarchical DEMATEL method for complex systems. Expert Syst. Appl. 2021, 167, 113871. [Google Scholar] [CrossRef]
  23. Gandhi, S.; Mangla, S.K.; Kumar, P.; Kumar, D. A combined approach using AHP and DEMATEL for evaluating success factors in implementation of green supply chain management in Indian manufacturing industries. Int. J. Logist.-Res. Appl. 2016, 19, 537–561. [Google Scholar] [CrossRef]
  24. Srdjevic, B.; Lakicevic, M. Causality and Importance of Sustainable Forestry Goals: Strategic and Tactical Assessment by DEMATEL and AHP. Forests 2023, 14, 77. [Google Scholar] [CrossRef]
  25. Yazdi, M.; Khan, F.; Abbassi, R.; Rusli, R. Improved DEMATEL methodology for effective safety management decision-making. Saf. Sci. 2020, 127, 104705. [Google Scholar] [CrossRef]
  26. Si, S.L.; You, X.Y.; Liu, H.C.; Zhang, P. DEMATEL technique: A systematic review of the state-of-the-art literature on methodologies and applications. Math. Probl. Eng. 2018, 2018, 3696457. [Google Scholar] [CrossRef]
  27. Srđević, Z.; Srđević, B.; Suvočarev, K.; Galamboš, L. Hybrid constructed wetland selection as a group decision-making problem. Water Resour. Manag. 2020, 34, 295–310. [Google Scholar] [CrossRef]
  28. Srdjevic, B.; Srdjevic, Z. Evaluating groundwater ponds for urban drinking water supply under uncertainty. Water Supply 2022, 22, 7643–7655. [Google Scholar] [CrossRef]
  29. Forman, E.; Peniwati, K. Aggregating individual judgments and priorities with the analytic hierarchy process. Eur. J. Oper. Res. 1998, 108, 165–169. [Google Scholar] [CrossRef]
  30. Tsai, C.H.; Lee, Y.C.; Yen, T.M. Using Importance-Performance Analysis and Decision Making Trial and Evaluation Laboratory to Enhance Order-Winner Criteria–a Study of Computer Industry. Inf. Technol. J. 2008, 7, 396–408. [Google Scholar]
  31. Dalalah, D.; Al-Tahat, M.; Bataineh, K. Mutually dependent multi-criteria decision making. Fuzzy Inf. Eng. 2012, 4, 195–216. [Google Scholar] [CrossRef]
  32. Golany, B.; Kress, M. A multicriteria evaluation of methods for obtaining weights from ratio-scale matrices. Eur. J. Oper. Res. 1993, 69, 210–220. [Google Scholar] [CrossRef]
  33. Sušnik, A.; Gregorič, G.; Szalai, S.; Bokal, S.; Srđević, Z. Making drought management in the Danube region efficient and operative: Drought risk in the Danube region project (DriDanube). Vodoprivreda 2018, 50, 349–354. [Google Scholar]
  34. Srđević, Z.; Stammel, B.; Ionescu, C.; Galamboš, L.; Srđević, B.; Grabić, J.; Ždero, S.; Ilić, M.; Benka, P.; Antonić, N. Stakeholders in the Koviljsko-Petrovaradinski Rit special nature reserve near Novi Sad, Serbia: Who are they and how to involve them in the processes of identification and integration of ecosystem services important for improving the Danube water quality? (In Serbian: Stejkholderi u specijalnom rezervatu prirode Koviljsko-petrovaradinski rit kod Novog Sada: Ko su i kako ih uključiti u procese identifikacije i integracije ekosistemskih usluga važnih za poboljšanje kvaliteta vode Dunava?). Vodoprivreda 2021, 53, 241–248. [Google Scholar]
Figure 1. Four-quadrant influential relation matrix, I: key factors, II: minor key factors; III: independent factors; IV: indirect factors (Si et al. [26]).
Water 17 01777 g001
Figure 2. Weight of criterion Cj (adapted from Gandhi et al. [23]).
Water 17 01777 g002
Figure 5. Scatter diagram of Conf-S.
Water 17 01777 g005
Figure 4. The causal graph for the group.
Water 17 01777 g004
Table 1. Influential comparison scale.
DescriptionNumerical
No influence0
Small influence1
Medium influence2
Significant influence3
Extremely significant influence4
Table 2. Direct-relation matrix of system factors.
FactorsF1F2Fn
F1034
F2401
122
Fn030
Numbers, except at the main diagonal (zeros), are arbitrary and serve only for illustration.
Table 3. Direct-relation matrix filled by Expert #7.
MeasuresM1M2M3M4M5M6M7
M1 floodplain restoration0344334
M2 habitat improvement4044334
M3 control invasive species3304434
M4 policy changes4440444
M5 education and awareness3333033
M6 streamlining the d-m pr.3333404
M7 app. of nat. based sol.4444330
Table 4. Cause/effect relations between measures determined by experts.
ExpertMeasures
Cause(+)/Effect(−) Relations
M1
Floodplain Restoration
M2
Habitat
Improv.
M3
Control Inv.
Species
M4
Policy Changes
M5
Education/
Awareness
M6
Streamlining
Dm Process
M7
App. of Nat. Based Solut.
E1 enviroCause (+)Cause (+)Cause (+)Cause (+)Effect (−)Effect (−)Cause (+)
E2 enviroEffect (−)Effect (−)Effect (−)Effect (−)Cause (+)Cause (+)Cause (+)
E3 waterEffect (−)Effect (−)Effect (−)Effect (−)Cause (+)Cause (+)Cause (+)
E4 agricEffect (−)Effect (−)Effect (−)Cause (+)Cause (+)Cause (+)Effect (−)
E5 acadeEffect (−)Effect (−)Effect (−)Cause (+)Cause (+)Cause (+)Cause (+)
E6 acadeEffect (−)Effect (−)Effect (−)Cause (+)Cause (+)Cause (+)Effect (−)
E7 enviroCause (+)Cause (+)Effect (−)Cause (+)Effect (−)Cause (+)Effect (−)
E8 forestCause (+)Cause (+)Cause (+)Cause (+)Effect (−)Effect (−)Effect (−)
E9 forestEffect (−)Effect (−)Effect (−)Effect (−)Cause (+)Cause (+)Cause (+)
E10 waterCause (+)Cause (+)Cause (+)Effect (−)Effect (−)Effect (−)Cause (+)
E11 waterEffect (−)Effect (−)Effect (−)Cause (+)Cause (+)Cause (+)Effect (−)
E12 waterEffect (−)Effect (−)Effect (−)Cause (+)Cause (+)Cause (+)Effect (−)
No. of Causes (+)4438896
No. of
Effects (−)
8894436
Table 5. Direct-influence matrix for the group.
MeasuresGroup
M1M2M3M4M5M6M7
M10.003.422.422.001.921.752.67
M22.670.002.752.001.581.752.50
M32.083.080.002.331.671.671.83
M42.082.172.420.002.752.672.33
M53.173.082.582.000.003.252.75
M62.752.832.581.923.170.003.00
M73.083.422.752.332.081.920.00
Table 6. Total relation matrix for the group.
MeasuresGroup
M1M2M3M4M5M6M7
M10.871.150.980.820.820.810.96
M20.950.920.950.780.770.770.91
M30.891.040.770.760.740.740.85
M41.011.121.010.730.890.880.98
M51.181.301.140.940.851.001.12
M61.141.261.110.920.990.821.10
M71.101.231.070.890.890.880.91
Table 7. Vectors derived from the total relation matrix and the cause/effect status of the analyzed measures.
MeasuresGroup
RgCgRg + CgRgCgE/C
M16.417.1413.55−0.73effect
M26.048.0214.067−1.98effect
M35.807.0312.83−1.23effect
M46.625.8512.460.77cause
M57.545.9513.501.59cause
M67.335.9013.231.44cause
M76.966.8213.780.14cause
Table 8. Weights obtained from experts and aggregated group weights.
ExpertWeights of Measures
M1M2M3M4M5M6M7
E10.148 (4)0.155 (1)0.139 (5)0.150 (3)0.151 (2)0.133 (6)0.124 (7)
E20.136 (5)0.148 (3)0.133 (7)0.135 (6)0.153 (1)0.149 (2)0.145 (4)
E30.143 (4)0.156 (1)0.141 (6)0.124 (7)0.142 (5)0.147 (2)0.146 (3)
E40.151 (3)0.152 (1)0.143 (6)0.144 (5)0.152 (2)0.147 (4)0.111 (7)
E50.144 (3)0.161 (1)0.134 (6)0.136 (5)0.149 (2)0.134 (7)0.142 (4)
E60.111 (7)0.175 (1)0.155 (3)0.157 (2)0.136 (5)0.151 (4)0.115 (6)
E70.142 (5)0.143 (4)0.145 (3)0.154 (1)0.133 (6)0.133 (7)0.151 (2)
E80.149 (2)0.147 (3)0.157 (1)0.147 (4)0.127 (7)0.140 (5)0.134 (6)
E90.144 (4)0.141 (5)0.138 (6)0.115 (7)0.156 (1)0.154 (2)0.152 (3)
E100.132 (6)0.162 (2)0.138 (4)0.103 (7)0.152 (3)0.134 (5)0.179 (1)
E110.141 (5)0.148 (4)0.114 (6)0.114 (7)0.168 (1)0.149 (3)0.167 (2)
E120.148 (4)0.179 (1)0.086 (7)0.123 (6)0.150 (3)0.142 (5)0.172 (2)
Group0.145 (3)0.151 (1)0.137 (6)0.133 (7)0.145 (4)0.142 (5)0.147 (2)
Table 9. Conformity and Spearman’s rank correlation coefficients for 12 experts.
ExpertConformity (Manhattan
Distance) (CONF)
Spearman’s Ranks Correlation Coefficient
(S)
E10.064 (5)0.143 (9)
E20.035 (3)0.429 (6)
E30.029 (1)0.786 (2)
E40.072 (7)0.393 (7)
E50.034 (2)0.714 (3)
E60.150 (12)−0.214 (12)
E70.065 (6)−0.179 (11)
E80.075 (8)−0.143 (10)
E90.058 (4)0.357 (8)
E100.102 (10)0.714 (4)
E110.099 (9)0.536 (5)
E120.122 (11)0.929 (1)
Disclaimer/Publisher’s Note: The statements, opinions and data contained in all publications are solely those of the individual author(s) and contributor(s) and not of MDPI and/or the editor(s). MDPI and/or the editor(s) disclaim responsibility for any injury to people or property resulting from any ideas, methods, instructions or products referred to in the content.

