Abstract
Research on water erosion often uses rainfall simulators, as these instruments allow for controlling the characteristics of the erosive agent and carrying out replications of experimental runs over brief time periods. In this paper, the early-step assessment of a new pressurized rainfall simulator equipped with nozzles differing in their spray angle and flow rate is developed. Experimental runs were performed to determine operative information about its functioning and rainfall intensity distribution. The investigated pressure–flow rate pairs, corresponding to values differing from those provided by the manufacturer, suggested that these nozzles are affected by their technological variability. Therefore, the use of the nozzles in pressure ranges that the producer did not investigate requires the testing of the manufacturer’s characteristic curves. The developed analysis on the variability of the measured average rainfall intensities and Christiansen’s Uniformity coefficient with the distance from the nozzle orifice demonstrates that the best simulation was obtained for the high-flow-rate nozzles at 120° and 90° with a pressure of 0.5 bar. These two simulation conditions allowed for the obtainment of rainfall intensities equal to 50 and 70 mm/h, respectively, and excellent uniform spatial distributions within a circular area with a diameter of 1.5 m. Moreover, to change the rainfall intensity during the simulation, the more effective approach was to maintain a constant pressure and modify the nozzle type, thereby modifying the nozzle spray angle. This finding underlines the importance of verifying the manufacturer’s nozzle characteristic curves and testing the rainfall intensity spatial distribution for selecting the nozzles most suitable for the simulation aims.
1. Introduction
Rain simulation is a remarkable tool in water erosion research, as it allows for the control of the characteristics of the erosive agent, which cannot be controlled a priori using natural rainfalls. Rainfall simulators are valuable devices in experimental tests as they allow for controlled replications of precipitation events over short periods. By providing numerous and repeatable rainfall conditions, these devices allow for isolating specific variables and assessing their impact over relevant hydrological processes related to soil erosion, infiltration rates, surface runoff, sediment transport, and conservation practices [1,2,3,4,5,6,7].
Different rainfall simulators have been proposed in the literature, distinguished by the research application, nozzle type, capillary material, droplet size distribution, rainfall intensity, and uniformity of the simulated precipitation, and each device requires testing both the dynamic characteristics and the distribution of the simulated rainfall [8,9,10,11,12,13,14,15,16,17,18,19,20,21,22,23,24,25,26,27,28,29,30,31,32,33,34,35,36]. Before using rainfall simulators for hydrological purposes, they need to be characterized not only in terms of the rainfall intensity and its uniformity distribution, but also in terms of the raindrop size distribution, raindrop falling velocity, and, thus, kinetic energy that reaches the sampling area in a given time.
Referring to the raindrop formation process, rainfall simulators can be categorized as dripping and pressurized simulators [37].
Dripping simulators, such as the Kamphorst one (model type 09.06) [18,38], use needles or drippers to generate raindrops through gravity. Thus, they are simple in design and effective for small-scale investigations. For fixed conditions, such as the water temperature, pressure head, drippers’ geometric characteristics (length and inner diameter), and fall height of drops, they form raindrops with constant characteristics in terms of their diameter and fall velocity. Therefore, the use of a weighing technique to determine raindrops’ diameters and a photographic method to measure their fall velocities [39,40] allows for an easy characterization of this type of simulator. The main limitation of these simulators is that they are often characterized by large raindrops, which always impact the same areas unless the system is modified using meshes for the drop breaking and the spatial redistribution [25,32,41,42,43].
In contrast, pressurized simulators use pumps and nozzles to generate rainfall closely resembling natural storm events, since they allow for simulating precipitation having a wider range of drop sizes and rainfall intensities by varying the raindrop falling height and diameter [6,44]. Nevertheless, they require careful calibration and maintenance to ensure accuracy and consistency in the simulation.
Although many rainfall simulators have been proposed and used in the literature, their results are difficult to compare, even when the same physical process is investigated, due to a lack of standardization in the operating conditions [3,32,36,45,46]. Therefore, the characterization of a rainfall simulator by a consistent methodology is fundamental to ensure the reproducibility and comparability of the experimental results of different investigators.
For improving the reliability of hydrological studies, another challenge of these devices is their characterization in terms of the Drop Size Distribution (DSD), drop fall velocity v (m/s), rainfall kinetic power Pn (J/m2/s) (i.e., the rainfall kinetic energy per unit area and time), and momentum per unit time and area M (N/m2) [39,40]. The energy characterization is straightforward to perform in drip-type simulators, as individual droplets can be identified and analyzed with higher precision [40], while for the pressurized one, it requires the use of a disdrometer to measure the raindrop size distribution and falling velocity.
The correct functioning of a simulator also implies that the rainfall distribution over the investigated plot area is uniform. For this aim, the simple Christiansen Uniformity (CU) coefficient [47] is the most frequently used parameter to evaluate the rainfall uniformity over the plot surface [3,4,33,48,49,50]. The CU coefficient is calculated using the following equation [47]:
where is the sum of the absolute deviations of the rainfall intensity Ii (mm/h) of a single collector from the mean rainfall intensity Ia (mm/h) of all collectors, and n (-) is the total number of collectors. However, its use is appreciably dependent on the applied methodology (the number, density, and layout of collectors) [51].
As reported by the American Society of Agricultural Engineers [52], the uniformity of a rainfall simulator can be classified as unacceptable (CU < 60%), poor (60% < CU < 70%), fair (70% < CU < 80%), good (80% < CU < 90%), or excellent (CU > 90%) [7]. Furthermore, Iserloh et al. [3] emphasized that achieving a CU above 80% is essential to ensure the proper functioning and reproducibility of any rainfall simulation investigation.
Iserloh et al. [3] compared the performances of thirteen rainfall simulators of both types spread throughout European research institutes, one of which is a drip-type simulating a rainfall intensity equal to 360 mm/h. The others are pressurized rainfall simulators which, according to Iserloh et al. [3], discharged into the sampling area rainfall intensity values ranging from 37 to 94 mm/h.
To assess the spatial distribution of the simulated rainfall intensity, the authors used small collectors to measure the rainfall intensity, obtaining CU values for the tested devices varying between 60.6% and 97.8%. The investigated simulators were also characterized in terms of the DSD and rainfall kinetic energy using an optical disdrometer (Laser Precipitation Monitor, Thies Clima, Göttingen-Germany), neglecting the spatial variability of the rainfall energy characteristics and only providing the average measured kinetic energy obtained by placing the disdrometer at five different spots in the center of the sampled surface. The authors suggested that, since the low fall height did not enable them to reach the terminal velocity of large natural raindrops (large drops are only produced when the system pressure is low), the simulators produced low values of rainfall kinetic energy.
In this paper, a new pressurized small portable field rainfall simulator, equipped to be used with different nozzle types, is proposed. The early-stage operative information about its functioning and the uniformity of the rainfall intensity distribution is provided. For each considered nozzle, the performance of the proposed rainfall simulator is evaluated to verify the flow rate–pressure relationship (characteristic curve), test its technological variability, and determine the uniformity of the rainfall intensity distribution for different pressure values.
2. Materials and Methods
2.1. The Description of the Rainfall Simulator
The proposed simulator, schematically reported in Figure 1, belongs to the category of pressurized nozzle simulators.
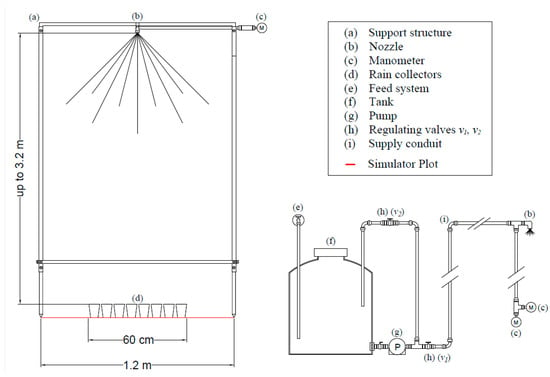
Figure 1.
The experimental set-up: the front-view of the support structure, nozzle, and rain collectors (left) and a schematic representation of the rainfall simulator’s hydraulic system, from the feed system to the nozzle outflow (right).
The support structure is made of galvanized steel with a square base of 1.2 m per side, corresponding to that of the plot subjected to the simulated rainfall (Figure 1). Designed for easy assembly, the frame includes four uprights equipped with a telescopic sliding mechanism, enabling the change in the frame’s height up to 3.2 m. Each upright can be independently adjusted, allowing the structure to also be used on steep slopes or uneven terrain. The upper section of the gantry is reinforced with a square grid, reducing vibrations and improving stability during rainfall simulations.
The water stored in a 30 L capacity tank is pressurized using a centrifugal pump (model 2088-713-515, made by Shurflo, Roncq-France) (Figure 1). This pump features a maximum pressure, P, of 3.8 bar and a maximum flow rate, Q, of 13.2 L/min. This pump operates on a 12 V electrical power supply, which can also be sourced by a transformer connected to a 220 V electrical grid and a 12 V, 10 Ah battery, ensuring the device’s functionality in field applications.
Two separate control valves have been installed: the first valve (v1) controls the amount of water drawn by the pump, while the second valve (v2) regulates the amount of water recirculated into the tank (Figure 1). This configuration allows for finer pressure adjustment, facilitating the execution of experimental tests, as a steady-state flow condition can be easily achieved. In this investigation, when v2 was completely closed, the maximum flow rate occurred; as v2 was gradually opened, the recirculation flow to the feed tank increased, reducing pressure (up to 0.1 bar) and flow rate values at the nozzle.
The selected nozzles are axial full-cone sprinklers from the Lechler 490 Series (Lechler Gmb, Metzingen-Germany) (Figure 2), made for chemical applications.
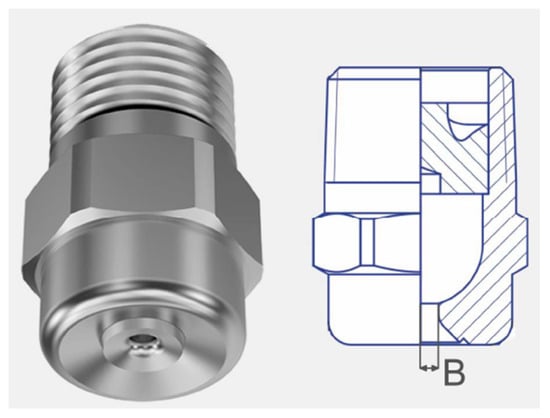
Figure 2.
Close-up view of Lechler Series 490 nozzles (B: bore width).
These nozzles are specifically designed to minimize the risk of clogging due to their wide flow channels, ensuring a uniform distribution over the circular impact area [53]. Manufactured from brass, these nozzles offer high resistance to oxidation and abrasion, preserving their hydraulic performance over time. They maintain a stable spray angle across a range of pressures, which is essential for uniform coverage. The nozzles of the Lechler 490 series can cover different wetting surfaces depending on the pressure and specific model. Five nozzle models were selected, distinguished by their spray angle or delivered flow rate (High Q and Low Q nozzle type), and, for each model, two nozzles were tested to verify their technological variability. The key characteristics of the investigated nozzles, in terms of spray angle, bore diameter, and hydraulic properties (Q-P relationship), provided by the manufacturer are listed in Table 1. Table 1 also lists the maximum diameter of the circular wetted area corresponding to the used falling height of 1.63 m.

Table 1.
Characteristics of Lechler nozzles provided by the manufacturer.
For each nozzle type, the nozzles were positioned at the center of the upper grid of the metal structure and as a terminal component of the supply conduit, which has a diameter equal to ½ inch (1.27 cm). A digital manometer (model PCE-DMM 10, made by PCE Instruments, Italy), placed on the upper grid of the structure at the same height as the nozzle to avoid errors attributable to the outflow dynamic effects (Figure 1), was installed to measure the pressure of the rainfall simulation. Moreover, using a T-shaped connector, a metal manometer in a glycerin bath was installed at the terminal section of the supply line (Figure 1) for verifying the reliability of the digital manometer’s measurements during the simulation. The nozzle position at the highest point of the system also facilitated the steady-state condition.
The use of full-cone nozzles results in rainfalls confined within a pseudo-conical volume, with the nozzle orifice as its apex, and the shape of this volume is affected by pressure and falling height.
2.2. Experimental Measurements
To measure the flow rate, Q (L/min), for each pressure value, the water volume was collected and then weighed using a digital scale with a resolution of 0.1 g (model 6200 D, made by Precisa Gravimetrics AG, Dietikon, Switzerland), while time was recorded using a digital stopwatch with a resolution of 0.01 s. The sampling time was set equal to two minutes.
The following statistical indices were considered to verify and thus quantify the reliability of the nozzle characteristic curves. In particular, the values of the mean relative error (MRE) (%) and the mean absolute error (MAE) (%) were calculated as follows:
in which xcalculated and xmeasured denote the calculated and measured considered variables, respectively, and N is the number of experimental data.
Rain collectors with a diameter of 6.35 cm and a maximum capacity of 200 cm3 were placed to collect the rainfall volumes in the selected sampling surface. The rain collectors were placed on a polystyrene base cut to fit the containers, preventing any movement due to the impact of the rain. With reference to a circular surface of 60 cm in diameter, 55 rain collectors were used, numbered, and arranged as concentrically as possible inside a circular sampler with a diameter of exactly 60 cm (Figure 3).
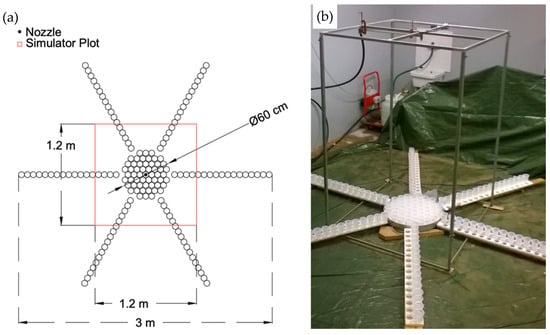
Figure 3.
The top-view of the sampling scheme used for volumetric tests (a) and the view of the experimental set-up in the laboratory (b). The diagram shows the positions of the rain collectors, with a central sampling area of 60 cm in diameter and a total length of 3 m along the three main directions.
The surrounding area was sampled by arranging 17 rain collectors along each of the 6 axle shafts (Figure 3). A total of 157 collectors were numbered and located in a circular area with a diameter of 3 m. The external surface of the collectors was also dried before weighing to avoid measurement errors (systematic overestimates) caused by water adhering to the beakers and present among the samplers.
Rainfall intensity measurements were carried out for each nozzle model, fixing the pressure upstream of the nozzle and the drop falling height (equal to 1.63 cm), i.e., the distance between the nozzle and the upper surface of the rain collectors. The volumes, Vol (mm3), collected after a time interval of about 30 min, were measured by weighing each rain collector before and after precipitation, assuming a water specific weight of 1000 kg/m3.
Knowing the volume of rainfall collected by each cup, the simulated rainfall intensity Ii (mm/h) was determined as follows:
in which σ (m2) is the sampling surface of each collector, equal to 6400 mm2 for the considered cups, and t (h) is the sampling time.
The spatial distribution of simulated rainfall intensity was assessed both within a circular area of 60 cm in diameter, centered on the vertical axis passing through the nozzle orifice, and in the surrounding area outside the 60 cm circle using three sample directions, with six axle shafts, that cover a total diameter of 3 m (Figure 3). The rationale behind the selection of a 60 cm sampling core is due to the fact that this simulator was initially conceived for point-scale hydrological measurements within a 60 cm diameter plot. Subsequently, the evaluation of distribution uniformity was extended beyond the initial 60 cm diameter for considering the theoretical maximum size of the circular wetted area corresponding to the different nozzles (Table 1).
In this investigation, for each nozzle, the volumetric tests were conducted at different pressure levels, ranging from 0.25 to 0.54 bar for nozzle models 120° and 90° and from 1.00 to 1.54 bar for nozzle models 45° and 60°. These pressure values were chosen for obtaining a simulated rainfall, consisting of visually distinguishable single droplets that reach the ground, avoiding the formation of a spray flow.
In this investigation, the uniformity of precipitation at a given distance from the nozzle was also investigated by considering the rings corresponding to the inlet surfaces of the collectors, positioned at a fixed distance from the vertical axis of the nozzle orifice. For each nozzle model, the trend of the rainfall intensities averaged in the circular area (Figure 4a) and the concentric rings (Figure 4b) and the uniformity coefficients, as a function of the distance from the nozzle, were also determined.
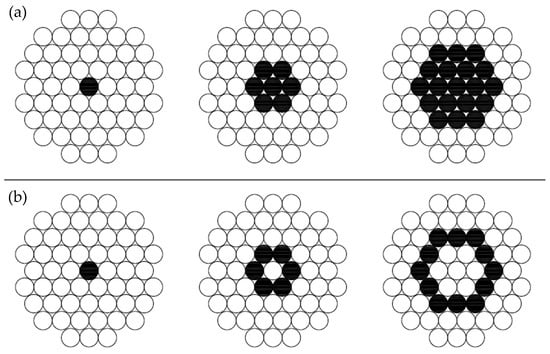
Figure 4.
Schematic examples of circular areas (a) and concentric rings (b).
3. Results
The reliability of the proposed rainfall simulator and the performance of each considered nozzle were tested by verifying the relationship (characteristic curve) between the flow rate, Q (L/min), and pressure, P (bar), and by evaluating the spatial distribution of the rainfall intensity.
3.1. Testing the Characteristic Curve
For all the nozzle types, and considering pressure values ranging from 0.5 bar to 10 bar, the manufacturer suggested values of the (P, Q) pairs (Table 1) that can be described by the following relationship (Figure 5):
in which a and b are coefficients that are equal to 3.8 and 0.4 for the nozzles at high flow rates (45°_490683, 60°_490684, 90°_490686, 120°_490688) and to 2.4 and 0.4 for the 120°_490608 model, which is a low-flow-rate model. In other words, a common characteristic curve is suggested for different high-flow-rate nozzles.
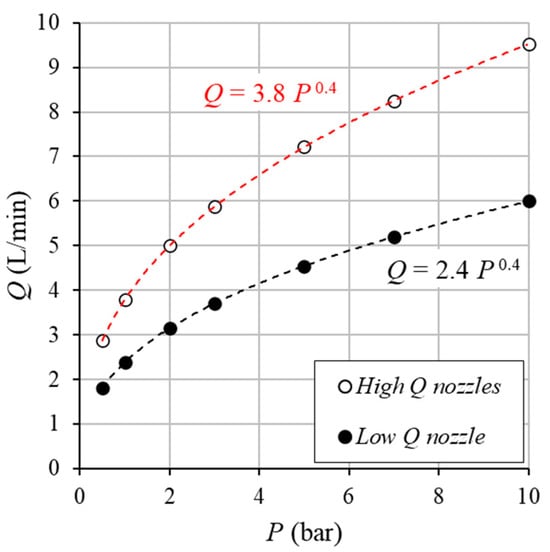
Figure 5.
Characteristic curves (P-Q) of the considered nozzle models.
For each nozzle model listed in Table 1, two nozzles (n1 and n2) were considered to test their technological reliability. For each nozzle, the characteristic curve provided by the manufacturer (Equation (5)) was tested by collecting, under a constant pressure, the water volume over a given time. Specifically, 11 pressure values, ranging from 0.1 bar to 2.5 bar, were considered.
Figure 6 shows the comparison between the experimental (P, Q) pairs and the characteristic curves provided by the manufacturer (Equation (5)). The analysis showed that, for a fixed model, the n1 and n2 pairs (P, Q) were almost overlapped, confirming the technological reliability of the chosen models. In other words, for a fixed pressure and for each model, the two nozzles produced nearly the same Q value.
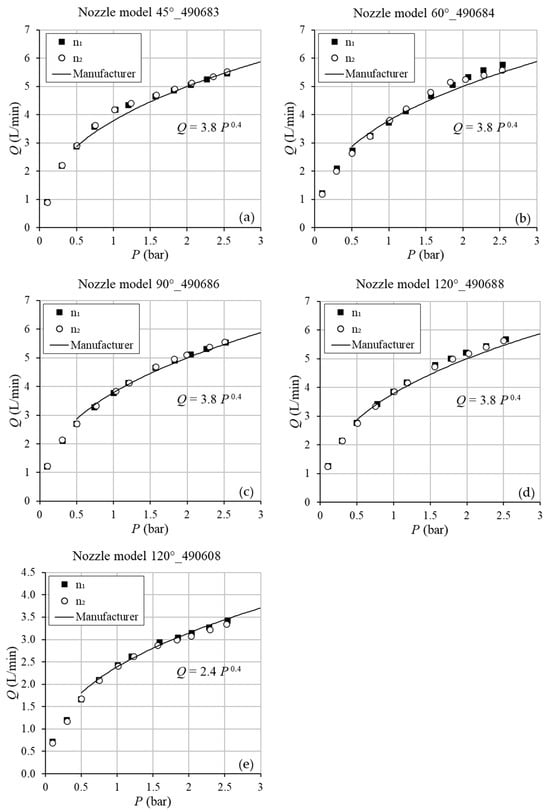
Figure 6.
Experimental pressure–flow rate (P-Q) data for the five tested nozzles (45°_490683 (a), 60°_490684 (b), 90°_490686 (c), 120°_490688 (d), and 120°_490608 (e)) compared with the manufacturer’s characteristic curve.
Moreover, to verify the reliability of the characteristic curves suggested by the manufacturer, the values of the MRE (%) (Equation (2)) and MAE (%) (Equation (3)) and the percentage of measurements affected by absolute errors (AEs) less than or equal to 10%, referred to as high- and low-flow-rate nozzles, were calculated (Table 2). The analysis of the errors suggested that the characteristic curves are able to describe the experimental pairs, with an MAE equal to 5.6% for high-Q nozzles and 5.4% for low-Q ones. The percentage of measurements with an absolute error >10% is equal to 13.6% for both cases, and 68.8% (for high-flow-rate type) and 25% (for low-flow-rate type) of them occurred for a P < 0.5 bar.

Table 2.
The reliability of Equations (5) and (6) in estimating Q, with coefficients suggested by the manufacturer and those calibrated on data.
This result suggested that Equation (5), with a and b coefficients provided by the manufacturer, which was developed for a P > 0.5 bar, did not provide good Q estimates for a P < 0.5 bar. Therefore, Equation (5) needed to be calibrated by the experimental data of the present investigation. Figure 7 shows the calibration of the nozzles’ characteristic curves based on the experimental data.
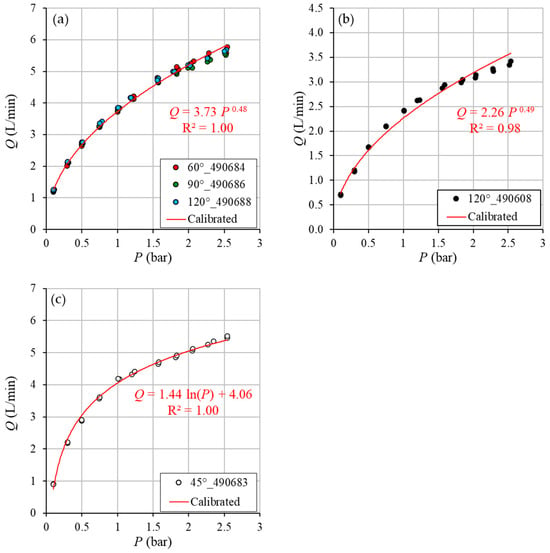
Figure 7.
A comparison between the manufacturer characteristic curves and those calibrated on data to reproduce the experimental pressure–flow rate (P-Q) values for the models 60°_490684, 90°_490686, and 120°_490688 (a), 120°_490608 (b) and 45°_490683 (c).
Specifically, the high-Q nozzles with spray angles of 60°, 90°, and 120°, as well as the low-Q nozzle with a 120° spray angle, were calibrated using Equation (5), with the coefficients a and b equal to 3.73 and 0.48 for the high-flow-rate type (Figure 7a) and 2.26 and 0.49 for the low-flow-rate type (Figure 7b). A different approach was required for the 45° nozzle, which showed a different performance and was therefore calibrated using the following relationship:
in which c and d are coefficients equal to 1.44 and 4.06 (Figure 7c), respectively.
The statistical indices (MRE, MAE, and the percentage of measurements affected by absolute errors less than or equal to 10%), referring to the calibration of the characteristic curves on experimental data, are also listed in Table 2, showing an appreciable improvement in performance compared to those observed with manufacturer characteristic curves.
Figure 8 shows the comparison between the Q measured value and those calculated by Equations (5) and (6) calibrated on data, highlighting the good performance of the new calibration since all the experimental points are close to the line of the perfect agreement (1:1). Indeed, for the high-Q nozzles with spray angles of 60°, 90°, and 120°, as well as the low-Q nozzle with a 120° spray angle, all the measurements are affected by absolute errors less than or equal to 10%. For the nozzle with a spray angle of 45°, 90.9% of the data present an AE ≤ 10% (Table 2).
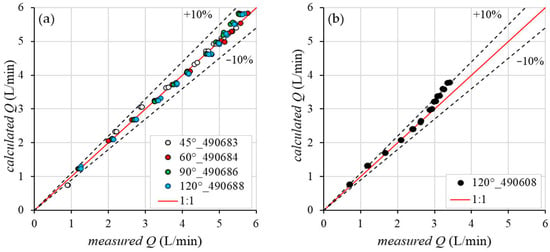
Figure 8.
Comparison between measured Q values and those calculated by Equations (5) and (6) calibrated on data for the models 45°_490683, 60°_490684, 90°_490686, and 120°_490688 (a), and 120°_490608 (b).
3.2. Rainfall Intensity
For each nozzle type and fixed P, the values of the average intensity, Ia (mm/h) and the rainfall intensity CU coefficient (Equation (1)) (Figure 3) were determined (Table 3) considering the central sampled circular area of 60 cm in diameter.

Table 3.
Experimental results, for each tested nozzle model and pressure value, in terms of the average rainfall intensity (Ia) and Christiansen Uniformity coefficient (CU), considering the central sampled circle with a diameter of 60 cm.
The analysis showed that, considering the wet area of 60 cm in diameter, the 120° spray angle models recorded values of Ia that seem to be little influenced by the increase in pressure from 0.25–0.26 to 0.51–0.54 bar. The increasing pressure values, instead, determine, especially for the low-flow-rate nozzle type (model 490608), an improvement of the rainfall intensity CU coefficient (Table 3).
The 90° spray angle model was much more sensitive to the rise in pressure (from 0.25 to 0.51–0.52 bar). Indeed, this rise determined a relevant reduction in the Ia values and a slight improvement in the CU coefficient (Table 3).
The 45° and 60° spray angle models required pressures of 1.0–1.4 bar to simulate rainfalls characterized by distinguished raindrops. Simulated rainfall intensity values ranging from 164.2 mm/h to 327.4 mm/h, which can be high for hydrological purposes, correspond to the chosen pressures. The growth of P yielded an increase in the average rainfall intensity and a nearly constant CU, except for the n1 of the 60° spray angle model, which showed an anomalous behavior compared to the other nozzles, registering an average rainfall intensity equal to 327.43 mm/h with a CU = 66.5% for a P = 1.02 bar and equal to 321.41 mm/h with a CU = 72.4% for a P = 1.54 bar (Table 3).
For a fixed nozzle model and pressure value, the analysis revealed that different values of Ia occur for n1 and n2, except for the 90° spray angle model, which exhibited lower technological variability, since very similar Ia values were discharged into the sampling area (Table 3).
For the investigated nozzle models and pressures, Figure 9, Figure 10, Figure 11, Figure 12 and Figure 13 show the trend of the Ia values with the distance from the vertical axis of the nozzle orifice, considering both the circular areas (Figure 4a) and the concentric rings (Figure 4b) of the wetted area of 3 m in diameter. Moreover, in the same figures, the trend of the CU coefficient (Equation (1)) with the distance from the nozzle and considering the concentric rings is shown.
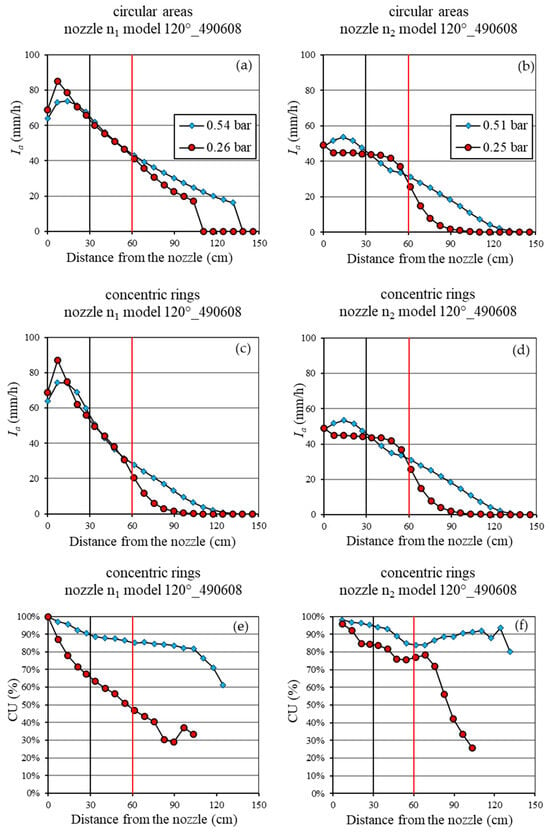
Figure 9.
The spatial distribution of the mean rainfall intensity (Ia), considering both the circular sampling areas (a,b) and the concentric rings (c,d), and of the Christiansen Uniformity (CU) coefficient (e,f) for nozzle model 120°_490608 with low flow rates. The black and red vertical lines represent the distance of both the wetted area of 60 cm and the simulator plot of 1.2 m from the nozzle, respectively.
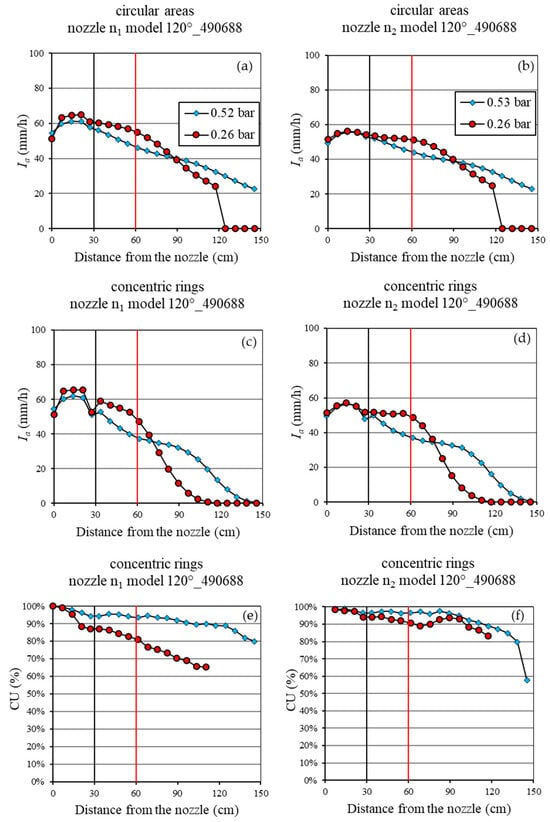
Figure 10.
The spatial distribution of the mean rainfall intensity (Ia), considering both the circular sampling areas (a,b) and the concentric rings (c,d), and of the Christiansen Uniformity (CU) coefficient (e,f) for nozzle model 120°_490688 with high flow rates. The black and red vertical lines represent the distance of both the wetted area of 60 cm and the simulator plot of 1.2 m from the nozzle, respectively.
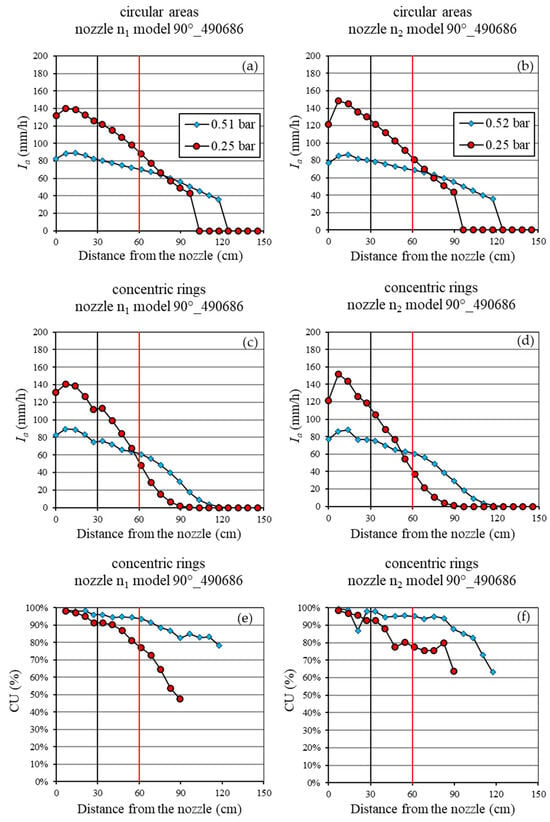
Figure 11.
The spatial distribution of the mean rainfall intensity (Ia), considering both the circular sampling areas (a,b) and the concentric rings (c,d), and of the Christiansen Uniformity (CU) coefficient (e,f) for nozzle model 90°_490686. The black and red vertical lines represent the distance of both the wetted area of 60 cm and the simulator plot of 1.2 m from the nozzle, respectively.
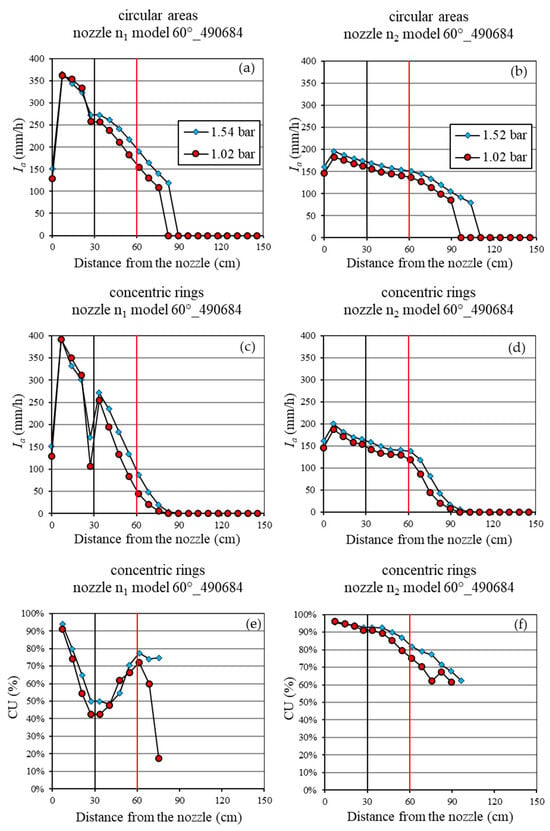
Figure 12.
The spatial distribution of the mean rainfall intensity (Ia), considering both the circular sampling areas (a,b) and the concentric rings (c,d), and of the Christiansen Uniformity (CU) coefficient (e,f) for nozzle model 60°_490684. The black and red vertical lines represent the distance of both the wetted area of 60 cm and the simulator plot of 1.2 m from the nozzle, respectively.
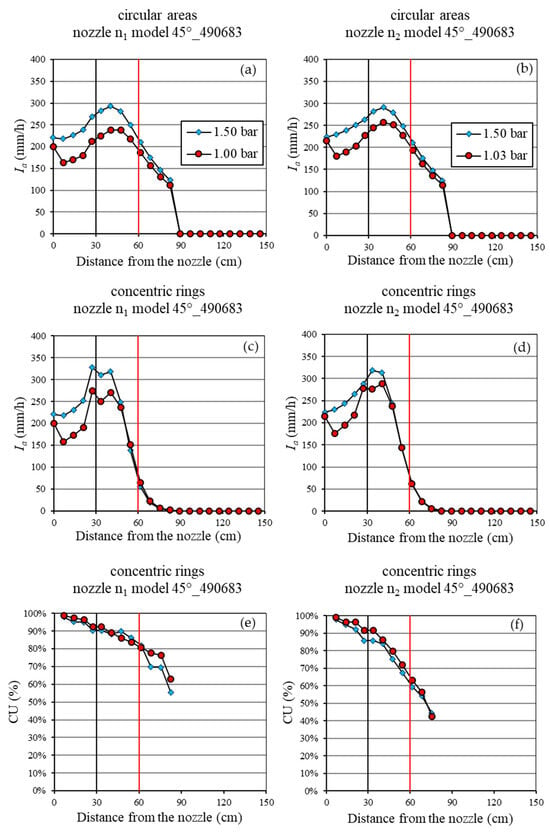
Figure 13.
The spatial distribution of the mean rainfall intensity (Ia), considering both the circular sampling areas (a,b) and the concentric rings (c,d), and of the Christiansen Uniformity (CU) coefficient (e,f) for nozzle model 45°_490683. The black and red vertical lines represent the distance of both the wetted area of 60 cm and the simulator plot of 1.2 m from the nozzle, respectively.
In particular, the analysis highlighted that the 120° nozzle model (490608) with a low flow rate (Figure 9) is characterized by performance differences between the nozzles n1 and n2 (Figure 9a–d), denoting a clear technological variability. For nozzle n1, the average rainfall intensities rapidly decreased with distance, starting from about 80 mm/h (Figure 9a,c). Instead, nozzle n2 produced a constant rainfall intensity (about 45 mm/h) up to 50 cm from the nozzle axis (Figure 9b,d). In any case, at the maximum considered pressure of 0.51–0.54 bar, these nozzles showed a good uniformity of the rainfall intensity inside the rings, up to considerable distances (about 100 cm) from the nozzle (Figure 9e,f). Instead, the uniformity appreciably decreased with a minor pressure, especially for the nozzle n1.
The two nozzles with a 120° spray angle and high flow rates (model 490688) (Figure 10) exhibited equal performances concerning the trend of the Ia values with the distance from the nozzle, considering both the circular areas (Figure 10a,b) and the concentric rings (Figure 10c,d). Concerning the trend of the CU with the distance from the nozzle, n2 produced CU values greater than 90% up to 100 cm from the nozzle, independently of the considered pressure (Figure 10f). For the n1 nozzle, the highest-pressure value gave the best rainfall intensity uniformity with the increase in the distance from the nozzle (Figure 10e).
The two 90° nozzles (Figure 11) did not exhibit performance differences, regardless of the applied pressure, demonstrating a good technological reliability (Figure 11a–d). Moreover, for each nozzle, the increase in the P value determined a decrease in the average rainfall intensity, because the same flow rate was distributed over a larger surface, producing an enlargement in the wetted area (Figure 11a–d). Furthermore, the increase in the P value determined a growth of the CU, particularly in the wetted area farther from the nozzle (Figure 11e,f). Thus, for both nozzles, the best simulation occurred at a pressure of 0.5 bar, which ensured a nearly constant average rainfall intensity (80 mm/h) within the wetted area of 60 cm in diameter and also determined the highest CU values.
The analysis of the nozzles with a 60° spray angle (Figure 12) highlighted that they are not technologically reliable regarding the spatial distribution of the rainfall intensity. For a fixed pressure and distance from the nozzle, the nozzles n1 and n2 provided different values of the average rainfall intensity concerning both the circular areas (Figure 12a,b) and the concentric rings (Figure 12c,d). Moreover, the delivered rainfall intensity was too high (up to almost 400 mm/h for n1 and 200 mm/h for n2). In addition, for both P values, n2 showed a better performance than n1 in terms of the CU as the distance from the nozzle increased, especially in the concentric rings up to a distance of 30 cm from the nozzle (Figure 12e,f). However, for this nozzle model, both the Ia and CU trends with the distance from the nozzle are less affected by the increase in P (Figure 12a–f).
Concerning the 45° nozzle model (Figure 13), the analysis shows that the employed nozzles provided the same results when analyzing both the circular areas (Figure 13a,b) and the concentric rings (Figure 13c,d). Moreover, this nozzle model is the only one, among those tested, that produced precipitation with an increasing average rainfall intensity value as the distance from the nozzle grew. This increasing trend of Ia is observed up to distances of 40 cm from the orifice, after which it rapidly decreases, becoming practically negligible at 70 cm (Figure 13a–d). As a result, the CU values exhibit a marked decreasing trend (Figure 13e,f) for all the considered nozzles and pressures. Nevertheless, it remains quite high (CU ≥ 90%) up to distances of about 40 cm from the nozzle orifice.
Furthermore, for each fixed nozzle relative to the 60° and 45° spray angle models, the decrease in the operating pressure from 1.5 bar to 1 bar determined lower Ia values (Figure 12a–d and Figure 13a–d). However, despite this downward vertical shift in the distance–intensity relationships, the average simulated rainfall intensities remained excessive for hydrological purposes.
Figure 14 and Figure 15 show an example of the spatial distribution of rainfall intensities referring to the high-flow-rate nozzles at 120° and 90° with a pressure of 0.53 and 0.52 bar, respectively, which are the nozzles that produced the best rainfall simulation. Specifically, these figures highlight that, in the simulator plot area, the two nozzles produced a different range of rainfall intensity, giving a homogeneous spatial distribution of Ii. Moreover, a decreasing trend of the Ii values with the increase in the distance from the nozzle is registered for both the considered nozzle models.
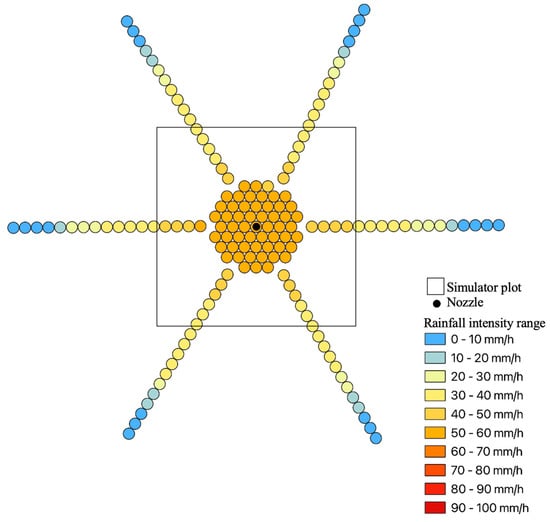
Figure 14.
An example of the spatial distribution of the rainfall produced by the nozzle model 120°_490688 at a test pressure of 0.53 bar.
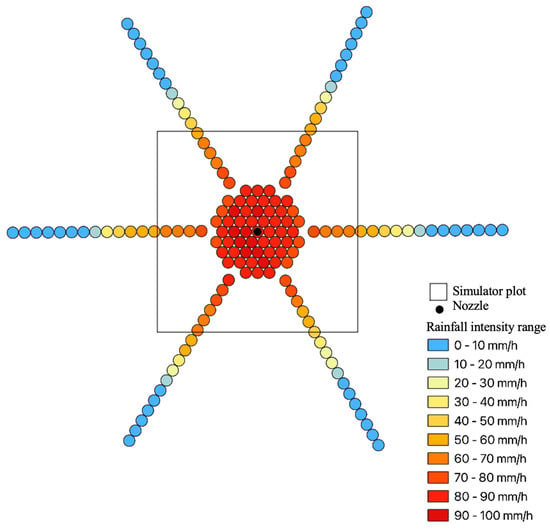
Figure 15.
An example of the spatial distribution of the rainfall produced by the nozzle model 90°_490686 at a test pressure of 0.52 bar.
4. Discussion
4.1. Testing the Characteristic Curve
For obtaining a simulated rainfall composed of visually distinguishable single droplets that reach the ground, the use of pressure values different than those suggested by the manufacturer was required.
Therefore, the use of nozzles in an application field different from that of the original design required special attention in verifying the characteristic curves, the average rainfall intensity, and the rainfall uniformity within the wetted area.
At first, the laboratory tests led to choosing only two values of P that allowed for the avoidance of a spray flow. As an example, the use of a pressure higher than 0.7 bar for 90° and 120° models determined a rainfall characterized by very small droplets, emitted so rapidly as to originate a spray. Conversely, for 45° and 60° nozzle models, the use of low-pressure values (<1 bar) caused intermittent rainfalls, making the simulation unrealistic.
The manufacturer distinguished these nozzle models into two categories: the high-flow-rate type (45°_490683, 60°_490684, 90°_490686, and 120°_490688) and low-flow-rate type (120°_490608). For each category, a characteristic curve was proposed (Figure 5). Therefore, for a fixed category, a given pressure value yields a unique Q value, which is distributed on a different wetted surface. The latter is dependent on the considered spray angle model.
The P–Q measurements of the present investigation (Figure 6) allowed for the testing of the manufacturer characteristic curves. For the considered pressure values, the results suggested that these curves need to be recalibrated as estimation errors of Q occur (Table 2).
This result demonstrated that the calibration of Equation (5) and Equation (6) by the experimental data resulted in a more reliable estimation of the flow rate, also for a P < 0.5 bar (Figure 7 and Figure 8, Table 2).
Moreover, the data also suggested that, for the 45° nozzle model, the characteristic curve assumes a different form than that of the other high-Q flow rate nozzle types. In other words, these results highlighted that, for pressure values different from those suggested by the manufacturer, these nozzles are more affected by the technological variability.
4.2. Rainfall Intensity
For a fixed nozzle model and pressure value, the Ia and CU were also investigated considering the central circular wetted area with a diameter of 60 cm (Table 3). The analysis revealed that different values of Ia occurred between the n1 and n2 nozzles for all models, except for the 90° spray angle model, which resulted in less technological variability, since very similar Ia values were discharged into the sampling area (Table 3). Within the diameter of 60 cm, all nozzle models have a high rainfall intensity CU coefficient (Table 3), except the 120° model at low a Q and P = 0.25 bar and the n1 nozzle at a 60° spray angle at both P values, highlighting the reliability of the selected nozzles for hydrological purposes. The range of the rainfall intensity CU coefficient of the present investigation (66.5–97.2%) was comparable to that suggested by Iserloh et al. [3] (60.6–97.8%) for the pressurized rainfall simulators, confirming the reliability of the proposed simulator to provide an accurate spatial rainfall intensity distribution.
The analysis was also extended to the sampling area of 3 m in diameter, since the 120° nozzle model placed at a height of 1.63 m could cover a wetted area of a maximum of 3 m.
For each nozzle model and fixed P values, the Ia variability with the distance from the vertical axis of the nozzle orifice was investigated by considering both the circular areas (Figure 4a) and the concentric rings (Figure 4b, Figure 9, Figure 10, Figure 11, Figure 12 and Figure 13). Moreover, the trend of the CU coefficient with the concentric rings was examined. The analysis highlighted that the 120° nozzle model with low flow rates (490608) determined performance differences between n1 and n2, denoting a dependence on the considered nozzle. This notable technological variability is probably due to the small size of the orifice, which amplifies the effects of the micro imperfections of the device (Figure 9).
For the 120° spray angle and high-flow-rate (490688) nozzles, the growth of the pressure value from 0.26 to 0.50 bar did not result in a decrease in the Ia, but an increase in the wetted area was observed (Figure 10). In other words, the same average rainfall intensity was distributed over a larger wetted surface. The best CU values were consistently obtained at 0.5 bar (Figure 10e,f).
Therefore, the analysis of the 490688 model allowed for the conclusion that it can adequately simulate precipitation both in terms of the maximum intensity (about 60 mm/h) and uniformity of distribution, even on plots up to 1.2 m in size. Moreover, for this nozzle model, the reduction in pressure does not effectively decrease the precipitation intensity, which could be obtained by changing the nozzle model.
For the 90° nozzles, an increase in pressure led to a decrease in rainfall intensity, as the same flow rate was distributed over a larger area (Figure 11a–d). Nevertheless, the best CU values were observed at 0.5 bar, denoting an optimal performance at this pressure. The analysis also demonstrated that the 90° nozzles present the highest technological reliability and, therefore, could be used for the proposed rainfall simulator.
Conversely, the 60° nozzles showed poor technological consistency: at a fixed pressure and distance, n1 and n2 yielded differences in the average intensities, with excessively high Ia values (up to almost 400 mm/h for n1 and 200 mm/h for n2), making them unsuitable for hydrological applications.
Moreover, for both the 60° and 45° nozzles (Figure 13), the increase in the pressure from 1 to 1.5 bar did not enhance the wetted surface and did not improve the CU. In both cases, the CU remains high up to approximately 40 cm. However, at higher pressures, these nozzles produced excessively high intensities over small surface areas, making them unsuitable for hydrological simulations.
In conclusion, this analysis shows that the best simulation in terms of rainfall intensity was obtained for the high-flow-rate nozzles at 120° and 90° with a pressure of 0.53 and 0.52 bar, which generated average rainfall intensity values equal to 50 and 70 mm/h, respectively. The rainfall intensity values were uniformly distributed within the simulator plot area (Figure 14 and Figure 15) and presented an excellent spatial distribution uniformity (CU > 90%) within a large circular area with a diameter of 1.5 m.
Furthermore, with these nozzle models, except for the 90° spray angle one, the change in the operating pressure did not produce a variation in rainfall intensity, but it caused variations in the spatial distribution of the precipitation. Therefore, to obtain the required rainfall intensity value, it is necessary to change the nozzle type and/or model or adjust the nozzle height. As an example, for a fixed nozzle model and pressure, the increase in the simulation height produces a lower rainfall intensity value. This finding underlines the importance of an accurate calibration to select the most reliable nozzles for hydrological applications. For these purposes, this analysis represents only the first step towards the complete characterization of this simulator. In fact, the limits of this investigation are the absence of energy characterization—important for using the proposed rainfall simulator in hydrological and soil erosion studies—and the use of a single raindrop falling height.
5. Conclusions
In this paper, a new portable rainfall simulator, designed for use both in the field and laboratory, with pressurized nozzles and a downward spray was presented. The proposed rainfall simulator has the advantage of having a lightweight and easily assembled supporting structure, which is essential for field applications. Moreover, since the four uprights can be independently adjusted, the design allows the simulator to be easily used even in steep and/or uneven terrain.
The proposed simulator operates using a single nozzle, and to evaluate its simulation capabilities, five full-cone nozzle models were tested, each characterized by four distinct spray angles and two different characteristic curves.
After reconstructing and verifying the consistency of the characteristic curves of all the tested nozzles with those provided by the manufacturer, the P–Q measurements of the present investigation allowed for the testing of the manufacturer characteristic curves, suggesting that, for the considered pressure value, these curves need to be calibrated on data, because errors in the Q estimation occur. Therefore, the analysis highlighted that for pressure values different from those suggested by the manufacturer, these nozzles are more affected by the technological variability. Therefore, it is important to verify the reliability of the manufacturer’s characteristic curves.
The analysis of the results also showed that, except for two nozzles (one at 120° with low flow rates and one at 60° with high flow rates), all the tested nozzles exhibited a good degree of rainfall intensity uniformity distribution, especially within the circular area with a diameter of 60 cm, where uniformity coefficients were always higher than 88%. The study of the performance of the considered nozzle models showed that the best simulation was obtained for the high-flow-rate nozzles at 120° and 90°, imposing a pressure of 0.5 bar. Under these conditions, precipitation intensity values, similar to those of natural rain (50–70 mm/h), were obtained, also registering excellent uniform spatial distributions within a large circular area with a diameter of 1.5 m.
Adjusting the operating pressure, for varying the intensity during the rainfall simulation, proved to be ineffective, as it led to variations in the precipitation distribution: for instance, the intensity increased in some areas despite pressure reductions. Instead, a more effective approach was to maintain a constant pressure and modify the nozzle model, thereby modifying the nozzle spray angle. Using nozzles with the same characteristic curve but different angles was a viable strategy for 120° and 90° nozzles, but not for 60° and 45° nozzles, which were determined to be unsuitable for hydrological applications.
In conclusion, these findings represent preliminary tests to verify the reliability of the proposed simulator for studying hydrological processes. In particular, the results of this study underlined the importance of recalibrating the manufacturer’s nozzle characteristic curves and testing the rainfall intensity spatial distribution to select the most reliable nozzles. Specific experimental investigations are required to energetically characterize each simulated rainfall and for exploring different falling heights, considering that these factors influence the rainfall intensity uniformity distribution, the raindrop velocity, and, potentially, the droplet size. The future analysis will allow for a complete characterization of the proposed rainfall simulator.
Moreover, a new simulator, composed of multiple nozzles of the same model, will be designed for enabling the simulation of precipitation in larger plot areas, having a known average rainfall intensity value and spatial distribution for larger sampling areas.
Author Contributions
Conceptualization, M.A.S., R.C., F.G.C., V.B., V.F. and A.N.; methodology, M.A.S., R.C., F.G.C., V.B., V.F. and A.N.; validation, M.A.S., R.C., F.G.C., V.B., V.F. and A.N.; formal analysis, M.A.S., R.C., F.G.C., V.B., V.F. and A.N.; investigation, M.A.S., R.C., F.G.C., V.B., V.F. and A.N.; data curation, M.A.S., R.C., F.G.C., V.B., V.F. and A.N.; writing—original draft preparation, M.A.S., R.C., F.G.C., V.B., V.F. and A.N.; writing—review and editing, M.A.S., R.C., F.G.C., V.B., V.F. and A.N.; visualization, M.A.S., R.C., F.G.C., V.B., V.F. and A.N.; supervision, F.G.C., V.B. and V.F.; funding acquisition, F.G.C. All authors have read and agreed to the published version of the manuscript.
Funding
This research was funded by the Sicilian Micronanotech Research And Innovation Center “SAMOTHRACE” (MUR, PNRR-M4C2, ECS_00000022) and spoke 3—Università degli Studi di Palermo “S2-COMMs—Micro and Nanotechnologies for Smart & Sustainable Communities”.
Data Availability Statement
The data presented in this study are available on request from the corresponding author.
Conflicts of Interest
The authors declare no conflicts of interest.
References
- Meyer, L.D. Simulation of rainfall for soil erosion research. Trans. ASAE 1965, 8, 63–65. [Google Scholar] [CrossRef]
- Aksoy, H.; Unal, N.E.; Cokgor, S.; Gedikli, A.; Yoon, J.; Koca, K.; Boran Inci, S.; Eris, E. A rainfall simulator for laboratory-scale assessment of rainfall-runoff-sediment transport processes over a two-dimensional flume. Catena 2012, 98, 63–72. [Google Scholar] [CrossRef]
- Iserloh, T.; Ries, J.B.; Arnáez, J.; Boix-Fayos, C.; Butzen, V.; Cerdà, A.; Echeverría, M.T.; Fernández-Gálvez, J.; Fister, W.; Geißler, C.; et al. European small portable rainfall simulators: A comparison of rainfall characteristics. Catena 2013, 110, 100–112. [Google Scholar] [CrossRef]
- Lassu, T.; Seeger, M.; Peters, P.; Keesstra, S.D. The Wageningen rainfall simulator: Set-up and calibration of an indoor nozzle-type rainfall simulator for soil erosion studies. Land Degrad. Dev. 2015, 26, 604–612. [Google Scholar] [CrossRef]
- Vergni, L.; Todisco, F.; Vinci, A. Setup and calibration of the rainfall simulator of the Masse experimental station for soil erosion studies. Catena 2018, 167, 448–455. [Google Scholar] [CrossRef]
- Mhaske, S.N.; Pathak, K.; Basak, A. A comprehensive design of rainfall simulator for the assessment of soil erosion in the laboratory. Catena 2019, 172, 408–420. [Google Scholar] [CrossRef]
- Fernández-Raga, M.; Rodríguez, I.; Caldevilla, P.; Búrdalo, G.; Ortiz, A.; Martínez-García, R. Optimization of a Laboratory Rainfall Simulator to Be Representative of Natural Rainfall. Water 2022, 14, 3831. [Google Scholar] [CrossRef]
- Neal, J.H. The Effect of the Degree of Slope and Rainfall Characteristics on Runoff and Soil Erosion; University of Missouri, College of Agriculture, Agricultural Experiment Station: Columbia, MO, USA, 1938. [Google Scholar]
- Wilm, H.G. The application and measurement of artificial rainfall on types FA and F infiltrometers. Eos Trans. Am. Geophys. Union 1943, 24, 480–487. [Google Scholar] [CrossRef]
- Adams, J.E.; Kirkham, D.; Nielsen, D.R. A portable rainfall-simulator infiltrometer and physical measurements of soil in place. Soil Sci. Soc. Am. J. 1957, 21, 473–477. [Google Scholar] [CrossRef]
- Hudson, N.W. The Influence of Rainfall on the Mechanics of Soil Erosion: With Particular Reference to Southern Rhodesia. Master’s Thesis, University of Cape Town, Cape Town, South Africa, 1965. [Google Scholar]
- Bryan, R.B. A simulated rainfall test for the prediction of soil erodibility. Z. Geomorphol. 1974, 21, 138–150. [Google Scholar]
- Imeson, A.C. A simple field-portable rainfall simulator for difficult terrain. Earth Surf. Process. 1977, 2, 431–436. [Google Scholar] [CrossRef]
- De Ploey, J. Crusting and time-dependent rainwash mechanisms on loamy soil. In Soil Conservation, Problems and Prospects; Morgan, R.P.C., Ed.; Wiley: Hoboken, NJ, USA, 1981; pp. 139–154. [Google Scholar]
- Farres, P.J. The dynamics of rainsplash erosion and the role of soil aggregate stability. Catena 1987, 14, 119–130. [Google Scholar] [CrossRef]
- Roth, C.H.; Meyer, B.; Frede, H.G. A portable rainfall simulator for studying factors affecting runoff, infiltration and soil loss. Catena 1985, 12, 79–85. [Google Scholar] [CrossRef]
- Luk, S.H. Effect of antecedent soil moisture content on rainwash erosion. Catena 1985, 12, 129–139. [Google Scholar] [CrossRef]
- Kamphorst, A. A small rainfall simulator for the determination of soil erodibility. Neth. J. Agric. Sci. 1987, 35, 407–415. [Google Scholar] [CrossRef]
- Norton, L. Micromorphological study of surface seals developed under simulated rainfall. Geoderma 1987, 40, 127–140. [Google Scholar] [CrossRef]
- Calvo, A.; Gisbert, J.M.; Palau, E.; Romero, M. Un simulador de lluvia portátil de fácil construcción. In Métodos y Técnicas para la Medición en el Campo de Procesos Geomorfológicos; Sala, M., Gallart, F., Eds.; Sociedad Española de Geología: Zaragoza, Spain, 1988; Volume 1, pp. 6–15. [Google Scholar]
- Poesen, J.; Ingelmo-Sanchez, F.; Mucher, H. The hydrological response of soil surfaces to rainfall as affected by cover and position of rock fragments in the top layer. Earth Surf. Process. Landf. 1990, 15, 653–671. [Google Scholar] [CrossRef]
- Cerdà, A.; Ibáñez, S.; Calvo, A. Design and operation of a small and portable rainfall simulator for rugged terrain. Soil Technol. 1997, 11, 163–170. [Google Scholar] [CrossRef]
- Torri, D.; Regüés, D.; Pellegrini, S.; Bazzoffi, P. Within-storm soil surface dynamics and erosive effects of rainstorms. Catena 1999, 38, 131–150. [Google Scholar] [CrossRef]
- Battany, M.C.; Grismer, M.E. Development of a portable field rainfall simulator for use in hillside vineyard runoff and erosion studies. Hydrol. Process. 2000, 14, 1119–1129. [Google Scholar] [CrossRef]
- Regmi, T.P.; Thompson, A.L. Rainfall simulator for laboratory studies. Appl. Eng. Agric. 2000, 16, 641–647. [Google Scholar] [CrossRef]
- Loch, R.J.; Robotham, B.G.; Zeller, L.; Masterman, N.; Orange, D.N.; Bridge, B.J.; Sheridan, G.J.; Bourke, J.J. A multi-purpose rainfall simulator for field infiltration and erosion studies. Soil Res. 2001, 39, 599–610. [Google Scholar] [CrossRef]
- Martínez-Mena, M.; Abadía, R.; Castillo, V.; Albaladejo, J. Diseño experimental mediante lluvia simulada para el estudio de los cambios en la erosión del suelo durante la tormenta. Cuatern. Geomorfol. 2001, 15, 31–43. [Google Scholar]
- Humphry, J.B.; Daniel, T.C.; Edwards, D.R.; Sharpley, A.N. A portable rainfall simulator for plot–scale runoff studies. Appl. Eng. Agric. 2002, 18, 199–204. [Google Scholar] [CrossRef]
- Blanquies, J.; Scharff, M.; Hallock, B. The design and construction of a rainfall simulator. In Proceedings of the International Erosion Control Association (IECA), 34th Annual Conference and Expo, Las Vegas, NV, USA, 24–28 February 2003. [Google Scholar]
- Regüés, D.; Gallart, F. Seasonal patterns of runoff and erosion responses to simulated rainfall in a badland area in Mediterranean mountain conditions (Vallcebre, southeastern Pyrenees). Earth Surf. Process. Landf. 2004, 29, 755–767. [Google Scholar] [CrossRef]
- Birt, L.N.; Persyn, R.A.; Smith, P.K. Evaluation of an indoor nozzle-type rainfall simulator. Appl. Eng. Agric. 2007, 23, 283–287. [Google Scholar] [CrossRef]
- Clarke, M.A.; Walsh, R.P. A portable rainfall simulator for field assessment of splash and slopewash in remote locations. Earth Surf. Process. Landf. J. Br. Geomorphol. Res. Group 2007, 32, 2052–2069. [Google Scholar] [CrossRef]
- Alves Sobrinho, T.; Gómez-Macpherson, H.; Gómez, J.A. A portable integrated rainfall and overland flow simulator. Soil Use Manag. 2008, 24, 163–170. [Google Scholar] [CrossRef]
- Nadal-Romero, E.; Regüés, D. Detachment and infiltration variations as consequence of regolith development in a Pyrenean badland system. Earth Surf. Process. Landf. 2009, 34, 824–838. [Google Scholar] [CrossRef]
- Abudi, I.; Carmi, G.; Berliner, P. Rainfall simulator for field runoff studies. J. Hydrol. 2012, 454, 76–81. [Google Scholar] [CrossRef]
- Ries, J.B.; Iserloh, T.; Seeger, M.; Gabriels, D. Rainfall simulations-constraints, needs and challenges for a future use in soil erosion research. Z. Geomorphol. Suppl. 2013, 57, 1–10. [Google Scholar] [CrossRef]
- Rončević, V.; Živanović, N.; van Boxel, J.H.; Iserloh, T.; Štrbac, S. Dripping rainfall simulators for soil research—Performance review. Water 2023, 15, 1314. [Google Scholar] [CrossRef]
- Eijkelkamp. Rainfall Simulator—Operating Instructions, M-0906E; Eijkelkamp: Giesbeek, The Netherlands, 2022; Available online: https://www.royaleijkelkamp.com/media/1awdmlno/m-0906e-rainfall-simulator.pdf (accessed on 10 April 2025).
- Carollo, F.G.; Caruso, R.; Ferro, V.; Serio, M.A. Characterizing the Kamphorst rainfall simulator for soil erosion investigations. J. Hydrol. 2024, 643, 132025. [Google Scholar] [CrossRef]
- Serio, M.A.; Carollo, F.G.; Caruso, R.; Ferro, V. Guidelines for the Energetic Characterization of a Portable Drip-Type Rainfall Simulator for Soil Erosion Research. Water 2024, 16, 2100. [Google Scholar] [CrossRef]
- Bowyer-Bower, T.A.S.; Burt, T.P. Rainfall simulators for investigating soil response to rainfall. Soil Technol. 1989, 2, 1–16. [Google Scholar] [CrossRef]
- Naves, J.; Anta, J.; Suárez, J.; Puertas, J. Development and calibration of a new dripper-based rainfall simulator for large-scale sediment wash-off studies. Water 2020, 12, 152. [Google Scholar] [CrossRef]
- Cottenot, L.; Courtemanche, P.; Nouhou-Bako, A.; Darboux, F. A rainfall simulator using porous pipes as drop former. Catena 2021, 200, 105101. [Google Scholar] [CrossRef]
- Corona, R.; Wilson, T.; D’Adderio, L.P.; Porcù, F.; Montaldo, N.; Albertson, J. On the estimation of surface runoff through a new plot scale rainfall simulator in Sardinia, Italy. Procedia Environ. Sci. 2013, 19, 875–884. [Google Scholar] [CrossRef]
- Lascelles, B.; Favis-Mortlock, D.T.; Parsons, A.J.; Guerra, A.J.T. Spatial and temporal variation in two rainfall simulators: Implications for spatially explicit rainfall simulation experiments. Earth Surf. Process. Landf. 2000, 25, 709–721. [Google Scholar] [CrossRef]
- Boulal, H.; Gómez-Macpherson, H.; Gómez, J.A.; Mateos, L. Effect of soil management and traffic on soil erosion in irrigated annual crops. Soil Tillage Res. 2011, 115, 62–70. [Google Scholar] [CrossRef]
- Christiansen, J.E. Irrigation by Sprinkling; University of California: Berkeley, CA, USA, 1942; Volume 4. [Google Scholar]
- Karmeli, D. Estimating sprinkler distribution patterns using linear regression. Trans. ASAE 1978, 21, 682–0686. [Google Scholar] [CrossRef]
- Esteves, M.; Planchon, O.; Lapetite, J.M.; Silvera, N.; Cadet, P. The ‘EMIRE’ large rainfall simulator: Design and field testing. Earth Surf. Process. Landf. 2000, 25, 681–690. [Google Scholar] [CrossRef]
- Costa, A.R.D.S.; Alvarenga, L.A.; Thebaldi, M.S.; Melo, P.A.; Colombo, A.; Isidoro, J.M.G.P. Portable rainfall simulator: Evaluation and suitability of plot geometry to improve rainfall uniformity. Eng. Sanit. Ambient. 2023, 28, e20220198. [Google Scholar] [CrossRef]
- Green, D.; Pattison, I. Christiansen uniformity revisited: Re-thinking uniformity assessment in rainfall simulator studies. Catena 2022, 217, 106424. [Google Scholar] [CrossRef]
- ASABE. Design and Installation of Micro-Irrigation Systems; American Society of Agricultural Engineers: St. Joseph, MI, USA, 1994. [Google Scholar]
- Iserloh, T.; Fister, W.; Seeger, M.; Willger, H.; Ries, J.B. A small portable rainfall simulator for reproducible experiments on soil erosion. Soil Tillage Res. 2012, 124, 131–137. [Google Scholar] [CrossRef]
Disclaimer/Publisher’s Note: The statements, opinions and data contained in all publications are solely those of the individual author(s) and contributor(s) and not of MDPI and/or the editor(s). MDPI and/or the editor(s) disclaim responsibility for any injury to people or property resulting from any ideas, methods, instructions or products referred to in the content. |
© 2025 by the authors. Licensee MDPI, Basel, Switzerland. This article is an open access article distributed under the terms and conditions of the Creative Commons Attribution (CC BY) license (https://creativecommons.org/licenses/by/4.0/).