Article

Comparative Study on Consumers’ Behavior Regarding Water Consumption Pattern

by
Horea-George Crișan
1,
Oana-Adriana Crișan
2,*,
Florina Șerdean
1,*,
Corina Bîrleanu
1 and
Marius Pustan
1
1
Mechanical Systems Engineering Department, Faculty of Industrial Engineering, Robotics and Production Management, Technical University of Cluj-Napoca, European University of Technology, European Union, 400641 Cluj-Napoca, Romania
2
Micro-Nano Systems Laboratory, Technical University of Cluj-Napoca, 400641 Cluj-Napoca, Romania
*
Authors to whom correspondence should be addressed.
Water 2025, 17(12), 1755; https://doi.org/10.3390/w17121755
Submission received: 25 April 2025 / Revised: 4 June 2025 / Accepted: 6 June 2025 / Published: 11 June 2025
(This article belongs to the Special Issue Mathematical and Statistical Modeling Methods in Wastewater Treatment)

Abstract

:
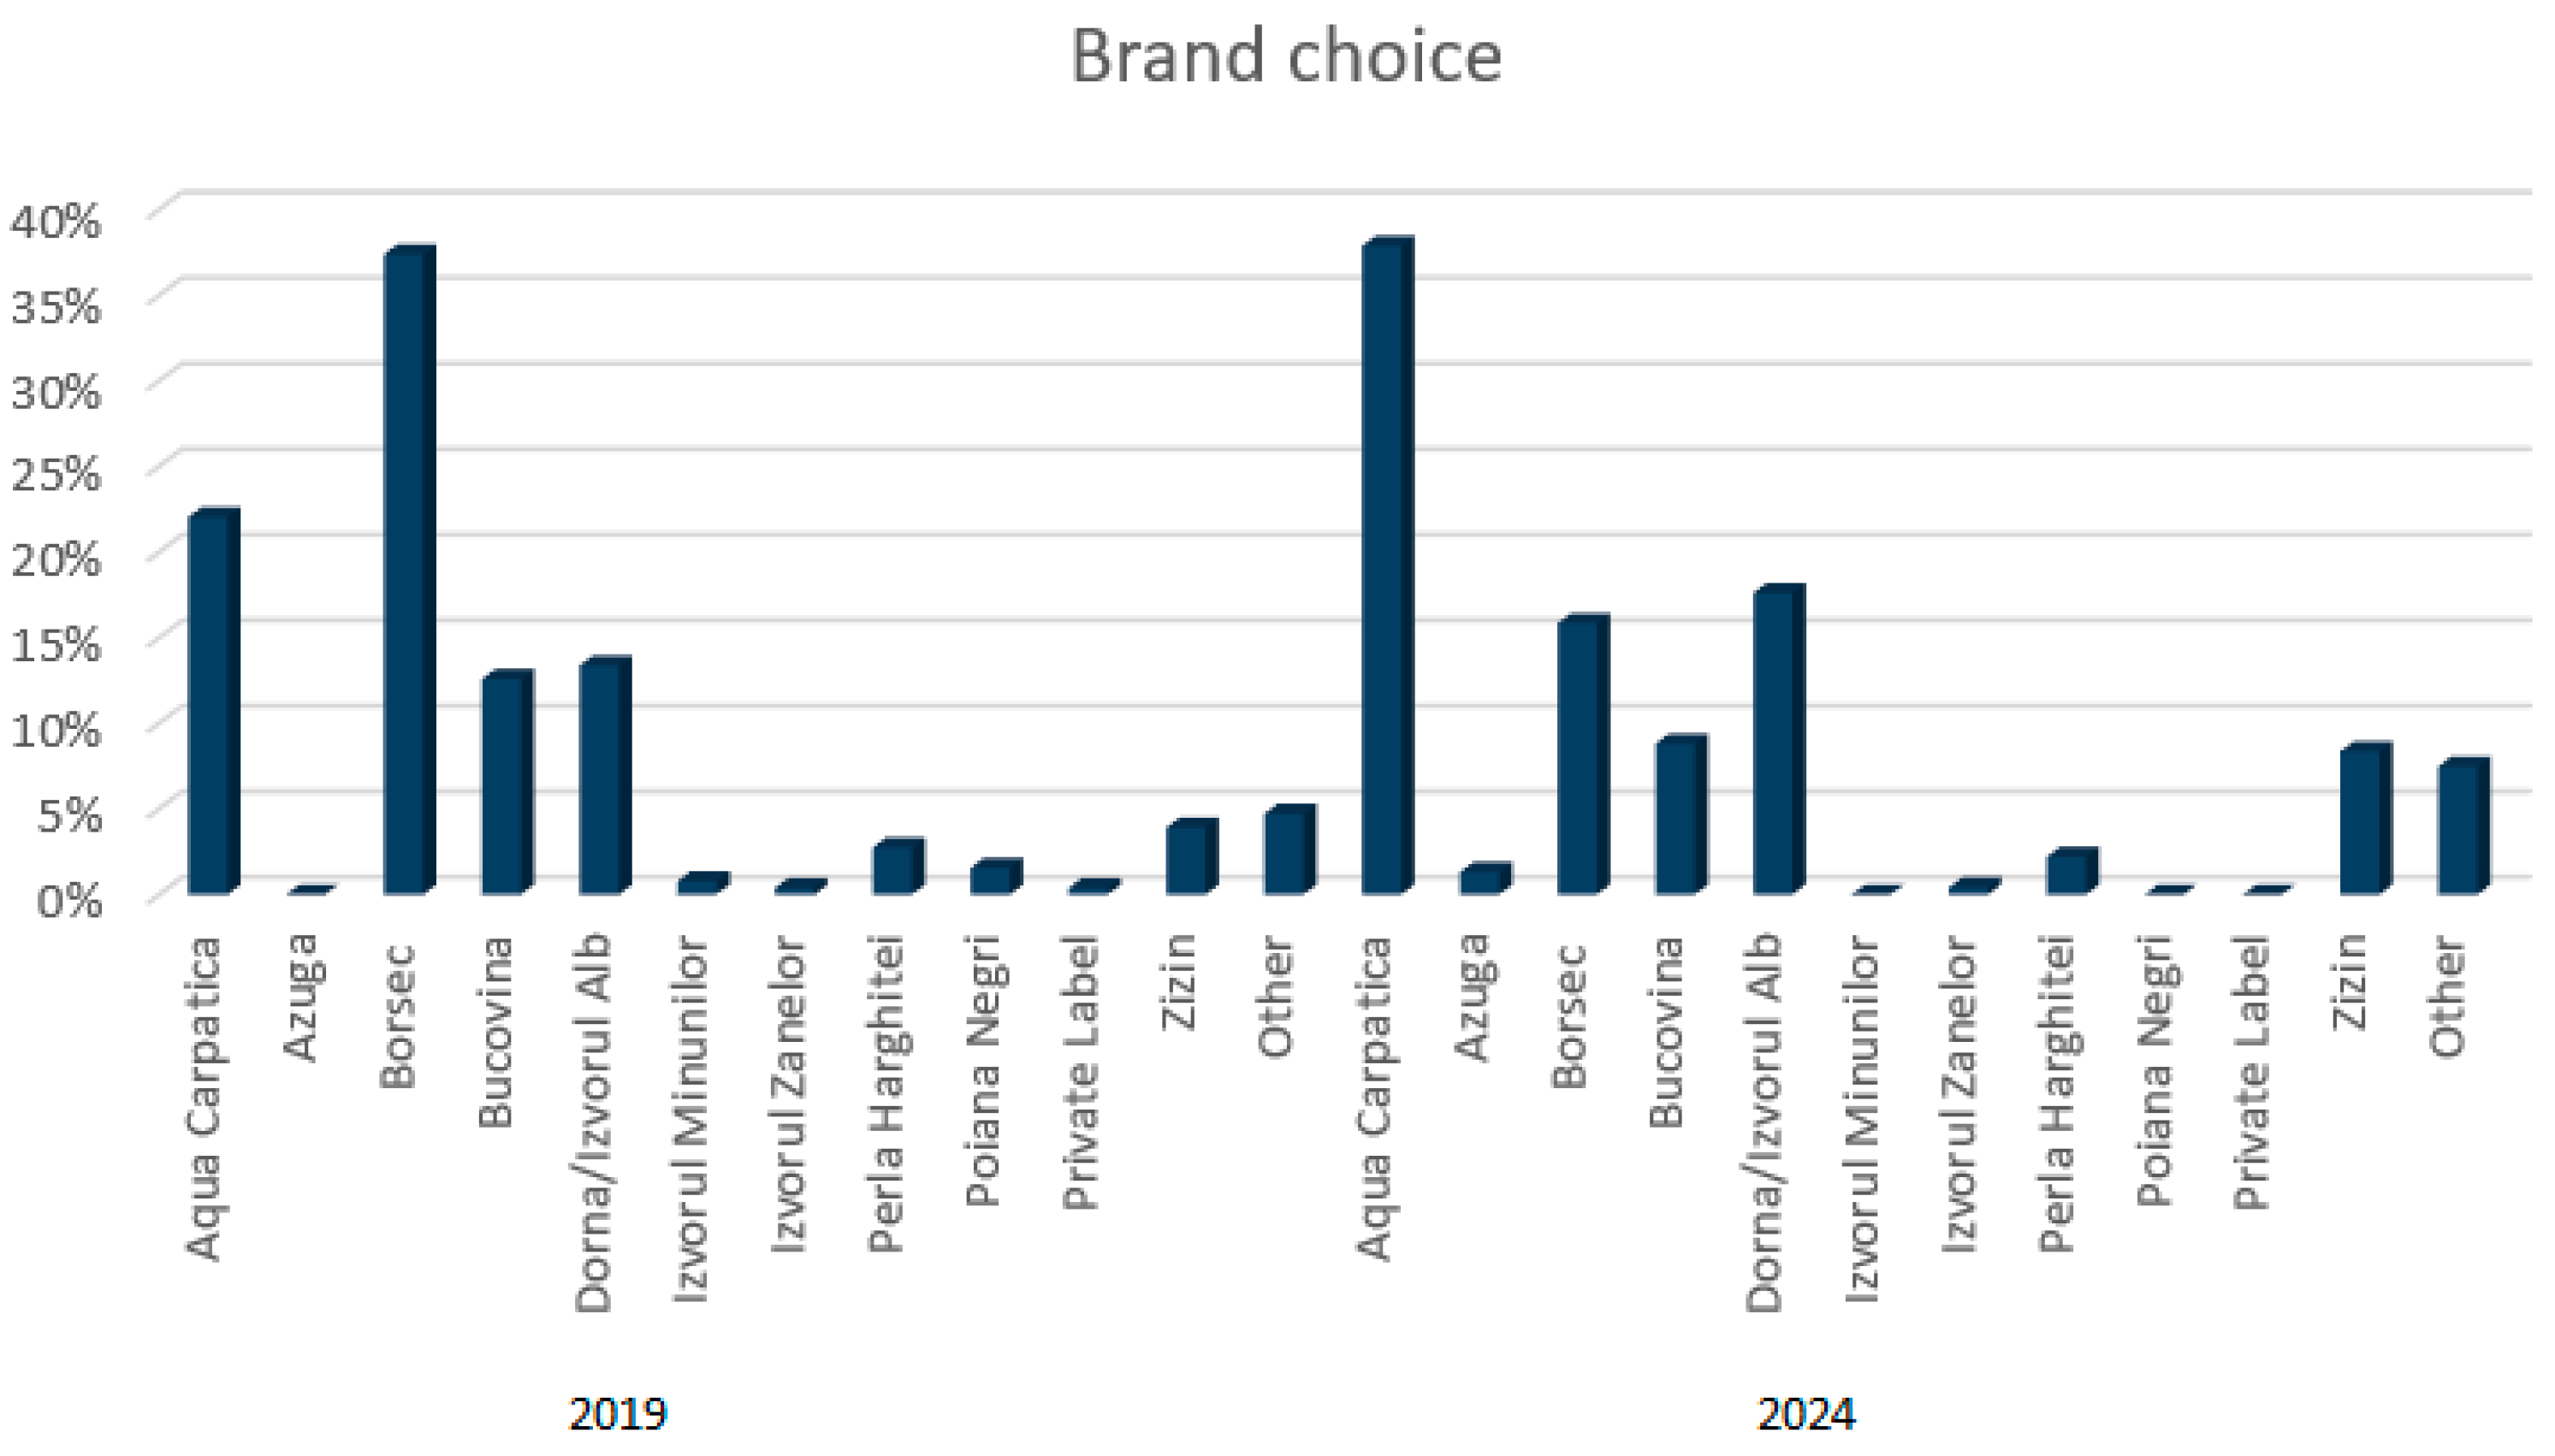
The quality of water and its impact on consumers’ health has been studied extensively, along with concerns surrounding the use of polyethylene terephthalate (PET) packaging. This research aimed to analyze consumer behavior regarding water consumption patterns, with a focus on sustainability, packaging preferences, and perceptions of drinking water quality. Two surveys, conducted in 2019 and 2024, used a 23-question structured questionnaire to assess the public willingness to prevent water waste in the context of the circular economy. The surveys addressed consumer identification, drinking water preferences, the awareness of alternative consumption methods, and the openness to sustainable solutions such as water filters. Key quantitative findings showed a 10.4% increase in the amount of bottled water purchased in a single trip and a 12.1% rise in the frequency of weekly purchases, particularly among women and younger consumers. Simultaneously, a 4% increase in the preference for PET packaging over glass raised concerns about environmental sustainability, while the preference for tap water dropped by 5%, correlated with a 4.2% decline in the perceived tap water quality. The brand preference also shifted notably, with Aqua Carpatica rising to 38% and Borsec declining from 37% to 16%, reflecting the influence of purity-focused marketing. The novelty of the approach lay in identifying emerging trends related to sustainability, health, and circular economy principles. A comparative analysis of Romanian citizens’ responses over time highlighted changing perceptions of water use and waste reduction. To support the analysis, 13 statistical indicators were evaluated, a Spearman correlation test was applied to 13 criteria, descriptive statistics were computed, and a t-test was conducted across eight hypotheses.

1. Introduction

1.1. Context

Water is one of the most important resources on Earth. Climate change has led to a crisis in terms of its quality, so that over the last hundred years its pollution has increased. Currently, the water quality crisis has led to strict management being applied to water quality through laws specific to each country. In the EU, the basic norm is the Framework Directive on Water (WFD), 2000/60/EC [1]. It is widely accepted as the most substantial and ambitious piece of European environmental legislation to date. It was adopted in 2000 with the aim of establishing a framework for the management and protection of European waters, more precisely to restore their quality and also to be a possible model for future environmental regulations. The WFD requires EU Member States to manage their water optimally, prepare strategic river basin management plans and several operational measurement programs, and at the same time engage with stakeholders and the general public.
Its main objectives are
Extending water protection to all water categories;
Water management in hydrographic basins;
Combining emission limit values with environmental quality standards;
Ensuring that water prices provide adequate incentives to use water resources efficiently;
The closer involvement of citizens;
Simplifying water legislation.
Overall, the WFD was considered the first European directive to focus on environmental sustainability [2,3,4].

1.2. Bottled Water Versus Filtered Water

Over the years, many assumptions have been developed regarding the quality of bottled water versus tap water [5,6,7]. Recent studies have shown that water bottled in polyethylene terephthalate (PET) bottles can harm health [8,9,10,11]. Microplastics were detected in food boxes, food, and bottled water [12,13]. Also, the physicochemical properties of bottled water differ depending on the temperature and storage conditions [14,15,16].
Along with the development of the circular economy concept, systems aimed at improving the quality of water for consumers, in terms of both its taste and smell and the removal of micro- and nanoplastics, called water filters, have been adopted in the consumer market.
The novelty of this research lies in its long-term comparative study of shifting trends in sustainable water usage among Romanian citizens from 2019 to 2024, focusing particularly on health-related outcomes and their connection to circular economy principles. By examining changes in public perceptions towards alternative consumption practices—namely the shift from consuming PET-packaged bottled water to the use of water filters—this study provides detailed insights into how consumer behavior has evolved in light of environmental and health issues. The findings not only enrich the academic conversation surrounding sustainability and public health but also offer practical insights for manufacturers seeking to improve the quality and material sustainability of water filters in line with consumer expectations and future market needs.

1.3. Description of Research

The purpose of this research was to evaluate the attitude of consumers regarding their interest in purchasing the analyzed drinking water filtration systems intended for the domestic regime at the expense of purchasing water with PET-type packaging. The present study aimed to find out the preferences of domestic users and how they understand water consumption and would improve water in terms of its taste, quality, price ratio, circular economy factors, and so forth.
In Figure 1, the overall aspects and steps of our research are presented.
The secondary goal was to reflect how willing the population is to contribute to the prevention of water waste in the context of the circular economy. Quantitative analysis was used to examine consumer attitudes towards drinking water consumption, with surveys conducted using questionnaires as the primary working tools. Initially, they were used for pretesting so that they could be modified to fit the current questionnaire model. The first survey was carried out between March and July 2019, while the second was conducted between January and May 2024. The deliberate five-year interval between the two data collection points was chosen to capture long-term shifts in public perceptions of water use and waste reduction within the context of the circular economy. Reliable comparative analysis was ensured by the use of a consistent questionnaire structure and methodology across both surveys.
Although the survey periods did not entirely overlap, both included spring months, which we considered significant in minimizing potential seasonal biases in water consumption behavior. Moreover, participants were asked to reflect on their general habits rather than recent or specific events, helping to reduce recall bias. The focus of the study was primarily on behavioral trends and consumer attitudes, which are less susceptible to short-term seasonal fluctuation. These factors support the robustness and relevance of the comparative analysis presented.
No formal awareness campaigns or interventions were carried out by the authors between the two survey periods. However, the questionnaire included brief explanatory notes highlighting the potential health and environmental impacts of water consumption choices, aiming to inform participants without influencing their responses. This format was applied consistently in both the 2019 and 2024 surveys.
The questionnaire design was tested amongst the authors and a small group of anonymous people prior to dissemination.
The questionnaire applied during both periods consisted of a set of 23 questions divided into four parts:
Part I—This included a set of nine questions aimed at identifying the respondents.
Part II—This consisted of a set of eight questions regarding preferences and consumption patterns in relation to drinking water.
Part III—This contained two questions and focused on informing the respondents about the existence of alternative ways of consuming bottled drinking water.
Part IV—This consisted of the final four questions and aimed to raise awareness among the respondents about water waste and, implicitly, the effects on consumers’ health and to determine whether they would consider purchasing water filters as an alternative for household use.
Although the study was conducted in the region of Romania, the investigation results are more broadly applicable to areas outside of this country. Together with a thorough statistical examination of consumer attitudes and behavior, the five-year comparison approach offered important insights into global trends in sustainable water consumption. The observed changes in Romanian consumer attitudes can be used as a representative case study because environmental sustainability, public health, and achieving a decrease in plastic waste are issues that many nations, regardless of their population size, face. These observations could guide the creation of new products, policies, and public awareness campaigns in other areas going through similar ecological and socioeconomic changes.

2. Materials and Methods

2.1. Research Questions and Hypotheses

To conduct the longitudinal study, the “Google Forms” platform was used, and a questionnaire access link was generated using it. Each set of questionnaires was filled out over a period of 5 months, both online and by distributing them on various social media platforms. The content of the questionnaires is presented in Appendix A.
The most important objectives of the research described were as follows.
Objective 1: Identifying preferences and consumption patterns in regard to drinking water, pointing to possible health-jeopardizing behaviors.
Objective 2: Providing information about alternative ways of consuming drinking water.
Objective 3: Generating information regarding the most important features respondents desire from a household water filter.
Objective 4: Raising awareness about water waste caused by domestic users through the purchase of water in PET bottles and informing users through the questionnaire to shift towards buying water filters in order to protect the environment and their health.

2.2. Sampling and Recruitment

The whole study was composed of approximately 479 participants. For the first study, the research had 253 participants, while for the second one, there were 226 participants.
The participants were from different regions and cities in Romania. Both questionnaires yielded anonymous answers. The participants were asked to read an information sheet and consent to participation in the research study.
Questions requiring single-word or multiple-choice responses were included. The online questionnaire was distributed and the responses were gathered using Google Forms [17,18]. The survey involved interviewing a total of 479 random individuals over both periods from different regions of the country, with different ages, educational backgrounds, and occupations.
Efforts were made to recruit participants with similar demographic characteristics in both survey periods to ensure the validity of the comparisons. While the populations were not identical, they were comparable, thus supporting the relevance of the findings. Regarding participants’ education level, in 2019, 83 participants had graduated from high school and 168 had a university or post-university education, while in 2024, 78 had completed high school and 148 had engaged in higher education. Regarding participants’ socioeconomic status, in 2019, 174 participants reported a low income and 79 reported a medium or high income, while in 2024, 183 reported a low income and 43 reported a medium or high income. In 2019, the gender ratio was approximately 2:1 (female/male), while in 2024 the ratio shifted somewhat. However, each sample maintained a clear representation of both genders. The age distribution was also comparable, with the majority of participants in both surveys representing similar age groups. Information regarding household sizes was also considered. However, fewer than 10% of respondents in each survey period reported being married with children, as the majority of participants were either single or married without children. Given this demographic profile, the household size was not expected to substantially influence the overall purchasing patterns observed.

2.3. Research Methods

The examination detailed in this research comprised multiple successive stages. The first phase involved a descriptive–comparative statistical analysis focused on investigating consumer attitudes in Romania according to demographic traits. Particular statistical measures were computed, and comparative charts were created to emphasize the most significant criteria and the main elements affecting consumer behavior. These analyses were conducted on the complete sample of respondents.
To evaluate the strength and direction of correlations between demographic factors and those indicative of water consumption patterns, a Spearman correlation analysis was conducted. The aim was to verify the relationships between the variables being examined.
The outcomes of the correlation analysis showed specific connections among the variables, which highlighted the need for a more detailed investigation. This was accomplished by formulating hypotheses that were later evaluated using a two-sample t-test assuming equal variances as the statistical method. α = 0.05 was set as the significance level in all statistical analyses presented in this research, and p < 0.05 was considered to be statistically significant.
All the types of statistical analyses were performed using Microsoft Excel. The analyses were mainly comparative, seeking to demonstrate shifts in consumer behavior in Romania regarding preferences related to bottled water consumption and the amounts of bottled water consumed.

3. Results

3.1. Comparative Descriptive Statistics and Correlation Analysis

This section summarizes the 2019 and 2024 survey findings, highlighting how Romanian consumers have shifted toward using bottled water, especially with PET packaging, while their confidence in tap water has waned. Table 1 and Table 2 provide the key descriptive and correlational evidence that underpins these trends.
From 2019 to 2024, the average quantity bought per trip grew by 10.4 % (from 2.30 to 2.54 L) and the weekly purchase frequency by 12.1 % (from 3.07 to 3.44). Taken together, these two changes imply that roughly 24 % more bottled water entered the participants’ households each week. This rise likely reflects habits formed during the COVID-19 period—larger, less frequent shopping trips and increased home deliveries—that persisted after restrictions were lifted.
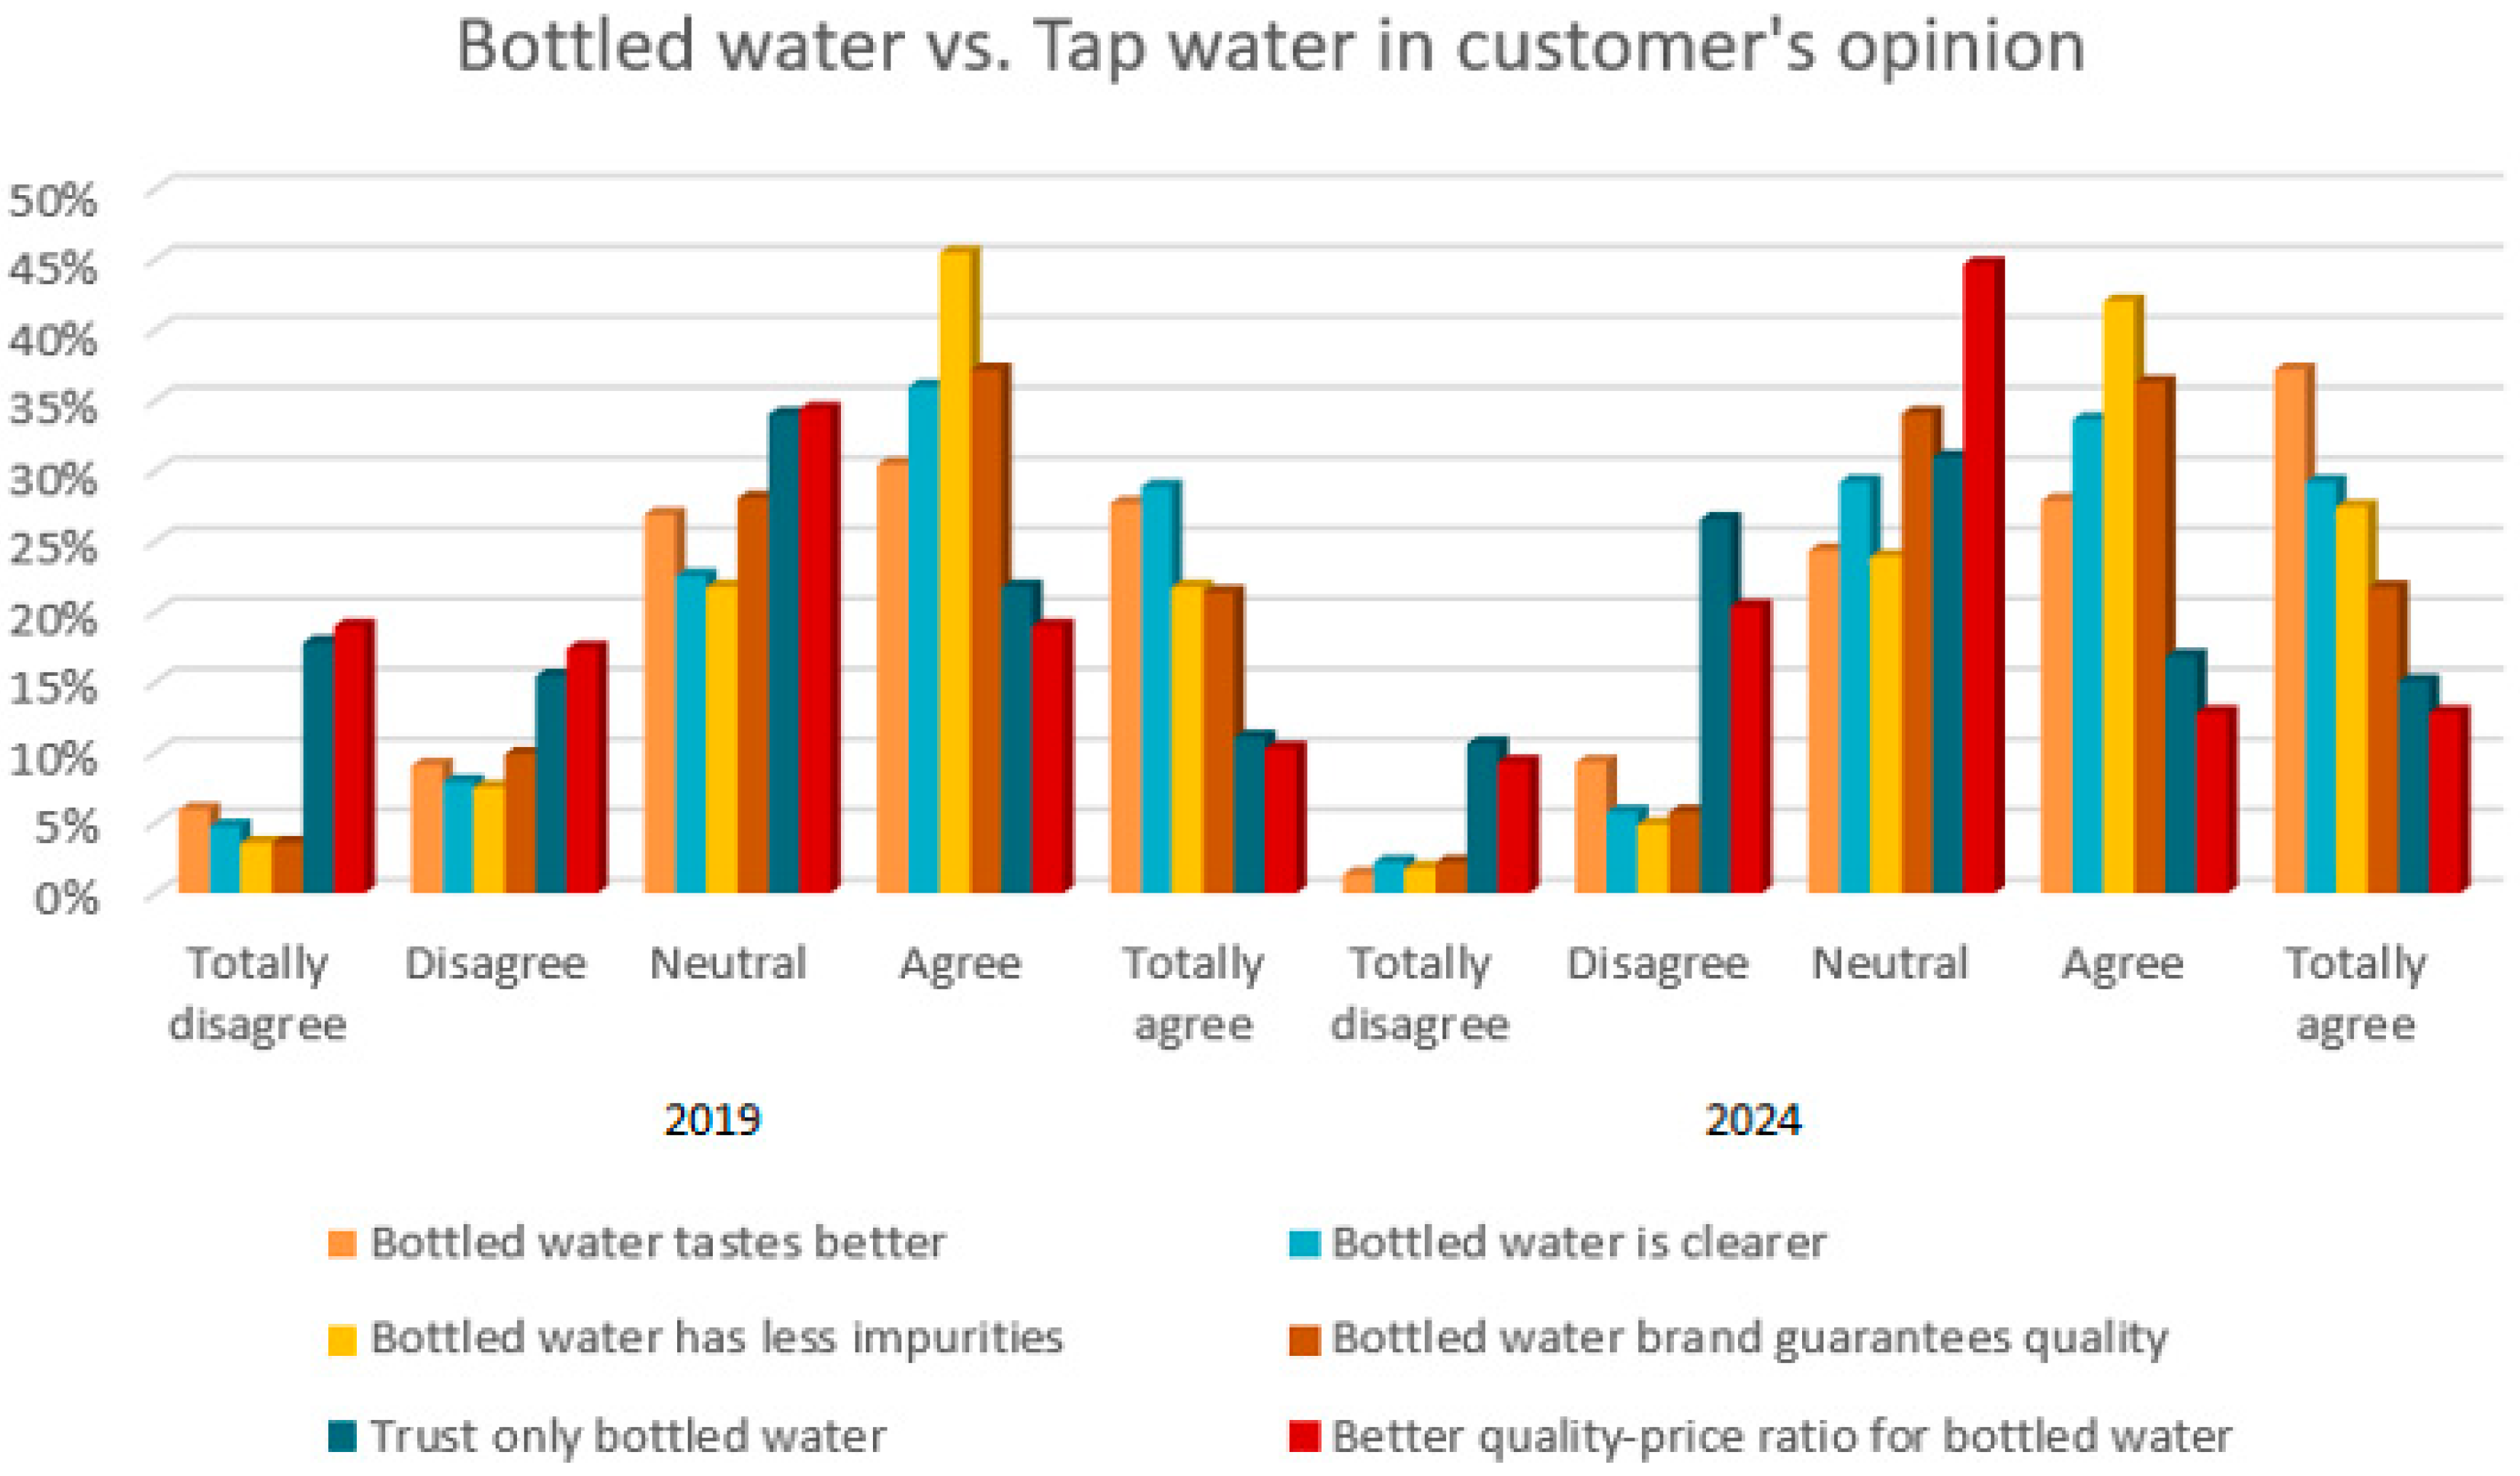
The survey responses also showed a 5 % fall in the tap water preference and a 4.2 % drop in its perceived quality (mean score of 6.88 to 6.59). Figure 2 visualizes this divergence: as the confidence in tap water eroded, the reliance on bottled alternatives intensified.
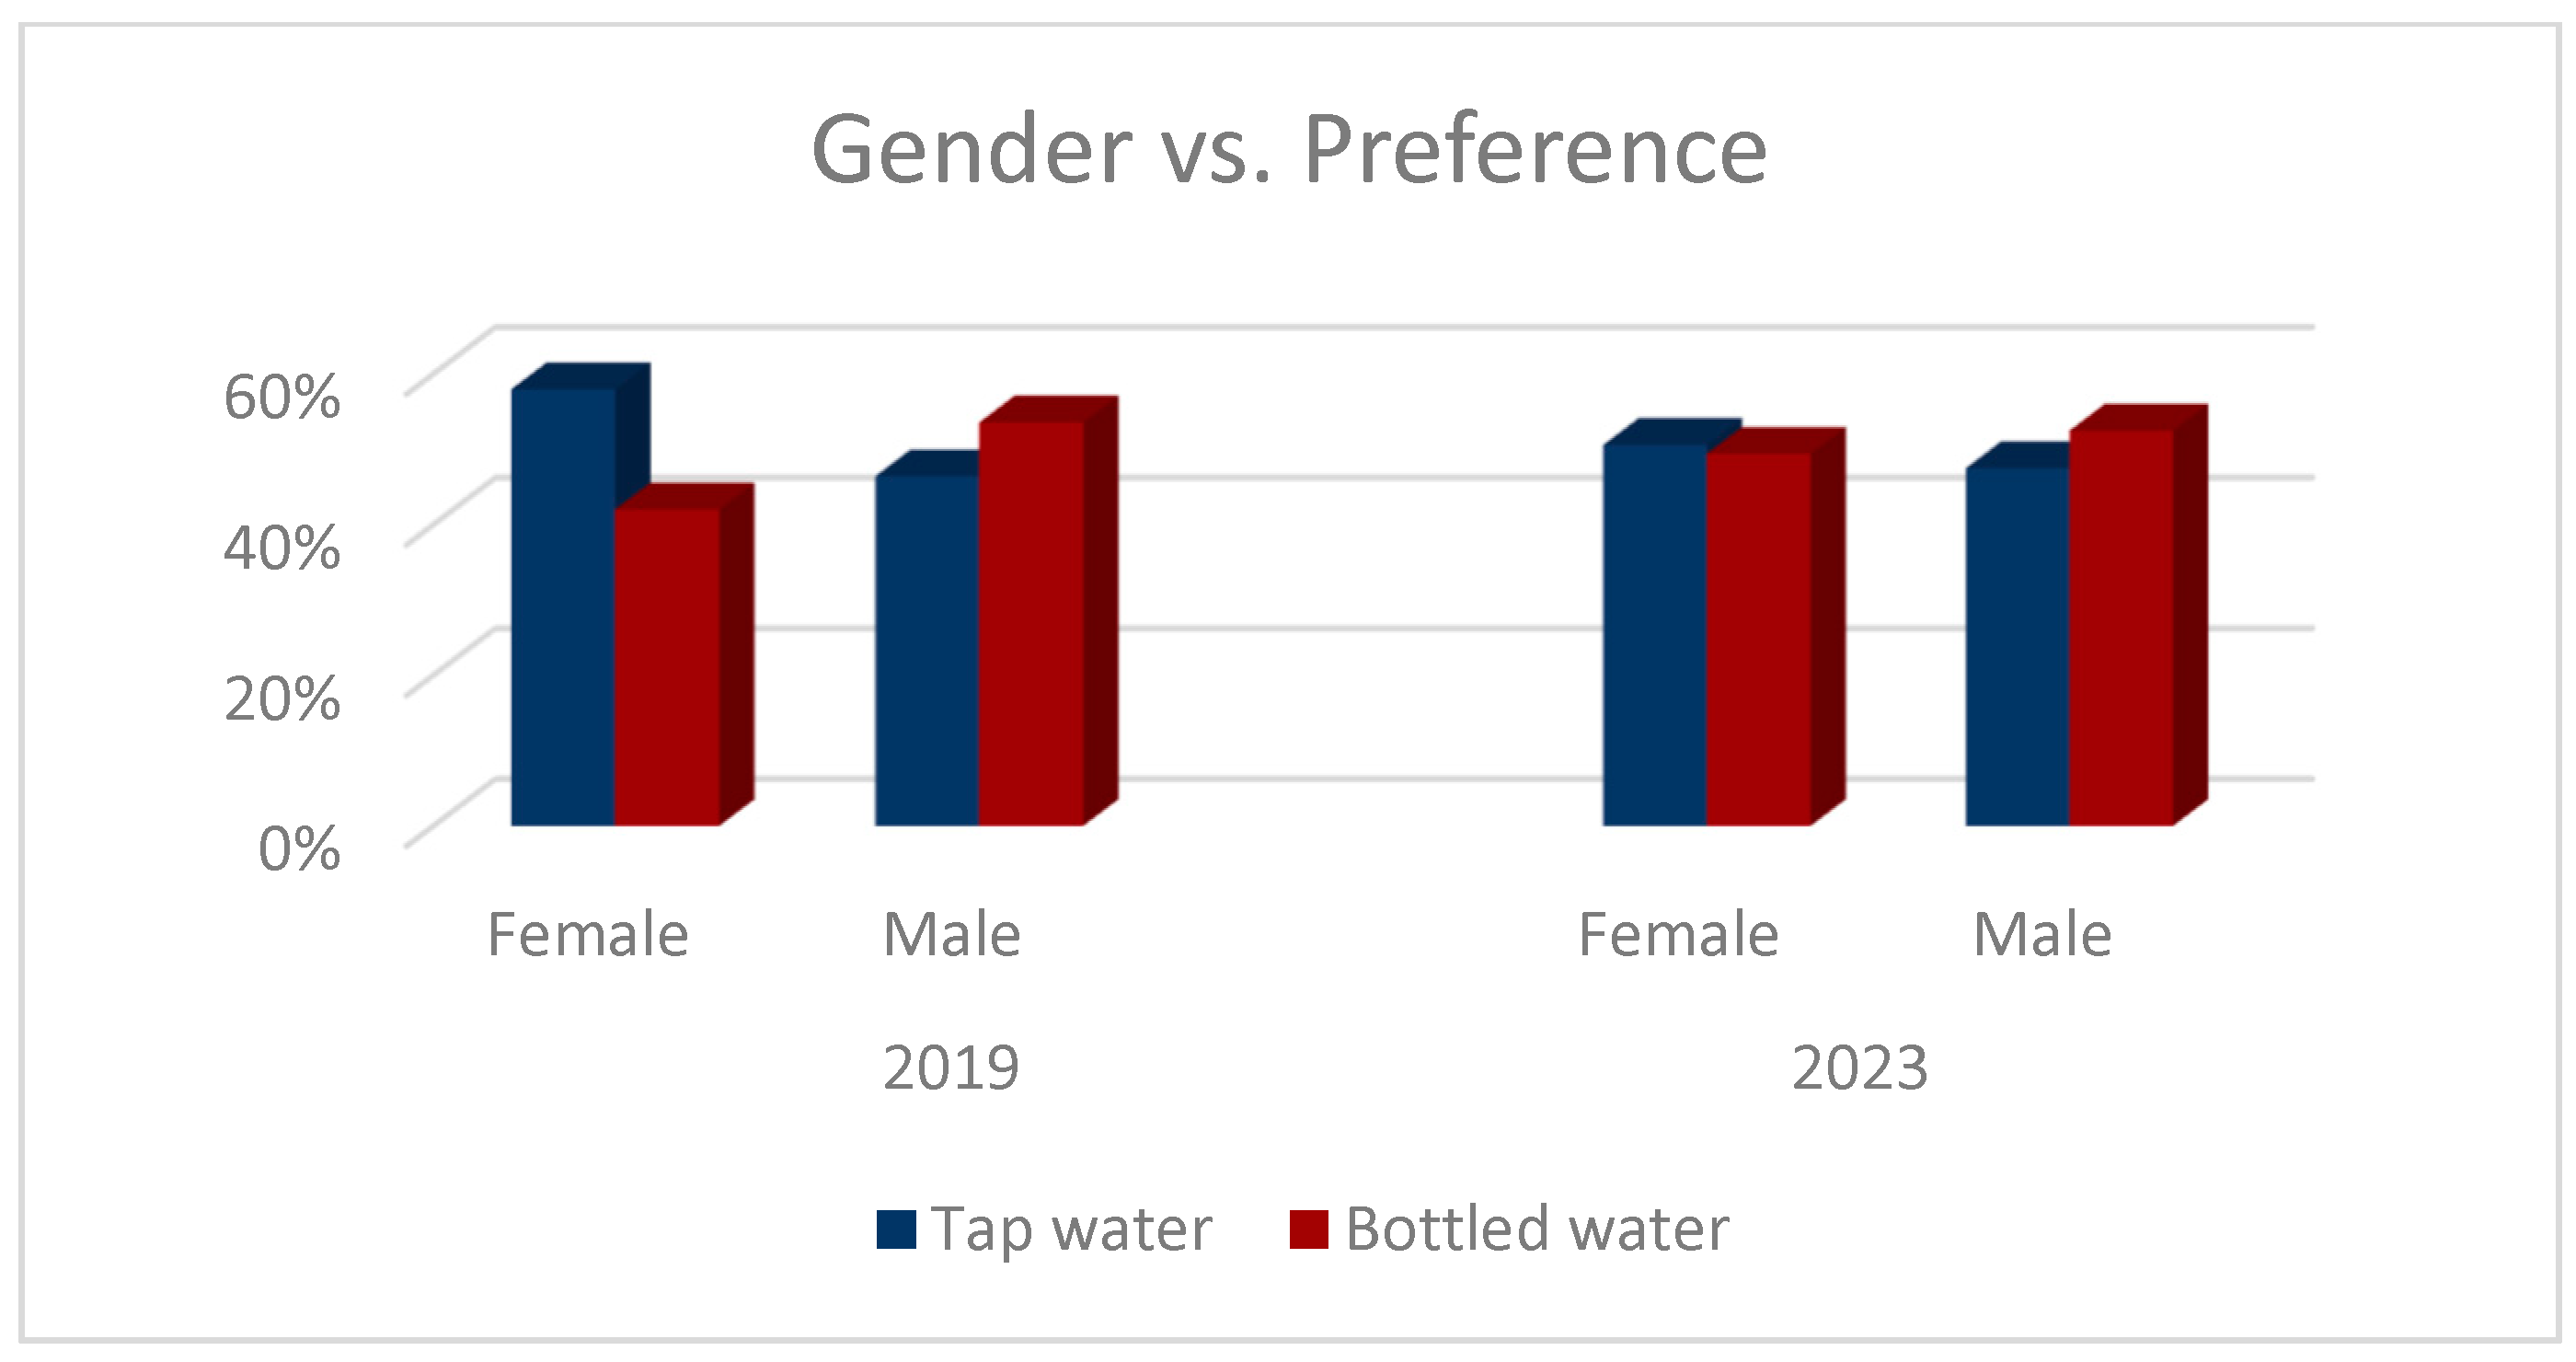
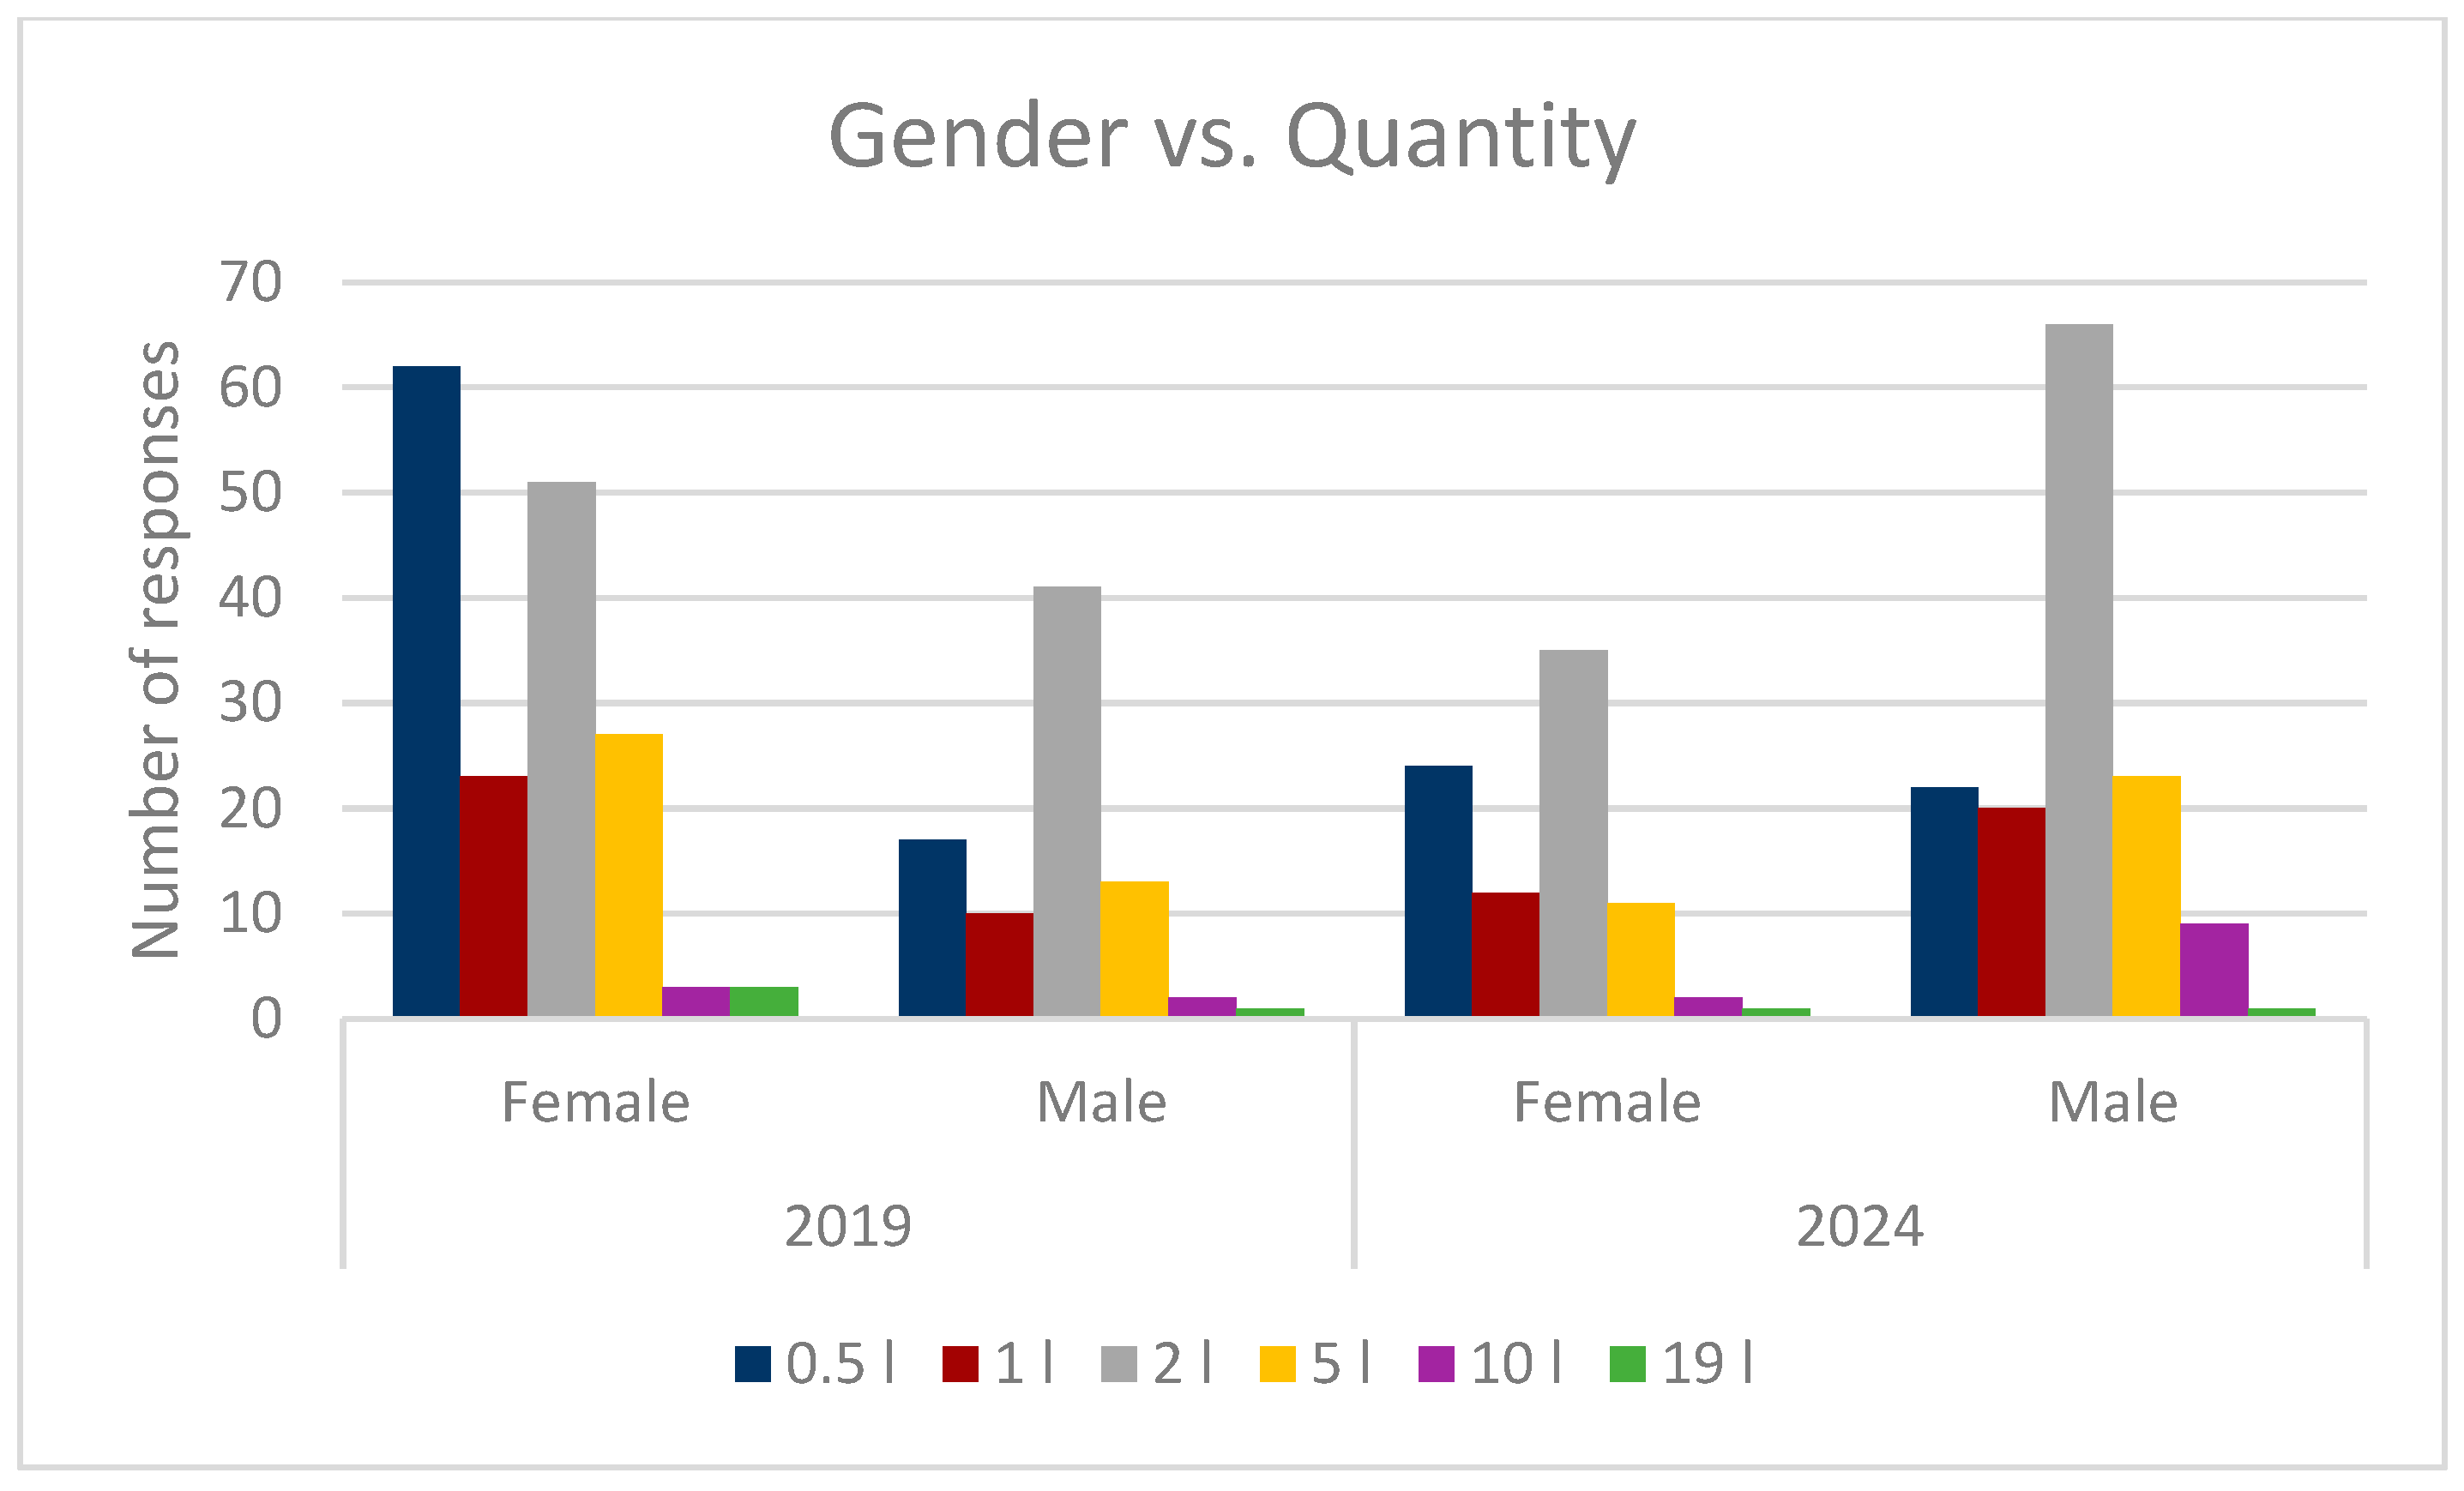
Gender differences became more pronounced over the five-year span. Women increased the frequency of their purchases more than men, whereas men continued to buy larger volumes per trip. These patterns are backed by positive correlations between the male gender and quantity (ρ (2019) = 0.129, ρ (2024) = 0.149, p < 0.05 for both) and a diminishing correlation with the frequency by 2024, indicating the convergence in different genders’ shopping routines (Figure 3 and Figure 4).
The bottled water volume per transaction rose across all income brackets. The steepest increase occurred in the lowest-income group, hinting at bulk-buying to lower the cost per liter (Figure 5). Although income–consumption correlations remained weak (Table 2), this direction was consistent across the board.
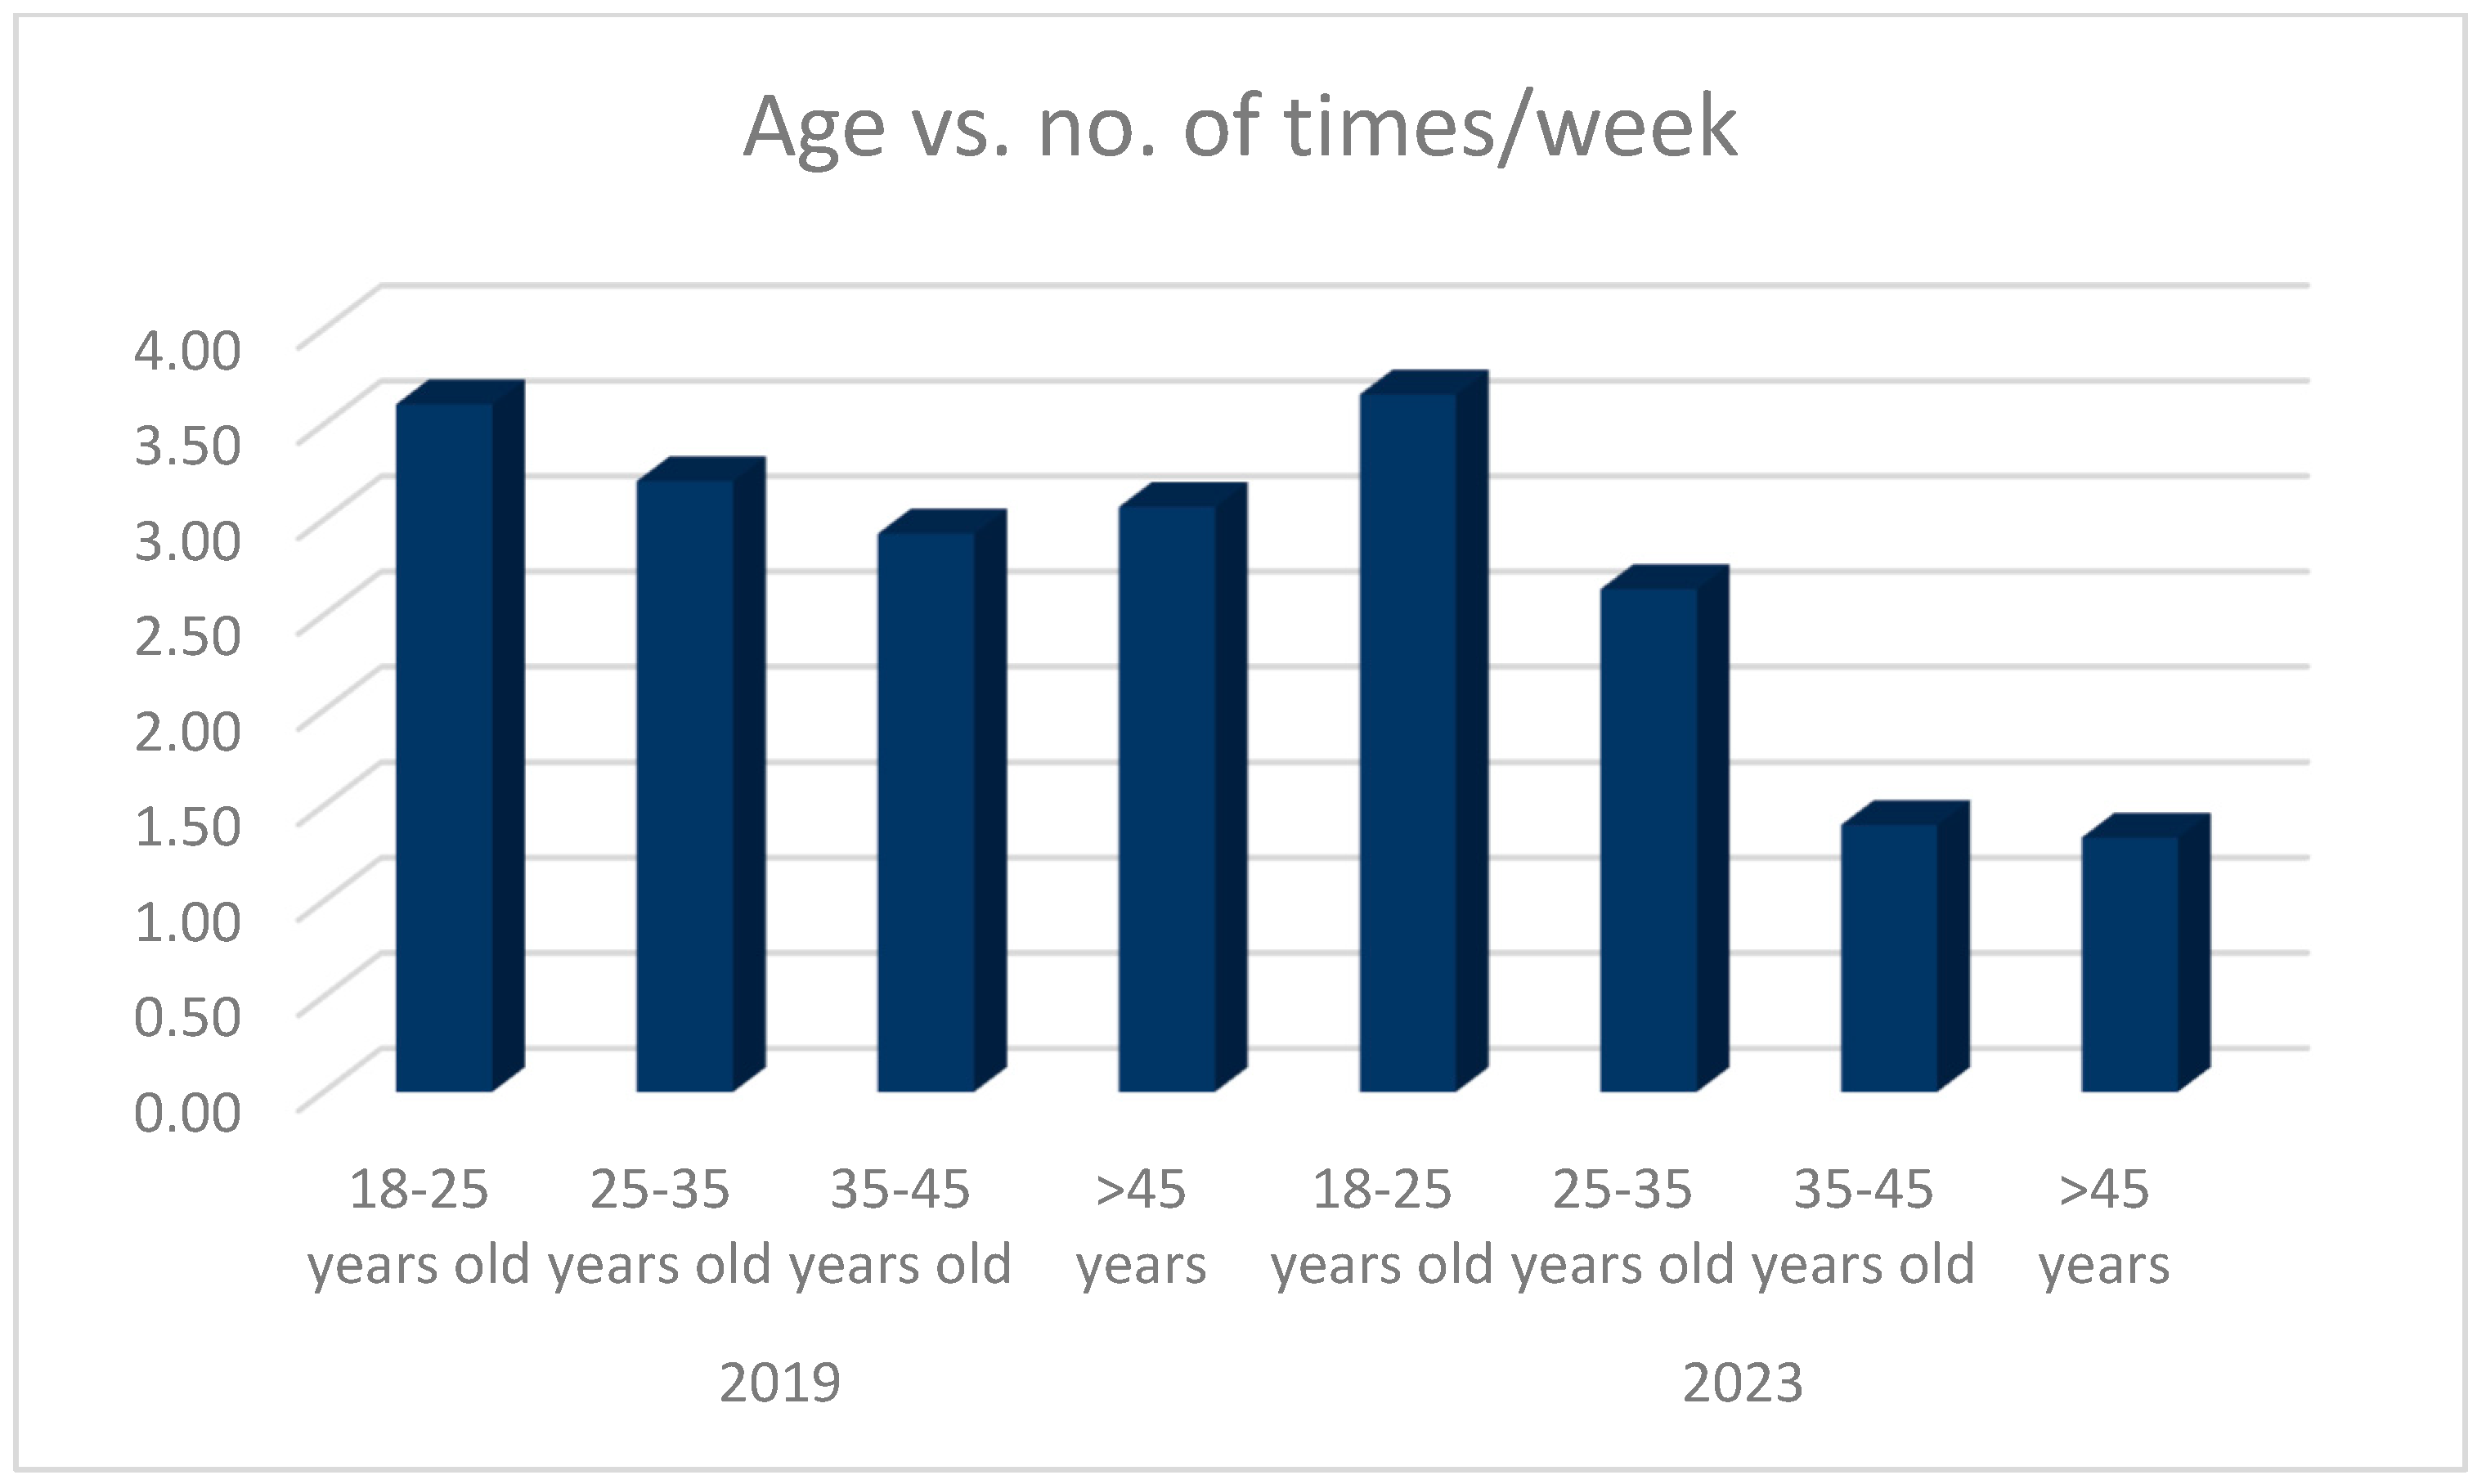
The age effects were clear: consumers aged 18–34 showed the largest uptick in their preference for bottled water and frequency of purchasing it. In 2024 age correlated negatively with both the bottled water preference (ρ = −0.153, p < 0.03) and purchase frequency (ρ = −0.295, p < 0.001), confirming young adults to be the main drivers of this trend (Figure 6).
Unmarried respondents also purchased bottled water more often and in larger quantities. Negative correlations between participants’ marital status and consumption variables for 2024 support this observation, underscoring lifestyle influences on purchasing behavior.
A critical environmental indicator came from the packaging choice: the preference for PET bottles increased from 88.2 % in 2019 to 92.5 % in 2024 (+4.3 %). Given the simultaneous fall in tap water use, this amplifies concerns about single-use-plastic waste.
Brand loyalty shifted sharply during the study period. Borsec’s share plunged from 37 % to 16 %, while Aqua Carpatica climbed to 38 %, benefitting from campaigns that emphasized purity and low amounts of nitrates (Figure 7).

3.2. Hypothesis Testing

The first hypothesis was formulated based on the following question: do women exhibit a higher awareness of sustainability and preventive health than men? Namely, if given the choice between purchasing bottled still water or water filters for household consumption, would the majority of female respondents opt not to buy bottled water in PET packaging, in order to protect the environment and their health? Therefore, the null and alternative hypotheses were as follows.
H0: 
The average number of water bottles with PET packaging bought by men is the same as the average number of water bottles with PET packaging bought by women.
Ha1: 
The average number of water bottles with PET packaging bought by men is greater than the average number of water bottles with PET packaging bought by women.
The descriptive statistics for the investigated variables are presented in Table 3 for both the studied years, while the results of the t-test are included in Table 4. The data included in Table 3 shows that male respondents consistently purchased slightly more bottles on average than female respondents in both survey years. The mode remained constant at five bottles for all groups, suggesting a common purchasing pattern regardless of gender. The variability, as indicated by the standard deviation and range, was similar across groups, with all ranges capped at 4. These findings suggest stable gender-based differences in purchasing behavior over time, with male respondents showing a marginally higher consumption rate of bottled water. As can be seen in Table 4, after performing a one-tailed two-samples t-test, the obtained values were 1.40 for t and 0.08 for p in 2024, and the obtained values were 2.17 for t and 0.02 for p in 2019. Because for the survey taken in 2024, t was smaller than tcrit = 1.65 and p was greater than α, the null hypothesis could not be rejected. Therefore, any fluctuations in the average number of water bottles with PET packaging bought by women could have been caused by chance or were due to a sampling error. In 2019, t was greater than tcrit = 1.65 and p was smaller than α, so the alternative hypothesis was accepted and the difference between the average numbers of water bottles with PET packaging bought by women and the ones bought by men was considered to be statistically significant.
A similar approach to the one presented above for the first hypothesis was taken for the other hypotheses, and the obtained results are summarized in Table 5. The other investigated alternative hypotheses were as follows.
Ha2: 
The average number of water bottles with PET packaging bought by individuals with a job is greater than the average number of water bottles with PET packaging bought by unemployed consumers.
Ha3: 
The average number of water bottles with PET packaging bought by young consumers is greater than the average number of water bottles with PET packaging bought by older consumers.
Ha4: 
The average number of water bottles with PET packaging bought per week by unmarried consumers is greater than the average number of water bottles with PET packaging bought by married consumers per week.
Ha5: 
The average quantity of bottled water bought by male consumers is greater than the average quantity of bottled water bought by female consumers.
Ha6: 
The average quantity of bottled water bought by young consumers is greater than the average quantity of bottled water bought by older consumers.
Ha7: 
The average quantity of bottled water bought by unmarried consumers is greater than the average quantity of bottled water bought by married consumers.
Ha8: 
The average quantity of bottled water bought by unemployed consumers is greater than the average quantity of bottled water bought by employed consumers.
For the second hypothesis, for 2019, the results indicated that the alternative hypothesis should be accepted, and the difference between the average number of water bottles with PET packaging bought by employed consumers and the ones bought by unemployed consumers was considered to be statistically significant. For 2024, the alternative hypothesis was rejected as any fluctuations in the average number of water bottles with PET packaging bought by employed consumers could have been caused by chance or were due to a sampling error. This shift in consumers’ tendencies from 2019 to 2024 could be explained by the existence of the high inflation rate in Romania.
For the third hypothesis, for both the investigated years, the alternative hypothesis was accepted, with the difference between the average numbers of water bottles with PET packaging bought by young consumers and the ones bought by older consumers being considered to be statistically significant.
In the case of the fourth hypothesis, the results indicated that for 2019 the alternative hypothesis should be accepted; therefore, the average number of water bottles with PET packaging bought by unmarried consumers was (statistically) significantly greater than the average number bought by married consumers per week. For 2024 the alternative hypothesis was rejected, as any fluctuations in the average number of water bottles with PET packaging purchased with respect to the consumers’ marital status could have been caused by chance or were due to a sampling error.
For the fifth hypothesis, for both the investigated years, the alternative hypothesis was accepted, meaning the average quantity of bottled water bought by male consumers was (statistically) significantly greater than the average quantity bought by female consumers. However, for the sixth hypothesis, the alternative hypothesis was rejected for both the investigated years, as any fluctuations in the average quantity of bottled water bought by young consumers when compared to that bought by older consumers could have been caused by chance or were due to a sampling error.
In the case of the seventh hypothesis, the results from 2019 indicated that the alternative hypothesis should be rejected, as any fluctuations in the average quantity of bottled water purchased with respect to the consumers’ marital status could have been caused by chance or were due to a sampling error. For the results from 2024, the alternative hypothesis was accepted; therefore, the average quantity of bottled water bought by unmarried consumers was (statistically) significantly greater than the average quantity bought by married consumers per week. The same conclusions were true for the eighth hypothesis. For 2019 the alternative hypothesis was rejected, as any fluctuations in the average quantity of bottled water purchased with respect to the consumers’ employment status could have been caused by chance or were due to a sampling error, while for 2024 the alternative hypothesis was accepted; therefore, the average quantity of bottled water bought by unemployed consumers was (statistically) significantly greater than the average quantity bought by employed consumers per week.
The population’s perception of the consumption of bottled or tap drinking water, examined through the prism of quality factors and effects on their health and the impact on the environment, represents a persistent concern not only in communities with a high level of development but also those in the process of development. Several examples which involve and frame this theme and demonstrate the importance of the steps taken in the study conducted and the findings obtained and shown in this article are presented below.

4. Discussions

The results obtained using the applied methods reflect important aspects regarding the perception and choices of the population concerning the consumption of drinking water. The methods applied to obtain these findings proved to be efficient, with the collection, dissemination, and statistical processing of data and then their interpretation being in accordance with the directions followed by those who develop studies in this area of interest.
The research conducted by surveying the opinions of consumers on tap water versus bottled water was based on the principle of investigating the public perception regarding water quality, a principle also found in the compendium that includes the Guidelines for Drinking Water Quality of the World Health Organization. Thus, the quality of drinking water is crucial not only for health but also for maintaining public trust. People judge water’s safety largely through its appearance, taste, and smell, which are influenced by microbial, chemical, and physical factors. Even if water is safe, unpleasant sensory qualities can lead consumers to reject it, sometimes choosing riskier alternatives. Therefore, maintaining water’s health standards and esthetic quality is essential to ensure safety and public confidence [14].
The findings resulting from the statistical interpretations of the surveys conducted in the first phase reflect a significant increase in the amount of bottled water consumed. Bottled water saw an increase in consumption of over 10% compared to tap water. Men in particular consumed more bottled water than women. This indicates a change in the perception of the quality of the drinking water consumed and the mode of consumption in terms of the frequency of bottled water purchases and the quantity of bottled water purchased.
The analysis of the correlation matrix showed a change in the trends, in a positive sense, after the time interval between the two surveys, thus demonstrating the influence of the level of education on the frequency of bottled water consumption and the relationships between the packaging method (for various volumes of bottled water) and age, the quantity consumed and gender, and the preferred brand and the consumer’s age, as well as the packaging method.
These aspects were also noted in the study carried out as described in paper [15]: Data analysis showed that bottled water was more often consumed by those with lower education, a higher income, and employment and retired household members. Women drank both bottled and tap water more frequently than men, especially tap water, which they consumed several times a day. Also, the study conducted in [16] indicated the increased consumption of bottled water compared to tap water, especially when used for cooking: Bottled water was more commonly consumed by individuals with lower education, a higher income, and employment and retired household members. Women were more likely than men to drink both types of water, particularly tap water, several times daily.
The results obtained in the developed study reflect not only the increased consumption of bottled water but especially the shift in preferences towards choosing bottled water in PET packaging. This aspect is a major concern and represents a starting point in the development of sustainable alternatives (such as improving the quality of tap water, installing filtration systems, etc.). These findings are similar to those of other studies. One of the key goals of this research was to reduce the use of single-use plastics, such as PET bottles. To minimize the environmental harm caused by the production and consumption of bottled water, effective strategies need to be developed and implemented. Environmental and human health concerns about bottled water are also rising, especially those related to plastic bottles and exacerbated by the current preoccupation with microplastics found in water [15,16].
A limitation here is the lack of a cost–quality analysis of the two types of water consumed (bottled versus tap water), which could present a future research direction, along with the additional analysis of several variables for the analysis of descriptive statistical indicators. Another future research direction is to test the amount of microplastics in the packaging of the bottled water consumed and the impact on the quality of the water compared to that of tap water improved through household filtration processes.
Although the survey conducted that formed the basis for the development of the study described in this paper was characterized by its traceability, including from a demographic perspective, the survey sample was similar to that in the study described in paper [15]. However, in a similar study in the future, this sample could be increased and stratified demographically, like the one in the study described in paper [16].

5. Conclusions, Limitations of Study, and Future Directions for Development

This research provides longitudinal insights into the changes in bottled versus tap water preferences in Romania from 2019 to 2024, an area where the recent data was previously limited. By examining the same essential variables at two different time intervals, we offer a more precise understanding of who is instigating the change and to what extent. The key findings that can be expressed are the following:
The average purchase volume per trip rose by 10.4%, and the weekly buying frequency rose by 12.1%;
The growth was concentrated among women and younger respondents;
The preference for PET bottles increased by 4%, while the stated tap water use fell by 5%, paralleling a 4.2% drop in the perceived tap water quality;
The brand share shifted: the share for Aqua Carpatica rose to 38%, whereas the share for Borsec fell from 37% to 16%, suggesting that purity-based marketing influences choices across income levels.
Regarding the limitations and contributions of this study and the next steps suggested by the findings, it can be stated that the results were based on self-reported online surveys that may have under-represented older or rural residents and could not fully capture urban–rural differences. The quantitative design also limited insights into the motives behind the observed behaviors. By quantifying the recent shifts and linking them to demographic factors, this study helped fill a gap in the understanding of Romania’s evolving drinking water landscape. Future work should combine qualitative methods (e.g., interviews or focus groups) with the targeted sampling of under-represented rural groups to clarify why consumers favor bottled water over tap water and how perceptions of water quality are formed.

Author Contributions

H.-G.C. and O.-A.C. wrote the draft of the manuscript. O.-A.C. and F.Ș. contributed to the conception and design of the study. O.-A.C. organized the database. F.Ș. performed the statistical analysis. C.B. and M.P. wrote sections of the manuscript. All authors contributed to the manuscript revisions and read and approved the submitted version. All authors have read and agreed to the published version of the manuscript.

Funding

This research received no external funding.

Data Availability Statement

The data presented in this study are available on request from the corresponding author. The data are not publicly available due to privacy reasons.

Conflicts of Interest

The authors declare that there is no conflict of interest related to this paper. Oana-Adriana CRIȘAN is an employee of MDPI; however, she does not work for the journal Water at the time of submission and publication.

Appendix A

Appendix A.1. Consumer Attitudes Regarding Interest in Purchasing Drinking Water Filters Versus Bottled Water in PET Packaging

I 
Data on respondents.
  • E-mail address (optional for those who want to know the results of the study).
  • Specify the geographical area from which you come:
    • Water 17 01755 i001 Bucharest-Ilfov; Water 17 01755 i001 Center; Water 17 01755 i001 Northeast; Water 17 01755 i001 Northwest;
    • Water 17 01755 i001 South Muntenia; Water 17 01755 i001 Southeast Dobrogea; Water 17 01755 i001 Southwest Oltenia; Water 17 01755 i001 West.
  • The city where you live:
    __________________________________.
  • Age:
    • Water 17 01755 i001 18–25 years old; Water 17 01755 i001 25–35 years old; Water 17 01755 i001 35–45 years old; Water 17 01755 i001 Over 45 years old.
  • Status:
    • Water 17 01755 i001 Employee; Water 17 01755 i001 Unemployed; Water 17 01755 i001 Student/Master’s student/Ph.D. student;
    • Water 17 01755 i001 Retired; Water 17 01755 i001 Household;
    • Water 17 01755 i001 Other—please specify:_______________.
  • Professional level:
    • Water 17 01755 i001 8 classes; Water 17 01755 i001 High school;
    • Water 17 01755 i001 University studies; Water 17 01755 i001 Postgraduate studies;
  • Level of net income (in RON):
    • Water 17 01755 i001 0–1500; Water 17 01755 i001 1500–3000; Water 17 01755 i001 3000–4000;
    • Water 17 01755 i001 4000–6000; Water 17 01755 i001 6000–10,000; Water 17 01755 i001 Peste 10,000.
  • Marital status:
    • Water 17 01755 i001 Married; Water 17 01755 i001 Unmarried;;
    • Water 17 01755 i001 Married with children; Water 17 01755 i001 Unmarried with children.
  • Gender:
    • Water 17 01755 i001 Female;
    • Water 17 01755 i001 Male.
II 
Data on drinking water preferences and consumption.
10.
What is your water consumption preference?
  • Water 17 01755 i001 I prefer to drink water from home (from the public network);
  • Water 17 01755 i001 I prefer to drink bottled water.
11.
How many times per week do you consume still bottled water?
  • Water 17 01755 i001 not at all;
  • Water 17 01755 i001 once a week;
  • Water 17 01755 i001 between 1–3 times/week;
  • Water 17 01755 i001 between 3–5 times/week;
  • Water 17 01755 i001 more than 5 times/week.
12.
What is the amount of still bottled water you consume most frequently?
  • Water 17 01755 i001 0.5 L;Water 17 01755 i001 1 L;Water 17 01755 i001 2 L;
  • Water 17 01755 i001 5 L;Water 17 01755 i001 10 L;Water 17 01755 i001 19 L;
13.
What is the type of packaging in which you buy still bottled water?
  • Water 17 01755 i001 still bottled water in glass packaging;
  • Water 17 01755 i001 still bottled water in polyethylene terephthalate packaging (PET)
14.
What is the brand of drinking water you purchase most often?
  • Water 17 01755 i001 Borsec; Water 17 01755 i001 Aqua Carpactica; Water 17 01755 i001 Izvorul Alb; Water 17 01755 i001 Bucovina;
  • Water 17 01755 i001 Dorna; Water 17 01755 i001 Perla Harghitei; Water 17 01755 i001 Poiana Negri; Water 17 01755 i001 Izvorul Minunilor;
  • Water 17 01755 i001 Private Label; Water 17 01755 i001 Zizin; Water 17 01755 i001 Azuga; Water 17 01755 i001 Izvorul Zânelor;
  • Water 17 01755 i001 Other—please specify:_______________.
15.
To what extent do you agree with the following statements regarding the comparison between still bottled water and the water distributed at home from the public network?
Bottled WaterTotally AgreeAgreeNeutralDisagreementTotal Disagreement
It tastes much better
It has a much clearer appearance
It is free of possible impurities
The brand I buy from gives me the guarantee of quality
I only trust the quality of bottled water
The value for money is much better
16.
On a scale from 1 to 10 (where 1 represents the worst score and 10 is the best score), how do you rate drinking water quality at your home?
  • 1. Water 17 01755 i001 2. Water 17 01755 i001 3. Water 17 01755 i001 4. Water 17 01755 i001 5. Water 17 01755 i001 6. Water 17 01755 i0017. Water 17 01755 i001 8. Water 17 01755 i001 9. Water 17 01755 i001 10. Water 17 01755 i001.
17.
Consider that it should be improved in terms of its quality?
  • Water 17 01755 i001 Yes, it needs significant improvements;
  • Water 17 01755 i001 Yes, it needs some improvements;
  • Water 17 01755 i001 May need improvement;
  • Water 17 01755 i001 I don’t think it needs improvement;
  • Water 17 01755 i001 It doesn’t need any improvement.
III 
Information about the existence of alternatives to the consumption of bottled drinking water.
18.
Do you know some possible alternatives for bottled water other than the one at home?
  • Water 17 01755 i001 Yes; Water 17 01755 i001 I don’t know, but I want to find out; Water 17 01755 i001 I don’t know.
19.
Drinking water filters are a new alternative solution for water consumption and have the role of improving water quality at the level of the domestic user, and thus, consumers’ health. Starting from this basic information, please evaluate the most important features a water filter should contain:
Very ImportantImportantNeutralImportant EnoughUnimportant
Price
Durability
Efficiency (high degree of filtration and impurities)
Possibility of reuse
Possibility of recycling
Increased degree of innovation (eg: the possibility of ozonation of water, improvement of taste, elimination of watercolor)
The material from which it is made
Minimizing the impact on the environment
IV 
Raising awareness of water waste and water’s impact on health and determining the intention of users to purchase water filters.
20.
What do you think are the effects of the relationship between the consumption of bottled water in PET packaging and the environment and one’s health?
  • Water 17 01755 i001 There is no particular relationship;
  • Water 17 01755 i001 It is a relationship without direct consequences on the environment because once the PET packaging become waste, they are thrown in specially designed-places;
  • Water 17 01755 i001 There are no negative effects in the short and medium term on consumers’ health;
  • Water 17 01755 i001 There are numerous negative effects on the environment and consumers’ health caused by the permanent consumption of PET packaging.
21.
Every year, 400 billion liters of bottled water are consumed, and to bottle it in PET (polyethylene terephthalate) packing, 30 million barrels of oil and 7 times more water are consumed annually to produce a single bottle versus the one being bottled. Based on these aspects, how do you assess the amount of resources used for this process?
  • Water 17 01755 i001 I think the amount of resources used is normal;
  • Water 17 01755 i001 Resources exist in nature in abundance, so the quantity itself is not a problem;
  • Water 17 01755 i001 I can’t properly estimate the amount of resources used;
  • Water 17 01755 i001 In the context of sustainable development and circular economy, it is imperative to reduce the amount of resources we use for this process;
  • Water 17 01755 i001 Other:________________________________
22.
What is your opinion on purchasing flat water filters? (multiple answers)
  • Water 17 01755 i001 It’s just another marketing strategy;
  • Water 17 01755 i001 They will only partially solve drinking water quality and health problems;
  • Water 17 01755 i001 It represents a viable alternative in the context of the circular economy;
  • Water 17 01755 i001 They will significantly improve water quality and, implicitly consumers’ health;
  • Water 17 01755 i001 Contributes to stopping water wastage;
  • Water 17 01755 i001 It represents a much better alternative to PET packaging from sustainability and health persepctive;
  • Water 17 01755 i001 In the context of sustainable consumption, it is necessary to turn our attention to them;
  • Water 17 01755 i001 They are important for improving the quality of life.
23.
What would be your choice if you had to decide between buying plain bottled water or purchasing water filters for home water consumption? (multiple answers)
  • Water 17 01755 i001 I don’t plan to buy water filters;
  • Water 17 01755 i001 I don’t understand why I should buy water filters;
  • Water 17 01755 i001 I don’t find it necessary to buy water filters;
  • Water 17 01755 i001 If I could find water filters for home consumers on sale, I would buy them;
  • Water 17 01755 i001 Yes, I would buy them because I want to stop drinking bottled water in PET bottles, so I can protect the environment and my health;
  • Water 17 01755 i001 Yes, I would buy, but in parallel, I would continue to buy bottled water;
  • Water 17 01755 i001 I have already switched to this way of consumption, but I still consume bottled water;
  • Water 17 01755 i001 I have already switched to this way of consumption and no longer buy bottled water.

References

  1. Directive 2000/60/EC of the European Parliament and of the Council of 23 October 2000 Establishing a Framework for Community Action in the Field of Water Policy. Available online: https://eur-lex.europa.eu/eli/dir/2000/60/oj (accessed on 24 May 2024).
  2. Allan, R. Water sustainability and the implementation of the Water Framework Directive—A European perspective. Ecohydrol. Hydrobiol. 2012, 12, 171–178. [Google Scholar] [CrossRef]
  3. Wuijts, S.; Van Rijswick, H.F.; Driessen, P.P.; Runhaar, H.A. Moving forward to achieve the ambitions of the European Water Framework Directive: Lessons learned from the Netherlands. J. Environ. Manag. 2023, 333, 117424. [Google Scholar] [CrossRef] [PubMed]
  4. Cooper, R.J.; Hiscock, K.M. Two decades of the EU Water Framework Directive: Evidence of success and failure from a lowland arable catchment (River Wensum, UK). Sci. Total Environ. 2023, 869, 161837. [Google Scholar] [CrossRef] [PubMed]
  5. Geerts, R.; Vandermoere, F.; Van Winckel, T.; Halet, D.; Joos, P.; Steen, K.V.D.; Van Meenen, E.; Blust, R.; Borregán-Ochando, E.; Vlaeminck, S.E. Bottle or tap? Toward an integrated approach to water type consumption. Water Res. 2020, 173, 115578. [Google Scholar] [CrossRef] [PubMed]
  6. Acarer, S. Abundance and characteristics of microplastics in drinking water treatment plants, distribution systems, water from refill kiosks, tap waters and bottled waters. Sci. Total Environ. 2023, 884, 163866. [Google Scholar] [CrossRef] [PubMed]
  7. Su, Z.; Liu, T.; Men, Y.; Li, S.; Graham, N.; Yu, W. Understanding point-of-use tap water quality: From instrument measurement to intelligent analysis using sample filtration. Water Res. 2022, 225, 119205. [Google Scholar] [CrossRef] [PubMed]
  8. Muhib, I.; Uddin, K.; Rahman, M.; Malafaia, G. Occurrence of microplastics in tap and bottled water, and food packaging: A narrative review on current knowledge. Sci. Total Environ. 2023, 865, 161274. [Google Scholar] [CrossRef] [PubMed]
  9. Dorigoni, A.; Bonini, N. Water bottles or tap water? A descriptive-social-norm based intervention to increase a pro-environmental behavior in a restaurant. J. Environ. Psychol. 2023, 86, 101971. [Google Scholar] [CrossRef]
  10. Praveena, S.M.; Ariffin, N.I.S.; Nafisyah, A.L. Microplastics in Malaysian bottled water brands: Occurrence and potential human exposure. Environ. Pollut. 2022, 315, 120494. [Google Scholar] [CrossRef] [PubMed]
  11. Umoafia, N.; Joseph, A.; Edet, U.; Nwaokorie, F.; Henshaw, O.; Edet, B.; Asanga, E.; Mbim, E.; Chikwado, C.; Obeten, H. Deterioration of the quality of packaged potable water (bottled water) exposed to sunlight for a prolonged period: An implication for public health. Food Chem. Toxicol. 2023, 175, 113728. [Google Scholar] [CrossRef] [PubMed]
  12. Li, Y.; Wang, Z.; Guan, B. Separation and Identification of Nanoplastics in Tap Water. Environ. Res. 2022, 204, 112134. [Google Scholar] [CrossRef] [PubMed]
  13. Rasheed, R.O. Impact of Polyethylene Terephthalate in Different Temperatures and Storage Duration on Some Physicochemical Properties of Drinking Bottled Water. Polycycl. Aromat. Compd. 2022, 43, 3977–3987. [Google Scholar] [CrossRef]
  14. WHO. Guidelines for Drinking-Water Quality, 4th ed.; World Health Organization: Geneva, Switzerland, 2022; Available online: https://www.who.int/publications/i/item/9789240045064 (accessed on 25 May 2025).
  15. Zvěřinová, I.; Ščasný, M.; Otáhal, J. Bottled or Tap Water? Factors Explaining Consumption and Measures to Promote Tap Water. Water 2024, 16, 3011. [Google Scholar] [CrossRef]
  16. March, H.; Garcia, X.; Domene, E.; Sauri, D. Tap Water, Bottled Water or In-Home Water Treatment Systems: Insights on Household Perceptions and Choices. Water 2020, 12, 1310. [Google Scholar] [CrossRef]
  17. Survey Taken in 2019. Available online: https://forms.gle/oyinVJ7Dxud2zVhb8 (accessed on 10 May 2019).
  18. Surbey Taken in 2024. Available online: https://forms.gle/1AetskBRwpgyVzqo8 (accessed on 15 June 2024).
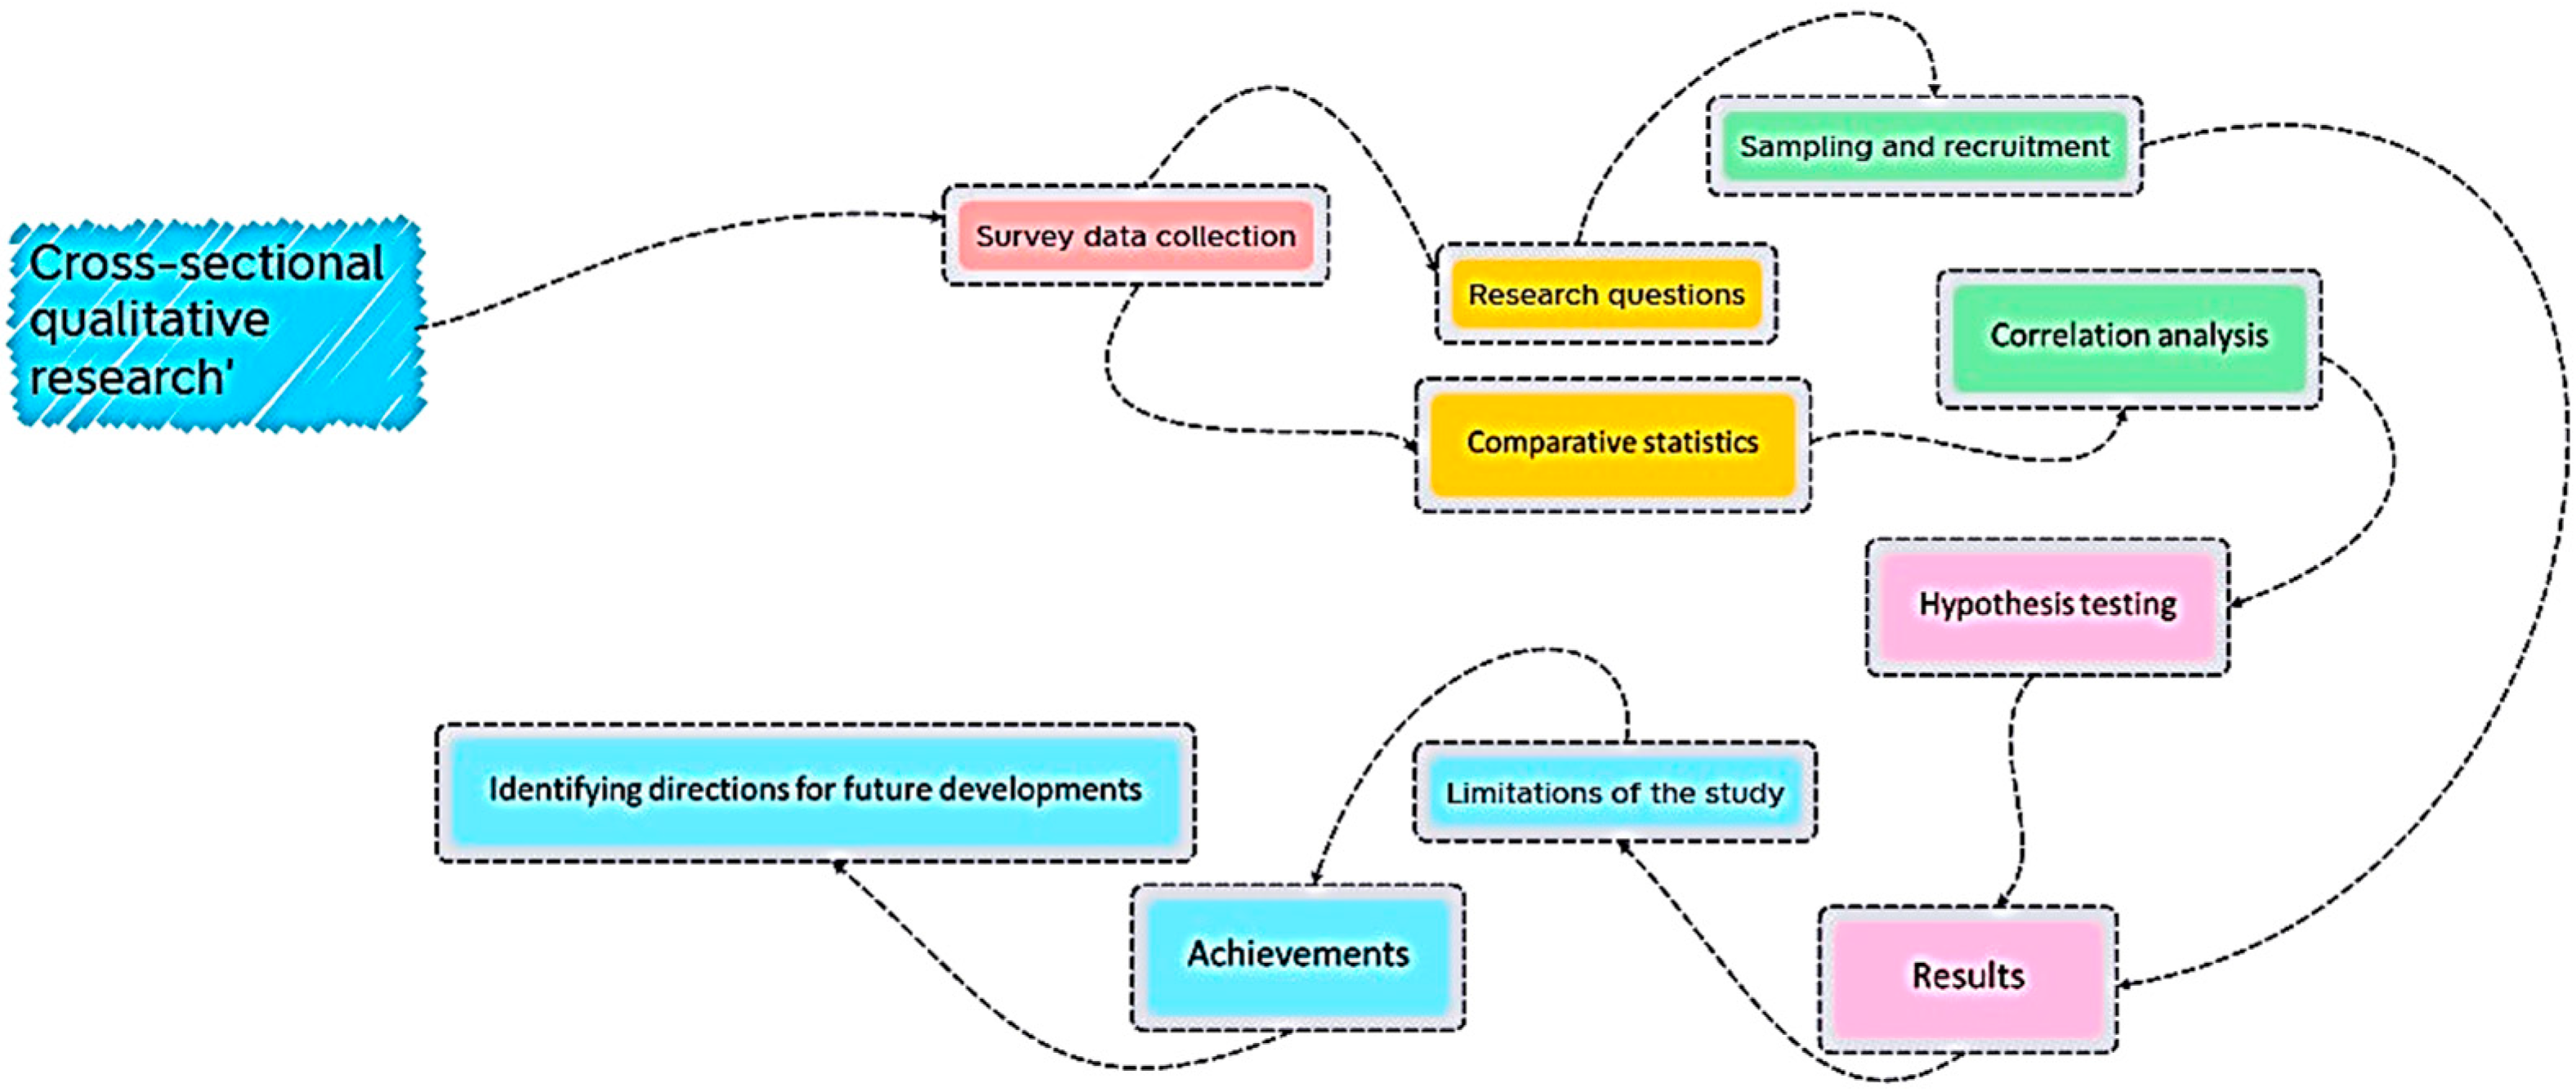
Figure 1. Overview of the research framework.
Water 17 01755 g001
Figure 2. Changes in consumer perceptions of bottled water versus tap water in Romania between 2019 and 2024, based on survey responses.
Water 17 01755 g002
Figure 3. Comparison of bottled water preference between male and female respondents in Romania in 2019 and 2024.
Water 17 01755 g003
Figure 4. Gender-based comparison of the bottled water quantity purchased per transaction in Romania for the years 2019 and 2024.
Water 17 01755 g004
Figure 5. Comparison of bottled water purchase quantity per transaction across income groups in Romania in 2019 and 2024.
Water 17 01755 g005
Figure 6. Comparison of weekly bottled water purchase frequency across different age groups in Romania in 2019 and 2024.
Water 17 01755 g006
Figure 7. Shift in brand preferences for bottled water among Romanian consumers between 2019 and 2024.
Water 17 01755 g007
Table 1. Summary of descriptive statistical indicators for key variables, based on survey data from 2019 and 2024.
Quantity in Liters/PurchaseNo. of Times/WeekWater Quality
201920242019202420192024
Mean2.302.543.073.446.886.59
Standard Error0.180.180.150.160.150.16
Median222477
Mode226688
Standard Deviation2.832.712.312.342.372.41
Sample Variance8.037.365.345.495.635.83
Kurtosis17.8612.36−1.59−1.65−0.02−0.42
Skewness3.723.020.18−0.07−0.79−0.62
Range18.518.56699
Minimum0.50.50011
Maximum1919661010
Sum582.557577777817411489
Count253226253226253226
Table 2. Correlation matrix.
YearAgeEducation LevelIncomeMarital StatusGenderPreferenceNo. of TimesQuantityPETBrand
Age20191
20241
Education level20190.08771
20240.15441
Income20190.44830.43051
20240.38320.13681
Marital status20190.57790.11840.44101
20240.37810.09600.22811
Gender2019−0.2660−0.1519−0.1012−0.25461
2024−0.0749−0.08650.0767−0.07911
Preference2019−0.06870.03670.0508−0.05120.10931
2024−0.15260.03230.0064−0.15000.02981
No. of times2019−0.13920.04470.0483−0.14280.13580.72911
2024−0.29450.01090.0096−0.12530.09340.66231
Quantity2019−0.05120.03330.11640.00490.12910.51280.54351
2024−0.0472−0.05600.0768−0.16170.14940.30860.44201
PET20190.0593−0.0909−0.00510.02300.05290.03050.07790.00301
20240.1081−0.01830.05410.0135−0.05560.0092−0.09250.05381
Brand2019−0.07900.03980.0394−0.00310.0050−0.0486−0.00810.1100−0.01471
20240.07520.02620.08330.0805−0.0279−0.0092−0.1277−0.11270.02401
Table 3. Summary of descriptive statistics for purchases of bottled water in PET packaging, disaggregated by gender, based on 2019 and 2024 survey data.
20192024
FemaleMaleFemaleMale
Mean3.153.573.353.63
Standard Error0.110.150.160.12
Median3434
Mode5555
Standard Deviation1.481.351.461.43
Sample Variance2.21.812.142.05
Kurtosis−1.43−1.18−1.28−1.2
Skewness−0.01−0.38−0.26−0.48
Range4444
Minimum1111
Maximum5555
Sum533300285512
Count1698485141
Table 4. Results for the t-test performed for the first proposed hypothesis.
Two-Sample t-Test Assuming Equal Variances
20192024
MaleFemaleMaleFemale
Mean3.573.153.633.35
Variance1.812.202.052.14
Observations8416914185
Pooled Variance2.07 2.08
Hypothesized Mean Difference0 0
df251 224
t Stat2.17 1.40
P (T<=t), One-Tailed0.02 0.08
t Critical, One-Tailed1.65 1.65
P (T<=t), Two-Tailed0.03 0.16
t Critical, Two-Tailed1.97 1.97
Table 5. Results for the t-test performed for the other proposed hypotheses.
Hypothesisttcritp
Ha2t2019 = 1.77
t2024 = 1.40
tcrit2019 = 1.65
tcrit2024 = 1.66
p2019 = 0.04
p2024 = 0.08
Ha3t2019 = 2.04
t2024 = 10.81
tcrit2019 = 1.66
tcrit2024 = 1.80
p2019 = 0.02
p2024 = 1.69 × 10⁻⁷
Ha4t2019 = 2.29
t2024 = 1.75
tcrit2019 = 1.65
tcrit2024 = 1.80
p2019 = 0.01
p2024 = 0.05
Ha5t2019 = 2.06
t2024 = 2.26
tcrit2019 = 1.65
tcrit2024 = 1.65
p2019 = 0.02
p2024 = 0.01
Ha6t2019 = 0.56
t2024 = 1.48
tcrit2019 = 1.65
tcrit2024 = 1.72
p2019 = 0.29
p2024 = 0.08
Ha7t2019 = −0.08
t2024 = 2.45
tcrit2019 = 1.65
tcrit2024 = 1.65
p2019 = 0.46
p2024 = 0.01
Ha8t2019 = 0.53
t2024 = 1.68
tcrit2019 = 1.65
tcrit2024 = 1.65
p2019 = 0.30
p2024 = 0.04
Disclaimer/Publisher’s Note: The statements, opinions and data contained in all publications are solely those of the individual author(s) and contributor(s) and not of MDPI and/or the editor(s). MDPI and/or the editor(s) disclaim responsibility for any injury to people or property resulting from any ideas, methods, instructions or products referred to in the content.