Article

Calcium Determination by Complexometric Titration with Calcein Indicator Using Webcam for Endpoint Detection

by
Alexander Shyichuk
1,2,*,
Dorota Ziółkowska
1,
Jan Lamkiewicz
1 and
Maria Kowalska
1
1
Faculty of Chemical Technology and Engineering, Bydgoszcz University of Science and Technology, Seminaryjna 3, 85-326 Bydgoszcz, Poland
2
Educational and Scientific Center of Materials Science and Nanotechnology, Vasyl Stefanyk Precarpathian National University, 76018 Ivano-Frankivsk, Ukraine
*
Author to whom correspondence should be addressed.
Water 2025, 17(12), 1757; https://doi.org/10.3390/w17121757
Submission received: 31 March 2025 / Revised: 29 May 2025 / Accepted: 10 June 2025 / Published: 11 June 2025
(This article belongs to the Section Water Quality and Contamination)

Abstract

:
Precise and convenient analytical methods are needed for the quantitative determination of calcium in water and food. Complexometric titration remains a reliable technique to determine calcium in milligram amounts. The titrations have been performed automatically by detecting color transitions with a webcam. Classical complexometric indicator calcein provided a sharp color transition. In diffuse reflection mode, the color appearance parameter (Hue) provides better precision and is more resistant to ambient light fluctuations compared to RGB primaries. In fluorescence mode with LED illumination, the fluorescence brightness of calcein is independent of ambient light, and the primary green color provides the sharpest endpoints. The color change during titration is better in the upper part of the acquired images due to the internal filter effect in calcein solutions. The automatic titration with a digital burette provides a standard deviation as low as 0.1 μmol. An example of its application is in the determination of calcium in commercial mineral waters. Based on the AGREE and ComplexMoGAPI rating scales, the semi-automatic titration showed better environmental assessment compared to the standard ASA method.

1. Introduction

The determination of calcium in water is important for many reasons. In heat exchange installations, calcium and magnesium ions can result in the formation of scale on hot surfaces. Therefore, water used as a heating or cooling medium should be free of calcium ions. For technical reasons, water used for domestic purposes should also have a hardness of low to medium. One study on tap water samples collected in 33 countries showed significant variation in calcium and magnesium content [1]. It turned out that European waters are among the hardest, which is due to their geological origin. So, water softening is necessary, and its control requires determining the content of calcium and magnesium ions. The opposite situation occurs in natural seawater, where calcium plays an important role in the structure of many marine organisms, including corals, mussels, macroalgae, and bacterial biofilms. Therefore, an important task for owners of marine aquaria is the regular control of calcium concentration in order to maintain it at a suitable level. In the human body, calcium is 1 of 11 macroelements. Calcium forms the structure of bones and teeth. Calcium plays important roles in the homeostasis of blood plasma, and in the proper functioning of cells and mucous membranes. Calcium is involved in metabolism, muscle contraction, and blood coagulation. It has anti-inflammatory, anti-swelling, and anti-allergic properties [2]. Therefore, the body’s high demand for calcium and magnesium, and on the other hand, the low supply of these elements in the diet, are the cause of many diseases. These include cardiovascular diseases and an associated increased risk of mortality [3]. Sources of calcium in the diet are mainly dairy products, as well as fish and plant products [4,5]. Calcium can be supplemented with mineral water, too. Drinking water containing appropriate amounts of calcium ions (within the recommended range of 20–200 mg L−1) can, among other things, prevent circulatory system diseases and resulting mortality [3]. However, highly mineralized water can only be a supplement to the diet. For example, the deteriorating quality of drinking water in Pakistan, which, due to anthropogenic causes, is manifested, for instance, as an increase in calcium content (often significantly above 300 mg L−1), and is attributed to diseases such as urinary tract infections, stomach ulcers, and tooth decay [6]. Anthropogenically significant increases in calcium content in groundwater to levels exceeding 440 mg L−1 are also a problem in approximately 43% of studied districts in India [7].
Precise and convenient analytical methods are needed for the routine quantitative determination of calcium in water and food. The most used methods are atomic absorption spectrometry, ICP-OES, ICP-MS, calcium-selective electrodes, and complexometric titration [8,9,10,11]. The method of complexometric titration with ethylene diamine tetraacetic acid (EDTA) has a long history and still remains popular in analytical practice [12,13,14,15,16,17,18,19,20]. The advantages of the titration method are its high accuracy and low hardware requirements. The disadvantages of manual titration are increased labor costs and subjective errors in color perception, which reduce the accuracy of endpoint detection. Automatic titration with a calcium ion-selective electrode provides better repeatability; however it is time-consuming because each titration step takes several minutes for the electrode potential to stabilize [21,22]. More convenient detectors include photometric immersion probes that provide immediate responses and have high sensitivity [23]. However, air bubbles in the optical gap may disturb the photometric signal [24]. Suspended particles and droplets also interfere with the optical immersion probes, leading to spikes and erroneous detection of the endpoint.
The above drawbacks motivate analysts to seek a more convenient technique for detecting the endpoint. Currently, the most convenient and low-cost option for optical detectors is webcams. Commercially available CMOS sensors have high sensitivity and a wide dynamic range, which facilitates the automation of the titration procedure. Averaging signals from multiple pixels minimizes fluctuations caused by air bubbles and suspended particles. An additional advantage of this technique is the lack of a washing procedure for electrodes or immersion optical probes.
Digital cameras and scanners are already used in analytical chemistry, mainly for the direct measurement of transmittance and reflectance [25,26,27,28,29,30,31,32]. Several scientific reports have addressed the use of digital cameras for endpoint detection in titration techniques [33,34,35,36,37,38,39]. Different color models are used to detect the color transition [33,38,40]. The Red–Green–Blue color model is most commonly used. The Hue–Saturation–Intensity and Hue–Saturation–Value models may provide less fluctuation in the titration line due to the separation of color and luminance information [40]. The Hue parameter provides smooth titration graphs using an open mixing chamber without rigorous lighting control [38]. The Hue parameter and the inner product of RGB vectors have been compared using the same set of digital images [41]. Both parameters proved to be excellent in detecting endpoints.
So far, there have been few published scientific reports on testing complexometric indicators with RGB sensors for the titrimetric determination of calcium. Image analysis was successfully used to detect the endpoint in the complexometric determination of water hardness at pH = 10 [35]. The Eriochrome Black T indicator was examined with both the RGB and Hue–Saturation–Intensity models. The conclusion was that the most sensitive signal is the Red one [35]. The Eriochrome Black T indicator was also used within the framework of the Hue–Saturation–Value color model [37]. A digital camera was also used to document the course of the titrimetric determination of alkali metals and calcium with ionophore-based reagents [36,39]. Water hardness was determined by EDTA titration using a Calmagite indicator and a 6-channel spectral sensor board as an endpoint detector [42]. The six spectral signals were processed using the K-nearest neighbor classification algorithm, which allowed for reliable detection of color change.
This work describes the optimal lighting conditions and color parameters for recording sharp endpoints with a digital camera, using calcein as an indicator. Calcein is a typical calcium-sensitive indicator used in complexometric titrations [14,15,43,44,45]. It has been proven that the optimal selection of measurement conditions for a webcam allows for the precise determination of calcium in water solution.

2. Materials and Methods

2.1. Reagents, Instrumentation, and Lighting

The standard volumetric solutions of EDTA (0.025 M) and calcium chloride (0.01 M), as well as sodium hydroxide, for titrimetric determination were purchased from Chempur (Piekary Śląskie, Poland). The CRM was calcium carbonate, purchased from Johnson Matthey Chemicals Ltd. (London, UK), and the indicator was calcein (Figure 1a), purchased from Sigma-Aldrich (Saint Louis, MO, USA). The reagents used for the AAS method were 65% nitric acid suprapur (Merck, Darmstadt, Germany), a standard solution of calcium nitrate in 0.5 mol L−1 nitric acid of Ca concentration 1000 mg L−1 (Merck, Darmstadt, Germany), and lanthanum chloride (Sigma-Aldrich, Saint Louis, MO, USA). The commercial mineral waters used were of Polish origin. The other samples of water were taken from the municipal water supply system and from the Vistula River, in the city of Bydgoszcz, Poland.
The measuring set is shown in Figure 1b. The Titronic 300 burette and the Logitech C270 webcam were controlled by a computer with custom software ChemiON (v. 1.4.8.5 of the author’s program by Jan Lamkiewicz). ChemiON is a Java program used for controlling and collecting data from various input and output devices [46]. In diffuse reflection mode, the background was white, and the light source was an LED lamp (1260 lm, 4500 K) placed 80 cm above a milky polypropylene beaker. In fluorescence mode, the background was a sheet of black paper, and the light source was an LED spotlight (360 lm, 6000 K) placed 25 cm above the glass beaker. The automatic gain function of the webcam was turned off. The AAS measurements were performed using spectrophotometer iCE 3500 Series AA (Thermo Scientific, Waltham, MA, USA) at a wavelength of 422.7 nm.

2.2. Titration Procedure and Image Analysis

Test solutions for the determination of linearity range, effect of calcein dose, and sampling area were prepared by diluting exact volumes of standard 0.01 mol L−1 calcium chloride solution with deionized water. A solution of CRM with a calcium concentration of 10 mg L−1 was prepared by dissolving CRM using ultrapure water and HNO3. The river water was filtered through a medium-hardness filter while tap water and mineral waters were not filtered. If necessary, mineral water samples were diluted to maintain the amount of calcium in the linearity range. Then, the pH was adjusted to 12.5 with 8 mol L−1 NaOH solution, and the exact volume (of 0.1 to 1.2 mL) of 1 mmol L−1 calcein indicator solution was added.
The titration procedure was performed by adding standard EDTA solution (0.025 mol L−1) in increments of 0.01 or 0.05 mL. Images were recorded 10 s after each dose step. The images of the reaction mixture were analyzed with ChemiON software. The sampling area was set by the operator. Each of the RGB color components was averaged over the sampling area. The transformation of the RGB values (8-bit integer) to the Hue parameter (degrees) was carried out according to the HSI color model. The variance of the endpoint volume was calculated from the results of ten determinations.

2.3. AAS Measurements

Samples with high concentrations of calcium were diluted with deionized water to obtain calcium concentrations within the range of the standard curve, i.e., from 1 to 20 mg L1. In total, 100 mL of solution was acidified with 1 mL of nitric acid. In order to eliminate matrix interference effects, 10 mL of lanthanum chloride solution (20 g La L1) was added.

3. Results and Discussion

The calcein indicator has four carboxyl groups that coordinate calcium ions (Scheme 1). Since the carboxyl groups are weakly dissociated, it is assumed that only two of the four groups bind the Ca ion. The complex has a light green color and, under appropriate conditions, fluoresces. Figure 1b shows the fluorescence of calcein under LED light. During titration, calcium combines with EDTA to form a more stable complex and the free indicator is released (Scheme 2). So, the color of the solution changes to that characteristic of free calcein (desaturated dark orange). Free calcein does not fluoresce.

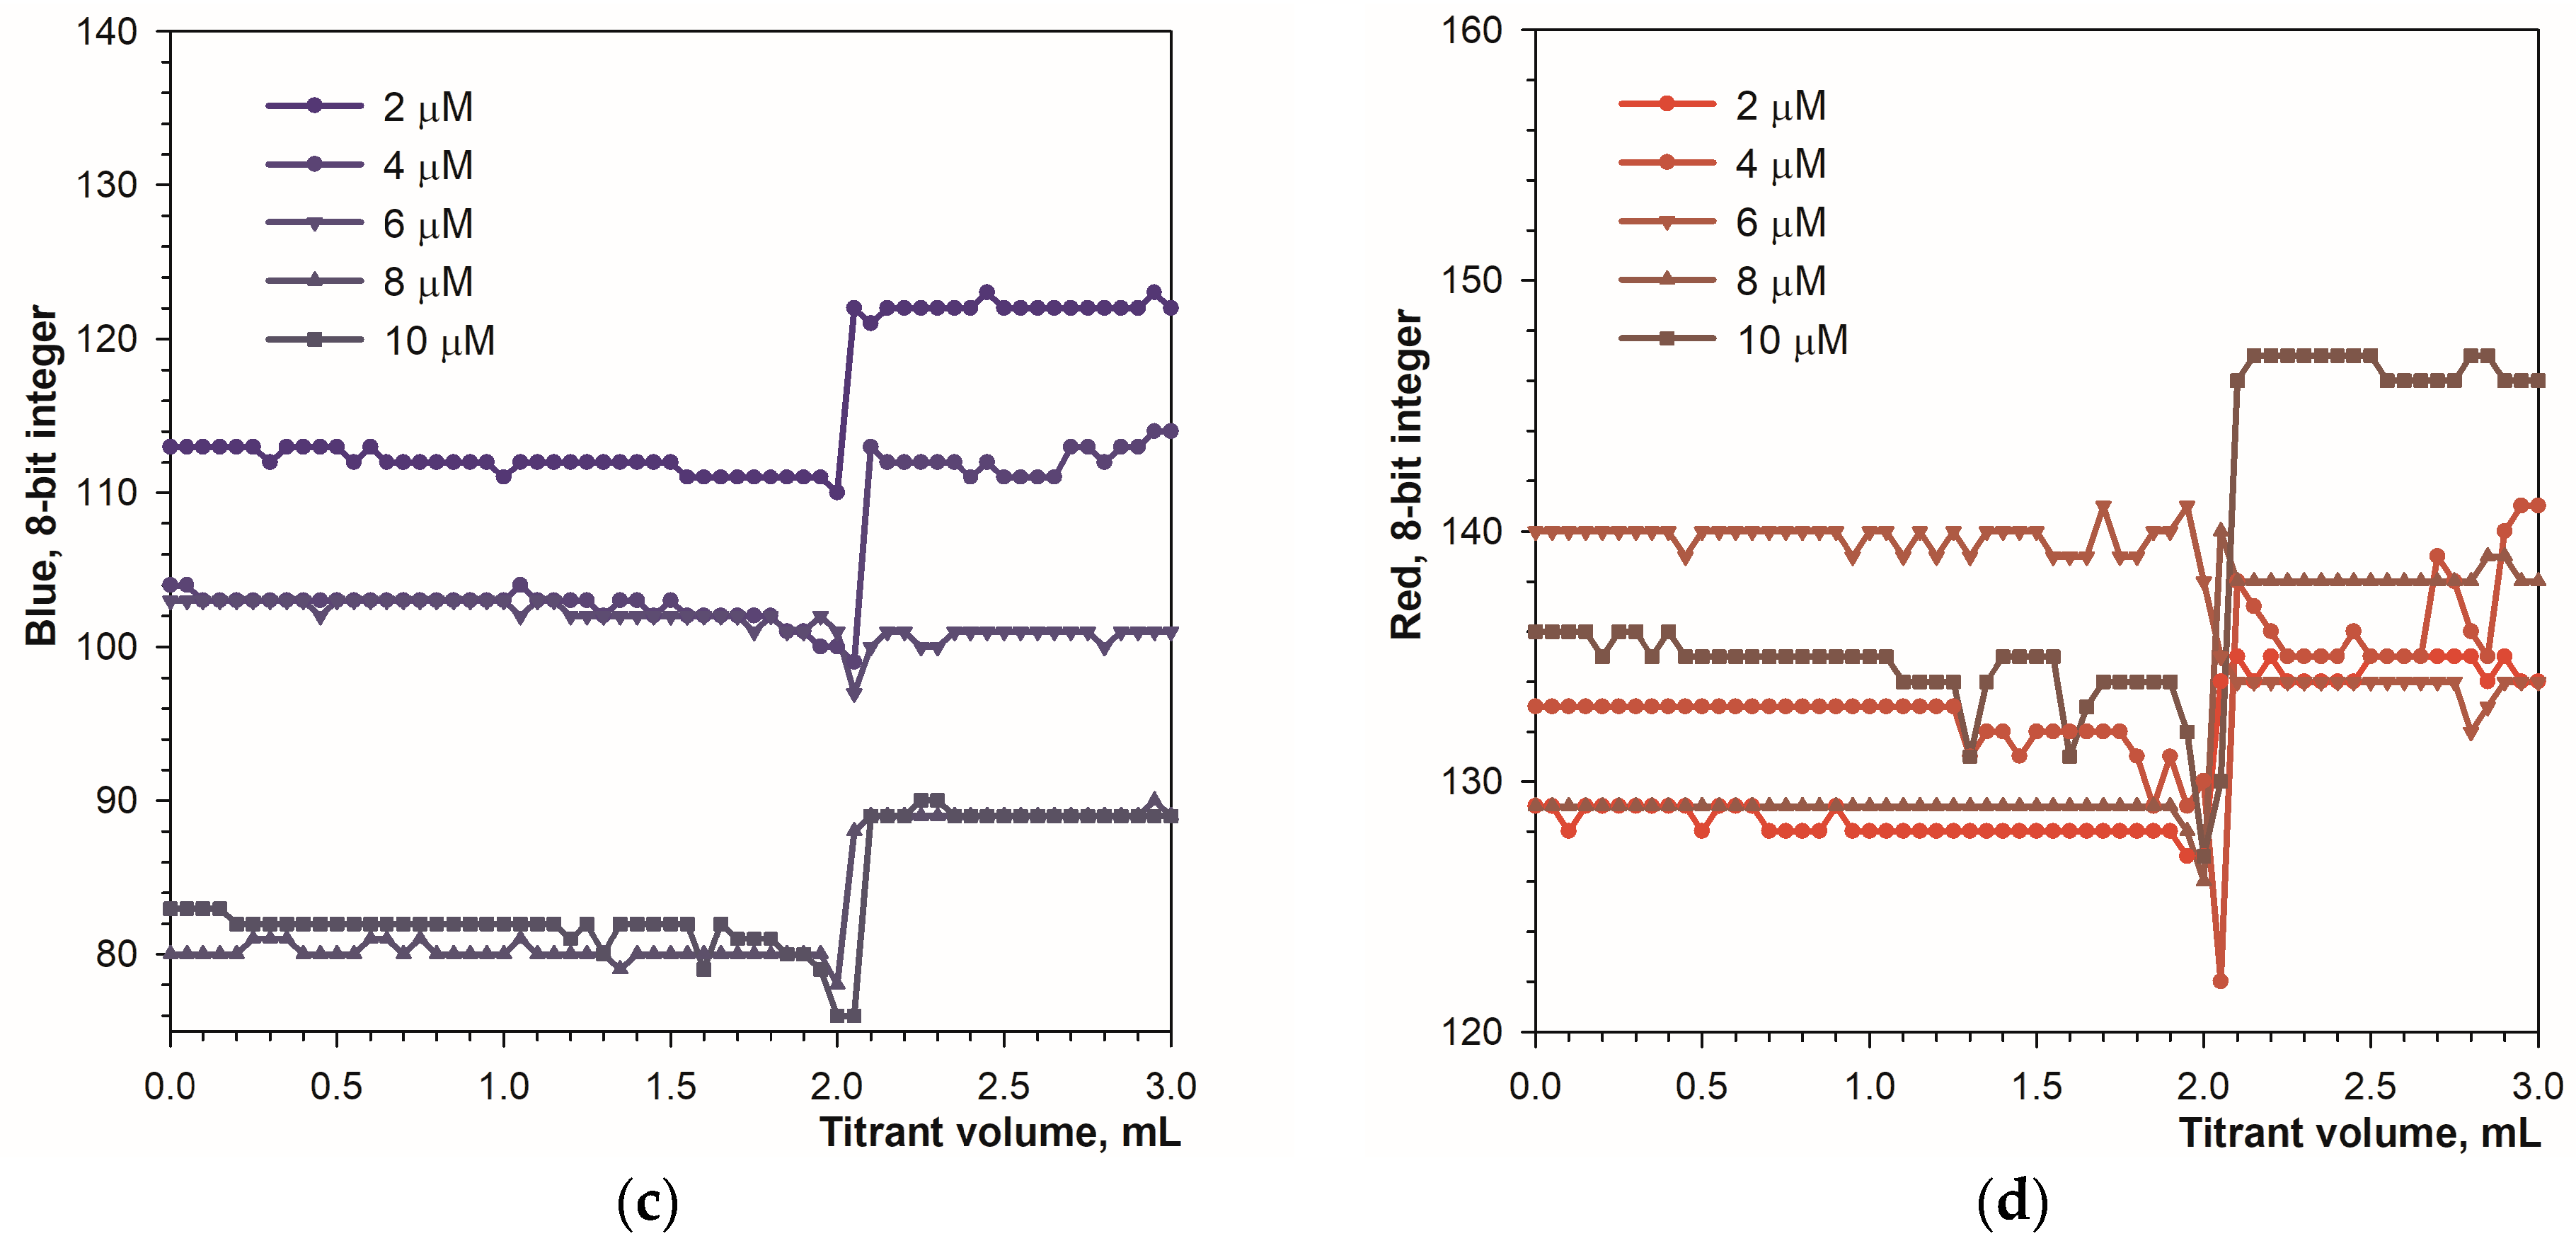
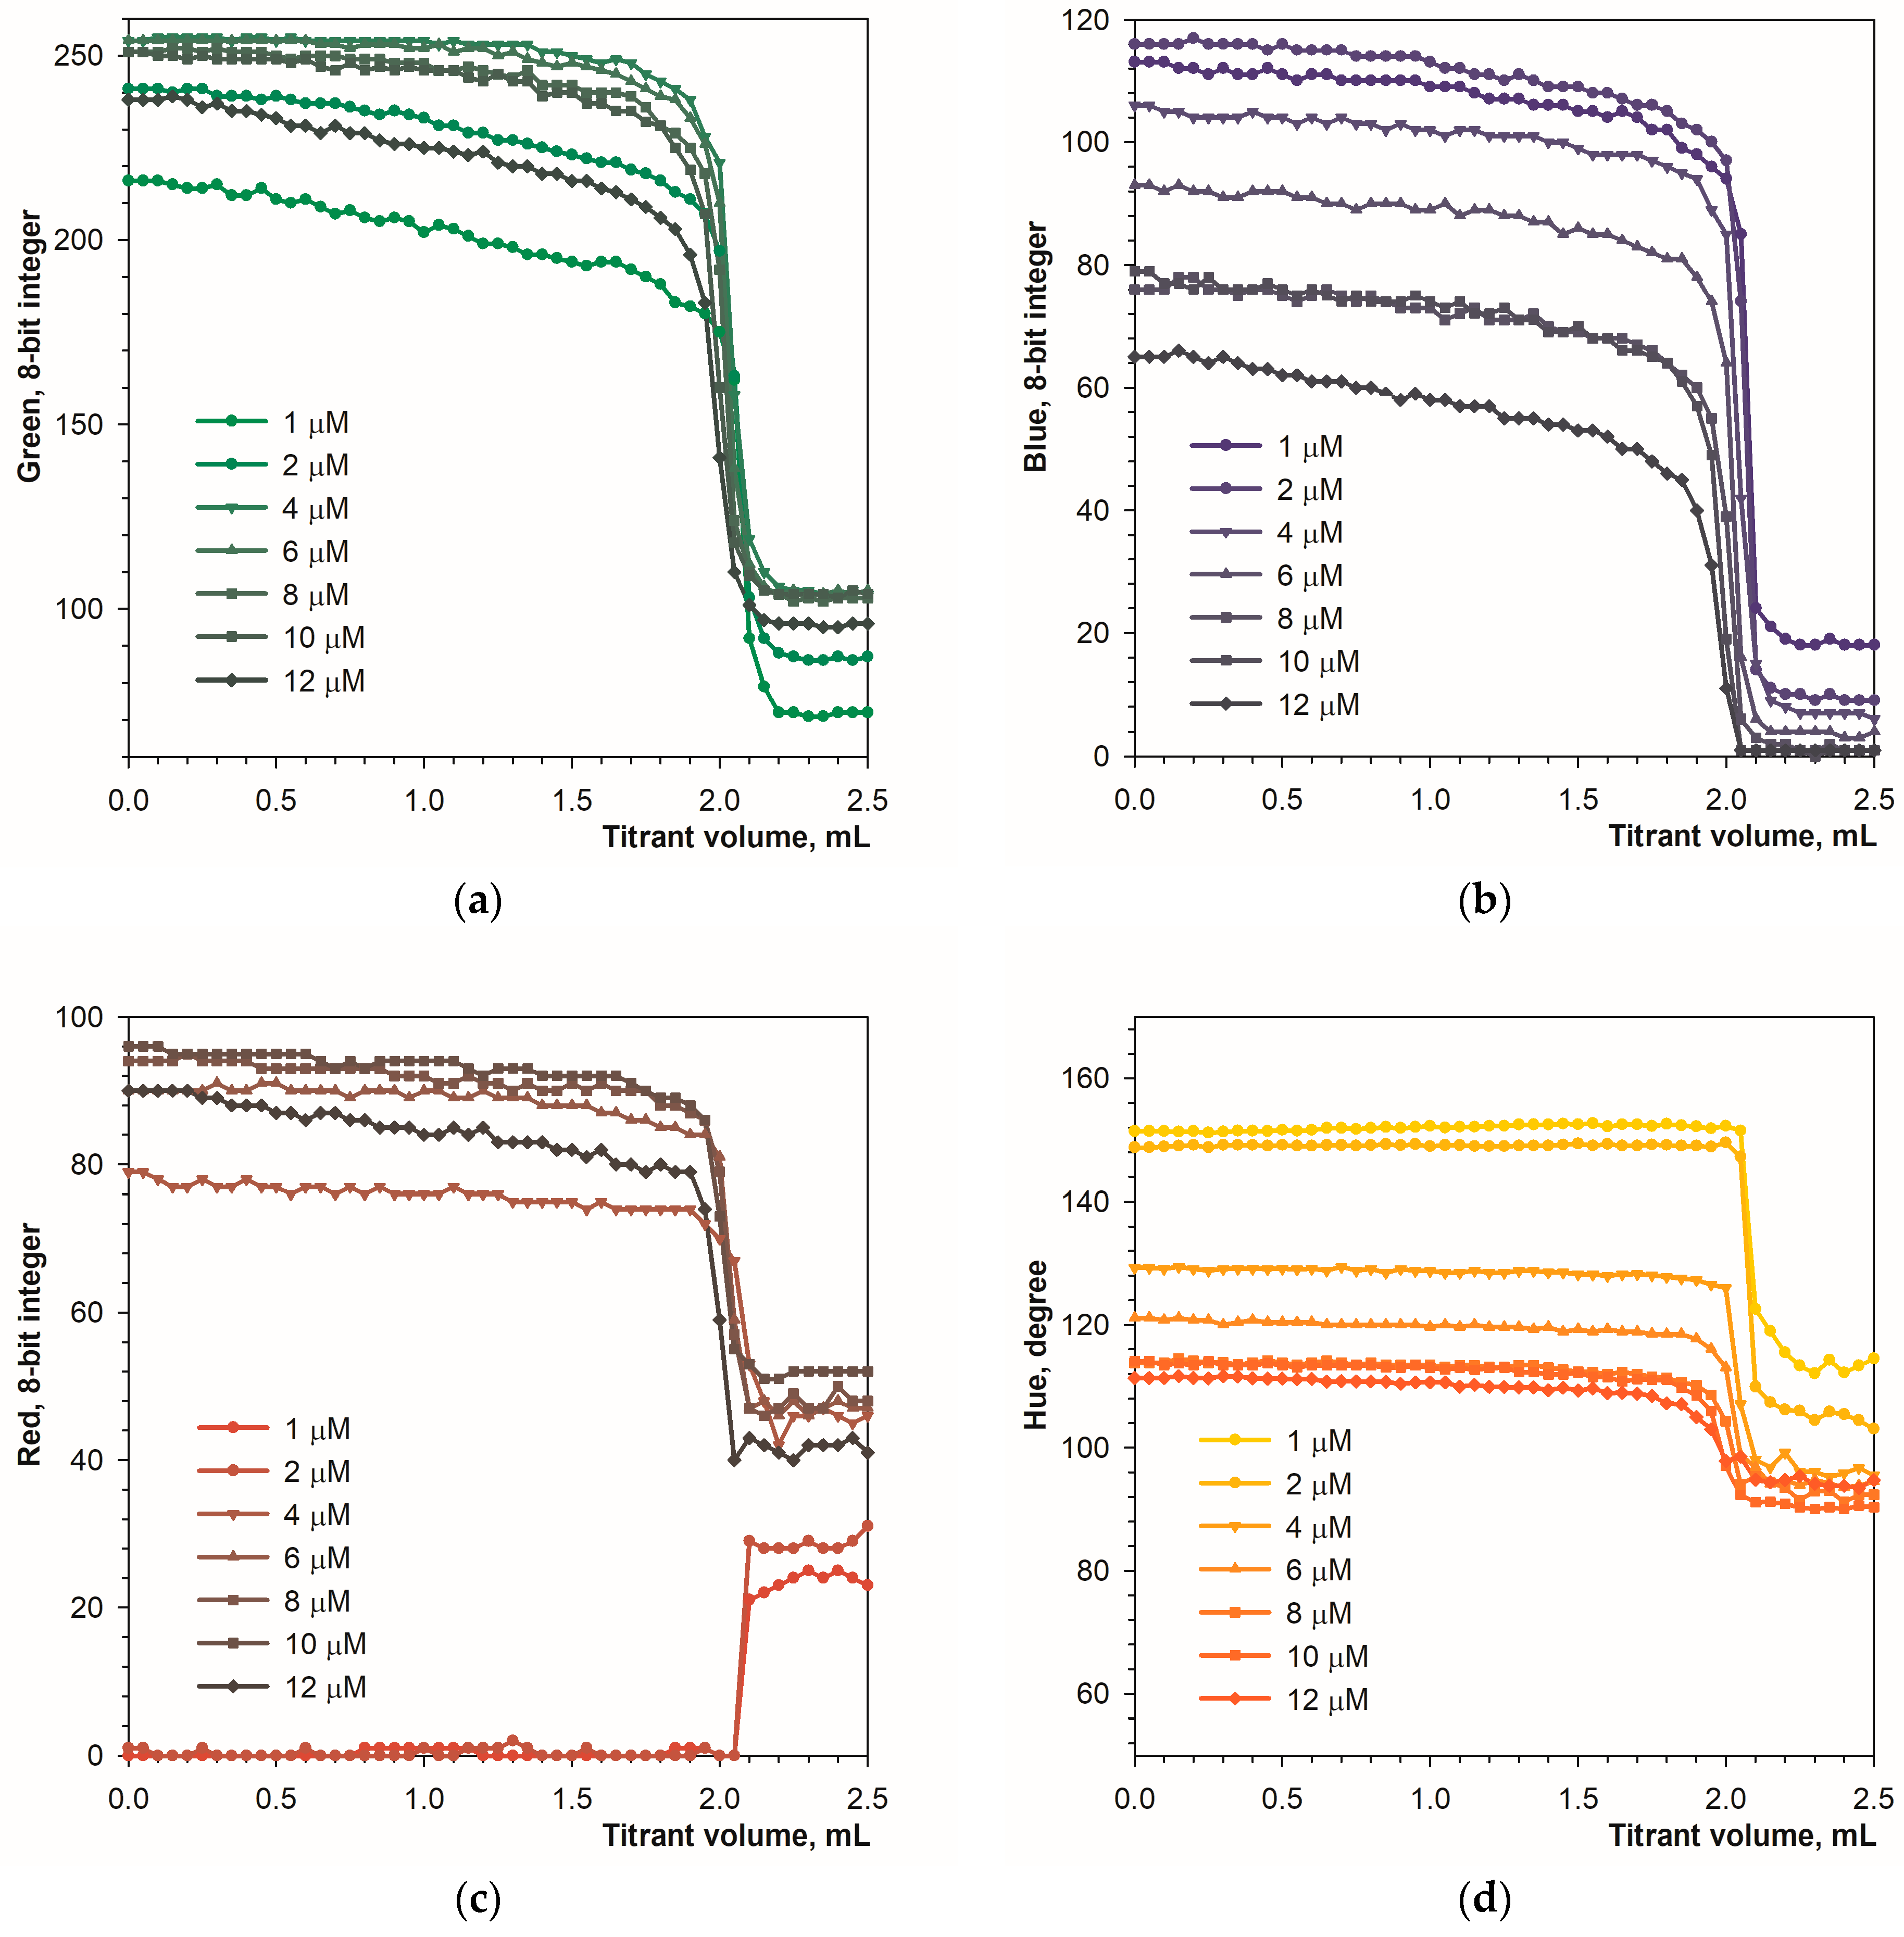
3.1. Detecting the Endpoint in Diffuse Reflection Mode

Figure 2 shows color changes in analyte solution during titration in diffuse reflection mode. The color transition is well recognizable using the Hue and green signals (Figure 3a,b). The primary blue color is less suitable due to a narrow range of changes in parameter values, and the red signal is unsuitable for detecting the endpoint (Figure 3c,d). The optimal concentration of the calcein indicator is in the range of 4 to 10 μmol L−1, but in the case of the Hue signal, a concentration of 2 μmol L−1 proved to be sufficient.
The repeatability of the measurements was determined using high and low concentrations of calcium (Table 1). In full agreement with the titration graph shapes, calcein indicator provides the most precise results using the Hue parameter compared to the primary RGB colors. The Hue parameter is characterized by particularly good performance at low calcium contents (Table 1). At higher Ca contents, the green signal also ensures a relatively low value of relative standard deviation. Additionally, each of the tested signals provides a satisfactory recovery value (Table 1), which indicates good accuracy in the determination. It can be concluded that both the Hue and Green parameters are quite suitable for automatic endpoint recognition in diffuse reflection mode.

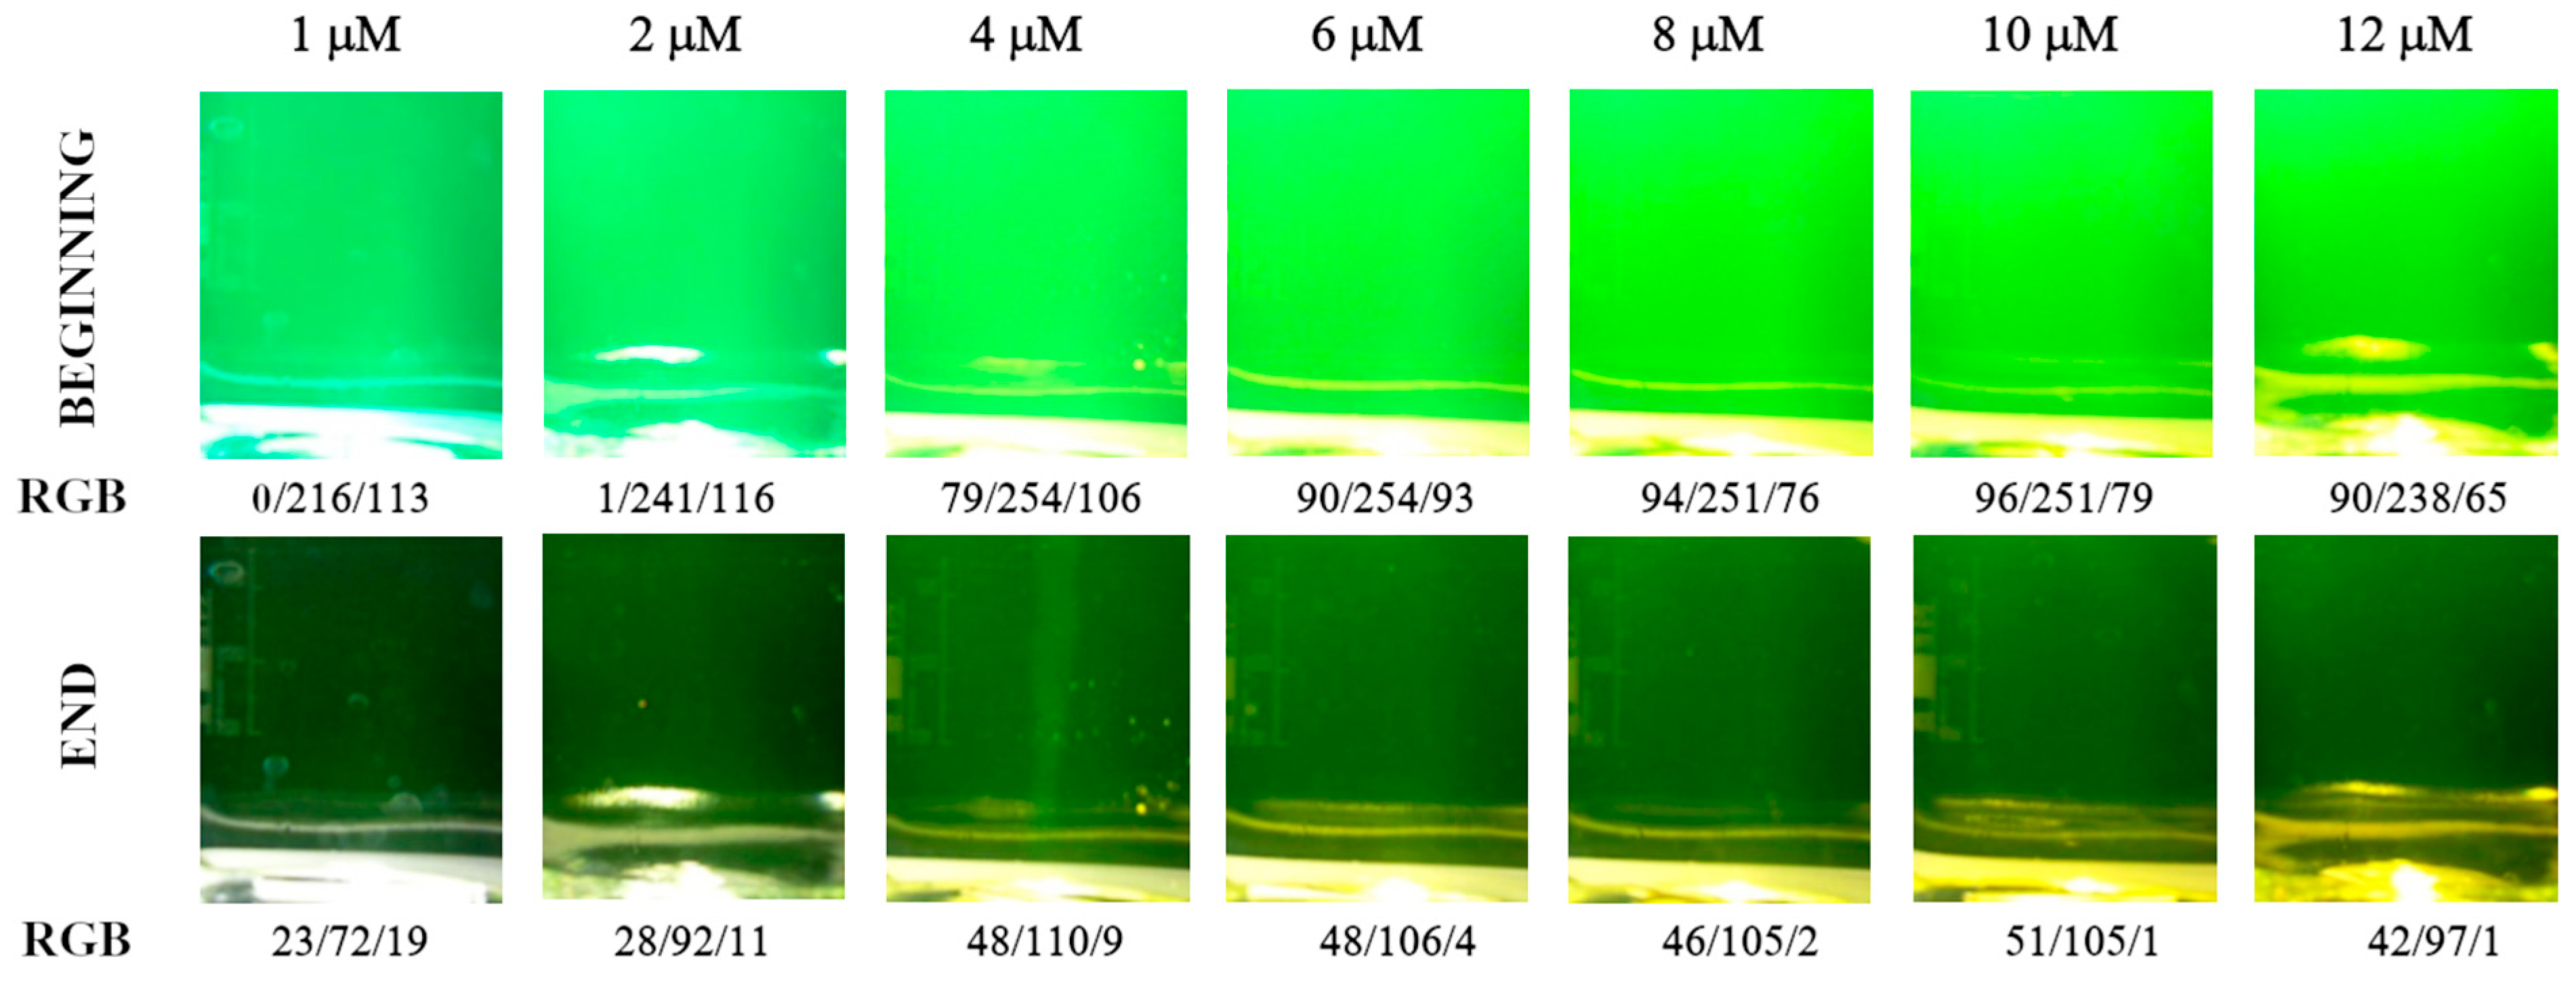
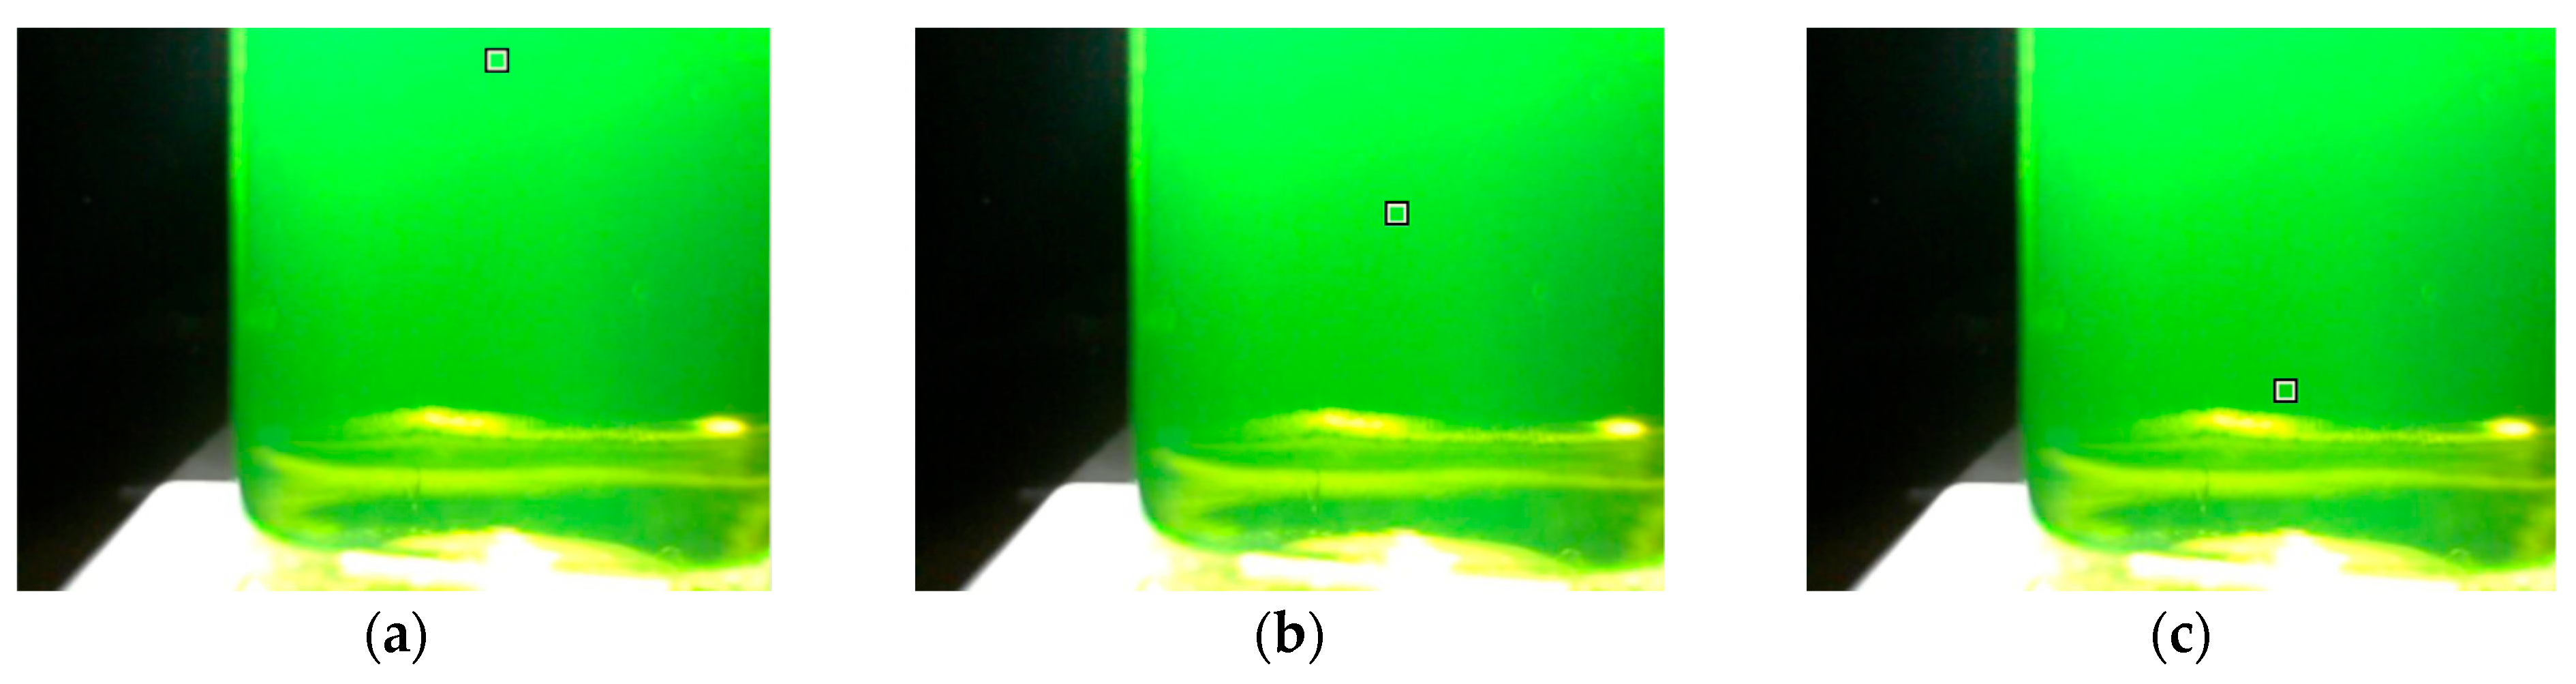
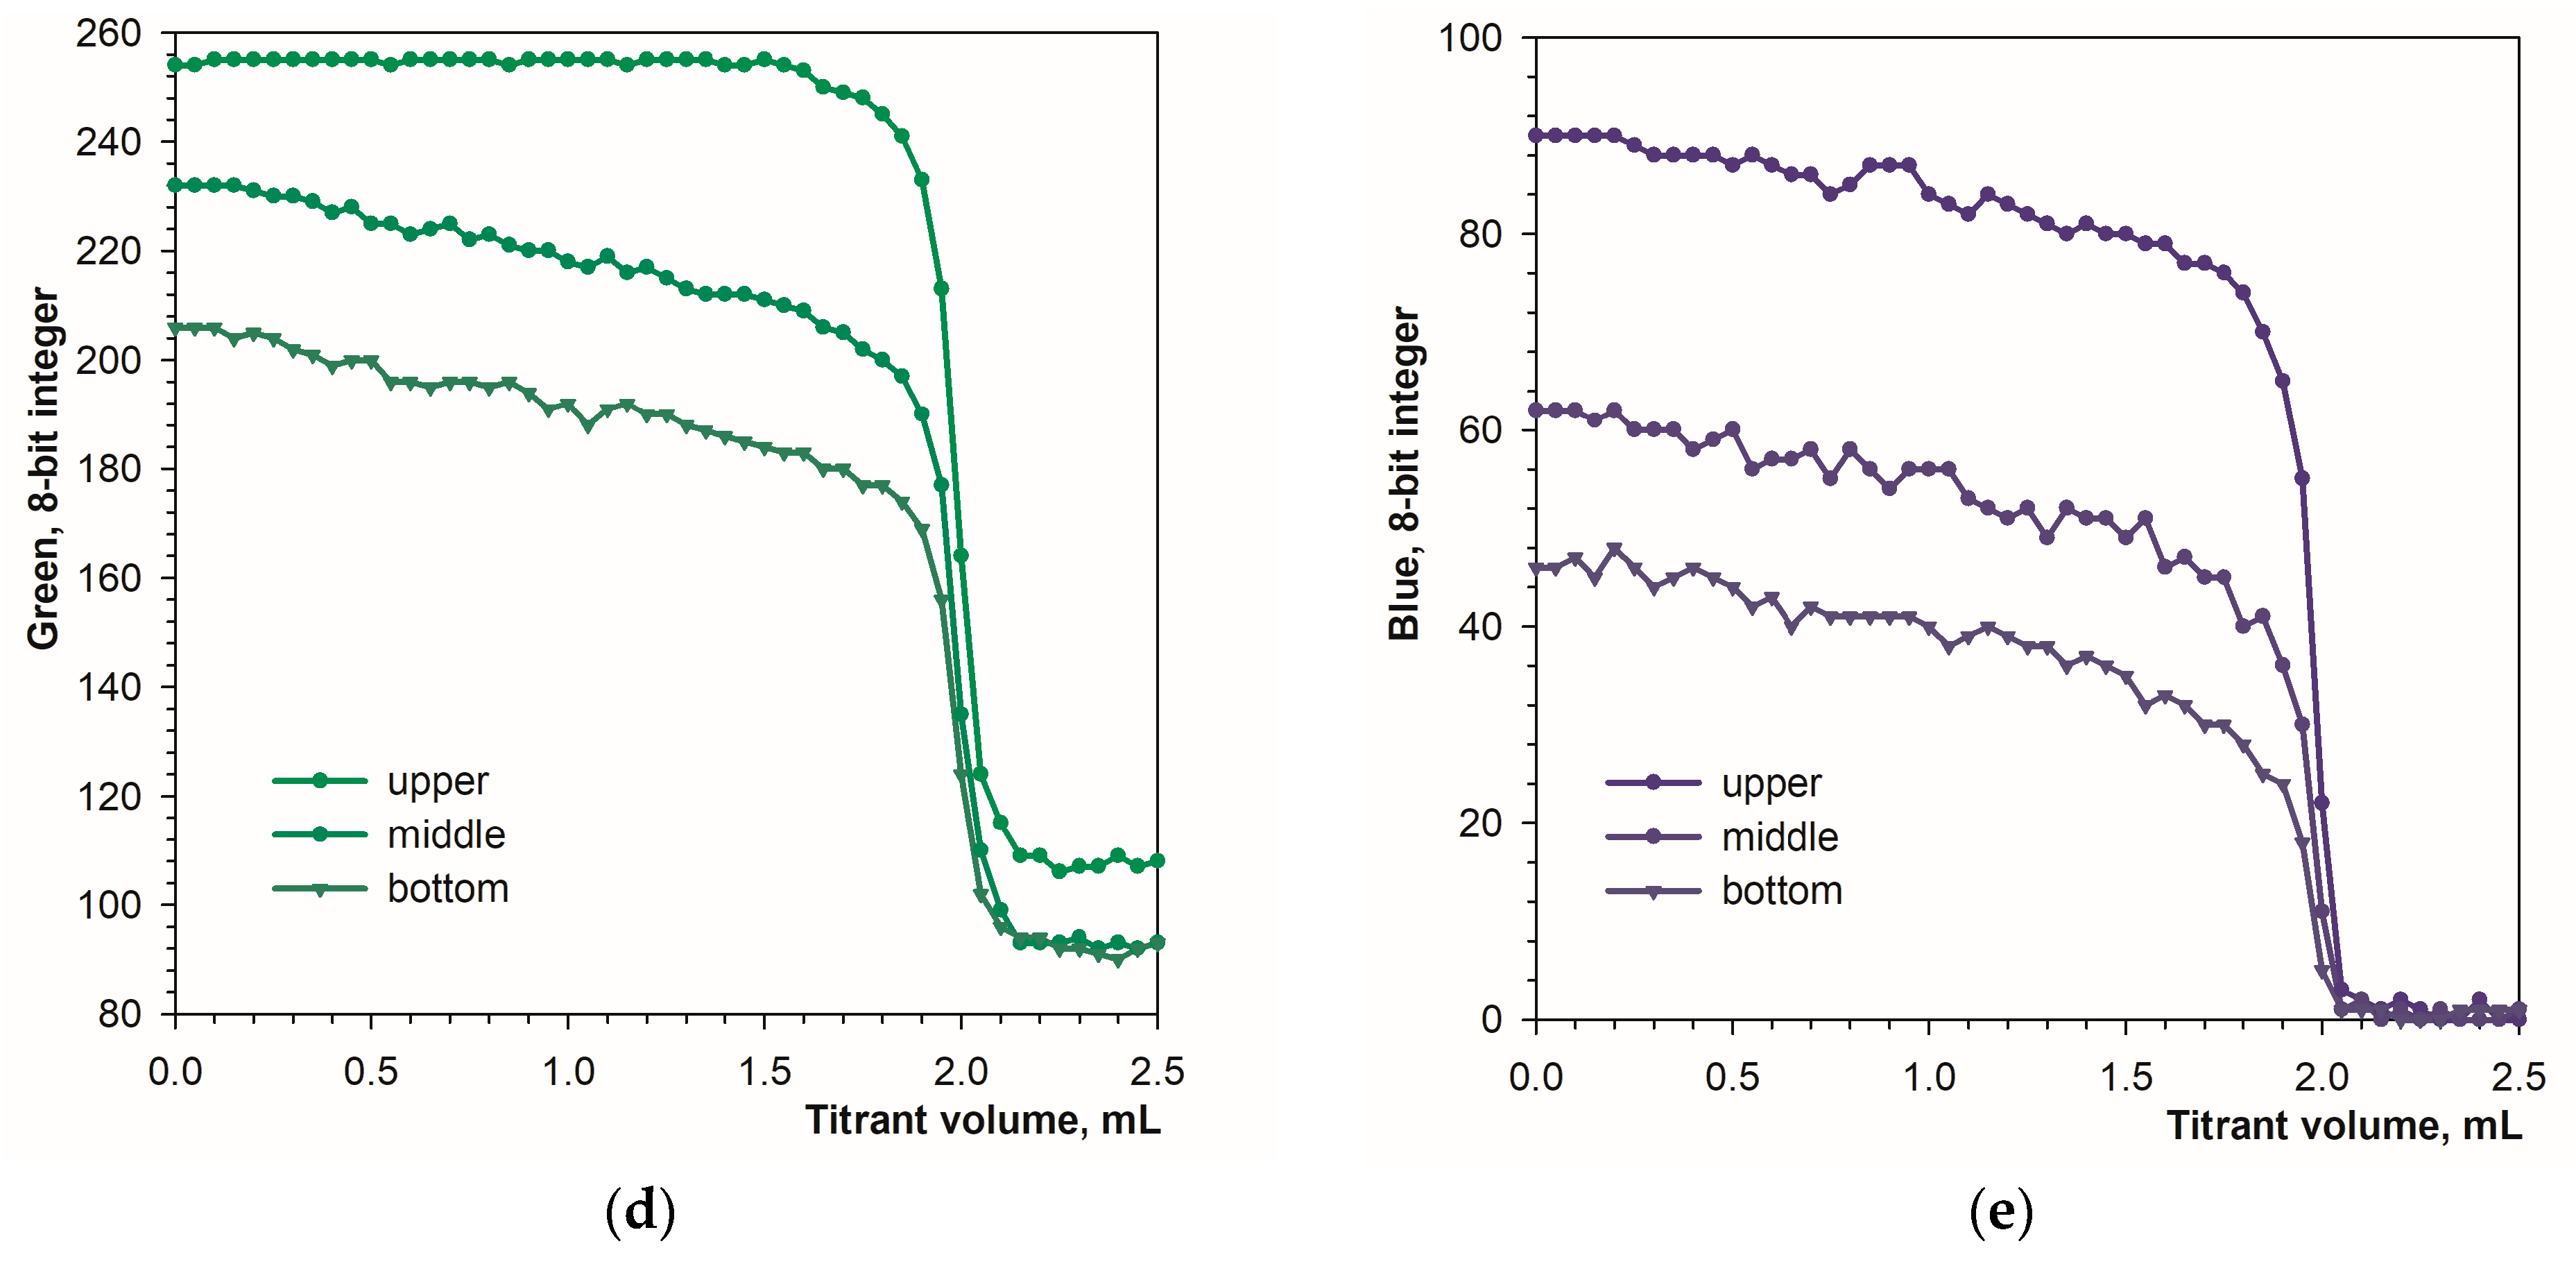
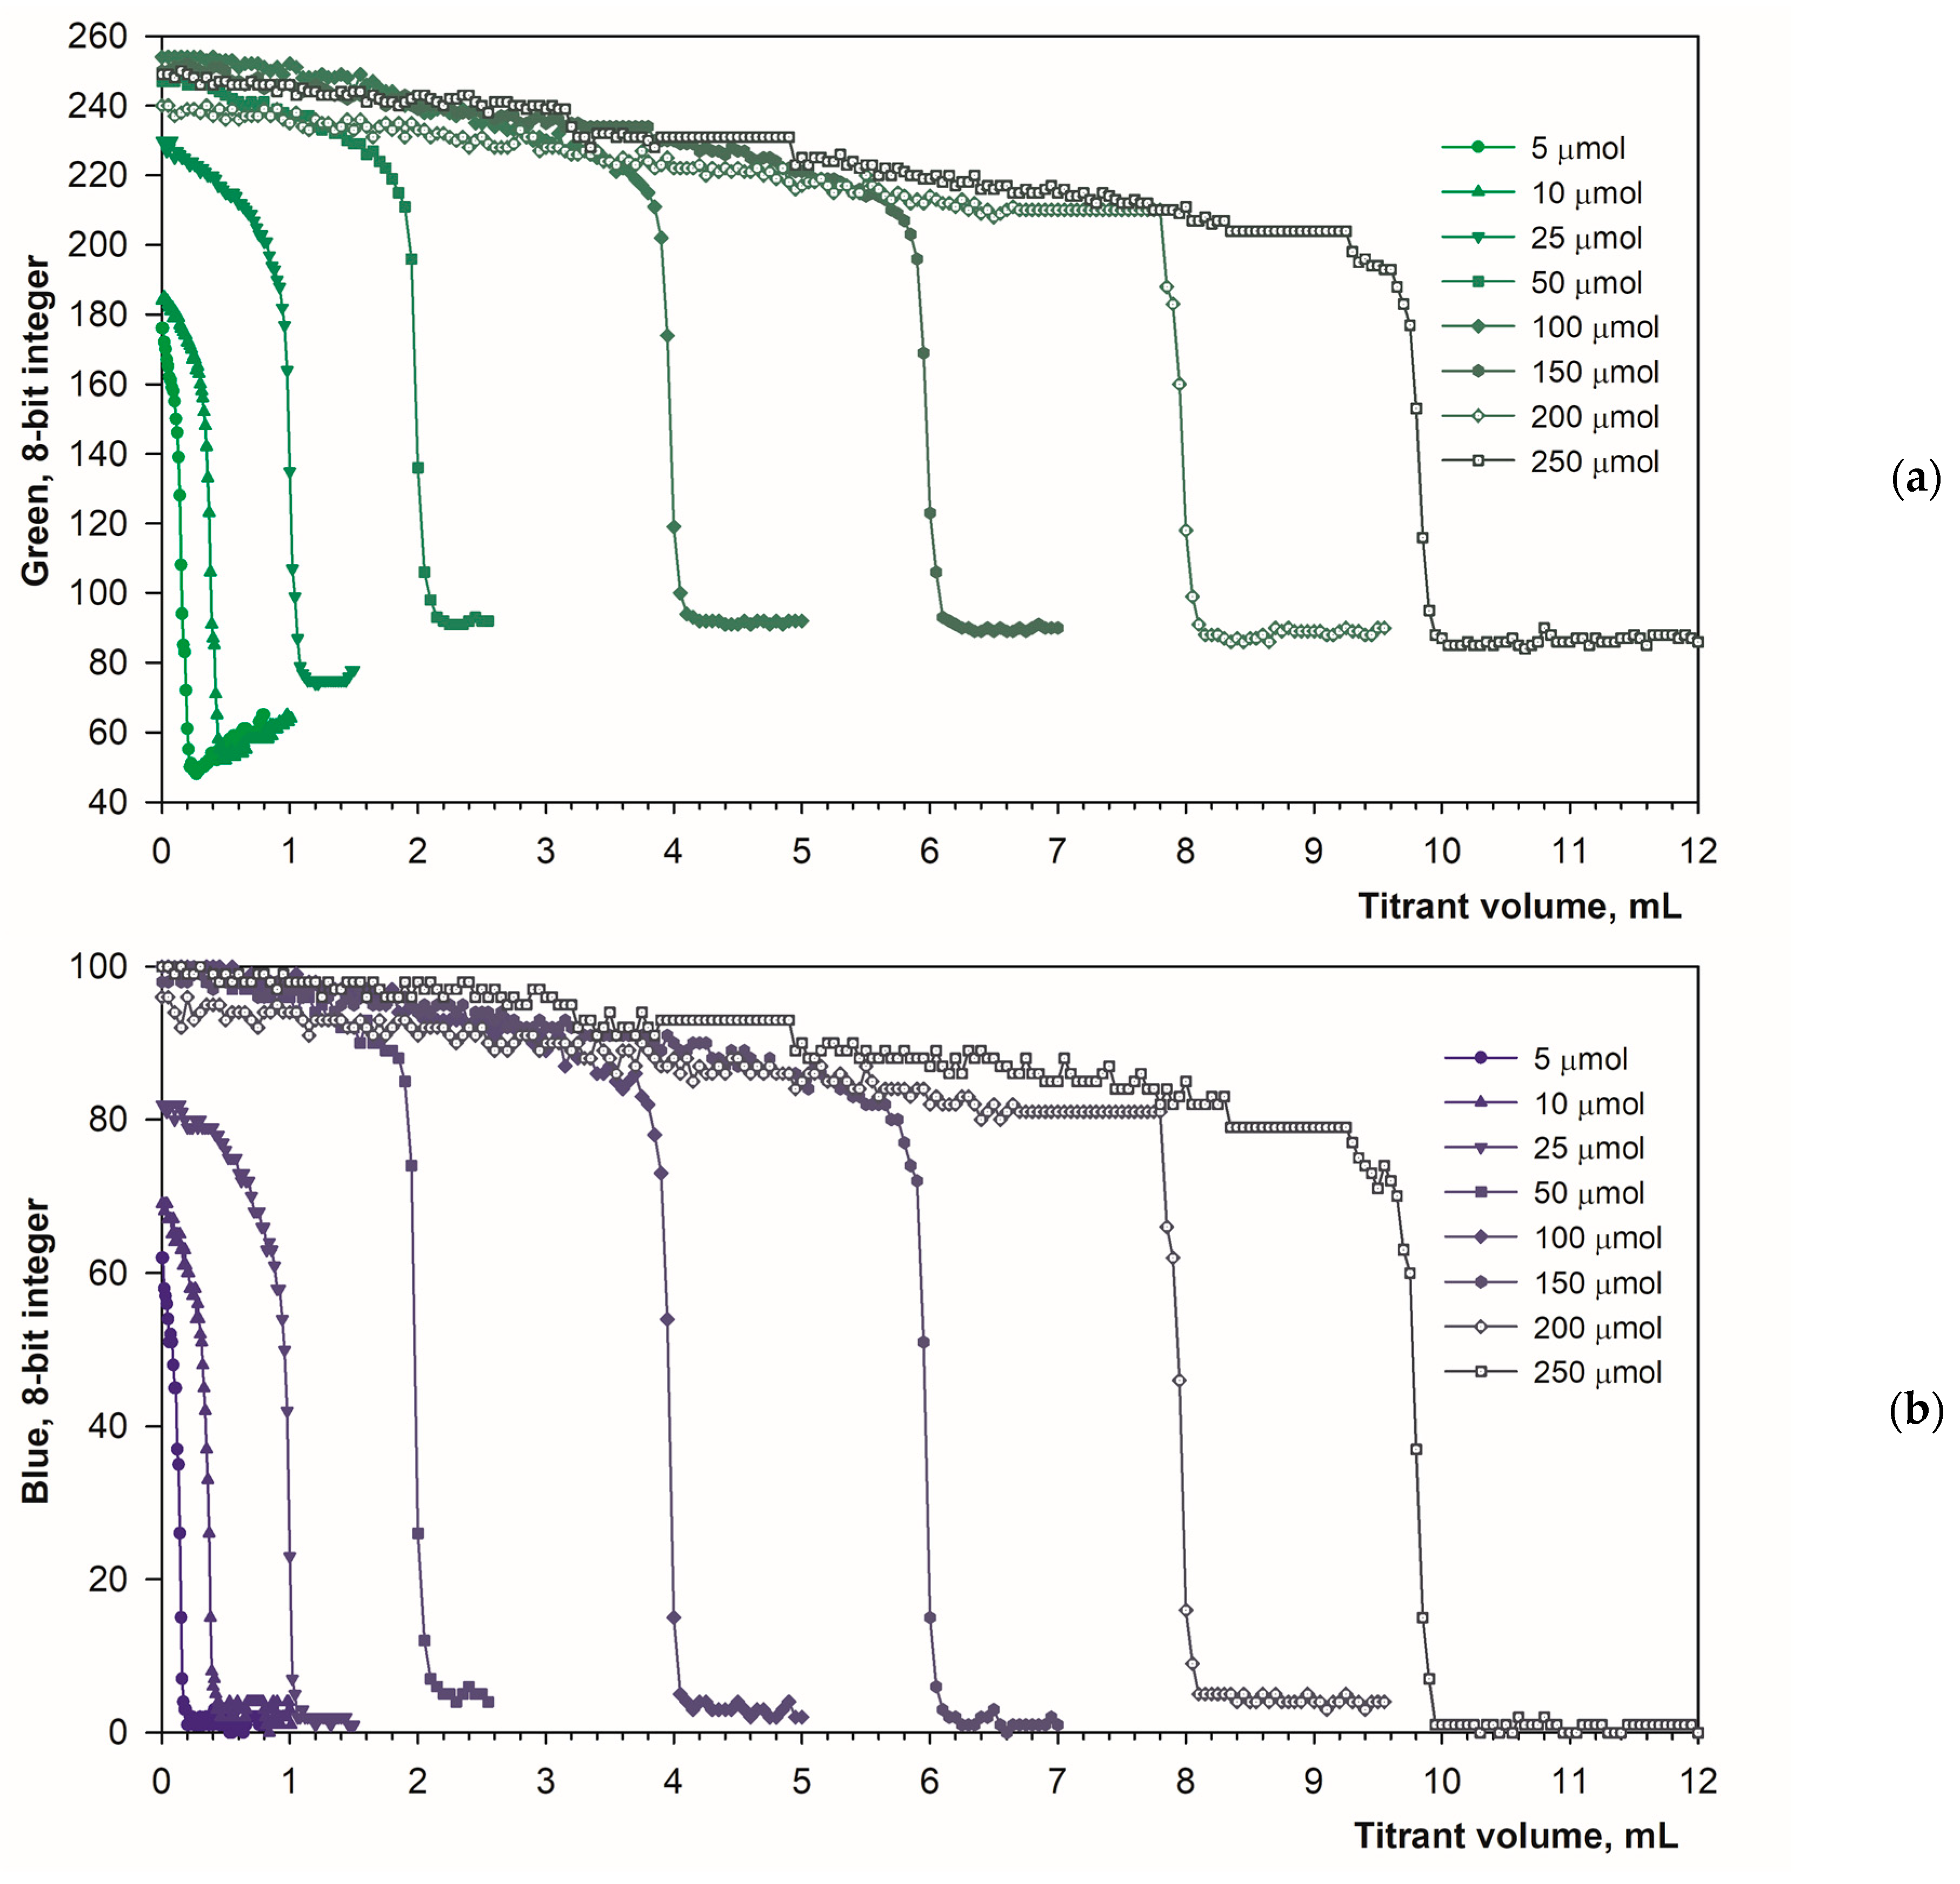
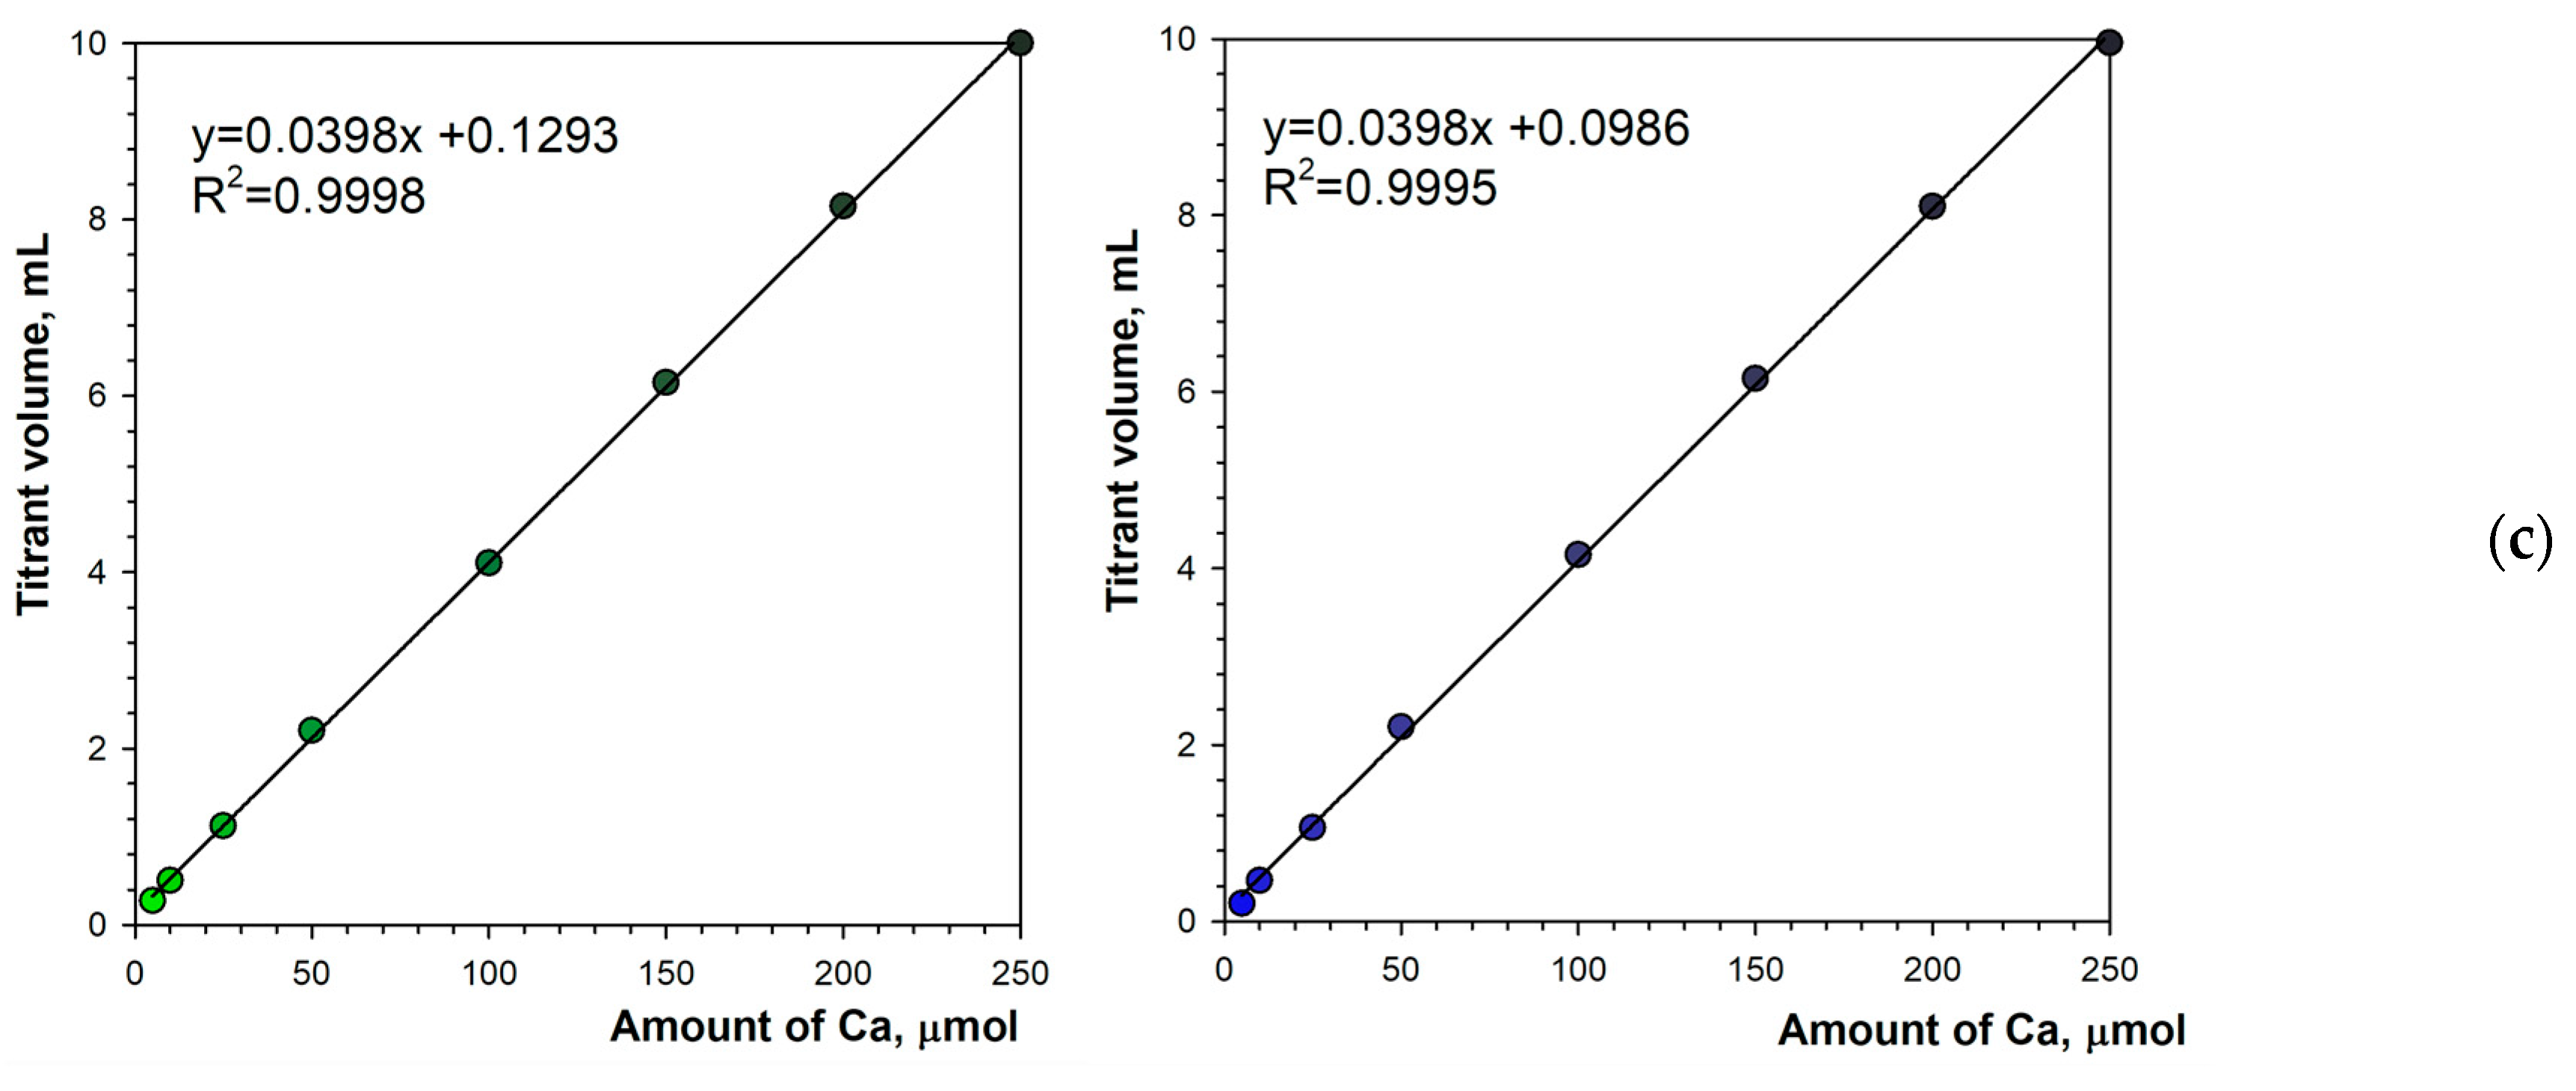
3.2. Detecting the Endpoint in Fluorescence Mode

The calcein indicator is well suited for detecting the endpoint under intense artificial lighting. The LED spotlight induces bright fluorescence in the calcein indicator complexed with calcium ions (Figure 4, Scheme 1 and Scheme 2). The emitted light is well suited for recording on a black background (Figure 1b).
The initial color for moderate calcein concentration is lime green with RGB values around 90, 250, and 100 (Figure 4). After all the calcium ions are bonded with EDTA, the color changes to very dark green with RGB values around 50, 100, and 5 (Figure 4). The color changes are far more pronounced compared with those in the diffuse reflection mode (cf. Figure 2).
Another difference between the image recording modes is color uniformity. In diffuse reflection mode, the color of the solution is fairly uniform over the height of the titration beaker. In fluorescence mode, the color of the solution changes from top to bottom. The top layer, closest to the LED light, has the lightest color, with deeper layers becoming progressively less bright. Figure 5a–c show the tested positions of the color sampling area. The location of the sampling area has a significant impact on the signal drop at the endpoint (Figure 5d,e). The higher the sampling area location, the larger the signal drop. The obvious reason for this is the internal filter effect in calcein solutions. The intensity of excited light is lower in deeper layers of the calcein solution because of absorption in the higher layers. For this reason, the sampling area should be located at the upper part of the image.
The applied calculation procedure allows for a free choice of sampling area size (Section 2.2). Figure 6 shows the influence of the sampling area size on the sharpness of the endpoint detection. The increase in sampling area results in a slight decrease in the signal drop at the titration endpoint. In the case of the blue component, increased signal fluctuations are observed for small sampling areas (Figure 6b). Therefore, in the case of the Blue component, it is averaging the signal over a larger area is recommended.
Another parameter influencing the titration curve is the amount of calcein in the analyzed solution. Figure 7 shows the titration curves obtained in the presence of different concentrations of the calcein indicator.
At the end point of the titration, the green signal drops rapidly by 130 units (Figure 7a). The concentration of the calcein indicator has little effect, especially above 6 μM. The blue signal drops by 60 to 100 units (Figure 7b). The red and Hue signals have smaller ranges of change (Figure 7c,d). It can be concluded that in fluorescence mode the calcein indicator is applicable in the concentration range from 1 to 12 μmol L−1.
The selected optimal parameters allow for a reliable determination of the calcium content in the solution. Figure 8a,b show titration graphs obtained for calcium amounts ranging from 5 to 250 μmol. In fluorescence mode, the emitted light does not depend on ambient lighting due to stable luminous flux from the spotlight used (Figure 1b). Additionally, the black background minimizes the reflectance of diffused ambient light. As a result, the titration graphs have uniform character throughout the measurement series (Figure 8a,b). As the calcium concentration increases, the endpoint drop in the green signal decreases only slightly (Figure 8a). Therefore, the upper range of determination is probably far higher than the tested value of 250 μmol. Figure 8c shows the excellent linearity of the method. The coefficients of determination are R2 = 0.9998 and R2 = 0.9995 for the green and blue color components, respectively. Both the linear equations have the same slope of 0.0398 mL μmol−1. The graph shift values are irrelevant (0.1293 mL and 0. 0986 mL for the green and blue color components, respectively).
The variance in calcium quantitation in fluorescence mode was determined using high and low concentrations of calcium (Table 2). The calcein indicator provides quite precise results for all the color characteristics in question (Table 2). The green signal provides lesser values of relative standard deviation due to a larger fall at the endpoint. The other color parameters also provide acceptable precision (Table 2). The accuracy of the determination expressed as percentage recovery is satisfactory, with the exception of the Hue parameter applied to low calcium contents. Thus, the obtained results correspond to the shapes of the titration curves shown in Figure 7.
Table 3 shows a comparison of the titration method and AAS used for the Certified Reference Material. The recovery of the titration method is slightly higher than that of the AAS method (Table 3).
The repeatability of the titration method and AAS was also compared by analyzing natural waters with different mineralization (Table 4). Again, the best titration repeatability was obtained using the Green signal. The largest values of RSD were observed for the titration method in the case of the low-mineralized water A2 (Table 4). The obvious reason is that the amount of analyte is close to the lower limit of quantification (Figure 8a). The inter-day and intra-day values of RSD are similar (Table 4), indicating a good stability of the titrant solution. Calcium concentrations determined by the AAS method confirm the correctness of the results obtained by the titrimetric method. The results shown in Table 3 and Table 4 suggest that the calcium concentrations determined by the AAS method are slightly underestimated, and the concentrations obtained by the titrimetric method are slightly overestimated.
Table 5 presents the reproducibility of the measurements using the titrimetric method determined for mineral and river waters. The results obtained by two operators did not differ significantly, especially when the Green signal was used to determine the titration endpoint. Discrepancies in test results were probably due to human errors during the solution preparation.
Based on the measurement results shown in Table 4 and Table 5, it can also be seen that the repeatability of measurements for mineral water may be worse than that for natural water. The bottled water C3 is slightly carbonated. For this reason, despite degassing the sample before testing, the scatter of results may be slightly greater than in the case of non-carbonated waters (i.e., river and tap waters).

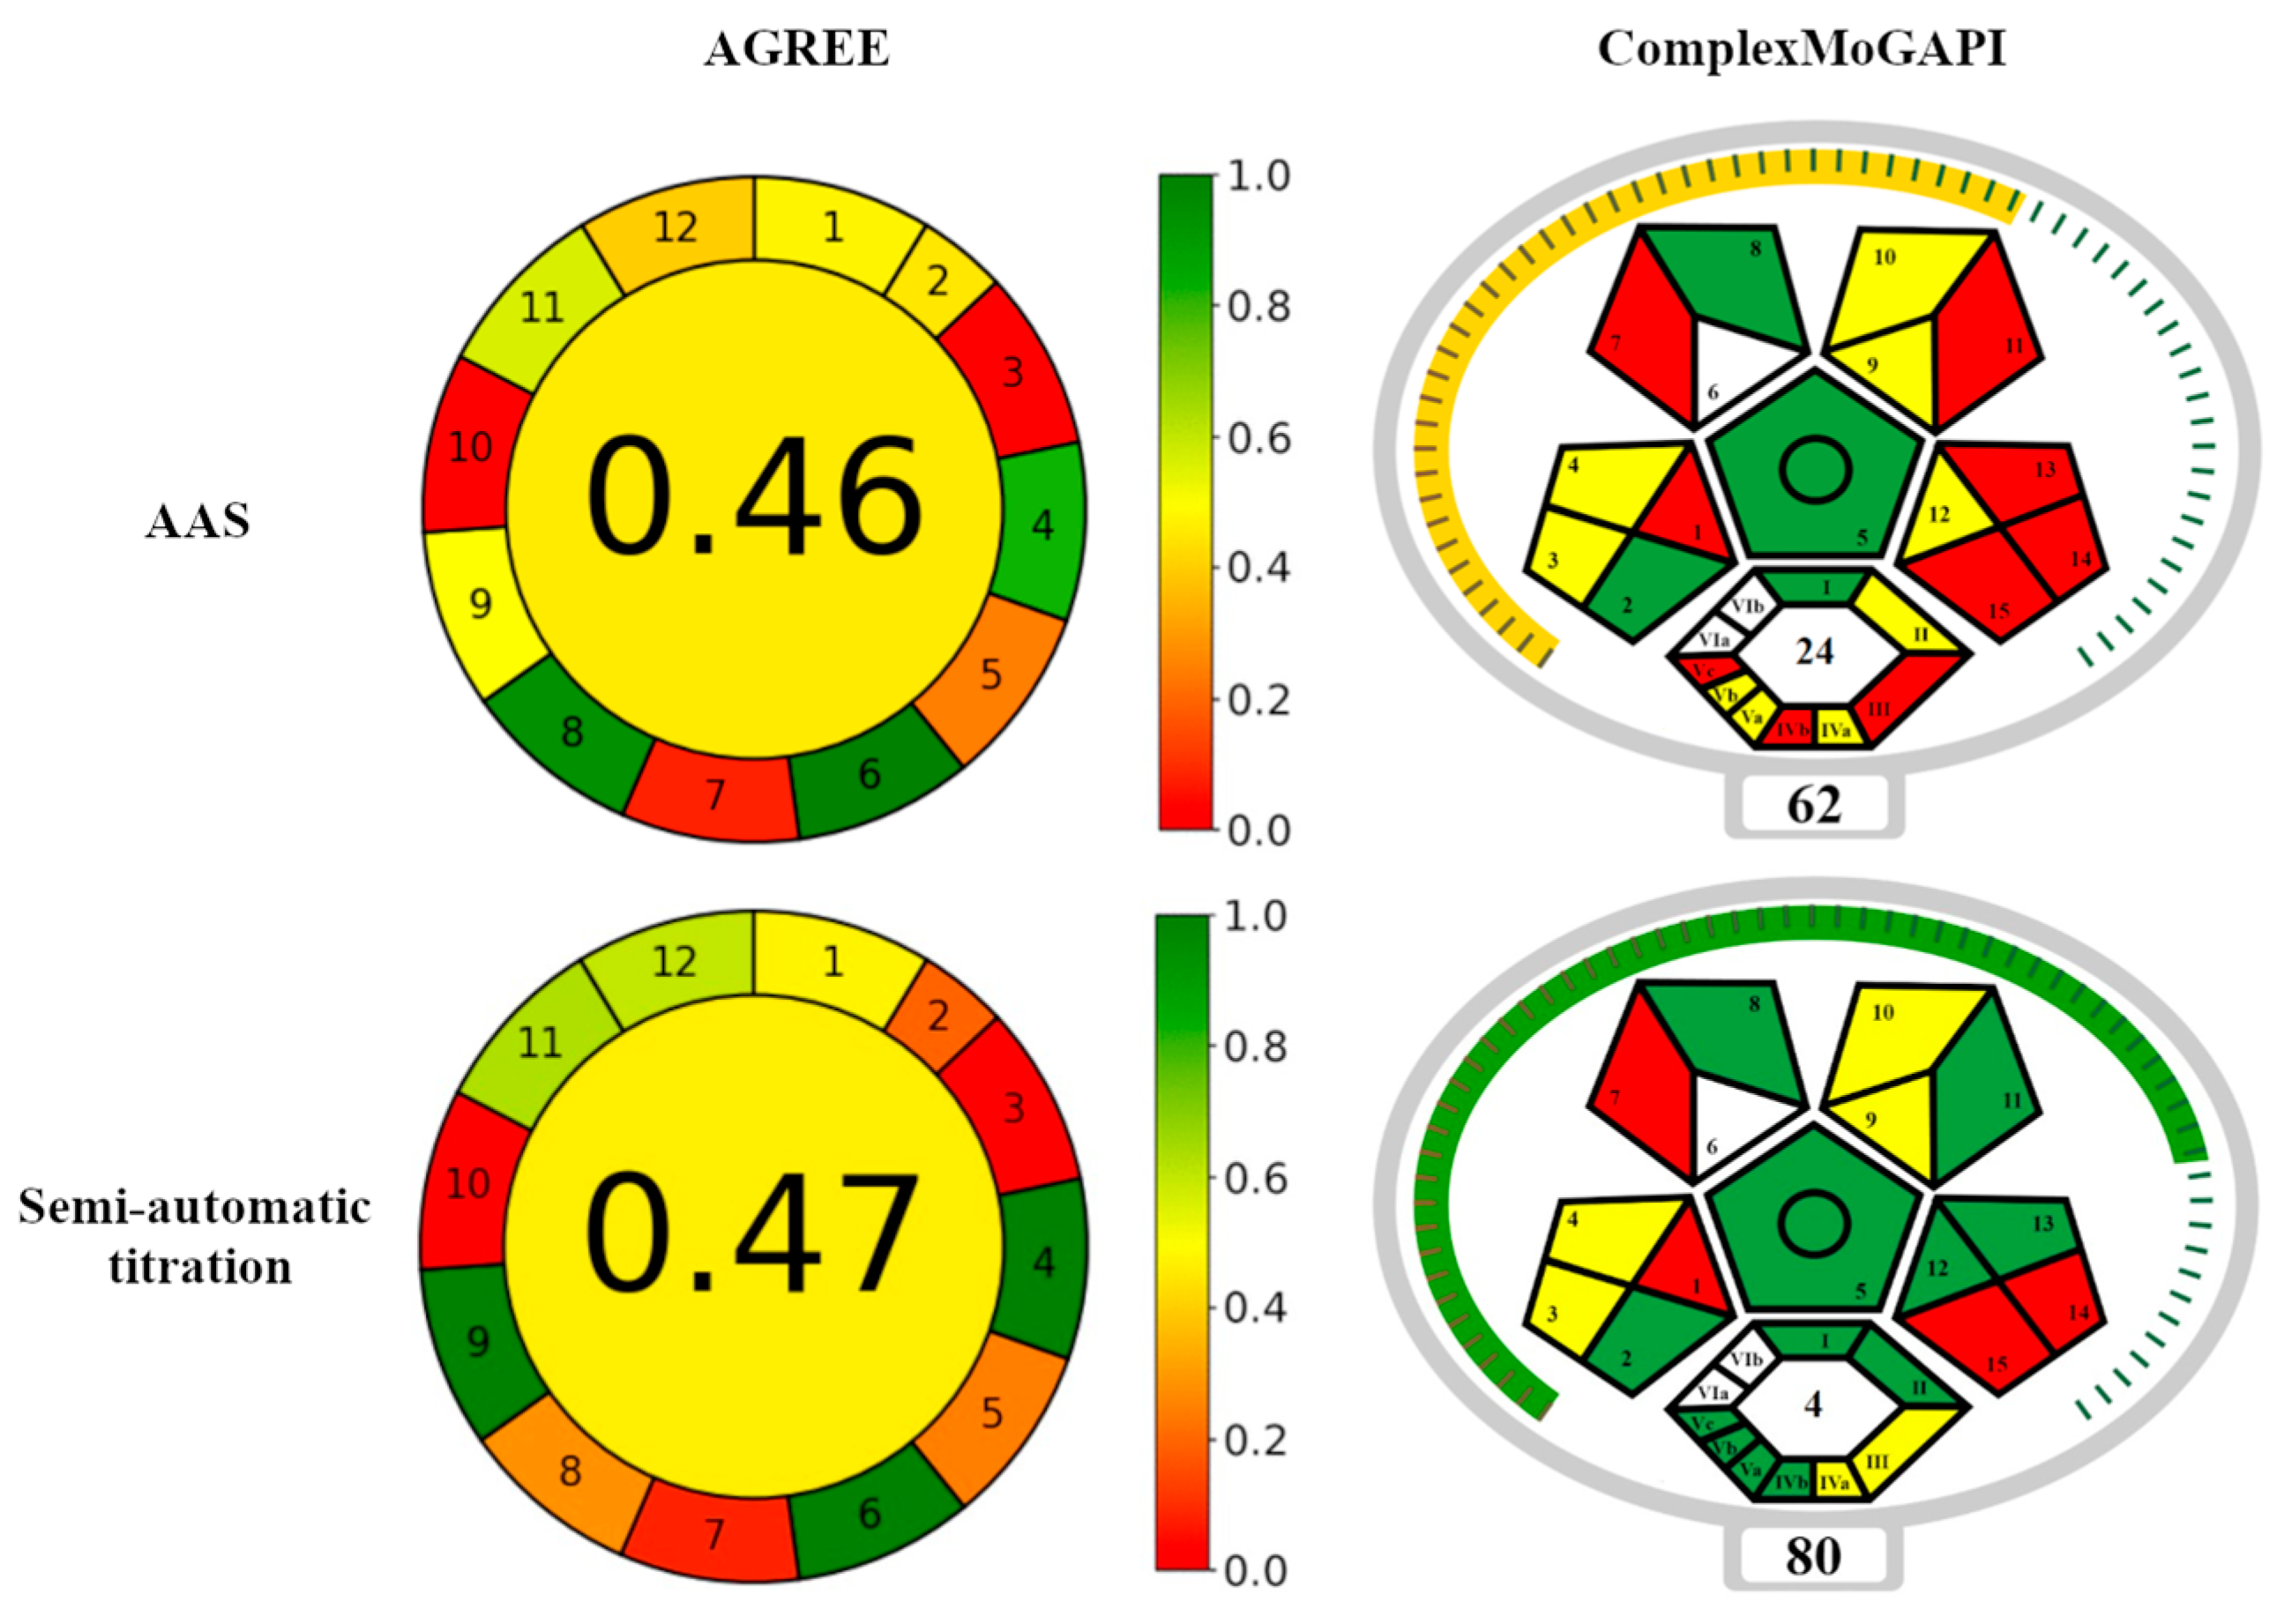
3.3. The Environmental Friendliness of the Titration Procedure

The developed procedure for semi-automatic calcium titration in fluorescence mode was compared with the standard AAS measurement method in terms of environmental friendliness. The tools used for this purpose were AGREE and ComplexMoGAPI tests.
The AGREE (Analytical GREEnness Metric Approach) test is based on the 12 principles of Green Analytical Chemistry [47]. Within each criterion, the calculator generates partial values, and the resulting final score ranges from 0 to 1, with higher values indicating better environmental friendliness. The ratings are assigned a color, which smoothly changes from Red (least environmentally friendly) through Yellow to Green (most environmentally friendly). The AGREE test has been frequently used to evaluate analytical methods used in pharmacy [48,49]. The GAPI (Green Analytical Procedure Index) tool [49] is a modification of the AGREE test. It assesses the greenness of the entire analytical methodology, including the sampling step, which is not included in AGREE. It assigns three values to individual criteria: Green, Yellow, or Red, understood in the same way as in the AGREE method. It was used, among others, to evaluate analytical procedures used in the determination of biogenic amines in wine samples and the determination of polycyclic aromatic hydrocarbons (PAHs) [50], as well as for determining pesticides in grapes [51]. The GAPI test is considered more informative compared to other tests. The procedure can be extended with additional criteria, which enables the assessment of the greenness of the synthesis/production of organic compounds or solvents, nanomaterials, or stationary phases (ComplexGAPI [52]). The ComplexMoGAPI test provides an overall assessment [53]. The assessment criteria according to the AGREE and ComplexMoGAPI tests are listed in Table 6 and Table 7. Figure 9 shows the final result of the comparison.
In terms of environmental friendliness, the semi-automatic titration procedure and the AAS method have their own advantages and disadvantages. According to the AGREE test, semi-automatic titration requires the use of larger analyte portions and is less efficient (criteria 2 and 8 in Table 6 and Figure 9) compared to the AAS method. On the other hand, the semi-automatic titration is a more economical method than AAS in terms of the organization of the analytical procedure and energy consumption (criteria 4 and 9 in Table 6 and Figure 9). Moreover, titration is preferred due to the lower consumption of toxic reagents and their lower toxicity (criteria 11, 12 and 7, respectively, in Table 6 and in Figure 9). As a result, the total score of semi-automatic titration according to the AGREE test is comparable to the AAS method (Figure 9). The advantages of the semi-automated titration method are low energy consumption and better operator safety.
The ComplexMoGAPI test showed that the considered analytical methods differ in terms of energy consumption (parameters 12, Vb, and II in Table 7 and Figure 9), the degree of complexity of the procedure (parameter Va in Table 7 and Figure 9), and operator safety related to exposure to toxic reagents (parameters 11 and IVb, as well as 13 and Vc in Table 7 and Figure 9). The semi-automated titration method proved to be more environmentally friendly. Additionally, this method satisfies more green chemistry rules (parameter III in Table 7 and Figure 9). The overall rating of semi-automatic titration according to the ComplexMoGAPI test is much better than that of AAS method (Figure 9).

3.4. Determination of Calcium in Mineral Water Samples

Table 8 shows the results of calcium determination in the commercial mineral waters. Determined calcium content ranges from 2.81 to 306.6 mg L−1. The measured values are usually in line with the values declared by the manufacturers. Discrepancies greater than 20% occur only in cases AK, S1, SE, MU2, and S2. This is not only related to extremely low or high calcium contents or carbon dioxide contents.
Discrepancies between the values determined and declared by the manufacturer (Table 8) may result from the fact that the composition of water changes over time. To study this question, water samples of the brand O1 were tested for a long time (Figure 10). This local mineral water source has been operating for 130 years and supplies water with a calcium–hydrogen carbonate character. The spring is fed by rainwater infiltrating through the ground into the deposit. It is the quaternary sediments that are the source of calcium, which is gradually washed away by precipitation. Such springs are typical in the area of north-western Poland [54].
It turned out that the concentration of calcium in O1 brand samples varies within a fairly wide range (Figure 10). The obtained results suggest that calcium concentration is subject to seasonal trends. Higher calcium concentrations occur in summer, while lower concentrations occur in spring and autumn. It has been reported that seasonal changes in groundwater calcium concentration are caused by changes in precipitation [55]. Probably, the observed changes in calcium concentration (Figure 10) are also related to the amount of precipitation. However, the effect of precipitation is not clearly pronounced because the infiltration process occurs rather slowly and is limited by absorption in soil as well as by the evaporation of rainwater in the summer. The concentration of calcium in groundwater may also slowly change as a result of climate change. Summers are becoming warmer and drier, with occasional heavy rains. As a result, an increase in calcium content in groundwater has been observed in many regions of Europe. For example, calcium–hydrogen carbonate groundwater from Debrecen (Hungary) was analyzed [56]. These waters are supplied with calcium by the slow dissolution of minerals: calcite, dolomite, and aragonite. Over a 5-year period, an increased dissolution of minerals was observed, leading to an increase in Ca ion concentration in groundwater. Similar observations have also been made in the Middle East. In Iran, a 10-year study showed an increase in calcium content in groundwater, which, however, is attributed to excessive groundwater extraction and drought, while insufficient aquifer recharge is maintained [57]. The decline in groundwater levels in this country has been confirmed by independent research [58]. Furthermore, it was shown that the titration method with semi-automatic end-point detection can also be used for other natural waters (Table 4). The result of the tap water test corresponds to the calcium content given in the current report of the local control station [59], with a difference of 8.5%.

4. Conclusions

Inexpensive webcams work well for automated endpoint detection in EDTA calcium titrations using the calcein indicator. The sharpness of the color transition depends on both the concentration of the calcein indicator and the lighting conditions during titration. In diffuse reflection mode, the Hue parameter and the Green component of the color provide greater precision than other primary colors. The Hue parameter is also more resistant to fluctuations in ambient light intensity. In fluorescence mode, the Green primary color provides very sharp endpoints. In this measurement mode, other color components and the Hue parameter can also be used, provided that the indicator concentration is properly selected. The advantage of the fluorescence mode is the minimal impact of the ambient light.
The automatic detection of the endpoint provides good precision. Taking into ac-count the minimum value of the registered standard deviation (0.1 μmol) and the sample volume (0.1 L), the Limit of Detection is estimated to be 2 μmol L−1 and the Limit of Quantitation to be 6 μmol L−1. It has been found that the calcium content in mineral waters given by the manufacturer may differ from the actual content. Fluctuations in calcium concentration may be seasonal and related to variable rainfall.
The proposed endpoint detection method is a convenient, inexpensive, and environmentally friendly solution for routine measurements of calcium concentration in aqueous solution. The automatic burette with a webcam detector can also be used to determine other metal ions in water samples.

Author Contributions

Conceptualization, A.S. and J.L. methodology, A.S., D.Z. and M.K.; software, J.L.; investigation, D.Z. and M.K.; writing—original draft preparation, A.S. and D.Z.; writing—review and editing, A.S. and D.Z.; visualization, A.S., D.Z. and J.L. All authors have read and agreed to the published version of the manuscript.

Funding

This research received no external funding.

Data Availability Statement

All data are included in the article.

Conflicts of Interest

The authors declare no conflicts of interest.

References

  1. Hori, M.; Shozugawa, K.; Takizawa, T.; Watanabe, Y. Distribution of inorganic compositions of Japanese tap water: A nationwide survey in 2019–2024. Sci. Rep. 2024, 14, 14167. [Google Scholar] [CrossRef] [PubMed]
  2. Woźniak, D.; Cichy, W.; Dobrzyńska, M.; Przysławski, J.; Drzymała-Czyż, S. Reasonableness of Enriching Cow’s Milk with Vitamins and Minerals. Foods 2022, 11, 1079. [Google Scholar] [CrossRef] [PubMed]
  3. Bykowska-Derda, A.; Spychala, M.; Czlapka-Matyasik, M.; Sojka, M.; Bykowski, J.; Ptak, M. The Relationship between Mortality from Cardiovascular Diseases and Total Drinking Water Hardness: Systematic Review with Meta-Analysis. Foods 2023, 12, 3255. [Google Scholar] [CrossRef]
  4. Kongpharm, K.; Nakklay, P.; Kongtong, C.; Tanapumchai, P.; Prapkree, L.; Rueangsri, N.; Singhato, A. Impacts of people at-risk of either cow milk allergies or lactose intolerance on their daily calcium intake and bone mineral density. Front. Nutr. 2024, 11, 1421275. [Google Scholar] [CrossRef] [PubMed]
  5. Ghoreishy, S.M.; Shidfar, F. The Impact of Dairy Consumption on Anthropometric Indices. In Handbook of Public Health Nutrition; Preedy, V.R., Patel, V.B., Eds.; Springer: Cham, Switzerland, 2025. [Google Scholar] [CrossRef]
  6. Ahmad, W.; Iqbal, J.; Nasir, M.J.; Ahmad, B.; Khan, M.T.; Khan, S.N.; Adnan, S. Impact of land use/land cover changes on water quality and human health in district Peshawar Pakistan. Sci. Rep. 2021, 11, 16526. [Google Scholar] [CrossRef]
  7. Mishra, S.; Chauhan, M.S.; Sundaramurthy, S. Assessing groundwater quality dynamics in Madhya Pradesh: Chemical contaminants and their temporal patterns. Environ. Res. 2024, 252, 118887. [Google Scholar] [CrossRef]
  8. Ocaña-Reyes, J.A.; Gutiérrez, M.; Paredes-Espinosa, R.; Riveros, C.A.; Cárdenas, G.P.; Bravo, N.; Quispe-Tomas, A.; Amaringo-Cordova, L.P.; Ocaña-Canales, J.C.; Zavala-Solórzano, J.W.; et al. Tillage Practices and Liming: Comparative Study of Soil Properties and Forage Corn Production. Agronomy 2024, 14, 558. [Google Scholar] [CrossRef]
  9. Wang, J.; Aalaei, K.; Skibsted, L.H.; Ahrné, L.M. Bioaccessibility of calcium in freeze-dried yogurt based snacks. LWT 2020, 129, 109527. [Google Scholar] [CrossRef]
  10. Wang, J.; Aalaei, K.; Skibsted, L.H.; Ahrné, L.M. Calcium bioaccessibility increased during gastrointestinal digestion of α-lactalbumin and β-lactoglobulin. Food Res. Int. 2023, 164, 112415. [Google Scholar] [CrossRef]
  11. Wang, J.; Munk, M.B.; Skibsted, L.H.; Ahrné, L.M. Impact of pectin and whey minerals solubilized by lime juice on calcium bioaccessibility in yogurt based snacks. Food Hydrocolloid 2022, 131, 107817. [Google Scholar] [CrossRef]
  12. Shao, J.; Wang, M.; Zhang, G.; Zhang, B.; Hao, Z. Preparation and characterization of sesame peptide-calcium chelate with different molecular weight. Int. J. Food Prop. 2022, 25, 2198–2210. [Google Scholar] [CrossRef]
  13. Qian, K.; Song, Y.; Lai, J.; Qian, X.; Zhang, Z.; Liang, Y.; Ruan, S. Characterization of historical mortar from ancient city walls of Xindeng in Fuyang, China. Constr. Build. Mater. 2022, 315, 125780. [Google Scholar] [CrossRef]
  14. Schäfer, J.; Hinrichs, J.; Kohlus, R.; Huppertz, T.; Atamer, Z. Pilot scale processing and characterisation of calcium-reduced micellar casein concentrate powders. Int. Dairy. J. 2021, 113, 104888. [Google Scholar] [CrossRef]
  15. Kozak, J.; Paluch, J.; Kozak, M.; Kochana, J.; Wieczorek, M.; Kościelniak, P. Novel Simultaneous Determination of Calcium and Magnesium Based on Flow Injection Gradient Titration. Anal. Lett. 2018, 51, 2157–2172. [Google Scholar] [CrossRef]
  16. Rosales-Conrado, N.; Peña-Martínez, J. Adding Sustainability in Analytical Chemistry Education through Monitoring Aquarium Water Quality. Sustain. Chem. 2023, 4, 282–303. [Google Scholar] [CrossRef]
  17. Zhai, W.; Lin, D.; Mo, R.; Zou, X.; Zhang, Y.; Zhang, L.; Ge, Y. Process Optimization, Structural Characterization, and Calcium Release Rate Evaluation of Mung Bean Peptides-Calcium Chelate. Foods 2023, 12, 1058. [Google Scholar] [CrossRef]
  18. Ouyang, Q.; Jiang, Y.; Liu, L.; Cai, C.; Bandara, N.; Li, P.; Wu, K.; Hong, H.; Chen, L. Preparation and characterization of Sipunculus nudus peptide-calcium chelate: Structural insights and osteogenic bioactivity assessment. J. Funct. Foods 2024, 122, 106497. [Google Scholar] [CrossRef]
  19. Bu, G.; Zhao, X.; Wang, M.; Ti, G.; Chen, F.; Duan, X.; Huang, Y.; Li, P. Identification of calcium chelating peptides from peanut protein hydrolysate and absorption activity of peptide–calcium complex. J. Sci. Food Agr. 2024, 104, 6676–6686. [Google Scholar] [CrossRef]
  20. Dai, H.; Cao, Y.; Fu, Y.; Tang, M.; Feng, X.; Ma, L.; Zhang, Y. Sustainable and one-pot fabrication of peptide chelated calcium from fish scale hydrolysates. Collagen Leather 2024, 6, 7. [Google Scholar] [CrossRef]
  21. Mueller, A.V.; Hemond, H.F. Statistical generation of training sets for measuring NO3, NH4+ and major ions in natural waters using an ion selective electrode array. Environ. Sci.-Proc. Imp. 2016, 18, 590–599. [Google Scholar] [CrossRef]
  22. Tuan, V.; Khattak, A.; Zhu, H.; Gao, W.; Wang, M. Combination of Multivariate Standard Addition Technique and Deep Kernel Learning Model for Determining Multi-Ion in Hydroponic Nutrient Solution. Sensors 2020, 20, 5314. [Google Scholar] [CrossRef] [PubMed]
  23. Shyichuk, A.; Kowalska, M.; Shyychuk, I.; Lamkiewicz, J.; Ziółkowska, D. Determination of Calcium in Meat Products by Automatic Titration with 1,2-Diaminocyclohexane-N,N,N’,N’-tetraacetic Acid. Molecules 2023, 28, 6592. [Google Scholar] [CrossRef] [PubMed]
  24. Chaturvedi, K.; Shah, H.S.; Sardhara, R.; Nahar, K.; Dave, R.H.; Morris, K.R. Protocol development, validation, and troubleshooting of in-situ fiber optic bathless dissolution system (FODS) for a pharmaceutical drug testing. J. Pharm. Biomed. Anal. 2021, 195, 113833. [Google Scholar] [CrossRef] [PubMed]
  25. Upadhyay, S.; Kumar, A.; Srivastava, M.; Srivastava, A.; Dwivedi, A.; Singh, R.K.; Srivastava, S.K. Recent advancements of smartphone-based sensing technology for diagnosis, food safety analysis, and environmental monitoring. Talanta 2024, 275, 126080. [Google Scholar] [CrossRef]
  26. Yadav, A.; Sagar, P.; Srivastava, M.; Srivastava, A.; Kumar, R.; Srivastava, S.K. A smartphone-enabled colorimetric sensor based on VS2 quantum dots for Rapid and on-site detection of ferric ions. Spectrochim. Acta A 2025, 329, 125609. [Google Scholar] [CrossRef]
  27. Lee, J.-K.; Lee, Y.-H.; Lee, D.-H. Proximal Absorbance Calibration Method Using an Embedded Blank Reference RGB Sensor for Determination of Ion Concentrations. Agriculture 2024, 14, 2171. [Google Scholar] [CrossRef]
  28. Qin, S.; Sun, X.; Zhao, X. Advances in smartphone-based biosensors for food testing. Curr. Opin. Food Sci. 2025, 61, 101236. [Google Scholar] [CrossRef]
  29. Danyliuk, N.; Tatarchuk, T.; Kannan, K.; Shyichuk, A. Optimization of TiO2-P25 photocatalyst dose and H2O2 concentration for advanced photo-oxidation using smartphone-based colorimetry. Water Sci. Technol. 2021, 84, 469–483. [Google Scholar] [CrossRef]
  30. Thanayutsiri, T.; Patrojanasophon, P.; Opanasopit, P.; Ngawhirunpat, T.; Chinsriwongkul, A.; Rojanarata, T. Green and facile short path smartphone-based assay for L-proline in dietary supplements using a mild chromogenic reaction combined with simple equipment. Sustain. Chem. Pharm. 2024, 42, 101787. [Google Scholar] [CrossRef]
  31. Keresteš, O.; Pohanka, M. A colour sensor integrated into a microcontroller platform as a reliable tool for measuring pH changes in biochemistry applications. Anal. Methods 2024, 16, 6487–6493. [Google Scholar] [CrossRef]
  32. Filgueiras, M.F.; de Oliveira Lima, B.; Borges, E.M. A high-throughput, cheap, and green method for determination of ethanol in cachaça and vodka using 96-well-plate images. Talanta 2022, 241, 123229. [Google Scholar] [CrossRef] [PubMed]
  33. Ruttanakorn, K.; Phadungcharoen, N.; Laiwattanapaisal, W.; Chinsriwongkul, A.; Rojanarata, T. Smartphone-based technique for the determination of a titration equivalence point from an RGB linear-segment curve with an example applica-tion to miniaturized titration of sodium chloride injections. Talanta 2021, 233, 122602. [Google Scholar] [CrossRef]
  34. Berasarte, I.; Bordagaray, A.; Garcia-Arrona, R.; Ostra, M.; Reis de Araujo, W.; Vidal, M. Microscale titration of acetic acid using digital colorimetry and paper-based analytical devices. Talanta 2024, 276, 126254. [Google Scholar] [CrossRef] [PubMed]
  35. Siqueira, L.A.; Nunes, I.S.; Almeida Junior, P.L.; Lyra, W.S.; Andrade, R.A.N.; Araújo, M.C.U.; Almeida, L.F.; Lima, R.A.C. Accurate automatic titration procedure for low sharpness and dichroism in end point detection using digital movies as detection technique. Microchem. J. 2017, 133, 593–599. [Google Scholar] [CrossRef]
  36. Zhai, J.; Zhu, C.; Peng, X.; Xie, X. Ionophore-based Heterogeneous Calcium Optical Titration. Electroanalysis 2018, 30, 705–709. [Google Scholar] [CrossRef]
  37. Bandyopadhyay, S.; Rathod, B.B. The Sound and Feel of Titrations: A Smartphone Aid for Color-Blind and Visually Im-paired Students. J. Chem. Educ. 2017, 94, 946–949. [Google Scholar] [CrossRef]
  38. Lima, R.A.C.; Almeida, L.F.; Lyra, W.S.; Siqueira, L.A.; Gaião, E.N.; Paiva Junior, S.S.L.; Lima, R.L.F.C. Digital movie-based on automatic titrations. Talanta 2016, 147, 226–232. [Google Scholar] [CrossRef]
  39. Zhai, J.; Xie, X.; Cherubini, T.; Bakker, E. Ionophore-Based Titrimetric Detection of Alkali Metal Ions in Serum. ACS Sens. 2017, 2, 606–612. [Google Scholar] [CrossRef]
  40. de Castro, C.M.; Olivi, P.; de Freitas Araújo, K.C.; Barbosa Segundo, I.D.; dos Santos, E.V.; Martínez-Huitle, C.A. Environmental application of a cost-effective smartphone-based method for COD analysis: Applicability in the electrochemical treatment of real wastewater. Sci. Total Environ. 2023, 855, 158816. [Google Scholar] [CrossRef]
  41. Kakiuchi, N.; Ochiai, J.; Takeuchi, M.; Tanaka, H. Inner product of RGB unit vectors for detecting color transition: Application to feedback-based flow ratiometric titration. Anal. Sci. 2022, 38, 623–626. [Google Scholar] [CrossRef]
  42. Boppana, N.P.D.; Snow, R.; Simone, P.S.; Emmert, G.L.; Brown, M.A. A low-cost automated titration system for colorimetric endpoint detection. Analyst 2023, 148, 2133–2140. [Google Scholar] [CrossRef]
  43. Lapanantnoppakhun, S.; Ganranoo, L.; Kradtap Hartwell, S.; Grudpan, K. Sequential Injection Ion Chromatography with Flow Injection Post Column Derivatization Capable of Using the Unstable Reagent Murexide to Determine Calcium and Magnesium in a Mixture. Chromatographia 2018, 81, 1269–1276. [Google Scholar] [CrossRef]
  44. Tian, C.; He, B.; Ye, F.; Wang, J.; Song, G. Using a decision-making approach to evaluate the effect of accelerators on calcium leaching of sprayed concrete. Eng. Fail. Anal. 2022, 138, 106349. [Google Scholar] [CrossRef]
  45. Vavrusova, M.; Liang, R.; Skibsted, L.H. Thermodynamics of Dissolution of Calcium Hydroxycarboxylates in Water. J. Agr. Food Chem. 2014, 62, 5675–5681. [Google Scholar] [CrossRef] [PubMed]
  46. Ziółkowska, D.; Kaniewska, A.; Lamkiewicz, J.; Shyichuk, A. Determination of carrageenan by means of photometric titration with Methylene Blue and Toluidine Blue dyes. Carbohyd Polym. 2017, 165, 1–6. [Google Scholar] [CrossRef] [PubMed]
  47. Pena-Pereira, F.; Wojnowski, W.; Tobiszewski, M. AGREE—Analytical GREEnness Metric Approach and Software. Anal. Chem. 2020, 92, 10076–10082. [Google Scholar] [CrossRef]
  48. Agrawal, R.; Kotadiya, R. AQbD-guided stability indicating HPLC method for azelnidipine and chlorthalidone fixed-dose combination tablet: A green approach. J. Taibah Univ. Sci. 2024, 18, 2415156. [Google Scholar] [CrossRef]
  49. Mikawy, N.N.; Magdy, N.; Mohamed, M.H.; El-Kosasy, A.M. Green highly sensitive and selective spectroscopic detection of guaifenesin in multiple dosage forms and spiked human plasma. Sci. Rep. 2024, 14, 18694. [Google Scholar] [CrossRef]
  50. Płotka-Wasylka, J. A new tool for the evaluation of the analytical procedure: Green Analytical Procedure Index. Talanta 2018, 181, 204–209. [Google Scholar] [CrossRef]
  51. Syrgabek, Y.; Alimzhanova, M.; García-Encina, P.A.; Jiménez, J.J.; López-Serna, R. Greenness evaluation of sample preparation methods by GAPI for the determination of pesticides in grape: A review. Trends Environ. Anal. Chem. 2023, 39, e00206. [Google Scholar] [CrossRef]
  52. Płotka-Wasylka, J.; Wojnowski, W. Complementary green analytical procedure index (ComplexGAPI) and software. Green. Chem. 2021, 23, 8657–8665. [Google Scholar] [CrossRef]
  53. Mansour, F.R.; Omer, K.M.; Płotka-Wasylka, J. A total scoring system and software for complex modified GAPI (ComplexMoGAPI) application in the assessment of method greenness. Green. Anal. Chem. 2024, 10, 100126. [Google Scholar] [CrossRef]
  54. Siepak, M.; Lewandowska, A.; Sojka, M. Variability in the Chemical Composition of Spring Waters in the Postomia River Catchment (Northwest Poland). Water 2022, 15, 157. [Google Scholar] [CrossRef]
  55. Edet, A. Seasonal and spatio-temporal patterns, evolution and quality of groundwater in Cross River State, Nigeria: Implications for groundwater management. Sustain. Water Resour. Manag. 2019, 5, 667–687. [Google Scholar] [CrossRef]
  56. Mohammed, M.A.A.; Szabó, N.P.; Mikita, V.; Szűcs, P. Tracking the spatiotemporal evolution of groundwater chemistry in the Quaternary aquifer system of Debrecen area, Hungary: Integration of classical and unsupervised learning methods. Environ. Sci. Pollut. Res. 2025, 32, 6884–6903. [Google Scholar] [CrossRef]
  57. Sadeghi-Lari, A.; Bahrami, M.; Dastandaz, T. Temporal and spatial variations of groundwater quantity and quality for drinking and irrigation purposes in the arid and hot weather of Southern Iran. Phys. Chem. Earth 2024, 134, 103582. [Google Scholar] [CrossRef]
  58. Daneshvar Vousoughi, F.; Dinpashoh, Y.; Aalami, M.T.; Jhajharia, D. Trend analysis of groundwater using non-parametric methods (case study: Ardabil plain). Stoch. Environ. Res. Risk A 2013, 27, 547–559. [Google Scholar] [CrossRef]
  59. Reports of the Central Water and Sewage Testing Laboratory of the Municipal Water and Sewage Company in Bydgoszcz (Poland). Available online: https://bip.mwik.bydgoszcz.pl/w-zakresie-jakosci-wody-dostarczanej-odbiorcom/ (accessed on 14 May 2025).
Figure 1. The calcein indicator (a) and the experimental setup used in fluorescence mode (b).
Water 17 01757 g001
Scheme 1. Complexation of calceine indicator with calcium ions.
Water 17 01757 sch001
Scheme 2. Release of calcein from the calcium indicator complex during titration with EDTA solution.
Water 17 01757 sch002
Figure 2. Color of analyte solution at the beginning and end of the titration depending on the calcein indicator concentration (μM). Images were recorded in diffuse reflectance mode. Calcium amount equal to 50 μmol.
Water 17 01757 g002
Figure 3. Graphs of the Hue (a), green (b), blue (c), and red (d) values vs. EDTA volume obtained using the calcein indicator in diffuse reflection mode. The concentration of calcein is indicated. The amount of calcium ions is 50 μmol.
Water 17 01757 g003aWater 17 01757 g003b
Figure 4. Color of analyte solution at the beginning and end of the titration depending on the calcein indicator concentration (in μM). Images were recorded in fluorescence mode. Calcium amount equal to 50 μmol.
Water 17 01757 g004
Figure 5. Location of different sampling areas ((a)—upper, (b)—middle, (c)—bottom) in the titration vessel image obtained in fluorescence mode. Titration graphs at different locations for green (d) and blue (e) signals. The concentration of the calcein indicator equals 6 μM. The amount of calcium ions is 50 μmol. The sampling area is 16 × 16 pixels.
Water 17 01757 g005aWater 17 01757 g005b
Figure 6. The influence of the sampling area dimension on the graphs of the green (a) and blue (b) signals vs. the titrant volume. The concentration of calcein indicator was 10 μM. The images were recorded in fluorescence mode. The calcium amount is equal to 50 μmol.
Water 17 01757 g006
Figure 7. Graphs of the green (a), blue (b), red (c) and Hue (d) values vs. EDTA volume obtained using the calcein indicator in fluorescence mode. The concentration of calcein is indicated. The amount of calcium ions is 50 μmol.
Water 17 01757 g007
Figure 8. Graphs of the Green (a) and the Blue (b) signal values vs. EDTA volume obtained using the calcein indicator (6 μM) in fluorescence mode. The amount of calcium is indicated. The analytical signal linearity (c) for Green (left) and Blue (right) signals.
Water 17 01757 g008aWater 17 01757 g008b
Figure 9. Results of analytic method comparison via AGREE and ComplexMoGAPI tests. The parameter numbering for the AGREE and ComplexMoGAPI tests are given in Table 6 and Table 7, respectively, as well as in the text.
Water 17 01757 g009
Figure 10. The concentration of calcium in mineral water from a local spring (O1) over time.
Water 17 01757 g010
Table 1. Standard deviation, relative standard deviation, and recovery towards standard Ca solutions determined using 6 μM calcein indicator in diffuse reflection mode.
Ca Amount, μmolSignalSD, μmolRSD, %Recovery, %
50Green0.3750.72104.8
50Blue0.8301.60103.5
50Hue0.3750.73102.8
5Green0.3056.07100.5
5Blue0.2505.00100.0
5Hue0.1002.0896.0
Table 2. Standard deviation, relative standard deviation, and recovery towards standard Ca solutions determined using the calcein indicator (6 μM) in fluorescence mode.
Ca Amount, μmolSignalSD, μmolRSD, %Recovery, %
50Red1.633.14103.7
50Green0.3750.71105.3
50Blue0.5751.11103.3
50Hue1.092.07105.5
5Red0.2955.92100.0
5Green0.1753.5299.5
5Blue0.3156.5796.5
5Hue0.3054.68130.0
Table 3. Comparison of results obtained for CRM with two analytical methods.
TitrationAAS
SignalCa Amount, mg L−1Recovery, %Ca Amount,
mg L−1
Recovery, %
Red10.52105.29.7297.2
Green10.82108.2
Blue10.32103.2
Hue10.72107.2
Table 4. The results of calcium determination using the calcein indicator (6 μM) in fluorescence mode as well as using the AAS method for natural water samples.
SampleTitrationAAS
SignalMean Ca Concentration,
mg L−1
Intra-Day RSD, %Inter-Day RSD, %Mean Ca Concentration, mg L−1Intra-Day RSD, %
A2Red2.897.449.352.701.98
Green2.815.054.83
Blue2.855.525.97
Hue2.976.554.36
C3Red302.23.051.15301.10.95
Green306.61.171.00
Blue307.81.942.09
Hue310.21.221.58
Tap waterRed74.932.167.7370.031.60
Green75.451.040.96
Blue73.951.902.62
Hue76.251.371.00
River waterRed79.531.994.3874.380.64
Green79.910.830.94
Blue80.032.021.97
Hue80.790.601.16
Table 5. Reproducibility of calcium determination using the calcein indicator (6 μM) in fluorescence mode.
SampleSignalOperator 1Operator 2
Mean Ca Concentration, mg L−1RSD, %Mean Ca Concentration, mg L−1RSD, %
C3Red302.23.05308.62.22
Green306.61.17312.01.60
Blue307.81.94312.02.31
Hue310.21.22316.61.21
River waterRed79.531.9987.3717.22
Green79.910.8379.920.49
Blue80.032.0278.961.87
Hue80.790.6080.960.93
Table 6. Results of analytic method comparison using the AGREE test. The parameter weight is given in brackets.
NoPrincipleASASemi-Automatic Titration
1Direct Analytical Techniques Should Be Applied to Avoid Sample TreatmentOff-line analysis (2)Off-line analysis (2)
2Minimal Sample Size and Minimal Number of Samples Are Goals4 mL (1)25 mL (1)
3In Situ Measurements Should Be PerformedOff-line (2)Off-line (2)
4Integration of Analytical Processes and Operations Saves Energy and Reduces the Use of Reagents4 steps (2)3 steps (2)
5Automated and Miniaturized Methods Should Be SelectedSemi-automatic,
not miniaturized (2)
Semi-automatic,
not miniaturized (2)
6Derivatization Should Be AvoidedNo derivatization (2)No derivatization (2)
7Generation of a Large Volume of Analytical Waste Should Be Avoided and Proper Management of Analytical Waste Should Be Provided100 mL (2)100 mL (2)
8Multianalyte or Multiparameter Methods Are Preferred versus Methods Using One Analyte at a Time1 analyte/run,
60 samples/h (2)
1 analyte/run,
4 sample/h (2)
9The Use of Energy Should Be MinimizedFlame atomic absorption spectrometry (2)Titration (2)
10Reagents Obtained from Renewable Source Should Be PreferredNone of the
reagents are from bio-based sources (2)
None of the
reagents are from bio-based sources (2)
11Toxic Reagents Should Be Eliminated or ReplacedToxic reagents: 0.60 g (2)Toxic reagents: 0.36 g (2)
12The Safety of the Operator Should Be
Increased
Toxic to aquatic life; highly flammable; explosive (2)Toxic to aquatic life, corrosive (2)
Table 7. Results of analytic method comparison via ComplexMoGAPI test.
NoCriterionScore
AASSemi-Automatic Titration
Sample Preparation
1CollectionOff-lineOff-line
2PreservationNoneNone
3TransportRequiredRequired
4StorageUnder normal conditionsUnder normal conditions
5Type of method: direct or indirectNo sample preparationNo sample preparation
6Scale of extractionNot applicableNot applicable
7Solvents/reagents usedNon-green solvents/reagents usedNon-green solvents/reagents used
8Additional treatmentsNoneNone
Reagents and Solvents
9Amount10–100 (10–100 g)10–100 mL (10–100 g)
10Health hazardModerately toxic; could cause temporary incapacitation;
NFPA = 2 or 3
Moderately toxic; could cause temporary incapacitation;
NFPA = 2 or 3
11Safety hazardHighest NFPA flammability,
instability score is 4
Highest NFPA flammability,
instability score of 0 or 1. No special hazards
Instrumentation
12Energy≤1.5 kW h per sample≤0.1 kW h per sample
13Occupational
hazard
Emission of vapors into the atmosphereHermetic sealing of analytical process
14Waste>10 mL (>10 g)>10 mL (>10 g)
15Waste treatmentNo treatmentNo treatment
16QuantificationProcedure for qualification and
quantification
Procedure for qualification and
quantification
Yield and Conditions
IYield>89%>89%
IITemperature/timeRoom temperature, >1 h, Heating, <1 hRoom temperature, <1 h
Relation to Green Economy
IIINumber of rules met13
Reagents and Solvents
IVaHealth hazardModerately toxic; could cause temporary incapacitation; NFPA = 2 or 3Moderately toxic; could cause temporary incapacitation; NFPA = 2 or 3
IVbSafety hazardHighest NFPA flammability,
instability score is 4
Highest NFPA flammability,
instability score of 0 or 1 No special hazards
Instrumentation
VaTechnical setupAdditional setups/semi-advanced instruments usedCommon setup
VbEnergy≤1.5 kW h per sample≤0.1 kW h per sample
VcOccupational hazardEmission of vapors into the atmosphereHermetic sealing of analytical process
Workup and Purification
VIaWorkup and purification of the end productNot applicableNot applicable
VIbPurityNot applicableNot applicable
E-Factor244
Table 8. Calcium content in mineral water samples.
BrandCarbonationCa Content, mg L−1
DeterminedDeclared
A1non-carbonated156162
A2non-carbonated2.813.27
AKnon-carbonated50.740.3
C1non-carbonated111130
K1non-carbonated56.368.1
KB1non-carbonated45.341.0
M1non-carbonated34.737.4
NZnon-carbonated10196.2
O1non-carbonated144123
OMnon-carbonated144148
P1non-carbonated51.348.1
S1non-carbonated152124
SEnon-carbonated128107
Z1non-carbonated41.341.7
A2low-carbonated224198
C2carbonated128130.3
C3low-carbonated306.6325.8
K2carbonated75.365
KB2carbonated45.341
M2carbonated42.737.4
MU1low-carbonated212208
MU2low-carbonated131200
O2carbonated142.7123
P2carbonated54.748.1
S2low-carbonated111155
Z2highly carbonated60.059.3
Disclaimer/Publisher’s Note: The statements, opinions and data contained in all publications are solely those of the individual author(s) and contributor(s) and not of MDPI and/or the editor(s). MDPI and/or the editor(s) disclaim responsibility for any injury to people or property resulting from any ideas, methods, instructions or products referred to in the content.

