Article

A Django-Based Modeling Platform for Predicting Soil Moisture in Agricultural Fields

1
College of Mechanical and Electronic Engineering, Nanjing Forestry University, No. 159 Longpan Road, Nanjing 210037, China
2
College of Agricultural Science and Engineering, Hohai University, No. 1 Xikang Road, Nanjing 210098, China
*
Author to whom correspondence should be addressed.
Water 2025, 17(12), 1753; https://doi.org/10.3390/w17121753
Submission received: 25 April 2025 / Revised: 5 June 2025 / Accepted: 6 June 2025 / Published: 11 June 2025
(This article belongs to the Section Soil and Water)

Abstract

:
To solve the problems of strong professionalism and cumbersome operation required for crop soil moisture prediction, a soil moisture prediction platform has been developed for real-time irrigation decision-making based on the Django framework. This platform supports users in quickly selecting prediction models, setting model hyperparameters, and training models based on historical data to achieve the real-time predictions of soil moisture. Users can simply run the model according to the prompts, greatly reducing the threshold for non-professionals to use the prediction model and improving the convenience and scalability of practical applications. In addition, to improve the accuracy and stability of the model, the platform has integrated automatic parameter tuning methods including grid search and random search to further optimize model performance. The experimental results show that the platform’s models can continuously and accurately predict soil moisture during crop reproductive stages, achieving an R2 of 0.95 compared to observed values. This study not only effectively avoids the problem of duplicate development of soil moisture models and significantly improves the efficiency of model development and application, but also provides important support for the practical application and promotion of smart irrigation decision-making systems.

1. Introduction

Per capita water resources in China are relatively scarce, and the agricultural labor force is steadily declining. Combined with increasingly prominent environmental issues caused by irrational irrigation practices, these challenges have driven the development of agricultural irrigation systems toward greater intelligence and sustainability. Among the many approaches, intelligent irrigation decision-making systems have become a critical component. To enable real-time decision-making in irrigation, four main categories of methods have been developed both domestically and internationally: methods based on evapotranspiration and water balance, soil moisture, crop water status, and predictive modeling [1,2,3]. Among these, soil moisture plays a central role in determining irrigation needs. Accurate estimation of field-wide soil moisture and comparison with threshold values at different crop growth stages can enable fast and effective real-time irrigation decisions [4,5].
Several methods have been developed to estimate soil moisture in agricultural fields, including localized sensor measurements [6], remote sensing inversion [7], and model-based prediction techniques [8]. Each method has distinct advantages in terms of temporal and spatial resolution. Among them, model-based approaches offer a practical balance between accuracy and scalability, making them particularly suitable for daily irrigation decision-making at the field scale. However, the cost of deploying numerous in-field sensors for long-term monitoring is often prohibitively high. Similarly, remote sensing methods primarily capture surface-level soil moisture, which is insufficient for deep-root irrigation of staple crops and is also associated with high system setup costs. As a result, recent research has focused on predictive models—either purely data-driven or hybrid approaches that integrate sensor and remote sensing data—to enhance irrigation planning.
Model-based approaches for predicting soil moisture can generally be divided into two categories: those based on agricultural system models and those based on artificial intelligence (AI) or data-driven algorithms. Agricultural system modeling is particularly effective for extending limited experimental datasets, and the Root Zone Water Quality Model 2 (RZWQM2) is among the most widely studied and applied tools for irrigation planning [9,10]. However, the application of such models typically requires expert knowledge and extensive experimental data, which limits their scalability and practical use in real-world farming scenarios. In contrast, prediction methods based on AI and data-driven algorithms have gained increasing popularity due to their flexibility and ease of deployment [11]. Common techniques include backpropagation neural networks [12], Long Short-Term memory [13] and deep learning methods [14,15]. Gu et al. [16] developed an ensemble of artificial neural networks, which significantly improved the model’s generalization ability and robustness. While these AI-based methods offer high accuracy and can support continuous prediction throughout crop growth stages, their applicability is often limited to specific field conditions or crop types, making generalization across regions or scenarios more challenging. Prediction methods that integrate sensor or remote sensing data primarily rely on these technologies to measure soil moisture, followed by data analysis and modeling for prediction purposes [17]. Overall, a key limitation across most predictive modeling approaches is their lack of generalizability. These models often require expert intervention during development, and their application tends to be restricted to experimental or research settings. This limits their scalability and hinders broader adoption in real-world agricultural fields.
To facilitate the adoption of smart irrigation systems, various service platforms have gradually emerged, including smart irrigation service platforms [18], third-party cloud-based platforms [19,20], and others. Smart irrigation platforms allow users to share irrigation strategies and experiences, contributing to the widespread adoption of intelligent irrigation technologies. These platforms also enable users to provide feedback on water and fertilizer application outcomes via mobile apps [21]. Based on this feedback, the system continuously refines its automated irrigation algorithms, adjusts the underlying mathematical models, improves program accuracy, and ultimately enhances crop yield and quality. While such platforms offer remote monitoring and management capabilities, they lack the ability to accurately and continuously predict soil moisture levels. Instead, irrigation adjustments are primarily driven by user feedback. Third-party cloud service platforms typically support water metering, pipeline network monitoring, scheduling, and information dissemination through IoT-enabled irrigation infrastructure and client applications [22]. However, these platforms also focus mainly on monitoring weather data and remotely controlling irrigation valves, without the capacity for continuous soil moisture prediction.
In summary, most existing service platforms provide only monitoring and remote irrigation control functions and cannot offer real-time, continuous predictions of future soil moisture levels—especially to the extent needed for daily crop management. Moreover, users are generally unable to select or customize prediction models according to their specific fields or crop types. This highlights the urgent need for a flexible, intelligent platform that addresses these limitations.
Therefore, this study focuses on the development of a soil moisture prediction platform based on Django to support real-time irrigation decision-making. The goal is to enable general users—regardless of technical background—to efficiently build prediction models tailored to their specific fields. To enhance the platform’s applicability, three data-driven machine models—neural networks (NNs), support vector regression (SVR), and linear support vector regression (LinearSVR)—are provided for users to choose and compare based on their specific data and evaluation results. Additionally, the influence of hyperparameter selection on model prediction performance was analyzed to provide theoretical guidance for platform users during the modeling process.

2. Prediction Platform and Prediction Model

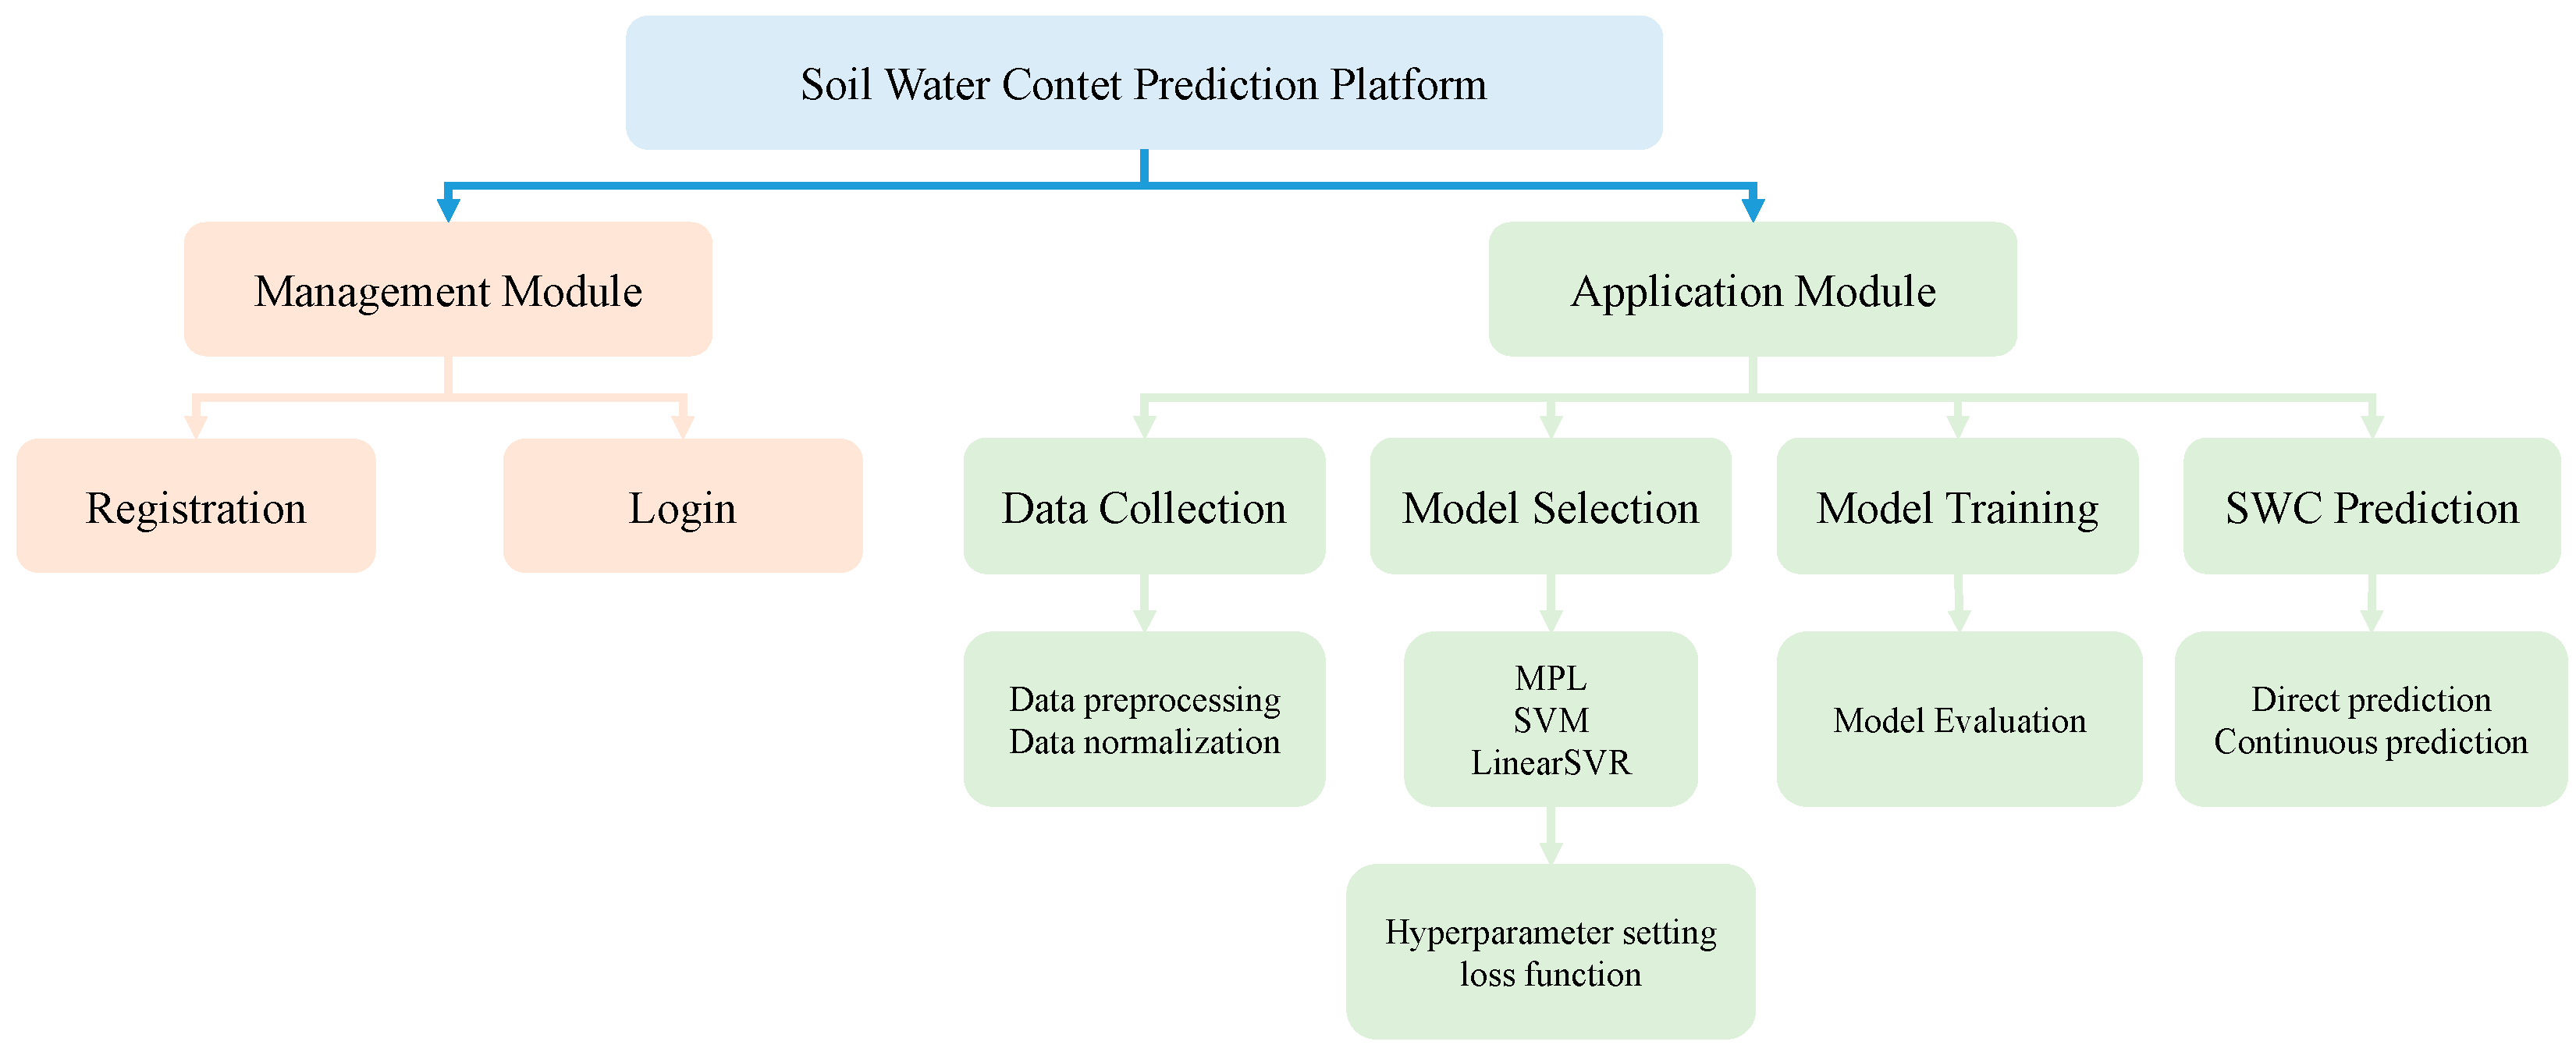
2.1. Prediction Platform Framework Based on Django

Django (https://www.djangoproject.com/) is a powerful Python-based framework that supports multi-language development and provides a comprehensive set of tools and libraries [23]. These features allow developers to concentrate on business logic without spending excessive time on low-level implementation details. Due to its extensive use in platform development and the availability of numerous successful application cases [24], Django was selected as the primary framework for building the soil moisture prediction platform in this study. To support essential platform functions—such as uploading historical data, storing trained models, and saving prediction results—dedicated databases were established, including a training database, a model database, and a real-time prediction database.
The soil moisture content (SWC) prediction platform consists of two main components: a management module and an application module, as shown in Figure 1. The management module handles user account registration and login information management. The application module delivers prediction services, and includes four functional submodules: data collection, model selection, model training, and SWC prediction. In the submodule of data collection, users should follow a standardized template format that includes all model-relevant factors and submit the completed file to the training database. In the submodule of model selection, users can choose prediction models and adjust the model hyperparameters according to their prediction needs; if no specific preference is indicated, the system recommends a suitable model based on the provided dataset. The training module allows users to retrain models if they are dissatisfied with the automatically generated results. In the prediction module, users receive a visual representation of the prediction results based on their uploaded data and selected model. This includes evaluation metrics and time series plots of the predicted outcomes. The prediction results are simultaneously stored in the real-time prediction database.

2.2. SWC Prediction Models

2.2.1. Prediction Model Framework

The soil moisture prediction model is the core part of the proposed platform, with the aim of using agricultural system models and machine learning algorithms to accurately predict changes in soil moisture in order to achieve intelligent irrigation decision-making. In order to construct an effective prediction model, it is first necessary to fully understand the dynamic changes in soil moisture and ensure that the model can produce reliable prediction results under different environmental and irrigation conditions. Therefore, the design of the model not only needs to consider soil hierarchy and meteorological factors, but also needs to be trained and validated based on actual field test data.
The structure of the soil water content prediction model is shown as Figure 2. Shallow soils tend to have drastic changes in moisture, while deep soils are relatively stable [25]. Since the variation pattern of crop soil water content differs with soil depth, field soil water content is usually stratified and predicted based on depth to improve prediction performance. In addition, considering the sudden changes in soil moisture during water replenishment (rainfall or irrigation), and the significant differences between such changes and normal soil moisture consumption, two different prediction sub-models, a consuming sub-model and supplying sub-model, were constructed for the absence or presence of replenishment, respectively.
The proposed prediction model is a multi-input and single-output model for each soil layer with meteorological variables and soil water content. Specifically, the model inputs include meteorological parameters, rooting depth, and soil moisture for each layer from the previous day, while the outputs are the soil moisture values for each layer on the current day. Assuming the soil was divided into n layers, the prediction platform would construct n consuming sub-models and n supplying sub-models.

2.2.2. Prediction Sub-Models Based on Machine Learning

To achieve accurate and continuous soil moisture predictions, the prediction sub-model on the proposed prediction platform provides models such as neural networks (MLP) [26], support vector regression (SVR) [27], and linear support vector regression (LinearSVR) [28].
The use of MLP neural network models in irrigation scheduling platforms has been explored by scholars. Due to its portability, the MLP neural network model remains our preferred choice. The MLP used in this study is based on the MLPRegressor class in scikit-learn. For each neural network model, a three-layer multilayer perceptron (MLP) is used, consisting of an input layer, a hidden layer, and an output layer.
Because of the significant advantages of their lightweight nature and low resource consumption, SVR and LinearSVR demonstrate strong generalization capabilities when dealing with nonlinear relationships and can handle complex data patterns without overfitting. Since these algorithms rely on support vectors (SVs) to define decision boundaries rather than storing the entire dataset, they have low memory requirements, making them suitable for memory-constrained environments and capable of processing large datasets without causing memory overflow. SVR and LinearSVR were selected not only for their resource efficiency, but also for their proven effectiveness, generalizability, and adaptability in various applications.
SVR aims to build an optimal regression model by finding a boundary (support vector) in the feature space that best fits the data. SVR introduces an insensitive loss function based on SVM, which does not simply seek a linear function to fit the data, but instead constructs a region called the “epsilon-insensitive zone,” where most data points fall within the boundary. The distance between points outside this boundary and the boundary is minimized. The basic form of SVR is as follows:
f x = i n a i k x , x i + b
where f x is the target value of the prediction, n is the number of support vectors, a i is the Lagrange multiplier of the support vectors, k x , x i is the similarity in the feature space computed by the kernel function (which can be linear, polynomial, a radial basis function, etc.), x i is the input feature of the support vectors, and b is the bias term.
LinearSVR is similar to SVR, but it is specifically designed for linear regression problems. It uses a linear kernel function to model the regression, making it highly efficient and simple for linear problems. The basic form of LinearSVR is as follows:
f x = w x + b
where f x is the predicted target value, w is the weight vector of the features, x is the input feature, and b is the bias term.
The SVR and LinearSVR used in this study are adopted from the class SVR and LinearSVR in scikit-learn (sklearn). The inputs and outputs used in the model are the same as in MLP, where the SVR uses the radial basis function (RBF) as the kernel function. The RBF kernel function is one of the commonly used kernel functions in SVR, which is suitable for dealing with the data with nonlinear relationships.

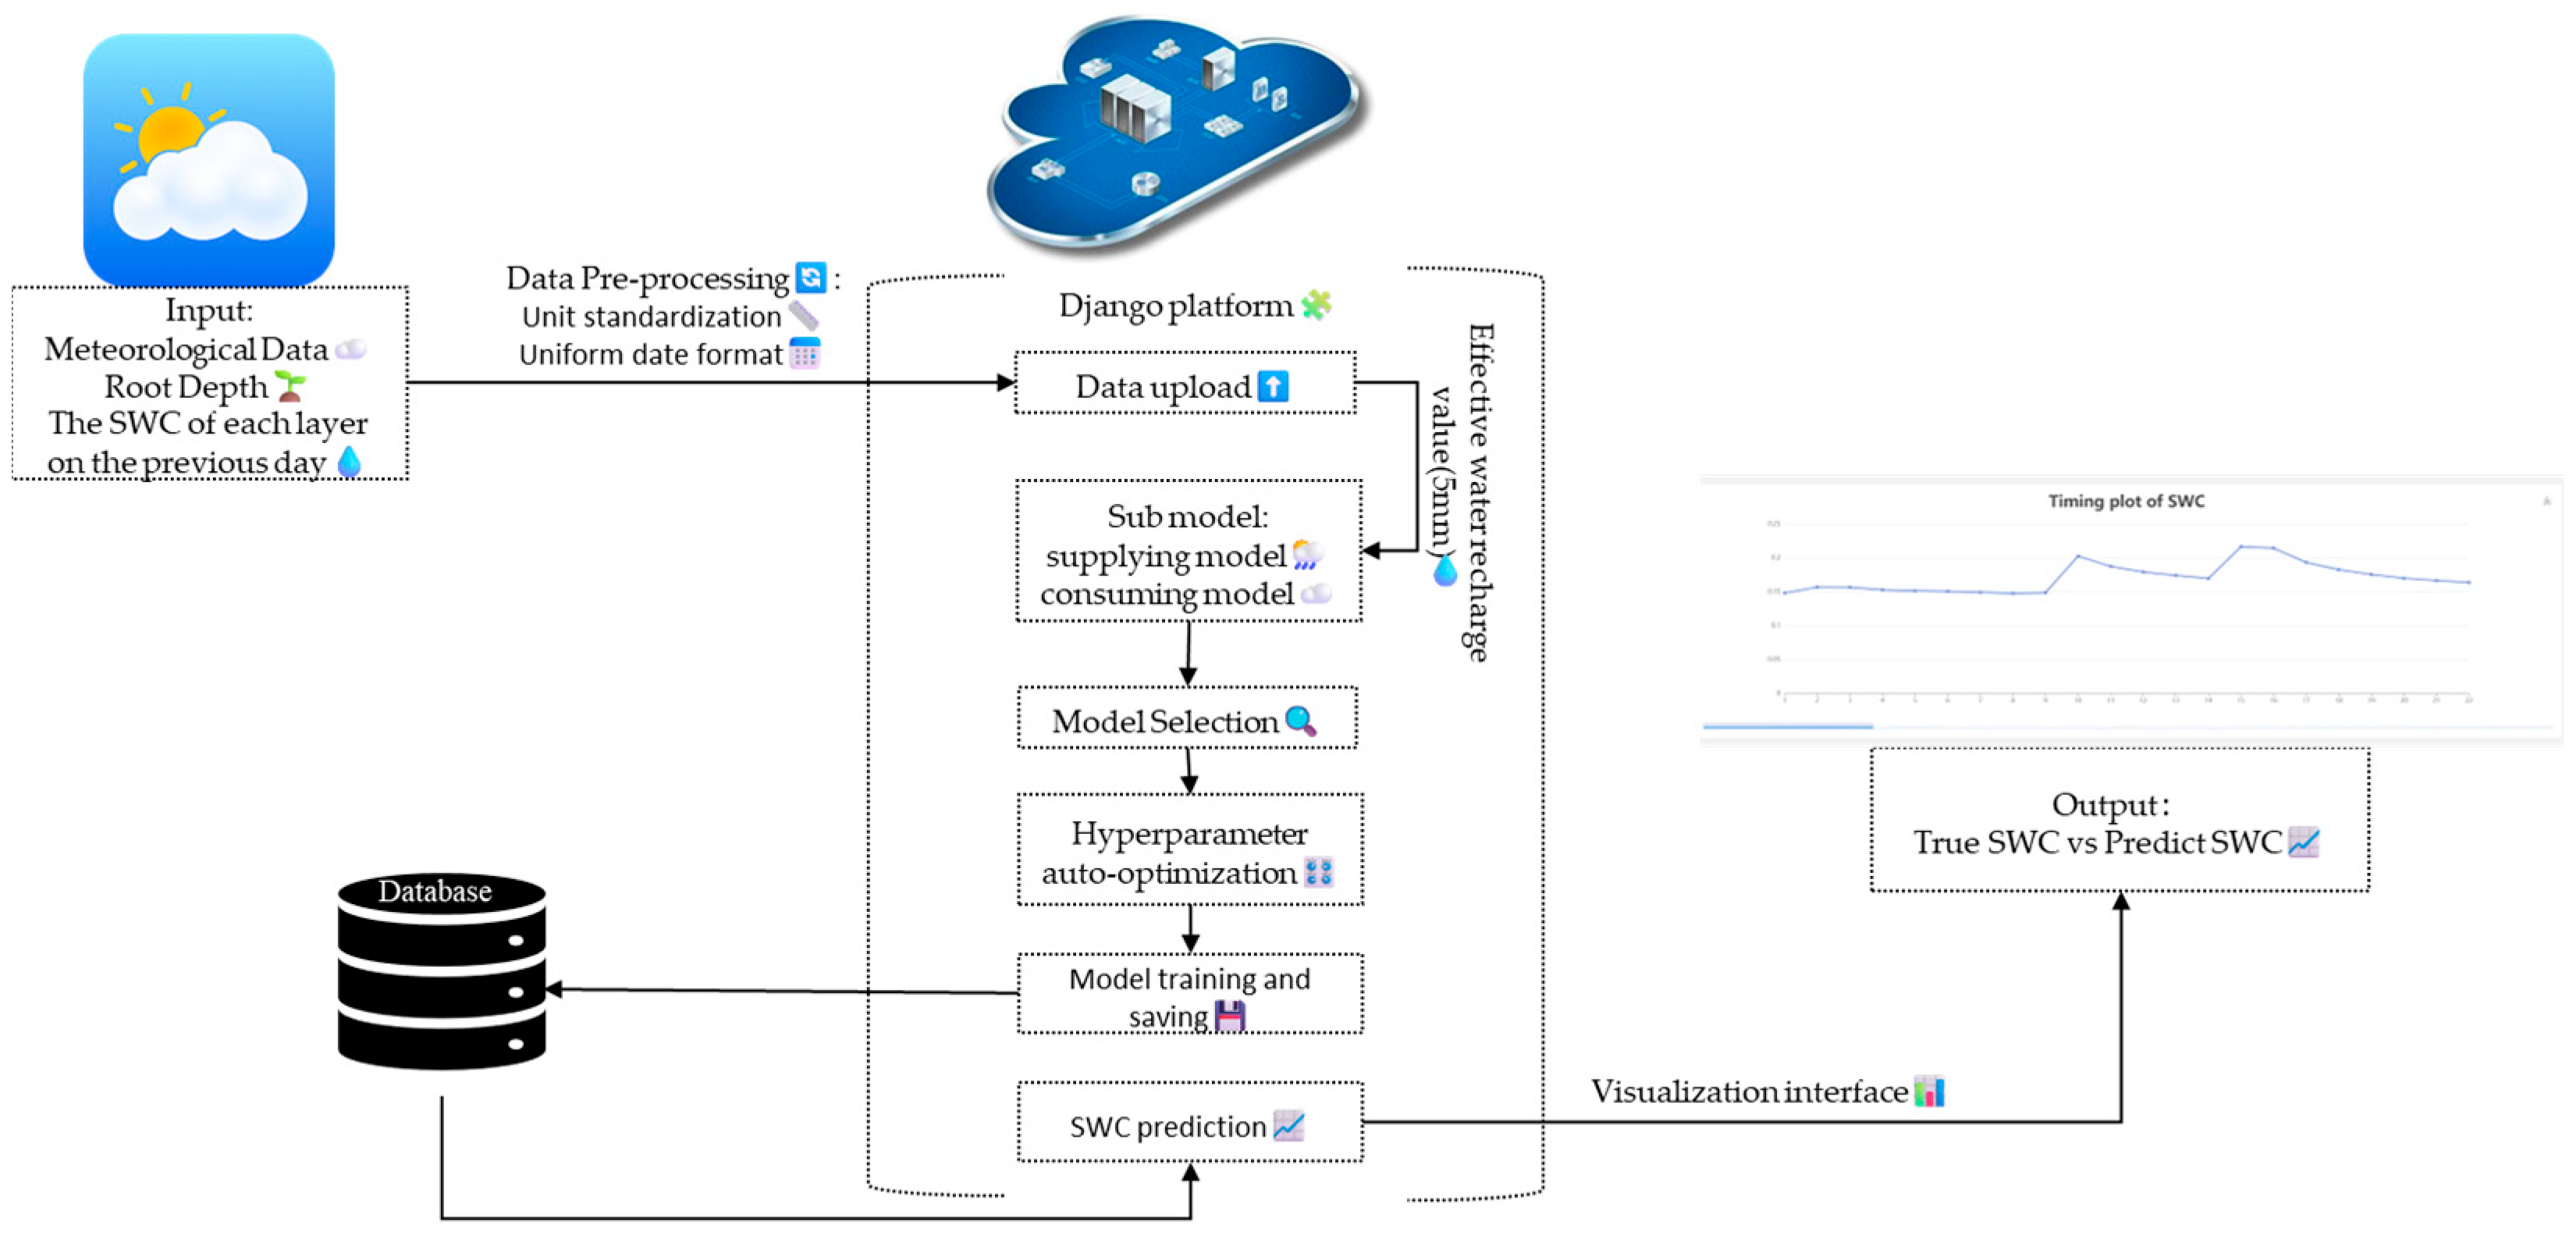
2.3. Platform Operation Process

The developed SWC prediction platform provides users with real-time soil moisture predictions. Firstly, users are required to upload the meteorological data for the prediction day, as well as the root depth and the actual soil moisture value on the first day of the prediction period. Then, users can select the model based on the prompts, and the system will retrieve the appropriate model from the model database saved in the model training module to perform the prediction. After that, users can click the “Predict” button to obtain a list of predicted results. This list includes meteorological data, root depth, and other attribute columns for each predicted day, along with the predicted moisture values for each soil layer based on the user’s provided data. Additionally, a download function will be available, allowing users to download the forecast data in Excel format. A time series plot of soil moisture at root depth will also be provided, offering a clear visualization for each prediction day. This plot will be available for download and can be saved locally in PNG format.
To better illustrate the complete process from data input to prediction output, the overall modeling and prediction workflow of the platform is shown in Figure 3.

3. Prediction Model Performance Evaluation and Discussion

3.1. Testing Data and Evaluation Index

3.1.1. Testing Data

To evaluate the performance of the prediction models on the developed soil water content prediction platform, three-year soil moisture data were used from corn fields in Colorado [25,29]. Since the shallow and deep layers of the soil have different degrees of drastic changes in moisture, it is necessary to stratify soil moisture when predicting soil moisture. In the experimental data, the soil layer was defined as 7 layers (0–15 cm, 15–30 cm, 30–60 cm, 60–90 cm, 90–120 cm, 120–150 cm, and 150–200 cm), so that the experimental data should include the true value of soil moisture in the seven layers. At the same time, the experimental data also included relevant variables such as root depth, irrigation amount, rainfall, average wind speed, average temperature, solar radiation, and relative humidity. Finally, the data from 2008 to 2009 were set as a training set, and the data from 2010 were set as a testing set.

3.1.2. Model Evaluation Indicators

Four criteria—coefficient of determination (R2), normalized mean bias error (nMBE), normalized mean absolute error (nMAE), and normalized root mean square error (nRMSE)—were used to evaluate the performance of the predicted values. A higher R2 (closer to 1) and lower values of nMBE, nMAE, and nRMSE (closer to 0) indicate better prediction accuracy. The specific formulas are as follows:
R 2 = i = 1 N y i t y t ¯ y i y ¯ 2 i = 1 N y i t y t ¯ 2 i = 1 N y i y ¯ 2
n M B E = 1 N i = 1 N y i y i t / y t ¯
n M A E = 1 N i = 1 N y i y i t / y t ¯
n R M S E = 1 N i = 1 N y i y i t 2 / y t ¯
where N is the number of samples, y is the predicted value of the constructed NN model, y t is the true value, and y and y t are the average of the predicted and true values, respectively.

3.2. Performance Evaluation of the Different Models

A group of experiments were taken out to evaluate and compare the prediction models, including MLP, SVR, LinearSVR, Random Forest, and XGBoost [30], respectively. The results for continuous prediction of soil moisture at root depth are listed in Table 1. It is clear that the R2 values of five models all exceed 0.91, which means the provided models in the prediction platform could achieve satisfactory performance in soil moisture prediction. For the testing data, the MPL achieved the best prediction performance of all these models.
To further analyze the predictive performance of each model, the time series charts for the testing set are shown as Figure 4. All models exhibit consistent prediction deviations during the initial experimental phase (Days 0–20). This may be attributed to shallow root systems in the early stages of crop growth, where surface soil layers are influenced by a wide range of complex factors. Water supply events in this phase often lead to rapid yet short-lived changes in shallow soil moisture—minor rainfall can cause sharp moisture spikes, which are quickly followed by depletion due to evaporation and plant uptake. These intense and irregular fluctuations increase the nonlinearity of the data, posing significant challenges for models such as LinearSVR that rely on linear assumptions. Even nonlinear models like MLP and SVR struggle to capture optimal fitting patterns under such chaotic and highly variable conditions.
During the mid-experimental phase (Days 40–120), frequent fluctuations in soil moisture are observed. All models, except for LinearSVR, demonstrate satisfactory fitting performance. The limited performance of LinearSVR is primarily attributed to its reliance on linear regression, which is insufficient for capturing the nonlinear interactions arising from multifactorial influences on soil moisture dynamics. In contrast, the late experimental phase (Days 120–160) displays more gradually linearized trends, likely resulting from stabilized root system development and a balanced pattern of moisture consumption and replenishment. Under these conditions, LinearSVR’s linear assumptions become more appropriate, resulting in improved performance. However, tree-based models such as Random Forest and XGBoost exhibit residual deviations, which may stem from their continued adaptation to earlier nonlinear patterns, making them less responsive to the evolving linear characteristics of the data.
For objectives prioritizing the capture of short-term abrupt fluctuations in soil moisture, MLP, Random Forest, and XGBoost should be prioritized. If the goal is to accurately track long-term soil moisture trends while avoiding overfitting, SVR emerges as the superior choice. While LinearSVR serves as a viable baseline model for simple linear trend references, it underperforms compared to both MLP and SVR in overall capability. All evaluated algorithms demonstrate competent continuous prediction performance, but MLP stands out as the most suitable foundational model for the dataset employed in this study, balancing responsiveness to nonlinear dynamics and robustness across varying temporal patterns.

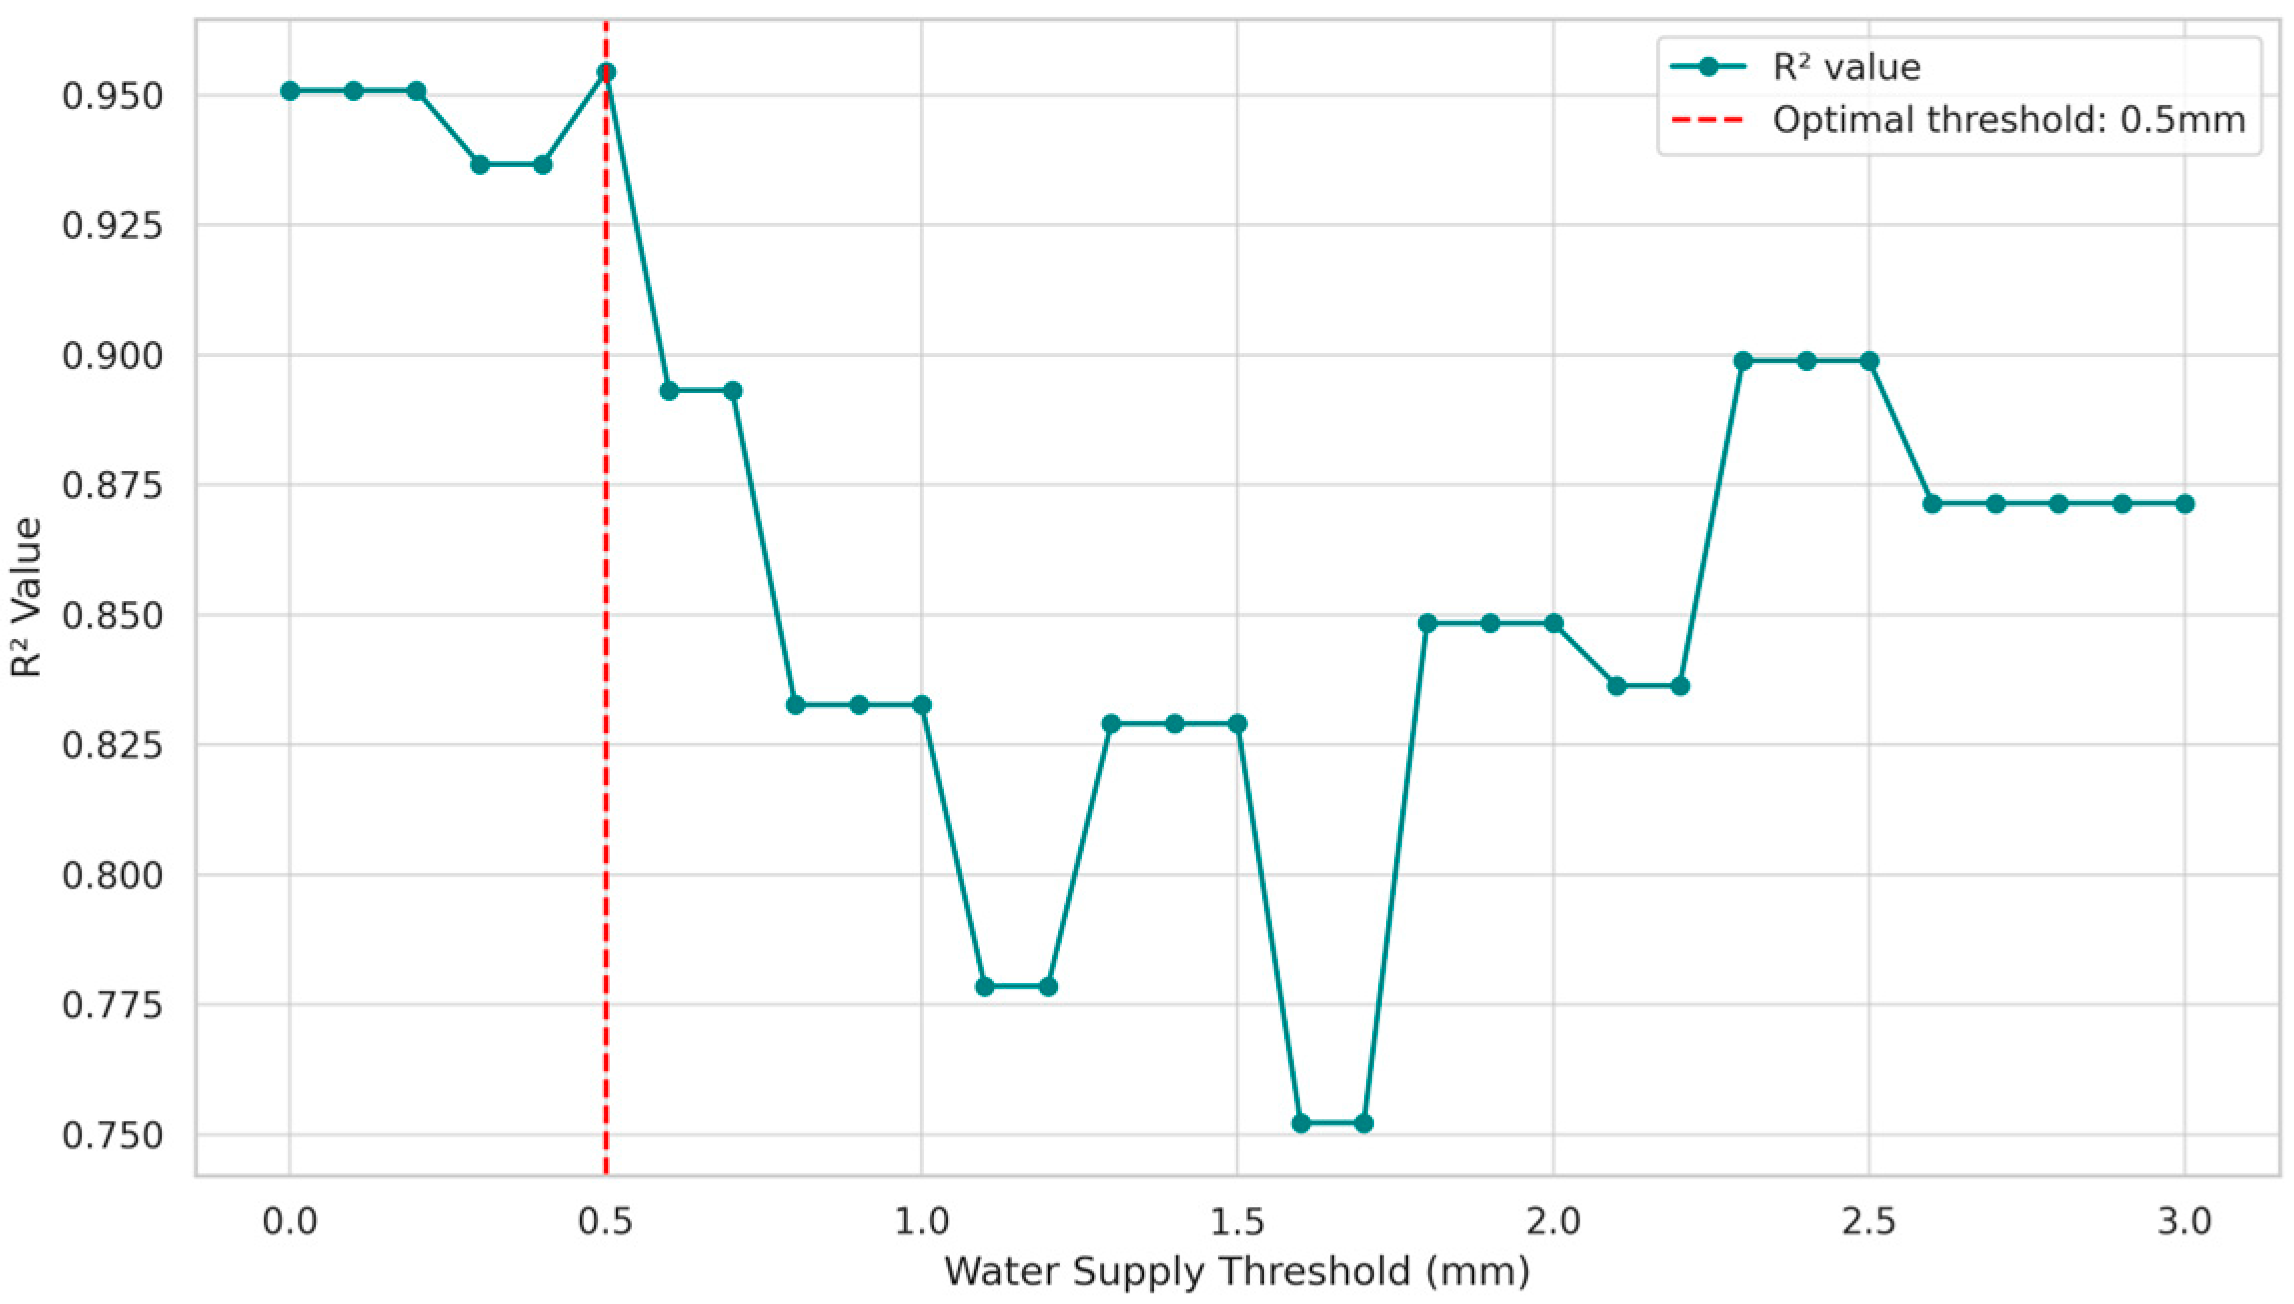
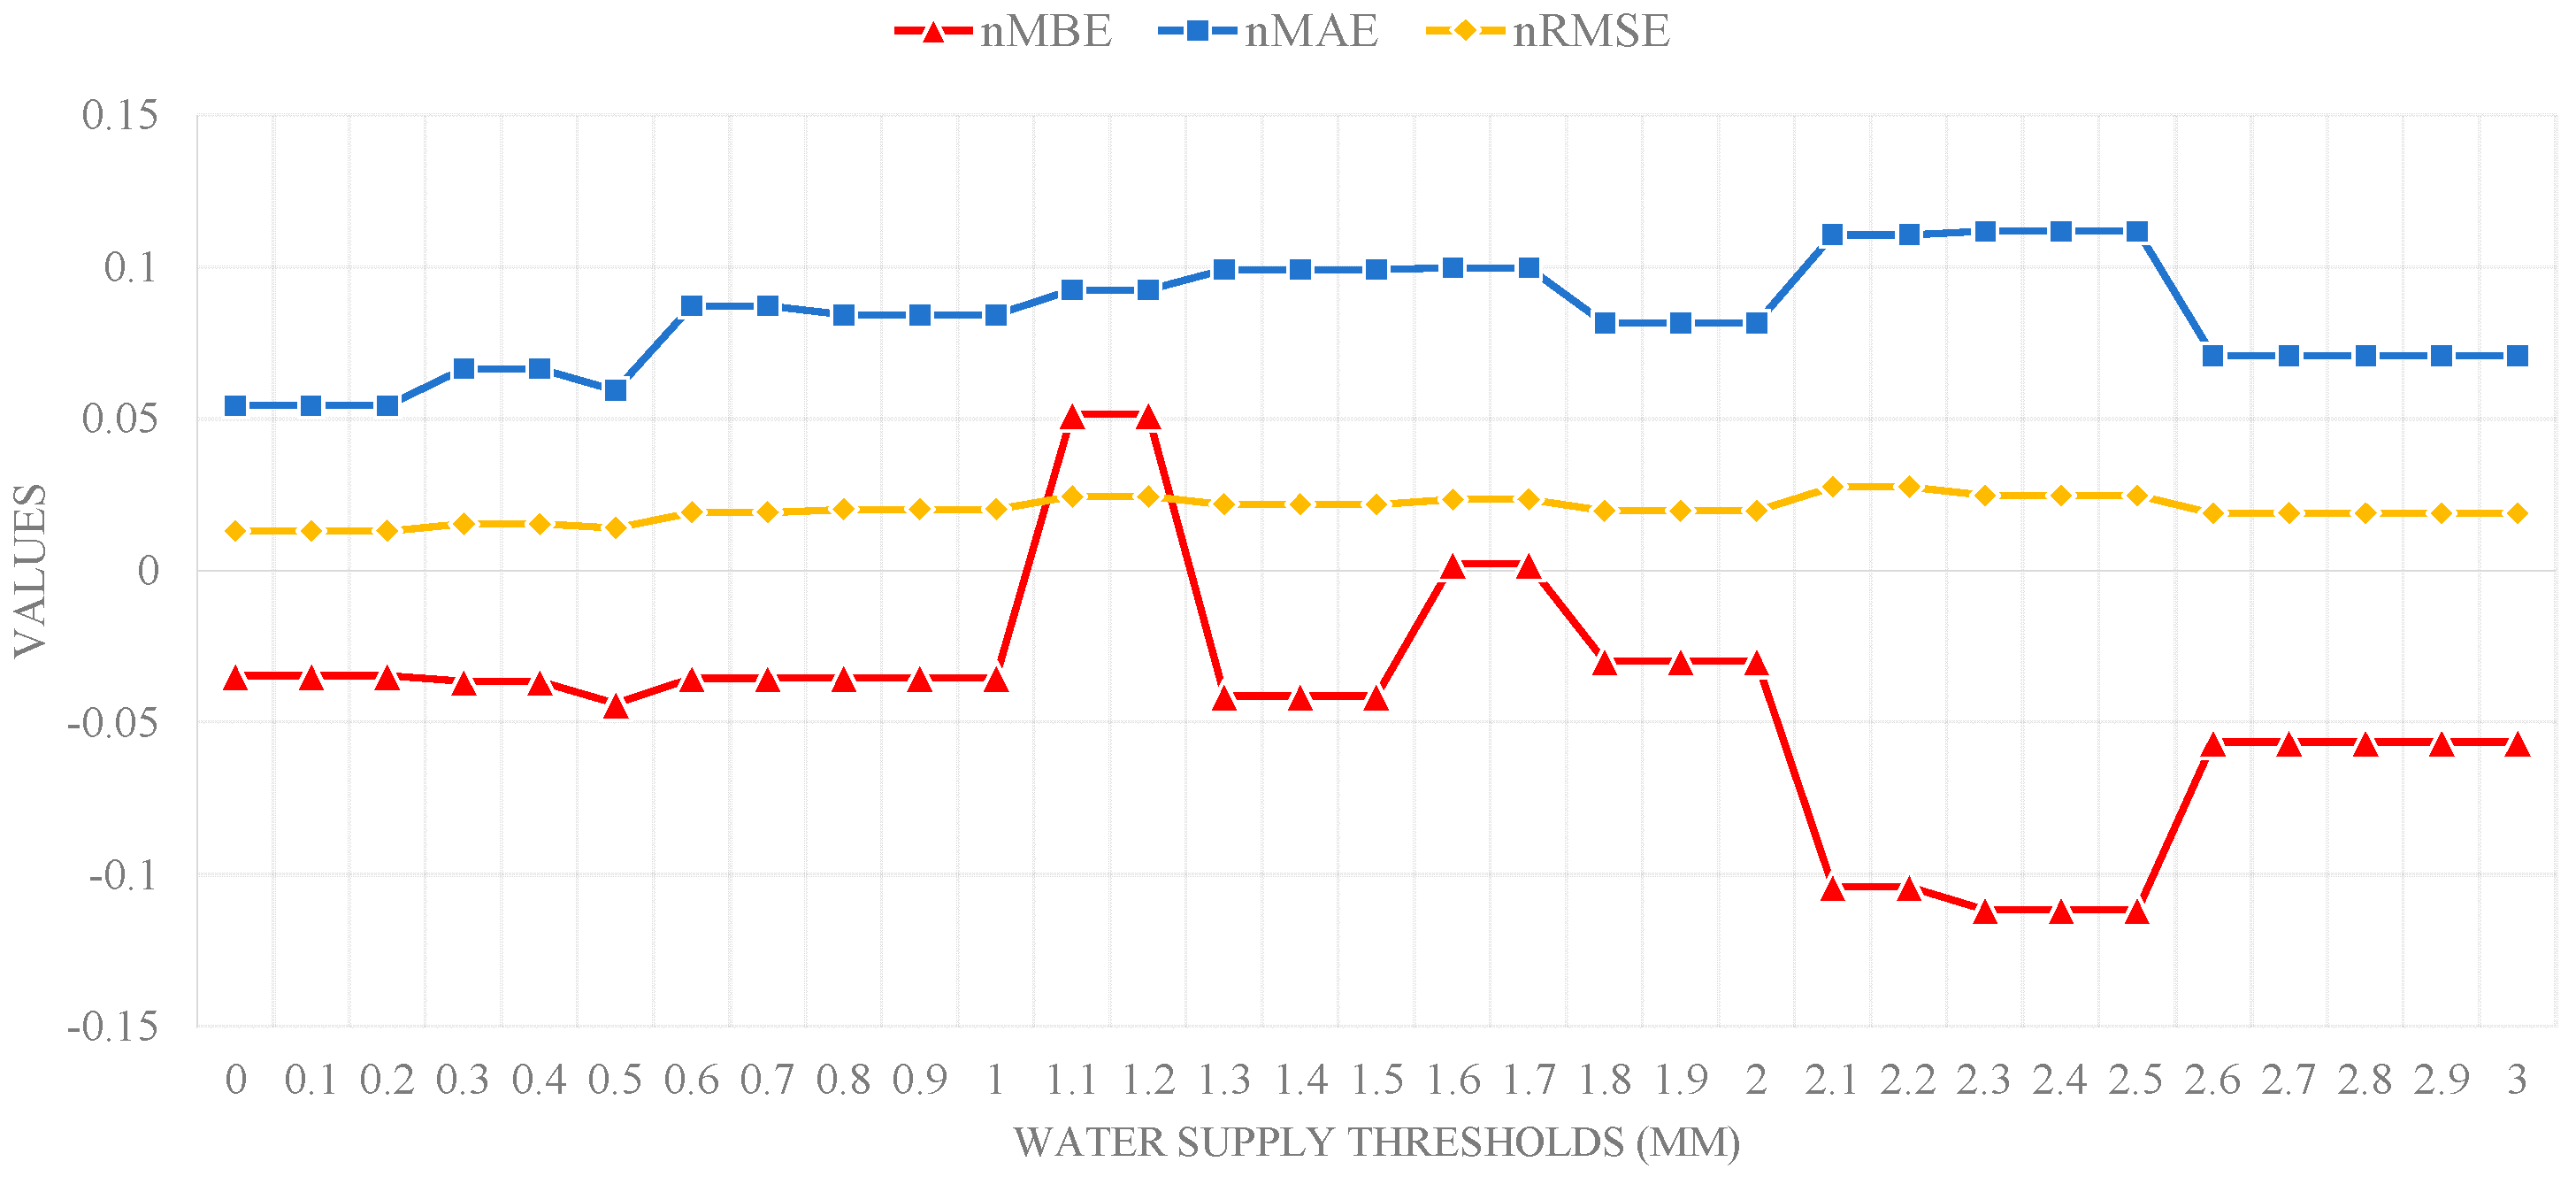
3.3. Influence of Threshold for on Prediction Performance

To determine the thresholds that distinguish the consuming model from the supplying model, a group of experiments were carried out to evaluate different thresholds for both models using the MLP model, which achieved the best prediction performance, as shown in Table 1. Only the thresholds for water replenishment were adjusted by fixing MLP model parameters (29 hidden nodes for the supplying model and 15 hidden nodes for the consuming model). Models trained with different thresholds were used for continuous prediction of soil moisture at root depth, and the results are shown in Figure 5 and Figure 6.
Compared to the effective water recharge set as 1 mm [25], it is clear that the effective water recharge value set to 0.5 mm is more appropriate, and the evaluation parameters perform optimally, as shown in Figure 5 and Figure 6. Therefore, water recharge less than 0.5 mm is defined as ineffective water recharge and modeled using the consuming model.

3.4. Influence of Hyperparameter Selection on Prediction Performance

The hyperparameters of prediction models significantly impact the prediction results [31,32,33]. Taking the MLP model as an example, the number of hidden nodes is a key hyperparameter affecting the prediction results. Therefore, we explored and analyzed the influence of the number of hidden nodes on the prediction results by keeping other hyperparameters fixed through empirical trials. The results of three groups of model hyperparameters are listed in Table 2.
Evaluating the model based solely on the training results as shown in Table 1 may not clearly reveal the differences. Therefore, we used these combinations of hidden node numbers for continuous prediction, and the evaluation results are listed in Table 3. The experimental results indicate that different hyperparameters have a considerable impact on the continuous prediction results. Therefore, it is essential to allow users to adjust the hyperparameters when providing training and prediction services.

3.5. Influence of Activation Functions on MLP Performance

To further investigate the impact of activation function choices on the performance of the MLP model, we evaluated four commonly used activation functions (identity, logistic, tanh, and Relu) with the same dataset and model configuration (hidden layer size, iterations, regularization strength, etc.) [34]. The results of the continuous prediction are listed in Table 4. These results indicate that the choice of activation function plays a significant role in the prediction accuracy of the MLP model. Among the tested options, Relu provided the best performance in terms of both fit (R2) and error metrics, making it the default activation function on the platform. Tanh also showed competitive results, while identity performed the worst, as expected due to its inability to capture nonlinearity in soil moisture dynamics.

4. Prediction Platform Application

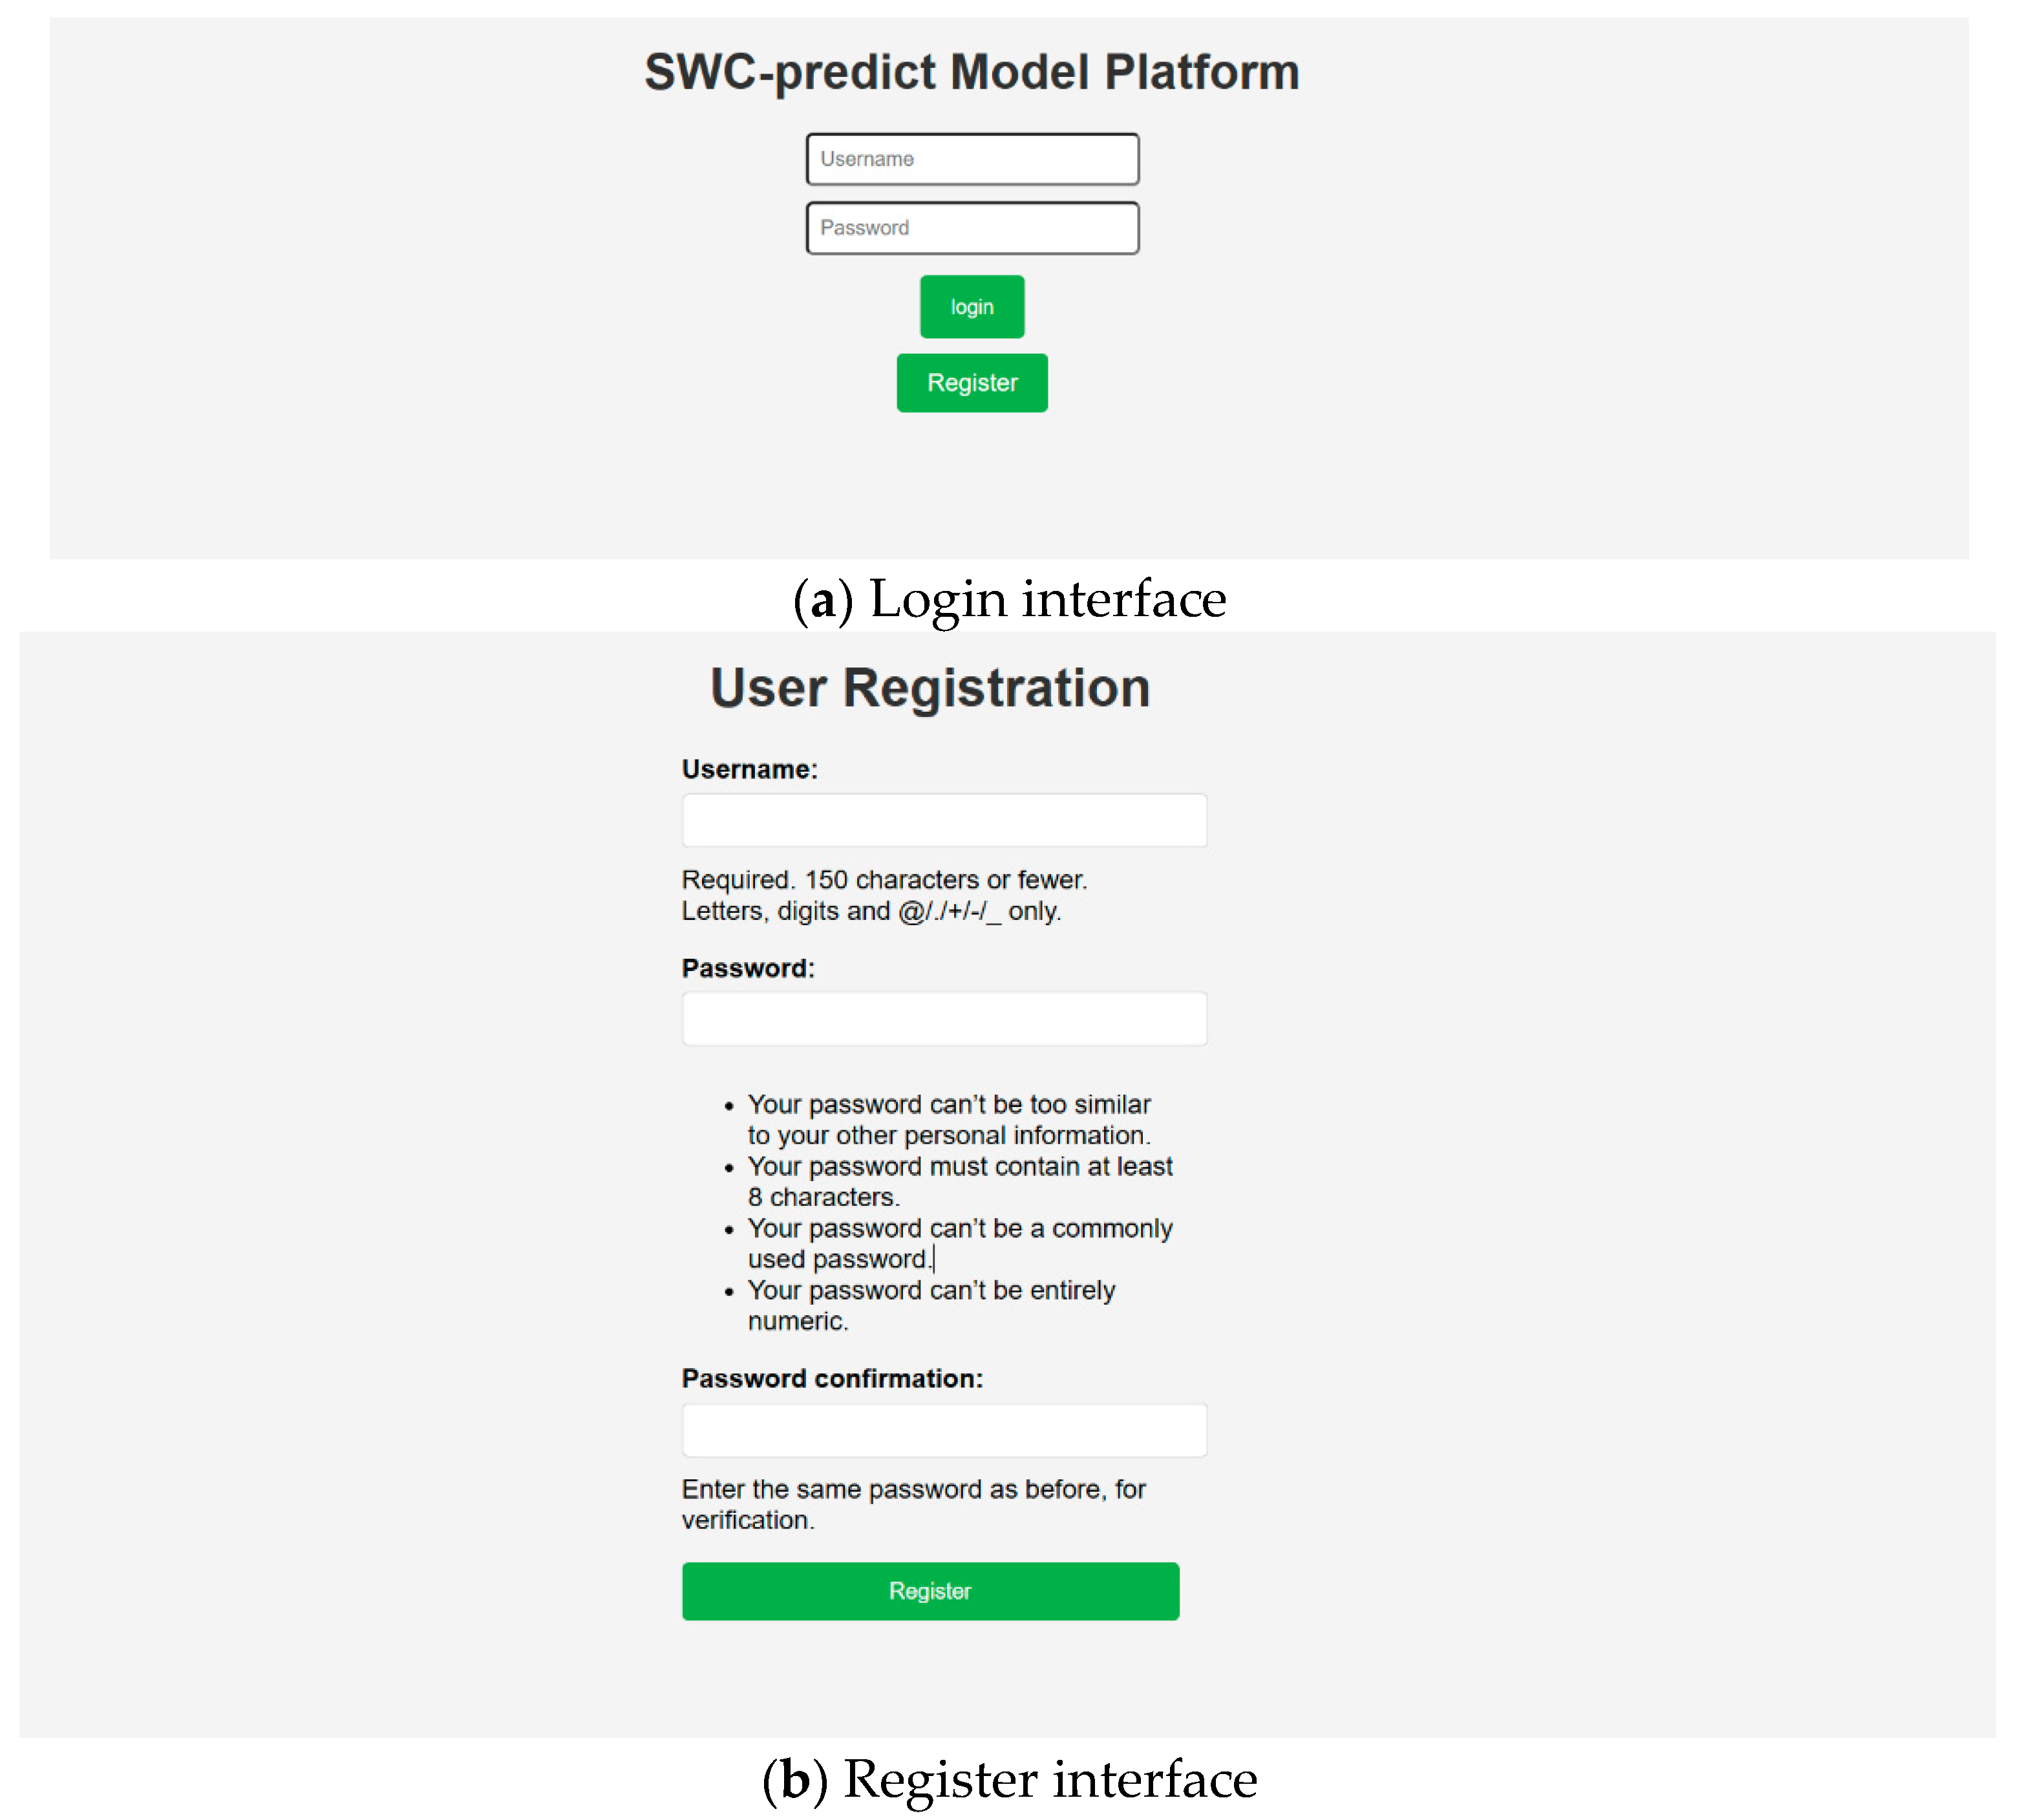
4.1. Registration and Login

After accessing the prediction platform’s website, as shown in Figure 7, users can log in using their registered username and password, as shown in Figure 8a. New users may click the “Register” button to access the registration interface, as shown Figure 8b, where they can create an account by entering a valid username and password. Input validation rules are applied to ensure that both fields meet system requirements. Upon successful registration, user credentials are stored securely in the backend user information database. After completing registration or login, users are redirected to the platform’s home page, where a welcome message and navigation bar are displayed. By clicking the “Start” button, as shown in Figure 7, users are guided to begin using the platform.

4.2. Data Collection

The primary function of the data collection interface is to standardize the file types and content formats of user-uploaded data. The platform accepts Microsoft Excel files in .xls or .xlsx formats. Given that users may use different units for meteorological parameters—such as root depth, rainfall, and irrigation (e.g., centimeters vs. millimeters)—unit standardization is essential. In the prediction platform, all values of root depth, rainfall, and irrigation are normalized to centimeters. Additionally, because Django is sensitive to date formatting, a unified date style is required to prevent errors during data parsing and to reduce unnecessary manual adjustments. Therefore, users are instructed to follow specific formatting guidelines when preparing their input files.
To assist users in meeting these data formatting requirements, the data preparation interface provides instructional prompts along with two functional buttons: “Display Template” and “Open Template Excel”. By clicking “Display Template”, users can view a schematic illustration of the required data structure. If further clarification is needed, users can click “Open Template Excel” to download the editable Excel file and modify their data accordingly based on the provided format.

4.3. Model Selection and Training
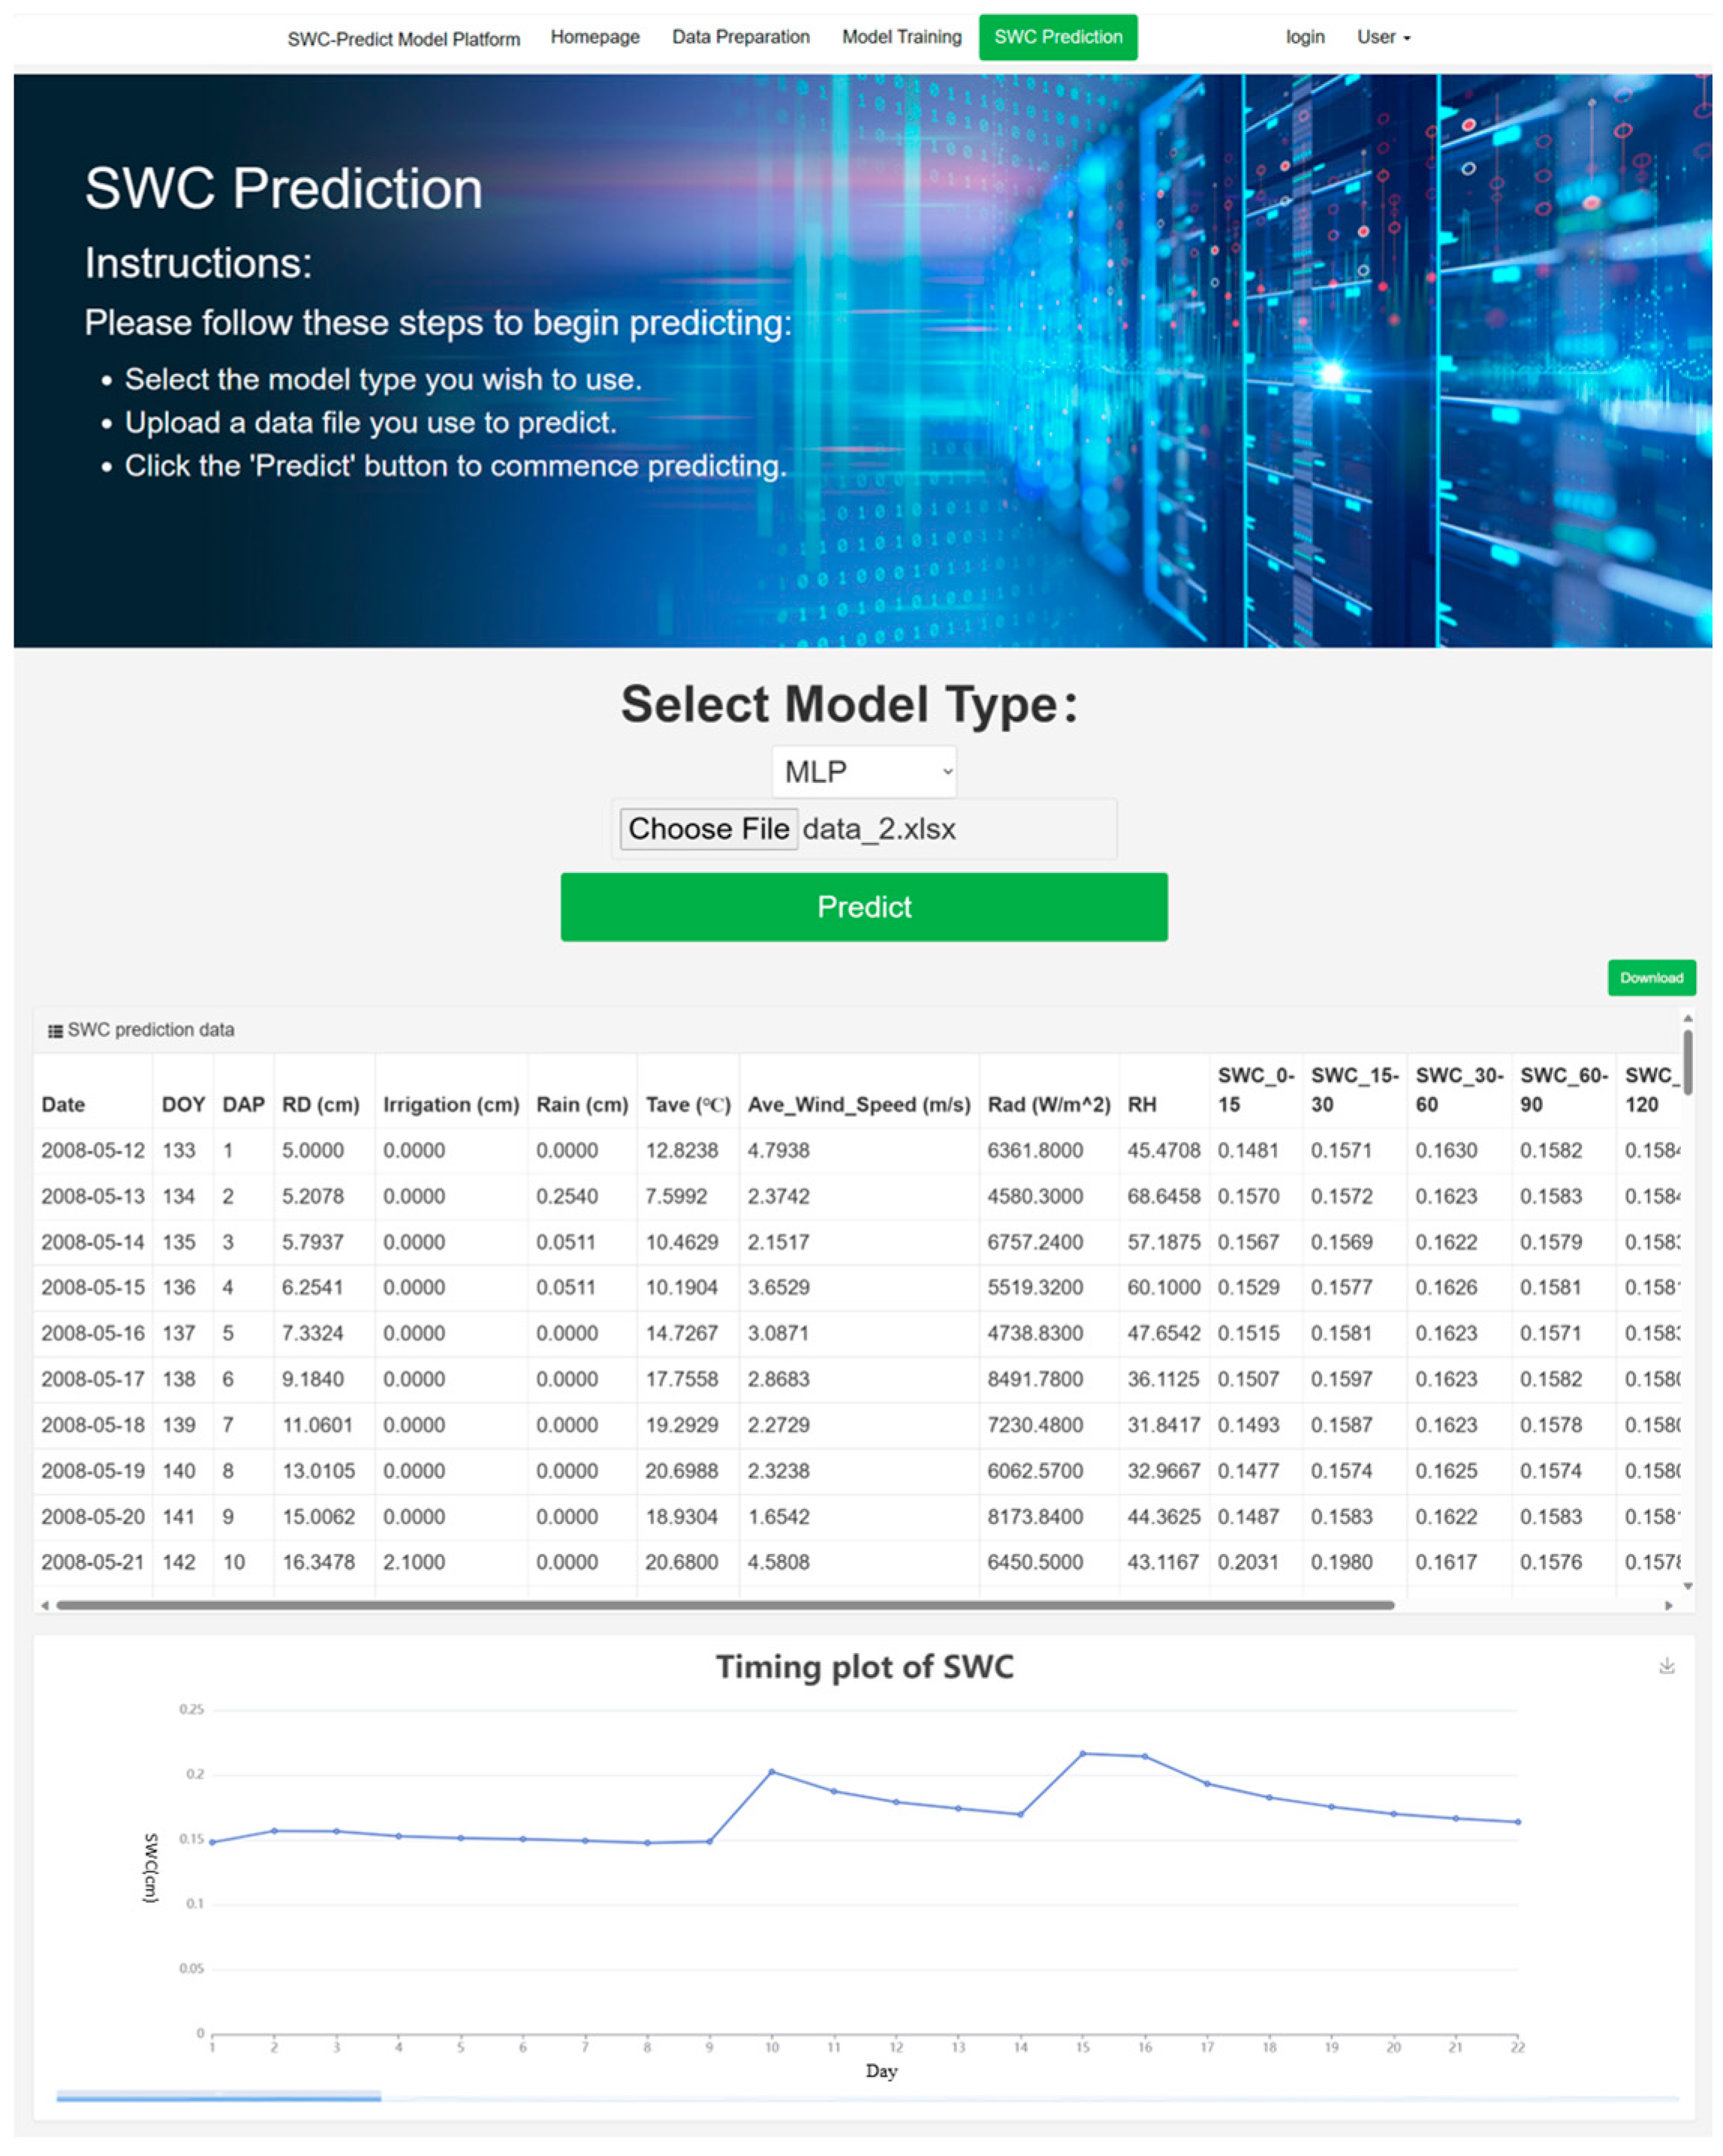
After the user completes the data preparation process, they are prompted to enter the model training interface. Once inside the interface, users can follow the on-screen instructions to complete the training procedure. A diagram illustrating the model structure is provided in the training interface. This diagram includes a help button, which briefly describes its purpose, helping users gain a clearer understanding of the training process. When a model is selected, the system will display a range of adjustable parameters based on the model type (e.g., MLP: number of hidden nodes and maximum iterations; SVR and LinearSVR: tolerance error parameter and regularization error parameter).
Since accurately adjusting hyperparameters can be challenging for non-professionals, the prediction platform also provides an auto-optimization function, which automatically selects the optimal hyperparameters within a rough range provided by the user. The hyperparameter range is suggested and defaulted based on the model, making it easier for users to determine the appropriate range. The default values of the prediction model hyperparameters are listed in Table 5.
Taking the supplying model of MLP as an example, we tested the efficiency of grid search and random search with the number of hidden nodes as a hyperparameter, and the results are listed in Table 6. For the grid search, the optimal solution was found when the number of hidden nodes was in the range of 10 to 50, with a step size of 1, 21 iterations, and an iteration time of 2.44 s, demonstrating high feasibility. Although the grid search method performs a little better, the random search method has a faster convergence speed under the same conditions and data. Therefore, when the goal is not to find the optimal hyperparameter combination but simply a better one, random search is a more efficient choice.
After adjusting the parameters and uploading the training data, users can click the “Train” button. The system will then automatically search for the optimal parameters within the specified ranges and select the best ones for training. Evaluation parameters (R2) are subsequently calculated for both the supplying and consuming models for each soil layer. The trained model is then saved in the model database. Based on the R2 values, users can either proceed with further parameter adjustments or enter the real-time decision board to use the trained model for soil moisture predictions.

4.4. SWC Prediction

The SWC prediction module provides users with real-time soil water content predictions of every soil layer for irrigation decision-making. After uploading the prediction data and selecting the model, users can click the “Predict” button to obtain a list of predicted results shown as Figure 9. This list includes meteorological data, root depth, and other attribute columns for each predicted day, along with the predicted moisture values for each soil layer based on the user’s provided data. Additionally, a download function will be available, allowing users to download the forecast data in Excel format. A time series plot of soil moisture at root depth will also be provided, offering a clear visualization for each prediction day. This plot will be available for download and can be saved locally in PNG format.

5. Conclusions

A soil water content prediction platform has been developed by integrating multiple machine learning models, including MLP, SVM, and Linear SVM, for root-zone soil moisture estimation. The experimental results demonstrate that the performance of the prediction model is satisfactory, with R2 values exceeding 0.91.
Moreover, the results of the three comparative experiments indicate that the partition threshold, model hyperparameters, and model activation function of the sub-models all have a significant impact on the prediction results. However, these settings often require relatively specialized knowledge, which limits the application of machine learning to soil moisture prediction. The prediction platform developed based on Django in this paper enables users to operate without professional knowledge by embedding models, standardizing data, setting default values, providing model rotation, and automatic hyperparameter search schemes, etc., to obtain soil moisture prediction values and guide agricultural irrigation.
Future work will aim to further enhance the platform’s usability by improving user interface design and integrating advanced visualization tools to better support user decision-making. On the other hand, the platform will integrate multiple management strategies to provide irrigation and management suggestions based on predicted results for users, which would improve the intelligence level of agricultural production management.

Author Contributions

Conceptualization, Z.G.; methodology, P.G. and Z.G.; software, P.G., Z.L. and Z.G.; validation, P.G.; formal analysis, P.G. and Z.L.; resources, Z.G.; data curation, Z.G.; writing—original draft preparation, P.G. and Z.G.; writing—review and editing, T.Z.; visualization, P.G.; supervision, H.Z.; funding acquisition, Z.G. All authors have read and agreed to the published version of the manuscript.

Funding

This research was funded by the Fundamental Research Funds for the Central Universities, grant number B240201037; Jiangxi Province “Science and Technology & Water Conservancy” Joint Plan Project, grant number 2023KSG01002; and Key Research and Development Program Project of Jiangsu Province, grant number BE2022390.

Data Availability Statement

The data presented in this study are available upon request by contact with the corresponding author due to the data being part of an ongoing study.

Conflicts of Interest

The authors declare no conflicts of interest.

References

  1. Huffman, R.L. Soil and Water Conservation Engineering; American Society of Agricultural and Biological Engineers: St. Joseph, MI, USA, 2013. [Google Scholar]
  2. Chen, Z.; Song, N.; Liu, X.; Wang, J. Water-saving irrigation management and decision support system. Trans. Chin. Soc. Agric. Eng. 2009, 25, 1–6. [Google Scholar]
  3. Gu, Z.; Qi, Z.; Ma, L.; Gui, D.; Xu, J.; Fang, Q.; Yuan, S.; Feng, G. Development of an irrigation scheduling software based on model predicted crop water stress. Comput. Electron. Agric. 2017, 143, 221–298. [Google Scholar] [CrossRef]
  4. Tan, J.; Cui, Y.; Zhang, P. The development and application of real-time irrigation forecasting and irrigation water decision support system. China Rural. Water Hydropower 2015, 07, 1–4+9. [Google Scholar]
  5. Yang, S.; Wang, J.; Zhou, J. Decision support system based on variable irrigation mathematical model. Trans. Chin. Soc. Agric. Eng. 2005, 11, 37–40. [Google Scholar]
  6. Kamath, R.; Balachandra, M.; Prabhu, S. Raspberry Pi as visual sensor nodes in precision agriculture: A study. IEEE Access 2019, 7, 45110–45122. [Google Scholar] [CrossRef]
  7. Hu, Y.; Li, H.; Wang, W.; Li, Q. Application of Remote Sensing in Monitoring the Soil Moisture of the Irrigation Area in the Lower Yellow River Coastal Area. J. Coast. Res. 2019, 94, 96–100. [Google Scholar] [CrossRef]
  8. Shi, W.Q.; Xu, X.Y.; Zhang, W.; Zhang, P.; Sun, H.; Hu, J. Prediction Model of Soil Moisture Content in Northern Cold Region Based on Near-Infrared Spectroscopy. Spectrosc. Spectr. Anal. 2022, 42, 1704–1710. [Google Scholar]
  9. Ahuja, L.R.; Ma, L.; Lascano, R.J.; Saseendran, S.A.; Fang, Q.X.; Nielsen, D.C.; Wang, E.; Colaizzi, P.D. Syntheses of the current model applications for managing water and needs for experimental data and model improvements to enhance these applications. Adv. Agric. Syst. Model. 2014, 5, 399–438. [Google Scholar]
  10. Saseendran, S.A.; Ahuja, L.R.; Ma, L.; Trout, T.J. Modeling for best management of the effects of irrigation frequencies, initial water, and nitrogen on corn. Adv. Agric. Syst. Model. 2014, 5, 25–52. [Google Scholar]
  11. Huang, L.; Jiang, X.; Jia, Z.; Zhou, H.; Zhou, L.; Rong, Z. Hyperspectral monitoring of nutrient content in pear trees based on deep learning. Spectrosc. Spectr. Anal. 2024, 44, 3543–3552. [Google Scholar]
  12. Chen, K.; Lei, X.; Li, F.; Wen, J. Drip moisture prediction of processing tomatoes based on BP networks. China Rural. Water Hydropower 2012, 9, 1–4. [Google Scholar]
  13. Huang, F.; Zhang, Y.; Zhang, Y.; Shangguan, W.; Li, Q.; Li, L.; Jiang, S. Interpreting Conv-LSTM for spatio-temporal soil moisture prediction in China. Agriculture 2023, 13, 971. [Google Scholar] [CrossRef]
  14. Xu, L.; Yu, H.; Chen, Z.; Du, W.; Chen, N.; Huang, M. Hybrid Deep Learning and S2S Model for Improved Sub-Seasonal Surface and Root-Zone Soil Moisture Forecasting. Remote Sens. 2023, 15, 3410. [Google Scholar] [CrossRef]
  15. Lu, J.; Tan, L.; Jiang, H. Review on convolutional neural network (CNN) applied to plant leaf disease classification. Agriculture 2021, 11, 707. [Google Scholar] [CrossRef]
  16. Gu, Z.; Zhu, T.; Jiao, X.; Xu, J.; Qi, Z. Evaluating the Neural Network Ensemble Method in Predicting Soil Moisture in Agricultural Fields. Agronomy 2021, 11, 1521. [Google Scholar] [CrossRef]
  17. Shi, J.; Yang, H.; Wang, F.; Sun, P. Collaborative inversion of soil moisture over summer maize covered surfaces based on multi-source remote sensing data. China Rural. Water Hydropower 2024, 8, 136–143. [Google Scholar]
  18. Kamienski, C.; Soininen, J.P.; Taumberger, M.; Fernandes, S.; Toscano, A.; Cinotti, T.S.; Maia, R.F.; Neto, A.T. SWAMP: An IoT-based Smart Water Management Platform for Precision Irrigation in Agriculture. In Proceedings of the IEEE Global IoT Summit 2018, Bilbao, Spain, 4–7 June 2018. [Google Scholar]
  19. Li, S. Research on Key Technologies of Cloud Service Platform for Farmland Soil Moisture Monitoring and Intelligent Irrigation. Ph.D. Thesis, Chinese Academy of Agricultural Sciences, Beijing, China, 2017. [Google Scholar]
  20. Gu, W.; Yang, L.; Li, T. The development and application of irrigation water decision support system based on real-time weather information. Water Sav. Irrig. 2017, 02, 103–105. [Google Scholar]
  21. Mbabazi, D.; Migliaccio, K.W.; Crane, J.H.; Fraisse, C.; Zotarelli, L.; Morgan, K.T.; Kiggundu, N. An irrigation schedule testing model for optimization of the Smartirrigation avocado app. Agric. Water Manag. 2017, 179, 390–400. [Google Scholar] [CrossRef]
  22. Wu, M.C.; Sheu, Y.H.; Liu, S.H.; Shieh, J.Y.; Su, H.K. Design of a Composite IoT Sensor Stack System for Smart Agriculture. Lect. Notes Data Eng. Commun. Technol. 2023, 177, 250–260. [Google Scholar]
  23. Zhang, T.; Liao, M.; Zhang, R.; Huang, W.; Shao, M. Design and implementation of traffic accident data visual analysis system based on Django. Softw. Guide 2023, 22, 112–117. [Google Scholar]
  24. Wang, D. Design of the online education platform for Python courses based on the Django framework. Inf. Comput. 2023, 35, 242–244. [Google Scholar]
  25. Gu, Z.; Zhu, T.; Jiao, X.; Xu, J.; Qi, Z. Neural network soil moisture model for irrigation scheduling. Comput. Electron. Agric. 2021, 180, 105801. [Google Scholar] [CrossRef]
  26. Achieng, K.O. Modelling of soil moisture retention curve using machine learning techniques: Artificial and deep neural networks vs support vector regression models. Comput. Geosci. 2019, 133, 104320. [Google Scholar] [CrossRef]
  27. Lacasse, M.A. Application of Support Vector Regression to the Prediction of the Long-Term Impacts of Climate Change on the Moisture Performance of Wood Frame and Massive Timber Walls. Buildings 2021, 11, 188. [Google Scholar] [CrossRef]
  28. Uttsha, M.M.; Haque, A.N.; Banna, T.T.; Deowan, S.A.; Islam, A.; Babu, H.M.H. Enhancing agricultural automation through weather invariant soil parameter prediction using machine learning. Heliyon 2024, 10, 10. [Google Scholar] [CrossRef]
  29. Ma, L.; Trout, T.J.; Ahuja, L.R.; Bausch, W.C.; Saseendran, S.A.; Malone, R.W.; Nielsen, D.C. Calibrating RZWQM2 model for maize responses to deficit irrigation. Agric. Water Manag. 2012, 103, 140–149. [Google Scholar] [CrossRef]
  30. Ma, L.; Niu, W.; Li, G.; Du, Y.; Sun, J.; Siddique, K.H.M. Crop Yield Prediction Based on Bacterial Biomarkers and Machine Learning. J. Soil. Sci. Plant Nutr. 2024, 24, 2798–2814. [Google Scholar] [CrossRef]
  31. Han, Q.; Zeng, Y.; Zhang, L.; Cira, C.-I.; Prikaziuk, E.; Duan, T.; Wang, C.; Szabó, B.; Manfreda, S.; Zhuang, R.; et al. Ensemble of optimised machine learning algorithms for predicting surface soil moisture content at global scale. Geosci. Model. Dev. Discuss. 2023, 16, 5825–5845. [Google Scholar] [CrossRef]
  32. Singh, T.; Kundroo, M.; Kim, T. WSN-Driven Advances in Soil Moisture Estimation: A Machine Learning Approach. Electronics 2024, 13, 1590. [Google Scholar] [CrossRef]
  33. Li, S.; Zhu, P.; Song, N.; Li, C.; Wang, J. Regional Soil Moisture Estimation Leveraging Multi-Source Data Fusion and Automated Machine Learning. Remote Sens. 2025, 17, 837. [Google Scholar] [CrossRef]
  34. Peterson, L.E. Covariance matrix self-adaptation evolution strategies and other metaheuristic techniques for neural adaptive learning. Soft Comput. 2011, 15, 1483–1495. [Google Scholar] [CrossRef]
Figure 1. Soil water content prediction platform architecture diagram, where the arrow indicates inclusion relationship.
Water 17 01753 g001
Figure 2. Structure of soil water content prediction model, where arrow indicates the flow of data.
Water 17 01753 g002
Figure 3. Workflow of the soil water content prediction platform, where the arrow means the flow of data.
Water 17 01753 g003
Figure 4. Root-zone soil water content time series with different prediction models.
Water 17 01753 g004
Figure 5. R2 of predictions and the true values by MLP with different water supply thresholds.
Water 17 01753 g005
Figure 6. Evaluation results (nMBEs, nMAEs, and nRMSEs) of predictions and the true values by MLP with different water supply thresholds.
Water 17 01753 g006
Figure 7. Home page of soil water content prediction platform.
Water 17 01753 g007
Figure 8. Login and Register interface.
Water 17 01753 g008
Figure 9. Continuous prediction results displayed on the interface of the prediction platform.
Water 17 01753 g009
Table 1. Performance of different models for the testing set under the continuous prediction.
ModelsR2nMBEnMAEnRMSE
MLP0.9545−0.04380.05940.0141
SVR0.9197−0.07560.08230.0202
LinearSVR0.9227−0.09300.16180.0331
Random Forest0.9246−0.09810.10250.0235
XGBoost0.9103−0.05420.09130.0200
Table 2. The prediction results of MPL with different hyperparameters on the testing set.
MLP (h1, h2)R2nMBEnMAEnRMSE
(13, 12)0.9988−0.00010.00460.0013
(16, 15)0.9989−0.00010.00440.0012
(29, 15)0.9991−0.00020.00410.0010
Notes: h1 is the number of hidden nodes of the supplying sub-model, and h2 is the number of hidden numbers of the consuming sub-model.
Table 3. Continuous prediction results of MPL with different hyperparameters.
MLP (h1,h2)R2nMBEnMAEnRMSE
(13, 12)0.9121−0.16250.16340.0334
(16, 15)0.9249−0.05250.08180.0012
(29, 15)0.9544−0.04380.05940.0141
Notes: h1 is the number of hidden nodes of the supplying sub-model, and h2 is the number of hidden numbers of the consuming sub-model.
Table 4. Performance of MLP with different activation functions.
Activation FunctionR2nMBEnMAEnRMSE
Identity0.85860.12110.13590.0278
Logistic0.88520.08230.13210.0202
Tanh0.9327–0.05200.07250.0150
Relu0.9545–0.04380.05940.0142
Table 5. Model hyperparameters with default values for different prediction models.
ModelsHyperparameters (Default Value)
MLPHidden layers (m = 1), learning rate (lr = 0.001), hidden nodes (h ∈ [10,50])
SVMRegularization parameter (C ∈ [1,10]), tolerance error parameter (ε = 0.01)
Linear SVMRegularization parameter (C ∈ [1,10]), tolerance error parameter (ε = 0.2)
Table 6. Performance comparison of grid search and random search for the optimal model hyperparameters.
Grid SearchRandom Search
R2 of Soil Layer10.9999260.999926
R2 of Soil Layer20.9996330.999633
R2 of Soil Layer30.9999370.999937
R2 of Soil Layer40.9998700.999870
R2 of Soil Layer50.9999200.999920
R2 of Soil Layer60.9999530.999938
R2 of Soil Layer70.9998740.999874
Iteration time2.4468 s1.2525 s
Iteration number2110
Disclaimer/Publisher’s Note: The statements, opinions and data contained in all publications are solely those of the individual author(s) and contributor(s) and not of MDPI and/or the editor(s). MDPI and/or the editor(s) disclaim responsibility for any injury to people or property resulting from any ideas, methods, instructions or products referred to in the content.

