

Extreme Droughts in the Peruvian Amazon Region (2000–2024)

 ,
,  , and
, and
Abstract
1. Introduction
2. Materials and Methods
2.1. Data Sources
2.2. Study Area
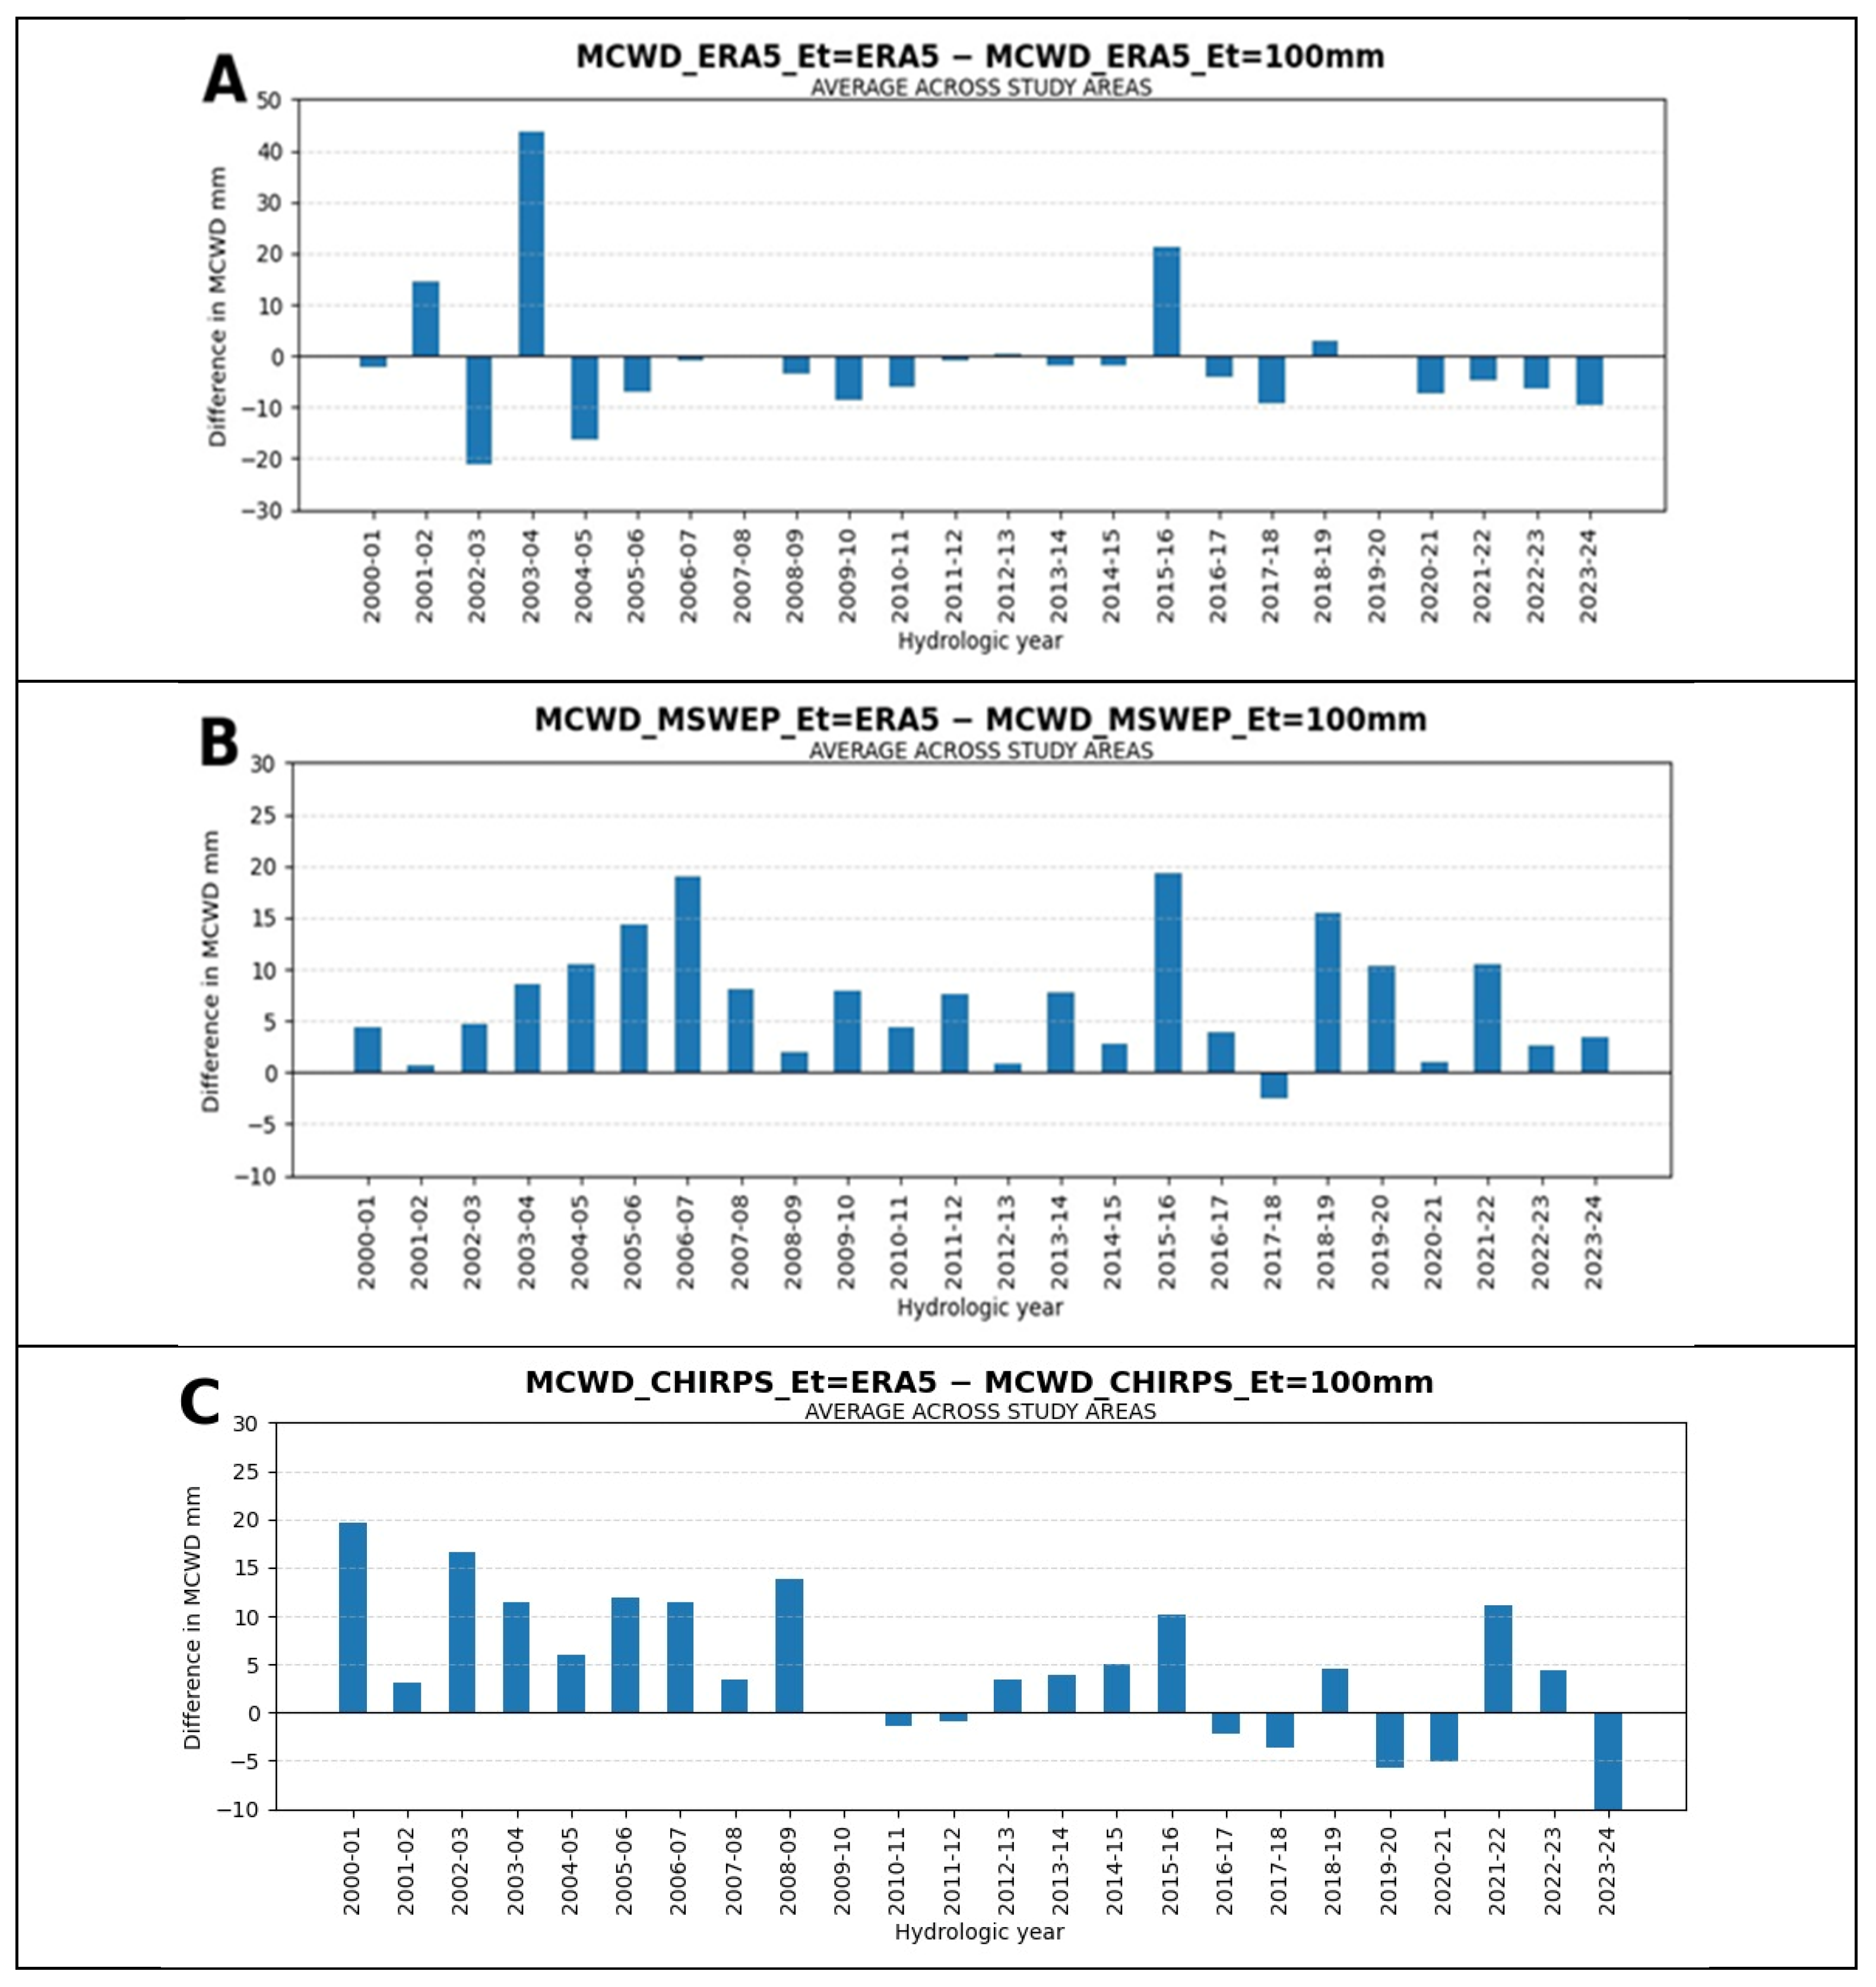
2.3. Obtaining the MCWD Drought Index
3. Results
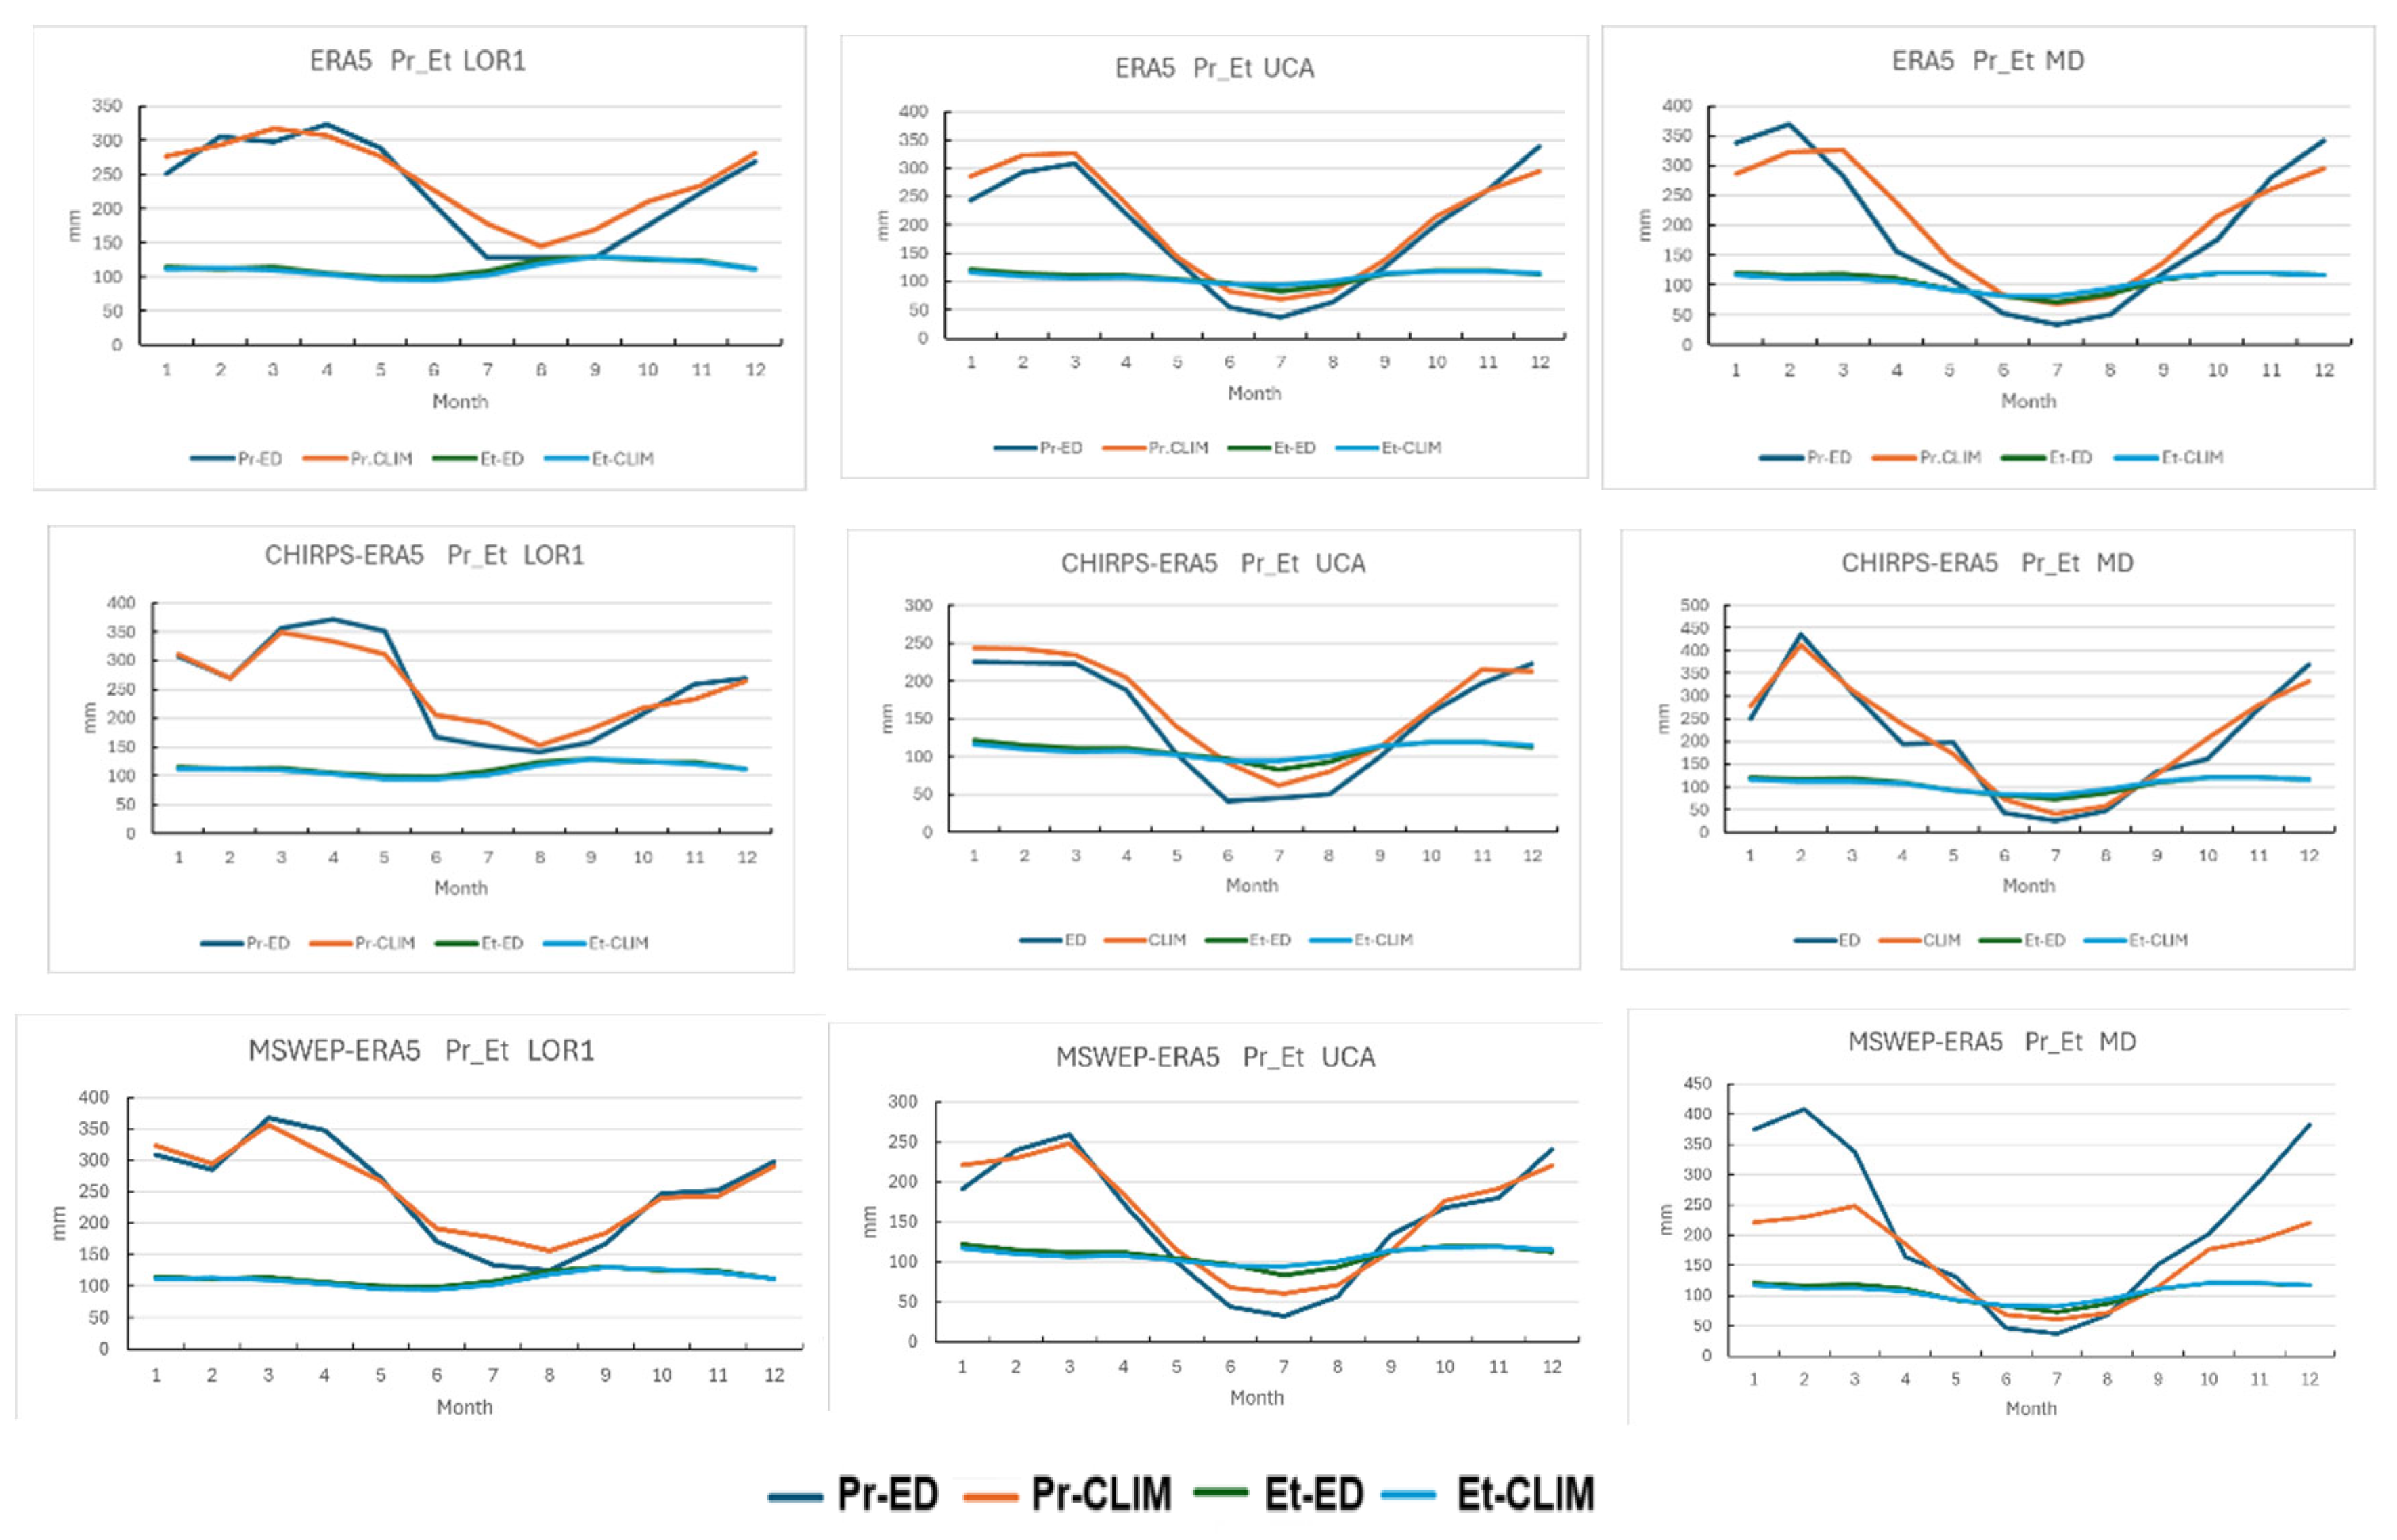
3.1. Annual Precipitation and Evaporation in the Study Areas of the Peruvian Amazon
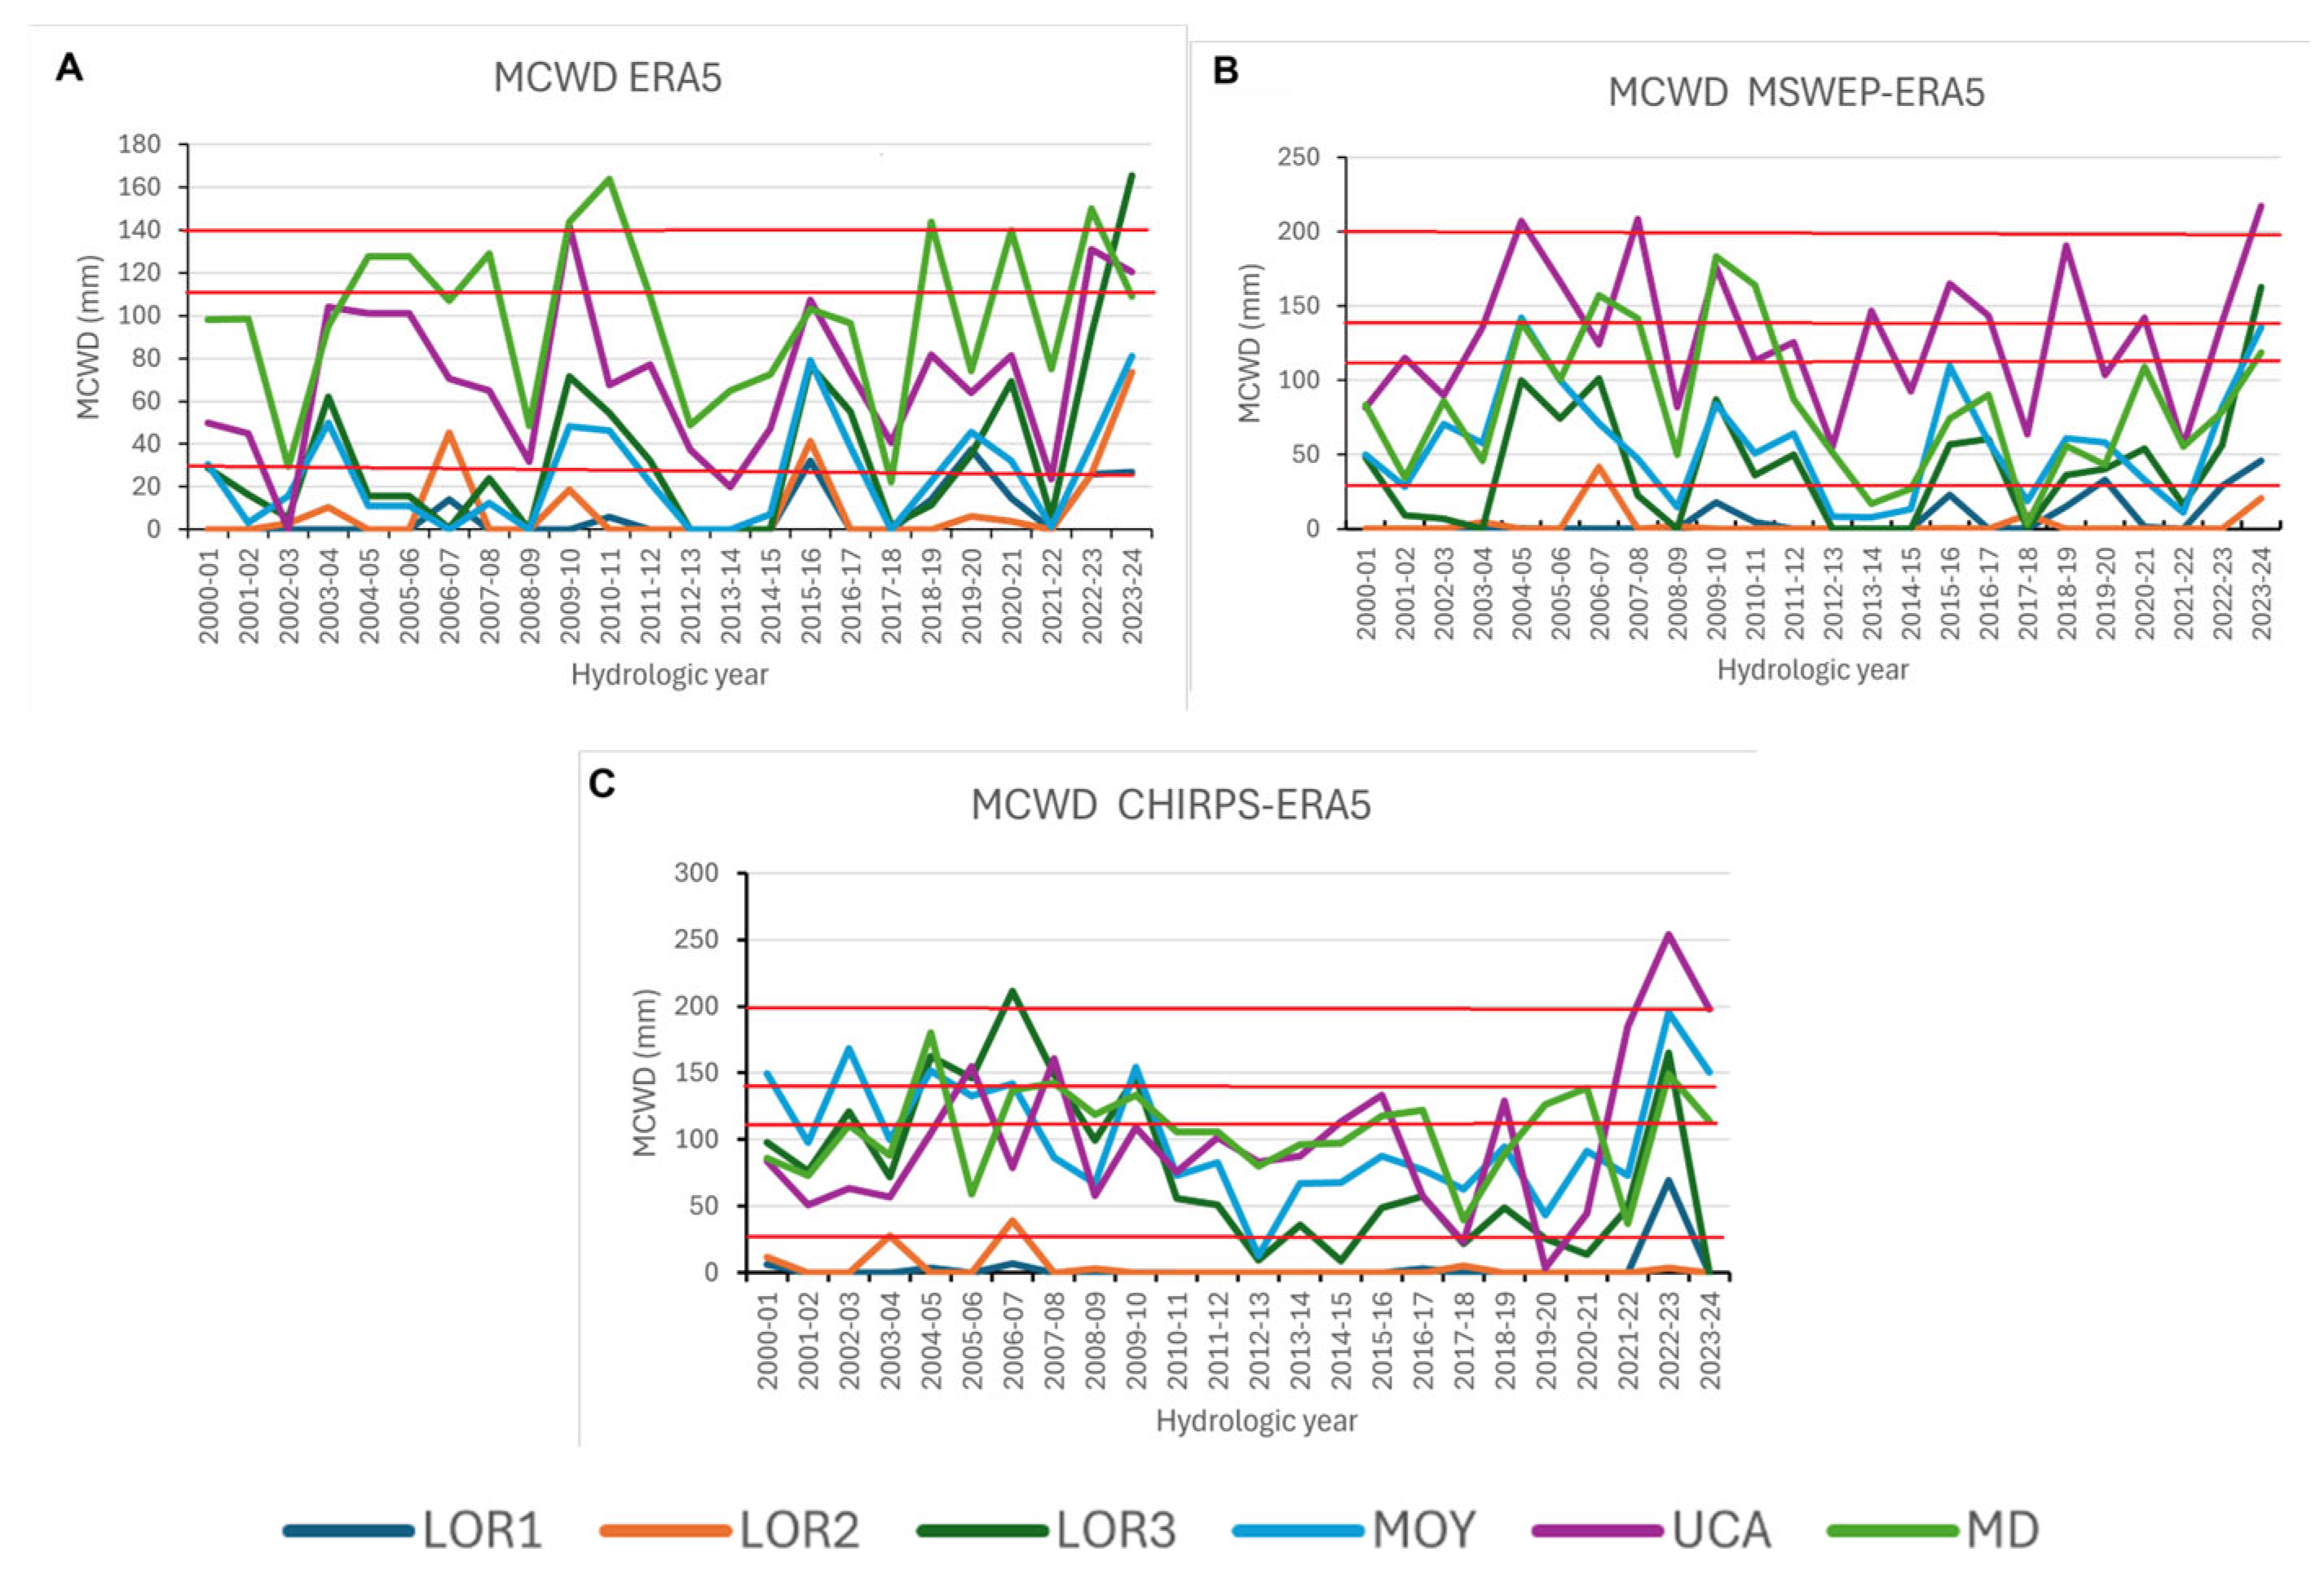
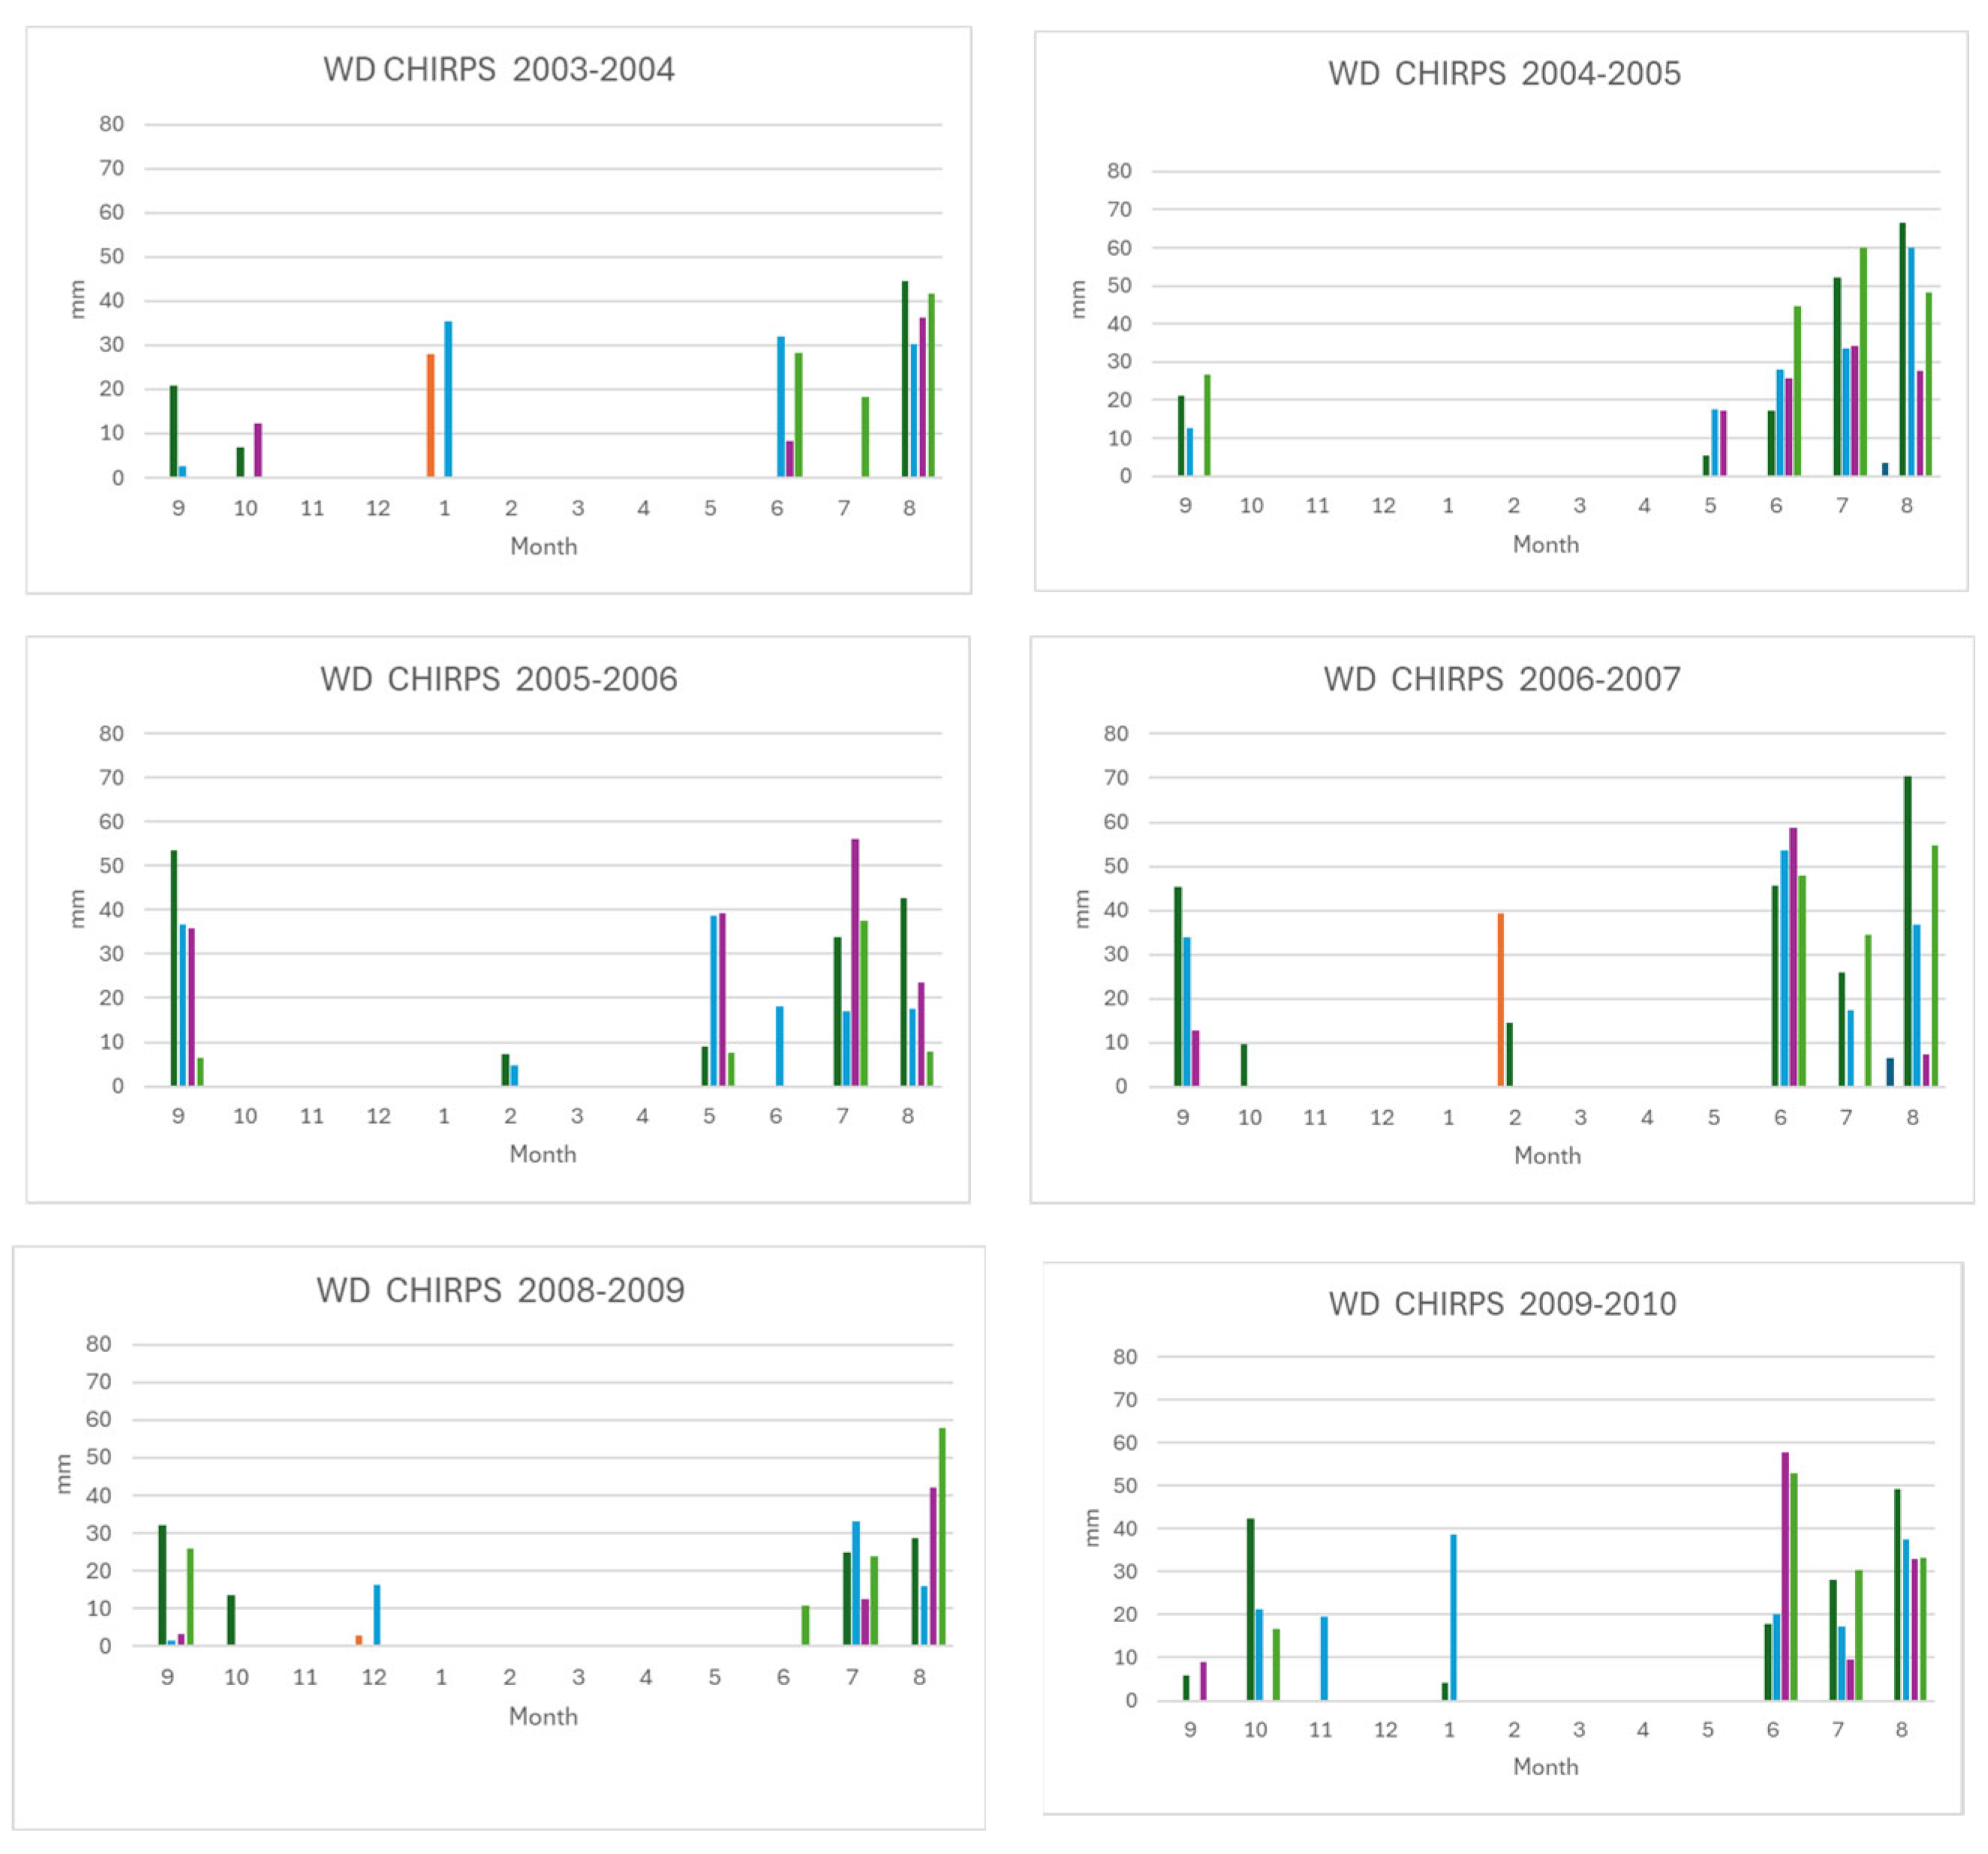
3.2. Determination of Drought Periods
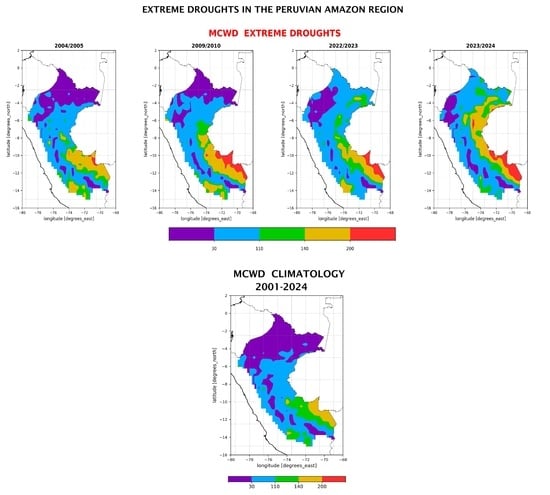
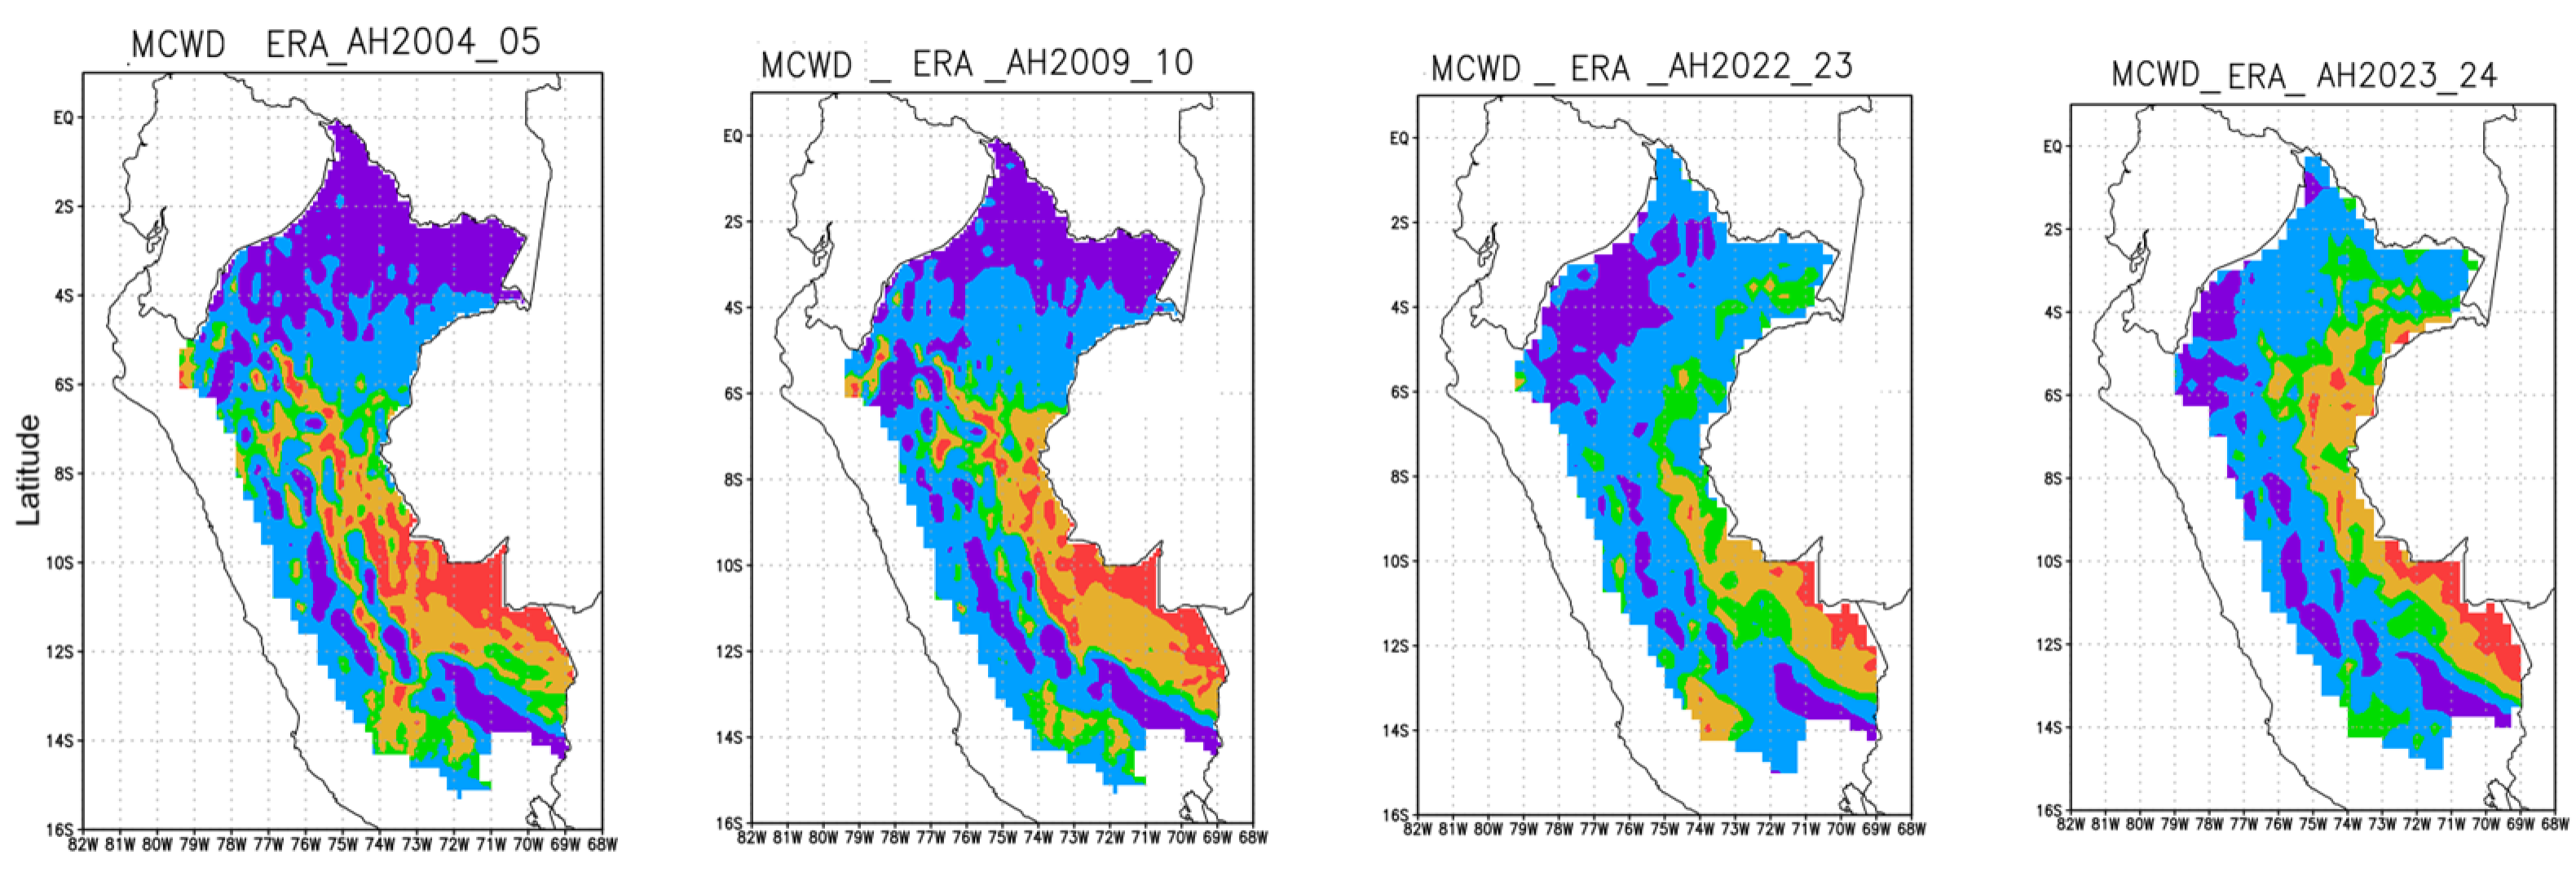
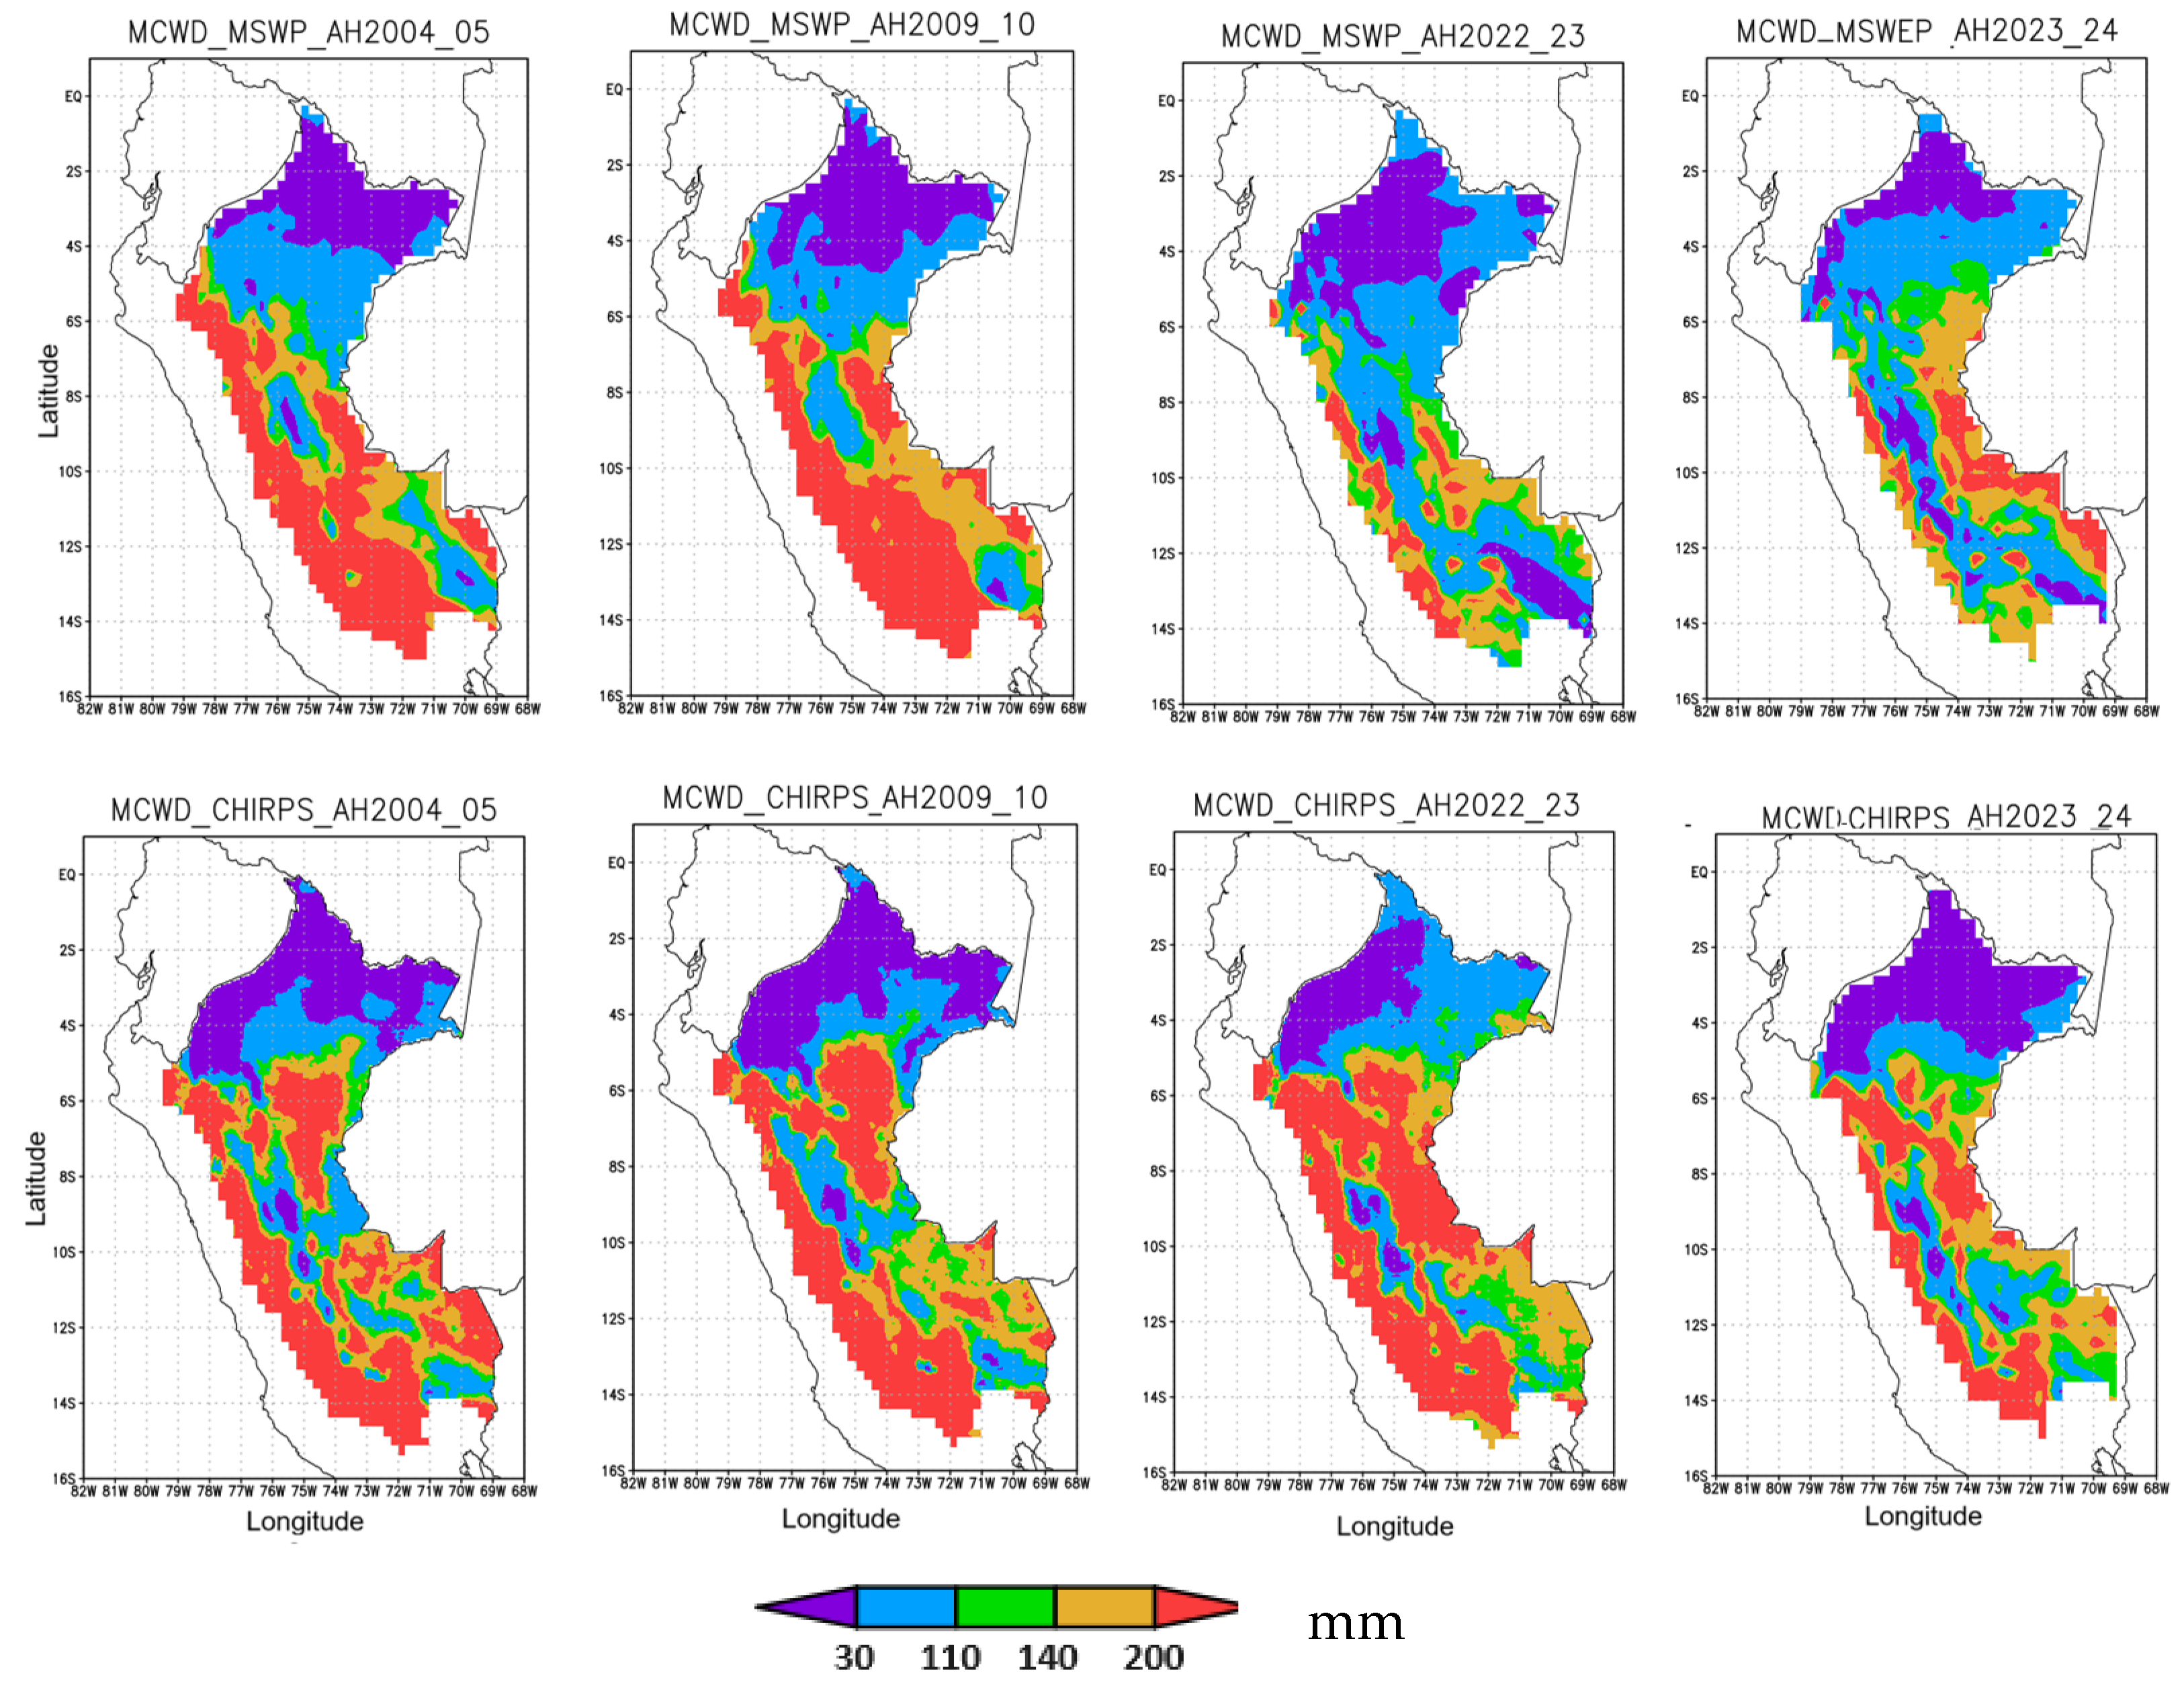
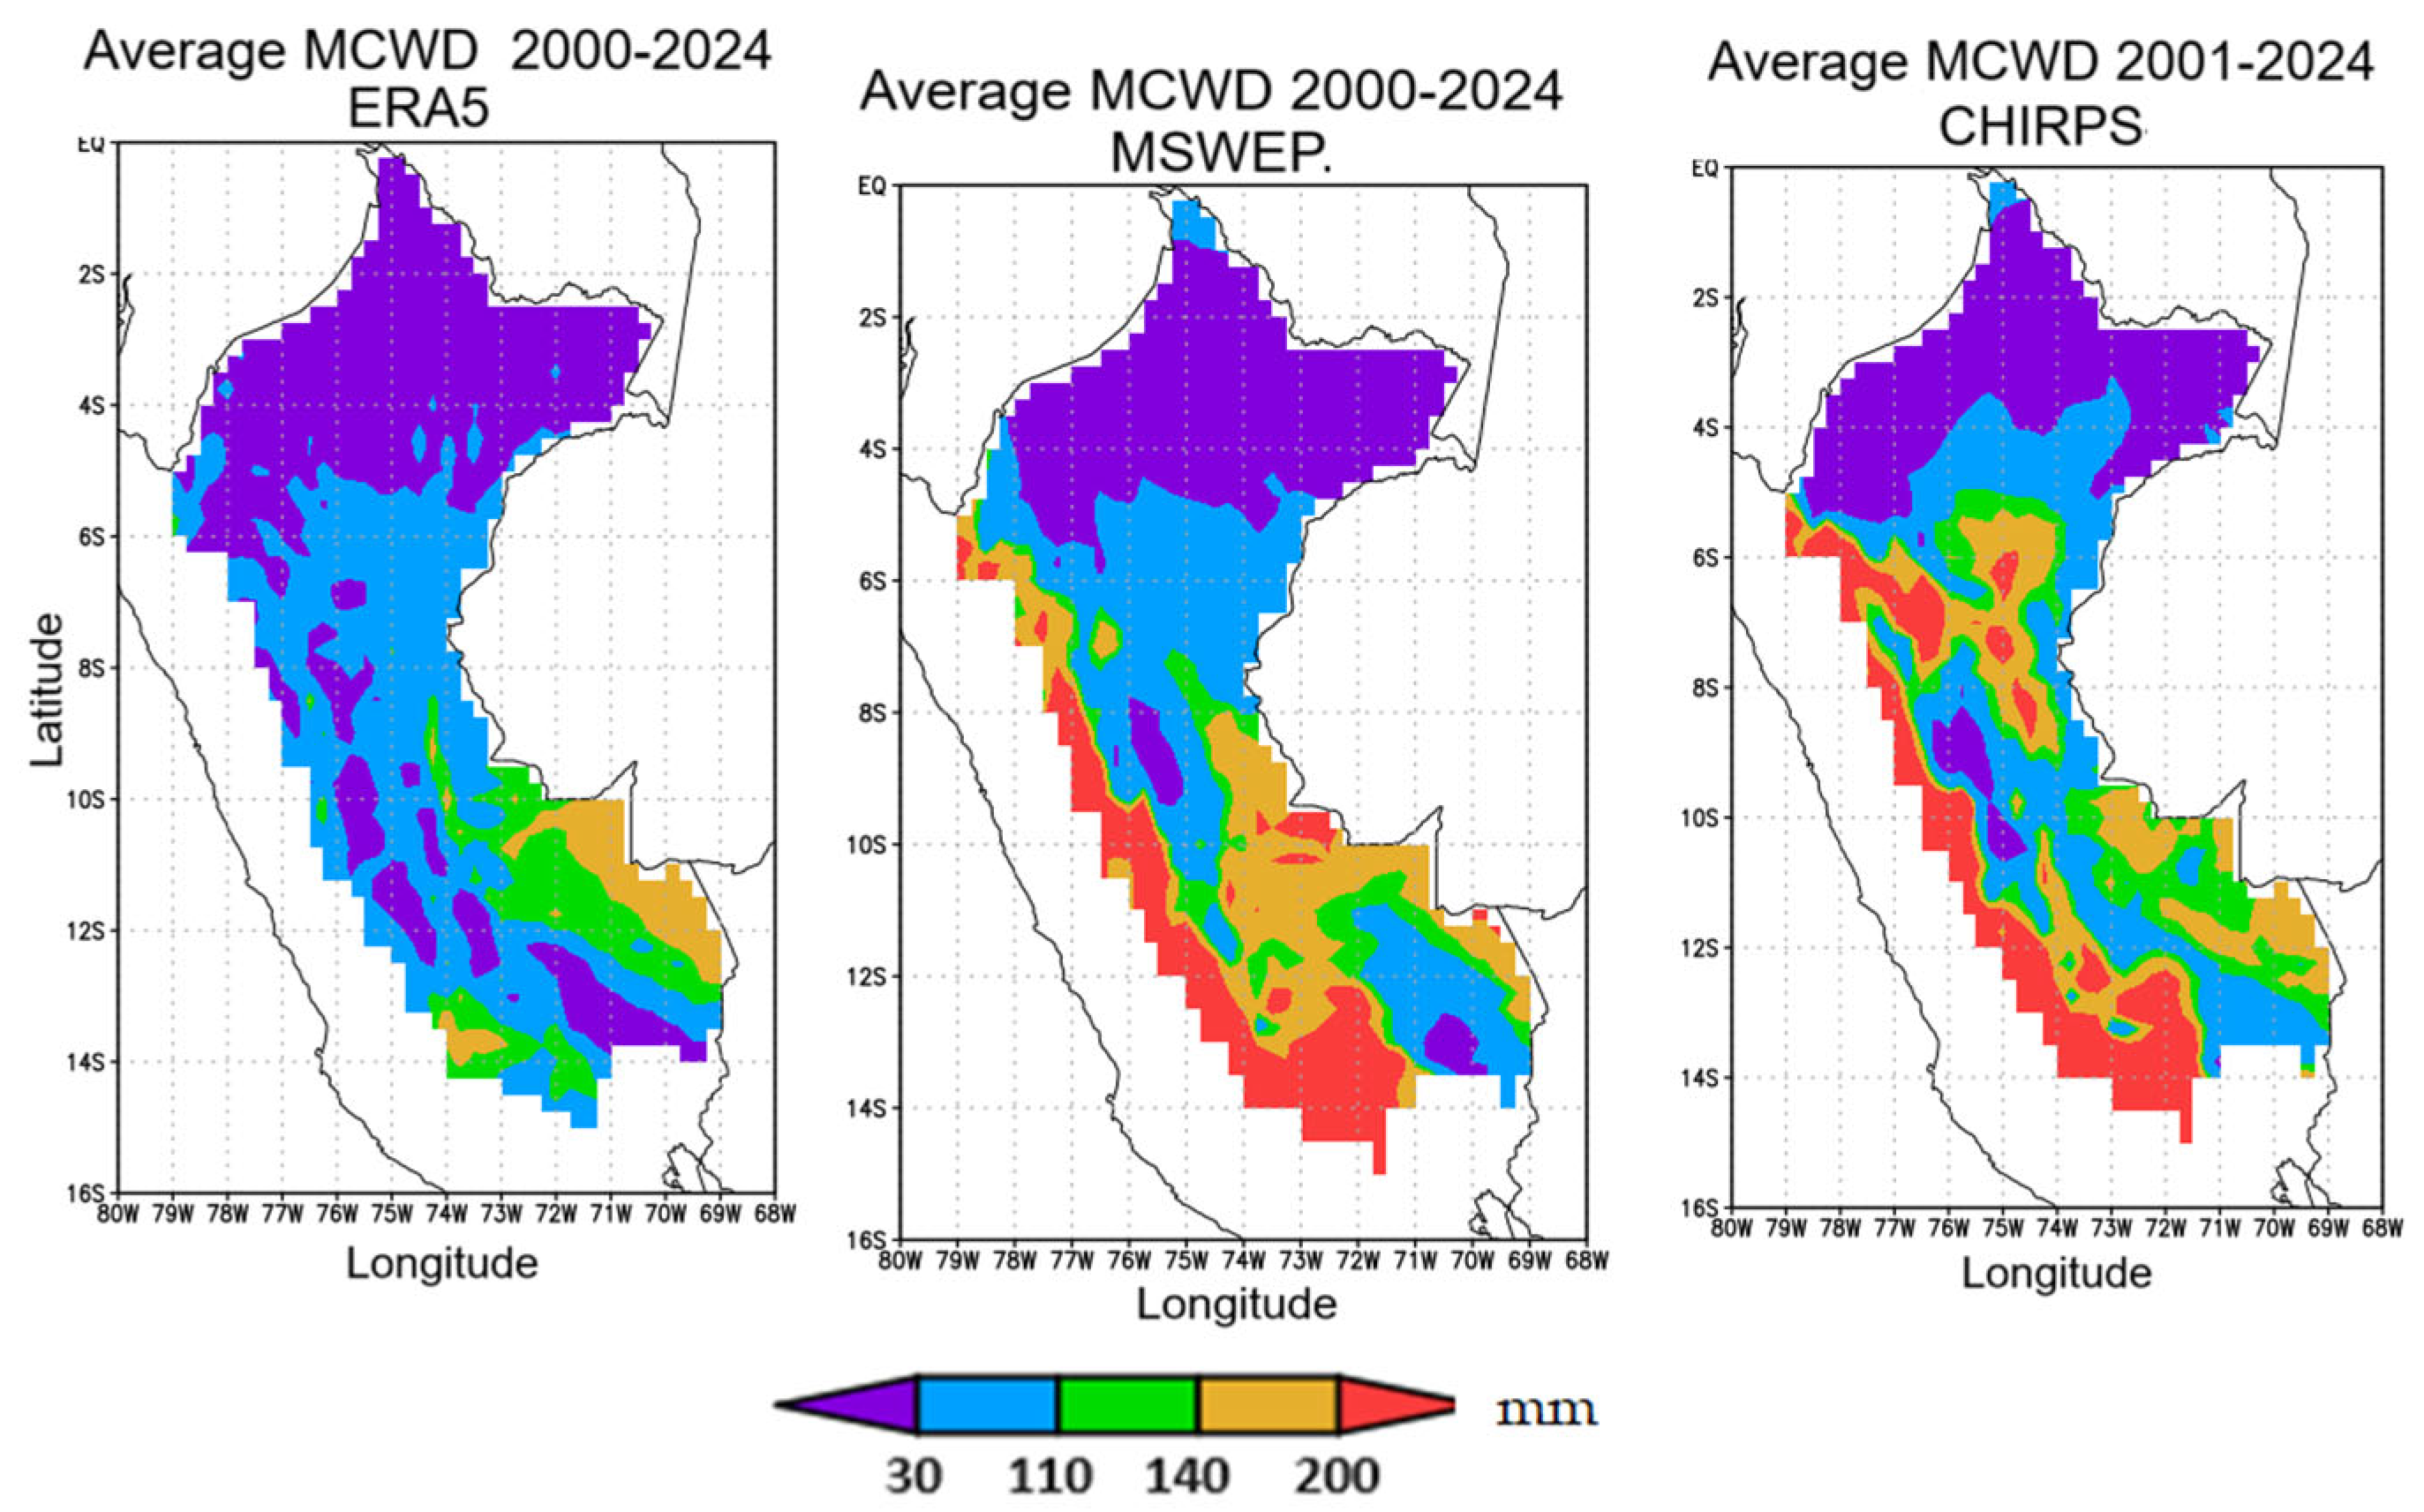
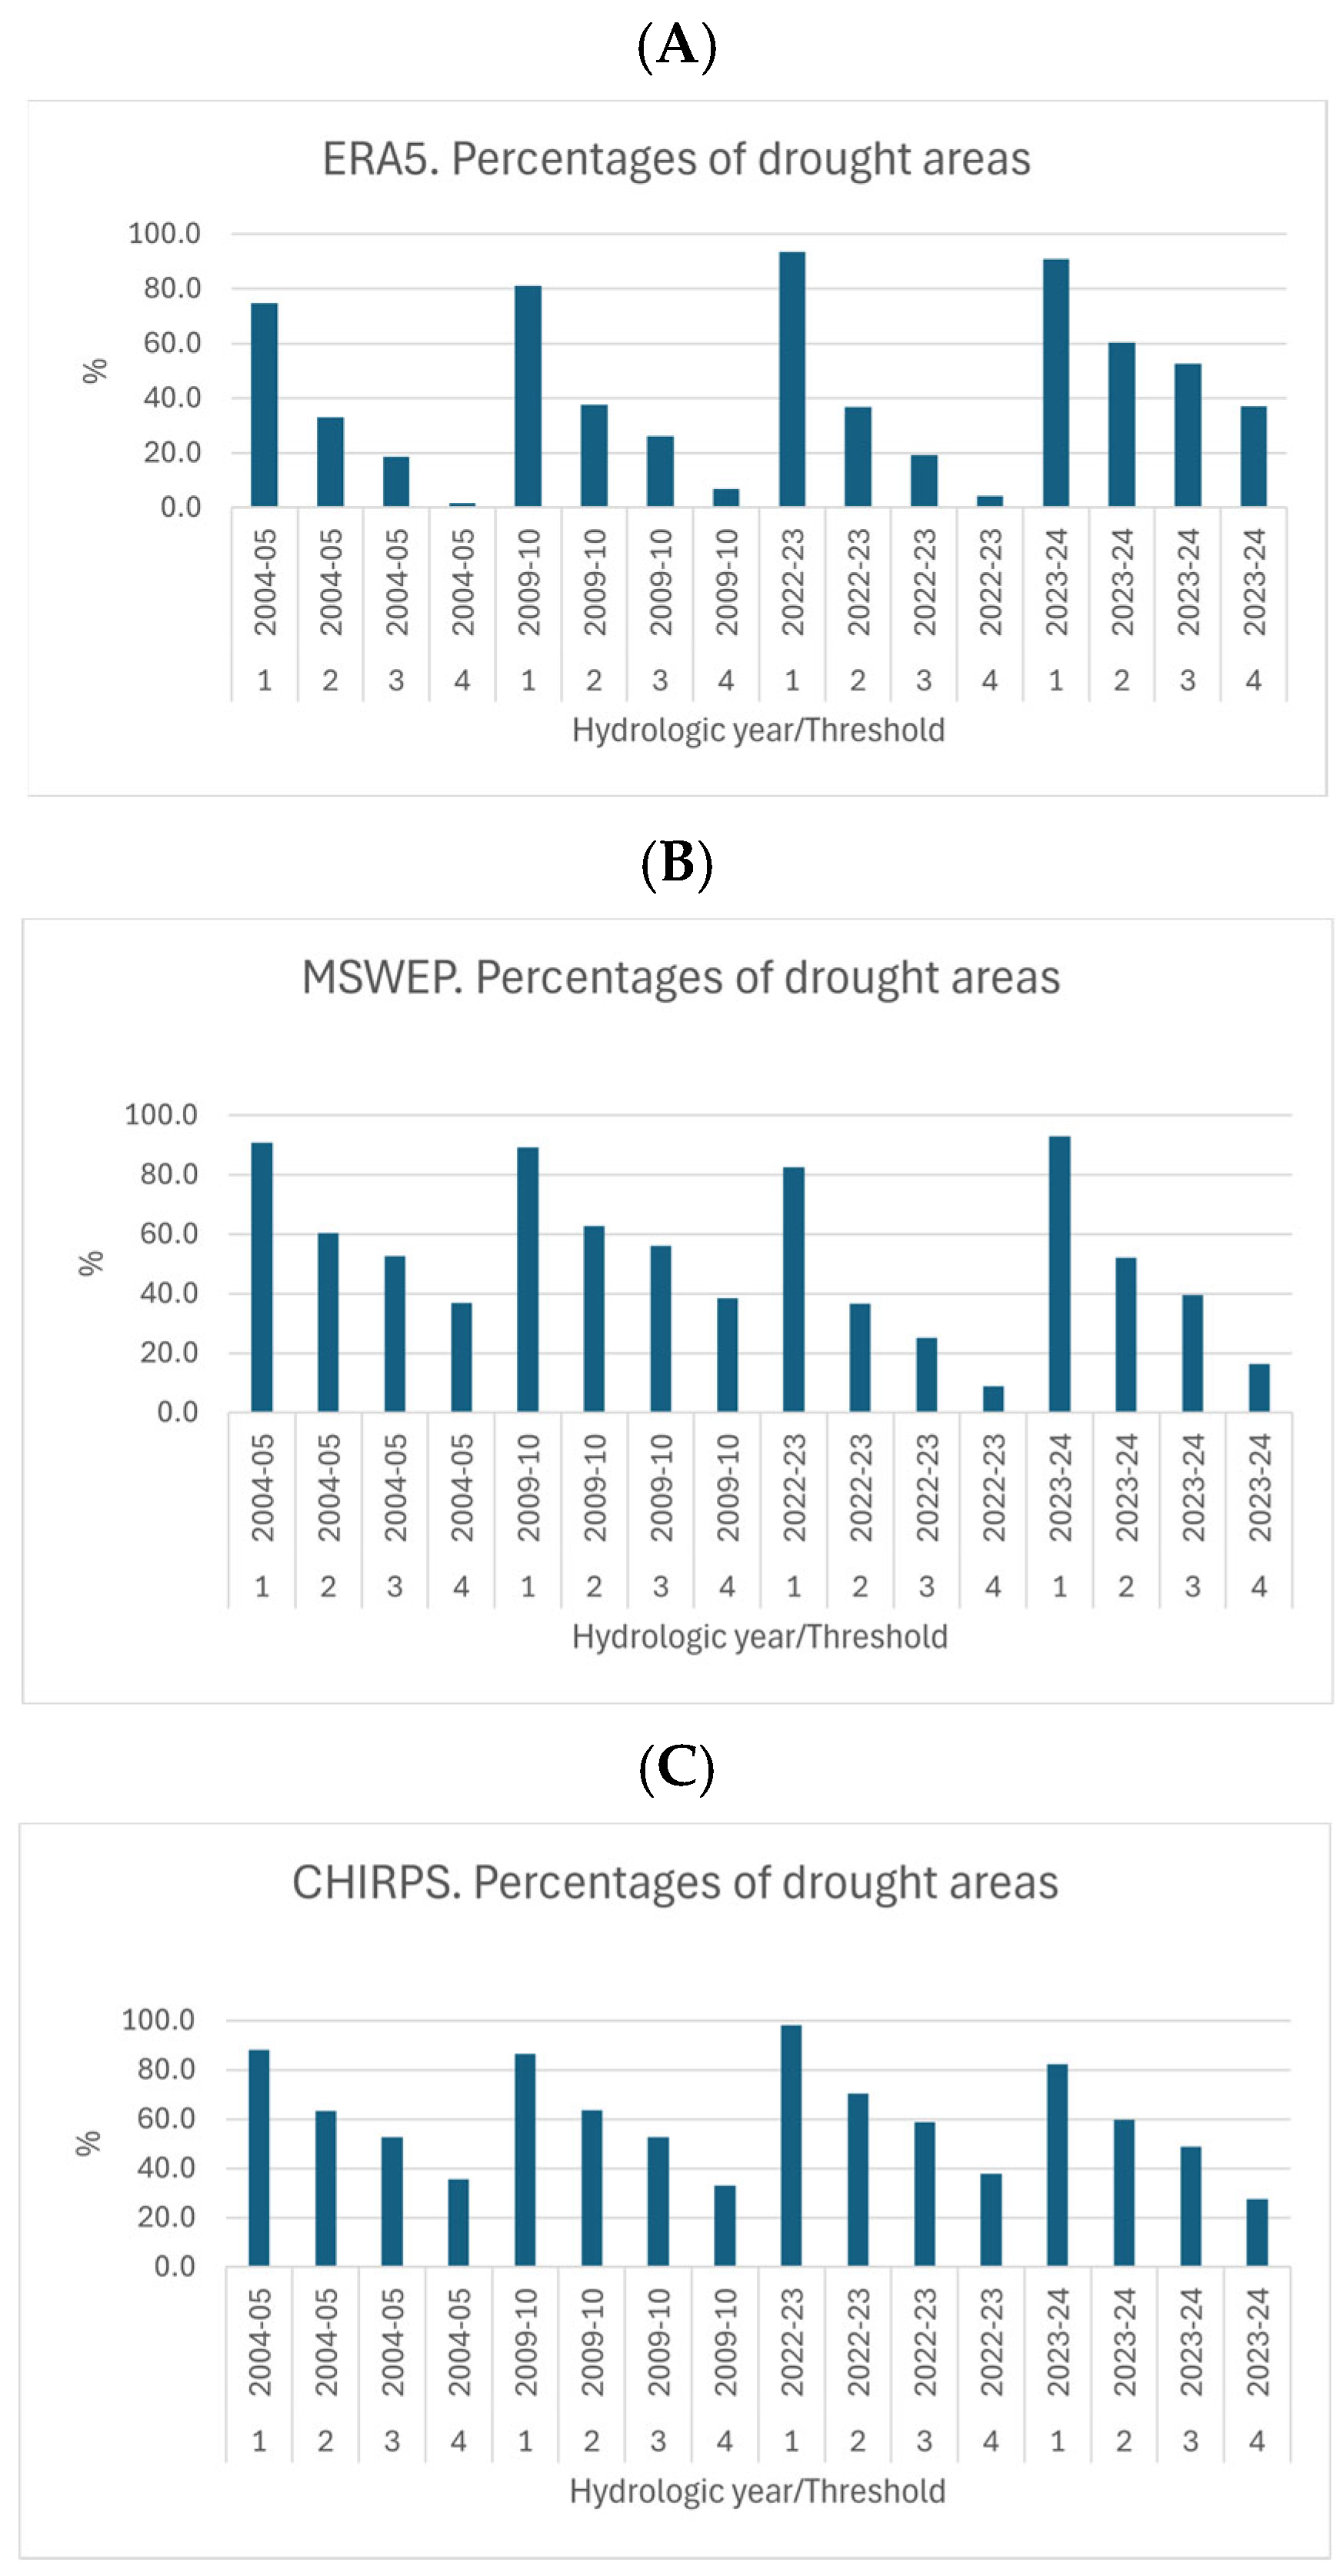
3.3. Spatial Distribution of Drought Regions
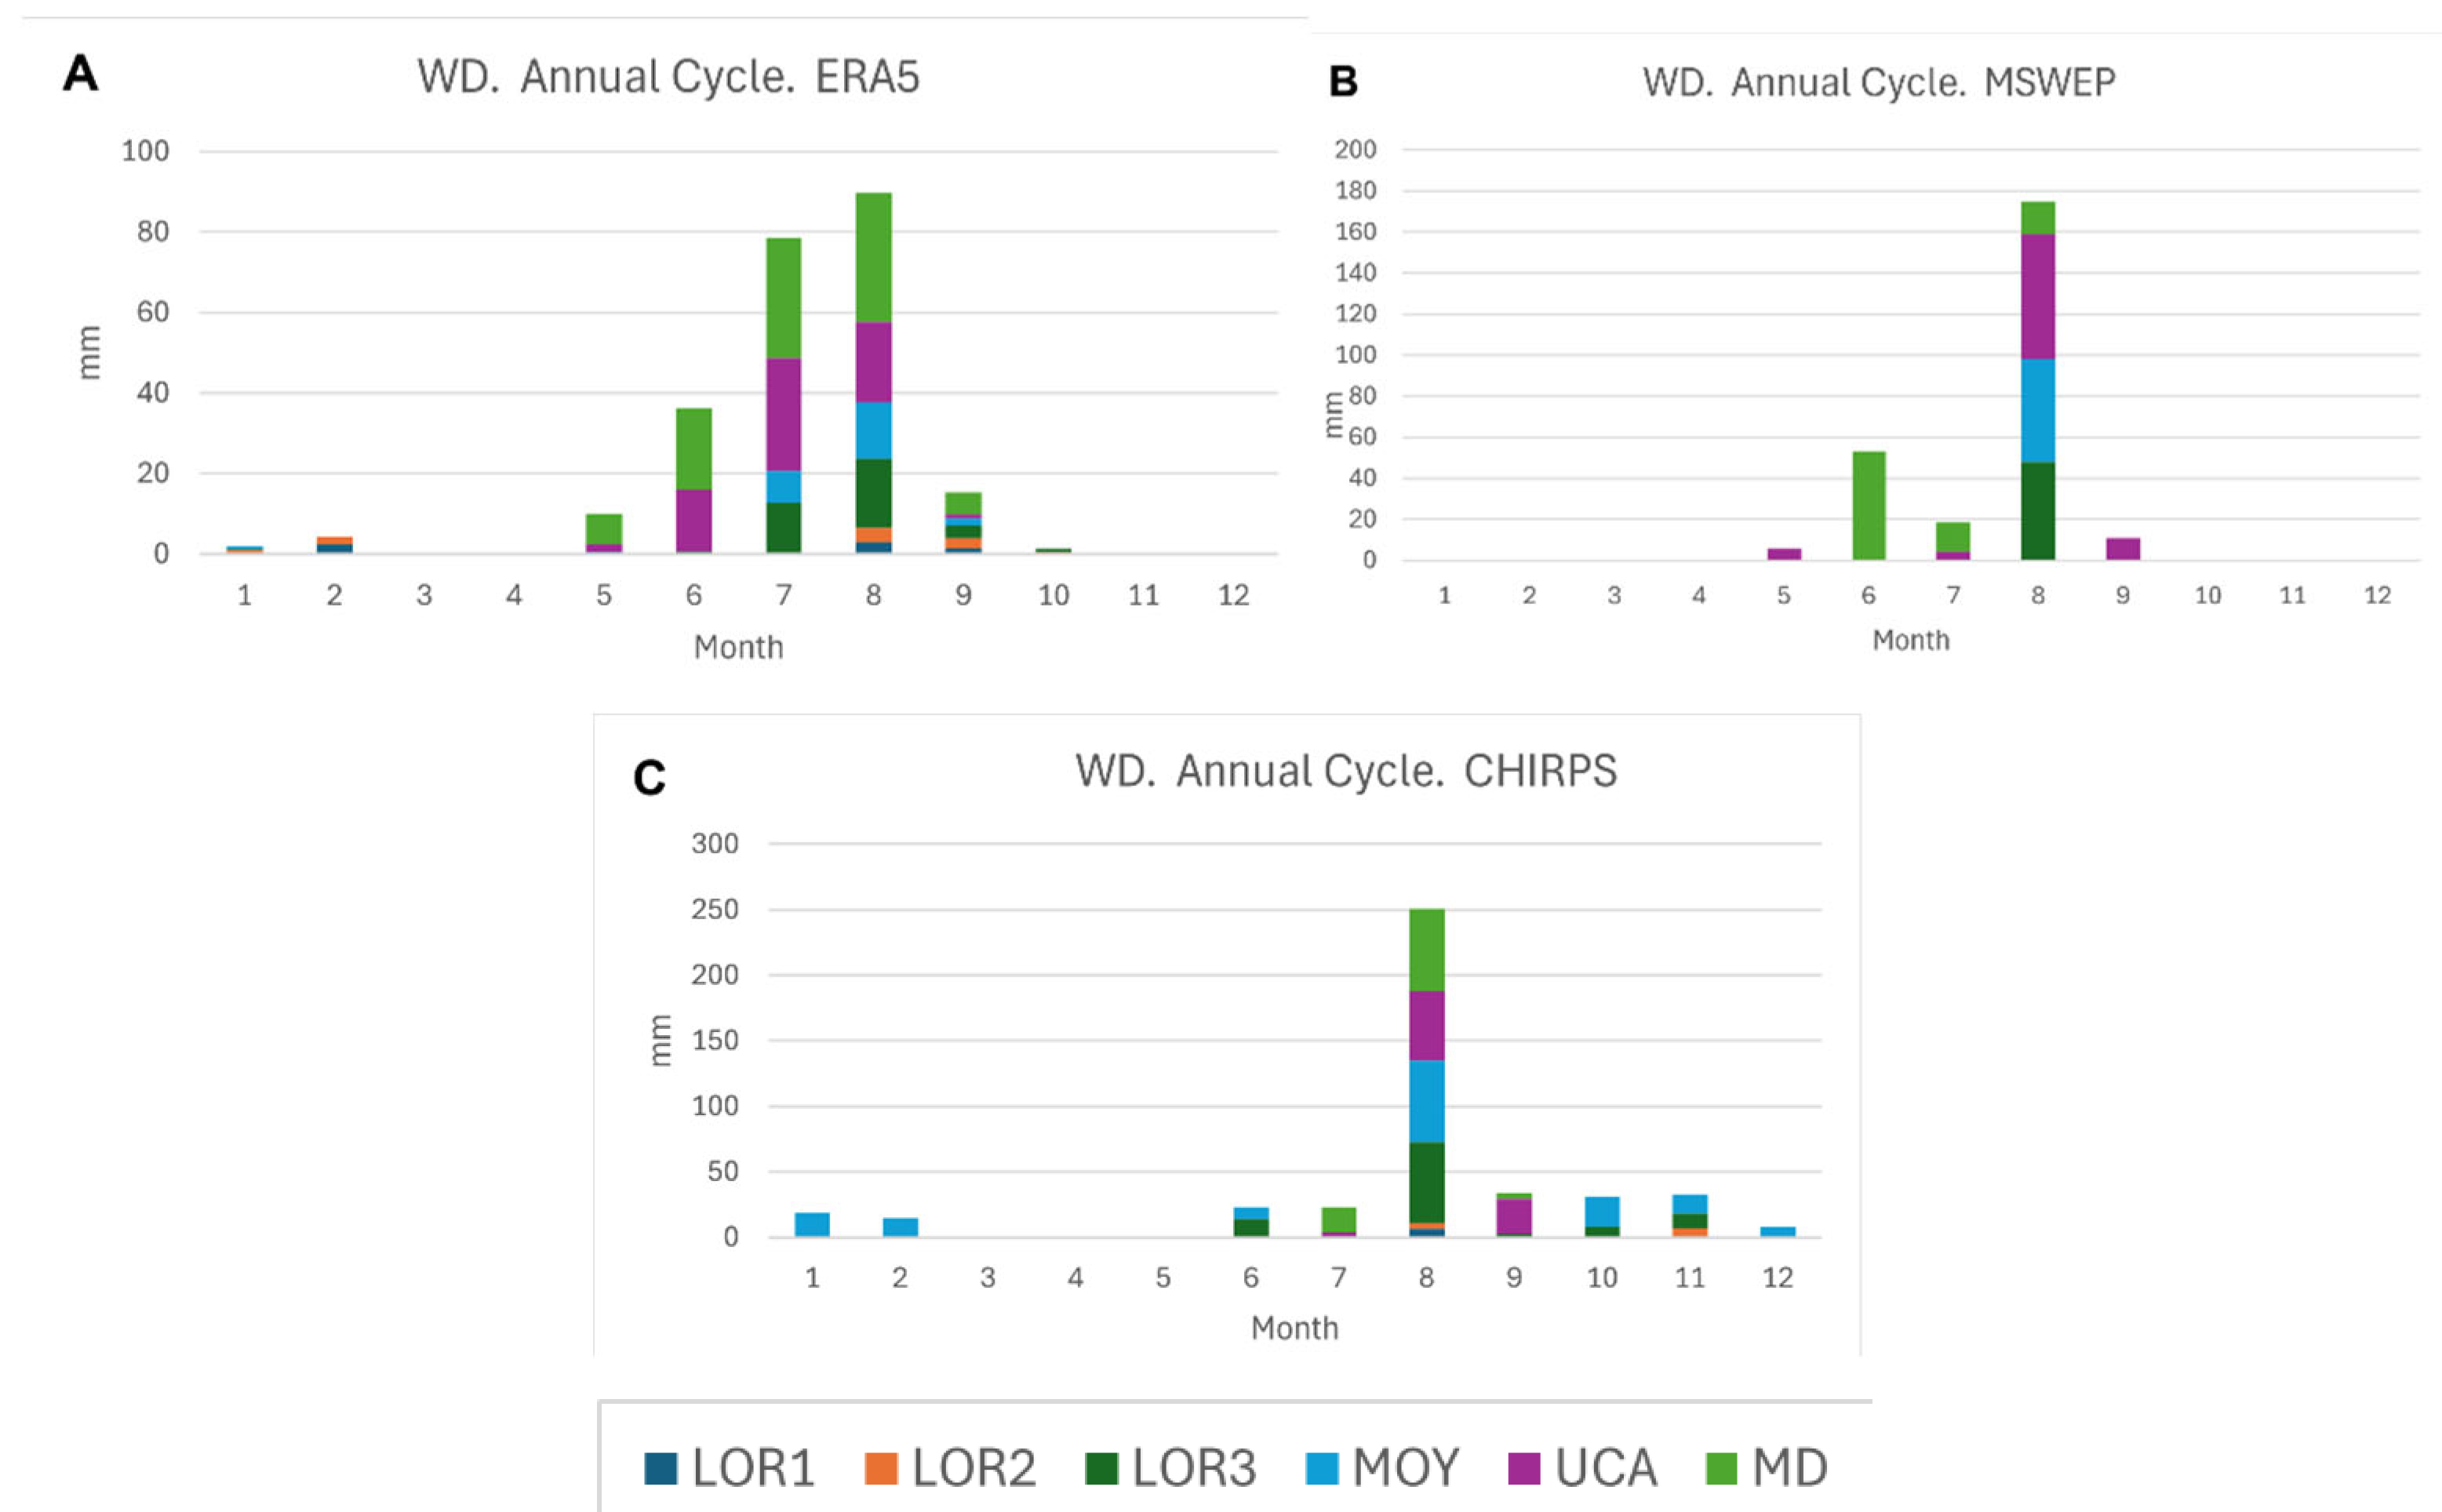
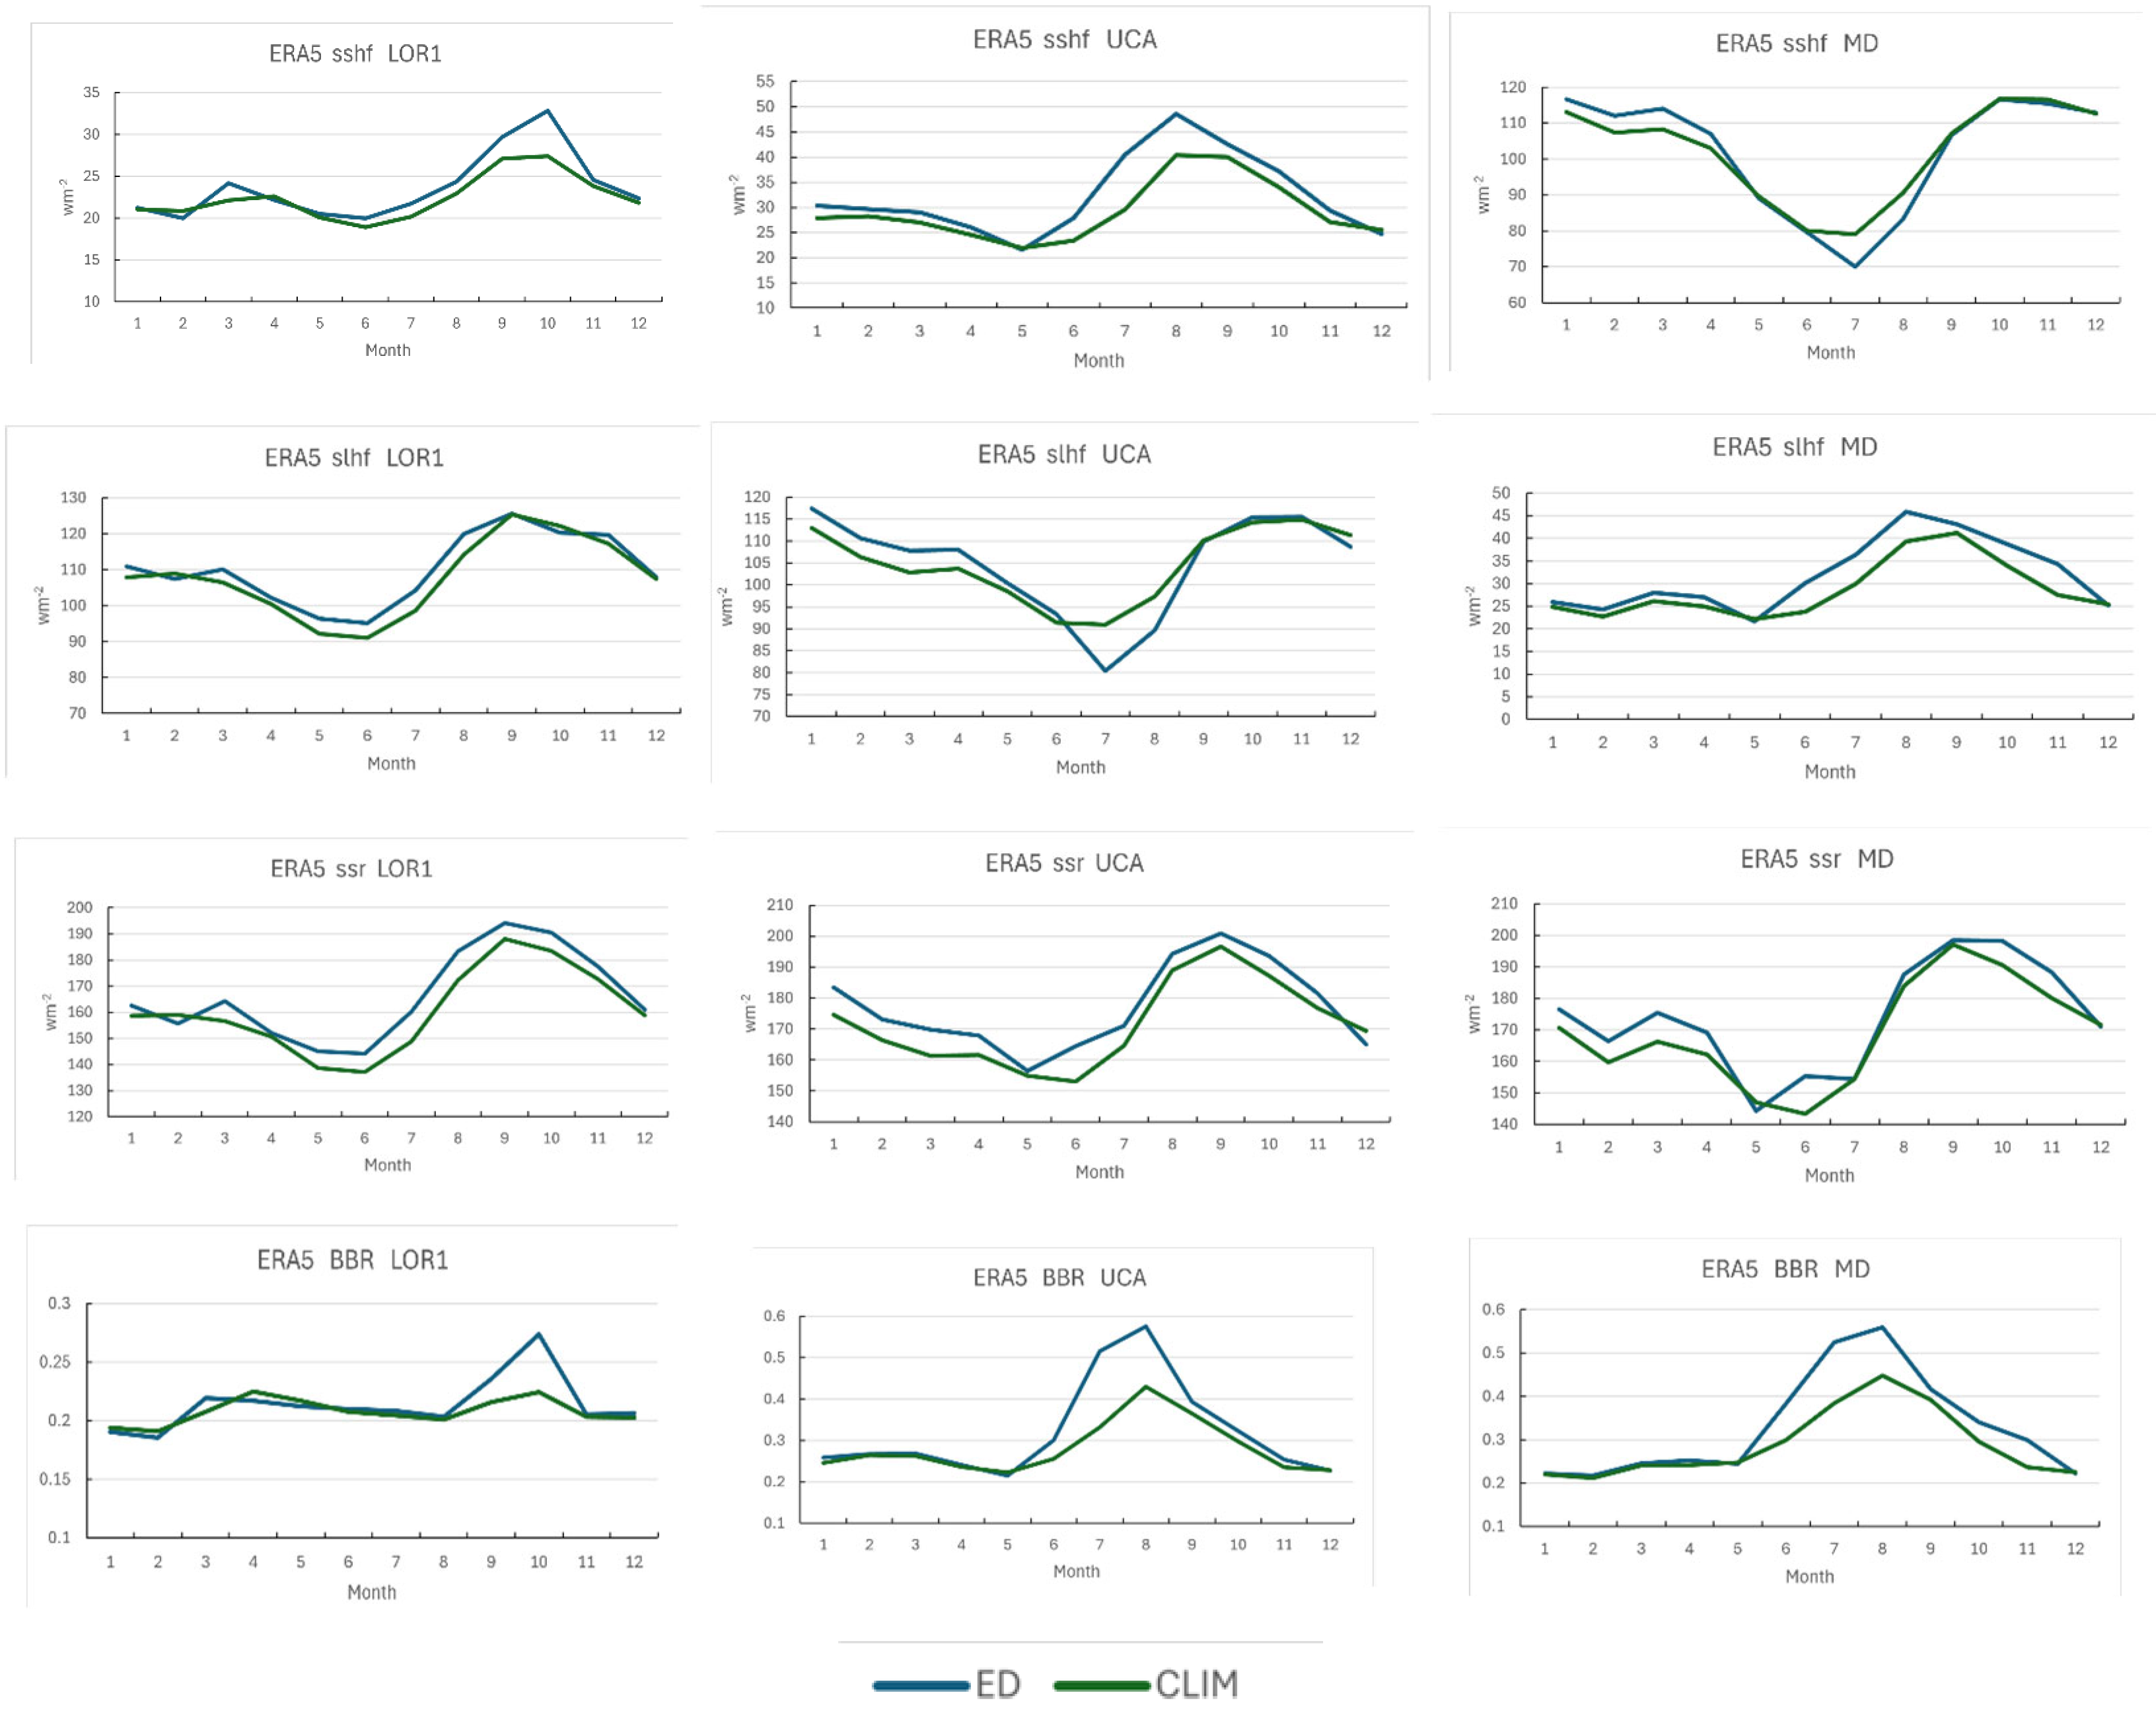
3.4. Annual Cycles of Energy Fluxes According to ERA5 in Extreme Drought Conditions in the Peruvian Amazon
4. Discussion
5. Summary and Conclusions
Author Contributions
Funding
Data Availability Statement
Acknowledgments
Conflicts of Interest
Abbreviations
| WD | Water deficit |
| CWD | Cumulative water deficit |
| MCWD | Maximum cumulative water deficit |
| H | Heaviside step function |
| Pr | Precipitation |
| Et | Evapotranspiration |
| HY | Hydrologic year |
| ERA5 | Fifth generation reanalysis of the ECMWF |
| ECMWF | European Centre for Medium-range Weather Forecasts |
| CHIRPS | Climate hazards group infrared precipitation with station data |
| MSWEP | Multi-source weighted-ensemble precipitation |
| ITCZ | Inter-tropical convergence zone |
| SPEI | Standardizes Precipitation and Evapotranspiration Index |
| SENAMHI | Servicio Nacional de Meteorología e Hidrología del Perú |
| PISCO | Peruvian Interpolated data of the SENAMHI’s Climatological and hydrological Observations |
| GPM | Global precipitation mission |
| IMERG | Integrated multi-satellite retrievals of the GPM |
| LOR1 | Study area in the northeast of the Loreto department |
| LOR2 | Study area in the northwest of the Loreto department |
| LOR3 | Study area in the south of the Loreto department |
| MOY | Study area in the Andes–Amazon transition region centered in Moyobamba city |
| UCA | Study area in the Ucayali department, in the central–southern part of the Peruvian Amazon region |
| MD | Study area in the Madre de Dios department in the southern part of the Peruvian Amazon region |
| ED | Extreme drought |
| CLIM | Climatology |
References
- Papastefanou, P.; Zang, C.S.; Angelov, Z.; de Castro, A.A.; Jimenez, J.C.; De Rezende, L.F.C.; Ruscica, R.C.; Sakschewski, B.; Sörensson, A.A.; Thonicke, K.; et al. Recent extreme drought events in the Amazon rainforest: Assessment of different precipitation and evapotranspiration datasets and drought indicators. Biogeosciences 2022, 19, 3843–3861. [Google Scholar] [CrossRef]
- Espinoza, J.C.; Jimenez, J.C.; Marengo, J.A.; Schongart, J.; Ronchail, J.; Lavado-Casimiro, W.; Ribeiro, J.M. The new record of drought and warmth in the Amazon in 2023 related to regional and global climatic features. Sci. Rep. 2024, 14, 8107. [Google Scholar] [CrossRef] [PubMed]
- Marengo, J.; Cunha, A.; Espinoza, J.; Fu, R.; Schöngart, J.; Jimenez, J.; Costa, M.; Ribeiro, J.; Wongchuig, S.; Zhao, S. The Drought of Amazonia in 2023–2024. Am. J. Clim. Change 2024, 13, 567–597. [Google Scholar] [CrossRef]
- Nobre, C.A.; Sampaio, G.; Borma, L.S.; Cardoso, M.; Silva, J.S.; Cardoso, M. Land-use and climate change risks in the Amazon and the need of a novel sustainable development paradigm. Proc. Natl. Acad. Sci. USA 2016, 113, 10759–10768. [Google Scholar] [CrossRef]
- Galaz, V.; Meacham, M. (Eds.) Redirecting Flows—Navigating the Future of the Amazon; Report; Stockholm Resilience Centre, Stockholm University: Stockholm, Sweden, 2024. [Google Scholar] [CrossRef]
- Brienen, R.J.; Phillips, O.L.; Feldpausch, T.R.; Gloor, E.; Baker, T.R.; Lloyd, J.; Lopez-Gonzalez, G.; Monteagudo-Mendoza, A.; Malhi, Y.; Lewis, S.L.; et al. Long-term decline of the Amazon carbon sink. Nature 2015, 519, 344–348. [Google Scholar] [CrossRef]
- Hubau, W.; Lewis, S.L.; Phillips, O.L.; Affum-Baffoe, K.; Beeckman, H.; Cuní-Sanchez, A.; Daniels, A.K.; Ewango, C.E.; Fauset, S.; Mukinzi, J.M.; et al. Asynchronous carbon sink saturation in African and Amazonian tropical forests. Nature 2020, 579, 80–87. [Google Scholar] [CrossRef]
- Papastefanou, P.; Pugh, T.A.M.; Buras, A.; Fleischer, K.; Grams, T.E.E.; Hickler, T.; Lapola, D.M.; Liu, D.; Zang, C.; Rammig, A. Simulated sensitivity of the Amazon rainforest to extreme drought. Environ. Res. Lett. 2024, 19, 124072. [Google Scholar] [CrossRef]
- Marengo, J.A.; Espinoza, J.C. Extreme Seasonal Droughts and Floods in Amazonia: Causes, Trends and Impacts. Int. J. Climatol. 2016, 36, 1033–1055. [Google Scholar] [CrossRef]
- Aragão, L.E.; Anderson, L.O.; Fonseca, M.G.; Rosan, T.M.; Vedovato, L.B.; Wagner, F.H.; Silva, C.V.; Silva Junior, C.H.; Arai, E.; Aguiar, A.P.; et al. 21st Century Drought-Related Fires Counteract the De-cline of Amazon Deforestation Carbon Emissions. Nat. Commun. 2018, 9, 536. [Google Scholar] [CrossRef]
- Jiménez, J.-C.; Marengo, J.A.; Alves, L.M.; Sulca, J.C.; Takahashi, K.; Ferrett, S.; Collins, M. The role of ENSO flavours and TNA on recent droughts over Amazon forests and the Northeast Brazil region. Int. J. Climatol. 2019, 41, 3761–3780. [Google Scholar] [CrossRef]
- Zeng, N.; Yoon, J.H.; Marengo, J.A.; Subramaniam, A.; Nobre, C.A.; Mariotti, A.; Neelin, D. Causes and Impact of the 2005 Amazon Drought. Environ. Res. Lett. 2008, 3, 014002. [Google Scholar] [CrossRef]
- Espinoza, J.-C.; Ronchail, J.; Guyot, J.L.; Junquas, C.; Vauchel, P.; Lavado, W.S.; Drapeau, G.; Pombosa, R. Climate variability and extremes drought in the upper Solimões River (Western Amazon Basin): Understanding the exceptional 2010 drought. Geophys. Res. Lett. 2011, 38, L13406. [Google Scholar] [CrossRef]
- Marengo, J.A.; Tomasella, J.; Alves, L.M.; Soares, W.R.; Rodriguez, D.A. The drought of 2010 in the context of historical droughts in the Amazon region: DROUGHT AMAZON 2010. Geophys. Res. Lett. 2011, 38, L12703. [Google Scholar] [CrossRef]
- Jiménez, J.-C.; Barichivich, J.; Mattar, C.; Takahashi, K.; Santamarıa-Artigas, A.; Sobrino, J.A.; Malhi, Y. Spatio-temporal patterns of thermal anomalies and drought over tropical forests driven by recent extreme climatic anomalies. Phil. Trans. R. Soc. B 2018, 373, 20170300. [Google Scholar] [CrossRef]
- Gutierrez, R.A.; Espinoza, J.-C.; Lavado, W.; Junquas, C.; Molina-Carpio, J.; Condom, T.; Marengo, J.A. The 2022–23 drought in the South American Altiplano: ENSO effects on moisture flux in the western Amazon during the pre-wet season. Weather Clim. Extrem. 2024, 45, 100710. [Google Scholar] [CrossRef]
- Milla, P.; Espinoza, J.C.; Gutierrez, R.; Molina-Carpio, J.; Ronchail, J.; Espinoza-Romero, D.; Junquas, C. Recent changes in the dry-to-wet transition season in the Andean Altiplano and related atmospheric circulation patterns (1981–2022). Clim. Dyn. 2025, 63, 87. [Google Scholar] [CrossRef]
- Jiang, N.; Zhu, C.; Hu, Z.Z.; McPhaden, M.J.; Chen, D.; Liu, B.; Ma, S.; Yan, Y.; Zhou, T.; Qian, W.; et al. Enhanced risk of record-breaking regional temperatures during the 2023–24 El Niño. Sci. Rep. 2024, 14, 2521. [Google Scholar] [CrossRef]
- Doblas-Reyes, F.J.; Sorensson, A.A.; Almazroui, M.; Dosio, A.; Gutowski, W.J.; Haarsma, R.; Hamdi, R.; Hewitson, B.; Kwon, W.-T.; Lamptey, B.L.; et al. Linking global to regional climate change. In Climate Change 2021: The Physical Science Basis, Contribution of Working Group I to the Sixth Assessment Report of the Intergovernmental Panel on Climate Change; Masson-Delmotte, V., Zhai, P., Pirani, A., Connors, S.L., Pean, C., Berger, S., Caud, N., Chen, Y., Goldfarb, L., Gomis, M.I., et al., Eds.; Cambridge University Press: Cambridge, UK; New York, NY, USA, 2021; pp. 1363–1512. [Google Scholar] [CrossRef]
- Parsons, L.A.; Brennan, M.K.; Wills, R.C.J.; Proistosescu, C. Magnitudes and spatial patterns of interdecadal temperature variability in CMIP6. Geophys. Res. Lett. 2020, 47, e2019GL086588. [Google Scholar] [CrossRef]
- Agudelo, J.; Espinoza, J.C.; Junquas, C.; Arias, P.A.; Sierra, J.P.; Olmo, M.E. Future projections of low-level atmospheric circulation patterns over South Tropical South America: Impacts on precipitation and Amazon dry season length. J. Geophys. Res. Atmos. 2023, 128, e2023JD038658. [Google Scholar] [CrossRef]
- Clarke, B.; Barnes, C.; Rodrigues, R.; Zachariah, M.; Stewart, S.; Raju, E.; Baumgart, N.D.; Libonati, R.; Santos, D.; Albuquerque, R.; et al. Climate Change, Not El Niño, Main Driver of Exceptional Drought in Highly Vulnerable Amazon River Basin. 2024. Available online: https://spiral.imperial.ac.uk/entities/publication/a26f2f67-2670-4fc4-a435-57419ee3d00e (accessed on 15 March 2025).
- Jiménez-Muñoz, J.C.; Mattar, C.; Barichivich, J.; Santamaría- Artigas, A.; Takahashi, K.; Malhi, Y.; Sobrino, J.A.; van der Schrier, G. Record-breaking warming and extreme drought in the Amazon rainforest during the course of El Niño 2015–2016. Sci. Rep. 2016, 6, 33130. [Google Scholar] [CrossRef]
- Marengo, J.A.; Nobre, C.A.; Tomasella, J.; Oyama, M.D.; Sampaio de Oliveira, G.; de Oliveira, R.; Camargo, H.; Alves, L.M.; Brown, I.F. The Drought of Amazonia in 2005. J. Clim. 2008, 21, 495–516. [Google Scholar] [CrossRef]
- Espinoza, J.C.; Arias, P.A.; Moron, V.; Junquas, C.; Segura, H.; Sierra-Perez, J.; Wongchuig, S.; Condom, T. Recent changes in the atmospheric circulation patterns during the dry-to-wet transition season in south tropical South America (1979–2020). Impacts on precipitation and fire season. J. Clim. 2021, 34, 9025–9042. [Google Scholar] [CrossRef]
- Aragão, L.E.O.C.; Malhi, Y.; Roman-Cuesta, R.M.; Saatchi, S.; Anderson, L.O.; Shimabukuro, Y.E. Spatial patterns and fire response of recent Amazonian droughts. Geophys. Res. Lett. 2007, 34, L07701. [Google Scholar] [CrossRef]
- Malhi, Y.; Roberts, T.; Betts, R.A.; Killeen, T.J. Climate Change, Deforestation, and the Fate of the Amazon. Science 2008, 319, 169. [Google Scholar] [CrossRef]
- Marengo, J.A., Jr.; Souza, C.; Thonicke, K.; Burton, C.; Halladay, K.; Betts, R.A.; Alves, L.M.; Soares, W.R. Changes in Climate and Land Use Over the Amazon Region: Current and Future Variability and Trends. Front. Earth Sci. 2018, 6, 228. [Google Scholar] [CrossRef]
- Jiménez, J.C.; Miranda, V.; Trigo, I.; Libonati, R.; Albuquerque, R.; Peres, L.F.; Espinoza, J.C.; Marengo, J.A. Vegetation Warming and Greenness Decline across Amazonia during the Extreme Drought of 2023. Remote Sens. 2024, 16, 2519. [Google Scholar] [CrossRef]
- Malhi, Y.; Aragao, L.E.O.C.; Galbraith, D.; Huntingford, C.; Fisher, R.; Zelazowski, P.; Sitch, S.; McSweeney, C. Exploring the likelihood and mechanism of a climate-change-induced dieback of the Amazon forest. Proc. Natl. Acad. Sci. USA 2009, 106, 20610–20615. [Google Scholar] [CrossRef]
- Lewis, S.L.; Brando, P.M.; Phillips, O.L.; van der Heijden, G.M.F.; Nepsta, D. The 2010 Amazon Drought. Science 2011, 331, 554. [Google Scholar] [CrossRef]
- Phillips, O.L.; Aragão, L.E.O.C.; Lewis, S.L.; Fisher, J.B.; Lloyd, J.; López-González, G.; Malhi, Y.; Monteagudo, A.; Peacock, J.; Quesada, C.A.; et al. Drought Sensitivity of the Amazon Rainforest. Science 2009, 323, 1344–1347. [Google Scholar] [CrossRef] [PubMed]
- Brando, P.M.; Balch, J.K.; Nepstad, D.C.; Morton, D.C.; Putz, F.E.; Coe, M.T.; Silvério, D.; Macedo, M.N.; Davidson, E.A.; Nóbrega, C.C.; et al. Abrupt increases in Amazonian tree mortality due to drought–fire interactions. Proc. Natl. Acad. Sci. USA 2014, 111, 6347–6352. [Google Scholar] [CrossRef]
- Espinoza, J.C.; Ronchail, J.; Guyot, J.L.; Cochonneau, G.; Naziano, F.; Lavado, W.; De Oliveira, E.; Pombosa, R.; Vauchel, P. Spatio-temporal rainfall variability in the Amazon basin countries (Brazil, Peru, Bolivia, Colombia, and Ecuador). Int. J. Climatol. 2009, 29, 1574–1594. [Google Scholar] [CrossRef]
- Sulca, J.; Apaéstegui, J.; Tacza, J. New insights into the biennial-to-multidecadal variability of the water level fluctuation in Lake Titicaca in the 20th century. Front. Clim. 2024, 5, 1325224. [Google Scholar] [CrossRef]
- Bell, B.; Hersbach, H.; Simmons, A.; Berrisford, P.; Dahlgren, P.; Horányi, A.; Muñoz-Sabater, J.; Nicolas, J.; Radu, R.; Schepers, D.; et al. The ERA5 global reanalysis: Preliminary extension to 1950. Q. J. R. Meteorol. Soc. 2021, 147, 4186–4227. [Google Scholar] [CrossRef]
- Hersbach, H.; Bell, B.; Berrisford, P.; Hirahara, S.; Horányi, A.; Muñoz-Sabater, J.; Nicolas, J.; Peubey, C.; Radu, R.; Schepers, D.; et al. The ERA5 global reanalysis. Q. J. R. Meteorol. Soc. 2020, 146, 1999–2049. [Google Scholar] [CrossRef]
- Aybar, C.; Fernández, C.; Huerta, A.; Lavado, W.; Vega, F.; Felipe-Obando, O. Construction of a high-resolution gridded rainfall dataset for Peru from 1981 to present day. Hydrol. Sci. J. 2020, 65, 770–785. [Google Scholar] [CrossRef]
- Huerta, A.; Lavado-Casimiro, W.; Obando, F.O. High-resolution gridded hourly precipitation dataset for Peru (PISCOp_h). Data Brief. 2022, 45, 108570. [Google Scholar] [CrossRef]
- Huffman, G.J.; Stocker, E.F.; Bolvin, D.T.; Nelkin, E.J.; Tan, J. GPM IMERG Final Precipitation L3 Half Hourly 0.1 Degree × 0.1 Degree V07; Goddard Earth Sciences Data and Information Services Center (GES DISC): Greenbelt, MD, USA, 2024. [Google Scholar] [CrossRef]
- Paccini, L.; Espinoza, J.C.; Ronchail, J.; Segura, H. Intraseasonal rainfall variability in the Amazon basin related to large-scale circulation patterns: A focus on western Amazon-Andes transition region. Int. J. Climatol. 2018, 38, 2386–2399. [Google Scholar] [CrossRef]
- Espinoza, J.C.; Ronchail, J.; Marengo, J.A.; Segura, H. Contrasting North–South changes in Amazon wet-day and dry-day frequency and related atmospheric features (1981–2017). Clim. Dyn. 2019, 52, 5413–5430. [Google Scholar] [CrossRef]
- Gutierrez, R.A.; Junquas, C.; Armijos, E.; Sörensson, A.A.; Espinoza, J.-C. Performance of regional climate model precipitation simulations over the terrain-complex Andes-Amazon transition region. J. Geophys. Res. Atmos. 2024, 129, e2023JD038618. [Google Scholar] [CrossRef]
- Funk, C.; Peterson, P.; Landsfeld, M.; Pedreros, D.; Verdin, J.; Shukla, S.; Husak, G.; Rowland, J.; Harrison, L.; Hoell, A.; et al. The climate hazards infrared precipitation with stations—A new environmental record for monitoring extremes. Sci. Data 2015, 2, 150066. [Google Scholar] [CrossRef]
- Beck, H.E.; van Dijk, A.I.J.M.; Levizzani, V.; Schellekens, J.; Miralles, D.G.; Martens, B.; de Roo, A. MSWEP: 3-hourly 0.25° global gridded precipitation (1979–2015) by merging gauge, satellite, and reanalysis data. Hydrol. Earth Syst. Sci. 2017, 21, 589–615. [Google Scholar] [CrossRef]
- Vega-Viviescas, C.; Rodríguez-S, E.A. Evaluation of reanalysis data in the study of meteorological and hydrological droughts in the Magdalena-Cauca river basin, Colombia. Dyna 2019, 86, 268–277. [Google Scholar] [CrossRef]
- Fernandez-Palomino, C.A.; Hattermann, F.F.; Krysanova, V.; Lobanova, A.; Vega-Jácome, F.; Lavado, W.; Santini, W.; Aybar, C.; Bronstert, A. A Novel High-Resolution Gridded Precipitation Dataset for Peruvian and Ecuadorian Watersheds: Development and Hydrological Evaluation. J. Hydrometeor. 2022, 23, 309–336. [Google Scholar] [CrossRef]
- Baker, J.C.A.; Garcia-Carreras, L.; Gloor, M.; Marsham, J.H.; Buermann, W.; da Rocha, H.R.; Nobre, A.D.; de Araujo, A.C.; Spracklen, D.V. Evapotranspiration in the Amazon: Spatial patterns, seasonality, and recent trends in observations, reanalysis, and climate models. Hydrol. Earth Syst. Sci. 2021, 25, 2279–2300. [Google Scholar] [CrossRef]
- Polasky, A.; Sapkota, V.; Forest, C.E.; Fuentes, J.D. Discrepancies in precipitation trends between observational and reanalysis datasets in the Amazon Basin. Sci. Rep. 2025, 15, 7268. [Google Scholar] [CrossRef] [PubMed]
- Espinoza, J.C.; Chavez, S.; Ronchail, J.; Junquas, C.; Takahashi, K.; Lavado, W. Rainfall hotspots over the southern tropical Andes: Spatial distribution, rainfall intensity, and relations with large-scale atmospheric circulation. Water Resour. Res. 2015, 51, 3459–3475. [Google Scholar] [CrossRef]
- Chavez, S.P.; Takahashi, K. Orographic rainfall hot spots in the Andes-Amazon transition according to the TRMM precipitation radar and in situ data. J. Geophys. Res. Atmos. 2017, 122, 5870–5882. [Google Scholar] [CrossRef]
- Valenzuela, J.; Figueroa, M.; Armijos, E.; Espinoza, J.C.; Wongchuig, S.; Ramirez-Avila, J.J. Flooding risk of cropland areas by repiquetes in the western Amazon basin: A case study of Peruvian Tamshiyacu City. J. Hydrol. Reg. Stud. 2023, 47, 101428. [Google Scholar] [CrossRef]
- Zanin, P.R.; Pareja-Quispe, D.; Espinoza, J.C. Evapotranspiration in the Amazon Basin: Couplings, hydrological memory and water feedback. Agric. For. Meteorol. 2024, 352, 110040. [Google Scholar] [CrossRef]
- Sousa, T.R.; Schietti, J.; Coelho de Souza, F.; Esquivel-Muelbert, A.; Ribeiro, I.O.; Emílio, T.; Pequeno, P.A.C.L.; Phillips, O.; Costa, F.R.C. Palms and trees resist extreme drought in Amazon forests with shallow water tables. J. Ecol. 2020, 108, 2070–2082. [Google Scholar] [CrossRef]
- Hu, X.; Yuan, W. Evaluation of ERA5 precipitation over the eastern periphery of the Tibetan plateau from the perspective of regional rainfall events. Int. J. Climatol. 2021, 41, 2625–2637. [Google Scholar] [CrossRef]
- Ou, T.; Chen, D.; Tang, J.; Lin, C.; Wang, X.; Kukulies, J.; Lai, H. Wet bias of summer precipitation in the northwestern Tibetan Plateau in ERA5 is linked to overestimated lower-level southerly wind over the plateau. Clim. Dyn. 2023, 61, 2139–2153. [Google Scholar] [CrossRef]
- Dinku, T.; Funk, C.; Peterson, P.; Maidment, R.; Tadesse, T.; Gadain, H.; Ceccato, P. Validation of the CHIRPS satellite rainfall estimates over eastern Africa. Q. J. R. Meteorol. Soc. 2018, 144 (Suppl. S1), 292–312. [Google Scholar] [CrossRef]
- Malhi, Y.; Pegoraro, E.; Nobre, A.D.; Pereira, M.G.P.; Grace, J.A.; Culf, D.; Clement, R. Energy and water dynamics of a central Amazonian rain forest. J. Geophys. Res. 2002, 107, 8061. [Google Scholar] [CrossRef]
- Marengo, J.A.; Costa, M.C.; Cunha, A.P.; Espinoza, J.-C.; Jimenez, J.C.; Libonati, R.; Miranda, V.; Trigo, I.F.; Sierra, J.P.; Geirinhas, J.L.; et al. Climatological patterns of heatwaves during winter and spring 2023 and trends for the period 1979–2023 in central South America. Front. Clim. 2025, 7, 1529082. [Google Scholar] [CrossRef]
- Brimelow, J.C.; Hanesiak, J.M.; Burrows, W.R. On the Surface-Convection Feedback during Drought Periods on the Canadian Prairies. Earth Interact. 2011, 15, 1–26. [Google Scholar] [CrossRef]
- Vicente-Serrano, S.M.; Beguería, S.; Lorenzo-Lacruz, J.; Camarero, J.J.; López-Moreno, J.I.; Azorin-Molina, C.; Revuelto, J.; Morán-Tejeda, E.; Sanchez-Lorenzo, A. Performance of Drought Indices for Ecological, Agricultural, and Hydrological Applications. Earth Interact. 2012, 16, 1–27. [Google Scholar] [CrossRef]
- Zang, C.S.; Buras, A.; Esquivel-Muelbert, A.; Jump, A.S.; Rigling, A.; Rammig, A. Standardized drought indices in ecological research: Why one size does not fit all. Glob. Change Biol. 2020, 26, 322–324. [Google Scholar] [CrossRef]
- Zemp, D.C.; Schleussner, C.F.; Barbosa, H.M.J.; Hirota, M.; Montade, V.; Sampaio, G.; Rammig, A. Feedback between drought and deforestation in the Amazon. Environ. Res. Lett. 2017, 12, 054018. [Google Scholar] [CrossRef]
- Anderson, L.; Ribeiro, G.; Cunha, A.P.; Fonseca, M.; Moura, Y.; Silva, R.; Wagner, F.; Aragão, L. Vulnerability of Amazonian forests to repeated droughts. Philos. Trans. R. Soc. B Biol. Sci. 2018, 373, 20170411. [Google Scholar] [CrossRef]
- Staal, A.; van Nes, E.H.; Hantson, S.; Holmgren, M.; Dekker, S.C.; Pueyo, S.; Scheffer, M. Recurrent droughts increase risk of cascading tipping events by outpacing adaptive capacities in the Amazon rainforest. Proc. Natl. Acad. Sci. USA 2022, 119, e2120777119. [Google Scholar] [CrossRef]
- Kursar, T.A.; Wright, S.J.; Radulovich, R. The effects of the rainy season and irrigation on soil water and oxygen in a seasonal forest in Panama. J. Trop. Ecol. 1995, 11, 497–515. [Google Scholar] [CrossRef]
- Uuh-Sonda, J.M.; Figueroa-Espinoza, B.; Gutiérrez-Jurado, H.A.; Méndez-Barroso, L.A. Ecosystem productivity and evapotranspiration dynamics of a seasonally dry tropical forest of the Yucatan Peninsula. J. Geophys. Res. Biogeosci. 2022, 127, e2019JG005629. [Google Scholar] [CrossRef]
- Wolfe, B.T.; Kursar, T.A. Diverse patterns of stored water use among saplings in seasonally dry tropical forests. Oecologia 2015, 179, 925–936. [Google Scholar] [CrossRef]


| Source | URL | Variable | Units |
|---|---|---|---|
| ERA5 | (https://cds.climate.copernicus.eu/datasets/reanalysis-era5-single-levels-monthly-means?tab=download, accessed on 6 February 2025; | Precipitation Pr (total precipitation tp in ERA5) | mm |
| Evapotranspiration Et (Evaporation, e in ERA5) | mm water equivalent | ||
| Surface shortwave radiation downwards (ssrd) | W/m2 | ||
| CHIRPS | https://coastwatch.pfeg.noaa.gov/erddap/griddap/chirps20GlobalDailyP05_Lon0360.html, accessed on 6 February 2025; | Precipitation | mm |
| MSWEP | https://www.gloh2o.org/mswep/, accessed on 6 February 2025; | Precipitation | mm |
| Study Area | Longitude | Latitude | Approximate Location | Acronym |
|---|---|---|---|---|
| 1 | 72°–70° W | 4°–2° S | Loreto Northeast | LOR1 |
| 2 | 76°–74° W | 4°–2° S | Loreto Northwest | LOR2 |
| 3 | 75°–73 W | 7°–5° S | Loreto South | LOR3 |
| 3 | 77°–75° W | 7°–5° S | Moyobamba | MOY |
| 3 | 73°–75° W | 10°–8° S | Ucayali | UCA |
| 4 | 69.5°–71.5° W | 13°–11° S | Madre de Dios | MD |
| 1 | 2 | 3 | 4 | 5 |
|---|---|---|---|---|
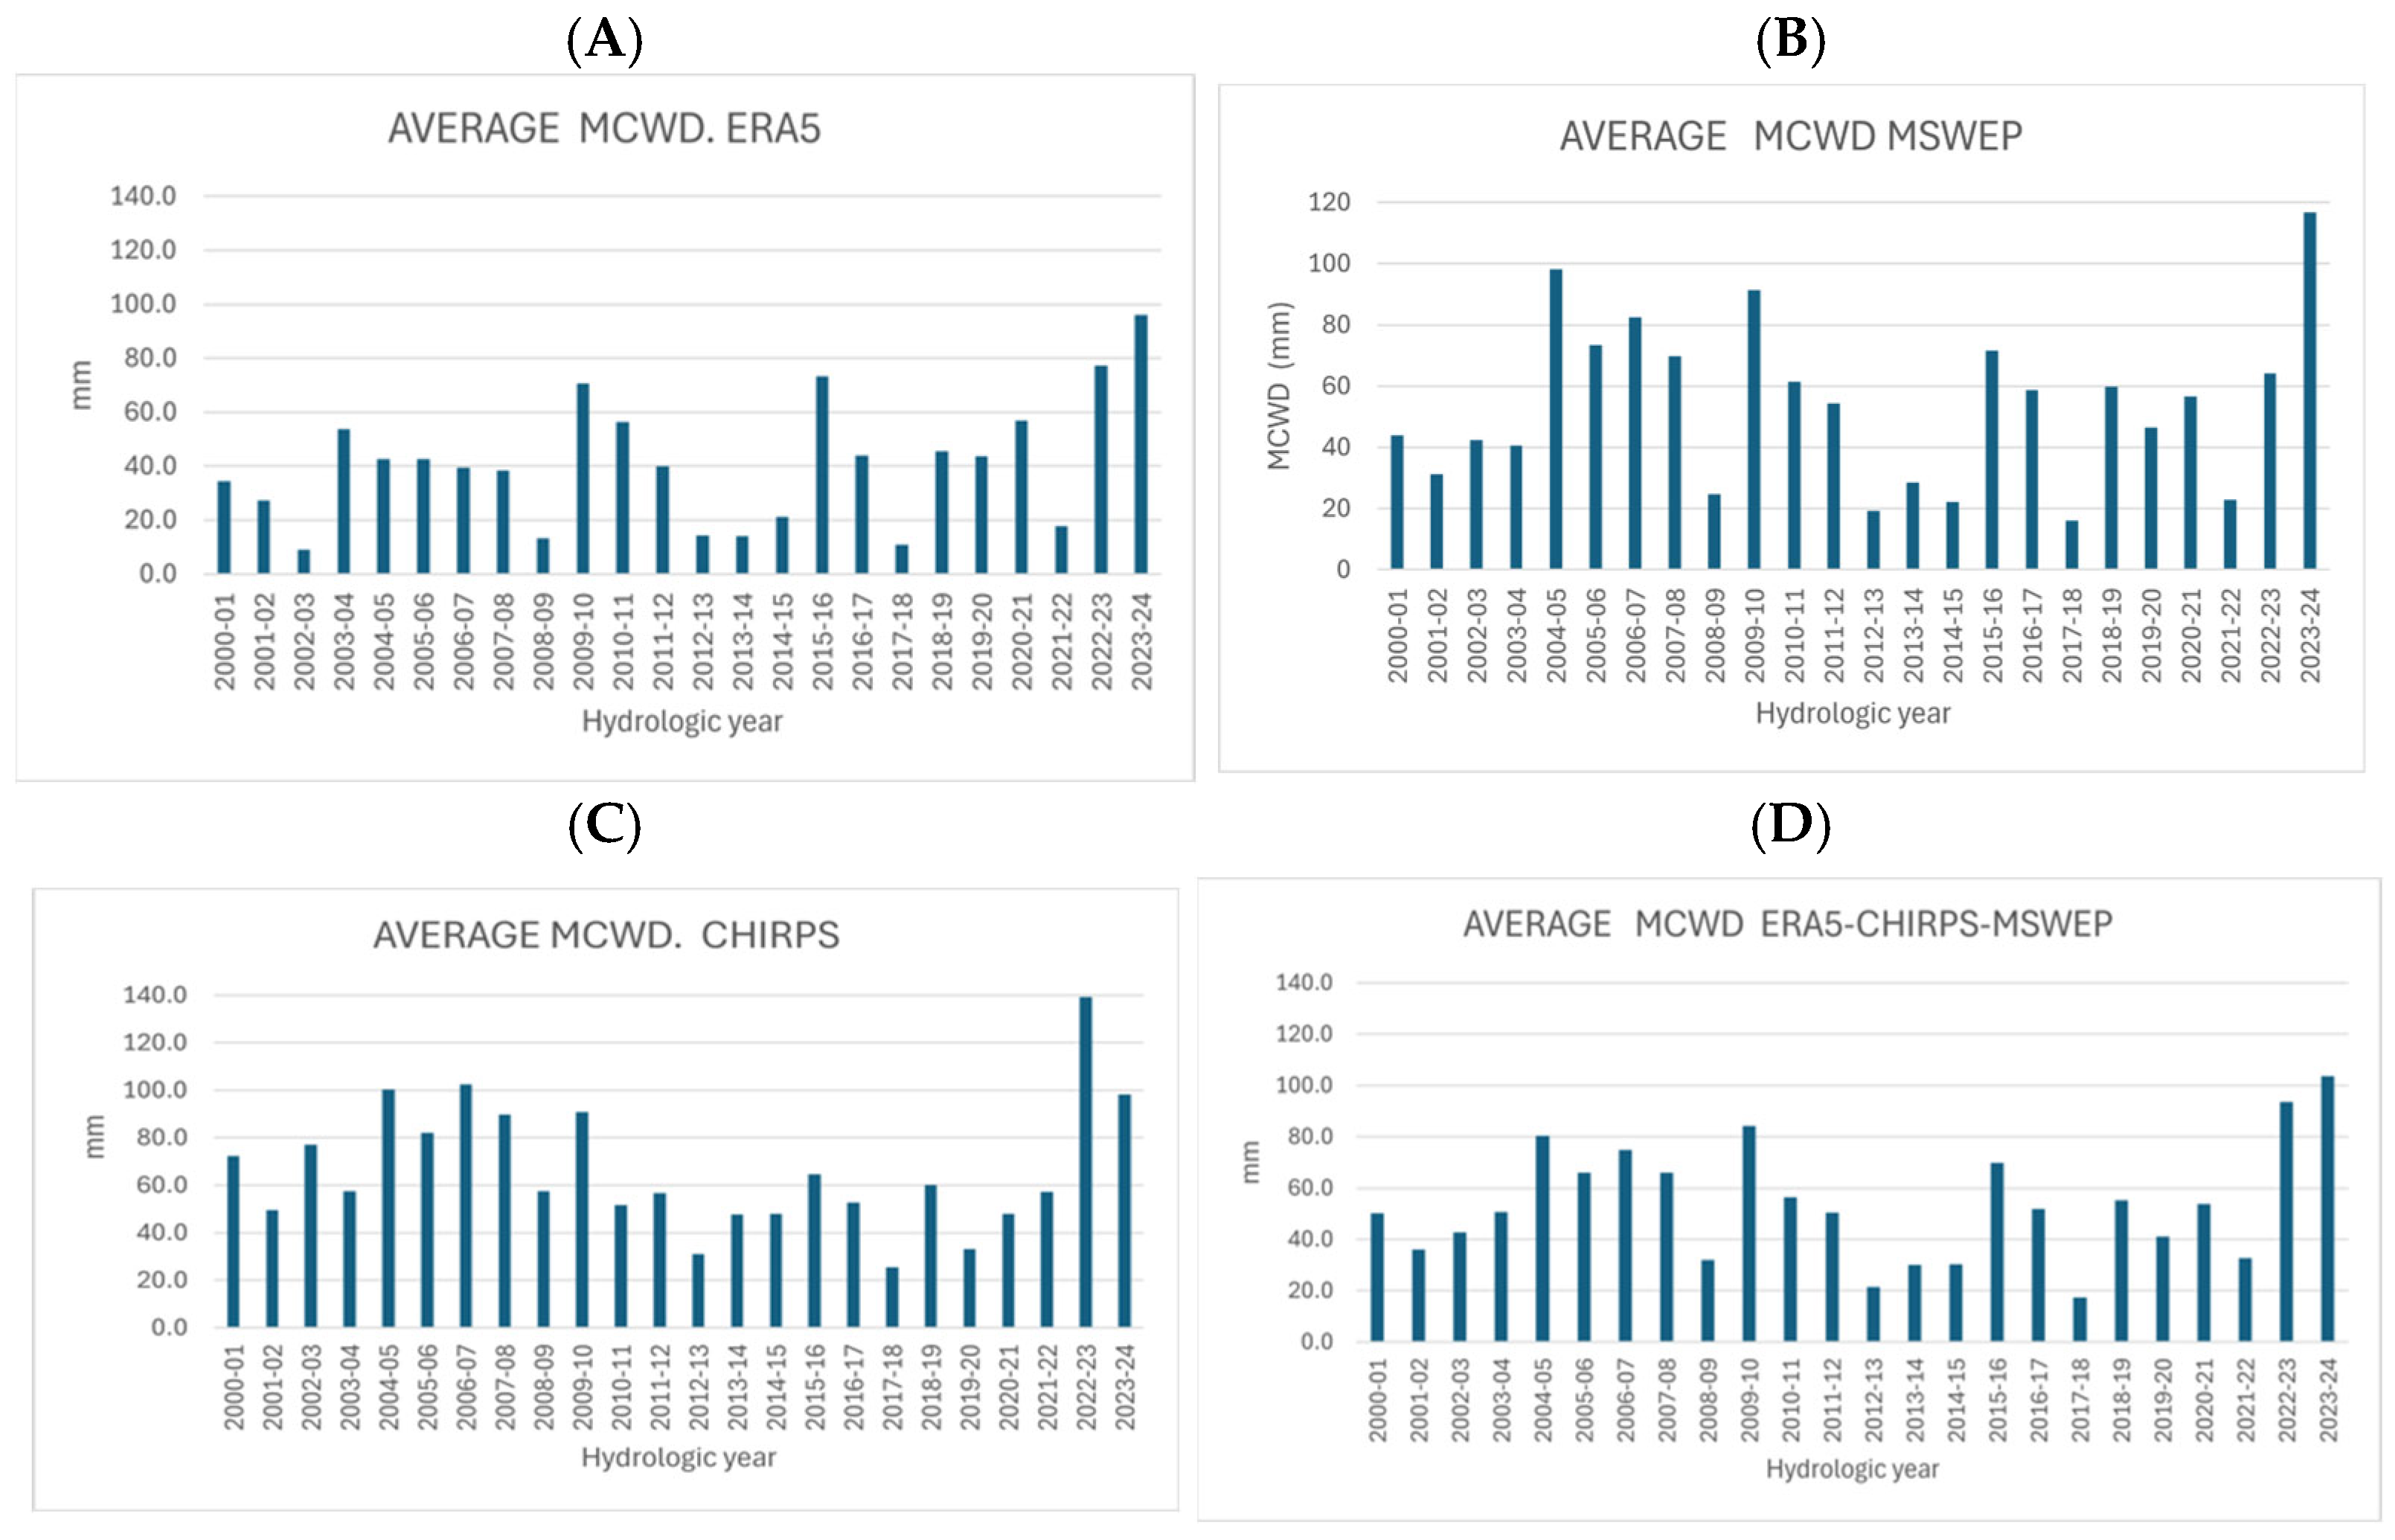
| HY | ERA5 | MSWEP | CHIRPS | Average |
| 2023-24 | 96.0 | 116.8 | 98.2 | 103.7 |
| 2022-23 | 77.3 | 64.2 | 139.3 | 93.6 |
| 2009-10 | 70.6 | 91.5 | 90.8 | 84.3 |
| 2004-05 | 42.6 | 98.1 | 100.4 | 80.4 |
| 2006-07 | 39.6 | 82.5 | 102.5 | 74.8 |
| 2015-16 | 73.3 | 71.5 | 64.6 | 69.8 |
| 2005-06 | 42.6 | 73.4 | 82.1 | 66.0 |
| 2007-08 | 38.4 | 69.9 | 89.8 | 66.0 |
| 2010-11 | 56.4 | 61.5 | 51.8 | 56.5 |
| 2018-19 | 45.6 | 59.8 | 60.2 | 55.2 |
| 2020-21 | 56.8 | 56.6 | 48.0 | 53.8 |
| 2016-17 | 43.9 | 58.8 | 52.8 | 51.9 |
| 2003-04 | 53.7 | 40.6 | 57.5 | 50.6 |
| 2011-12 | 40.0 | 54.4 | 56.8 | 50.4 |
| 2000-01 | 34.5 | 43.9 | 72.4 | 50.2 |
| 2002-03 | 8.9 | 42.3 | 77.2 | 42.8 |
| 2019-20 | 43.8 | 46.5 | 33.1 | 41.1 |
| 2001-02 | 27.2 | 31.2 | 49.7 | 36.0 |
| 2021-22 | 17.6 | 23.0 | 57.3 | 32.6 |
| 2008-09 | 13.4 | 24.7 | 57.6 | 31.9 |
| 2014-15 | 21.2 | 22.2 | 47.9 | 30.4 |
| 2013-14 | 14.1 | 28.6 | 47.8 | 30.2 |
| 2012-13 | 14.4 | 19.3 | 30.9 | 21.5 |
| 2017-18 | 10.8 | 16.1 | 25.4 | 17.4 |
Disclaimer/Publisher’s Note: The statements, opinions and data contained in all publications are solely those of the individual author(s) and contributor(s) and not of MDPI and/or the editor(s). MDPI and/or the editor(s) disclaim responsibility for any injury to people or property resulting from any ideas, methods, instructions or products referred to in the content. |
© 2025 by the authors. Licensee MDPI, Basel, Switzerland. This article is an open access article distributed under the terms and conditions of the Creative Commons Attribution (CC BY) license (https://creativecommons.org/licenses/by/4.0/).
Share and Cite
Martínez-Castro, D.; Takahashi, K.; Espinoza, J.-C.; Vichot-Llano, A.; Andrade, M.O.; Silva, F.Y. Extreme Droughts in the Peruvian Amazon Region (2000–2024). Water 2025, 17, 1744. https://doi.org/10.3390/w17121744
Martínez-Castro D, Takahashi K, Espinoza J-C, Vichot-Llano A, Andrade MO, Silva FY. Extreme Droughts in the Peruvian Amazon Region (2000–2024). Water. 2025; 17(12):1744. https://doi.org/10.3390/w17121744
Chicago/Turabian StyleMartínez-Castro, Daniel, Ken Takahashi, Jhan-Carlo Espinoza, Alejandro Vichot-Llano, Miguel Octavio Andrade, and Fey Yamina Silva. 2025. "Extreme Droughts in the Peruvian Amazon Region (2000–2024)" Water 17, no. 12: 1744. https://doi.org/10.3390/w17121744
APA StyleMartínez-Castro, D., Takahashi, K., Espinoza, J.-C., Vichot-Llano, A., Andrade, M. O., & Silva, F. Y. (2025). Extreme Droughts in the Peruvian Amazon Region (2000–2024). Water, 17(12), 1744. https://doi.org/10.3390/w17121744