Article

Experimental Study on Diversion Dike to Mitigate Debris Flow Blocking River Disaster

1
College of Water Resource and Hydropower, Sichuan University, Chengdu 610065, China
2
State Key Laboratory of Hydraulics and Mountain River Engineering, Sichuan University, Chengdu 610065, China
*
Author to whom correspondence should be addressed.
Water 2025, 17(12), 1736; https://doi.org/10.3390/w17121736
Submission received: 24 April 2025 / Revised: 4 June 2025 / Accepted: 5 June 2025 / Published: 8 June 2025
(This article belongs to the Section Hydrogeology)

Abstract

:
Barrier lakes formed by debris flows blocking rivers can burst rapidly, posing significant threats to downstream areas. Mitigating the risk of barrier lake breaches caused by debris flow blockages is crucial for ensuring safety in affected regions. This study employed physical experiments to investigate the influence of connection angles between the main flume and the tributary flume, as well as the installation of diversion dikes, on the morphological characteristics of debris flow deposits and the resulting barrier lake breach behavior. The findings reveal that when the debris flow enters the main flume at an intersection angle of 60°, compared to vertical entry (90°), the deposit’s height and volume are significantly reduced, while its length is increased. However, with the installation of a diversion dike, the height, volume, and length of the deposits are minimized, achieving the smallest values observed. Specifically, compared to vertical entry and a 60° connection angle without a diversion dike, the deposit volume decreased by 31.54~56.26%, height by 10.81~34.75%, and length by 2.33~25.05%. Post-breach observations indicate that the installation of a diversion dike results in the widest breach, the smallest peak flow, and the earliest occurrence of the peak flow. These findings demonstrate that diversion dikes effectively mitigate the barrier lake breach disaster caused by debris flow by altering the deposit morphology. The results provide valuable insights for the prevention and management of debris flow-induced river blockages and associated disasters in mountainous regions.

Graphical Abstract

1. Introduction

Debris flow is a common geological disaster in mountainous areas, which is often unpredictable and fast [1]. Under the induction of heavy rainfall, the accumulated materials in the mountain valleys form debris flows into the river channels, blocking the river channels and forming landslide dams [2,3,4]. Due to the poor stability and strong uncertainty of particle distribution, the bursting process of such barrier dams is highly unpredictable [5,6]. Once bursting occurs, a huge flow will flood the downstream area [7,8], causing serious losses. The 2023 Banzigou debris flow, the 2020 Shaziba debris flow, the 2020 Meilonggou debris flow, and the 2019 Xiazhuanggou “8·20” debris flow (Figure 1a–d) all blocked the main river channels to form large-scale barrier lakes, causing major geological disasters [9,10,11,12,13,14]. According to statistics from relevant departments, the number of barrier dams formed by debris flows is second only to that caused by landslides [15]. There were 2333 debris flow disasters after the 2008 Wenchuan earthquake alone [16]. Due to the characteristics of the disaster caused by the debris flow blocking the river, such as the difficulty in accurately grasping dynamic information [17], people’s research on its process and emergency plans has been restricted, and it has become a major hidden danger that endangers people’s lives and property safety.
Debris flow materials in mountainous areas can move along steep and narrow channels and be deposited in downstream areas [18]. This phenomenon often causes debris flows in mountainous areas to move to wide river channels downstream to form deposits that block the river channels. In order to prevent the river channels from being blocked, the upstream is flooded by backwaters, and the downstream is flooded due to the collapse of the dam [19,20]. At present, there are many measures set up in debris flow channels or debris flow deposition areas. For example, people use interception dams and other measures to intercept and divert debris flows or set deceleration baffles in the debris flow channels to promote their energy dissipation [21]. However, the effect of interception dams is also limited, and their capacity and other dimensions will also change accordingly, causing secondary disasters [22,23]. Using an artificial step pool system in the debris flow deposition area or setting up a breakwater and a retaining wall downstream of the debris flow to reduce debris flow disasters [24,25,26] has a certain effect, but a breakwater, a retaining wall, and other measures may also be damaged by the impact of the debris flow, and once the debris flow fills them, these measures lose their effect [22,23]. In an attempt to identify more feasible solutions, some scholars have proposed a flexible barrier structure, a permeable barrier structure [27,28], and other measures to prevent and control the debris flow, but these measures are also very limited in their effect on debris flow prevention and control and can only intercept a part or a specified size of debris flow materials, and most of the materials still maintain their original movement and continue to be transported downstream of the channel.
At present, debris flow prevention and control mainly focuses on blocking the direction of the debris flow movement to hinder its movement, and there is little research on constraints along the direction of the debris flow movement. As a diversion structure, the diversion dike flip wall proposed by Wang [29] can change the movement trajectory of the debris flow and extend the length of the debris flow path, thereby reducing the movement speed of the debris flow and promoting its deposition. Diversion dikes have been used in the field of debris flow prevention and control. Debris flow disasters frequently occurred in Jiangjiagou, Yunnan, China [30]. At first, a single-side diversion dike was used to prevent and control it. Its main purpose was to guide the debris flow that entered the river vertically to enter the river at an acute angle [29,31]. The above measures effectively mitigated the debris flow disaster in Jiangjiagou and the blockage of the Xiaojiang River by the debris flow. In addition, the intersection angle between the debris flow channel and the river channel also affects the transportation of the debris flow. The change in the intersection angle directly affects the energy change and flow state of the debris flow entering the river channel and affects the interaction process between the debris flow and the river channel [32,33,34,35]. Making debris flows enter the river at an acute angle to the direction of water flow can be used to prevent and control debris flow disasters [36,37,38], preventing debris flows from blocking the river channel, causing waterlogging upstream, forming a barrier lake, and triggering secondary disasters.
Existing research has achieved beneficial results in the prevention and control of debris flow disasters, but the research on barrier dams is more focused on landslide barrier dams, and there are relatively few systematic model experimental studies on the formation of barrier dams and the collapse of barrier dams when debris flows block the river. In order to continue to explore the differences in the morphology of the barrier body formed by the setting of diversion dikes and the debris flow entering the river at a natural angle and the differences in the collapse of the barrier lake caused by the diversion dike, this study uses the Yanmengou gully debris flow as a prototype to design experiments. By comparing the morphology of the barrier body formed by the debris flow blocking the river channel and the collapse process of the barrier lake under different intersection angles and diversion dikes, the influence of the intersection angle and the diversion dike on the shape of the deposit formed by the debris flow blocking the river and the collapse results are revealed. The research results can provide a certain reference for the prevention and control of debris flow disasters.

2. Experiment Method

2.1. Case Prototype

Yanmengou is located in the Songpan–Longmenshan seismic zone, where moderate to strong earthquakes occur frequently. Small geological disasters such as landslides often occur in the ditch, accumulating a large number of debris flow source bodies. After the heavy rain on 10 July, a flood was triggered. The flood carried a large amount of debris flow materials from the mountain ditch to the Minjiang River, forming an alluvial fan on the riverbed of the Minjiang River. The loose particles of the source body covered the alluvial fan on the riverbed to form a barrier dam, causing the river water level to rise and the river to change course. However, when the debris flow occurred, the Minjiang River was in the flood season, and the river flow was very large. The barrier dam formed by the debris flow overflowed in a relatively short time.
The Yanmengou debris flow is mainly composed of floating gravel and coarse sand, which is a dilution debris flow. Taking this debris flow as a prototype, there is no need to consider the effect of viscosity on the diffusion of the debris flow deposit, which is conducive for reflecting the deposition morphology of the deposit in the main waterway. The slope of the Yanmengou gully is 10~30°, and the slopes of its tributaries vary greatly, which is conducive for selecting a more appropriate tributary waterway slope for simulations in the model test.

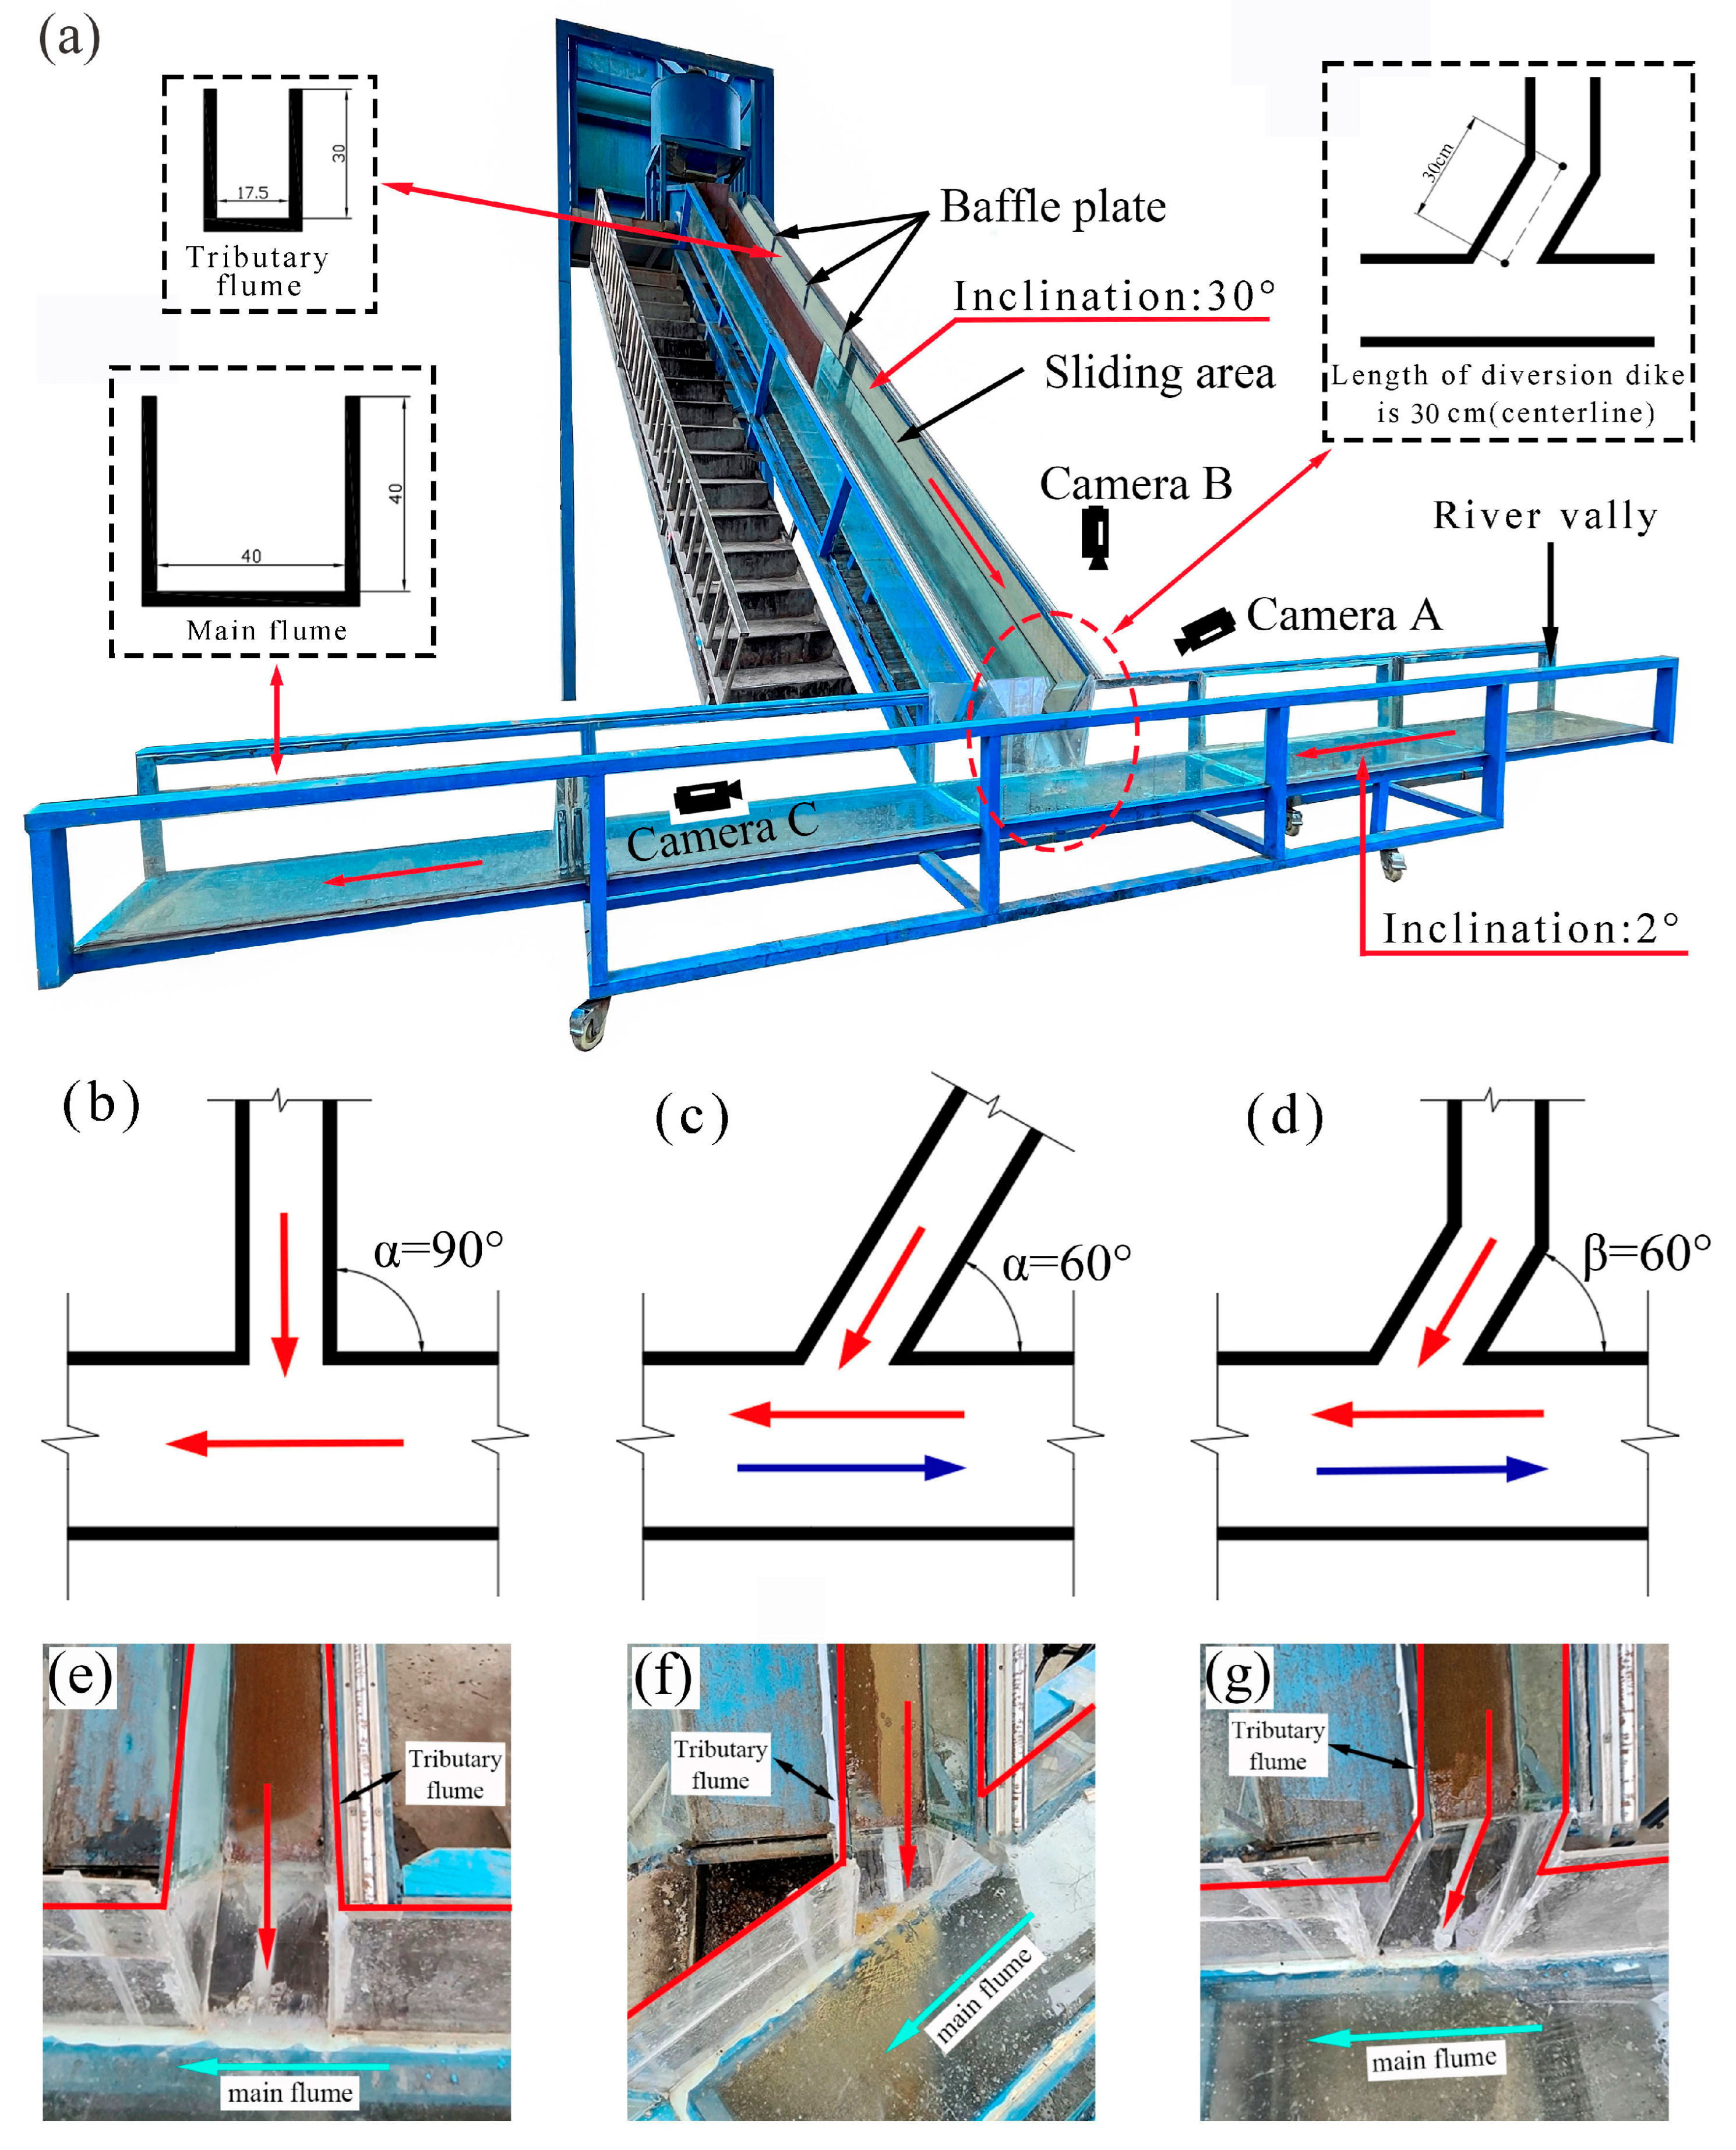
2.2. Experiment Setup

The model mainly consists of a debris flow generating device (tributary flume) and a river channel simulation device (main flume). The inclination angle of the main flume is 2° (Figure 2a). Under normal circumstances, the cross-sectional shape of a mountain valley can generally be simplified into a “V-shaped” design and a “rectangular” shape [39]. This experiment assumes that the river channel is a rectangular cross-section and designs the experimental model on this basis, as shown in Figure 2a. Based on the fact that the slope of the debris flow transport area in the middle of the Yanmengou gully is approximately 10~30° [29], according to the actual situation, the inclination angle of the tributary flume is set to 30°, and baffles are set at 3.5 m, 3 m, and 2.5 m above the tributary flume to control the debris flow from different heights. High-speed cameras A and B are placed on the right and top of the tributary flume to record the state of debris before and at the moment of entering the river. Camera C is placed in the river channel to record the impact of the debris flow on the river bank. The tributary flume is 17.5 cm wide and 30 cm deep (Figure 2a). The main flume is 40 cm wide and 40 cm deep (Figure 2a). The tributary flume and the main flume are made of transparent plexiglass for easy observation and recording. A water inlet is set at one end of the main flume to allow water to flow and explore the breach of the barrier lake. There are three ways to connect the tributary flume with the main flume, namely a vertical connection (Figure 2b,e), an inter-section angle connection (Figure 2c,f), and a diversion dike connection (Figure 2d,g). The length of the diversion dike centerline is 30 cm (Figure 2a).
This experiment takes the particle size gradation of the Yanmengou gully debris flow deposit as the prototype and obtains the model particle size gradation using the similarity criterion. According to the research by Wang [29] and other people and the on-site investigation, the density of the Yanmengou gully debris flow is ρ ≈ 1750 kg/m3, the fine sand content is very small, and the volume sand content is Cv = 0.45, which is consistent with a dilute debris flow. Viscous debris flows often have “intermittent” transport and “layering” phenomena, and their permeability is also low [40]. These phenomena were not observed at the site, so this experiment used uneven particles to add water to stir the dilute debris flow to simulate the prototype debris flow. The debris flow material is natural sand and gravel taken from the Yanmengou gully, Wenchuan County. The particle size distribution curve is shown in Figure 3. The particle size range is 0.3 mm–16 mm, where D60 = 7.3 mm, D30 = 2.4 mm, and D10 = 0.5 mm. The uniformity coefficient is Cu = 14.6, and the curvature coefficient is Cc = 1.58.

2.3. Test Procedure and Experimental Design

During the experiment, after determining the connection method between the tributary flume and the main flume, the baffle is adjusted to the set height, and the materials are mixed and stirred and then filled behind the baffle. The baffle is quickly pulled open to release the debris flow instantly, and it moves along the tributary flume to the main flume. When the baffle is released, cameras A, B, and C are turned on to record the movement of the debris flow. After the debris flow enters the river channel to form a deposit, the deposit is scanned by a three-dimensional laser scanner and photographed and measured at the same time. Then, water is passed into the main flume, resulting in waterlogging upstream of the deposit and causing the deposit to burst. At the same time, the water level changes upstream of the debris flow deposit are recorded every 5 s to calculate the burst flow. After the burst is completed, the residual deposit is scanned, photographed, and measured again by a three-dimensional laser.
The experimental settings are shown in Table 1. Based on the research results of [29] and others, the optimal effect of the diversion dike on the debris flow is 60~75°, and the structure of the diversion dike has good safety at this time. Therefore, the angle α of the diversion dike is set to 60° in this experiment. This experiment aims to transform the debris flow from vertically entering the river to entering the river at an incline through artificial structures. In order to compare the test effect of the 60° diversion dike, the angle β between the tributary flume and the main flume is also set to 60°. The experiment is carried out by changing the debris flow mass (M), height (H), intersection angle (α) between the tributary flume and the main flume, and diversion dike angle (β).

2.4. Data Acquisition

High-speed cameras A and B record the movement of debris after and before it flows into the river, respectively. Camera C is used to record the impact and movement of the debris flow when it enters the main flume. After the deposit is formed, the camera is used to photograph the shape of the deposit, and the SCANTECH IREAL 2S handheld 3D laser scanner is used to collect 3D point cloud data. Then, water (Q = 0.6 L/s) is passed into the main water tank to form a barrier lake to cause the deposit to overflow and collapse. After the deposit stabilizes, photos and 3D laser scanning are taken again.
Regarding the outburst flow process curve, we record the water level of the reservoir area upstream of the deposit every 5 s, calculate the volume change in the water in the upstream reservoir area through the water level change, and then calculate it in combination with the water balance equation. The difference between the inflow flow and the volume change in the water in the reservoir area in the same time interval is the outburst flow. The water balance equation is as follows:
d W d t = Q Q b
where W is the reservoir capacity; t is time; Q is the flow rate from the inlet pipe, which is 0.6 L/s in this experiment; and Q b is the breach flow rate.

3. Experiment Results

In this section, we present the morphology of debris flow deposits formed after the debris flow blocked the main water channel, focusing on cases where the material mass was 30 kg and 40 kg, respectively. Using the height, length, and volume distribution characteristics of the deposits formed under intersection angles of α = 60°and α = 90°, we analyzed the influence of the diversion dike on these key morphological parameters. Furthermore, the breach processes and post- breach morphological parameters of the debris flow deposits were examined.

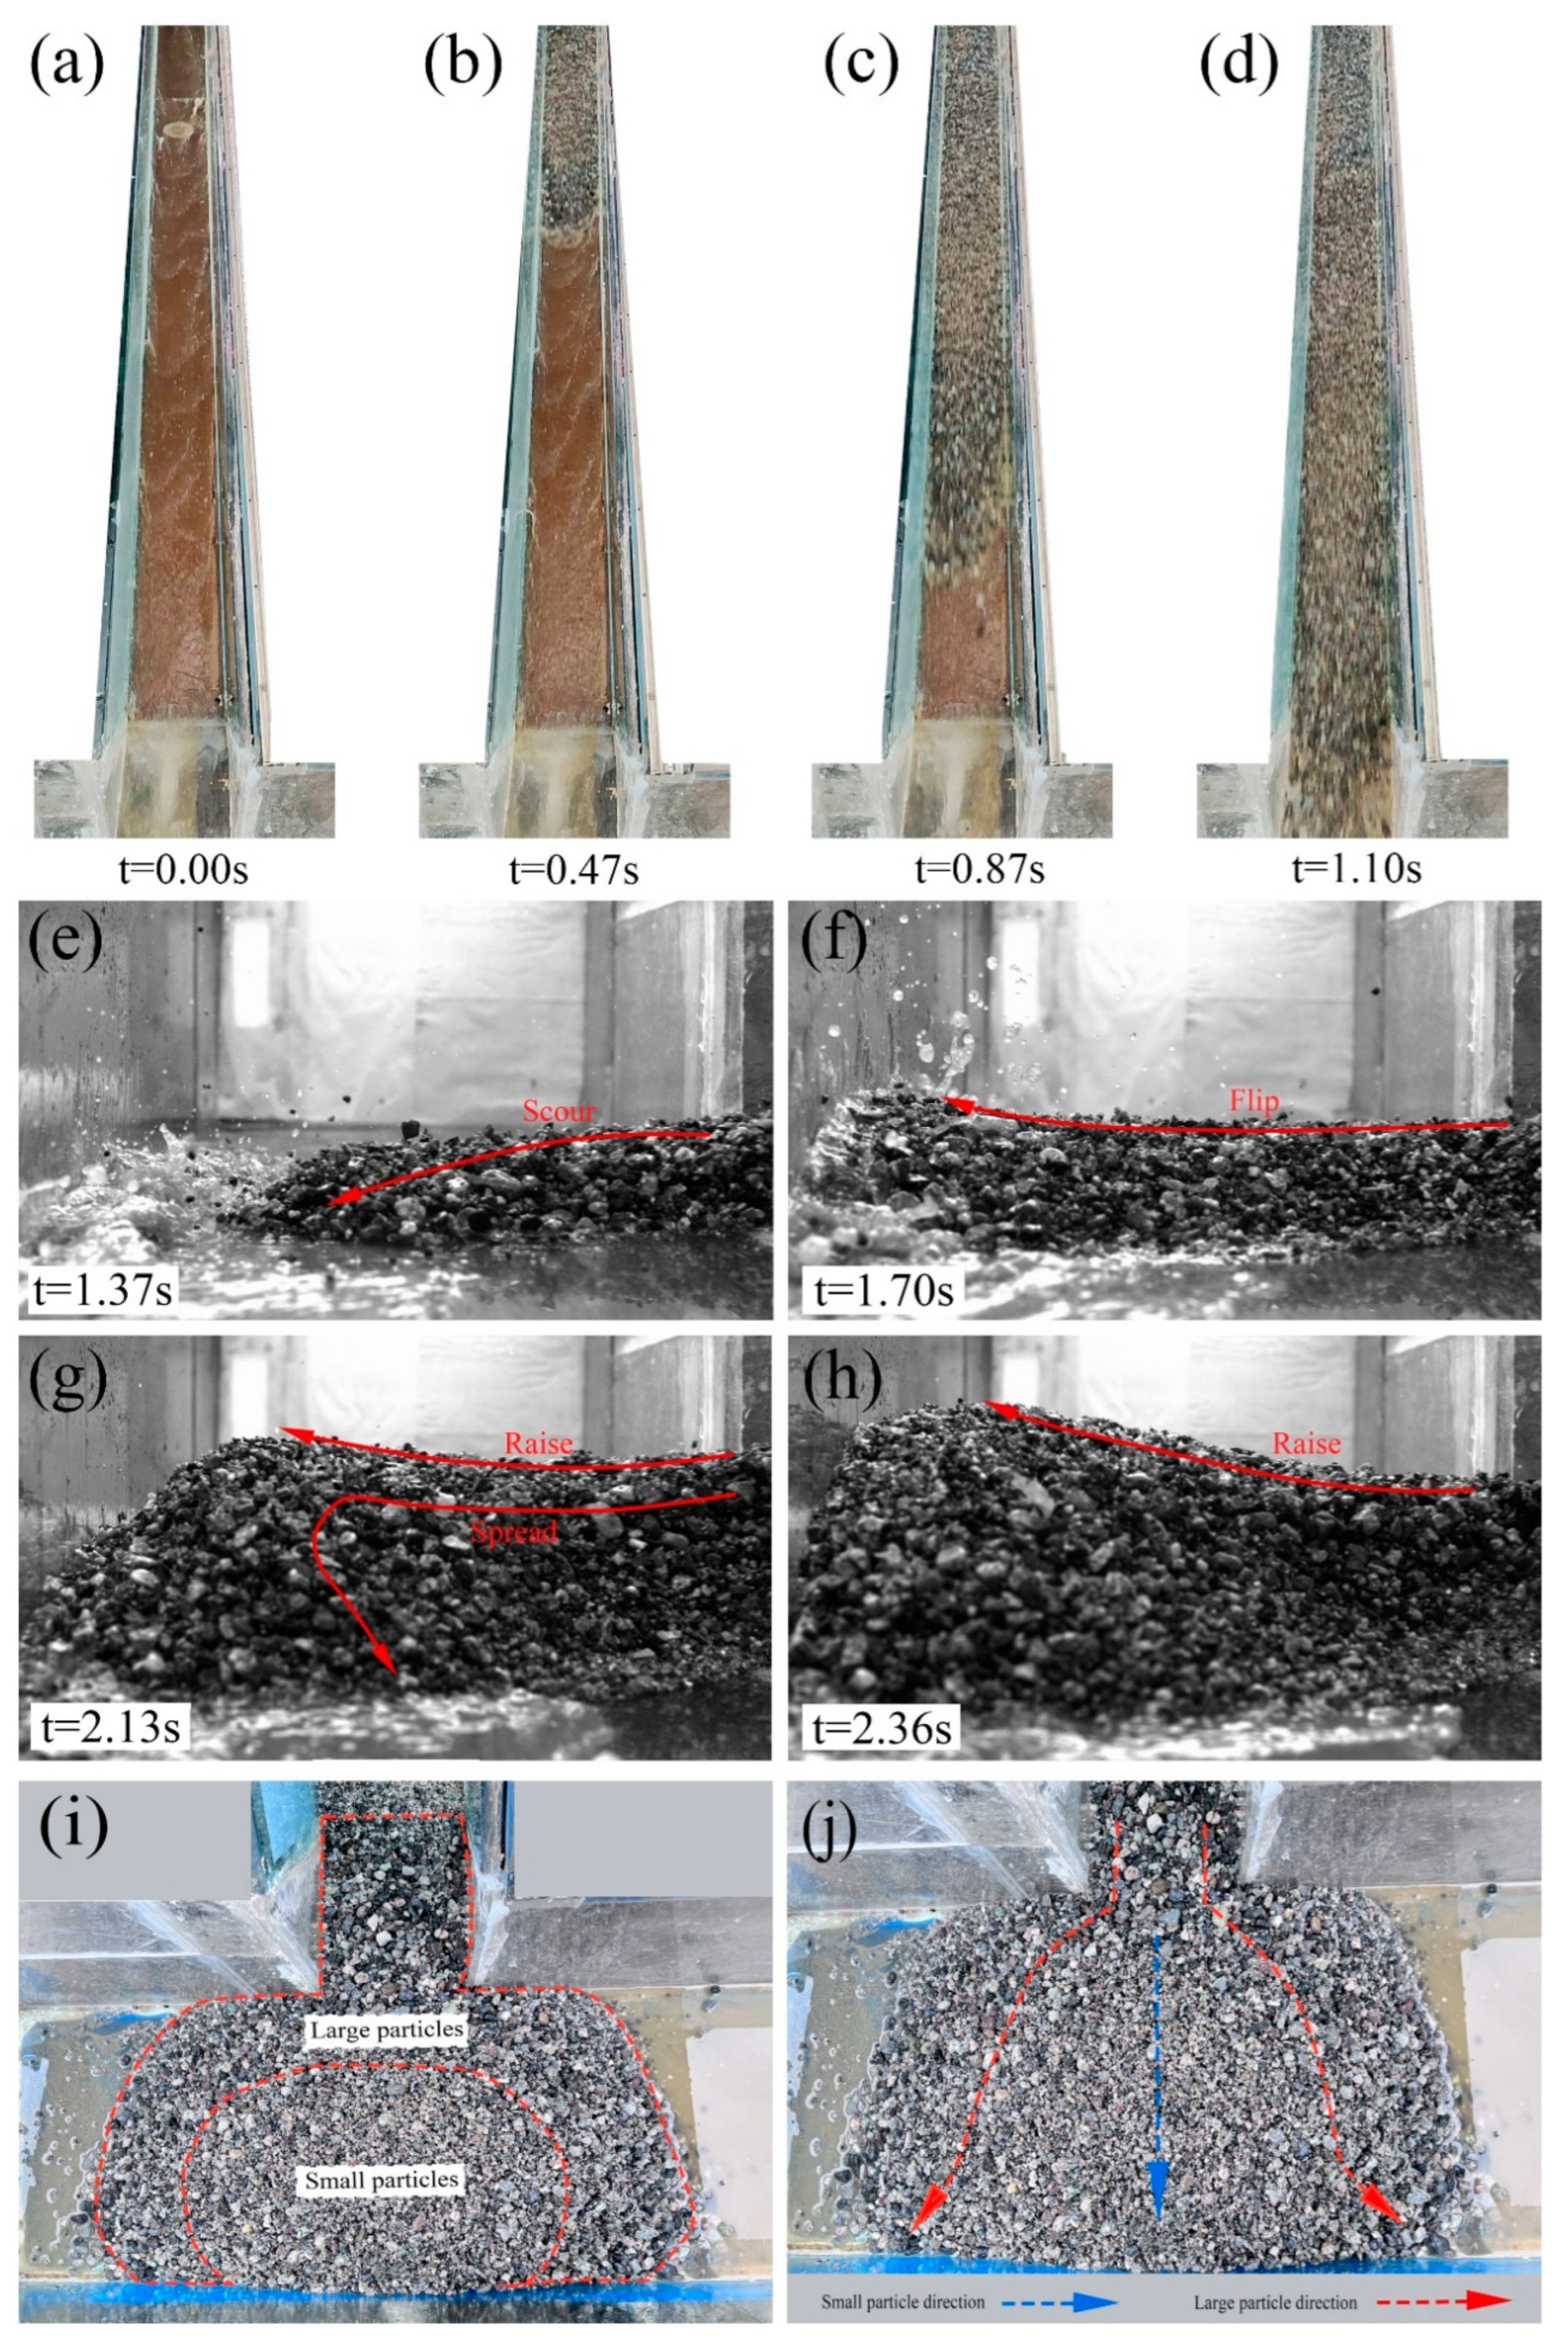
3.1. Debris Flow Movement and Deposition

This paper examines the movement and deposition processes of debris flow using Experiment A4, characterized by a material mass of M = 40 kg and an intersection angle of α = 90°, as illustrated in Figure 4. At t = 0 s, the debris flow begins to slide down after the baffle is removed. Between t = 0.47 s and t = 0.87 s, the debris flow accelerates as it moves from the tributary flume into the main flume. Figure 4c,d show that particle size differences result in varying movement speeds, with larger particles leading at the front of the debris flow while smaller particles trail behind. At t = 1.1 s, as the debris flow approaches the entrance of the main flume, this particle segregation pattern remains evident, reflecting the dynamic sorting mechanisms influenced by size and mass during debris flow movement.
At t = 1.37 s, the debris flow entered the main water channel and began to form a debris flow deposit. Larger particles were observed near the side of the tributary water channel, indicating a phenomenon where large particles moved backward (Figure 4i). This phenomenon is attributed to the particle sorting effect that occurs when the debris flow moves in the tributary flume. Simultaneously, due to its significant kinetic energy, the debris flow exerted a strong impact on the opposite bank upon entering the main water channel. At t = 1.7 s, the leading edge of the debris flow climbed up the opposite bank. By t = 2.13 s, a substantial volume of debris flow entered the main water channel, overlaying the smaller volume of material that had flowed in earlier. During this stage, larger particles moved toward the edges of the debris flow deposit, while smaller particles concentrated in the middle, creating a distinct particle segregation pattern where large particles surrounded smaller ones (Figure 4j). By t = 2.36 s, the debris flow fully blocked the water channel, forming a complete deposit.
Figure 5 illustrates the morphological characteristics of the deposits formed under various conditions. The planform of the deposits generally exhibits an elongated elliptical shape with a high aspect ratio. Under the condition of α = 90°, the deposits are nearly symmetrically positioned directly opposite the tributary flume. However, under conditions where α = 60° or α = 120°, or when a diversion dike is introduced with β = 60° or β = 120°, the deposits are noticeably offset from the interface between the tributary flume and the main flume. This positional shift indicates that the intersection angle and the diversion dike configuration significantly influence the spatial distribution of debris flow deposits.
Figure 6 demonstrate that as the mass of the debris flow increases, both the length and volume of the resulting deposit also increase. In addition, the highest point of the cross-section of the deposit in the main flume moved toward the bank away from the tributary channel (Figure 7), aggravating the blockage of the river channel. Furthermore, Figure 5 reveals that when the release height is high, the debris flow’s increased velocity not only leads to complete blockage of the main flume but also results in the spread of deposits both upstream and downstream of the blockage point. This creates a larger and more expansive debris flow deposit, which amplifies the risk of flooding and associated secondary disasters.

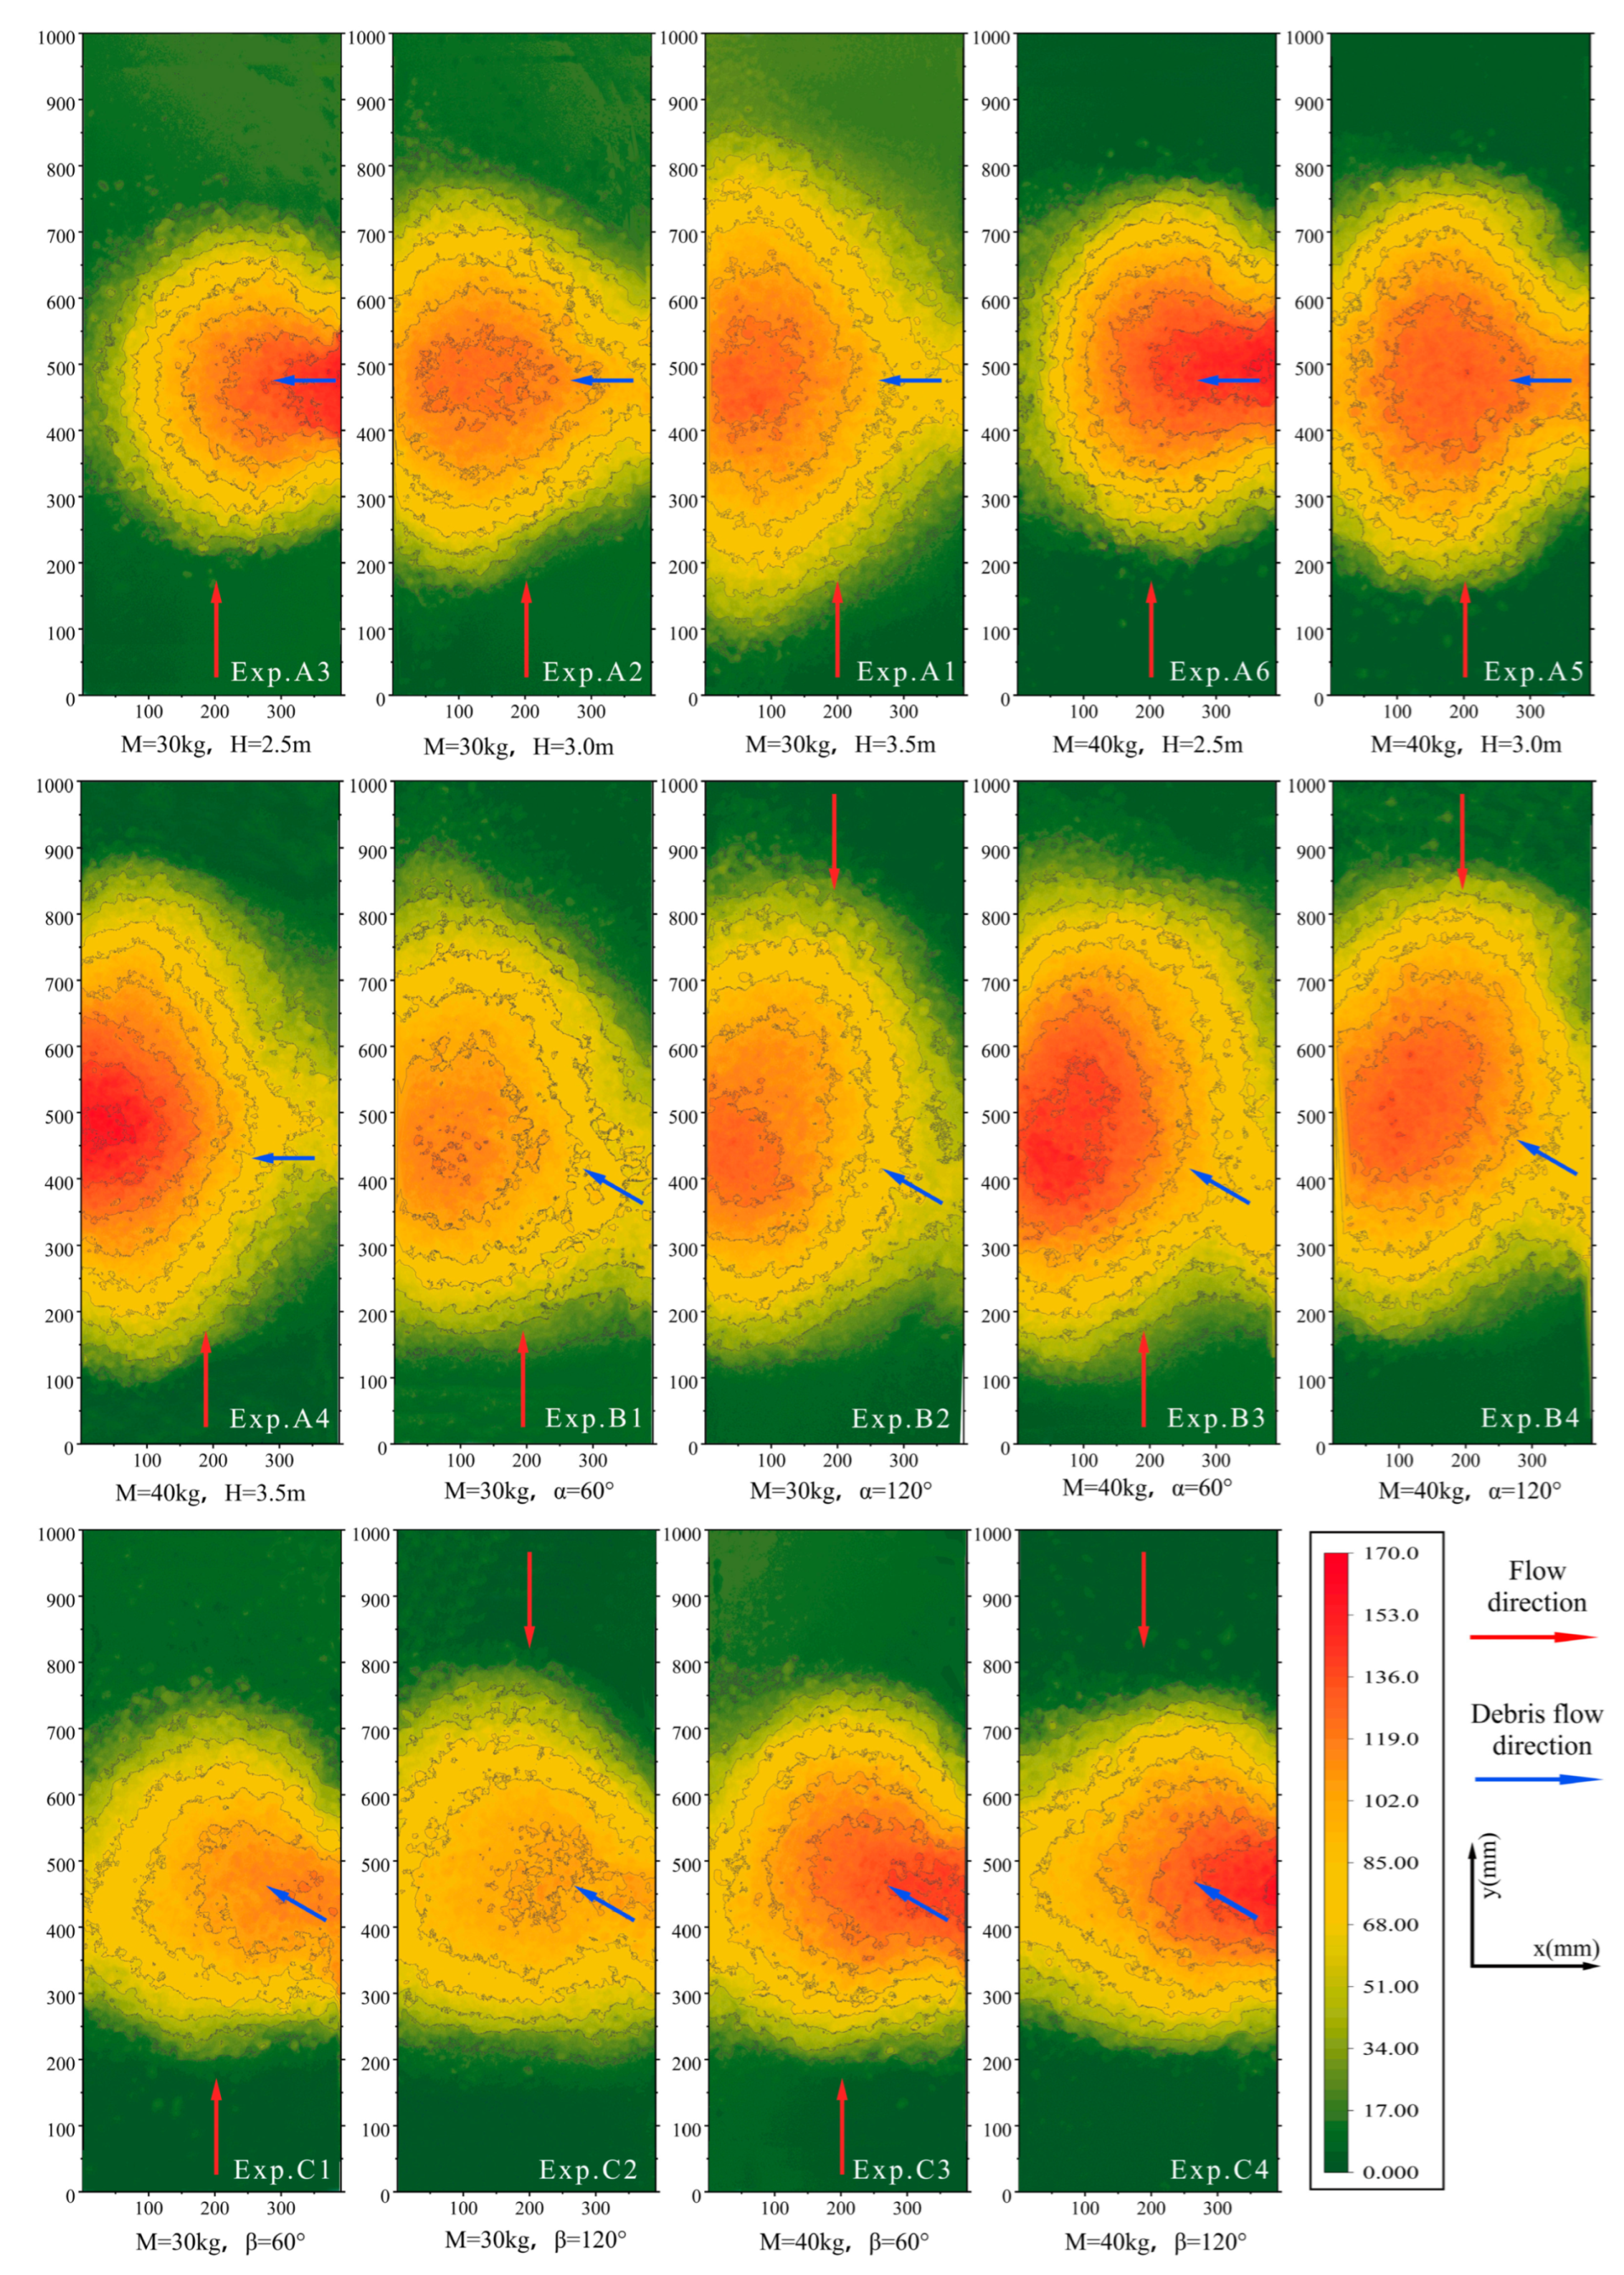
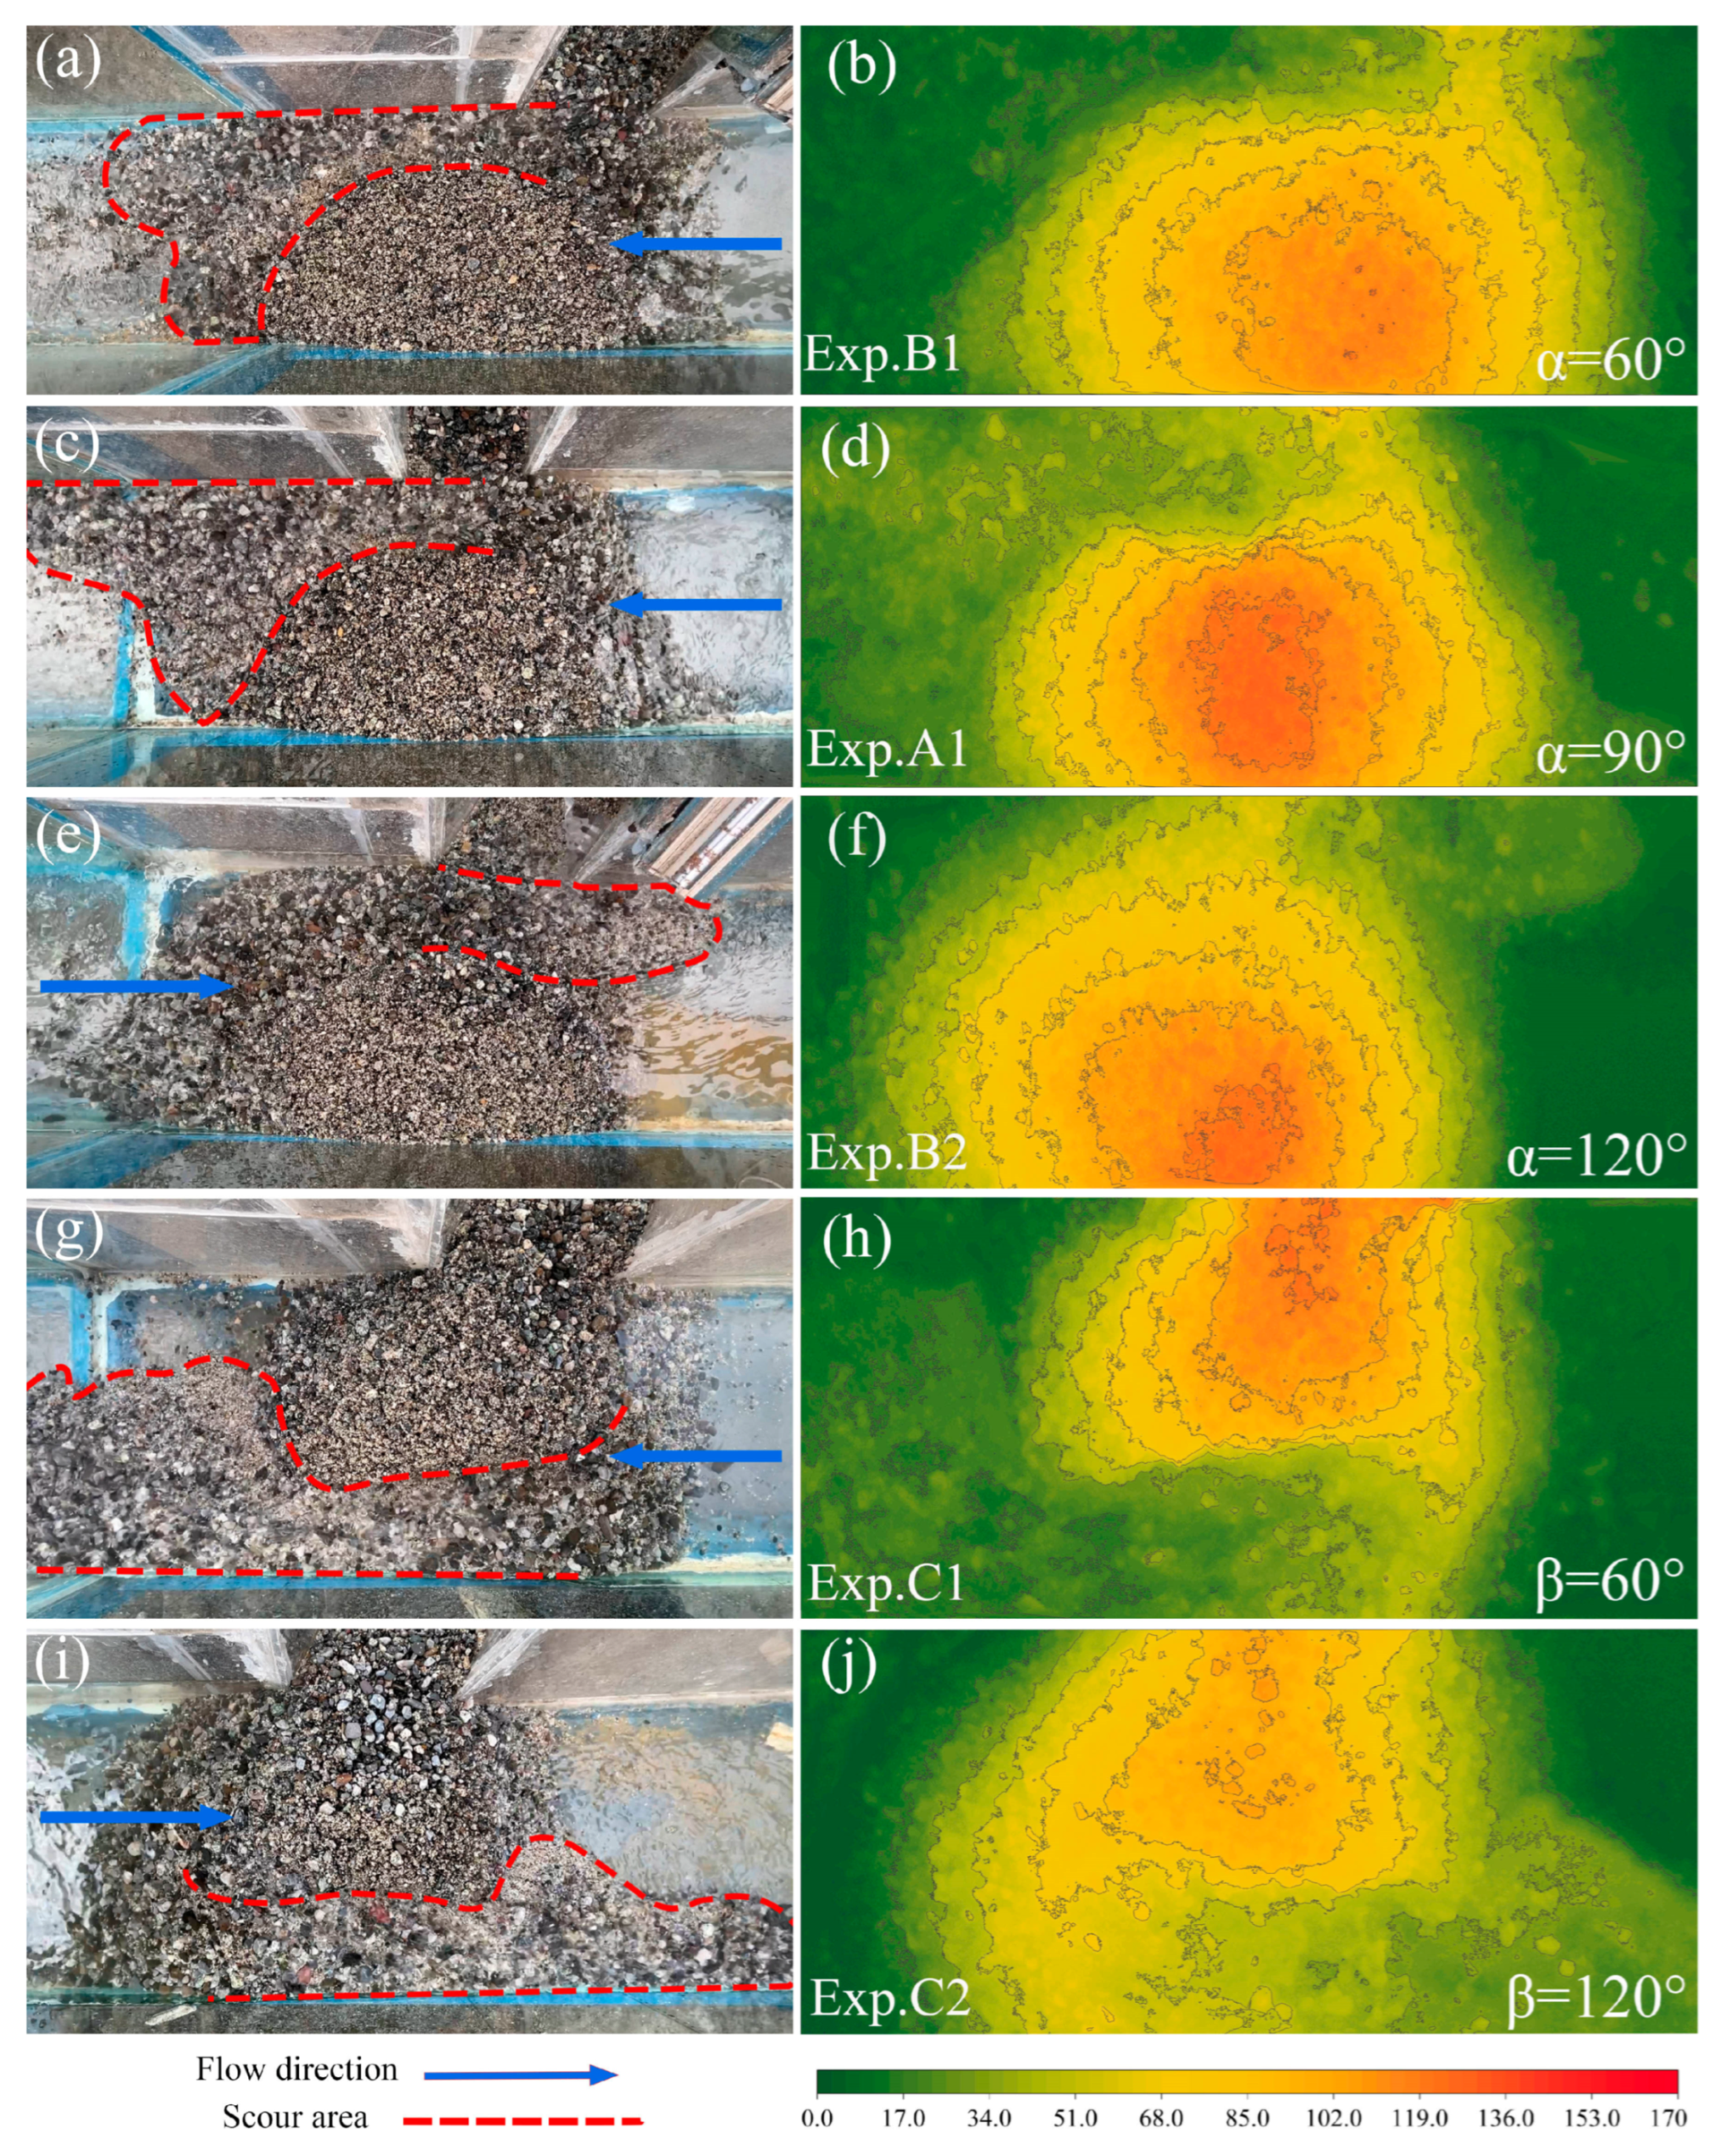
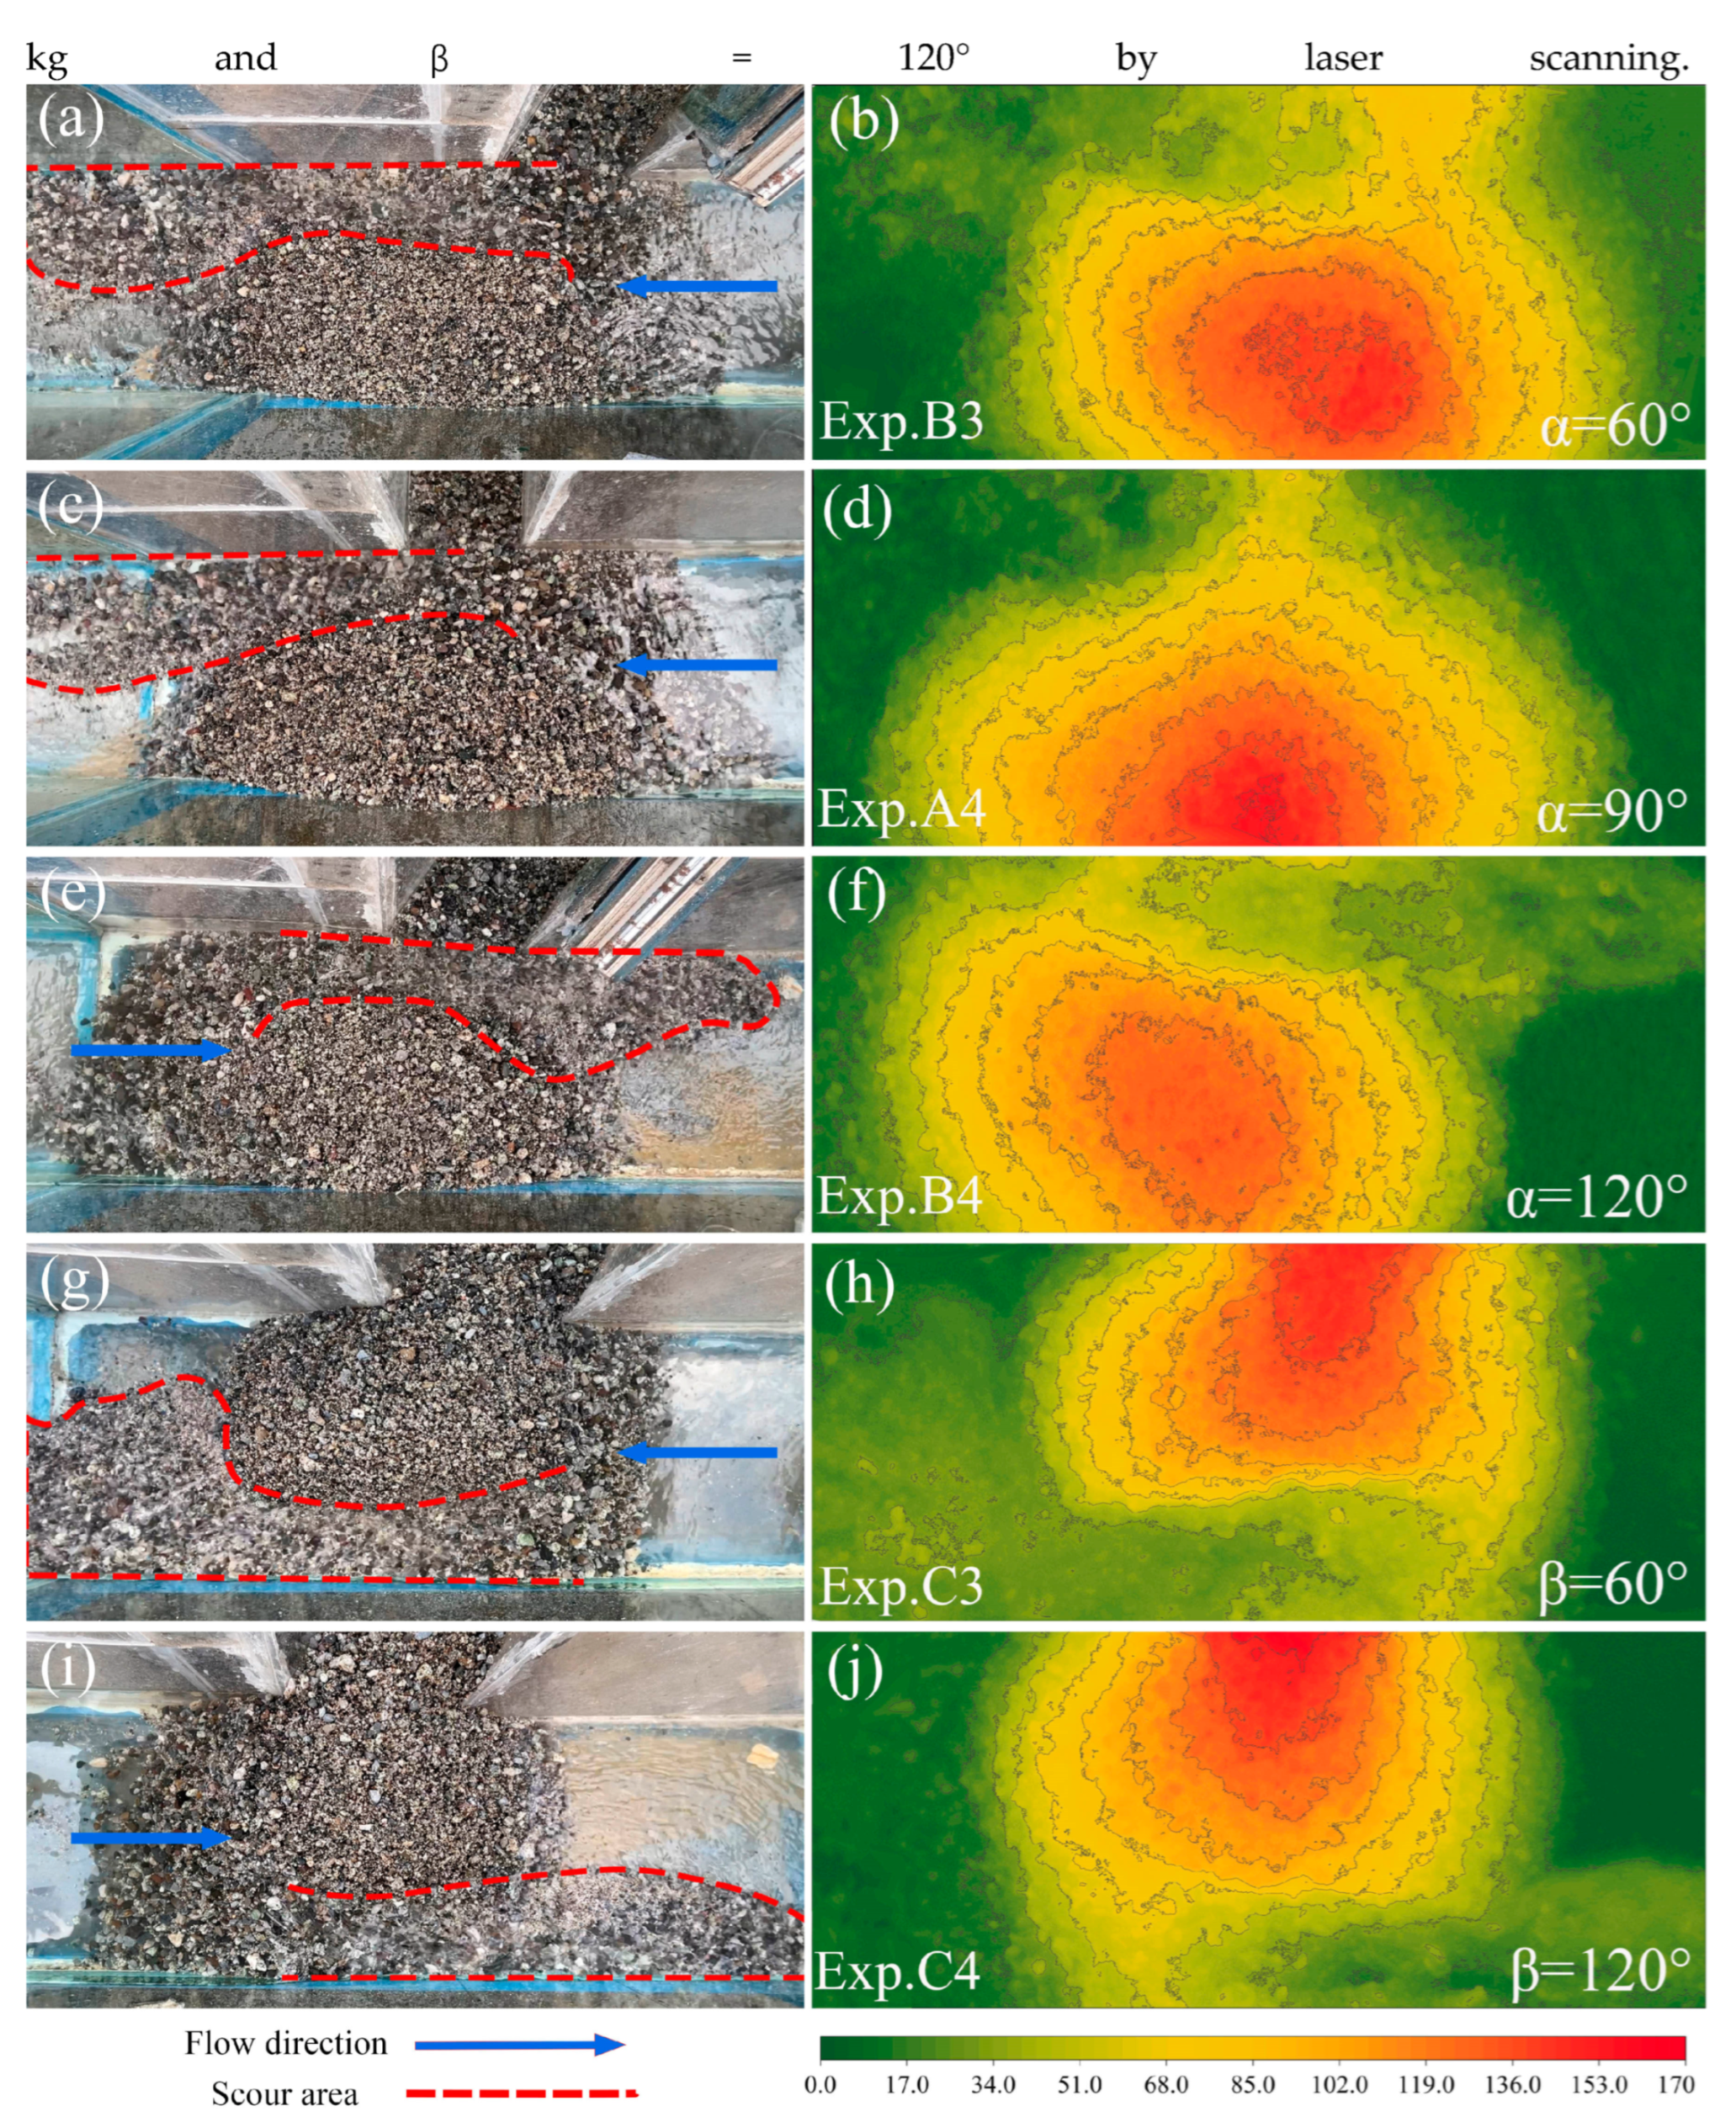
3.2. Debris Flow Deposit Morphology

Various debris flow confluence conditions, including the intersection angle between the tributary channel and the main channel, the debris flow mass, and the flow rate, significantly influence the morphological characteristics of the resulting deposits. These factors determine the spatial extent, shape, and elevation profile of the deposits formed. Figure 5 illustrates the elevation distribution of debris flow deposits generated under different experimental conditions.
When the debris flow originates from a height of H = 3.5 m, the morphological characteristics of the deposits vary significantly with changes in mass (M) and intersection angle (α). For a debris flow with M = 30 kg and α = 90°, the deposit has a length of 649.92 mm, a minimum cross-sectional height of 91.5 mm, and a volume of 0.01357 m3 (Figure 6). The overall deposit shape is characterized as short, tall, and large in volume. When α is adjusted to 60°, the deposit length increases to 699.14 mm, while the minimum height decreases to 69 mm, and the volume reduces to 0.01255 m3. The resulting deposit becomes longer and lower in profile. For a debris flow with M = 40 kg and α = 90°, the deposit exhibits a length of 658.62 mm, a minimum height of 76 mm, and a volume of 0.01507 m3. The morphological characteristics are generally consistent with those observed for the 30 kg debris flow. However, when α is reduced to 60°, the deposit length increases to 811.38 mm, the minimum height decreases slightly to 74 mm, and the volume rises to 0.01797 m3. This may be because when α = 60°, more debris flows enter the main flume and move along the flume direction without being blocked by the flume sidewalls, resulting in a longer length. Compared to α = 90°, the deposits formed at α = 60° exhibit a lower minimum height and greater elongation, reflecting the influence of the intersection angle on deposit morphology.
From the above comparison, it is evident that under the same debris flow mass, the height of the debris flow deposit formed at α = 60° is lower than that formed at α = 90°. Based on this finding, the experiment introduced a diversion dike with β = 60° to connect the tributary flume and the main flume. This structure consumes the energy of the debris flow by increasing the movement path of the debris flow, thereby reducing the amount of debris flow entering the main flume, directly affecting the deposition morphology of the debris flow in the river channel. This design has a significant impact on the sedimentation characteristics of river valley debris flow and has broad application prospects in debris flow prevention and control work [41,42]. After incorporating the diversion dike (Figure 7 and Figure 8), the length, height, and volume of the debris flow deposits in the main flume decreased significantly. Figure 8 is the definition of the length and minimum height of debris flow deposit. For a debris flow with M = 30 kg, the deposit length was reduced to 642.85 mm, the minimum height to 60.5 mm, and the volume to 0.00727 m3. For M = 40 kg, the deposit length decreased to 608.12 mm, the minimum height to 66 mm, and the volume to 0.01516 m3 (Figure 6). Compared with the intersection angle of α = 90°, the diversion dike deflects the debris flow that would otherwise flow directly into the main channel. This deflection consumes part of the debris flow’s kinetic energy and traps some of the material within the tributary channel, thereby reducing the likelihood of completely blocking the main water channel. Compared with α = 60°, the β = 60° diversion dike directs the debris flow into the main channel at a similar angle. However, the obstruction provided by the diversion dike further dissipates the debris flow’s kinetic energy, resulting in a reduced volume of material entering the main flume. This demonstrates the effectiveness of the diversion dike in mitigating the risk of river blockage by debris flows.
Additionally, when α = 90° or α = 60°, the resulting debris flow deposits exhibit the characteristics of climbing deposits [43]. These deposits are higher on the opposite bank of the tributary flume and lower on the tributary flume side. Such deposits tend to have greater height, length, volume, and area (Figure 5), which increases the likelihood of forming a barrier lake with a higher upstream water level. In contrast, after introducing the diversion dike, the morphology of the deposits transitions to sliding debris flow deposits, which are characterized by reduced height, shorter length, smaller volume, and limited area. These deposits are less likely to block the river and have a narrower impact range, demonstrating the effectiveness of the diversion dike in mitigating the risks associated with debris flow deposits and the formation of barrier lakes. This finding highlights the potential of structural measures like diversion dikes in controlling debris flow deposition patterns and reducing their impact.

3.3. Breaching Characteristics

The stability of the deposit is mainly affected by factors such as its volume, size, and shape [2], and the stability of the deposit directly determines the bursting of the formed barrier lake. In the experiment, after the deposit is formed, water (0.6 L/s) is passed into the main water tank to raise the upstream water level to form a barrier lake. On this basis, the burst flow process of the barrier dam is calculated by the water balance equation of the barrier lake reservoir area.
After the water flows over the lowest part of the deposit, erosion occurs. Initially, fine particles are eroded to the downstream area. As erosion continues, the breach begins to widen and erode, and the materials on both sides of the breach begin to collapse into the breach. Large particles of the material move downstream under the action of the water flow. The tail of the deposit begins to cut down, and a steep slope appears on the breach, causing upstream erosion. At this time, the scouring efficiency is the highest. Subsequently, the entire section of the breach cuts down into the inside of the breach until it reaches stability. At this time, the materials produced by the breach are deposited downstream. This phenomenon is similar to the research results by Huang and Peng [44,45].
Figure 9a–j and Figure 10a–j illustrate the residual forms of the debris flow deposits after breach and stabilization for cases where M = 30 kg and M = 40 kg, respectively. These figures reveal distinct differences in breach locations and characteristics depending on the intersection angle (α) and the presence of a diversion dike (β). When α = 60°, 90°, or 120° (without a diversion dike), the breach typically forms on the side of the tributary flume. In contrast, after introducing a diversion dike (β = 60° or 120°), the breach shifts to the opposite bank of the tributary flume and is notably wider and deeper. As shown in Figure 7, the reason for this difference is that the sliding-type deposit formed when there is a diversion dike is smaller in volume, and the height difference between the two sides of the deposit close to the tributary flume and away from the tributary flume is larger. The water flow upstream of the deposit is more likely to overflow from the lower side and cause a breach. Moreover, the diversion dike reduces the overall volume of the deposit, facilitating quicker breaching. The breach completion time is significantly reduced with the addition of diversion dikes (β = 60° or 120°) (Table 2). The analysis of the breach flow process curves (Figure 11a–e) indicates that for α = 90°, the peak breach flow is the largest (1.104 L/s), while the peak time is the longest (t = 85 s); for α = 60° and 120°, the peak flows are 0.984 L/s and 1.104 L/s, respectively, with peak times of 70 s and 77.5 s; for β = 120°, the peak flow and peak time are 1.02 L/s and 65 s, respectively; and for β = 60°, the peak flow is the lowest (0.95 L/s), while the peak time is the shortest (t = 47.5 s). Additionally, the breach width with a diversion dike is considerably larger than that without it (Figure 11f). These findings highlight the effectiveness of diversion dikes in modifying the breach process by reducing peak flows, accelerating breach times, and widening the breach, thus mitigating the severe downstream impacts.
It can be observed that when α = 90°, the water level of the barrier lake upstream of the debris flow deposit is the highest, resulting in a larger peak flow of the breach flood and a slower breach process. In contrast, when α = 60° or 120°, the debris flow exhibits more dynamic movement, both downstream and upstream, upon entering the main water channel. Specifically, when the debris flow moves downstream (α = 60°), the peak flow of the breach flood significantly decreases, from a maximum of 1.104 L/s to 0.984 L/s. After setting up the diversion dike, the peak flow of the breach flood is further reduced compared to other experimental conditions, and the breach width increases. This breach behavior is consistent with the findings of [41], indicating that a diversion dike at the connection between the main flume and the tributary flume can reduce the amount of debris flow entering the main channel. Compared with natural debris flow entry at a typical angle, the diversion dike results in a smaller deposit volume and a smaller burst flow during barrier lake breach events. This ultimately helps mitigate the risk of breaching due to the debris flow blocking the river channel.

4. Discussion

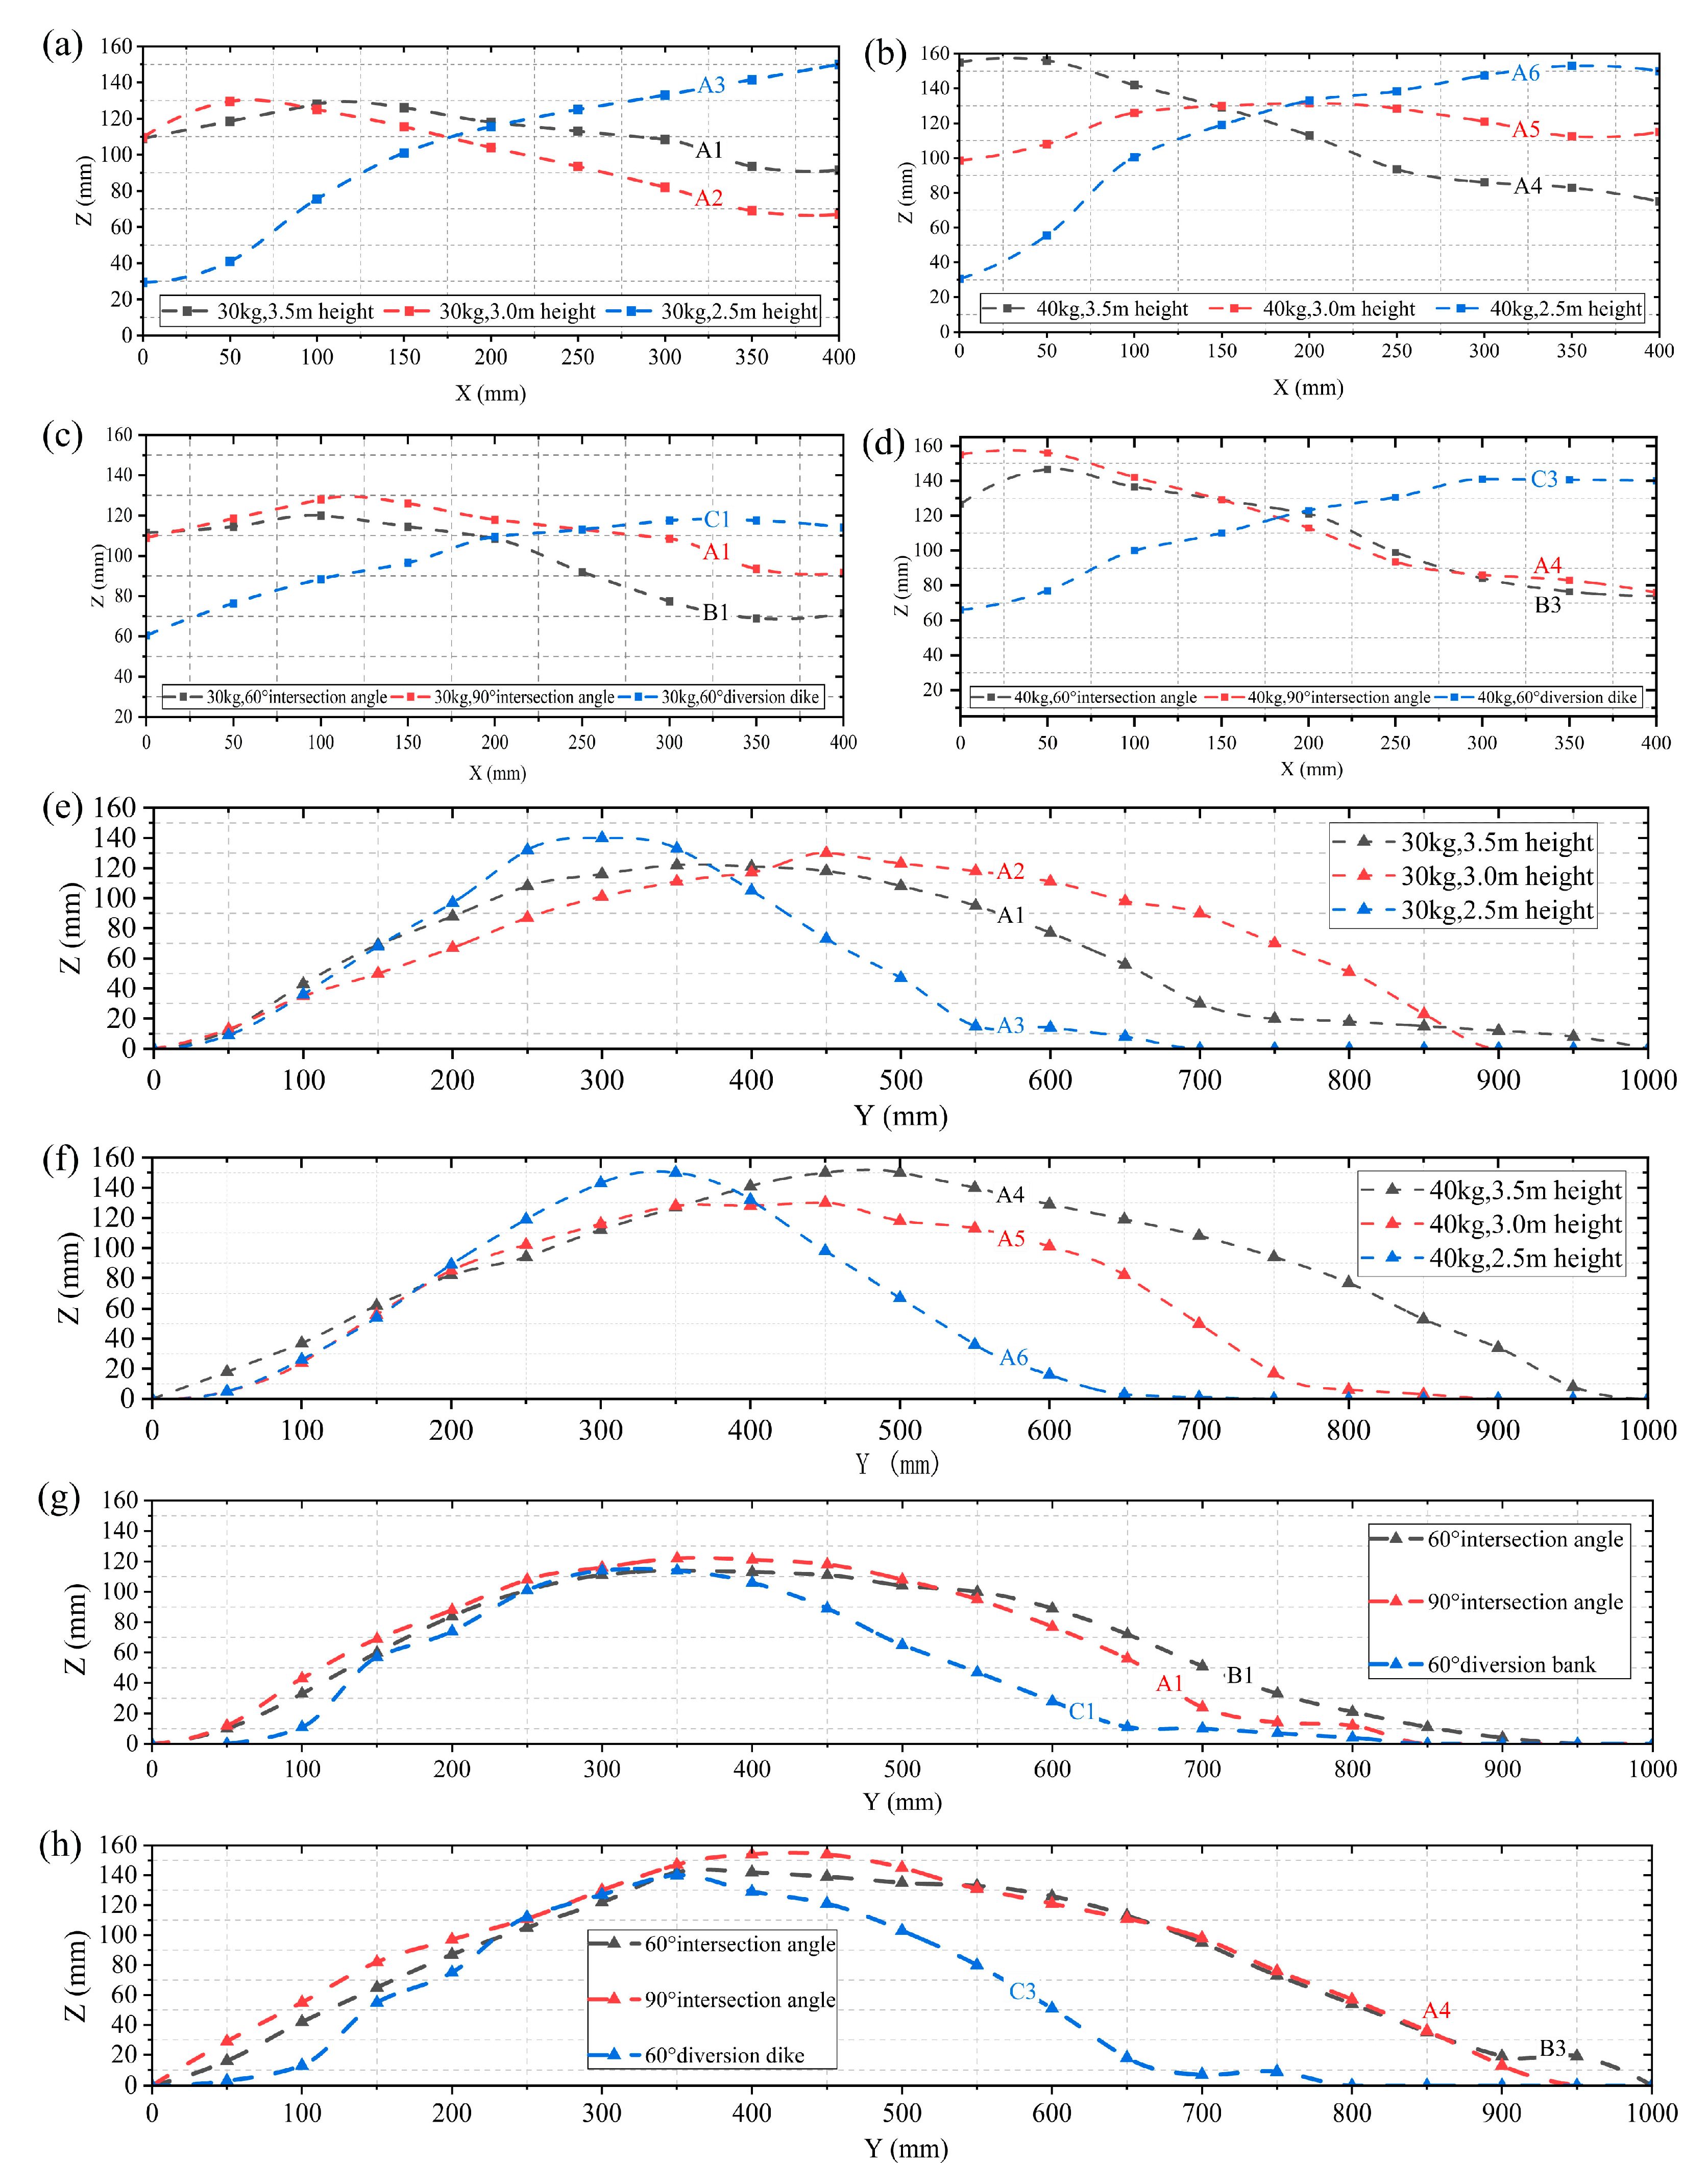
4.1. Deposit Morphology

The experimental results demonstrate that the morphology of debris flow deposits is significantly influenced by the intersection angle between the main flume and the tributary flume, consistent with the findings of [46]. Notable differences are observed in the deposits formed under conditions of α = 60° and α = 90°. When α = 90°, the debris flow deposit extends shorter along the main flume; that is, the length of the deposit is shorter, but the height and volume are larger; conversely, when α = 60°, the debris flow deposit extends farther along the main flume, so the deposit is longer, but the height is lower, and the volume is smaller. This indicates that when the main flume and tributary flume intersect at α = 60°, the resulting deposit, while more elongated, poses a reduced risk of barrier lake breach due to its decreased height and volume, mitigating the impact of debris flow blockage in the main flume.
Based on the experimental results, the transformation of debris flow from an entry angle of α = 90° to α = 60° was achieved by introducing a diversion dike at the intersection of the main flume and the tributary flume. Observations revealed that the 60° diversion dike effectively altered the debris flow dynamics. Compared to α = 90°, the deflection structure of the diversion dike intercepted and redirected the debris flow at the flume intersection, resulting in reduced length, height, and volume of the formed deposit. In addition, compared with the intersection angle of α = 60° without the diversion dike, the diversion dike deflects the debris flow and blocks it at the same time, which is beneficial for the longitudinal redistribution of the debris flow along the main flume and is especially beneficial for reducing the height of the deposit, reflecting the potential of the diversion dike in alleviating the impact of debris flow accumulation and reducing the risk of dam failure.
From a mechanical point of view, debris flow is a kind of expansive flow state. According to the debris flow movement mechanics model proposed by Takahashi and Bagnold [47,48], the shear force generated by the collision between its particles provides resistance to the movement of debris flow and the supporting force to prevent the particles from settling. The velocity distribution of debris flow is different from that of water flow, and the water–rock flow has greater resistance and kinetic energy. The movement of debris flow is easily disturbed by the outside world. The blocking effect of the diversion dike during its movement reduces the speed of the debris flow and slows down the collision between the debris flow particles, which reduces the supporting force between the debris flow particles and the mutual transfer of energy between the particles so that the debris flow can be deposited inside the diversion dike before entering the river channel, reducing the debris flow entering the river channel and slowing down the blockage of the river channel. However, this also leads to siltation inside the diversion dike, which weakens its prevention and control effect.
Table 3 quantifies the relative changes in the volume, height, and length of debris flow deposits after introducing a diversion dike for intersection angles of α = 60° and α = 90°. The results highlight the significant mitigating effects of the diversion dike on debris flow deposition. When the debris flow mass is M = 30 kg, the introduction of the diversion dike reduces the deposit volume by 42.10% compared to α = 60° and by 56.26% compared to α = 90°. The deposit height decreases by 12.32% and 34.75%, respectively, while the length decreases by 9.48% and 2.33%. For M = 40 kg, the deposit volume is reduced by 31.54% and 48.32% relative to α = 60° and α = 90°, respectively. The height decreases by 10.81% and 13.16%, while the length is reduced by 25.05% and 7.67%. These findings underscore the effectiveness of the diversion dike in significantly decreasing the scale of debris flow deposits, particularly in terms of volume and height, thus reducing the risk associated with river channel blockages caused by debris flow.
The interaction between the intersection angle α and the presence of a diversion dike significantly influences the formation and characteristics of debris flow deposits. When α = 90°, the debris flow directly impacts the opposite bank of the flume without hindrance, and the debris flow is intercepted in the tributary flume, at the very least. This results in debris flow deposits that are shorter in length along the river channel but exhibit the greatest volume and height due to the concentrated energy and deposition at the impact site. In contrast, at α = 60°, while the debris flow is similarly not intercepted in the tributary flume, it distributes more extensively along the river channel after entering the main flume. This broader distribution reduces the overall volume and height of the debris flow deposit compared to α = 90°. The introduction of a diversion dike fundamentally alters this deposition dynamic. The diversion dike absorbs and dissipates part of the kinetic energy of the debris flow, intercepting a portion of the material at the tributary flume’s intersection [49]. This results in deposits that are smaller in volume, lower in height, and shorter in length along the river channel. The deposits formed under these conditions are characterized as asymmetric sliding-type deposits [50]. These sliding-type deposits are advantageous in reducing the risk of forming high-water-level barrier lakes upstream. Their formation is often associated with debris flows of reduced volume and speed, emphasizing the effectiveness of structural interventions like diversion dikes in mitigating the risk of channel blockage and barrier lake formation.
However, the unique structural configuration of the diversion dike introduces certain risks. Specifically, debris flow may impact and damage the dike or climb over it upon entry. Additionally, the debris flow intercepted by the diversion dike could gradually accumulate, reducing the effectiveness of the dike and posing challenges for maintenance and removal. Addressing these issues remains a critical task for future research. Further exploration into the structural design and optimization of diversion dikes is planned as part of the next stage of this study. We will use well-established coupling models and numerical simulation methods to study the dynamic interaction between debris flows and dikes. For example, numerical simulations using a depth-integrated coupling model can provide insights into the dynamics of debris flows and their impact on dike performance. Similarly, studies of debris flow deposit morphology in natural river systems could shed light on deposition patterns and inform better engineering practices [51,52]. Through the integration of these methodologies, we aim to deepen the understanding of debris flow deposit morphology and dynamics in river-blocking scenarios.

4.2. Breaching Morphological Characteristics

The conditions under which debris flows converge into the main channel significantly influence the morphology and stability of the resulting deposits, which, in turn, affect the breach characteristics of the barrier lake formed by the blockage [2]. When the intersection angle is α = 90°, as previously discussed, the debris flow deposit exhibits a larger volume and greater height, leading to a higher upstream water level in the barrier lake. Consequently, the peak discharge during a breach is at its maximum. When the intersection angles are α = 60° and α = 120°, the two intersection angles are in a “mirror” structure relative to the center line of the tributary trough. However, their relative orientation to the main channel flow results in distinct breach characteristics. At α = 60°, the breach flow is smaller than that at α = 120°, but the breach width is largest at α = 120°. This difference may be attributed to the orientation of the 60° angle, which directs more debris flow downstream, making the deposit more susceptible to being carried away by water after the channel is breached. After the diversion dike is set, the breach formed by the debris flow deposit becomes wider, and the breach duration is shorter. Additionally, the reduced height of the debris flow deposit leads to a lower peak flow during the breach and a delay in the peak discharge time. Regarding the breach flow, the diversion dike configurations of β = 60° and β = 120° exhibit patterns similar to the “mirror” relationship of the aforementioned intersection angles. However, a key distinction lies in the breach width: for β = 120°, the width of the breach is slightly greater than that for β = 60°.
The experimental data further illustrate that the installation of a diversion dike significantly reduces the impact of debris flow deposits on river blockages. When β = 60°, the peak flood breach flow decreases from 0.984 L/s and 1.104 L/s at α = 60°and α = 90°, respectively, to 0.95 L/s. Simultaneously, the breach width increases from 112.32 mm and 99.79 mm to 118.91 mm. Similarly, when β = 120°, the peak flood breach flow decreases from 1.104 L/s at α = 120° and α = 90° to 0.95 L/s, while the breach width expands from 104.13 mm and 99.79 mm to 120.86 mm. The diversion dam reduced the height and volume of the debris flow deposit, making the water level in the reservoir upstream of the deposit lower, and the barrier lake collapsed and stabilized in a relatively short period of time. Compared with the scheme without a diversion dike, the lowering of the water level in the upstream reservoir directly leads to a reduction in peak outburst flow. These findings highlight the importance of diversion dikes in mitigating the risks associated with barrier lakes formed by debris flows blocking rivers.
The configuration of the connection between the tributary flume and the main flume significantly alters the flow dynamics of the debris flow, leading to changes in its internal structure [32]. These changes subsequently affect the morphology of the debris flow deposit and, in turn, the burst characteristics of the resulting barrier lake. The construction of diversion dikes aims to restrict debris flows from entering the river channel or change the shape of debris flow deposits, thereby reducing the risk of debris flows blocking the river channel or mitigating the impact of the bursting of the formed barrier lake. To a certain extent, it can alleviate the secondary disasters caused by debris flows blocking the river channel. In this study, a flume model was employed to simulate the burst process of debris flow-induced river blockages. It simplifies the natural topography of the tributary and main flumes and disregards terrain influences [53]. Consequently, the observed burst process may differ from actual field conditions. Due to experimental constraints, these simplifications were necessary. However, future research will focus on improving the experimental setup to more accurately represent real scenarios. This will help us better understand the breach mechanisms of debris flow deposits, especially under the influence of diversion dikes.

5. Conclusions

This experimental study investigated the impact of varying the intersection angle between the tributary flume and the main flume, as well as the effect of diversion dikes, on the morphological characteristics of debris flow deposits and the breach phenomena of barrier lakes. The experiments were conducted using debris flows of different masses to analyze how changes in the connection form between the flumes influence deposit morphology and breach. The results highlight the significant role of diversion dikes in mitigating the effects of debris flow-induced river blockages by altering deposit morphology and reducing the peak flow rate during barrier lake bursts. These findings provide valuable insights and a scientific basis for managing and controlling debris flow disasters in rivers.
The main conclusions of this study are as follows:
  • Effectiveness of diversion dikes:
The diversion dike can reduce the volume of debris flow entering the main water channel, thereby reducing the height and volume of the debris flow deposit and preventing the formation of a high-water-level barrier lake upstream. Specifically, after the diversion dike is installed, the deposit volume is reduced by 31.54~56.26%, the height is reduced by 10.81~34.75%, and the length is reduced by 2.33~25.05%. These changes in the morphological characteristics of the deposit can significantly reduce the risk of debris flow blocking the river and causing disasters.
2.
Influence on barrier lake breach dynamics:
Diversion dikes alter the flow pattern of debris flows, changing the morphology of deposits in the river channel. These changes result in distinct differences in breach characteristics, including smaller peak flows and wider breach widths, thereby reducing the severity of barrier lake bursts.
3.
Impact of entry angle on deposit morphology:
When the debris flow enters the main water channel vertically, the deposit volume and height are the largest under the same mass. This situation is likely to result in the formation of a barrier lake with a high water level. When the diversion dike angle is 60°, the peak outburst flow rate is reduced from 0.984 L/s and 1.104 L/s at the intersection angles of 60° and 90° to 0.95 L/s, and the breach width is widened from 112.32 mm and 99.79 mm to 118.91 mm. The outburst flow rate is effectively reduced, and the breach width is widened. If the angle between the natural debris flow channel and the main river channel is close to 90°, the diversion dike can be used to change the angle at which the debris flow enters the river channel to reduce the risk of debris flow blocking the river channel.
4.
Role of mass and velocity of debris flow:
The mass and speed of debris flows are also important factors affecting the morphology of river-blocking deposits. As the mass and speed of debris flows increase, the volume and height of the deposits will also increase. In this case, the deposits formed will often create a barrier lake with a greater risk. In addition, the interaction between particles in the debris flow becomes stronger during its movement, and the deposits formed are accompanied by different differences in particle size distribution, which will also cause differences in the burst results.
5.
Application potential of diversion dikes:
Diversion dikes can guide debris flows along designated paths, dissipate debris flow energy, and reduce the risk of secondary disasters caused by debris flow blocking the river. The diversion dike control structure proposed in this study is an improvement on the original diversion wall of Yanmengou. On the basis of retaining the original diversion wall, a double-sided diversion dike is used to enhance the restraint effect on debris flow. The experimental results verify that this measure has a significant effect on the prevention and control of debris flow blocking the river. This measure can be promoted and applied in Yanmengou and similar areas in the future.

Author Contributions

Conceptualization, H.Z.; Methodology, X.G., L.L., L.P., X.Y., H.Z., J.L., M.W. and P.R.; Software, X.G., L.P., J.L., M.W. and P.R.; Formal analysis, X.G.; Investigation, X.G., L.P. and J.L.; Resources, X.Y.; Data curation, X.G. and L.L.; Writing—original draft, X.G.; Writing—review & editing, X.G.; Project administration, H.Z.; Funding acquisition, X.Y. and H.Z. All authors have read and agreed to the published version of the manuscript.

Funding

This research was funded by National Natural Science Foundation of China (U20A20111).

Data Availability Statement

The original contributions presented in this study are included in the article. Further inquiries can be directed to the corresponding author.

Conflicts of Interest

The authors declare no conflict of interest.

References

  1. Jakob, M.; Hungr, O. Debris-flow Hazards and Related Phenomena; Springer: Berlin/Heidelberg, Germany, 2007. [Google Scholar] [CrossRef]
  2. Costa, J.E.; Schuster, R.L. The formation and failure of natural dams. Geol. Soc. Am. Bull. 1988, 100, 1054–1068. [Google Scholar] [CrossRef]
  3. Casagli, N.; Ermini, L.; Rosati, G. Determining grain size distribution of the material composing landslide dams in the Northern Apennines: Sampling and processing methods. Eng. Geol. 2003, 69, 83–97. [Google Scholar] [CrossRef]
  4. Yu, B.; Yang, C.; Yu, M. Experimental study on the critical condition of river blockage by a viscous debris flow. In Catena: An Interdisciplinary; Elsevier: Amsterdam, The Netherlands, 2022. [Google Scholar] [CrossRef]
  5. He, H.; Lv, D.; Peng, K.; Chen, Z.; Liao, H. Modeling experiment of river damming by debris landslide. Eng. Mater. Sci. 2023, 41, 84–87. [Google Scholar]
  6. Zhou, G.D.; Li, S.; Song, D.; Choi, C.E.; Chen, X. Depositional mechanisms and morphology of debris flow: Physical modelling. Landslides 2019, 16, 315–332. [Google Scholar] [CrossRef]
  7. Ni, H.; Zheng, W.; Xu, W. Catastrophic debris flows triggered by a 4 July 2013 rainfall in Shimian, SW China: Formation mechanism, disaster characteristics and the lessons learned. Landslides 2014, 11, 909–921. [Google Scholar] [CrossRef]
  8. Cao, C.; Chen, H.; Robin, N.; Li, H.; Ruan, H. Process of Debris Flow Dam Break Under Different Conditions. Bull. Soil Water Conserv. 2020, 40, 27–34. [Google Scholar]
  9. Tao, H.C.; Shi, C.B.; Jiang, Y.M.; Wang, S.H.; Hu, X.L.; Wang, J. Failure characteristics and formation mechanism of the shaziba landslide in Enshi. Resour. Environ. Eng. 2023, 37, 308–319. [Google Scholar] [CrossRef]
  10. Zhang, X.; Tie, Y.; Ning, Z.; Wang, S.; Hu, X.; Wang, J. Characteristics and activity analysis of the catastrophic “6.26” debris flow in the Banzi catchment, Wenchuan County of Sichuan Province. Hydrogeol. Eng. Geol. 2023, 50, 134–145. [Google Scholar] [CrossRef]
  11. Wen, Q.; Hu, X.; Liu, B.; Xi, C.; He, K. Analysis on the mechanism of debris fow in Meilong valley in Danba County on June 17, 2020. Chin. J. Geol. Hazard Control 2022, 33, 23–30. [Google Scholar] [CrossRef]
  12. Luo, Y.; Tang, C.; Xiong, J.; Chen, M.; Zhang, X. Cause Analysis of ‘8.20′ Debris Flow and Forecast of River-blocking Range in Xiazhuang Gully of Wenchuan County, Sichuan Province. Bull. Soil Water Conserv. 2020, 40, 193–199. [Google Scholar] [CrossRef]
  13. Chong, Y.; Chen, G.; Meng, X.-M.; Yue, D.-X.; Zhang, Y.; Guo, F.; Li, Y.; Zeng, R.; Zhao, Y.; Bian, S.; et al. Analysis of the transformation mechanism and prediction of a landslide-debris flow multi-hazards chain in an alpine canyon area: A case study in Zhouqu. J. Lanzhou Univ. (Nat. Sci.) 2022, 58, 372–384. [Google Scholar] [CrossRef]
  14. Cao, C.; Chen, H.; Robin, N. Research progress on debris flow dams. Yangtze River 2020, 51, 36–41. [Google Scholar] [CrossRef]
  15. Nian, T.; Wu, H.; Chen, G.; Zheng, D.; Zhang, Y.; Li, D. Research progress on stability evaluation method and disaster chain effect of landslide dam. Chin. J. Rock Mech. Eng. 2018, 37, 1796–1812. [Google Scholar] [CrossRef]
  16. Huang, R.; Fan, X. The landslide story. Nat. Geoence 2013, 6, 325–326. [Google Scholar] [CrossRef]
  17. Lin, Z.; Fan, G.; Chen, Q.; Zhou, J. Study on the process of landslide blocking the river based on seismic signal analysis: A case study of the Baige landslide dammed lake. Yangtze River 2023, 54, 90–97+202. [Google Scholar] [CrossRef]
  18. Xiong, J.; Tang, C.; Chen, M.; Zhang, X.; Shi, Q.; Gong, L. Activity characteristics and enlightenment of the debris flow triggered by the rainstorm on 20 August 2019 in Wenchuan County, China. Bull. Eng. Geol. Environ. 2020, 80, 873–888. [Google Scholar] [CrossRef]
  19. Walder Joseph, S. Tsunamis generated by subaerial mass flows. J. Geophys. Res. Solid Earth 2003, 108. [Google Scholar] [CrossRef]
  20. de Lange, S.I.; Santa, N.; Pudasaini, S.P.; Kleinhans, M.G.; de Haas, T. Debris-flow generated tsunamis and their dependence on debris-flow dynamics. Coast. Eng. 2019, 157, 103623. [Google Scholar] [CrossRef]
  21. Wang, F.; Chen, X.Q.; Chen, J.G. Experimental study on the energy dissipation characteristics of debris flow deceleration baffles. J. Mt. Sci. 2017, 14, 10. [Google Scholar] [CrossRef]
  22. Yuan, D.; Liu, J.-F.; You, Y.; Liu, D.-C.; Sun, H.; Zhang, L.; Zhou, W.-B. The siltation of debris flow behind check dam in the midstream of Bailong River. J. Mt. Sci. 2018, 15, 14. [Google Scholar] [CrossRef]
  23. Huang, T.; Ding, M.; Gao, Z.; Téllez, R.D. Check dam storage capacity calculation based on high-resolution topogrammetry: Case study of the Cutou Gully, Wenchuan County, China. Sci. Total Environ. 2021, 790, 148083. [Google Scholar] [CrossRef] [PubMed]
  24. Wang, Z.Y.; Qi, L.; Wang, X. A prototype experiment of debris flow control with energy dissipation structures. Nat. Hazards 2012, 60, 971–989. [Google Scholar] [CrossRef]
  25. Liu, F.; Xu, Q.; Dong, X.; Yu, B.; Frost, J.; Li, H. Design and performance of a novel multi-function debris flow mitigation system in Wenjia Gully, Sichuan. Landslides 2017, 14, 2089–2104. [Google Scholar] [CrossRef]
  26. Ugai, K.; Yagi, H.; Wakai, A. Earthquake-Induced Landslides; Springer: Berlin/Heidelberg, Germany, 2012. [Google Scholar] [CrossRef]
  27. Huo, M.; Zhou, J.W.; Yang, X.G.; Zhou, H.-W. Effects of a flexible net barrier on the dynamic behaviours and interception of debris flows in mountainous areas. J. Mt. Sci. 2017, 14, 1903–1918. [Google Scholar] [CrossRef]
  28. Jiang, R.; Fei, W.P.; Zhou, H.W.; Huo, M.; Zhou, J.W.; Wang, J.M.; Wu, J.J. Experimental and numerical study on the load and deformation mechanism of a flexible net barrier under debris flow impact. Bull. Eng. Geol. Environ. 2020, 79, 2213–2233. [Google Scholar] [CrossRef]
  29. Wang, J.; Hassan, M.A.; Saletti, M.; Yang, X.; Zhou, H.; Zhou, J. Experimental study on the mitigation effects of deflection walls on debris flow hazards at the confluence of tributary and main river. Bull. Eng. Geol. Environ. 2022, 81, 354. [Google Scholar] [CrossRef]
  30. Gao, Y.C.; Chen, N.S.; Hu, G.S.; Deng, M.F. Magnitude-frequency relationship of debris flows in the Jiangjia Gully, China. J. Mt. Sci. 2019, 16, 1289–1299. [Google Scholar] [CrossRef]
  31. You, Y.; Wu, J.; Cheng, Z. Causes and prevention measures of the debris flow diversion embankment breach in the lower reaches of Jiangjiagou. J. Catastrophology 2001, 16, 4. [Google Scholar] [CrossRef]
  32. Zhou, Y.; Shi, Z.; Zhang, Q.; Jang, B.; Wu, C. Damming process and characteristics of landslide-debris avalanches. Soil Dyn. Earthq. Eng. 2019, 121, 252–261. [Google Scholar] [CrossRef]
  33. Chen, C.-G.; Yao, L.-K.; Yang, Q.-H. Experimental Research on Confluence between Debris Flow and Main River. J. Southwest Jiaotong Univ. 2004, 39, 10–14. [Google Scholar]
  34. Cui, P.; Zeng, C.; Lei, Y. Experimental analysis on the impact force of viscous debris flow. Earth Surf. Process. Landf. 2015, 40, 1644–1655. [Google Scholar] [CrossRef]
  35. Zhang, J.S.; Cui, P. An empirical formula for suspended sediment delivery ratio of main river after confluence of debris flow. J. Mt. Sci. 2013, 10, 326–336. [Google Scholar] [CrossRef]
  36. Chen, K.T.; Chen, X.Q.; Hu, G.S.; Kuo, Y.-S.; Huang, Y.-R.; Shieh, C.-L. Dimensionless Assessment Method of Landslide Dam Formation Caused by Tributary Debris Flow Events. Geofluids 2019, 2019, 7083058. [Google Scholar] [CrossRef]
  37. Wang, D.-H.; Li, M.-H.; Gao, Y.-C. Prediction of Possibility of River Blocking by Debris Flow in Section of Yeniu Gully in Dadu River Watershed. Bull. Soil Water Conserv. 2014, 34, 230–233. [Google Scholar] [CrossRef]
  38. Huang, H.; Xie, Z.S.; Shi, S.W.; Yu, T. Characteristic and Countermeasures of River-bolcking Debris Flow of Haermu Gully in Wenchuan Area After Earthquake. Bull. Soil Water Conserv. 2015, 35, 327–332+337. [Google Scholar] [CrossRef]
  39. Zhao, Y.; Wu, P.; Li, J.; Yu, T. A new algorithm for the automatic extraction of valley floor width. Geomorphology 2019, 335, 37–47. [Google Scholar] [CrossRef]
  40. Liu, J.; Ma, C.; Li, C. Problems and prospects of studying riverbed deposition dynamics of viscous debris inflow catchment areas. Chin. J. Geomech. 2020, 26, 12. [Google Scholar] [CrossRef]
  41. Li, C.J.; Hu, Y.X.; Fan, G.; Zhu, Q.-Y.; Liu, D.-R.; Zhou, J.-W. Exploring debris flow deposit morphology in river valleys: Insights from physical modeling experiments. Eng. Geol. 2024, 332, 107465. [Google Scholar] [CrossRef]
  42. Gu, F.; Xu, L.; Li, Y. Evaluation of vulnerability of diversion dike suffering from debris flow disasters. J. Civ. Environ. Eng. 2023, 45, 145–154. [Google Scholar] [CrossRef]
  43. Zheng, H.; Shi, Z.; Peng, M.; Zhou, Y. Review and Prospect of the Formation Mechanism of Landslide Dams Caused by Landslide and Avalanche Debris. Adv. Eng. Sci. 2020, 52, 19–28. [Google Scholar] [CrossRef]
  44. Huang, J. Numerical simulation of flow variation during overtopping and breach of a dam. Shuili Xuebao 2008, 39, 1235–1240. [Google Scholar] [CrossRef]
  45. Peng, M.; Zhang, L.M. Breaching parameters of landslide dams. Landslides 2012, 9, 13–31. [Google Scholar] [CrossRef]
  46. Maria, S.L.; Stefano, L.; Enrico, F. Mutual Interference of Two Debris Flow Deposits Delivered in a Downstream River Reach. J. Mt. Sci. 2014, 11, 1385–1395. [Google Scholar] [CrossRef]
  47. Takahashi, T. Debris flow on prismatic open channel. Am. Soc. Civ. Eng. 1980, 106, 381–396. [Google Scholar] [CrossRef]
  48. Bagnold, R.A. Experiments on Gravity-Free Dispersion of Large Solid Spheres in a Newtonian Fluid Under Shear. Proc. R. Soc. A 1954, 225, 49–63. [Google Scholar] [CrossRef]
  49. Cheng, Z.; Dang, C.; Liu, J.; Gong, Y. Experiments of Debris Flow Damming in Southeast Tibet. Earth Sci. Front. 2007, 14, 181–185. [Google Scholar] [CrossRef]
  50. Wu, H.; Nian, T.-K.; Chen, G.-Q.; Zhao, W.; Li, D.-Y. Laboratory-scale investigation of the 3-D geometry of landslide dams in a U-shaped valley. Eng. Geol. 2024, 265, 105428. [Google Scholar] [CrossRef]
  51. Zhang, W.; Yan, F.; Wang, Z.-F.; Li, S.-J. Numerical analysis of landslides based on coupling model of material point method and depth integral. Rock Soil Mech. 2024, 45, 2515–2526. [Google Scholar] [CrossRef]
  52. Major, J.J. Depositional processes in large-scale debris-flow experiments. J. Geol. 1997, 105, 345–366. [Google Scholar] [CrossRef]
  53. Zheng, H.; Shi, Z.; Hanley, K.J.; Peng, M.; Guan, S.; Feng, S.; Chen, K. Deposition characteristics of debris flows in a lateral flume considering upstream entrainment. Geomorphology 2021, 394, 107960. [Google Scholar] [CrossRef]
Figure 1. Typical debris flow blocking river events in (a) Shaziba, (b) Banzigou, (c) Meilonggou, and (d) Xiazhuanggou.
Water 17 01736 g001
Figure 2. Experimental device. (a) Overall diagram of the model experimental device, (b) intersection angle α = 90°, (c) intersection angle α = 60°, (d) diversion dike β = 60°, (e) the connection position of the tributary flume and the main flume (intersection angle α = 90°), (f) the connection position of the tributary flume and the main flume (intersection angle α = 60°), and (g) the connection position of the tributary flume and the main flume (diversion dike β = 60°). Note: The direction of water flow in the main water tank is the red arrows, indicating that α or β = 60°, and blue arrows indicate α or β = 120°.
Water 17 01736 g002
Figure 3. Particle size gradation curve for sand and gravel of different particle sizes used in the experiment.
Water 17 01736 g003
Figure 4. (ah) Movement process of the debris flow, (i) phenomenon of large particles surrounding small particles formed by the debris flow, and (j) movement direction of large and small particles when the debris flow enters the main water flume.
Water 17 01736 g004
Figure 5. Morphology of the deposit under different experimental conditions.
Water 17 01736 g005
Figure 6. Length and volume of the debris flow deposit. (a) Experiments A1–A6, (b) Experiments B1–B4, and (c) Experiments C1–C4. (d) Minimum height of the debris flow deposit under different conditions.
Water 17 01736 g006
Figure 7. Cross-sectional shapes of the deposits: (a) Experiments A1–A3; (b) Experiments A4–A6; (c) Experiments A1, B1, and C1; and (d) Experiments A4, B3, C3. Longitudinal sectional shapes of the deposits: (e) Experiments A1–A3; (f) Experiments A4–A6; (g) ExperimentsA1, B1, and C1; and (h) Experiments A4, B3, and C3. Note: The position of the cross-section and longitudinal section are the A-A section and B-B section in Figure 8a.
Water 17 01736 g007
Figure 8. (a) Schematic diagram of the definition of the length of a debris flow deposit. (b) Schematic diagram of the definition of the minimum height of a debris flow deposit.
Water 17 01736 g008
Figure 9. (a) The shape of the residual dam when M = 30 kg and α = 60°. (b) The shape of the residual dam when M = 30 kg and α = 60° by laser scanning. (c) The shape of the residual dam when M = 30 kg and α = 90°. (d) The shape of the residual dam when M = 30 kg and α = 90° by laser scanning. (e) The shape of the residual dam when M = 30 kg and α = 120°. (f) The shape of the residual dam when M = 30 kg and α = 120° by laser scanning. (g) The shape of the residual dam when M = 30 kg and β = 60°. (h) The shape of the residual dam when M = 30 kg and β = 60° by laser scanning. (i) The shape of the residual dam when M = 30 kg and β = 120°. (j) The shape of the residual dam when M = 30 kg and β = 120° by laser scanning.
Water 17 01736 g009
Figure 10. (a) The shape of the residual dam when M = 40 kg and α = 60°. (b) The shape of the residual dam when M = 40 kg and α = 60° by laser scanning. (c) The shape of the residual dam when M = 40 kg and α = 90°. (d) The shape of the residual dam when M = 40 kg and α = 90° by laser scanning. (e) The shape of the residual dam when M = 40 kg and α = 120°. (f) The shape of the residual dam when M = 40 kg and α = 120° by laser scanning. (g) The shape of the residual dam when M = 40 kg and β = 60°. (h) The shape of the residual dam when M = 40 kg and β = 60° by laser scanning. (i) The shape of the residual dam when M = 40 kg and β = 120°. (j) The shape of the residual dam when M = 40 kg and β = 120° by laser scanning.
Water 17 01736 g010
Figure 11. Breach flow process curves for (a) α = 90°, (b) α = 120°, (c) α = 60°, (d) β = 120°, and (e) β = 60°; (f) breach width under different experimental conditions.
Water 17 01736 g011
Table 1. Experimental conditions of this study.
Exp IDM/kgH/mα/°β/°Exp IDM/kgH/mα/°β/°
A1303.590\B2303.5120\
A230390\B3403.560\
A3302.590\B4403.5120\
A4403.590\C1303.5\60
A540390\C2303.5\120
A6402.590\C3403.5\60
B1303.560\C4403.5\120°
Table 2. Comparison of breach duration under different experimental conditions.
M = 30 kgM = 40 kg
Exp IDConditionBreach DurationExp IDConditionBreach Duration
A1α = 90°76.78 sA4α = 90°114.10 s
B1α = 60°68.62 sB3α = 60°87.82 s
B2α = 120°70.25 sB4α = 120°84.12 s
C1β = 60°62.02 sC3β = 60°75.28 s
C2β = 120°67.82 sC4β = 120°78.78 s
Table 3. Relative change percentages in the length, height, and volume of the debris flow deposits after setting up the diversion dike.
Material QualityExp
ID
Intersection
Angle
Relative Change in Volume (%)Relative Change in Height (%)Relative Change in Length (%)
30 kgB160° −2.10−12.32−9.48
A190° −56.26−34.75−2.33
40 kgB360°−31.54−10.81−25.05
A490° −48.32−13.16−7.67
Disclaimer/Publisher’s Note: The statements, opinions and data contained in all publications are solely those of the individual author(s) and contributor(s) and not of MDPI and/or the editor(s). MDPI and/or the editor(s) disclaim responsibility for any injury to people or property resulting from any ideas, methods, instructions or products referred to in the content.

