Article

Soil Infiltration Characteristics and Driving Mechanisms of Three Typical Forest Types in Southern Subtropical China

1
College of Soil and Water Conservation, Beijing Forestry University, Beijing 100083, China
2
Anji County Water Resources Bureau, Huzhou 313000, China
3
Zhejiang Anji Nong Hi-Tech Group, Huzhou 313000, China
*
Author to whom correspondence should be addressed.
Water 2025, 17(12), 1720; https://doi.org/10.3390/w17121720
Submission received: 17 April 2025 / Revised: 14 May 2025 / Accepted: 4 June 2025 / Published: 6 June 2025
(This article belongs to the Section Hydrology)

Abstract

Plant roots and soil properties play crucial roles in regulating soil hydrological processes, particularly in determining soil water infiltration capacity. However, the infiltration patterns and underlying mechanisms across different forest types in subtropical regions remain poorly understood. In this study, we measured the infiltration characteristics of three typical stands (pure Phyllostachys edulis forest, mixed Phyllostachys edulis-Cunninghamia lanceolata forest, and pure Cunninghamia lanceolata forest) using a double-ring infiltrometer. Stepwise multiple regression and structural equation modeling (SEM) were employed to analyze the effects of root traits and soil physicochemical properties on soil infiltration capacity. The results revealed the following: (1) The initial infiltration rate (IIR), stable infiltration rate (SIR), and average infiltration rate (AIR) followed the order pure Phyllostachys edulis stand > mixed stand > pure Cunninghamia lanceolata stand. (2) Compared to the pure Cunninghamia lanceolata stand, the IIR, SIR, and AIR in the pure Phyllostachys edulis stand increased by 6.66%, 35.63%, and 28.51%, respectively, while those in the mixed stand increased by 28.79%, 28.82%, and 33.51%. (3) Fine root biomass, root length density, non-capillary porosity, and soil bulk density were identified as key factors influencing soil infiltration capacity. (4) Root biomass and root length density affected infiltration capacity through both direct pathways and indirect pathways mediated by alterations in non-capillary porosity and soil bulk density. These findings provide theoretical insights into soil responses to forest types and inform sustainable water–soil management practices in Phyllostachys edulis plantations.

1. Introduction

Soil water infiltration, one of the most critical processes governing water exchange between soil and the external environment, serves as a pivotal component in forest hydrological cycles [1]. Infiltration capacity not only directly reflects soil water conservation potential but also indirectly influences the utilization efficiency of soil water resources [2] and regulates the growth dynamics of forest communities [3]. Significant variations in root traits and soil physicochemical properties across different forest types may profoundly alter infiltration characteristics and subsequent hydrological processes [4,5,6,7]. Therefore, investigating soil water infiltration patterns and their driving mechanisms under distinct stand types is essential for evaluating regional hydrological cycling.
Soil physicochemical properties are key determinants of infiltration capacity [8,9]. During forest succession, improved soil properties enhance infiltration, whereas compacted soils with high bulk density hinder water exchange [10]. Non-capillary porosity [11]—including macropores formed by soil fauna (e.g., earthworms), decayed root channels, and cracks from shrink–swell clays [12]—and root–soil interactions mediated by soil organic matter critically regulate infiltration and water movement [6,13]. Soil texture, defined by the proportional composition of sand, silt, and clay particles, fundamentally controls soil respiration and pedogenesis, with clay content exerting the strongest inhibitory effect on infiltration [14].
Plant roots further modulate infiltration through dual mechanisms [15,16]. First, roots directly or indirectly reshape soil pore architecture (size, distribution, and connectivity), where coarse roots promote macropore formation while fine roots enhance pore spatial heterogeneity [17]. Second, root exudates alter soil organic carbon, aggregate stability, and microbial activity, thereby modifying soil permeability [18]. Variations in root morphological traits—including biomass, length density, surface area, and volume density—drive spatial heterogeneity in infiltration capacity across plant species [19]. However, debates persist regarding the role of root diameter: fine roots (<1 mm) may enhance infiltration by increasing microporosity [20], whereas both fine (<1 mm) and coarse roots (>2 mm) could suppress permeability through pore occlusion [21]. Current studies predominantly focus on isolated effects of root traits or soil properties on infiltration, leaving coupled mechanisms underexplored—a critical knowledge gap limiting the holistic understanding of infiltration processes.
In this study, we hypothesize that distinct root–soil interactions across forest types drive divergent infiltration patterns. Our objectives are to (1) quantify variations in root traits and soil physicochemical properties among three subtropical stands (pure Phyllostachys edulis forest, mixed Phyllostachys edulis-Cunninghamia lanceolata forest, and pure Cunninghamia lanceolata forest); (2) characterize their soil water infiltration dynamics; and (3) elucidate synergistic mechanisms by which roots and soil properties jointly regulate infiltration capacity.

2. Materials and Methods
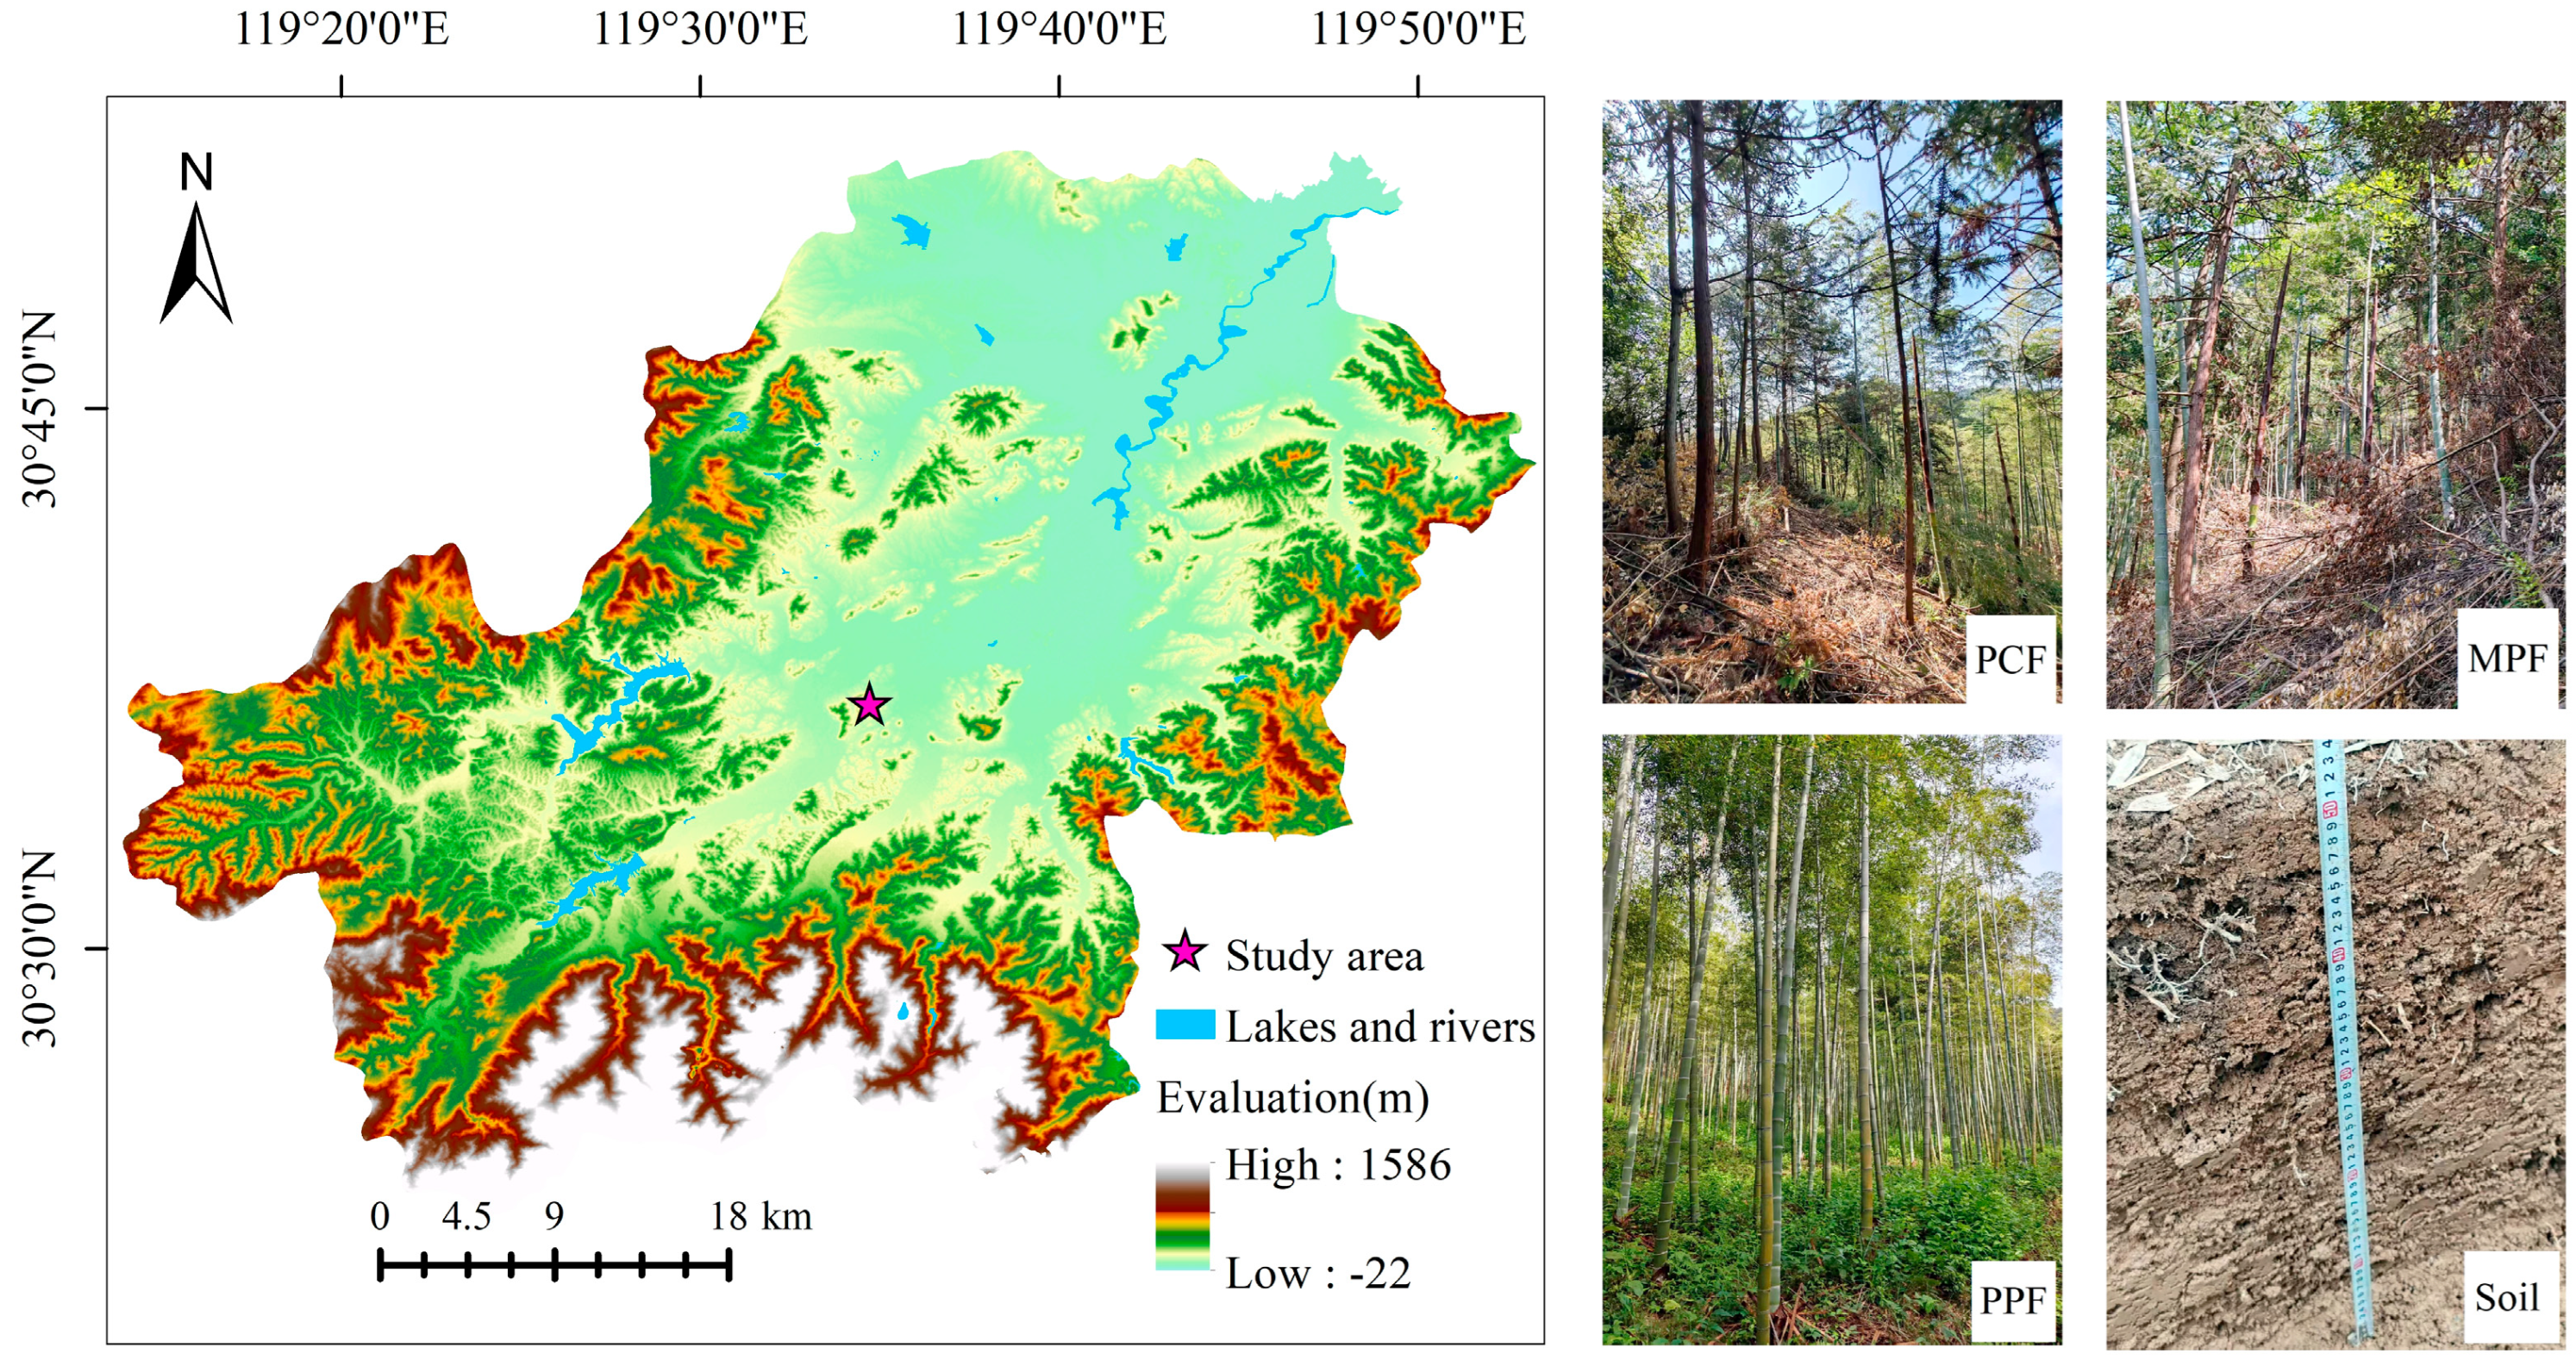
2.1. Study Area

The study was conducted in the Soil and Water Conservation Demonstration Park (30°36′ N, 119°35′ E) located in Anji County, Huzhou City, Zhejiang Province, China (Figure 1). This region experiences a typical subtropical maritime monsoon climate characterized by four distinct seasons, with approximately 70% of the annual precipitation (1400 mm) concentrated between May and August. The mean annual temperature is 16.6 °C. The area is recognized as the “Bamboo Town of China” and the birthplace of the ecological development concept “lucid waters and lush mountains are invaluable assets”. The basic soil characteristics of the study area are summarized in Table 1. The soils are classified as Yellow-Brown Earth (Hapludalfs according to USDA Taxonomy), corresponding to Acrisols in the FAO classification system, with a solum thickness ranging from 40 to 60 cm. The understory is densely covered with shrubs and herbs, dominated by three vegetation types: pure Cunninghamia lanceolata forest, pure Phyllostachys edulis forest, and mixed Cunninghamia lanceolata-Phyllostachys edulis forest.

2.2. Experimental Design

2.2.1. Plot Establishment

Three stand types were investigated: (1) mixed Phyllostachys edulis−Cunninghamia lanceolata forest (MPF), (2) pure Phyllostachys edulis (moso bamboo) forest (PPF), and (3) pure Cunninghamia lanceolata (Chinese fir) forest (PCF). Stand composition criteria were strictly defined:
PPF: >90% bamboo coverage with minimal fir presence;
MPF: Approximately 1:1 bamboo–fir mixture ratio [22];
PCF: <10% bamboo content with dominant fir coverage.
Three typical forest stand types with similar site conditions—pure Phyllostachys edulis (moso bamboo) forest (PPF), mixed Phyllostachys edulis–Cunninghamia lanceolata forest (MPF), and pure Cunninghamia lanceolata (Chinese fir) forest (PCF)—were selected as study objects (see Table 1 for stand characteristics). Within each stand type, two 20 m × 20 m standard plots were randomly established. Five 1 m × 1 m soil infiltration measurement points were systematically positioned at each plot using a stratified random sampling design.

2.2.2. Soil Infiltration Measurements

Field measurements were conducted in May 2024. Prior to formal experiments, gravimetric soil moisture content was determined through soil sampling across forest types, with all measurement points showing no significant differences (p > 0.05) in moisture levels (Table 2). At selected sites, surface debris including litter and extraneous materials was removed. A double-ring infiltrometer (inner ring: 30 cm diameter; outer ring: 60 cm diameter) [23] was vertically installed 3 cm below the soil surface following standard protocols. To establish vertical unidirectional flow, 4 g L−1 Brilliant Blue FCF solution (inner ring) and deionized water (outer ring) were simultaneously maintained at 4 cm constant head levels, effectively minimizing lateral seepage artifacts [24]. The time required for each 0.5 cm hydraulic head decline in the inner ring was recorded. When the head dropped to 1 cm, the solution was replenished to the 4 cm baseline. The test continued until achieving steady-state infiltration, defined by (a) cumulative infiltration depth ≥ 4 cm and (b) invariant time intervals between consecutive 0.5 cm head drops during at least three successive measurements.

2.2.3. Soil Sampling and Root Analysis

Soil properties including initial water content (W), bulk density (BD), total porosity (TCP), and non-capillary porosity (NCP) were determined using the core cutter method. Soil particle size distribution was analyzed following the Chinese national standard (GB/T 19077-2016).
A vertical soil profile was excavated along the diameter of the inner infiltration ring. Undisturbed soil samples were collected from six depth layers (0–10 cm, 10–20 cm, 20–30 cm, 30–40 cm, 40–50 cm, and 50–60 cm) at an adjacent profile unaffected by infiltration. Each layer includes cutting ring samples (100 cm3 in volume) and bulk soil samples (intact soil of 3534.3 cm3 in volume).
Roots were manually separated and trimmed from bulk soil samples and categorized into three diameter classes: 0–1 mm, 1–2 mm, and >2 mm. Subsequently, the morphological parameters (length, surface area, and volume) of roots from different diameter classes were quantified using the WinRHIZO Pro root scanning system. Following scanning, all root samples were air-dried at ambient temperature and then weighed to determine biomass.

2.3. Calculation Methods

(1)
Root Morphological Parameters
Root morphological indices included total root length (RL, cm), root surface area (RSA, cm2), and root volume (RV, cm3). Three density-based parameters were calculated as follows:
R L D = R L V
R S A D = R S A V
R V D = R V V
Here, R L D , R S A D and R V D represent root length density (cm per 100 cm3), root surface area density (cm2 per 100 cm3), and root volume density (cm3 per 100 cm3), respectively; R L , R S A , and R V denote total root length (cm), root surface area (cm2), and root volume (cm3) within the soil volume; and V is the total semi-cylindrical soil volume (3534.3 cm3 in this study).
(2)
Soil Infiltration Rate Calculation
The cumulative infiltration amount (CIA, mm) was defined as the total water depth infiltrated before reaching steady-state conditions. The soil infiltration rate was calculated as follows [25]:
i = I t × 600
Here, i is the infiltration rate (mm h−1); I is the water head decline (cm) in the inner ring during time interval t (minute); and 600 is the dimensionless conversion factor.

2.4. Data Processing and Analysis

Data were statistically analyzed using Excel 2016 (Microsoft Corp., Redmond, WA, USA) and SPSS 18.0 (IBM Corp., Armonk, NY, USA). One-way analysis of variance (ANOVA) and Duncan’s multiple comparison test (α = 0.05) were performed to assess differences among forest types. Pearson correlation analysis was conducted to examine relationships between root morphological characteristics and soil physicochemical properties. Principal component analysis was employed to identify key factors influencing soil infiltration capacity. Structural equation modeling (SEM) was implemented in R Studio 4.3.1 using the “lavaan” package (v0.6-16) to quantify direct and indirect effects of root traits and soil properties on infiltration, with model visualization generated by the “semPlot” package (v1.1.6). All data presented in figures and tables are expressed as means ± standard deviation (n = 5 measurement points per stand type).

3. Results

3.1. Soil Infiltration Characteristics Across Three Stand Types

Soil water infiltration characteristics of the three stand types are presented in Figure 2. The mean initial infiltration rate (IIR) ranged from 947.7 to 1220.5 mm·h−1, with the MPF showing significantly higher values than both pure stands (PPF, PCF) (Figure 2a).
For the stable infiltration rate (SIR), mean values varied between 272.0 and 369.0 mm·h−1, following the order PPF > MPF > PCF (Figure 2b). The average infiltration rate (AIR) exhibited a range of 373.1–498.2 mm·h−1, where both PPF and MPF demonstrated significantly higher rates than PCF (p < 0.05; Figure 2c). Cumulative infiltration amounts (CIAs) differed significantly among stands (p < 0.05), with means of 386–423 mm ranked as PPF > MPF > PCF (Figure 2d).

3.2. Soil Physicochemical Properties and Root Morphological Traits Across Stand Types

3.2.1. Soil Physicochemical Characteristics

As shown in Table 2, soil bulk density (BD), pH, clay, and silt contents generally increased with soil depth across all stands, while other properties decreased progressively.
The PPF exhibited significantly higher non-capillary porosity (NCP) and total porosity (TCP) in the 0–20 cm layer compared to other stands (p < 0.05). PPF also showed elevated soil total nitrogen (TN) and organic carbon (SOC) concentrations at 10–30 cm depths. Conversely, PPF demonstrated lower BD values in the 10–40 cm layer and reduced clay content throughout 0–40 cm profiles (p < 0.05). Sand and silt contents in PPF were marginally but significantly lower (p < 0.05) below 10 cm depth, while natural water content (W) showed minimal variation among stands.

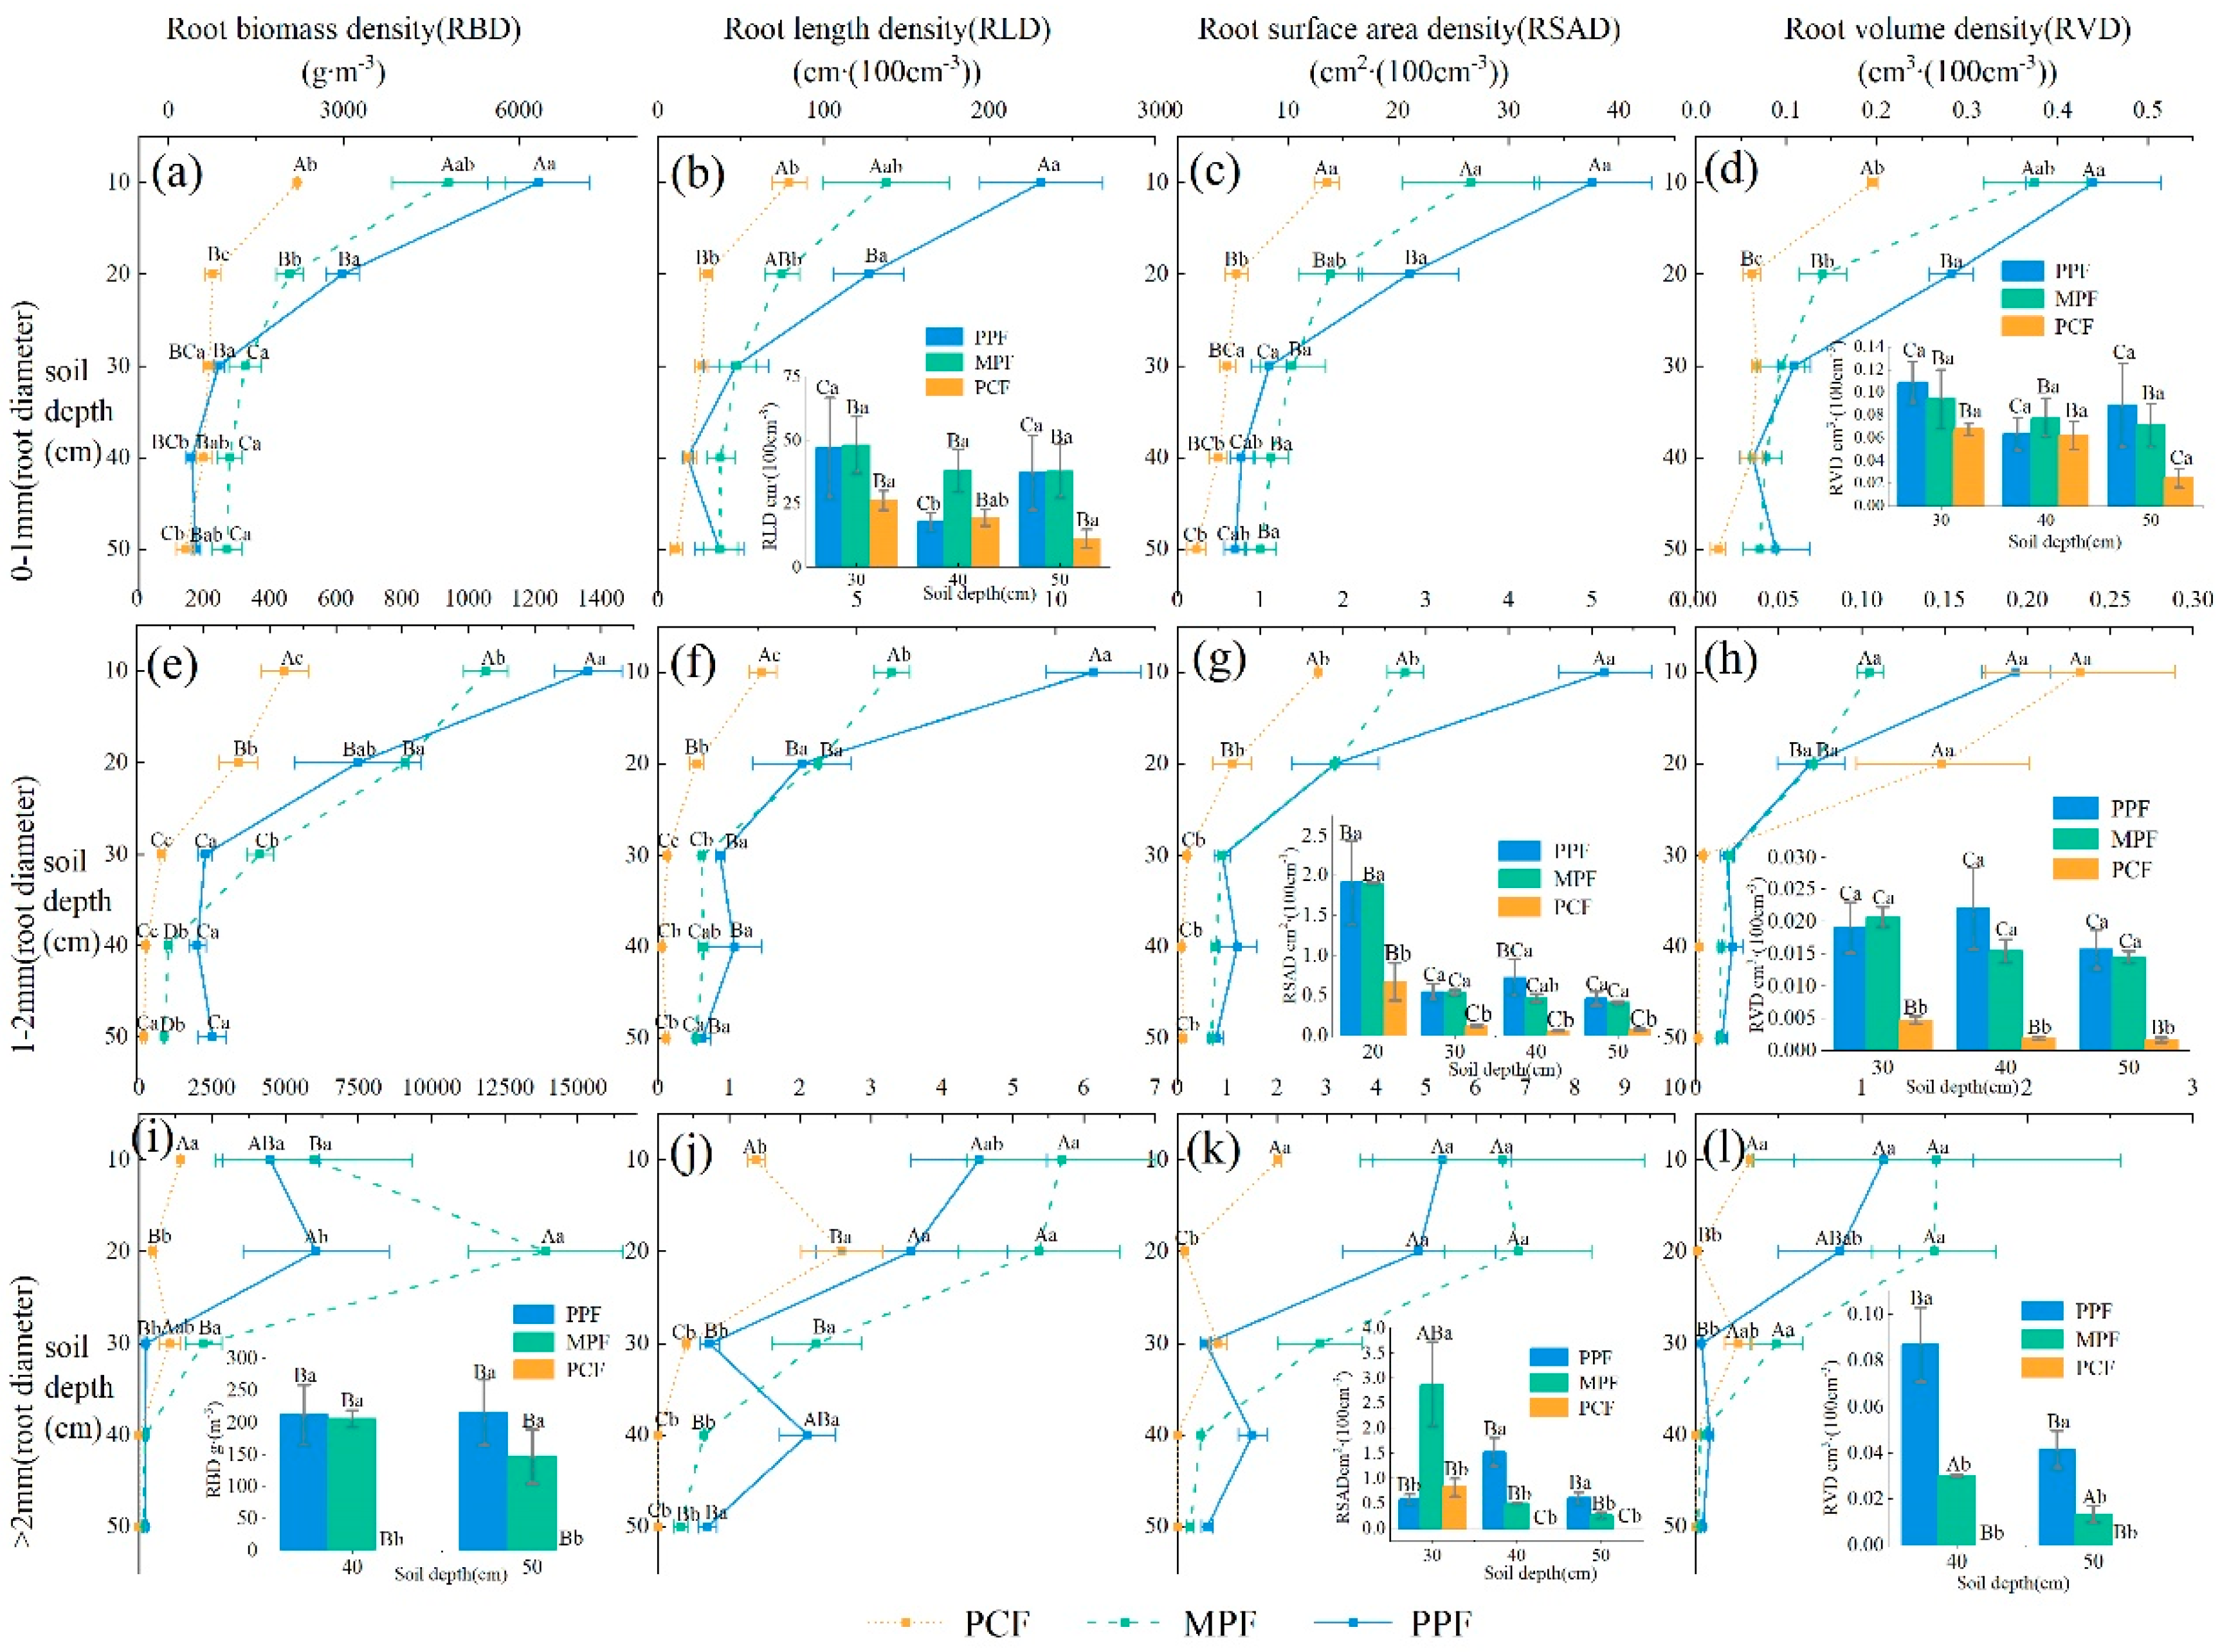
3.2.2. Root Traits Across Stand Types

Fine roots (<1 mm) dominated all soil layers across stands (Figure 3. For roots of 0–1 mm and 1–2 mm diameters, four morphological parameters (RBD, RLD, RSAD, and RVD) consistently followed the order pure Phyllostachys edulis stand (PPF) > mixed stand (MPF) > pure Cunninghamia lanceolata stand (PCF) throughout the profile (Figure 3a–h). In contrast, roots > 2 mm exhibited a distinct pattern: MPF > PPF > PCF (Figure 3i–l).
Significant inter-stand differences were primarily observed in fine-to-medium roots (<2 mm). Within the 0–20 cm layer, PPF demonstrated higher RBD, RLD, RSAD, and RVD of <2 mm roots compared to PCF, with MPF showing intermediate values (p < 0.05, Figure 3a–h). Below 20 cm depth, these parameters showed no statistical divergence among stands (p > 0.05). For coarse roots (>2 mm), morphological parameters across stand types exhibited the order MPF > PPF > PCF, though without statistical significance (p > 0.05, Figure 3i–l).

3.2.3. Relationships Between Soil Properties and Root Traits

Pearson correlation analysis demonstrated depth-specific relationships between soil properties and root traits (Table 3). In the 0–10 cm layer, fine root (<2 mm) morphological parameters—biomass density (RBD), root length density (RLD), surface area density (RSAD), and volume density (RVD)—showed significant correlations (p < 0.05) with soil bulk density (BD) and non-capillary porosity (NCP), while coarse root (>2 mm) traits exhibited no significant associations with soil properties. Within the 10–20 cm layer, BD and NCP were significantly correlated with RBD and RLD of fine roots (<2 mm) (p < 0.05), whereas NCP displayed significant positive correlations with RBD, RLD, and RVD of coarse roots (>2 mm) (p < 0.05). Notably, soil organic carbon (SOC) consistently correlated with all root metrics across both fine and coarse roots (p < 0.05).

3.3. Analysis of Influencing Factors on Soil Infiltration Rates

3.3.1. Principal Component Analysis

The principal component analysis (PCA) of soil properties yielded a loading matrix as presented in Table 4. Five principal components (PCs) with eigenvalues > 1 collectively accounted for 87.412% of the cumulative variance. In PC-1, high-loading parameters included BD and NCP, root traits of fine roots (RBD, RLD, and RSAD), and soil infiltration parameters (SIR, AIR, and CIA). BD exhibited negative correlations with all these factors, while positive correlations were observed among other parameters. PC-2 was predominantly characterized by soil TP, CP, silt content, and NCP, along with the IIR. Notably, The IIR showed a positive correlation with NCP but negative correlations with silt, TP, and CP. Similarly, PCs 3–5 primarily featured high loadings from soil clay content, SOC, W, and NCP, coupled with infiltration parameters IIR and AIR. Infiltration rates demonstrated positive correlations with these factors except for W. Collectively, the five PCs explained 87.412% of the total variance, revealing systematic relationships: soil BD, TP, CP, W, and silt content were negatively correlated with infiltration capacity, whereas root traits (RBD and RLD) and soil clay, NCP, and SOC showed positive correlations with infiltration.

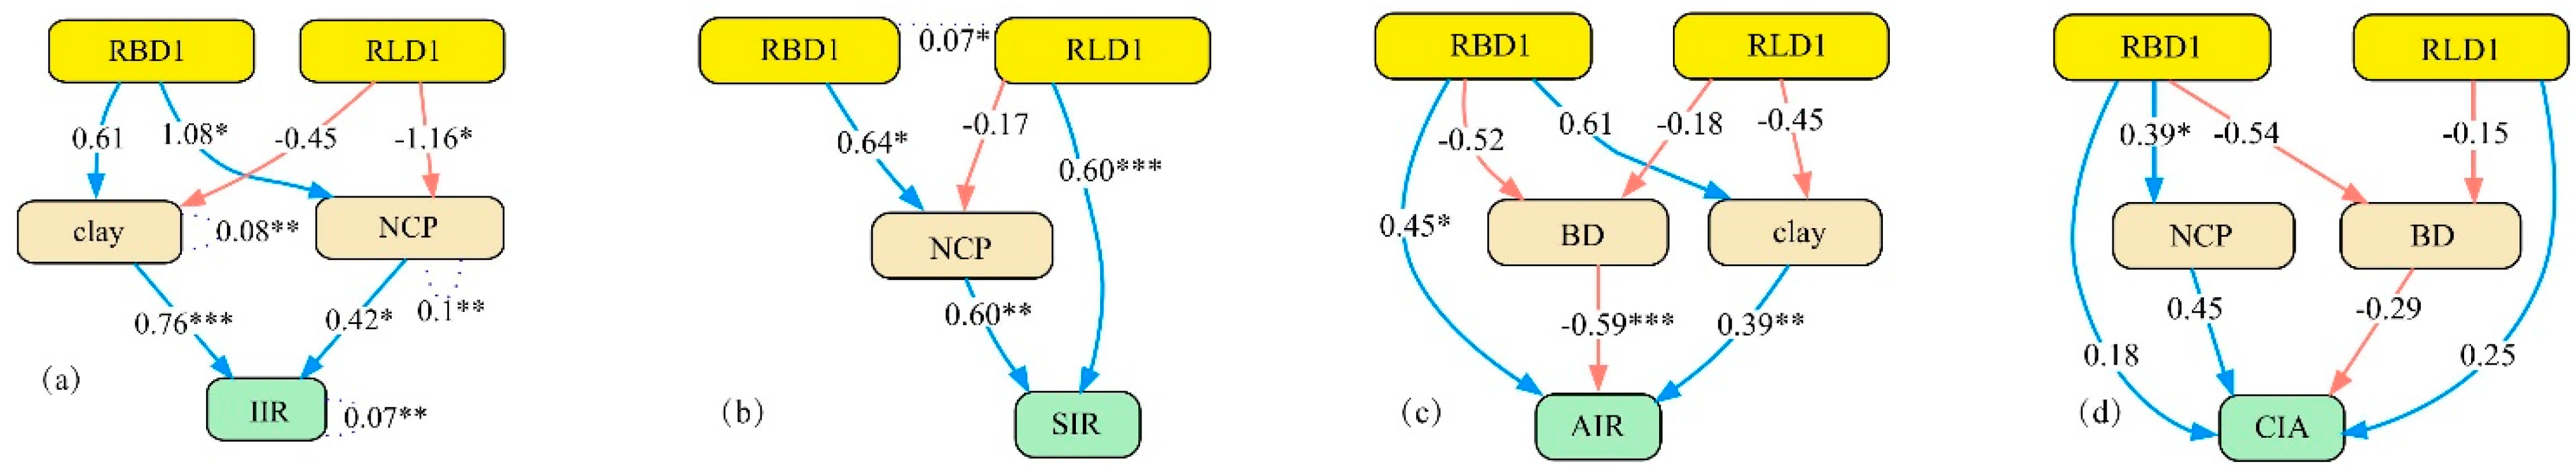
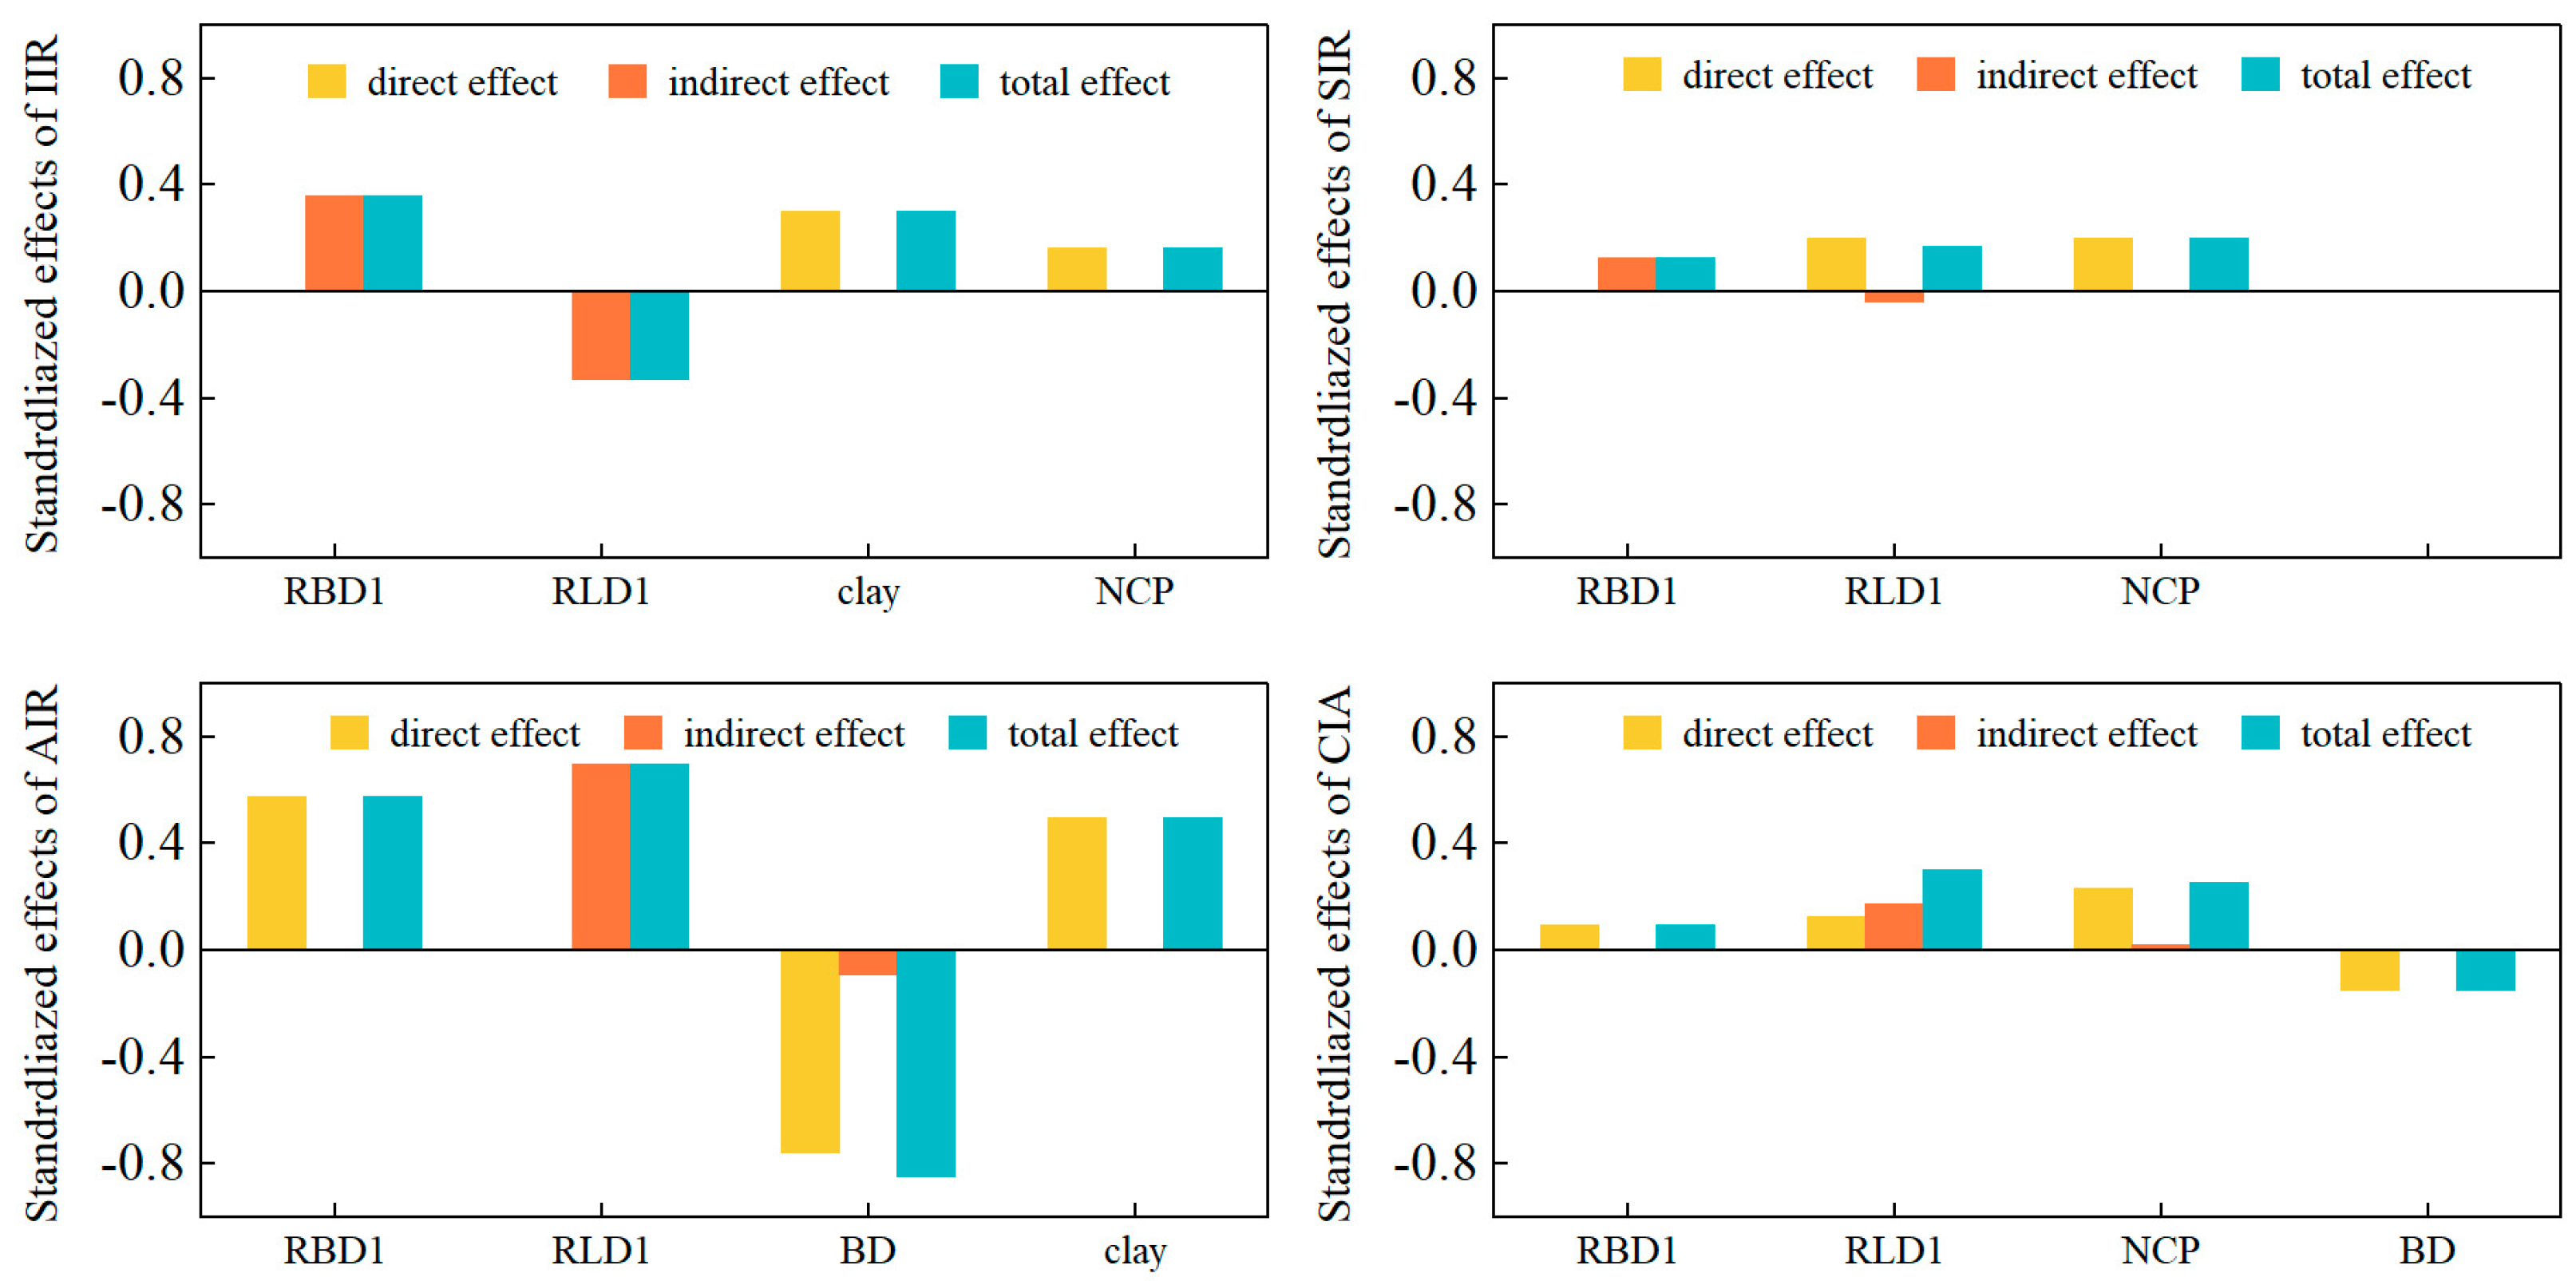
3.3.2. Structural Equation Model of the Infiltration Process

Considering the combined influence of soil properties and root traits on infiltration, we performed a path analysis of the infiltration process. The optimal structural equation model and its path coefficients are presented in Figure 4.
For the IIR, soil clay content and NCP exerted significant positive effects, with standardized path coefficients of 0.76 and 0.42, respectively. RBD and RLD showed no direct effects, yielding total effects of 0.362 and −0.327, respectively (Figure 5). Regarding the SIR, only soil NCP had a significant positive impact (standardized coefficient = 0.60). RBD again had no direct effect, whereas RLD exhibited a direct effect of 0.60; the total effects of RBD and RLD on the SIR were 0.13 and 0.168, respectively (Figure 5). For the AIR, BD negatively influenced infiltration (standardized coefficient = −0.59), while clay content was positively related (standardized coefficient = 0.39). RBD showed a direct positive effect of 0.45, and RLD had no direct effect; the resulting total effects were 0.577 for RBD and 0.698 for clay content (Figure 5). Finally, for the CIA, soil BD again had a negative effect (−0.29) and NCP a positive effect (0.45). Both RBD and RLD contributed direct effects of 0.18 and 0.25, respectively (Figure 5).

4. Discussion

4.1. Effects of Forest Types on Root Traits and Soil Properties

Our study revealed substantial differences in root characteristics (0–30 cm depth) among the three stand types, particularly in the PPF stand, which exhibited significantly higher fine root (<2 mm) RBD and RLD in the 0–20 cm layer compared to MPF and PCF stands. Root biomass serves as an indicator of root quantity, and root length density reflects the spatial distribution and entanglement of roots in the soil [3]. Because moso bamboo typically invades other stands through vigorous rhizome expansion [26], stands with a higher proportion of moso bamboo likely have a more abundant root system in terms of both number and spatial distribution. Research has reported that during the expansion of moso bamboo into evergreen broadleaf forests, it employs a high fine root turnover strategy, with fine root biomass and length being highest in PPF, intermediate in MPF, and lowest in evergreen broadleaf forests [27]. Fine roots (<2 mm) showed greater stand-type sensitivity than coarse roots (>2 mm), indicating stronger stand-type dependency of fine roots. These fine roots likely contribute substantially to SOC accumulation and aggregate formation via root exudates and microbial interactions [28,29]. For instance, Cai et al. [30] reported 7.03- and 1.57-fold increases in fine root biomass and RLD during bamboo expansion into fir forests, aligning with our findings on PPF’s root modification capacity.
The PPF stand demonstrated superior surface soil (0–20 cm) hydraulic properties, with 34.2% higher NCP and 8.4% lower BD than PCF (Figure 2), consistent with Chen et al.’s findings on soil BD and NCP changes during bamboo invasion into artificial oak forests [31]. The reduced BD in PPF surface soils can be attributed to the vigorous expansion of bamboo rhizomes, which enhance soil porosity and pore connectivity, creating larger and more numerous soil voids [32]. This mechanism aligns with our observation that PPF surface soils had significantly higher NCP than MPF and PCF (p < 0.05).
Regarding soil nutrients, PPF surface soils showed higher SOC and TN content, following the trend PPF > MPF > PCF. This contrasts with Bai et al.’s findings [33], potentially due to moso bamboo’s ability to increase surface root biomass, whose exudates stimulate microbial activity and SOC accumulation. In terms of soil texture, PPF surface soils had significantly higher clay content than PCF (p < 0.05), though clay remained less abundant than sand and silt fractions, consistent with Xie et al.’s observations in southern moso bamboo forests [34]. However, clay content decreased sharply in deeper PPF soil layers, differing significantly (p < 0.05) from the gradual vertical changes in MPF and PCF. This may result from the strong penetrating force of bamboo rhizomes, which disperse soil particles. Additionally, PPF’s understory species richness significantly increases [35], and the abundant herbaceous vegetation combined with bamboo’s rapid regeneration enhance litter input, thereby boosting surface carbon and nitrogen accumulation. Alternatively, rhizome turnover may replenish soil carbon and nitrogen pools, elevating total SOC and TN content [36].
Notably, fine root traits—including RBD and RLD—exhibit strong associations with SOC, BD, and NCP. The influence of root systems on soil texture and physicochemical properties has been extensively documented [37,38]. Specifically, the denser distribution of fine roots enhances soil aggregation efficiency [39]. During root growth, physical displacement of soil particles occurs, directly shaping the spatial configuration of NCP [40]. Mechanistically, fine roots reduce soil BD by increasing total porosity, as their lower density occupies soil voids and decreases overall soil compactness. Furthermore, root decomposition contributes substantial organic carbon inputs to soils [41], while the remnants of decayed roots create persistent macropores [42]. Ecologically, the development of fine root length correlates with stand site quality. The spatial distribution and morphological status of plant fine roots critically determine water/nutrient uptake efficiency, thereby exerting cascading effects on topsoil physicochemical characteristics [43].

4.2. Mechanisms of Soil Infiltration Regulation by Root–Soil Interactions

The decisive influence of root traits on soil infiltration has been widely acknowledged [44,45]. Root systems create preferential flow channels within the soil matrix, significantly enhancing water transport capacity [46]. Our results revealed significant correlations between fine root characteristics (<2 mm) and infiltration performance, consistent with Hao et al.’s findings that fine root biomass (<1 mm) enhances soil infiltration [20], but contrasting with Lu et al.’s conclusion that both fine (<1 mm) and coarse roots (>2 mm) inhibit infiltration. This discrepancy suggests that moso bamboo roots do not obstruct pore networks during water percolation. Specifically, fine root (<2 mm) RBD and RLD exerted significant positive effects on infiltration rates at all stages except the initial phase, diverging from Wang et al.’s observations in loess hilly-gully regions where coarse roots dominated infiltration enhancement [47]. In moso bamboo systems, coarse roots are subordinate in the root network, while fine roots substantially increase pore spatial heterogeneity and modify soil properties [18].
Although Zhang et al. found root surface area to be critical for SIR improvement in vegetation-restored loess soils [48], our study emphasized the importance of RBD and RLD. This distinction likely arises from the horizontally distributed, intricate fine root networks of moso bamboo, which enhance macropore formation and lateral pore connectivity—key drivers of preferential lateral flow [49].
Soil infiltration is a process transitioning from unsaturated to saturated conditions. In the unsaturated state, soil pores contain both water and air (where pores are not completely water-filled), and water movement is governed by both capillary and gravitational forces. The IIR represents average infiltration during the early stage of water entry and is a critical determinant of runoff generation at the onset of rainfall. As the soil progressively wets from dry to saturated conditions, soil moisture content and macroporosity emerge as key influencing factors [50,51]. In this study, the natural moisture content across sampling sites was consistent, with no significant differences (p < 0.05). Principal component analysis (PCA) confirmed the negative influence of soil moisture on the IIR, reinforcing its critical role. Notably, MPF exhibited the highest IIR, along with the lowest capillary porosity and the highest clay content (Table 2). Clay content had a stronger influence, suggesting it primarily drives the enhanced IIR in MPF. This aligns with previous findings that clay promotes the formation of large soil aggregates [52], enhancing their stability and thereby increasing infiltration rates [52,53]. Clay’s explanatory power for infiltration variation was significantly higher than that of sandy soils [54]. NCP was another key factor, serving as the primary pathway for rapid gravitational infiltration during early rainfall by overcoming capillary adsorption forces. The AIR reflects the overall infiltration process, including both initial infiltration and the transition to saturation. Results indicate that BD and clay content are its dominant controls. During soil saturation, compacted soils (high BD) impede water exchange [10]. The SIR represents the late-stage infiltration rate when the soil is fully saturated (pores are completely water-filled, as in groundwater layers). At this stage, water movement is primarily gravity-driven, occurring mainly through macropores, making NCP the decisive factor—almost the sole pathway for post-saturation percolation [14]. Furthermore, the CIA was predominantly governed by NCP, which played a pivotal role throughout the measured infiltration stages. NCP directly connects surface and subsurface soil layers, a well-established mechanism in infiltration dynamics [55]. Soil infiltration is interactively regulated by root characteristics and soil properties [56]. A substantial body of research attributes infiltration modification to root-mediated alterations in soil structure [57,58]. Our principal component analysis revealed that root traits (RBD and RLD), soil texture (particularly clay content), bulk density, and porosity exert critical control on infiltration processes. Structural equation modeling revealed that soil clay content and NCP directly enhanced infiltration, while BD directly suppressed it; RBD and RLD affected infiltration through both direct pathways and indirect mediation of soil properties, consistent with Cui et al.’s findings [59]. This aligns with reported mechanisms whereby RBD increases NCP in surface soils to enhance infiltration [60].
In summary, both PPF and MPF develop through the continuous expansion of their robust root systems. This represents an ongoing process of increasing both root quantity and quality, which consequently modifies the physical properties of surface soil, improves soil infiltration capacity, and ultimately contributes to more stable community development.

5. Conclusions

This study investigated soil infiltration characteristics and regulatory mechanisms in three typical subtropical forest stands. The results demonstrated the following: (1) Compared to PCF, PPF increased the IIR, SIR, and AIR by 6.66%, 35.63%, and 28.51%, respectively, whereas MPF enhanced these rates by 28.79%, 28.82%, and 33.51%. (2) Root–soil systems differed significantly among stand types. PPF and MPF developed higher fine root (<2 mm) RBD and RLD, along with greater soil porosity and lower bulk density than PCF. (3) Fine root (<2 mm) RBD and RLD regulated infiltration capacity through dual pathways: direct hydraulic effects and indirect modulation of soil properties (non-capillary porosity and bulk density). Structural equation modeling identified four dominant factors: fine root trait (RBD, RLD), clay content, non-capillary porosity, and bulk density.

Author Contributions

Conceptualization, Y.G. and S.Q.; methodology, Y.G., L.Z. and. T.Z.; software, Y.G. and C.W.; validation, Y.G., L.Z., S.Q. and G.C.; formal analysis, Y.G., L.Z., S.M., C.F. and T.Z.; investigation, Y.G., L.Z., S.M., C.F. and X.Z.; resources, Y.G., S.Q. and X.Z.; data curation, Y.G., L.Z. and X.Z.; writing—original draft preparation, Y.G., G.C., S.M. and C.W.; writing—review and editing, Y.G., S.Q., T.Z., C.W. and C.F.; visualization, Y.G. and S.Q.; supervision, S.Q.; project administration, S.Q.; funding acquisition, S.Q. All authors have read and agreed to the published version of the manuscript.

Funding

This work was sponsored by the National Natural Science Foundation of China (No. 32271964).

Data Availability Statement

Data is contained within the article.

Conflicts of Interest

Author Shuangshuang Ma was employed by the company Zhejiang Anji Nong Hi-Tech Group. The remaining authors declare that the research was conducted in the absence of any commercial or financial relationships that could be construed as a potential conflict of interest.

References

  1. Ren, Z.P.; Zhu, L.J.; Wang, B.; Chen, S.D. Soil hydraulic conductivity as affected by vegetation restoration age on the Loess Plateau, China. J. Arid Land 2016, 8, 546–557. [Google Scholar] [CrossRef]
  2. Li, J.B.; Zang, F.C.; Duan, C.X. Study on soil infiltration characteristics and water and nitrogen migration under magnetization irrigation of nitrogen fertilizer solution. Trans. Chin. Soc. Agric. Mach. 2022, 53, 316–324. (In Chinese) [Google Scholar]
  3. Liu, Y.; Guo, L.; Huang, Z.; Wu, G.L. Root morphological characteristics and soil water infiltration capacity in semi-arid artificial grassland soils. Agric. Water Manag. 2022, 235, 106153. [Google Scholar] [CrossRef]
  4. Qiu, D.X.; Xu, R.R.; Gao, P.; Mu, X.M. Effect of vegetation restoration type and topography on soil water storage and infiltration capacity in the Loess Plateau, China. CATENA 2024, 241, 108079. [Google Scholar] [CrossRef]
  5. Zhu, P.Z.; Zhang, G.H.; Wang, C.S.; Wang, C.S.; Chen, S.Q.; Wan, Y.Q. Variation in soil infiltration properties under different land use/cover in the black soil region of Northeast China. Int. Soil Water Conserv. Res. 2024, 12, 379–387. [Google Scholar] [CrossRef]
  6. Neris, C.; Jimenez, J.; Fuentes, J. Vegetation and land-use effects on soil properties and water infiltration of Andisols in Tenerife (Canary Islands, Spain). CATENA 2012, 98, 55–62. [Google Scholar] [CrossRef]
  7. Qiu, D.X.; Xu, R.R.; Wu, C.X.; Mu, X.M.; Zhao, G.J.; Gao, P. Effects of vegetation restoration on soil infiltrability and preferential flow in hilly gully areas of the Loess Plateau, China. CATENA 2023, 221, 106770. [Google Scholar] [CrossRef]
  8. Robinson, D.A.; Nemes, A.; Reinsch, S.; Radbourne, A.; Bentley, L.; Keith, A.M. Global meta-analysis of soil hydraulic properties on the same soils with differing land use. Sci. Total Environ. 2022, 852, 158506. [Google Scholar] [CrossRef]
  9. Basset, C.; Abou, N.M.; Ghezzehei, T.; Hao, X.X.; Daccache, A. How does soil structure affect water infiltration? A meta-data systematic review. Soil Tillage Res. 2023, 226, 105577. [Google Scholar] [CrossRef]
  10. Zhang, W.J.; Zhu, X.A.; Xiong, X.; Wu, T.; Zhou, S.D.; Lie, Z.Y.; Jiang, X.J.; Liu, J.X. Changes in soil infiltration and water flow paths: Insights from subtropical forest succession sequence. CATENA 2023, 221, 106748. [Google Scholar] [CrossRef]
  11. Peng, J.; Wu, Y.; Geng, T. Soil pore dynamics and infiltration characteristics as affected by cultivation duration for Mollisol in northeast China. Geoderma 2024, 449, 117021. [Google Scholar] [CrossRef]
  12. Horn, R. The Effect of Aggregation of Soils on Water, Gas, and Heat Transport. In Flux Control in Biological Systems; Academic Press: Cambridge, MA, USA, 1994; pp. 335–361. [Google Scholar]
  13. Huang, Z.; Tian, F.P.; Wu, G.L.; Liu, Y.; Dang, Z.Q. Legume Grasslands Promote Precipitation Infiltration better than Gramineous Grasslands in arid Regions. Land Degrad. Dev. 2017, 28, 309–316. [Google Scholar] [CrossRef]
  14. Wang, P.P.; Su, X.M.; Zhou, Z.C.; Wang, N.; Liu, J.; Zhu, B.B. Differential effects of soil texture and root traits on the spatial variability of soil infiltrability under natural revegetation in the Loess Plateau of China. CATENA 2023, 220, 106693. [Google Scholar] [CrossRef]
  15. Cui, Z.; Huang, Z.; Liu, Y.; López, V.M.; Wu, G.L. Natural compensation mechanism of soil water infiltration through decayed roots in semi-arid vegetation species. Sci. Total Environ. 2021, 819, 151985. [Google Scholar] [CrossRef]
  16. Shi, X.Q.; Qin, T.L.; Yan, D.H.; Tian, F.Q.; Wang, H. A meta-analysis on effects of root development on soil hydraulic properties. Geoderma 2021, 403, 115363. [Google Scholar] [CrossRef]
  17. Bodner, G.; Leitner, D.; Kaul, H.P. Coarse and fine root plants affect pore size distributions differently. Plant Soil 2014, 380, 133–151. [Google Scholar] [CrossRef]
  18. Gerke, H.H. Preferential flow descriptions for structured soils. Z. Pflanzenernähr. Bodenk 2006, 169, 382–400. [Google Scholar] [CrossRef]
  19. Jiang, X.J.; Liu, W.; Chen, C.; Liu, J.; Yuan, Z.Q.; Jin, B.; Yu, X. Effects of three morphometric features of roots on soil water flow behavior in three sites in China. Geoderma 2018, 320, 161–171. [Google Scholar] [CrossRef]
  20. Hao, H.X.; Wei, Y.J.; Cao, D.N.; Guo, Z.L.; Shi, Z.H. Vegetation restoration and fine roots promote soil infiltrability in heavy-textured soils. Soil Tillage Res. 2020, 198, 104542. [Google Scholar] [CrossRef]
  21. Lu, C.; Wang, F.; Lin, Y.Y.; Long, Q.; Zhao, Y.L.; Han, J.Q.; Ge, W.Y.; Chen, H. Changes in preferential flow caused by root effects in black locust plantations of different stand ages in the semi-arid region of the Loess Plateau. J. Hydrol. 2024, 634, 131086. [Google Scholar]
  22. Li, Y.C.; Liang, X.; Tang, C.X. Moso bamboo invasion into broadleaf forests is associated with greater abundance and activity of soil autotrophic bacteria. Plant Soil 2018, 428, 163–177. [Google Scholar] [CrossRef]
  23. Liu, L.; Gudmundsson, L.; Hauser, M.; Qin, D.; Seneviratne, S.I. Soil moisture dominates dryness stress on ecosystem production globally. Nat. Commun. 2020, 11, 4892. [Google Scholar] [CrossRef]
  24. Bouwer, H. Intake Rate: Cylinder Infiltrometer. In Methods of Soil Analysis; Klute, A., Ed.; Wiley: Hoboken, NJ, USA, 1986. [Google Scholar]
  25. Zhang, Y.; Niu, J.; Zhang, M.; Xiao, Z.X.; Zhu, W.L. Interaction Between Plant Roots and Soil Water Flow in Response to Preferential Flow Paths in Northern China. Land Degrad. Dev. 2017, 28, 648–663. [Google Scholar] [CrossRef]
  26. Xu, Q.F.; Liang, C.F.; Chen, J.H.; Li, Y.C.; Qin, H.Q. Rapid bamboo invasion (expansion) and its effects on biodiversity and soil processes. Glob. Ecol. Conserv. 2020, 21, e00787. [Google Scholar] [CrossRef]
  27. Liu, J.; Yang, Q.P.; Song, Q.N.; Yu, D.K. Strategy of fine root expansion of Phyllostachys pubescens population into evergreen broad- leaved forest. Chin. J. Plant Ecol. 2013, 37, 230–238. (In Chinese) [Google Scholar] [CrossRef]
  28. Liu, J.; Yang, Q.P.; Yu, D.K.; Yang, G.Y.; Qi, H.Y.; Shi, J.M. Contribution of fine root to soil nutrient heterogeneity at two sides of the bamboo and broad-leaved forest interface: Contribution of fine root to soil nutrient heterogeneity at two sides of the bamboo and broad-leaved forest interface. Chin. J. Plant Ecol. 2014, 37, 739–749. [Google Scholar] [CrossRef]
  29. Ni, H.J.; Su, W.H. Spatial distribution of fine root traits in relation to soil properties and aggregate stability of intensively managed Moso bamboo (Phyllostachys edulis) plantations in subtropical China. Plant Soil 2024, 498, 487–503. [Google Scholar] [CrossRef]
  30. Cai, C.J.; Fan, S.H.; Liu, X.Z. Fine root adaptation strategies during the expansion of moso bamboo to Chinese fir forest. Chin. J. Ecol. 2019, 38, 967–972. (In Chinese) [Google Scholar]
  31. Chen, J.Y.; Zhu, Z.Y.; Hu, H.B.; Luo, Z.X.; Yang, X.Y.; Jia, X.C.; Fang, P.; Mansour, L. Soil quality assessment of oak forests invaded by moso bamboo (Phyllostachys edulis) in the northern subtropics. Glob. Ecol. Conserv. 2024, 51, e02945. [Google Scholar] [CrossRef]
  32. Song, Q.N.; Yang, Q.P.; Liu, J. Effects of bamboo expansion on soil nitrogen mineralization and availability in evergreen broad-leaved forest. Chin. J. Appl. Ecol. 2013, 24, 338–344. (In Chinese) [Google Scholar]
  33. Bai, S.; Conant, R.T.; Zhou, G.; Wang, Y.; Wang, N.; Li, Y.; Zhang, K. Effects of Moso bamboo encroachment into native, broad-leaved forests on soil carbon and nitrogen pools. Sci. Rep. 2016, 6, 31480. [Google Scholar] [CrossRef]
  34. Xie, Y.Y.; Guo, Z.W.; Lin, S.Y.; Zuo, K.Y.; Yang, L.T.; Xu, S.; Gu, S.; Chen, S.L. Soil particle composition and water infiltration characteristics during the succession of understory vegetation in Moso bamboo forest. J. Nanjing For. Univ. (Nat. Sci. Ed.) 2024, 48, 108–116. (In Chinese) [Google Scholar]
  35. Xu, D.W.; Liu, J.F.; He, Z.S. Community species diversity characteristics of Phyllostachys heterocycla after expansion into Cunninghamia lanceolata forest. J. For. Environ. 2019, 39, 37–41. (In Chinese) [Google Scholar]
  36. Wu, J.S.; Jiang, P.K.; Wang, Z.L. Effects of bamboo expansion on soil fertility in Tianmu Mountain National Nature Reserve. Acta Agric. Univ. Jiangxiensis 2008, 689–692. (In Chinese) [Google Scholar]
  37. Alameda, D.; Villar, R. Linking root traits to plant physiology and growth in Fraxinus angustifolia Vahl. seedlings under soil compaction conditions. Environ. Exp. Bot. 2012, 79, 49–57. [Google Scholar] [CrossRef]
  38. Ali, H.E.; Reineking, B.; Münkemüller, T. Effects of plant functional traits on soil stability: Intraspecific variability matters. Plant Soil 2017, 411, 359–375. [Google Scholar] [CrossRef]
  39. Loades, K.W.; Bengough, A.G.; Bransby, M.F.; Hallett, P.D. Planting density influence on fibrous root reinforcement of soils. Ecol. Eng. 2010, 36, 276–284. [Google Scholar] [CrossRef]
  40. Gyssels, G.; Poesen, J.; Bochet, E.; Li, Y. Impact of plant roots on the resistance of soils to erosion by water: A review. Prog. Phys. Geogr. 2005, 29, 189–217. [Google Scholar] [CrossRef]
  41. Redelstein, R.; Dinter, T.; Hertel, D.; Leuschner, C. Effects of Inundation, Nutrient Availability and Plant Species Diversity on Fine Root Mass and Morphology Across a Saltmarsh Flooding Gradient. Front. Plant Sci. 2018, 9, 98. [Google Scholar] [CrossRef]
  42. Qu, Y.; Wu, Q.; Khan, F.U.; Wang, J.F.; Ren, X.Z.; Chai, X.H.; Xu, X.X.; Du, F. The impact of root systems on soil macropore abundance and soil infiltration capacity. Plant Soil 2025. [Google Scholar] [CrossRef]
  43. Gould, I.J.; Quinton, J.N.; Weigelt, A.; Gerlinde, B.D.D.; Bardgett, R.D. Plant diversity and root traits benefit physical properties key to soil function in grasslands. Ecol. Lett. 2016, 19, 1140–1149. [Google Scholar] [CrossRef]
  44. Wu, G.L.; Liu, Y.; Yang, Z.; Cui, Z.; Deng, L.; Chang, X.F.; Shi, Z.H. Root channels to indicate the increase in soil matrix water infiltration capacity of arid reclaimed mine soils. J. Hydrol. 2017, 546, 133–139. [Google Scholar] [CrossRef]
  45. Bogner, C.; Gaul, D.; Kolb, A.; Schmiedinger, I.; Huwe, B. Investigating flow mechanisms in a forest soil by mixed-effects modelling. Eur. J. Soil Sci. 2010, 61, 1079–1090. [Google Scholar] [CrossRef]
  46. Peter, G.; Benjamin, L.; Peter, L. Preferential Flow Dynamics and Plant Rooting Systems. In Hydropedology: Synergistic Integration of Soil Science and Hydrology; Academic Press: Cambridge, MA, USA, 2012; pp. 121–141. [Google Scholar]
  47. Wang, P.P.; Liu, Q.; Zhou, Z.C.; Liu, J.; Cao, L.G.; Wang, N.; Cao, Y.Y. Distinct variations of soil infiltrability of contrasting root types in a temperate mosaic-pattern grassland in northern China. CATENA 2024, 243, 108174. (In Chinese) [Google Scholar] [CrossRef]
  48. Zhang, S.Y.; Zhao, G.J.; Fan, J.J.; Yang, M.Y.; Tian, P.; Mu, X.M.; Geng, R. Variations of soil infiltration in response to vegetation restoration and its influencing factors on the Loess Plateau. Environ. Manag. 2024, 372, 123356. [Google Scholar] [CrossRef]
  49. Huang, Y.; Xiong, T.; Zhao, M.Q.; Deng, Y.S.; Yang, G.R.; Ban, Y.Y.; Lei, T.W.; Yu, X.X.; Huang, Y.H. Influence of soil properties and near-surface roots on soil infiltration process in short-rotation eucalyptus plantations in southern subtropical China. CATENA 2024, 234, 107606. [Google Scholar] [CrossRef]
  50. Zhang, H.J.; Fu, X.; Ma, S.W. Soil root distribution and water infiltration characteristics of different crop farmlands in Simian Mountain, Chongqing. Sci. Soil Water Conserv. 2023, 21, 137–144. (In Chinese) [Google Scholar]
  51. Assouline, S. Infiltration into soils: Conceptual approaches and solutions. Water Resour. Res. 2013, 49, 1755–1772. [Google Scholar] [CrossRef]
  52. Schweizer, S.A.; Bucka, F.; Graf-Rosenfellner, M.; Knabner, I.K. Soil microaggregate size composition and organic matter distribution as affected by clay content. Geoderma 2019, 355, 113901. [Google Scholar] [CrossRef]
  53. Zhao, Y.G.; Wu, P.T.; Zhao, S.W.; Feng, H. Variation of soil infiltrability across a 79-year chronosequence of naturally restored grassland on the Loess Plateau, China. J. Hydrol. 2013, 504, 94–103. [Google Scholar] [CrossRef]
  54. Lozano-Baez, S.E.; Cooper, M.; Meli, P. Land restoration by tree planting in the tropics and subtropics improves soil infiltration, but some critical gaps still hinder conclusive results. For. Ecol. Manag. 2019, 444, 89–95. [Google Scholar] [CrossRef]
  55. Wu, G.L.; Yang, Z.; Cui, Z.; Liu, Y..; Fang, N.-F.; Shi, Z.-H. Mixed artificial grasslands with more roots improved mine soil infiltration capacity. J. Hydrol. 2016, 535, 54–60. [Google Scholar] [CrossRef]
  56. Zhang, S.Y.; Liu, Y.H.; Yang, M.Y.; Tian, P.; Mu, X.M.; Zhao, G.J. Impact of vegetation restoration on preferential flow and soil infiltration capacity in the hilly region of the Loess Plateau. J. Hydrol. Reg. Stud. 2025, 59, 102333. [Google Scholar] [CrossRef]
  57. Angers, D.A.; Caron, J. Plant-induced Changes in Soil Structure: Processes and Feedbacks. Biogeochemistry 1998, 42, 55–72. [Google Scholar] [CrossRef]
  58. Yu, M.; Zhang, L.; Xu, X.; Wang, Y.; Liu, W.; Schwarzel, K. Impact of land-use changes on soil hydraulic properties of Calcaric Regosols on the Loess Plateau, NW China. Plant Nutr. Soil Sci. 2015, 178, 486–498. [Google Scholar] [CrossRef]
  59. Cui, Z.; Wu, G.L.; Huang, Z.; Liu, Y. Fine roots determine soil infiltration potential than soil water content in semi-arid grassland soils. J. Hydrol. 2019, 578, 124023. [Google Scholar] [CrossRef]
  60. Wang, H.; Zhu, X.; Zakari, S.; Chen, C.; Liu, W.; Jiang, X.-J. Assessing the Effects of Plant Roots on Soil Water Infiltration Using Dyes and Hydrus-1D. Forests 2022, 13, 1095. [Google Scholar] [CrossRef]
Figure 1. Overview of the study area and sampling site.
Water 17 01720 g001
Figure 2. Infiltration index characteristics of different stand. PPF, pure Phyllostachys edulis (moso bamboo) forest; MPF, mixed Phyllostachys edulis-Cunninghamia lanceolata forest; PCF, pure Cunninghamia lanceolata (Chinese fir) forest. Different lowercase letters indicate significant differences.
Water 17 01720 g002
Figure 3. Differentiation of root traits by diameter class among three forest types in 0–50 cm soil layers. Different uppercase letters indicate vertical significant differences among the different soil depth within the same forest stand type at a significance level of p < 0.05 (Duncan’s multiple comparison test). Different lowercase letters indicate significant differences among the forest types within the same soil depth at a significant level of p < 0.05.
Water 17 01720 g003
Figure 4. Effects of soil physicochemical properties and root characteristics on IIR (a), SIR (b), AIR (c), CIA (d). * means significant effects (p < 0.05), ** means extremely significant effects (p < 0.01), *** means extremely significant effects (p < 0.001).
Water 17 01720 g004
Figure 5. Standardized impact effect.
Water 17 01720 g005
Table 1. Basic information of the plot.
StandAltitudeSlope (°)Aspect of SlopePlant DensityMean Tree Height (m)Mean DBH (cm)Canopy Density
PPF7310°West210016120.75
MPF7510°South-west135012100.85
PCF7610°South-west92510100.6
Table 2. Soil physical and chemical properties (mean ± SD) of different stand and at a depth of 0–40 cm.
Soil Depth
(cm)
Forest TypesWBD
(g∙(100 cm−3))
TP
(%)
CP
(%)
NCP
(%)
SOC
(g∙kg−1)
pHTN
(g∙kg−1)
Sandy
(%)
Silty
(%)
Clay
(%)
0–10PPF0.23 ± 0.01 a1.11 ± 0.08 a49.11 ± 3.47 a38.64 ± 2.25 a10.47 ± 2.02 a29.02 ± 4.05 a4.91 ± 0.37 a2.46 ± 0.28 a69 ± 4.21 a19.94 ± 2.8 a11.07 ± 1.85 ab
MPF0.22 ± 0.01 a1.19 ± 0.03 a42.82 ± 4.71 b21.32 ± 14.25b8.72 ± 0.99 ab22.54 ± 2.03 a4.44 ± 0.46 ab1.71 ± 0.31 a65.03 ± 6.43 a21.29 ± 6.18 a13.69 ± 2.86 a
PCF0.22 ± 0.01 a1.2 ± 0.05 a48.12 ± 3.26 ab40.78 ± 4.05 a7.34 ± 0.83 b28.22 ± 15.21 a4.28 ± 0.1 b1.64 ± 0.78 a69.66 ± 2.69 a20.47 ± 2.82 a9.88 ± 0.83 b
10–20PPF0.21 ±
0.02 a
1.28 ± 0.06 b42.43 ± 2.15 a35 ±
1.25 a
7.43 ±
1.03 a
17.7 ±
3.4 a
4.78 ±
0.1 a
1.32 ±
0.32 a
62.81 ±
11.5 a
23.31 ± 11.8 a13.88 ±
2.08 a
MPF0.2 ±
0.01 a
1.41 ± 0.06 b44.04 ± 5.54 a37.66 ± 5.63b6.38 ±
0.09 b
13.77 ± 3.35 a4.75 ±
0.18 a
0.91 ±
0.21 a
64.73 ±
2.55 a
23.34 ± 2.15b11.92 ±
3.54 b
PCF0.22 ±
0.01 a
1.46 ± 0.02 a44.79 ± 2.09 a38.89 ± 2.03 a5.9 ±
0.06 c
12.79 ± 0.6 b4.96 ±
0.23 a
0.84 ±
0.04 b
62.57 ± 3 b26.41 ± 4.64 ab11.03 ±
2.04 b
20–30PPF0.2 ±
0.02 a
1.27 ± 0.01 b39.89 ± 4.1 a31.87 ± 2.97 a5.82 ±
1.87 a
11.19 ± 1.32 a5.17 ±
0.27 a
0.9 ±
0.25 a
56.91 ±
8.27 a
31.52 ± 6.78 a11.57 ±
3.44 a
MPF0.19 ±
0 a
1.33 ± 0.02 b39.63 ± 2.84 a27.95 ± 11.2 b7.27 ±
0.8 b
11.08 ± 1.76 a5.2 ±
0.18 b
0.77 ±
0.19 b
60.81 ±
6.69 b
26.25 ± 8.54 b12.94 ±
2.12 b
PCF0.21 ±
0 a
1.47 ± 0.1 a44.19 ± 3.27 a37.52 ± 3.3 ab6.66 ±
0.11 b
8.42 ±
4.51 a
5.2 ±
0.1 b
0.62 ±
0.21 b
59.62 ±
5.02 b
26.47 ± 5.42 b13.92 ±
0.83 b
30–40PPF0.19 ±
0.02 a
1.37 ± 0.03 a42.14 ± 3.29 a37.59 ± 3.36 a4.56 ±
0.7 a
7.35 ±
1.55 a
5.43 ±
0.34 a
0.53 ±
0.09 a
40.89 ±
7.81 a
49.3 ±
3.52 a
9.81 ±
4.83 a
MPF0.18 ±
0.01b
1.39 ± 0.02 b36.46 ± 2.71 a31.03 ± 2.42 ab5.43 ±
0.43 b
6.68 ±
1.12 b
5.24 ±
0.3 a
0.48 ±
0.07 a
44.05 ±
10.68 ab
40.37 ± 10.56 b15.58 ±
1.2 b
PCF0.2 ±
0.01 a
1.45 ± 0.01 a39.69 ± 2.92 b34.43 ± 2.83 b5.26 ±
0.48 c
7.65 ±
0.74 ab
5.49 ±
0.18 a
0.57 ±
0.07 a
50.09 ±
1.06 b
38.04 ± 2 b11.87 ±
2.1 b
Notes: W, natural water content; BD, soil bulk density; TP, soil total porosity; CP, soil capillary porosity; NCP, soil non capillary porosity; SOC, soil organic carbon; TN, soil nitrogen content; Sandy, soil sand content; Silty, soil silt content; clay, soil clay content—the same as below. Different lowercase letters indicate significant differences among the forest types within the same soil depth at a significant level of p < 0.05.
Table 3. Correlation between soil physicochemical properties and root traits.
Soil Depth
(cm)
Root TraitsSoil Physical IndexSoil Chemical IndexSoil Texture
WBD
(g∙(100 cm−3))
TP
(%)
CP
(%)
NCP
(%)
SOC
(g∙kg−1)
pHTN
(g∙kg−1)
Sandy
(%)
Silty
(%)
Clay
(%)
0–10 cmRBD (<2 mm)0.249−0.713 **0.0720.1040.626 *0.0280.568 *0.398−0.1350.1090.087
RLD (<2 mm)0.196−0.841 **0.1850.2840.671 **0.0740.601 *0.392−0.0830.101−0.003
RSAD (<2 mm)0.144−0.734 **0.1970.2190.734 **0.0650.4680.37−0.1440.1340.064
RVD (<2 mm)0.178−0.818 **0.0020.1890.616 *−0.2590.4130.0160.0650.019−0.162
RBD (>2 mm)0.101−0.067−0.275−0.0170.204−0.117−0.049−0.037−0.022−0.1780.339
RLD (>2 mm)0.116−0.358−0.297−0.190.475−0.1610.114−0.003−0.083−0.080.299
RSAD (>2 mm)0.115−0.182−0.261−0.0230.296−0.1220.003−0.026−0.029−0.1470.301
RVD (>2 mm)0.108−0.04−0.2470.0440.149−0.104−0.053−0.032−0.008−0.1820.318
10–20 cmRBD (<2 mm)−0.209−0.610 *0.110.0680.0750.656 **0.0520.547 *−0.3290.2880.247
RLD (<2 mm)0.035−0.563 *0.1360.173−0.1910.646 **0.1680.556 *−0.4570.4120.309
RSAD (<2 mm)−0.22−0.4960.0820.040.0910.650 **−0.0880.5−0.1740.0930.305
RVD (<2 mm)−0.099−0.1360.527 *0.517 *−0.2420.2480.3010.22−0.3360.2960.248
RBD (>2 mm)−0.301−0.283−0.232−0.4040.669 **0.611 *−0.2030.30.29−0.263−0.193
RLD (>2 mm)−0.084−0.05−0.124−0.2720.536 *0.527 *−0.2070.1310.25−0.2−0.242
RSAD (>2 mm)−0.259−0.364−0.101−0.2370.4860.653 **−0.1290.3850.072−0.067−0.045
RVD (>2 mm)−0.246−0.279−0.123−0.2690.530 *0.642 **−0.1560.3350.154−0.14−0.101
20–30 cmRBD (<2 mm)−0.273−0.075−0.113−0.2340.2220.127−0.0190.1230.509−0.4550.205
RLD (<2 mm)−0.052−0.1580.3950.1310.3180.229−0.2180.3440.345−0.236−0.067
RSAD (<2 mm)−0.146−0.197−0.136−0.034−0.090.107−0.1880.1450.156−0.1450.077
RVD (<2 mm)0.08−0.3510.1940.338−0.3060.262−0.4080.4420.0350.113−0.391
RBD (>2 mm)−0.2440.0670.004−0.1840.439−0.3680.441−0.3940.495−0.577 *0.578 *
RLD (>2 mm)−0.307−0.078−0.073−0.2040.267−0.0580.135−0.0460.484−0.4790.327
RSAD (>2 mm)−0.3−0.01−0.05−0.2080.356−0.2090.295−0.220.505−0.544 *0.464
RVD (>2 mm)−0.230.0920.022−0.1510.426−0.3730.454−0.4110.482−0.571 *0.589 *
Notes: * t-p < 0.05; ** t-p < 0.01.
Table 4. Principal component analysis of soil properties and root traits of the forest types.
Principal ComponentPC-1PC-2PC-3PC-4PC-5
Eigenvalue9.2544.7642.7641.721.602
Variance40.23520.71412.0197.4776.967
Cumulative variance40.23560.94972.96880.44687.412
Eigenvectors
W−0.220.1680.511−0.420.047
BD−0.818−0.1090.341−0.1940.013
TP−0.0420.8430.0930.371−0.13
CP−0.0650.8580.3240.1720.032
NCP0.688−0.434−0.1210.489−0.177
SOC0.2690.2760.040.4940.741
pH0.4220.675−0.101−0.134−0.363
TN0.5720.518−0.3020.210.479
Sand−0.271−0.750.2060.496−0.202
Silt0.1210.819−0.008−0.4650.072
Clay0.410.08−0.494−0.2210.345
RBD10.9550.140.159−0.015−0.058
RLD10.9040.280.2320.06−0.083
RSAD10.8980.070.3010.189−0.039
RVD10.6560.2410.370.076−0.461
RBD20.759−0.4550.332−0.20.151
RLD20.783−0.3760.4490.0140.11
RSAD20.823−0.3310.367−0.1980.134
RVD20.702−0.3260.431−0.2990.257
IIR0.256−0.481−0.646−0.1920.018
SIR0.8690.057−0.378−0.015−0.15
AIR0.761−0.234−0.499−0.17−0.071
CIA0.7050.189−0.348−0.043−0.325
Notes: The SIR, IIR, and AIR represent infiltration rates in steady, initial, and average infiltration, respectively; CIA represents cumulative infiltration amounts.; RBD1 represent fine root (<2 mm) biomass density; RLD1 represents fine root (<2 mm) length density; RSAD1 represent fine root (<2 mm) surface area density; RVD1 represent fine root (<2 mm) volume density; RBD2 represent coarse root (>2 mm) biomass density; RLD2 represents coarse root (>2 mm) length density; RSAD2 represent coarse root (>2 mm) surface area density; RVD2 represent coarse root (>2 mm) volume density.
Disclaimer/Publisher’s Note: The statements, opinions and data contained in all publications are solely those of the individual author(s) and contributor(s) and not of MDPI and/or the editor(s). MDPI and/or the editor(s) disclaim responsibility for any injury to people or property resulting from any ideas, methods, instructions or products referred to in the content.

