Abstract
Rainfall-based methods have been employed for computing hydrographs in urban drainage systems. However, their implementation often introduces uncertainty in various aspects, such as the selection of a unit hydrograph, the choice of abstraction methods, and the formulas used to calculate the time of concentration, among others. Conventional consultancy studies tend to oversimplify catchment representation by treating it as a homogeneous unit or discretizing it into a few segments with simplified flood routing. This research proposes a streamlined methodology for computing hydrographs, considering the sub-basins’ heterogeneity. The methodology is based on the principles of proportionality and superposition. A sensitivity analysis of the proposed methodology is conducted, considering both homogeneous and heterogeneous catchments and the temporal distribution of rainfall. The proposed methodology is applied to the catchment of the Ricaurte channel, located in Cartagena de Indias (Colombia), with a watershed area of 728.8 ha. It has proven effective in representing a recorded simultaneous rainfall-runoff event, achieving a Root Mean Square Error of 3.93% in estimating the total volume of the measured hydrographs. A key advantage of the methodology, compared to traditional rainfall–runoff approaches, is that it does not require an extensive number of parameters to be calibrated. It may be utilized to estimate extreme flood events in urban areas with limited data availability, relying on minimal data inputs.
1. Introduction
Creating digital twin (DT) models in urban drainage systems has become a global objective in recent years [1]. These models aim to provide real-time virtual representations of urban infrastructure to control and prevent city flooding. One of the major challenges in developing DTs lies in the significant number of uncertainty sources, particularly those related to hydrological modeling [2,3].
Conventional rainfall–runoff models require a substantial number of parameters to be defined and calibrated [4,5]. These parameters are embedded within various components of the modeling framework, including the unit hydrograph, loss method, and flow routing techniques. The degree of complexity—and consequently, the modeling effort—increases with the spatial and temporal resolution level adopted, whether the model is lumped, semi-distributed, or fully distributed [5,6,7]. Generally, the more detailed the model, the greater the number of parameters that must be specified, calibrated, or estimated.
To reduce uncertainties in hydrological modeling [8,9,10] and to ensure the appropriate application of semi-distributed or distributed hydrological models, networks of rainfall and streamflow gauging stations must be installed across catchments [11]. Such instrumentation is essential for obtaining reliable parameter values that accurately reflect the hydrological characteristics of individual sub-basins. Best practices in hydrological modeling recommend using monitoring networks [12,13,14] to support the application of complex rainfall–runoff models capable of capturing the spatial and temporal variability of catchment responses. Recent advances in hydrological modeling software have extended analytical capabilities from lumped to fully distributed frameworks in various components [5,15,16].
Environmental agencies in local governments and international water-related organizations strongly advocate for the instrumentation of urban catchments to reduce modeling uncertainty and facilitate distributed simulations wherever possible [17,18]. While these recommendations have been implemented in several regions, many areas remain, especially in developing countries, where major cities lack basic streamflow gauging infrastructure. In such contexts, the calibration and application of conventional distributed hydrological models become more complex.
In designing hydraulic infrastructure, such as flow regulation systems, reservoirs, and flood control structures, particularly in regions with limited hydrological data, significant uncertainty persists regarding the magnitude of peak flows and the temporal characteristics of hydrographs during extreme events [2,19,20]. This uncertainty often arises from the oversimplified representation of catchment dynamics in conventional modeling approaches.
Catchments are typically represented as single homogeneous units or subdivided into a few segments where simplified routing techniques are applied. Such methods often neglect the heterogeneous nature of catchments, including spatial variability among sub-basins and the influence of geomorphological features on runoff generation and propagation.
The methodology proposed in this study seeks to address the limitations above by subdividing the catchment into geomorphologically defined sub-basins. The approach is grounded in the principles of proportionality and superposition. Each sub-basin is characterized using commonly available attributes employed in most hydrological models, such as catchment area and rainfall distribution, and requires only two parameters for each sub-basin: the runoff coefficient and the time of concentration.
This disaggregated approach enables a more realistic representation of runoff generation processes. It facilitates the modeling of hydrograph formation in heterogeneous watersheds that capture both spatial and temporal variability across the catchment. It is designed for application in data-scarce contexts, where conventional models are often impractical due to the unavailability of detailed input data.
By incorporating geomorphological criteria into the hydrological discretization process, the proposed framework improves the estimation of peak flows and the prediction of hydrograph shape. Importantly, it remains applicable even in ungauged or poorly instrumented catchments, offering a practical alternative where monitoring infrastructure is limited. This research uses analytical expressions for unit hydrographs and their corresponding hydrological responses for theoretical heterogeneous catchments.
A sensitivity analysis of the proposed method was carried out to assess the variability of the results under different conditions, including homogeneous versus heterogeneous catchments, as well as varying temporal rainfall distributions. The model was validated using a case study in a data-scarce watershed located in Cartagena, Colombia—specifically, the Ricaurte catchment, which covers an area of 652.2 ha. A comparison with a conventional rainfall–runoff model is also presented, demonstrating that both approaches yield peak flow estimates of the same order of magnitude for return periods of 50 and 100 years.
This research can be applied within urban management, particularly for estimating pluvial flood events, thereby aiding urban infrastructure planning in data-limited areas.
2. Proposed Methodology
The catchment is subdivided into multiple sub-basins based on geomorphological characteristics. Each sub-basin is described by its drainage area, main channel slope, time of concentration, and the spatial location of its outlet along the main channel of the catchment. Due to the spatial arrangement of the sub-basins, there exists a time delay (or travel time) between the arrival of hydrographs from upstream sub-basins and those closer to the outlet. This travel time is a function of the hydraulic characteristics of the intervening channel reaches.
Each sub-basin generates a characteristic hydrograph, which is then routed to the main outlet. The superposition of all individual hydrographs obtains the resulting catchment hydrograph, each temporally shifted according to its travel time. Figure 1 illustrates a schematic discretization of a sample catchment into five sub-basins, indexed 1 through 6. Each sub-basin is associated with a specific time of concentration and a peak discharge, determined based on a triangular unit hydrograph.
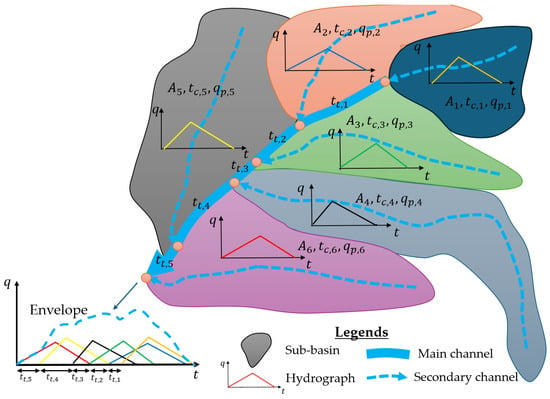
Figure 1.
The schematic discretization of a catchment divided into five sub-basins.
In the schematic (Figure 1), the main channel sequentially receives discharges from the sub-basins. Sometimes, two or more sub-basins may discharge at the exact location along the channel. The flow must travel through a defined channel segment between these confluence points, requiring a travel time denoted by . The observer situated at the catchment outlet will first register the hydrograph from sub-basin 6 (represented in red), followed by a travel time —by the hydrograph from sub-basin 4 (yellow). The last hydrograph from sub-basin 1 (orange) reaches the outlet at time . The complete hydrograph at the outlet is thus the envelope of all temporally shifted individual hydrographs.
Figure 2 generalizes this concept for a catchment discretized into sub-basins. Each sub-basin contributes a hydrograph that is delayed by a travel time , depending on its location and channel routing distance. In cases where two or more sub-basins discharge at the exact location, the travel time between them is considered zero.
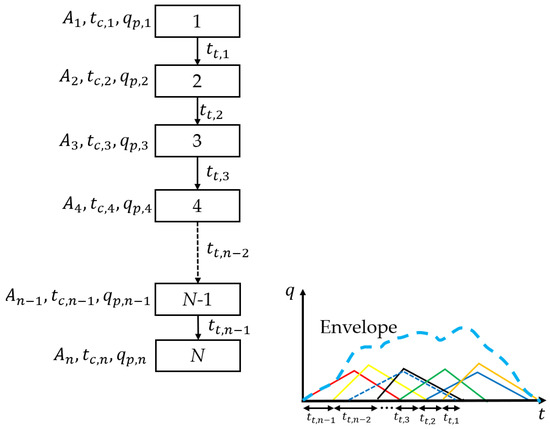
Figure 2.
General scheme of a catchment considering sub-basins.
2.1. Assumptions
The proposed modeling approach assumes that the hydrological system behaves linearly [21,22,23]. The following assumptions are considered:
- Principle of proportionality: If a function represents a solution to the system, then any scalar multiple , where c is a constant, is also a valid solution.
- Principle of superposition: If and are solutions of the governing equation, then their sum also constitutes a valid solution.
These principles allow the system response to be decomposed and reconstructed as the sum of individual responses associated with each sub-basin, making the framework particularly well-suited for hydrological modeling.
In particular, linear behavior is assumed at the level of the system’s response to unit inputs, thereby enabling the application of the principles of superposition and proportionality. These principles have been widely employed in hydrological modeling, especially within the framework of unit hydrograph theory, which effectively represents the rainfall–runoff relationship under the assumption of linear system behavior [24,25,26].
2.2. Governing Equations
2.2.1. Rainfall Considerations
The temporal distribution of rainfall significantly influences the shape and magnitude of the resulting hydrograph. Rainfall events can be idealized using simplified representations such as the triangular hyetograph, which provides a practical approximation for design and modeling purposes.
This triangular hyetograph is defined by two key temporal components: the time to peak rainfall intensity , and the recession time after the peak . In addition, the total duration of a rainfall event can be expressed as . The ratio characterizes the symmetry of the rainfall event. A value of 0. indicates a symmetric storm in terms of its temporal distribution. However, other values of reflect the asymmetry in rainfall events.
Figure 3 illustrates the key components of a triangular hyetograph, including the rise and fall of rainfall intensity over time. This schematic helps define the precipitation input and understand how such input translates into a runoff response.
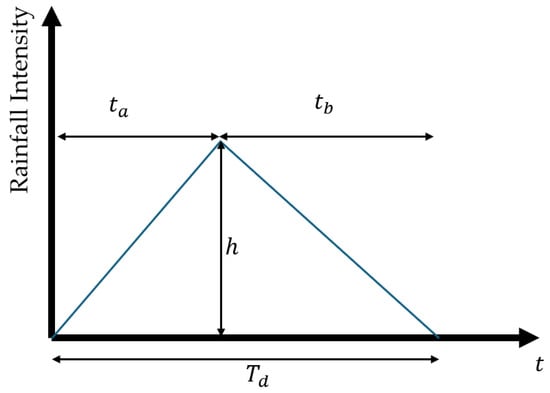
Figure 3.
Characteristic hyetotram for a rainfall event.
2.2.2. Unit Hydrograph
The structure of the precipitation hyetograph strongly influences the hydrograph of discharge at the outlet of a sub-basin. When a triangular rainfall input is applied, the resulting discharge hydrograph often exhibits a similar form, especially in systems where infiltration, storage, and other nonlinear effects are minimal or can be approximated linearly. This justifies using triangular hydrographs in the proposed modeling framework, maintaining consistency between rainfall input and runoff output.
The proposed hydrological modeling approach adopts a dimensionless triangular unit hydrograph that can be used for ungauged or data-scarce catchments in small watersheds.
Figure 4 illustrates the main components of the triangular unit hydrograph, which is defined by its peak flow, base time, and time to peak. This scalable response curve can be applied to various catchment sizes and storm characteristics.
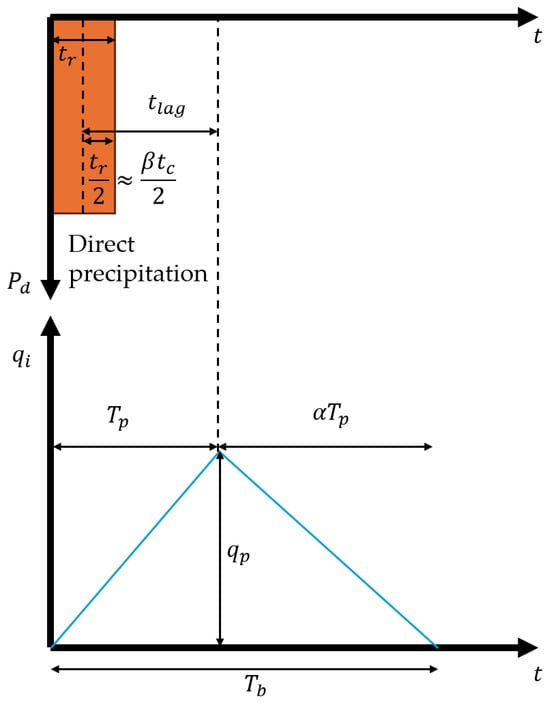
Figure 4.
Proposed triangular unit hydrograph.
Within the analytical framework, the proposed model considers that in the computation time step, a distance can be a representative sub-basin.
Based on these assumptions, it is possible to derive key hydrological parameters such as peak discharge (), base time (), and unit response functions for each sub-basin. These simplifications make the method computationally efficient while maintaining sufficient physical realism for design and planning applications.
Then, the time to peak can be defined as:
where, = time to peak, = lag time, and = discretized rainfall duration of an event.
The lag time can be computed as , where = time of concentration of a sub-basin.
The base time can be computed as follows:
where = factor that defines the recession limb of the unit hydrograph.
Considering the previous definitions, the time to peak and the base time can be computed as:
and,
According to the review conducted across various catchments (e.g., by the Soil Conservation Service), the value of can be approximated as 1.67. The value of can be rounded to 0.10 [22].
By the principle of mass conservation, the total direct runoff volume generated by a rainfall event must be equal to the volume represented by the corresponding triangular hydrograph. This fundamental principle provides the basis for deriving analytical expressions for the hydrograph parameters, particularly the peak discharge.
Considering the total volume of direct runoff generated by effective rainfall over a given sub-basin and the runoff response given by the unit triangular hydrograph with peak flow and base time , thus:
where, = watershed area and = the effective rainfall depth or direct precipitation.
By plugging Equation (4) into Equation (5), the unit peak discharge can be obtained as:
Moreover, this approach ensures the total water balance is preserved within the modeling framework. When applied systematically to each sub-basin in a discretized catchment, it synthesizes a complete hydrograph at the outlet via temporal shifting and superposition, as previously described.
To compute the unit discharge at time during the rising and recession limbs, then:
- If (rising limb), then:
Substituting Equation (6) into Equation (7) and subsequently rearranging yields:
- If (recession limb), then:
Similarly, by substituting Equation (6) into Equation (9) and taking into account the definition of , thus:
- If , then .
2.2.3. Convolution Method
To compute the total unit hydrograph of the basin under analysis, the convolution method must be applied, taking into account the travel time associated with each sub-basin i, as expressed below:
Equation (11) is valid considering the following values:
3. Analysis of Hydrological Effects
A series of simulations using simplified and controlled conditions were conducted to assess the impact of the spatial arrangement of sub-basins on the shape and characteristics of the resulting hydrograph at the catchment outlet.
3.1. Analysis of Homogeneous Catchments
These simulations aim to isolate the influence of travel time () between sub-basin outlets and the main outlet, assuming homogeneous hydrological conditions across the catchment. The following conditions are adopted:
- The catchment has a total area , divided into 10 identical sub-basins, each of area .
- The time step of the simulation , is used as the unit of discretization and is set to unity (= 1).
- The design rainfall has a duration of 10 time steps (), and at each time step, a unit of effective precipitation is applied (), and the total effective rainfall is therefore 10 units: .
- All sub-basins have the same time of concentration: .
- The travel time between sub-basins (), has the units of . The travel times have been varied from 0 to 8 units of .
- The coefficients and used in the analysis were 1.67 and 0.1, respectively.
All sub-basins are assumed to discharge simultaneously, with no spatial delay (). Each unit of effective rainfall produces a triangular unit hydrograph, and the composite hydrograph is formed by linear superposition. Figure 5a shows (left part) the geomorphological unit hydrograph for a single effective rainfall event in homogeneous conditions, while the right part displays the resulting hydrological unit hydrograph for a rainfall event lasting , with a total effective rainfall of 10 units. A sharp and pronounced peak is observed, as all sub-basins contribute simultaneously. The maximum peak discharge and minimum base time are observed in this hydrograph. Figure 5 shows the consideration of travel times varying from to . In this figure, the x-axis is expressed in units. The y-axis represents a discharge per unit of catchment area, per unit of effective rainfall, and per unit of discretization time on the left side. The right side represents the total unit hydrograph for a total rainfall event.
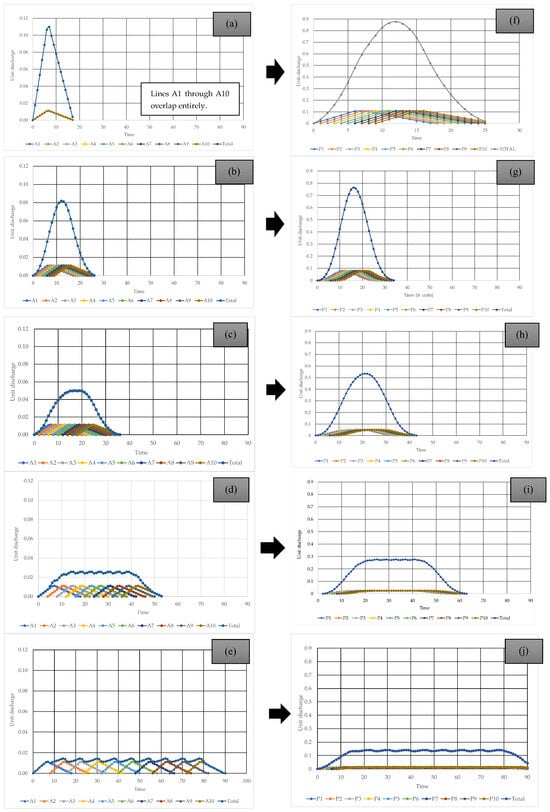
Figure 5.
Effects of homogeneous catchments for unit hydrograph considering: (a) and = 1; (b) and = 1; (c) and = 1; (d) and = 1; (e) and = 1; (f) and = 10; (g) and = 10; (h) and = 10; (i) and = 10; (j) and = 10.
Table 1 presents the main characteristics of the hydrograph for the entire catchment. It can be observed that sub-catchments discharging into the same outlet tend to form a more circular overall catchment shape. These configurations are associated with higher peak discharges and shorter times to peak and base durations. Conversely, the resulting catchment becomes increasingly elongated as the sub-catchments become more spatially separated. This morphological change leads to a reduction in peak discharge and an extension of the base time.

Table 1.
Results of effects of homogeneous catchments.
The results of all simulations are summarised in Table 1, which presents the primary hydrograph characteristics: peak discharge, time to peak, and base time. The trends observed indicate that:
- When all sub-basins discharge simultaneously (i.e., a compact catchment with circular geometry), the highest peak flows and shortest time to the peak are obtained.
- As the spatial separation increases (i.e., elongated catchment shape), the hydrograph becomes more spread out, the peak flow decreases, and the base time increases.
These results confirm that elongated catchments tend to produce lower peak discharges, albeit with longer durations, which is a key consideration in flood mitigation design and hydrological modeling.
3.2. Effect of the Rainfall Temporal Distribution
Several simulations were analyzed assuming a travel time equal to zero to assess the impact of the rainfall temporal distribution. The internal rainfall distribution was modeled following three additional patterns, as shown in Figure 6.
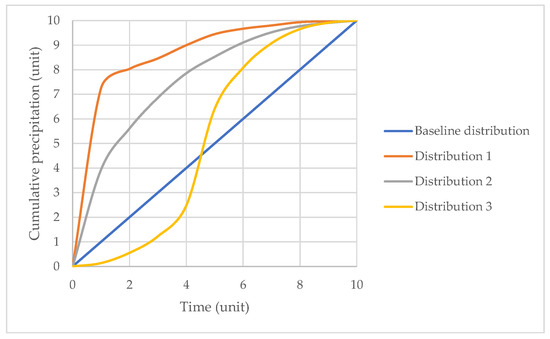
Figure 6.
Temporal rainfall distributions.
The choice of distribution method can substantially influence the shape and peak of the resulting hydrographs, thereby affecting flood prediction and water resource management strategies. Figure 7 shows the hydrographs considering the three additional rainfall distributions.
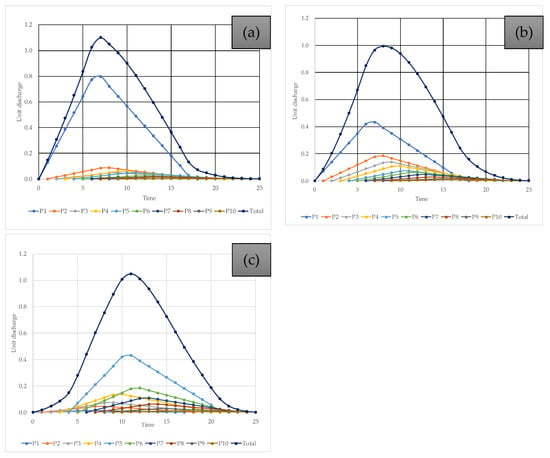
Figure 7.
Effects of rainfall temporal distribution: (a) distribution No. 1, (b) distribution No. 2, and (c) distribution No. 3.
Table 2 summarises the results obtained for the different rainfall distributions. Distribution No. 1 proves to be the most critical, as it concentrates rainfall at the onset of the event, resulting in the highest peak flow and the shortest time to peak. In contrast, the baseline distribution (uniform) yields the lowest peak flow and the longest base time. The base time remains constant for all scenarios.

Table 2.
Results of effects of rainfall distributions.
3.3. Analysis of a Heterogeneous Catchment
Real sub-basins exhibit heterogeneous shapes, constituting the proposed method’s primary focus. In this context, the assessment of simultaneous variations in sub-basin parameters reveals their influence on the shape and peak of the resulting hydrographs. The proposed method effectively captures hydrograph responses under a consistent precipitation input by incorporating stochastic variations in catchment area, time of concentration, and lag time.
Figure 8 illustrates the results obtained for a hypothetical catchment. The observed heterogeneity in sub-basin areas, times of concentration, and their spatial distribution—manifested through staggered drainage contributions—leads to a general attenuation of peak discharge. This attenuation is primarily due to the desynchronization of runoff peaks, resulting in a more distributed and flattened hydrograph response.
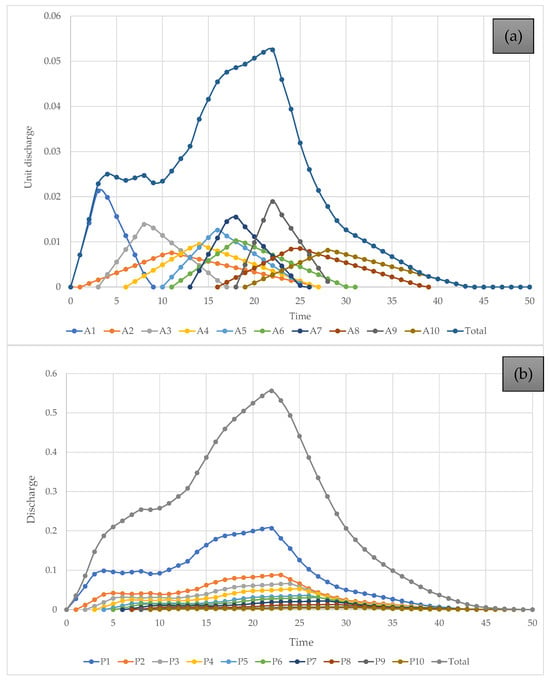
Figure 8.
Effects of a heterogeneous catchment: (a) unit direct precipitation and (b) total direct precipitation.
By integrating these parameters, the model offers a more nuanced representation of the catchment’s hydrological behavior, thereby underscoring the importance of spatial and temporal variability in flood modeling.
4. Case Study and Validation
4.1. Case Study
The Ricaurte channel, situated within the urban area of Cartagena, Bolívar, Colombia, forms part of the network of drainage basins that characterize this coastal city. This particular catchment discharges into the Ciénaga de la Virgen, a significant body of water within the region’s hydrological system. The Ricaurte channel basin comprises several sub-basins, which are named Alameda la Victoria (A), El Cementerio (C), Plazulea—Local (D), Socorro—Jardínez (E), Blas de Lezo—Caracoles (G), Santa Lucía—San Pedro (F), Tacarigua—Alpes (H-I), and Calamares—Gaviotas (J) (see Figure 9). The hydrograph analysis is carried out up to the box culvert on 13th June Avenue. The morphometric characteristics of the sub-basin are presented in Table 3. The watershed area is 728.8 ha.
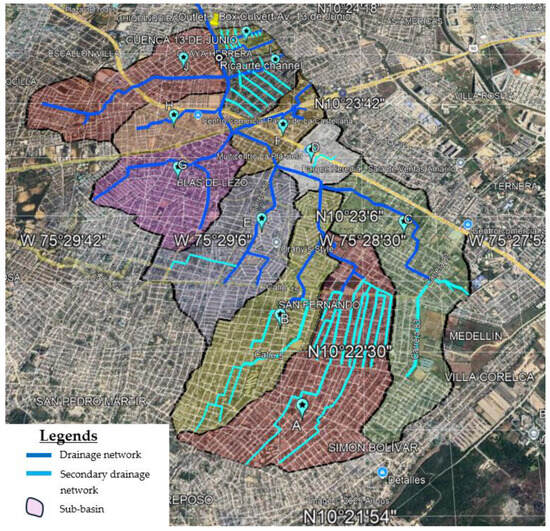
Figure 9.
Characteristics of the Ricaurte channel catchment.

Table 3.
Estimated flow rates in the Ricaurte channel up to the box culvert on 13th June Avenue.
4.2. Dataset
A rain gauge was installed within the catchment to record precipitation events for validation. Simultaneously, multiple flow measurements were conducted downstream of the box culvert crossing Pedro de Heredia Avenue. A vertical staff gauge (limnigraph) was installed at this location, and a gauging section was calibrated using a current meter to ensure accurate discharge measurements [27].
The fieldwork produced several rainfall records and the corresponding discharge data within the study catchment. Among these, the most significant precipitation events occurred on 16 June 2002, 7 September 2002, and 30 September 2002, with total rainfall amounts of 75.2 mm, 10.4 mm, and 9.9 mm, respectively. These events were the basis for analyzing the catchment’s hydrological response and calculating the runoff coefficient. Figure 10 displays the recorded rainfall events. Simultaneously, hydrographs were registered for these periods, as shown in Section 4.3.
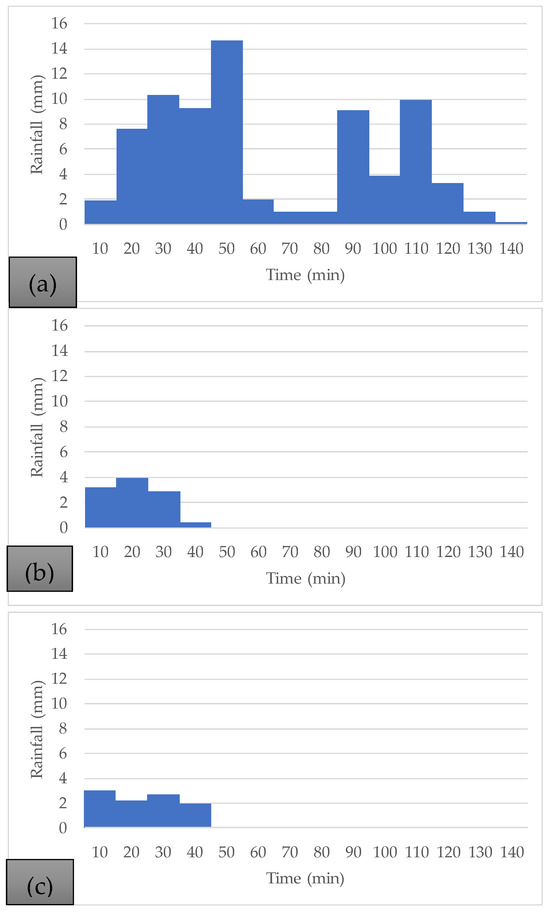
Figure 10.
Measured rainfall events measured on: (a) 16 June 2002; (b) 7 September 2002; and (c) 30 September 2002.
4.3. Results
In this section, a comparison of the computed hydrographs using the proposed method and the registered ones was performed in this research. Figure 11 compares and demonstrates that the proposed method is suitable for computing the hydrographs. The hydrographs produced by the proposed method yield results comparable to the observed data in terms of total volume and base time. The runoff coefficient was the only parameter subjected to calibration. For the rainfall–runoff events on 16 June 2002, 7 September 2002, and 30 September 2002, the resulting values were 0.581, 0.585, and 0.573, respectively, considering that the runoff volume was equal in the measured and computed hydrographs. In all cases, a very similar coefficient was obtained.
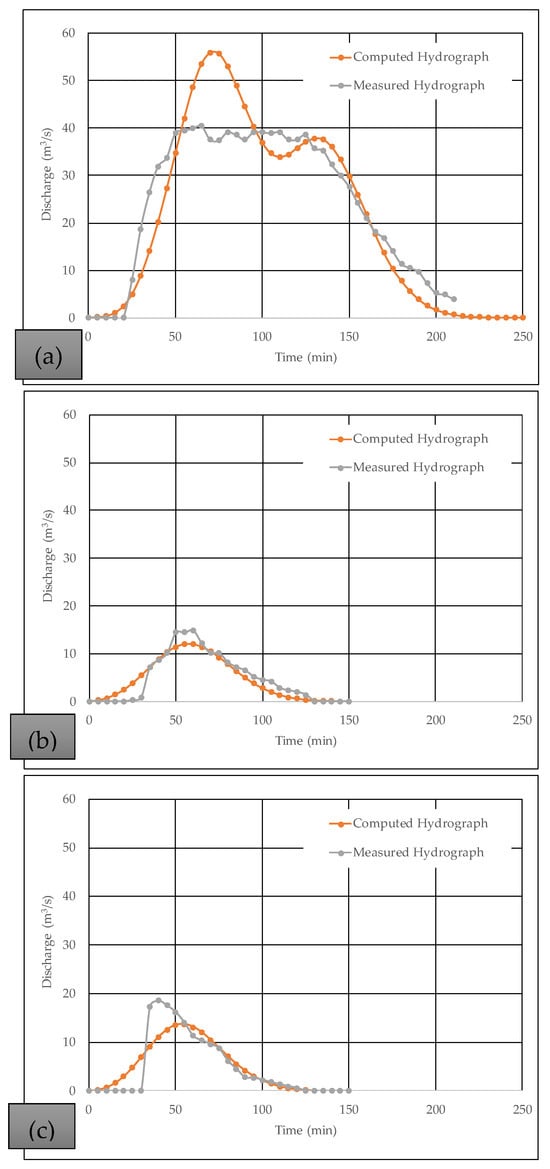
Figure 11.
Comparison of discharge flow between the proposed method and the measured data on (a) 16 June 2002; (b) 30 September 2002; (c) 7 September 2002.
Table 4 shows the root mean square error (RMSE) derived from comparing the total volume between the measured and computed hydrographs in Figure 10. The total RMSE amounted to 3.93%. The findings from this study offer valuable insights for calibrating hydrological models in urban environments, particularly in areas with characteristics similar to the Ricaurte channel. The methodology and data obtained are fundamental for designing and planning efficient urban drainage systems, contributing to improved flood management and infrastructure development in rapidly urbanizing regions.

Table 4.
Calculation of the root mean square error (RMSE) (%).
5. Discussion
Conventional rainfall–runoff methods require many parameters to characterize catchment behavior adequately. Although these models are based on physical principles, in practice, particularly in data-scarce contexts, engineers and designers often face uncertainty regarding, for example, selecting an appropriate unit hydrograph or loss method. These models are sensitive to the choice of hydrograph and loss methods and their associated parameters.
This issue is exacerbated when a catchment is divided into multiple sub-basins, increasing the overall uncertainty.
In the proposed methodology, two parameters may be used for calibration: the time of concentration () and the runoff coefficient (). An effective calibration process begins with selecting a time of concentration equation that appropriately reflects the conditions of each specific subbasin and defining a plausible parameter range. This parameter is particularly sensitive in subbasins located within urban environments.
In contrast, the uncertainty associated with the runoff coefficient can be mitigated using satellite-derived data. For the practical application presented in Section 3, only the runoff coefficient was employed for calibration.
Table 5 compares the parameters required by the conventional method and the proposed methodology approach. The results show that the proposed methodology requires significantly fewer parameters than the traditional rainfall–runoff models.

Table 5.
Comparison of the number of parameters between conventional rainfall-runoff methods and the proposed methodology.
The Guayepo catchment in Cartagena, Colombia, was the case study to compare peak flows for various return periods. The authors’ detailed analysis is available in Reference [28]. This catchment covers a total area of 21.06 km2 and was divided into six sub-basins (A, B, C, D, E, and H).
Table 6 compares results obtained using a conventional rainfall–runoff approach and the proposed methodology. The findings indicate that both methods yield peak flows of the same order of magnitude, suggesting that the proposed methodology may serve as a viable hydrological alternative, particularly in data-scarce contexts.

Table 6.
Comparison of peak flows estimated using a conventional rainfall–runoff method and the proposed model for the Guayepo catchment.
6. Conclusions
A proposed methodology was presented in this research to represent the rainfall–runoff process with limited data, which incorporates the principles of proportionality and superposition. The methodology is designed to capture sub-basin heterogeneity when calculating hydrographs. This approach accurately represents spatial and temporal variability in runoff generation. Simulations demonstrate that the spatial arrangement of sub-basins significantly influences peak discharge, base time, and hydrograph duration. Additionally, variations in the temporal distribution of rainfall affected hydrograph characteristics, highlighting the importance of considering such factors in flood prediction models. Integrating heterogeneity in catchment properties further enhances model accuracy by capturing desynchronized runoff peaks. Validation with the Ricaurte channel case study confirms the method’s efficacy in real-world applications, providing a valuable tool for flood risk management and hydraulic design in data-scarce regions. A Root Mean Square Error of 3.93% was obtained for computing the water volume produced in three measured rainfall–runoff events. The runoff coefficient was the sole parameter subject to calibration, with values ranging from 0.573 to 0.585.
This approach can also be applied to ungauged basins, offering a robust framework for hydrological modeling with minimal data input. Compared to conventional rainfall–runoff methods, the proposed methodology has a key advantage: it does not require many parameters to be calibrated. Using limited data, this approach offers a practical tool for hydraulic engineers to estimate extreme hydrographs for various return periods.
Future contributions should focus on developing software based on the proposed methodology in this research. This tool could be handy for engineers and designers working in data-scarce environments, where conventional rainfall–runoff methods are often limited by the need for numerous parameters and extensive calibration.
Author Contributions
Conceptualization, A.A.-P.; methodology, A.A.-P. and O.E.C.-H.; formal analysis, A.A.-P. and O.E.C.-H.; validation, A.A.-P., writing—original draft preparation, O.E.C.-H. and A.A.-P.; writing—review and editing, H.M.R.; supervision, A.A.-P. and H.M.R. All authors have read and agreed to the published version of the manuscript.
Funding
This research was funded by Universidad de Cartagena, act No. 112-2019.
Data Availability Statement
Databases are available in this article.
Conflicts of Interest
The authors declare no conflicts of interest.
References
- Bartos, M.; Kerkez, B. Pipedream: An Interactive Digital Twin Model for Natural and Urban Drainage Systems. Environ. Model. Softw. 2021, 144, 105120. [Google Scholar] [CrossRef]
- Panchanathan, A.; Ahrari, A.; Ghag, K.S.; Mustafa, S.; Haghighi, A.T.; Kløve, B.; Oussalah, M. An Overview of Approaches for Reducing Uncertainties in Hydrological Forecasting: Progress and Challenges. Earth Sci. Rev. 2024, 258, 104956. [Google Scholar] [CrossRef]
- Tegegne, G.; Kim, Y.O.; Seo, S.B.; Kim, Y. Hydrological Modelling Uncertainty Analysis for Different Flow Quantiles: A Case Study in Two Hydro-Geographically Different Watersheds. Hydrol. Sci. J. 2019, 64, 473–489. [Google Scholar] [CrossRef]
- Sahu, M.K.; Shwetha, H.R.; Dwarakish, G.S. State-of-the-Art Hydrological Models and Application of the HEC-HMS Model: A Review. Model. Earth Syst. Environ. 2023, 9, 3029–3051. [Google Scholar] [CrossRef]
- Dotson, H.W. Watershed Modeling with HEC-HMS (Hydrologic Engineering Centers-Hydrologic Modeling System) Using Spatially Distributed Rainfall. In Coping with Flash Floods; Springer: Berlin/Heidelberg, Germany, 2001; pp. 219–230. [Google Scholar]
- Beven, K.; Binley, A. The Future of Distributed Models: Model Calibration and Uncertainty Prediction. Hydrol. Process 1992, 6, 279–298. [Google Scholar] [CrossRef]
- Okiria, E.; Okazawa, H.; Noda, K.; Kobayashi, Y.; Suzuki, S.; Yamazaki, Y. A Comparative Evaluation of Lumped and Semi-Distributed Conceptual Hydrological Models: Does Model Complexity Enhance Hydrograph Prediction? Hydrology 2022, 9, 89. [Google Scholar] [CrossRef]
- Shin, M.-J.; Kim, C.-S. Analysis of the Effect of Uncertainty in Rainfall-Runoff Models on Simulation Results Using a Simple Uncertainty-Screening Method. Water 2019, 11, 1361. [Google Scholar] [CrossRef]
- Deletic, A.; Dotto, C.B.S.; McCarthy, D.T.; Kleidorfer, M.; Freni, G.; Mannina, G.; Uhl, M.; Henrichs, M.; Fletcher, T.D.; Rauch, W.; et al. Assessing Uncertainties in Urban Drainage Models. Phys. Chem. Earth Parts A/B/C 2012, 42–44, 3–10. [Google Scholar] [CrossRef]
- Mishra, S. Uncertainty and Sensitivity Analysis Techniques for Hydrologic Modeling. J. Hydroinform. 2009, 11, 282–296. [Google Scholar] [CrossRef]
- Singhal, A.; Jaseem, M.; Divya; Sarker, S.; Prajapati, P.; Singh, A.; Jha, S.K. Identifying Potential Locations of Hydrologic Monitoring Stations Based on Topographical and Hydrological Information. Water Resour. Manag. 2024, 38, 369–384. [Google Scholar] [CrossRef]
- WMO. Manual on Stream Gauging, Vol. I: Fieldwork; WMO: Geneva, Switzerland, 2010. [Google Scholar]
- Turnipseed, D.P.; Sauer, V.B. Discharge Measurements at Gaging Stations. Techniques and Methods; U.S. Geological Survey: Reston, VA, USA, 2010. [CrossRef]
- Mishra, A.K.; Coulibaly, P. Developments in Hydrometric Network Design: A Review. Rev. Geophys. 2009, 47, RG2001. [Google Scholar] [CrossRef]
- Quintero, F.; Velásquez, N. Implementation of TETIS Hydrologic Model into the Hillslope Link Model Framework. Water 2022, 14, 2610. [Google Scholar] [CrossRef]
- Ma, L.; He, C.; Bian, H.; Sheng, L. MIKE SHE Modeling of Ecohydrological Processes: Merits, Applications, and Challenges. Ecol. Eng. 2016, 96, 137–149. [Google Scholar] [CrossRef]
- Guide to Hydrological Practices, Volume I + II: Hydrology—From Measurement to Hydrological Information|World Meteorological Organization. Available online: https://community.wmo.int/en/bookstore/guide-hydrological-practices-volume-iii-hydrology-measurement-hydrological-information (accessed on 20 April 2025).
- European Environment Agency. Urban Adaptation to Climate Change in Europe. Challenges and Opportunities for Cities Together with Supportive National and European Policies; EEA Report/No 2/2012; European Environment Agency: Copenhagen, Denmark, 2012.
- Baig, F.; Sherif, M.; Faiz, M.A. Quantification of Precipitation and Evapotranspiration Uncertainty in Rainfall-Runoff Modeling. Hydrology 2022, 9, 51. [Google Scholar] [CrossRef]
- Sharafati, A.; Doroudi, S.; Shahid, S.; Moridi, A. A Novel Stochastic Approach for Optimization of Diversion System Dimension by Considering Hydrological and Hydraulic Uncertainties. Water Resour. Manag. 2021, 35, 3649–3677. [Google Scholar] [CrossRef]
- Zhao, B.; Tung, Y.-K. Determination of Optimal Unit Hydrographs by Linear Programming. Water Resour. Manag. 1994, 8, 101–119. [Google Scholar] [CrossRef]
- Chow, V.T.; Maidment, D.R.; Mays, L.W. Applied Hydrology; McGraw-Hill International Editions: New York, NY, USA, 1988; ISBN 0-07-010810-2. [Google Scholar]
- Mitchell, W.D. Linear Analysis of Hydrographs. Water Resour. Res. 1967, 3, 891–895. [Google Scholar] [CrossRef]
- Yoon, Y.-J.; Kim, J.-C. Fractional Linear Reservoir Model as Elementary Hydrologic Response Function. Water 2023, 15, 4254. [Google Scholar] [CrossRef]
- Feinstein, J.; Ploussard, Q.; Veselka, T.; Yan, E. Using Data-Driven Prediction of Downstream 1D River Flow to Overcome the Challenges of Hydrologic River Modeling. Water 2023, 15, 3843. [Google Scholar] [CrossRef]
- Feldman, A.D. Hydrologic Modeling System HEC-HMS: Technical Reference Manual; US Army Corps of Engineers, Hydrologic Engineering Center: Davis, CA, USA, 2000.
- Martin Padilla, M.A.; Reyes Pájaro, E.L. Determinación En El Campo Del Coeficiente de Escorrentía de La Microcuenca Socorro, Blas de Lezo, Los Alpes y Las Gaviotas. Bachelor’s Dissertation, Universidad de Cartagena, Cartagena, Colombia, 2004. [Google Scholar]
- Moreno-Pájaro, A.M.; Osorio-Gastelbondo, A.; Moreno-Egel, D.A.; Coronado-Hernández, O.E.; Narváez-Cuadro, M.A.; Saba, M.; Arrieta-Pastrana, A. Hydrological Modelling and Remote Sensing for Assessing the Impact of Vegetation Cover Changes. Hydrology 2025, 12, 107. [Google Scholar] [CrossRef]
Disclaimer/Publisher’s Note: The statements, opinions and data contained in all publications are solely those of the individual author(s) and contributor(s) and not of MDPI and/or the editor(s). MDPI and/or the editor(s) disclaim responsibility for any injury to people or property resulting from any ideas, methods, instructions or products referred to in the content. |
© 2025 by the authors. Licensee MDPI, Basel, Switzerland. This article is an open access article distributed under the terms and conditions of the Creative Commons Attribution (CC BY) license (https://creativecommons.org/licenses/by/4.0/).