Abstract
River pollution is a major issue in China’s urbanization process. Understanding the effects of river morphology and constructed wetlands on the self-purification capacity is crucial for water quality improvement. This study takes the Shiwuli River, a main tributary of Chaohu Lake, as an example. By monitoring the concentration changes of five water quality indicators—total nitrogen (TN), total phosphorus (TP), ammonia nitrogen (NH3-N), chemical oxygen demand (COD), and dissolved oxygen (DO)—in the river section for the years 2017 and 2024, we conducted a comparative analysis of the relationship between river morphology and self-purification capacity, as well as influencing factors. The results show that meandering rivers possess self-purification capabilities under natural conditions. There is a positive correlation between river sinuosity and the reduction rates of TP, TN, NH3-N, and COD, as well as the increase rate of DO—the greater the sinuosity, the stronger the purification capacity. Wetlands enhance both the self-purification capacity and the purification rate of river channels, reducing the required sinuosity for effective self-purification from 1.49 to 1.30. This study also discusses the mechanisms by which meandering rivers influence water self-purification, and proposes that increasing river sinuosity and constructing wetlands can enhance the self-purification capacity. This measure will increase the length and width of the river, prolong the purification time, improve the DO level, and enhance the exchange between the riverbed and groundwater. The findings of this study can provide a reference for river restoration and management in the context of urbanization.
1. Introduction
River systems, which serve as complete hydrological pathways from headwaters to estuaries, rely on synergistic interactions of riparian zones, riverbeds, water bodies, biological communities, and associated wetlands and lakes to maintain ecological functionality [1]. Healthy river systems not only sustain biodiversity but enhance regional environments through their inherent self-purification capacity [2].
With social development, most global rivers have been altered by human activities [3,4], primarily through interventions aimed at minimizing floods, reducing erosion, and optimizing water resource allocation [5,6,7]. These measures—often involving channelization or straightening [8,9]—modify key physical parameters, such as channel width, sinuosity, depth, and bank slope structure, leading to significant morphological changes [10,11]. Such alterations frequently trigger ecological degradation, disrupting natural riverine processes, and reducing ecosystem resilience [12].
Self-purification capacity, a key metric for assessing river health, is typically quantified using comprehensive attenuation coefficients and self-purification rates [13,14]. This capacity is based on the synergistic effects of physical (dilution, sedimentation), chemical (oxidation, photolysis), and biological (metabolic processes of plants, animals and microorganisms) processes [15]. In China, the pollutant loads in most rivers have far exceeded their self-purification thresholds, with the accumulation of nutrients (e.g., nitrogen and phosphorus) and organic pollutants significantly impairing water self-purification [16,17].
In recent years, researchers have proposed river restoration measures—such as constructing artificial wetlands, creating shallow riffles and deep pools, and restoring natural sinuosity—to improve aquatic ecosystems and enhance the self-purification capacity [18,19]. Among these, sinuosity (the ratio of the river’s centerline length to its straight-line valley length [20]) is the most critical morphological indicator [21,22]. In several studies, Xiao et al. combined the field monitoring of natural rivers with laboratory flume experiments to analyze the correlation between sinuosity and self-purification capacity. Their findings revealed that river morphology is a primary factor influencing self-purification, with a minimum sinuosity of 1.42 required to maintain nitrogen and phosphorus reduction [23,24,25]. Similarly, Jiahui’s study demonstrated that high-sinuosity reaches (1.0–1.07) exhibit significantly stronger self-purification capabilities [26].
Combining previous research findings, current studies on restoring river ecosystems and enhancing the water self-purification capacity have attracted researchers’ interest. However, the correlation between river morphological changes and self-purification capacity, as well as the underlying mechanisms, have not been sufficiently explored. Therefore, this study conducts field monitoring of the downstream inflow section of the Shiwuli River into Chaohu Lake to further clarify the relationship between river sinuosity and self-purification capacity. Additionally, it discusses the mechanisms and influencing factors of meandering rivers in water purification to provide a basis for water quality improvement and ecological restoration of rivers under the context of urbanization development.
2. Materials and Methods
2.1. Study Area
Chaohu Lake, one of China’s five largest freshwater lakes, is situated in the middle and lower reaches of the Yangtze River. In recent years, rapid urbanization has led to the deteriorating water quality in the lake. The Shiwuli River, located at the junction between Hefei’s old urban district and its new development zone, has experienced significant channel modifications due to continuous land-use planning adjustments. These changes have compressed the river’s natural morphology, resulting in pronounced channel straightening and persistently poor water quality (consistently below Grade V standards). As a major inflow river of Chaohu Lake, the Shiwuli River’s water quality directly impacts the lake’s ecological health.
In response, Hefei City has prioritized ecological restoration efforts. Between 2017 and 2023, a constructed wetland was implemented in the lower reach of the Shiwuli River (31°45′35.12″ N, 117°00′00″ E to 31°43′18.89″ N, 117°22′00″ E) to improve water quality.
This study focuses on the downstream section of the Shiwuli River near its confluence with Chaohu Lake. As illustrated in Figure 1, the wetland construction has altered the river’s morphology—increasing the channel width (from 25 m in 2017 to 35 m in 2024) while reducing the sinuosity (from 1.48 in 2017 to 1.38 in 2024). Field investigations have confirmed that the revetment structures and riparian substrates along the downstream reach of the Shiwuli River remained consistent between 2017 and 2024. This segment exhibited no point-source pollutant inputs and an absence of artificial purification facilities. These changes are localized to the wetland segment, with other reaches maintaining consistent cross-sectional parameters between the two periods. Notably, the wetland exhibits significantly greater channel width and flow path length compared to the natural river channel. Under uniform environmental conditions—with no point/non-point source pollution or anthropogenic disturbances—this setting provides an ideal system for investigating water quality–river morphology relationships.
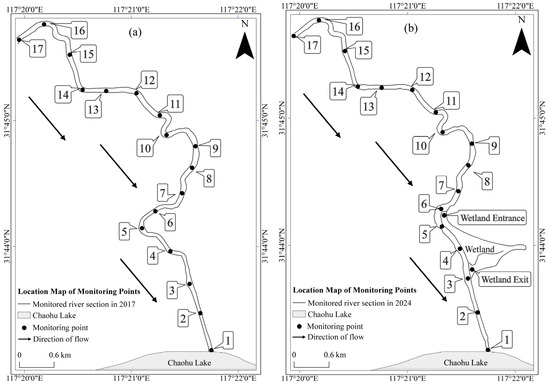
Figure 1.
Location Map of Sampling Sites: (a) in 2017; (b) in 2024.
2.2. Experimental Method
(1) Water Sampling and Monitoring
Seventeen water quality monitoring sites were established along the main channel of the study reach, with identical sampling locations maintained in both 2017 and 2024. Site 17 is positioned at the most upstream section, while Site 1 is located at the river–lake confluence near Chaohu Lake. Water samples were collected sequentially from upstream (Site 17) to downstream (Site 1).
To assess the wetland treatment effects, two additional monitoring points were set at the inlet and outlet of the constructed wetland. These were compared with the adjacent channel stations (Site 6 and Site 3, respectively) to evaluate the water quality transformation processes.
We obtain the data of the study river sections in the spring, summer, autumn, and winter of 2017 and 2024. The sampling is carried out at each monitoring point under the same background of water environment, including temperature, illumination, and riparian vegetation. The water temperatures during the sampling in each season are approximately as follows: 15 °C in spring, 30 °C in summer, 10 °C in autumn, and 0 °C in winter. Three parallel samples are collected at each sampling point. Five water quality indicators, namely dissolved oxygen (DO), total nitrogen (TN), ammonia nitrogen (NH3-N), total phosphorus (TP) and chemical oxygen demand (COD), are detected. The water quality analysis strictly adheres to the national standards of China, and the methods adopted are respectively the iodometric method, the alkaline potassium persulfate ultraviolet spectrophotometric method, the ammonium molybdate spectrophotometric method, the Nessler’s reagent spectrophotometric method, and the dichromate method.
(2) Data Analysis Method
The calculation method of the river curvature S is as follows:
Among them, LT is the length of the river centerline and L0 is the linear distance between the central sections of the river channel at the two monitoring points.
The self-purification capacity of the river is calculated through the self-purification rate and the comprehensive attenuation coefficient of the pollutants.
The self-purification rate R0 reflects the reduction amount of the concentration as follows:
Among them, C0 and C1 are the concentrations of the water quality indicators at the upstream section and the downstream section of the river reach, respectively.
The self-purification rate per unit length R reflects the change in the concentration of pollutants over a unit distance as follows:
The comprehensive attenuation coefficient K (unit: d−1) of river pollutants reflects the reduction rate of pollutant concentration, and the calculation formula is as follows:
Among them, V represents the average flow velocity of the river reach; the other parameters are the same as above.
The higher the self-purification rate of the river reach, the stronger the self-purification capacity of the river reach for pollutants. The self-purification rate per unit length of dissolved oxygen is represented by -R(DO), and the calculation method is to take the negative value of the formula, which means the growth rate per unit length of the dissolved oxygen.
3. Results
3.1. Self-Purification Capacity of Meandering Rivers Under Natural Conditions
As shown in Figure 2, the monitoring data reveal the following consistent trends in water quality parameters between the two study periods under natural conditions:
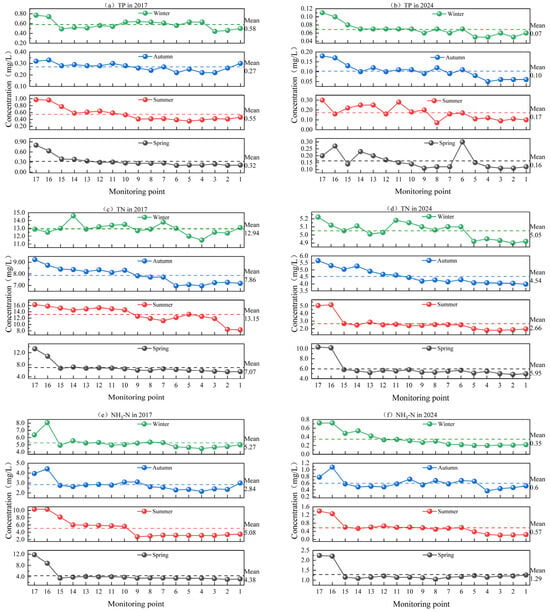
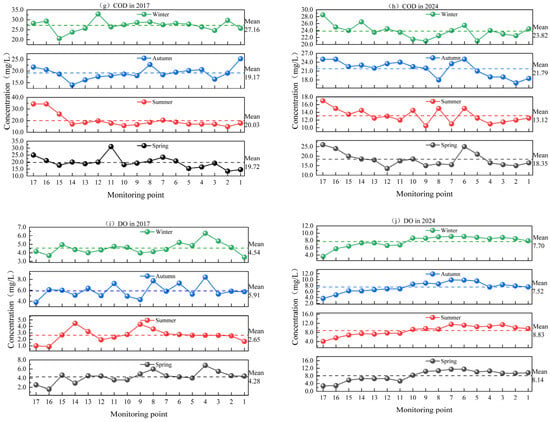
Figure 2.
Water quality concentration variation trends in the monitored river reach: (a,b) the changing trend of TP concentrations in 2017 and 2024; (c,d) the changing trend of TN concentrations in 2017 and 2024; (e,f) the changing trend of NH3-N concentrations in 2017 and 2024; (g,h) the changing trend of COD concentrations in 2017 and 2024; (i,j) the changing trend of DO concentrations in 2017 and 2024.
(1) Judging from the change trend chart of the water quality indicators, under natural conditions, each water quality indicator showed a similar change trend for the two periods. Among them, the concentrations of the indicators TP, TN, and NH3-N in the monitored river reach showed an oscillating downward trend, with a significant decrease in amplitude; the change range of the COD concentration was relatively drastic, but it also showed a downward trend as a whole; the change of the DO concentration was completely opposite to the previous four items, showing an obvious oscillating upward trend. The average concentrations of TP, TN, NH3-N, COD, and DO in 2017 were 0.43 mg/L, 10.19 mg/L, 4.42 mg/L, 21.61 mg/L, and 4.31 mg/L, respectively, which were 3.33 times, 2.24 times, 6.30 times, 1.16 times, and 0.54 times of the average concentrations in 2024, respectively. From Monitoring Point 6 to Monitoring Point 3, the annual average concentrations of TP, TN, NH3-N, COD, and DO in 2017 were 0.35 mg/L, 9.49 mg/L, 3.37 mg/L, 20.23 mg/L, and 4.95 mg/L, respectively. These values are 3.28 times, 2.31 times, 5.88 times, 1.06 times, and 0.51 times the annual average concentrations in 2024, respectively.
The concentrations of various water quality indicators in 2024 were significantly lower than those in 2017, indicating that the water quality in 2024 was significantly better than that in 2017. After the restoration and treatment of the river, the water quality of the river reach has been significantly improved.
(2) Variation rates of parameter concentrations along the entire monitored reach in 2017 and 2024 are shown in Figure 3.
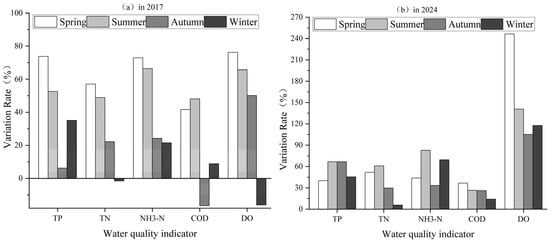
Figure 3.
Variation rates of parameter concentrations along the entire monitored reach: (a) variation rates of various indicators in river channels during 2017; (b) variation rates of various indicators in river channels during 2024.
With the exception of TN and COD in autumn 2017 and DO in winter 2017, the reduction rates of TP, TN, NH3-N, and COD, as well as the increase rate of DO were all positive across the different seasons during the monitoring periods. This indicates that the Shiwuli River exhibits natural purification effects on nitrogen, phosphorus, and chemical oxygen demand under undisturbed conditions. The key findings are as follows: TP showed the highest reduction rate (73.75%) in spring 2017; TN achieved its peak reduction (60.83%) in summer 2024; NH3-N demonstrated the most significant removal (82.73%) in summer 2024; COD had its maximum reduction (48.10%) in summer 2017; DO exhibited the most notable increase (246.43%) in spring 2024. Particularly noteworthy is the pronounced longitudinal increase in DO concentrations, with 2024’s annual growth rates consistently surpassing 2017 levels, indicating more favorable in-stream conditions for DO enrichment in 2024.
The marked variation patterns observed across all five water quality parameters after fluvial transport provide preliminary evidence that the meandering river morphology positively influences contaminant attenuation, confirming the inherent self-purification capacity of sinuous river systems under natural conditions. The abnormal variations in COD, TN, and DO during the autumn and winter of 2017 may be attributed to two causes: reduced temperatures weakening the capacity for organic matter degradation and nitrification reactions, and the freezing of the water surface in the winter disrupting the water reoxygenation.
(3) The reduction rates of pollutant concentrations in wetlands and river channels are shown in Figure 4.
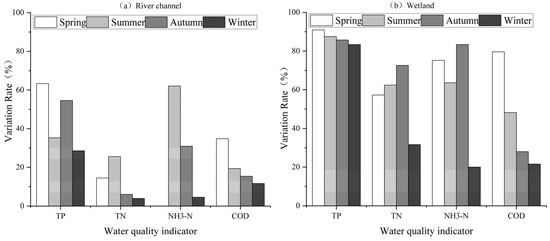
Figure 4.
Pollutant concentration reduction rate in wetland section: (a) variation rates of various indicators in river channels; (b) variation rates of various indicators in wetland.
Comparison of the water quality purification effects between the wetland and the river channel. As can be seen from the reduction rate chart, the maximum reduction rates of TP, TN, NH3-N, and COD in the wetland are 90.90%, 72.56%, 83.33%, and 79.89%, respectively; while, in the river channel, the maximum reduction rates are 63.33%, 25.50%, 62.07%, and 34.80%, respectively. The purification effect of the wetland on the various water quality indicators is significantly higher than that of the river channel, indicating that a longer and wider river channel is conducive to improving the self-purification capacity of water bodies.
3.2. Curvature and Self-Purification Capacity Correlation Analysis
3.2.1. Relationship Between River Sinuosity and Water Self-Purification Capacity
To elucidate the correlation between channel sinuosity and aquatic self-cleaning potential, the study reach was divided into eight distinct segments: 1–2, 2–4, 4–7, 7–9, 9–11, 11–13, 13–15, and 15–17. These segments exhibited sinuosity indices ranging from 1.00 to 1.84. Except for the different curvatures of the monitoring section 4–7 in 2017 and 2024, the curvatures of the other river sections are the same. The curvatures of each section are 1.00, 1.14, 1.84 (1.35 in 2024), 1.09, 1.42, 1.08, 1.22, and 1.56, respectively. Except for the different curvatures, the river channel index conditions, such as the riparian slope structure, vegetation conditions, climate, and river channel width of each curved section are basically similar.
The linear relationship diagrams between each index and the degree of curvature are shown in Figure 5.
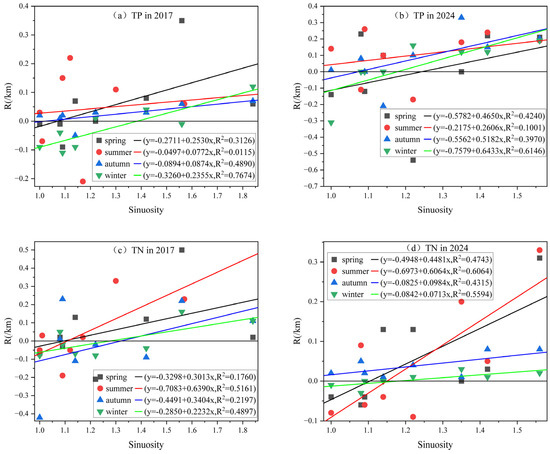
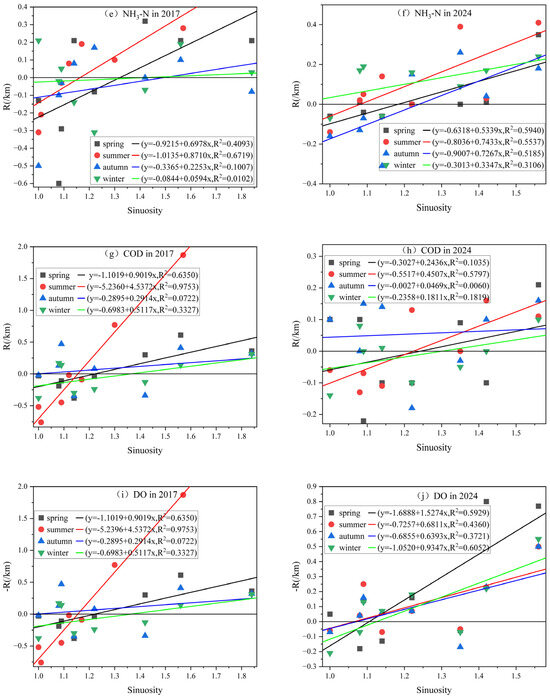
Figure 5.
Relationship between sinuosity and self-purification rate per unit channel length: (a,b) Linear Relationship Plot between TP and Sinuosity; (c,d) Linear Relationship Plot between TN and Sinuosity; (e,f) Linear Relationship Plot between NH3-N and Sinuosity; (g,h) Linear Relationship Plot between COD and Sinuosity; (i,j) Linear Relationship Plot between DO and Sinuosity.
Further calculation of the unit length variation rate of pollutant indicators across different sinuosity segments was conducted, followed by a linear regression analysis with the following results:.
As can be seen from the correlation diagram, there is a positive impact between the self-purification rate per unit length of the water quality indicators in each season of the two years and the curvature. As the curvature increases, the self-purification rate will change from negative to positive. Among them, in order to make the reduction rates of TP, TN, NH3-N, and COD, and the growth rate of DO change from negative to positive in each season, in 2017, the curvature of the river needs to be greater than 1.38 (in spring), 1.32 (in summer), 1.49 (in autumn), and 1.36 (in winter), respectively. It shows that the reduction effect on TN is the best and the required curvature is the lowest; the reduction effect on NH3-N is the worst. To ensure that the self-purification rate per unit length of the water quality indicators in the monitored river reach is greater than zero under natural conditions, the curvature of the monitored river reach needs to reach 1.49. However, the curvature of the river in the study reach in 2017 is 1.48, and the curvature cannot fully meet the self-purification needs of the river.
In 2024, the reduction rates of TP, TN, NH3-N, and COD, and the growth rate of DO in each season change from negative to positive. The curvature of the river needs to be greater than 1.24 (in spring), 1.23 (in summer), 1.24 (in autumn), 1.30 (in winter), respectively. It shows that the purification effects on DO and TN are the best and the required curvature is the lowest. To ensure that the self-purification rates of various water quality indicators in the monitored river reach change from negative to positive under natural conditions, the curvature needs to reach 1.30. And the curvature of the river in the monitored reach in 2024 is 1.38, which can meet the self-purification needs of the river.
In order to achieve the change of the self-purification effect on the indicators from negative to positive for the two periods, a higher river curvature is required in a low-temperature environment (autumn and winter), especially in winter. It can be inferred that a lower temperature will reduce the self-purification capacity of meandering rivers. To support this view, the comprehensive attenuation coefficient of the pollutants is calculated, and the purification rates for each indicator under different seasons and temperatures are compared.
The statistical table of comprehensive attenuation coefficient for across the entire monitoring section are shown in Table 1.

Table 1.
Statistical Table of Comprehensive Attenuation Coefficients for Pollutants Across the Entire Monitoring Section.
In terms of the data, the values of K(TP) range from 0.0114 to 0.3662 d−1; K(TN) from 0.0148 to 0.3125 d−1; K(NH3-N) from 0.0362 to 0.5855 d−1; K(COD) from 0.0139 to 0.1155 d−1; and K(DO) from 0.0715 to 0.3765 d−1. The comprehensive attenuation coefficients in 2024 are higher than those in 2017, with the maximum values occurring in summer and the minimum values in winter. This indicates that the degradation rate is the fastest in the summer, and the water purification capacity is the strongest, while the degradation rate is the slowest in the winter.
In summary, under higher temperature conditions, meandering rivers have a greater impact on the self-purification capacity of the river. Moreover, in the same season, the curvature required in 2024 is smaller than that in 2017, and the purification rate in 2024 is faster than that in 2017, indicating that the presence of wetlands can significantly enhance the self-purification capacity and rate of meandering rivers.
3.2.2. Correlation Between the River Curvature and the Self-Purification Capacity of Water Bodies
In order to further clarify the correlation between the river curvature and the self-purification capacity of water bodies, SPSS v. 30.0 was used to conduct a correlation analysis between the change rate per unit length of the water quality indicators and the curvature. The results are shown in Table 2.

Table 2.
Correlation analysis between water quality index variation rates and sinuosity (2017).
To exclude the wetland effects, the correlation analysis was recalculated after removing two meandering segments (2–4 and 4–7) in 2024, with the results shown in Table 3.

Table 3.
Correlation analysis between water quality index variation rates and sinuosity (2024).
The results indicate that, within the investigated river sinuosity range (1.0–1.84), varying degrees of positive correlation exist between the river sinuosity and the change rates of TP, TN, NH3-N, COD, DO. Among them, there is a correlation between R(TP) and the curvature with p < 0.01 in autumn 2024, and p < 0.05 in summer and autumn 2017; there is a correlation between R(TN) and the curvature with p < 0.01 in winter 2017, and p < 0.05 in spring and autumn 2024; there is a correlation between R(NH3-N) and the curvature with p < 0.05 in spring, summer, and autumn 2024; there is a correlation between R(COD) and the curvature with p < 0.01 in autumn 2024, and p < 0.05 in summer 2017, and in spring, summer, and winter 2024; there is a correlation between -R(DO) and the curvature with p < 0.01 in summer 2017, and in spring and winter 2024, and p < 0.05 in spring 2017, and in summer and autumn 2024. As the curvature increases, there is a significant correlation between -R(DO) and the curvature, indicating that, as the curvature increases, the growth rate per unit length of DO increases, and the growth rate of DO is consistent with the changes in the reduction rates of TP, TN, NH3-N, and COD.
4. Discussion
This study found that, in the summer with relatively high temperatures, the water self-purification capacity of meandering river channels with wetlands is the strongest.
Among the five monitored water quality indicators, the increase in the river curvature has the greatest impact on the DO content. An increase in the river curvature enhances the impact of the water flow on the riverbank. When the river impacts the riverbank slope, eddies are generated, which increases the oxygenation of the water body and leads to an increase in DO. The river curvature also significantly affects the reduction rates and reduction speeds of TN and NH3-N. The potential mechanisms are as follows: (1) Compared with straight river channels at the same scale, meandering river channels are longer in length, which prolongs the time for water purification [23]. (2) The correlation between the river curvature and the self-purification rate per unit length of DO is the most significant. As the river curvature increases, the growth rate of DO changes from negative to positive, and the content gradually increases, accelerating the nitrification reaction of the water body, and promoting the oxidation and decomposition of nitrogen. (3) An increase in the river curvature will strengthen the impact force of the water body on the riverbank and enhance the hyporheic exchange [27]. Hyporheic exchange will increase the contact between river water and pore water, increase the amount of substance exchange, and play a role in purifying the water quality [28].
There are positive correlations at different levels between the river curvature and the reduction rate of TP in different seasons. The potential mechanisms are as follows: (1) The slower water flow speed in meandering rivers is conducive to the sedimentation of solid phosphorus. (2) As the river curvature increases, the DO content gradually increases, accelerating the conversion of organic phosphorus into occluded phosphates. (3) As the curvature increases, the hyporheic exchange will be enhanced. The water in the hyporheic zone will also exchange with the river water. When the phosphorus-containing river water enters the hyporheic zone, phosphorus will be adsorbed on the surface of sediment particles, reducing the phosphorus content in the water body. (4) The seasonal variations in phosphorus (TP) removal efficiency can be attributed to the following multiple interacting factors: summer and autumn typically exhibit higher flow velocities and shorter hydraulic retention times, which may enhance the physical adsorption processes; winter conditions, with lower temperatures, reduce microbial activity and chemical reaction rates for phosphorus transformation. Microbial-mediated phosphorus cycling shows strong temperature sensitivity (optimal range: 20–30 °C) [29,30].
The river curvature is significantly correlated with the reduction rate of COD. The potential mechanism is that meandering rivers have a higher DO content. In the aerobic environment provided by DO, aerobic microorganisms can effectively decompose and convert the organic pollutants in COD, thus reducing the COD content. Moreover, in meandering rivers, the water flow speed is slower, which prolongs the time for water purification.
Wetlands can significantly enhance the self-purification capacity of meandering rivers. The potential mechanisms are as follows: (1) There is a positive correlation between water temperature and the pollutant purification rate [31]. As the temperature rises, the biochemical reaction rate accelerates, which is beneficial to the metabolic activities of microorganisms, thereby enhancing the removal effect of pollutants. There are a large number of biological species and quantities in wetlands, and a higher water temperature is more conducive to water purification [32]. (2) The concentration of dissolved oxygen (DO) is an important measure of water quality and river metabolism [33]. Wetland plants (e.g., reeds, duckweeds) and daytime algae release substantial oxygen through photosynthesis, particularly in well-lit shallow zones. Hydrological exchange between wetlands and rivers/groundwater enhances water flow, facilitating oxygen dissolution (e.g., via turbulent mixing). Therefore, dissolved oxygen (DO) levels in wetlands are generally high. A higher DO content promotes the ammonification and nitrification reactions of nitrogen, the reduction of COD, and the acceleration of the conversion of some organic phosphorus into occluded phosphates, and it maintains the biological community and ensures the health of the water environment [34,35]. (3) The water flow in wetlands is slow, the water surface is wider, and the runoff is longer, so the water purification time is longer. In addition, wetlands can efficiently remove pollutants through plant absorption, physical sedimentation, and microbial metabolism [36,37].
In conclusion, in the same environment, meandering rivers with wetland systems have a stronger self-purification capacity. Therefore, in the process of river restoration, the self-purification capacity of rivers can be quickly restored and a healthy ecological environment of the river channel can be maintained by increasing the river curvature and constructing artificial wetlands.
5. Conclusions
This study analyzed the relationship between river morphology and water self-purification capacity through water quality monitoring in the downstream section of the Shiwuli River entering Chaohu Lake. The influencing factors and mechanisms of self-purification in meandering rivers were also discussed. The conclusions are as follows:
(1) Meandering rivers exhibit self-purification capacity, with the highest purification rate and strongest self-purification ability occurring in summer under higher temperatures. River sinuosity shows a positive correlation with the unit length self-purification rates of TP, TN, NH3-N, COD, and DO, indicating that greater sinuosity enhances water self-purification.
(2) Wetlands improve the self-purification capacity and rate of river channels, reducing the required sinuosity for effective self-purification from 1.49 to 1.30.
(3) Enhancing river sinuosity and establishing wetlands prolongs the hydraulic retention time by extending the channel length and width, while intensifying hyporheic exchange and elevating DO levels—thereby improving the waterbody’s self-purification capacity.
These findings provide a reference for river restoration and management in urbanized areas. Further physical model experiments will be conducted to refine the relationship between river morphology and water self-purification.
Author Contributions
Conceptualization, C.X. and Z.C.; methodology, C.X., D.C. and Z.C.; software, Z.L.; validation, C.X., D.C. and Z.C.; formal analysis, C.X., Z.C. and Y.L.; investigation, C.X.; data curation, Z.C., Q.O. and Y.Z.; writing—original draft preparation, Z.C.; writing—review and editing, C.X. and Z.C.; visualization, Z.C.; supervision, C.X.; project administration, C.X.; funding acquisition, C.X. All authors have read and agreed to the published version of the manuscript.
Funding
This research was funded by National Natural Science Foundation of China (grant number 52209002); and Natural Science Foundation of Anhui Province (grant number 2208085US09).
Data Availability Statement
All data generated or analyzed during this study are included in this published article.
Conflicts of Interest
There is no conflict of interest in this article.
References
- Xu, Z.; Peng, D.; Pang, B.; Zuo, D.; Song, J.; Zhang, X.; Wang, X.; Zhan, C.; Liu, Z.; Yin, X. Theoretical Basis and Calculation Method for Ecological Base Flow for Rivers: Case Study in the Guanzhong Reach of the Wei River. Science: Beijing, China, 2016. (In Chinese) [Google Scholar]
- Jiang, X.; Xu, S.; Liu, Y.; Wang, X. River ecosystem assessment and application in ecological restorations: A mathematical approach based on evaluating its structure and function. Ecol. Eng. 2015, 76, 151–157. [Google Scholar] [CrossRef]
- Giller, P.S. River restoration: Seeking ecological standards. Editor's introduction. J. Appl. Ecol. 2005, 42, 201–207. [Google Scholar] [CrossRef]
- Grill, G.; Lehner, B.; Thieme, M.; Geenen, B.; Tickner, D.; Antonelli, F.; Babu, S.; Borrelli, P.; Cheng, L.; Crochetiere, H. Mapping the world’s free-flowing rivers. Nature 2019, 569, 215–221. [Google Scholar] [CrossRef] [PubMed]
- Walsh, C.J.; Roy, A.H.; Feminella, J.W.; Cottingham, P.D.; Groffman, P.M.; Morgan, R.P. The urban stream syndrome: Current knowledge and the search for a cure. J. North Am. Benthol. Soc. 2005, 24, 706–723. [Google Scholar] [CrossRef]
- Rohde, S.; Hostmann, M.; Peter, A.; Ewald, K. Room for rivers: An integrative search strategy for floodplain restoration. Landsc. Urban Plan. 2006, 78, 50–70. [Google Scholar] [CrossRef]
- Perşoiu, I.; Rădoane, M. Spatial and temporal controls on historical channel responses–study of an atypical case: Someşu Mic River, Romania. Earth Surf. Process. Landf. 2011, 36, 1391–1409. [Google Scholar] [CrossRef]
- Buijse, A.D.; Coops, H.; Staras, M.; Jans, L.; Van Geest, G.; Grift, R.; Ibelings, B.W.; Oosterberg, W.; Roozen, F.C. Restoration strategies for river floodplains along large lowland rivers in Europe. Freshw. Biol. 2002, 47, 889–907. [Google Scholar] [CrossRef]
- Chen, Y.; Dong, J.; Xiao, X.; Zhang, M.; Tian, B.; Zhou, Y.; Li, B.; Ma, Z. Land claim and loss of tidal flats in the Yangtze Estuary. Sci. Rep. 2016, 6, 24018. [Google Scholar] [CrossRef]
- Li, Z.; Yan, C.; Boota, M.W. Review and outlook of river morphology expression. J. Water Clim. Change 2022, 13, 1725–1747. [Google Scholar] [CrossRef]
- Islam, M.R.; Mohonto, S.; Noor, F. Evolution of Char lands in the Padma River in Bangladesh and its impacts on planform morphology of the river. Results Earth Sci. 2025, 3, 100075. [Google Scholar] [CrossRef]
- Arfa, A.; Ayyoubzadeh, S.A.; Shafizadeh-Moghadam, H.; Mianabadi, H. Transboundary hydropolitical conflicts and their impact on river morphology and environmental degradation in the Hirmand Basin, West Asia. Sci. Rep. 2025, 15, 2754. [Google Scholar] [CrossRef] [PubMed]
- Meckenstock, R.U.; Elsner, M.; Griebler, C.; Lueders, T.; Stumpp, C.; Aamand, J.; Agathos, S.N.; Albrechtsen, H.-J.; Bastiaens, L.; Bjerg, P.L. Biodegradation: Updating the concepts of control for microbial cleanup in contaminated aquifers. Environ. Sci. Technol. 2015, 49, 7073–7081. [Google Scholar] [CrossRef]
- Wei, G.; Yang, Z.; Cui, B.; Li, B.; Chen, H.; Bai, J.; Dong, S. Impact of dam construction on water quality and water self-purification capacity of the Lancang River, China. Water Resour. Manag. 2009, 23, 1763–1780. [Google Scholar] [CrossRef]
- Mirauda, D.; Caniani, D.; Colucci, M.T.; Ostoich, M. Assessing the fluvial system resilience of the river Bacchiglione to point sources of pollution in Northeast Italy: A novel Water Resilience Index (WRI) approach. Environ. Sci. Pollut. Res. 2021, 28, 36775–36792. [Google Scholar] [CrossRef] [PubMed]
- Green, M.O.; Coco, G. Review of wave-driven sediment resuspension and transport in estuaries. Rev. Geophys. 2014, 52, 77–117. [Google Scholar] [CrossRef]
- Tian, S.; Wang, Z.; Shang, H. Study on the Self-purification of Juma River. Procedia Environ. Sci. 2011, 11, 1328–1333. [Google Scholar] [CrossRef]
- Guzelj, M.; Hauer, C.; Egger, G. The third dimension in river restoration: How anthropogenic disturbance changes boundary conditions for ecological mitigation. Sci. Rep. 2020, 10, 13106. [Google Scholar] [CrossRef]
- Zingraff-Hamed, A.; Greulich, S.; Pauleit, S.; Wantzen, K.M. Urban and rural river restoration in France: A typology. Restor. Ecol. 2017, 25, 994–1004. [Google Scholar] [CrossRef]
- Kumar, B.A.; Gopinath, G.; Chandran, M.S. River sinuosity in a humid tropical river basin, south west coast of India. Arab. J. Geosci. 2014, 7, 1763–1772. [Google Scholar] [CrossRef]
- Mueller, J.E. An introduction to the hydraulic and topographic sinuosity indexes. Ann. Assoc. Am. Geogr. 1968, 58, 371–385. [Google Scholar] [CrossRef]
- Chen, L.; Ji, H.; Zhang, L. Controls on the sinuosity of alluvial meandering rivers with scroll bars. Arab. J. Geosci. 2022, 15, 1–8. [Google Scholar] [CrossRef]
- Xiao, C.; Chen, J.; Chen, D.; Chen, R. Effects of river sinuosity on the self-purification capacity of the Shiwuli River, China. Water Supply 2019, 19, 1152–1159. [Google Scholar] [CrossRef]
- Xiao, C.; Chen, J.; Yuan, X.; Chen, R.; Song, X. Model test of the effect of river sinuosity on nitrogen purification efficiency. Water 2020, 12, 1677. [Google Scholar] [CrossRef]
- Xiao, C.; Chen, J.; Chen, D.; Chen, R.; Song, X. Mechanism of sinuosity effect on self-purification capacity of rivers. Environ. Sci. Pollut. Res. 2023, 30, 112184–112193. [Google Scholar] [CrossRef]
- Jiahui, H. Study on the River Meandering Degree Impact on the River Self-Purification Capacity; South China University of Technology: Guangzhou, China, 2014. [Google Scholar]
- Poole, G.C.; Fogg, S.K.; O’Daniel, S.J.; Amerson, B.E.; Reinhold, A.M.; Carlson, S.P.; Mohr, E.J.; Oakland, H.C. Hyporheic hydraulic geometry: Conceptualizing relationships among hyporheic exchange, storage, and water age. PLoS ONE 2022, 17, e0262080. [Google Scholar] [CrossRef]
- Jin, G.; Yuan, H.; Zhang, G.; Zhang, Z.; Chen, C.; Tang, H.; Li, L. Effects of bed geometric characteristics on hyporheic exchange. J. Hydro-Environ. Res. 2022, 43, 1–9. [Google Scholar] [CrossRef]
- Luoqi, Z.; Denggao, F.; Xiaoni, W.; Change, L.; Xinqi, Y.; Sichen, W.; Changqun, D. Opposite response of constructed wetland performance in nitrogen and phosphorus removal to short and long terms of operation. J. Environ. Manag. 2024, 351, 120002. [Google Scholar]
- Zhou, Y.; Zhang, H.; Chang, F.; Duan, L.; Li, H.; Wen, X.; Bi, R.; Wu, H.; Zhu, M. Seasonal variations of water quality parameters in Lake Qilu. Adv. Geosci 2017, 7, 487–499. [Google Scholar] [CrossRef]
- Miao, Q.; Wang, C.; Cao, X.J.; Gu, Y.T.; Sun, J.J. The Study on the Correlation between Removal Rate of Pollutants and its Influencing Factors in Xinxue River Constructed Wetland of China. Adv. Mater. Res. 2012, 374, 932–936. [Google Scholar] [CrossRef]
- Yuan, S.; Huang, G.; Chen, W.; Chen, Z.; Yin, X. Study on Relationship between Seasonal Temperatures and Municipal Wastewater Pollutant Concentration and Removal Rate. In Proceedings of the MATEC Web of Conferences, Amsterdam, Netherlands, 23–25 March 2016; p. 14007. [Google Scholar]
- Zhi, W.; Ouyang, W.; Shen, C.; Li, L. Temperature outweighs light and flow as the predominant driver of dissolved oxygen in US rivers. Nat. Water 2023, 1, 249–260. [Google Scholar] [CrossRef]
- Chi, L.; Song, X.; Yuan, Y.; Wang, W.; Zhou, P.; Fan, X.; Cao, X.; Yu, Z. Distribution and key influential factors of dissolved oxygen off the Changjiang River Estuary (CRE) and its adjacent waters in China. Mar. Pollut. Bull. 2017, 125, 440–450. [Google Scholar] [CrossRef] [PubMed]
- Froehlich, H.E.; Hennessey, S.M.; Essington, T.E.; Beaudreau, A.H.; Levin, P.S. Spatial and temporal variation in nearshore macrofaunal community structure in a seasonally hypoxic estuary. Mar. Ecol. Prog. Ser. 2015, 520, 67–83. [Google Scholar] [CrossRef]
- Li, H.; Zhang, G.; Li, X.; Gao, R. Spatial Characteristics of Water Quality of Wetland in Northeast China–the Case of Zhalong Wetland. Procedia Environ. Sci. 2012, 12, 1024–1029. [Google Scholar] [CrossRef]
- Li, J.; Han, S.; He, Z.; Cao, T.; Han, S.; Li, T.; Li, J.; Jia, J.; Qin, W.; He, Y. Micro-polluted water source purification of root channel wetland in Jiaxing, China. Water Environ. Res. 2024, 96, e11112. [Google Scholar] [CrossRef]
Disclaimer/Publisher’s Note: The statements, opinions and data contained in all publications are solely those of the individual author(s) and contributor(s) and not of MDPI and/or the editor(s). MDPI and/or the editor(s) disclaim responsibility for any injury to people or property resulting from any ideas, methods, instructions or products referred to in the content. |
© 2025 by the authors. Licensee MDPI, Basel, Switzerland. This article is an open access article distributed under the terms and conditions of the Creative Commons Attribution (CC BY) license (https://creativecommons.org/licenses/by/4.0/).