Article

Catastrophic Precipitation in the City of Bielsko-Biała (Polish Carpathian Mountains) and Their Synoptic Circumstances (1951–2024)

1
Faculty of Geography and Geology, Jagiellonian University, ul. Gronostajowa 7, 30-387 Kraków, Poland
2
Institute of Meteorology and Water Management-National Research Institute, ul. Piotra Borowego 14, 30-215 Kraków, Poland
3
Faculty of Environmental and Power Engineering, Cracow University of Technology, ul. Warszawska 24, 31-155 Kraków, Poland
*
Author to whom correspondence should be addressed.
Water 2025, 17(11), 1611; https://doi.org/10.3390/w17111611
Submission received: 22 April 2025 / Revised: 18 May 2025 / Accepted: 20 May 2025 / Published: 26 May 2025
(This article belongs to the Section Water and Climate Change)

Abstract

:
Catastrophic precipitation is an inherent feature of temperate climates. Its occurrence is a manifestation of climate change, but also of the variability of atmospheric circulation. Mountainous areas may be particularly vulnerable as they receive more precipitation and are also areas where relief plays an important role in modifying the distribution of precipitation. One such area is the Polish Western Carpathian Mountains, especially the area around the city of Bielsko-Biała, located at their foot and directly exposed to rain-bearing winds. In 2024, two episodes of unusually heavy precipitation in quick succession occurred in this area, resulting in severe damage to infrastructure. This painful experience inspired a study focusing on the frequency of such catastrophic precipitation events and their synoptic circumstances spanning the period from the mid-20th century to the present day. Daily precipitation totals covering the study period of 74 years were used to identify a category of catastrophic precipitation (here set at above 100 mm). The six events identified to match the criteria appeared from May to September, always accompanied by cyclonic circulation types with advection from the northern sector and with a cyclonic trough situation over southern Poland. The study showed that the leading role in their formation was played by deep convection, especially a Genoa low moving along the Vb Van Bebber track. The damage and destruction suffered as a result were a consequence of the cumulative impact of high-intensity rainfall, itself caused by a combination of specific synoptic thermodynamic and orographic conditions.

1. Introduction

There has been a proliferation of extreme weather phenomena whose occurrence might be attributed to, among other factors, climatic warming [1] and changes in atmospheric circulation [2]. A growing body of research into these phenomena points to an increase in both their frequency and intensity, a reason sufficient to warrant their constant monitoring. Atmospheric precipitation stands out as one of the most significant of the said phenomena due to the significant role it plays in the overall water circulation system. A shortage or an excess of precipitation can trigger other types of dangerous hydrometeorological phenomena, such as droughts and floods. A heavy precipitation event may also directly cause damage or destruction to physical infrastructure and property, both public and private, leading to financial losses. As is aptly highlighted by Sen et al. [3], the management of water resources depends on the occurrence of alternating periods with excess and deficit of precipitation. For this reason, the understanding of statistical characteristics of their patterns of occurrence, again highlighted by Şen et al. [3], is key for optimised and sustainable water demand management. In many areas, especially in temperate climates, very heavy precipitation is an inherent feature of the local climate. This is particularly true about mountainous areas, which tend to receive yet more precipitation. Here, a significant role is played by land relief and slope aspect, as areas exposed to prevailing winds receive more precipitation than those sharing the same altitude and climatic zone but shaded from such winds. One area with geomorphological conditions exceptionally favourable to heavy precipitation is the western section of the Polish Carpathian Mountains exposed to rain-bearing westerly winds [4]. This is where two precipitation episodes, in June and September of 2024, produced unusually high rainfall totals (120 to 150 mm), leading to a massive scale of destruction in the largest local city of Bielsko-Biala and beyond, a development that was widely reported in the Polish media. The phenomenon of the existence of close proximity in time between the occurrence of such events is known as clustering [5]. It is regarded as particularly dangerous for both the economy and the communities affected, as it prevents the damage caused by the first event from being addressed before another strikes, as was the case in Bielsko-Biała. Therefore, one must ask how the frequency of such catastrophic precipitation events in the western Polish Carpathian Mountains relates to their synoptic circumstances. Obtaining such information is the primary aim of this article, which focuses on the period starting in the mid-20th century. In recent years, extreme weather events have considerably upset the environmental equilibrium of the Polish Carpathian Mountains, especially in terms of water retention and management. As this coincides with a process of intensive reconstruction of forest stands in the subalpine zone, fully justified concerns have arisen about maintaining the stability of forest complexes. In addition to extreme precipitation events and their adverse effect on the growth and expansion of spruce stands [6], young generations of trees are experiencing an additional stress factor due to periodic precipitation deficits occurring throughout the duration of the plant growing season. The global rise in air temperatures, which also affects the Polish Carpathian Mountains [7], could be another potential contributor to the increase in the intensity of catastrophic precipitation. Indeed, such events are directly caused by specific circulation systems bringing in air masses with varying thermal and humidity properties, sometimes even from outside the temperate latitudes, for example, from the tropics [8,9,10]. There is a long tradition of precipitation research in the Polish Carpathian Mountains and it covers a broad spectrum of specific aspects of its variability and resolutions ranging from daily to annual [11,12,13,14]. This research proposes that the occurrence of heavy daily precipitation is predicated by the type of pressure system and direction of air mass advection [15,16,17,18]. This is especially true for exceptionally heavy rainfall events that cause summer floods, and which occur in certain types of synoptic situations associated with air advection from the northern sector [13,15,16,19,20,21,22,23]. Most of the focus has been on maximum precipitation and its circulation-related determinants [10,20,21]. This category of precipitation has caused numerous regional-scale floods affecting significant portions of the Polish Carpathian Mountains [24,25]. There is a realisation, however, that our understanding of the occurrence of catastrophic precipitation in mountain areas remains insufficient [5].

2. Study Area, Data, and Methodology

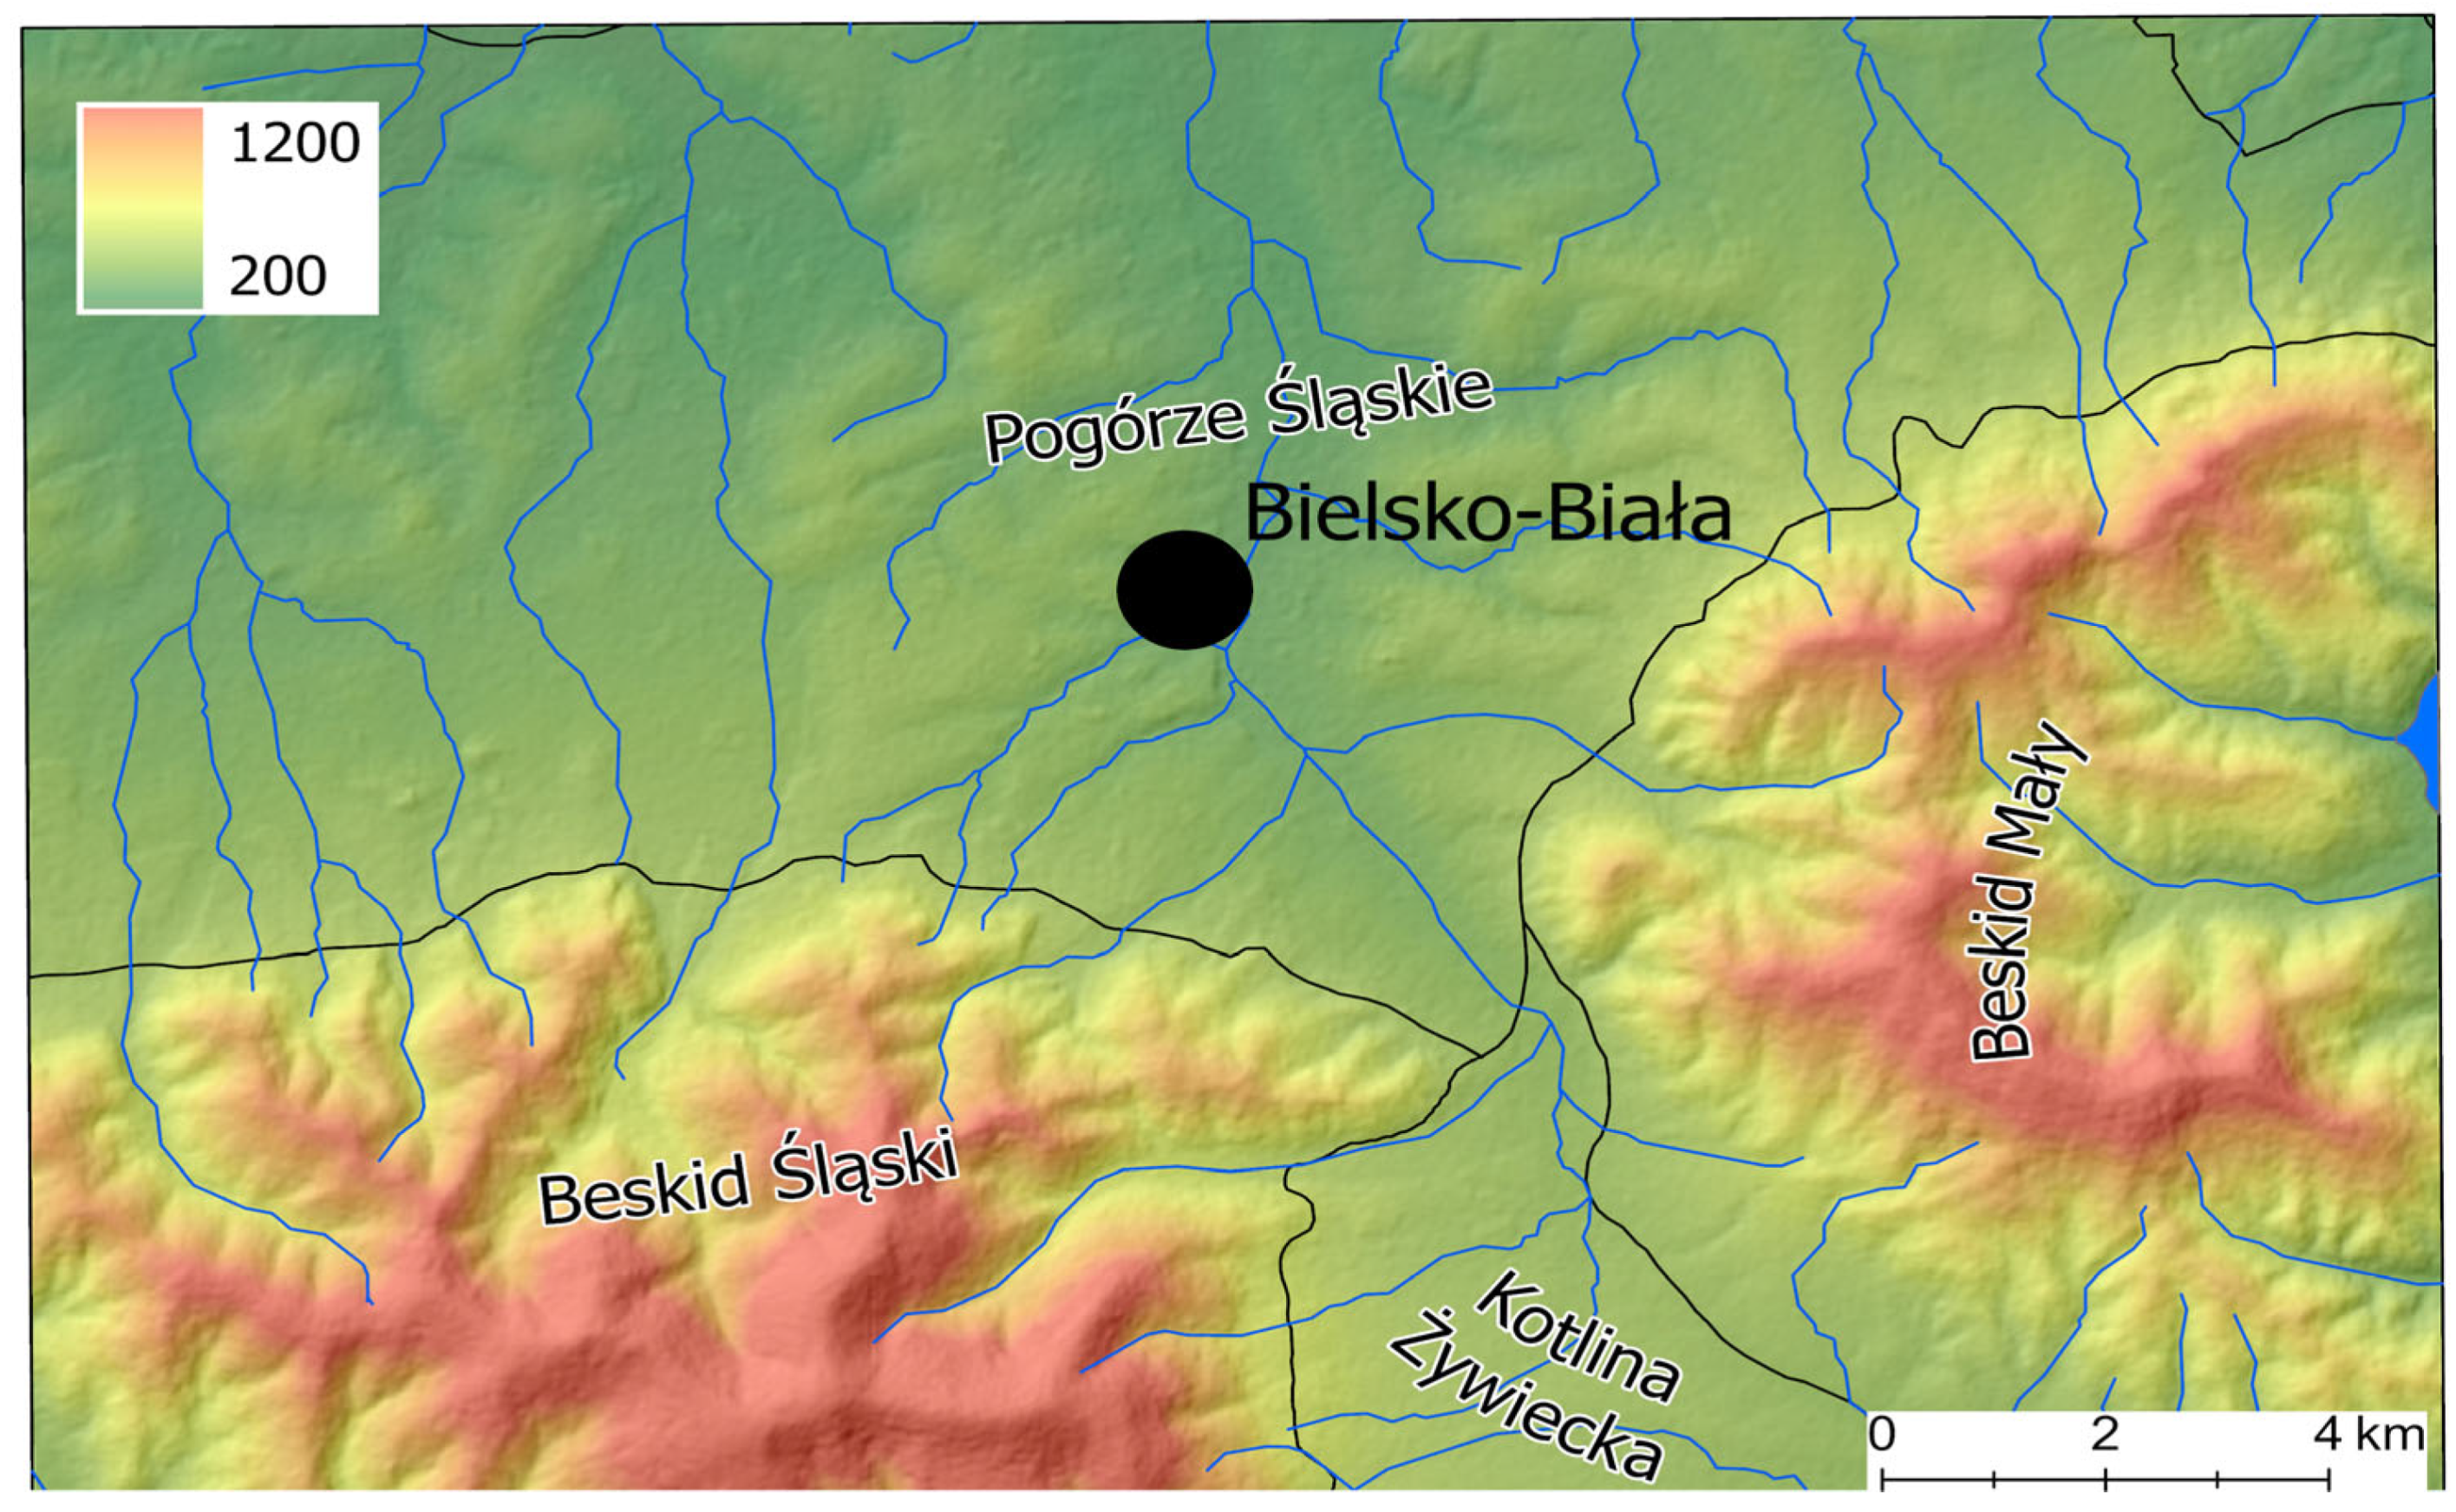
The study area covers the entirety of the Polish Carpathian Mountains, which occupy a 300 km stretch of southern Poland. They are composed of several longitudinally oriented mountain ranges (typically known under two-part names sharing the common component of ‘Beskidy’), with foothills in their northern foreland. Beskid Śląski, the westernmost of these ranges, comprises a series of compact mountain massifs aligned along the SW-NE axis peaking at 900–1200 m above sea level, bounded by a denudational threshold at 500–800 m above sea level, descending northwards and tailing off in a narrow band of foothills 10–15 km wide [5]. The city of Bielsko-Biała (population of c 160 thousand) is located in these foothills (Figure 1) at about 300–400 m above sea level in a region with a mountain climate [26].
The specific location of Bielsko-Biała certainly has a significant influence on its general climatic and precipitation-related conditions, with relief playing a key role in determining both the distribution of precipitation and the surface runoff into the area. Specifically, the city is on the receiving end of a dense hydrographic network of rivers and streams (Figure 2) characterised by steep gradients channelling runoff to the north from the hills in the south. The study area is characterised by a mean annual temperature of less than 7 °C and a long-term average annual precipitation of more than 1000 mm [26].
The study relies on daily precipitation totals for its basic data. This particular multi-year dataset is homogeneous with regard to time and place of measurement and covers the period from 1951 to 2024. The dataset was recorded at the synoptic station in Bielsko-Biała (no. WMO 12600, φ = 19°00′04″ λ = 49°48′29″) and was obtained from the Institute of Meteorology and Water Management-National Research Institute (IMGW-PIB) of the Polish meteorological service.
For the synoptic analysis, the hourly totals for June and September 2024 were also included. The calendar of atmospheric circulation types over southern Poland by T. Niedźwiedź [18,27,28] was used to determine the circulation conditions for the occurrence of catastrophic precipitation. Depending on availability, the synoptic analysis was employed: lower synoptic maps [29,30], distribution of the geopotential field and air temperature at the 500 hPa and 850 hPa isobaric levels (corresponding to 5500 and 1500 m a.s.l. respectively), relative humidity at 700 hPa (3000 m a.s.l.), CAPE [J/kg], or ML CAPE [31]. Radiosonde data from the city of Tarnów (about 140 km to the east) (IMGW-PIB) and radar data (CMAX—column maximum reflectivity, DPSRI—dual-polarisation surface rainfall intensity and VCUT—vertical cut) from a dual-polarisation radar at Ramża (40 km NW from the study area) were also used [32]. The study began by producing a general precipitation characteristic, including basic statistical parameters illustrated with box-and-whisker diagrams and mean and mean standard error. This was followed by identifying the category of catastrophic precipitation, which is defined as exceeding 100 mm of daily precipitation [33]. The empirical probability of these rainfall events was calculated using the following formula:
p(m, N) = (m/N + 1) × 100%
where
m—1, 2, 3…, 74—an item of the distribution sequence of catastrophic daily precipitation totals over the 74 years spanning from 1951 to 2024
N—number of years (74)
p(m, N)—empirical probability as a percentage.
The study went on to characterise the precipitation conditions preceding the catastrophic rainfall events. For this purpose, the number of days with and without precipitation and the standardised precipitation index SPI in the preceding months were used. The values of the standardised precipitation index (SPI) were determined by applying the method proposed by McKee et al. [34,35]. Based on the values of this index, a month with an SPI ≤ −0.5 was considered a dry period, a period with SPI Є (0.50 ÷ −0.50) was considered drought-neutral, while SPI ≥ 0.5 would mean the period was a wet month. These specific criteria represent a refining of the McKee et al. [35] method by Bąk and Łabędzki [36] in their studies of drought in the Wielkopolska and Kujawy regions of Poland spanning the years 1954–1998. The values of the standardised precipitation index (SPI) were calculated according to the following formula [37]:
S P I = u u ¯ d u
where
u = P 3 t r a n s f o r m e d   n o r m a l i s e d   p r e c i p i t a t i o n   t o t a l , m m
P—monthly precipitation total, mm
ū—mean value of the normalised precipitation sequence, mm
du—standard deviation of the normalised precipitation sequence, mm
A synoptic analysis of all the catastrophic precipitation events that were identified constitutes the core of the study.

3. General Characteristics of Precipitation

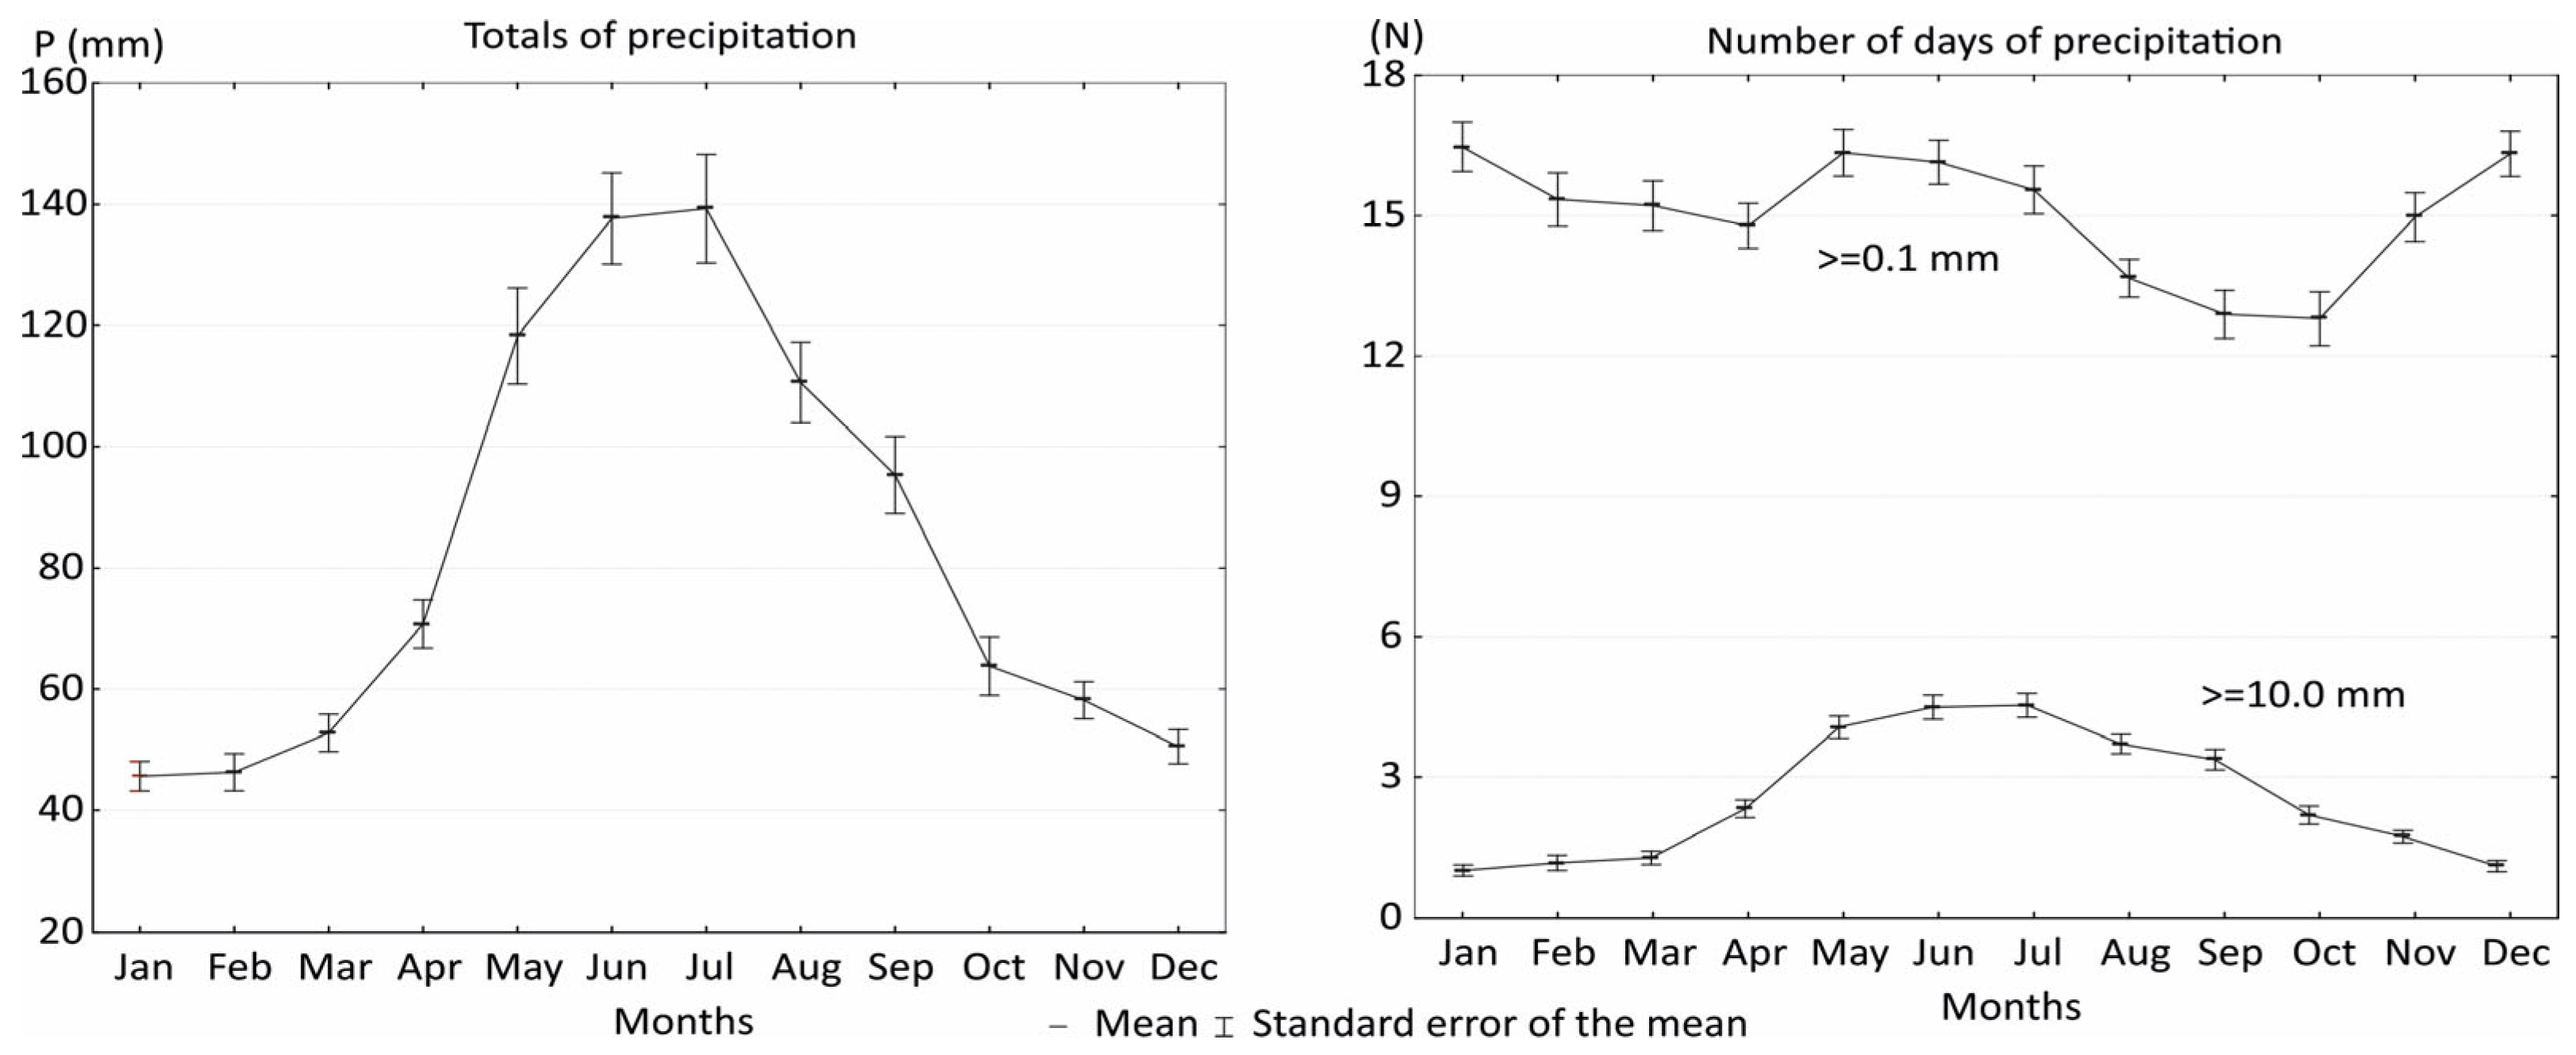
Bielsko-Biała’s location in the westernmost part of the Polish Carpathian Mountains is responsible for the fact that its 988 ± 19 mm multi-year (1951–2024) average annual precipitation is approximately 250 mm more than in the eastern part of the Polish Carpathian Mountains. [38]. Causes for this fact should be sought in the ground relief effect, namely (i) in the longitudinal run of the mountain ranges allowing free flow of moist air masses arriving from the western sector to the study area, and (ii) the altitude where precipitation increases by about 150 mm per 100 m of altitude (up to 500 m above sea level) [39]. Over the course of the study period, annual precipitation does not show statistically significant changes [40,41]. There is, however, evidence of a cyclic fluctuation, including the occurrence of a statistically significant 35-year Brückner cycle [9]. Future projections of precipitation volumes in southern Poland, calculated using RCP 4.5 and RCP 8.5 scenarios, also show no statistically significant change in precipitation up to the year 2100 [7,42]. There are peaks in the annual distribution of precipitation in two summer months, June and July, when their share is about 30% of the annual total and 72% of the summer total, equivalent to three times that of the winter season. This would point to a high degree of continentalism of the climate (Figure 3). A noteworthy feature that sets this section of the Polish Carpathian Mountains apart from the rest of the country is that, on average, it receives more precipitation in May than in August. This is explained by the meridional circulation that typically intensifies in May and the humid air masses it brings from the northern sector, which shed some of their moisture in the mountain foreland and enter the Beskid mountains with much smaller amounts of water vapour.
On average in Bielsko-Biała, about 50% of days in the year (1951–2024) are wet days, but that frequency varies from month to month. In general, the wettest months (≥0.1 mm) are January and December, together with May and June, while the driest ones are September and October (Figure 3). Heavy rainfall (≥10 mm) occurs between May and July.
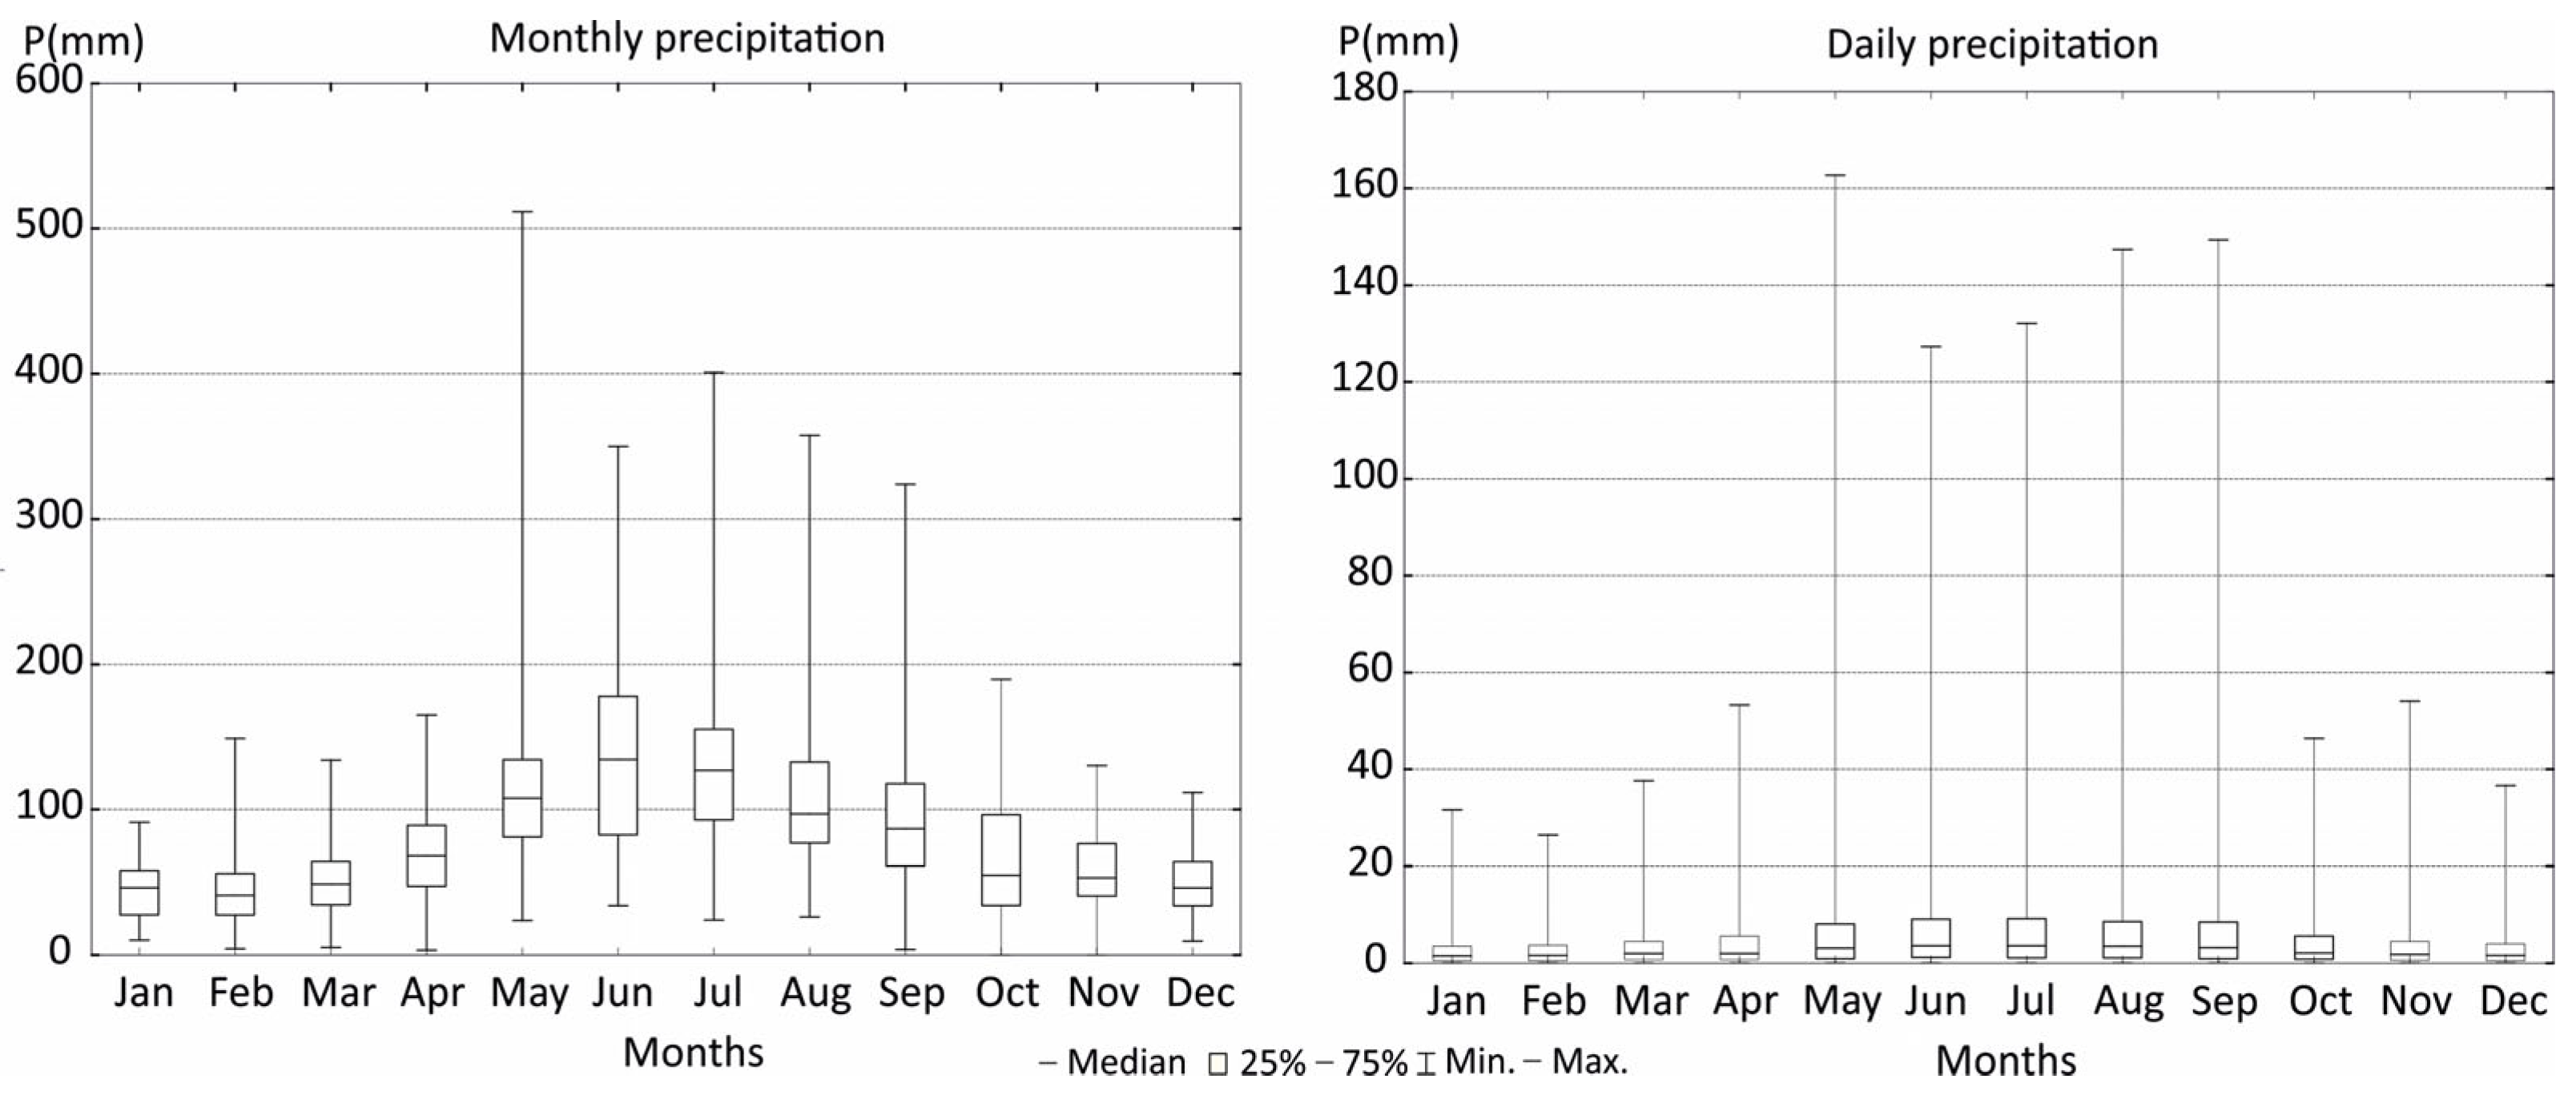
Monthly precipitation, and even more so daily precipitation, are characterised by great variability. Spells of dry weather can last for a month or longer, such as in October 1951 and November 2011, when the entire Polish Carpathian Mountains and their forelands received no precipitation, resulting in a regional meteorological drought. Both of those long-term water deficit events were clearly a consequence of predominant stable circulation conditions driven by anticyclonic systems persisting over Central and Eastern Europe [28]. On the other hand, highly productive events also occur, whether short-term (single day) events of a convective nature, or long-term ones lasting for several days. These result in very high monthly totals, exceeding the average monthly precipitation by up to 5 times. The month of May accounted for the greatest range of variability in monthly as well as daily precipitation (Figure 4). May was also the record month with 512 mm of rain overall in 2010, when daily precipitation peaked at 162.7 mm.
These rainfall events contributed 35% to the annual rainfall total for 2010. The occurrence of such abundant precipitation in the Polish Carpathian Mountains is typically caused by an increased frequency of cyclonic circulation types bringing air from the northern sector [25,43,44]. The typical annual distribution pattern includes up to 60 mm falling between October and April and clearly more than 100 mm in each of the remaining five months. During the study period, there were six rainfall events categorised as catastrophic (Table 1). All these events occurred under the following cyclonic circulation types: five with advection from the northern sector, and one in a cyclonic trough over southern Poland. The empirical probability of these precipitation events ranges from 1.3 to 6.7%, and their return period ranges from 75 years to 15 years, respectively.

3.1. Precipitation Conditions Before the Catastrophic Precipitation Events

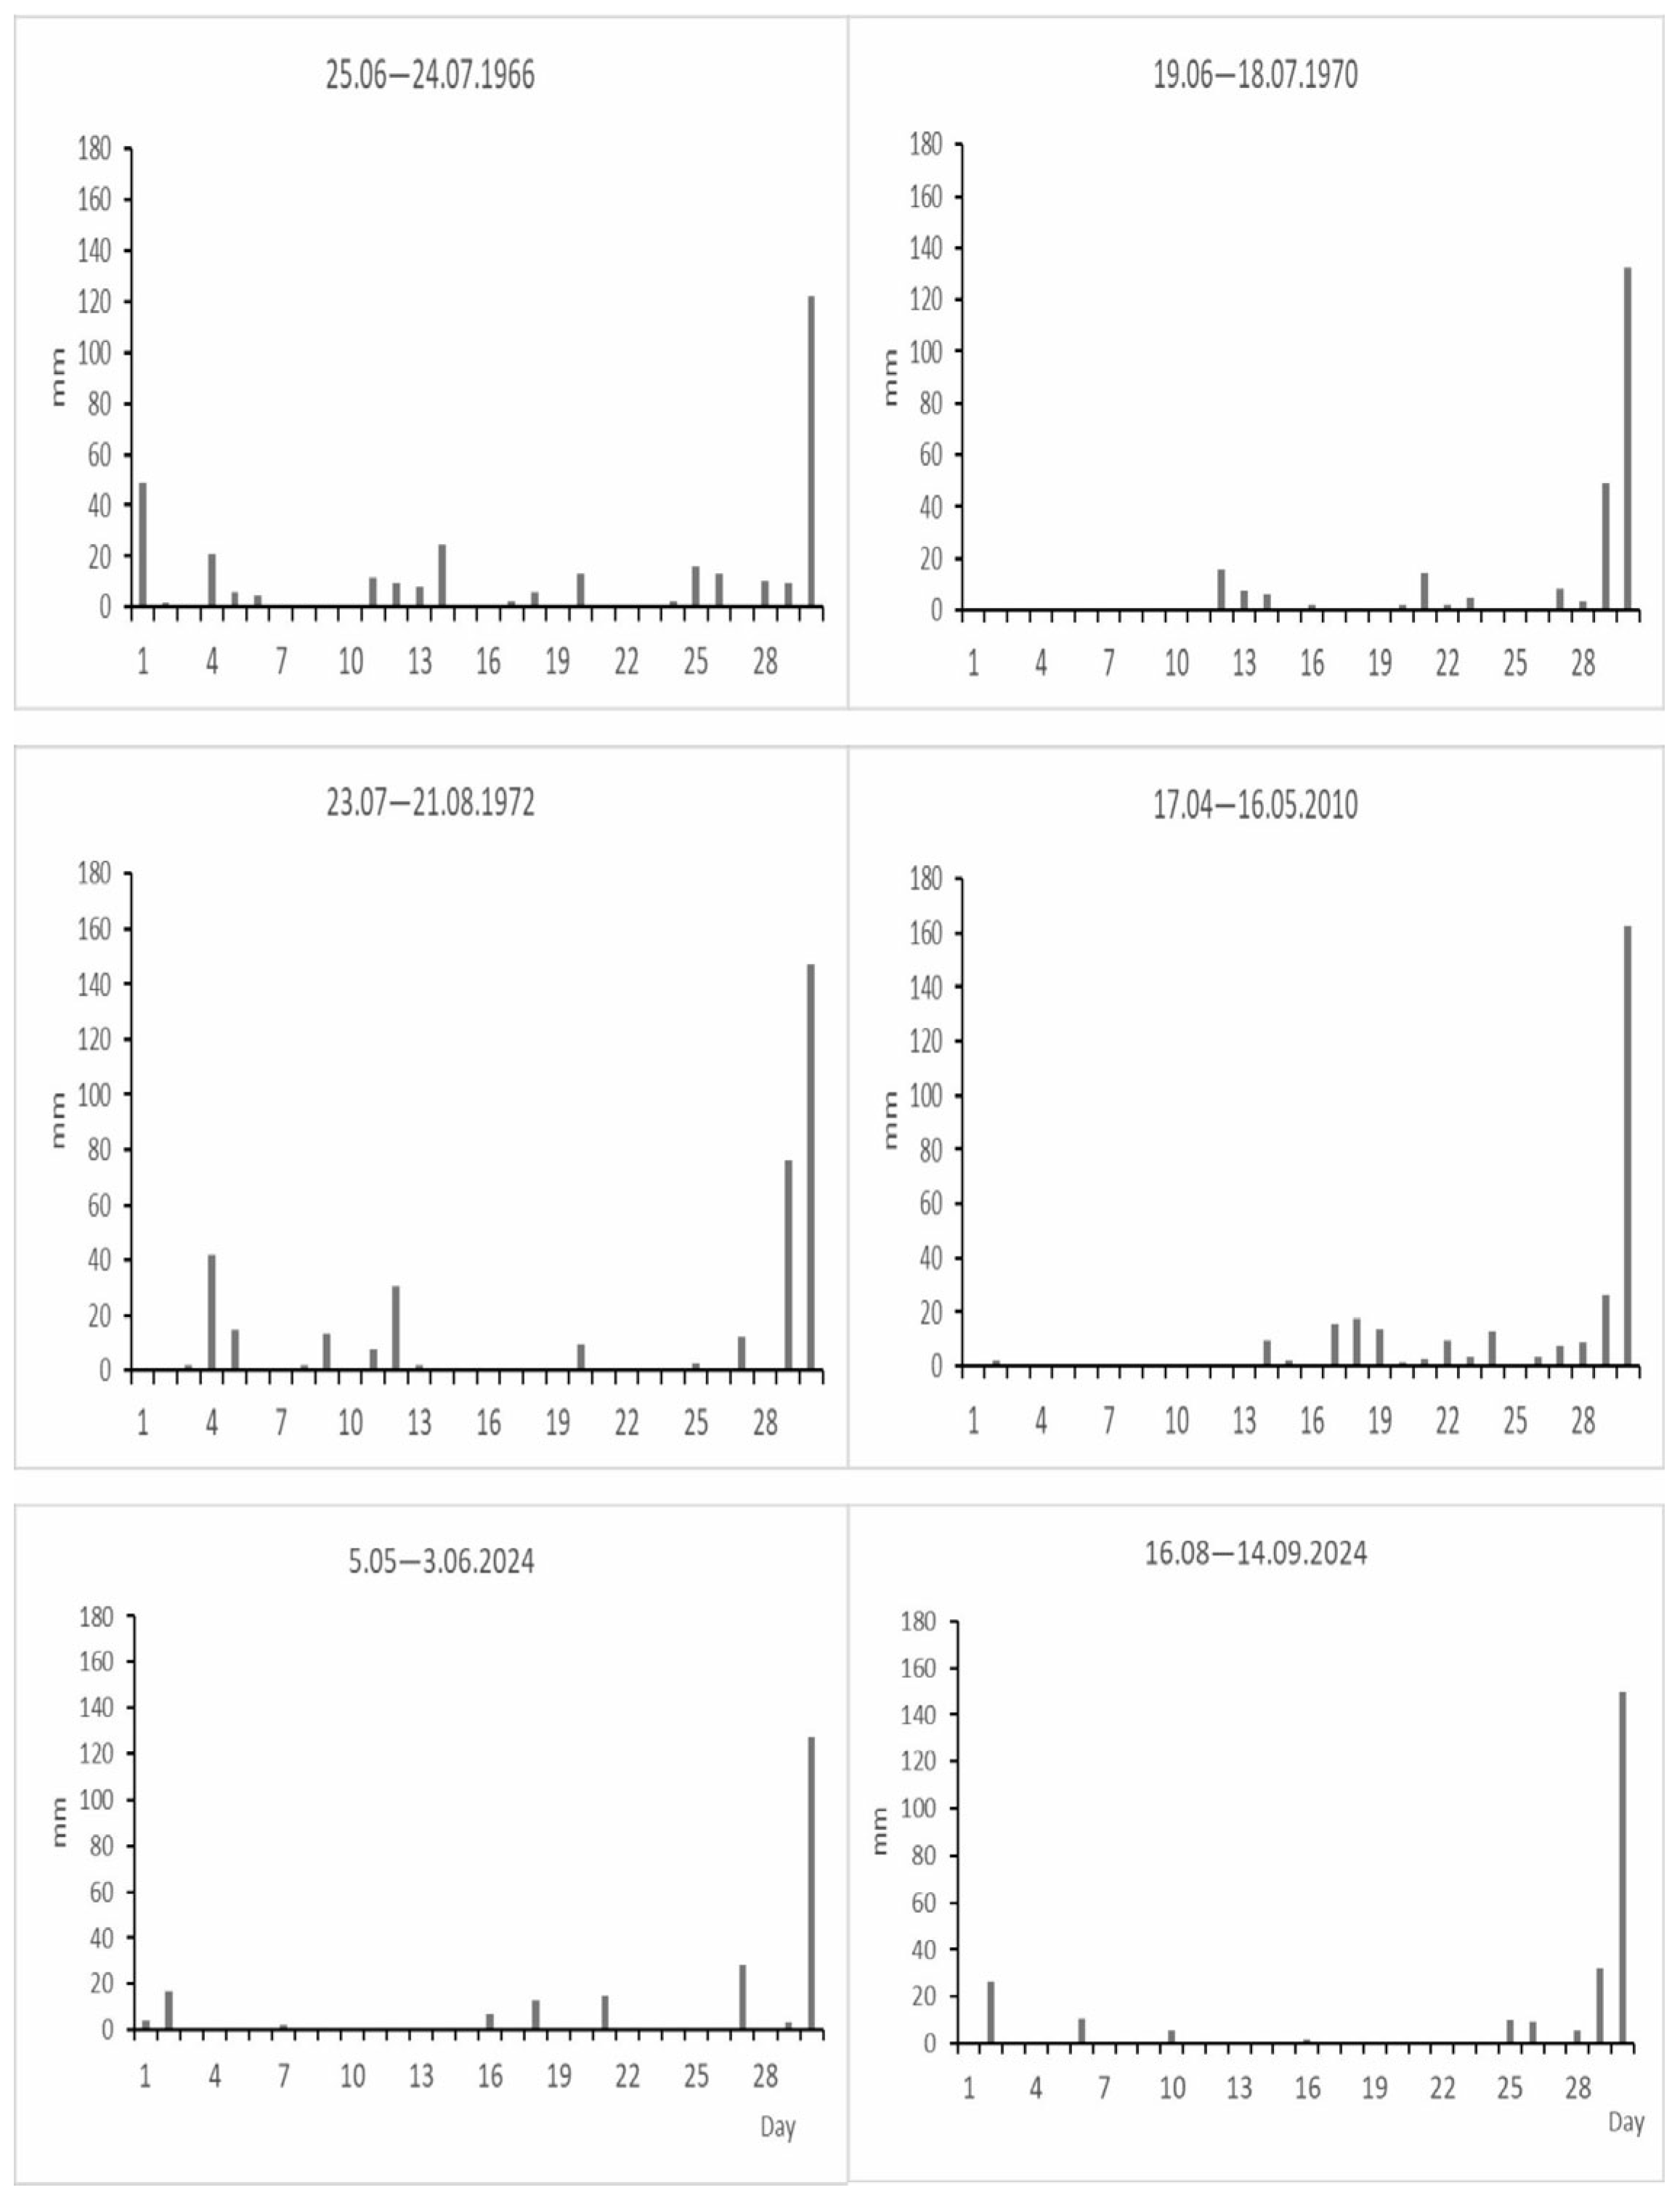
The immediate precipitation history prior to a catastrophic event, including both incidence and detailed data, can provide crucial insights when looking at the impact of the catastrophic event’s surface runoff. To this end, Figure 5 illustrates daily rainfall sequences in the 30 days preceding each of the catastrophic events recorded in Bielsko-Biała. In all six cases, there was prior rainfall of various frequencies and total sum, including instances of heavy rainfall, i.e., above 10 mm. The greatest number of these latter ones, 8, occurred in 1966, and the lowest, 3, in 1970. The most unfavourable hydrological situation occurred in May 2010, when the catastrophic event was preceded by a prolonged, approximately 2-week sequence of days with precipitation, including 5 days with heavy rainfall. In four of the events (1970, 1972, 2010, and in September 2024), the catastrophic rainfall was preceded by a day with at least 25 mm of rainfall. The next step was to classify the months preceding the occurrence of catastrophic precipitation using the standardised precipitation index (SPI) (Table 2). It was found that in five out of the six cases (July 1966, July 1970, August 1972, May 2010, and June 2024), the month immediately preceding the event was an average month (normal wet and dry conditions). The sole exception was August 2024, the month preceding the September catastrophic event, as it fell into the category of a moderate atmospheric drought (SPI = −0.52) (and was preceded by a very dry July (SPI = −1.84)). In contrast, the months of catastrophic rainfall could be considered either very wet or extremely wet. The scale of surface runoff was a result of the combined effect of several factors, adding to the effect of the intense rainfall event. One was the steep slopes that accelerate runoff velocity, favouring surface flow rather than infiltration, especially on the less permeable surfaces of developed land. This can contribute to flooding, as happened in 2024 when the city area was hit by a flash flood. These effects can be compounded by certain soil types and even more by the ground’s limited water absorption capacity, exhausted by the rains on the preceding days.

3.2. Synoptic Analysis of Catastrophic Precipitation

The synoptic analysis commenced with a consultation of the historic lower and upper synoptic maps that led to the conclusion that the rainfall event should be classified as associated with deep convection (or predominantly deep convection) or as a continuous torrential rainfall.

3.2.1. Precipitation Associated with Deep Convection: 24 July 1966 and 3 June 2024

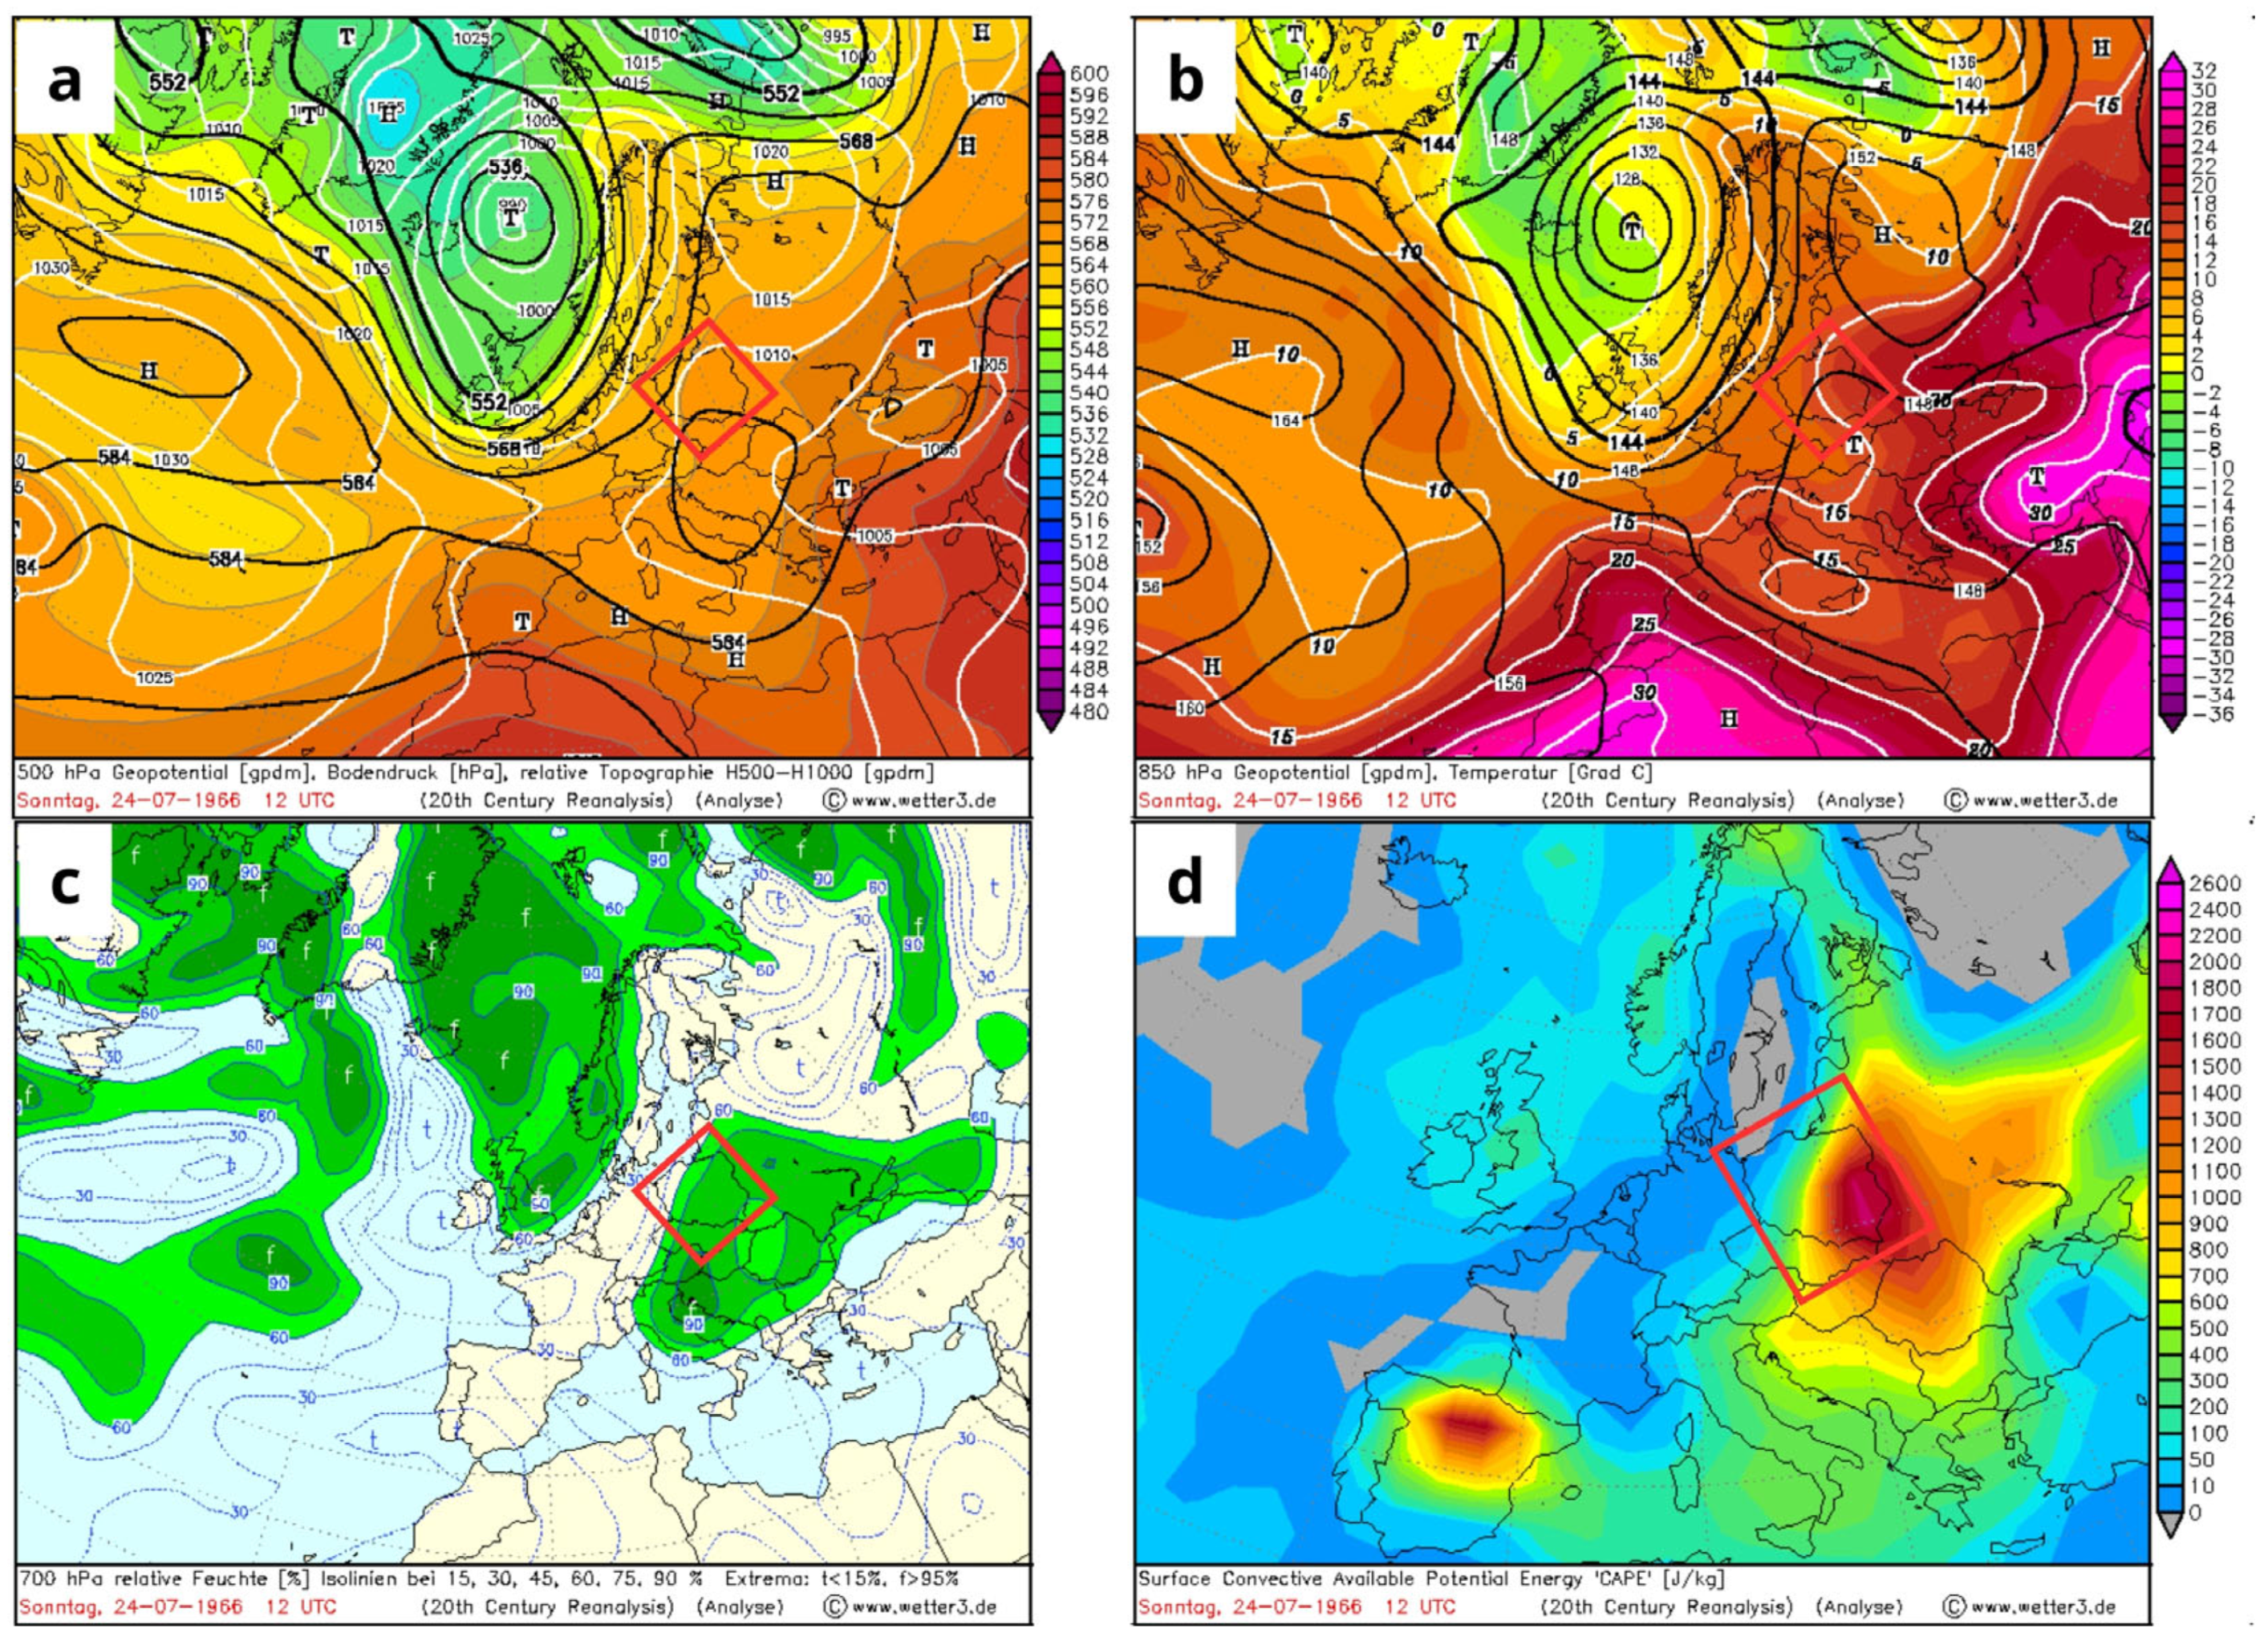
On 24 July 1966, southern Poland was within reach of a shallow gulf associated with a widespread low-pressure system centred over the Black Sea (Figure 6a). Over the Balkans, however, there lay another and far more powerful influence on the weather conditions in the Bielsko-Biała area: an upper low, well-marked at the geopotential field of 500 hPa (about 5500 m a.s.l.) (Figure 6a). Combined, they formed a pattern of pressure systems favouring an inflow of a very warm and humid air mass from the Black Sea over Poland.
The presence of a very warm air mass over the study area is corroborated by an analysis of the temperature distribution at the 850 hPa isobaric level (approx. 1500 m a.s.l.). In synoptic practice, a temperature of around 15 °C at 850 hPa is sufficient to classify incoming air as either tropical air or polar marine warm (Figure 6b). In this case, the 75–85% relative humidity at 700 hPa (around 3000 m a.s.l.) did confirm the high water-vapour content in the middle troposphere (Figure 6c). The combination of the high temperature and high humidity significantly heightened the degree of thermodynamic instability and this is reflected in the high values of the convective available potential energy (CAPE) amounting to about 1200–1500 J-kg−1 on the day (Figure 6d).
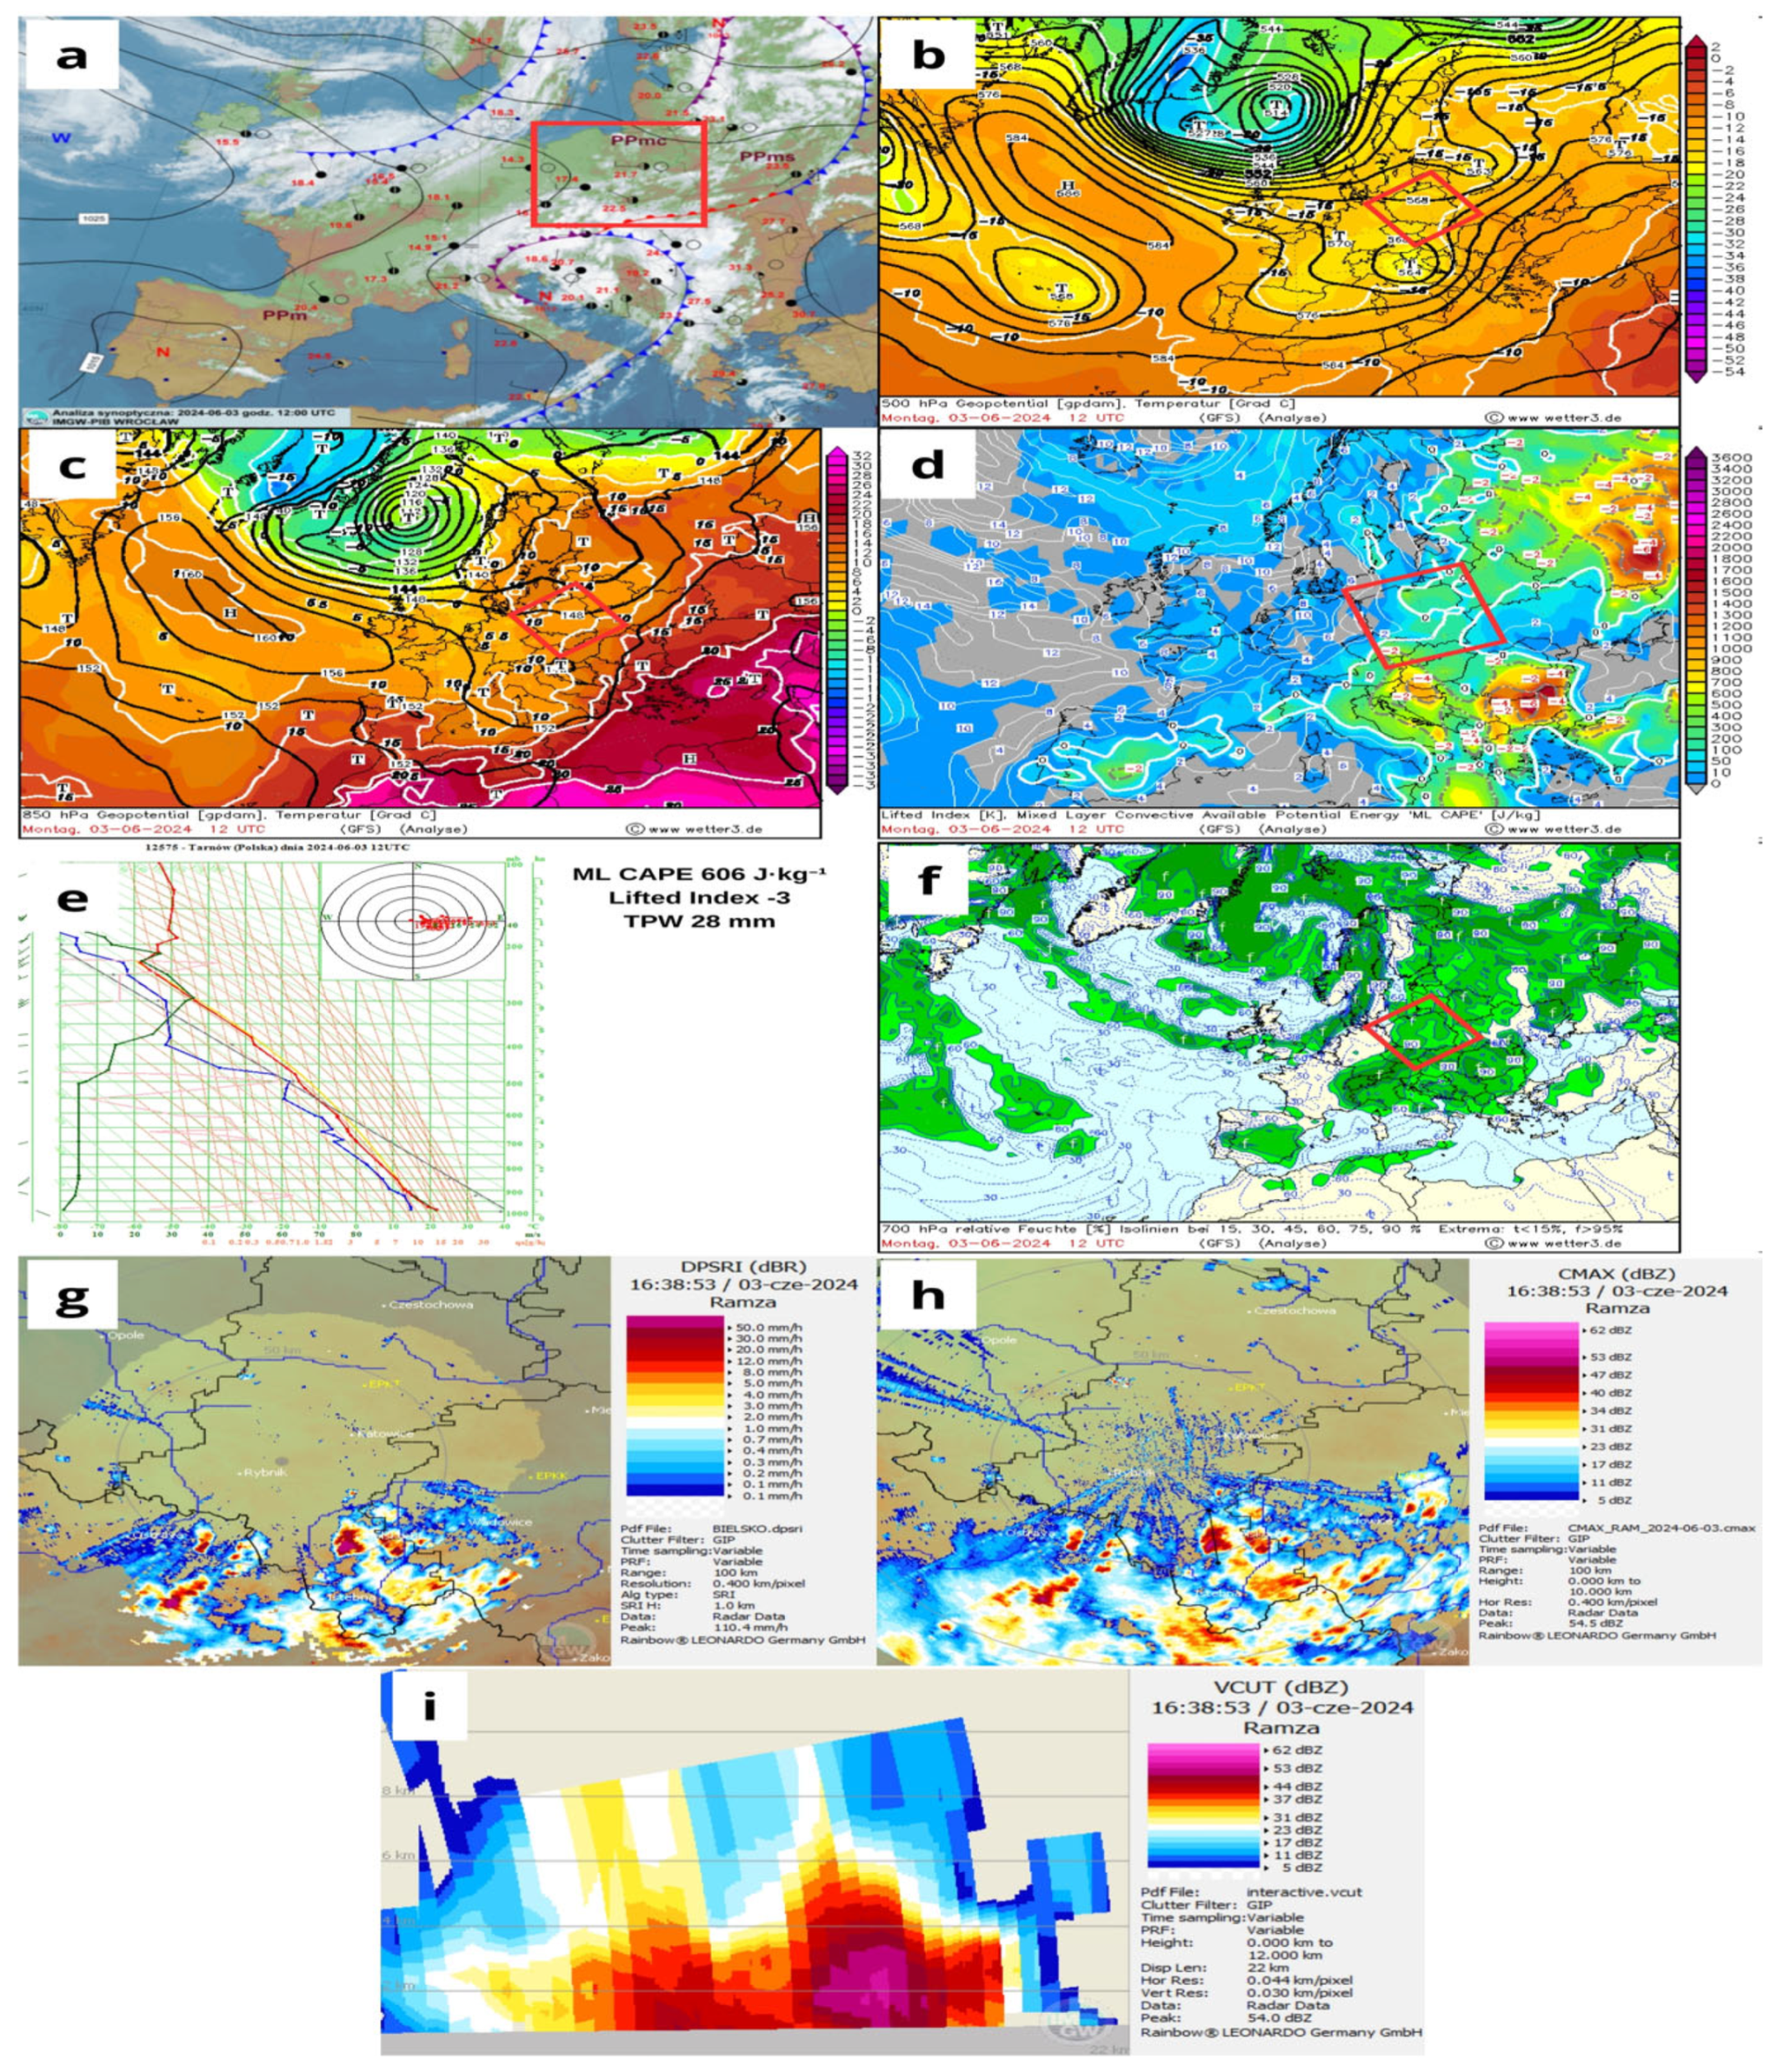
In the light of this, it is clear that the intense rainfall event of 24 July 1966 was convective in nature. Indeed, the high CAPE values (1200–1500 J-kg−1) point to a strong thermodynamic instability in the lower and middle troposphere, generating extensive vertical movement and, as a consequence, rapid build-up of Cumulonimbus clouds, followed by the customary violent thunderstorms. The arrival of the very warm air masses further increased the atmospheric water vapour capacity, under which conditions storm cells typically develop an exceptionally high rainfall productivity. The situation was compounded by the prevailing low air pressure gradient, resulting in a weak airflow in the middle troposphere, favouring either very slow storm cell movement or their outright stagnation. The result was the concentration of exceptionally heavy precipitation over Bielsko-Biała and the associated rainfall totals. On 3 June 2024, the weather over southern Poland was determined by a low-pressure system advancing from over the Hungarian Lowlands, accompanied by a system of atmospheric fronts (Figure 7a).
An analysis of the geopotential distribution at the 500 hPa and the 850 hPa isobaric levels shows the presence of just an upper gulf, but the absence of a clearly closed isohypse indicates that the low was shallow (Figure 7b). This pressure distribution pattern favoured the advection of warm and humid air from over the Black Sea that moved over the top of lingering polar marine air. The incoming air was characterised by moderate instability, as evidenced by the values of ML CAPE (500–600 J-kg−1) and the lifted index (−3) (Figure 7d). Furthermore, the total precipitable water (TPW) value stood at 28 mm (Figure 7e) and relative humidity at 700 hPa exceeded 90% (Figure 7f), confirming the presence of large quantities of water vapour in the middle troposphere and favouring the development of deep convection.
After 16:00 UTC, the first isolated storm cells started appearing over the Beskid Śląski range with their core located to the southwest of Bielsko-Biała. Radar data analysis (DPSRI) shows that the rainfall intensity reached and even exceeded 50 mm/h (Figure 7g). A cross-section of the most active storm cell indicated that the Cumulonimbus cloud reached a height of about 8 km, with the highest radar reflectivity (>40 dBZ) concentrated up to the level of 5 km, which also corroborates high intensity precipitation (Figure 7h).
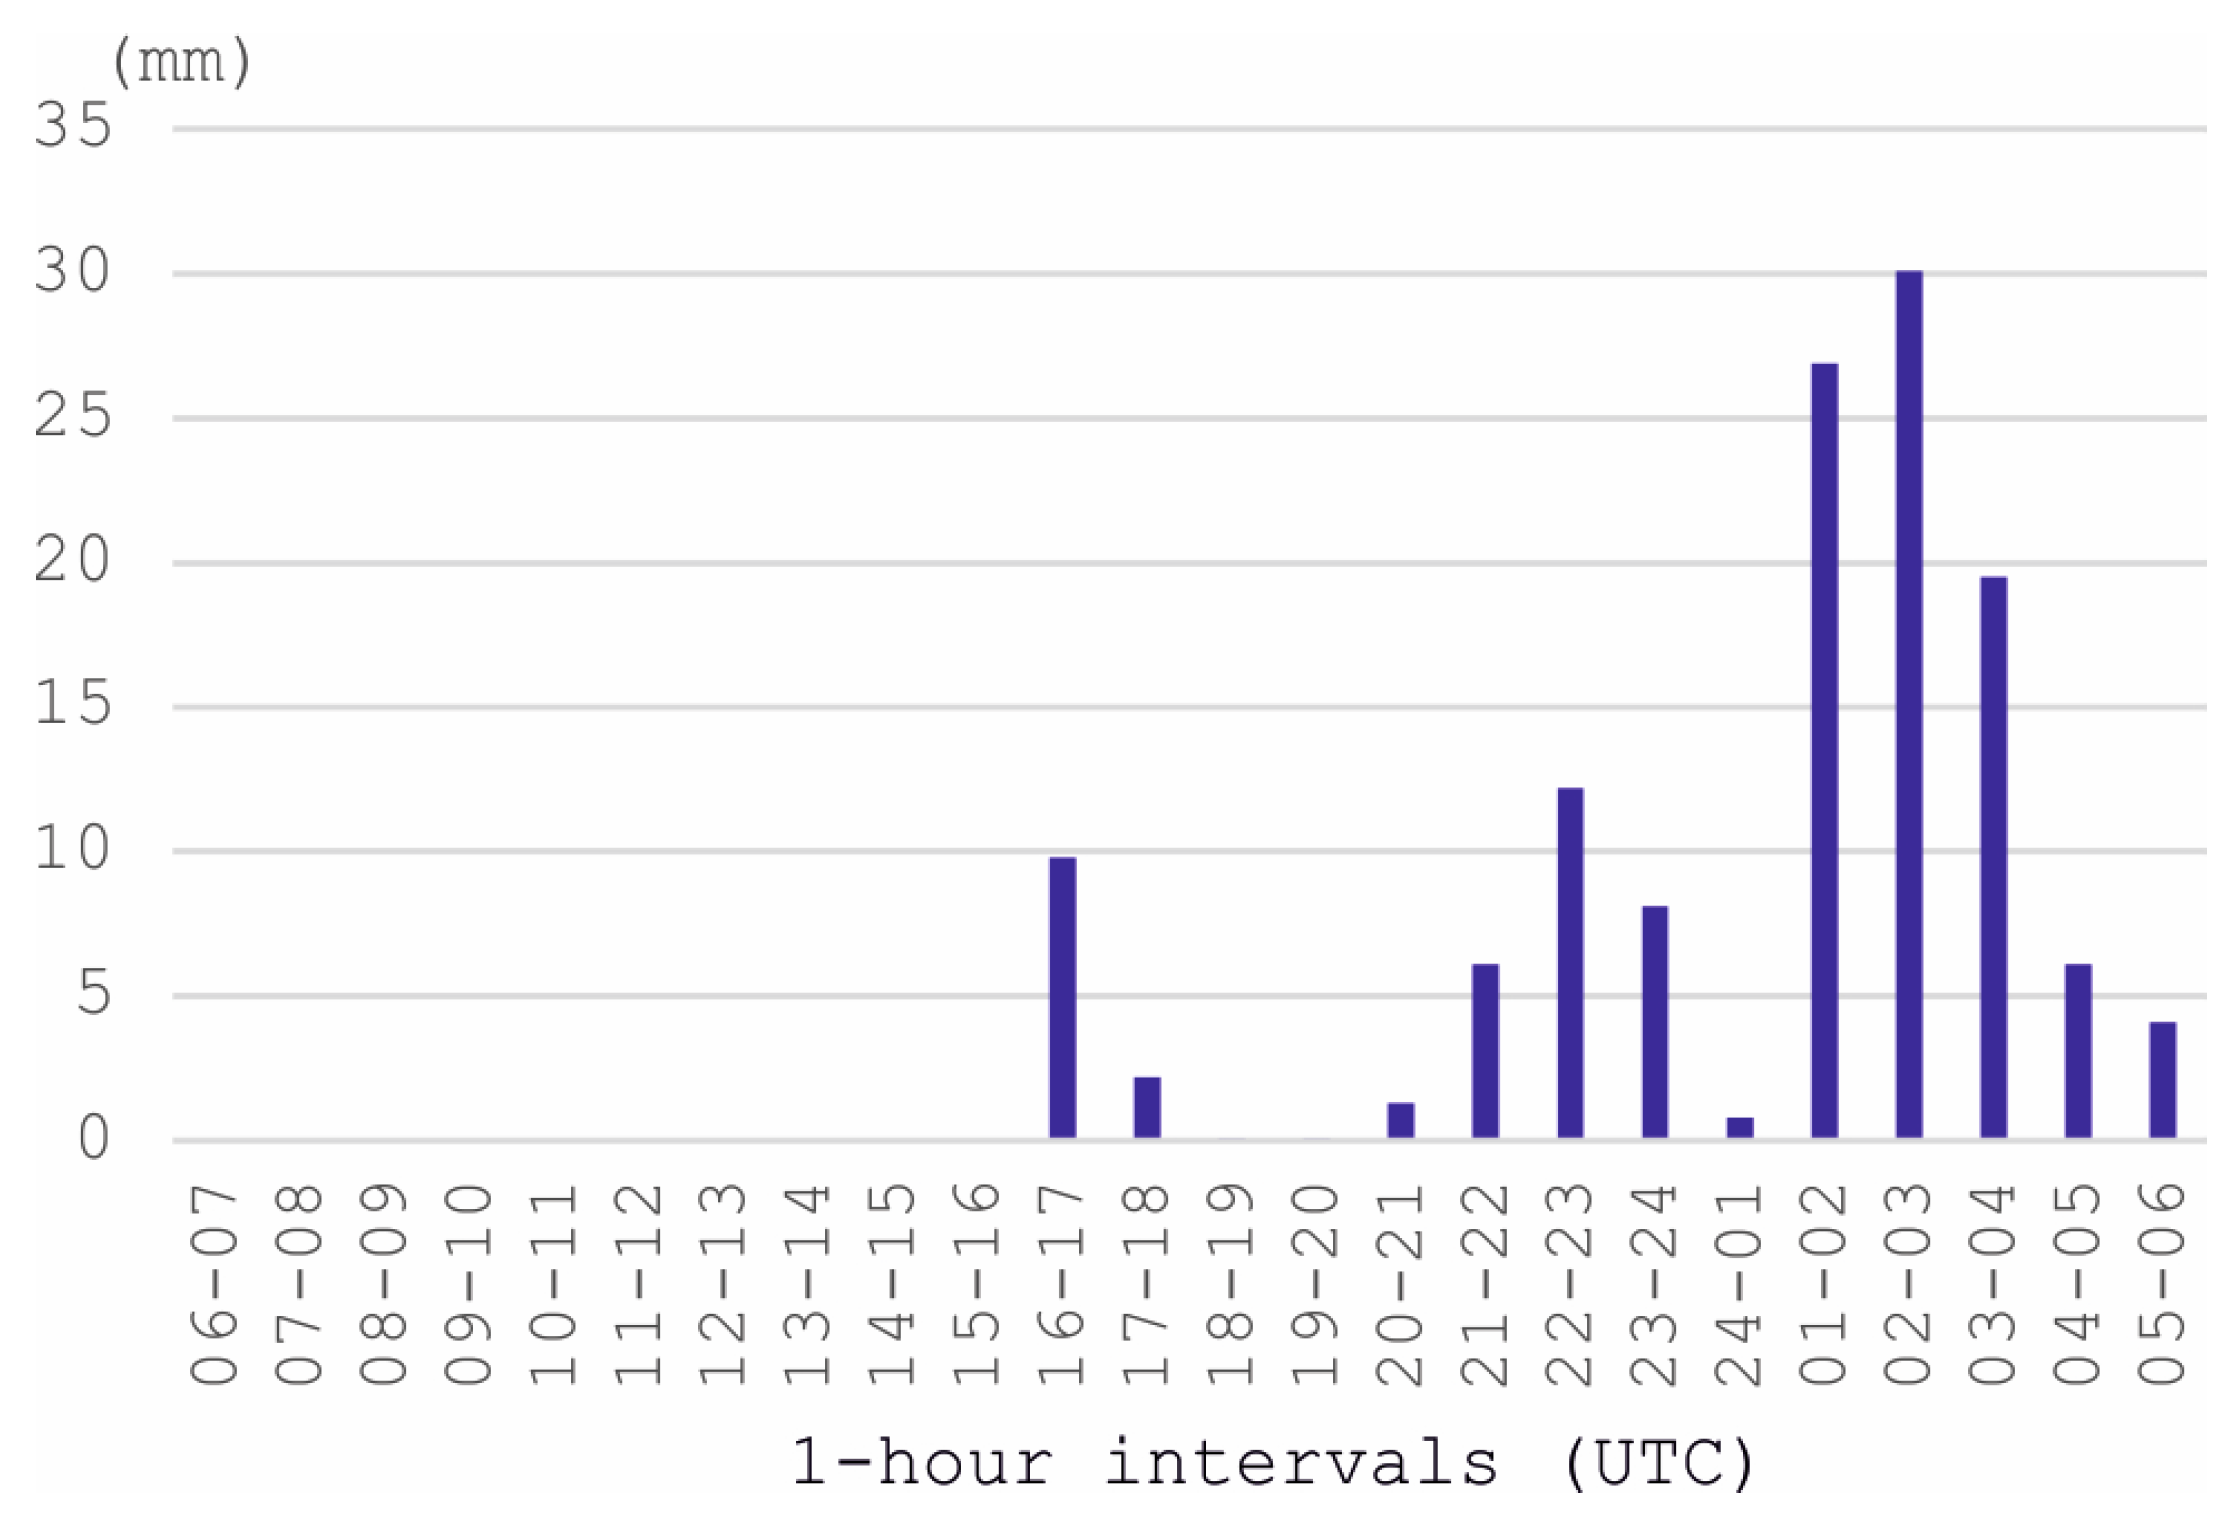
In Bielsko-Biała, the most intense rainfall occurred on the night of 3–4 June and it was directly linked to the passage of a shallow low-pressure system and an occluded front (Figure 8a). An even more humid air mass (TPW 31.7 mm) arrived over southern Poland and, despite their lower ML CAPE values (up to 100 J-kg−1) (Figure 8b), the precipitation zones that then formed were characterised by considerable intensity. According to radar data (DPSRI product), rainfall intensity in a narrow zone over the Beskidy Mountains may have locally exceeded 50 mm/h (Figure 8d). The air flow parallel to the front line proved an extremely important component in the combination that produced the record-breaking precipitation totals in the Bielsko-Biała area. This feature favoured the formation of ‘training storms’, i.e., a train of precipitation cells travelling one after another over the same area. The low barometric gradient slowed the front movement down even more, leading to prolonged rainfall that concentrated over the same area. The effects were catastrophic: according to IMGW-PIB records, the total daily precipitation in Bielsko-Biała reached 127.3 mm, of which almost 80 mm fell within the span of 3 h, between 1:00 and 4:00 UTC (Figure 9). Soon, streams and rivers began to swell, causing numerous floods and widespread damage to infrastructure on a scale that has been recognised as one of the most severe hydrometeorological disasters in southern Poland during the last few decades [45,46].

3.2.2. Precipitation Associated with the Genoa Low: 18 July 1970, 21 August 1972, 16 May 2010, and 14 September 2024

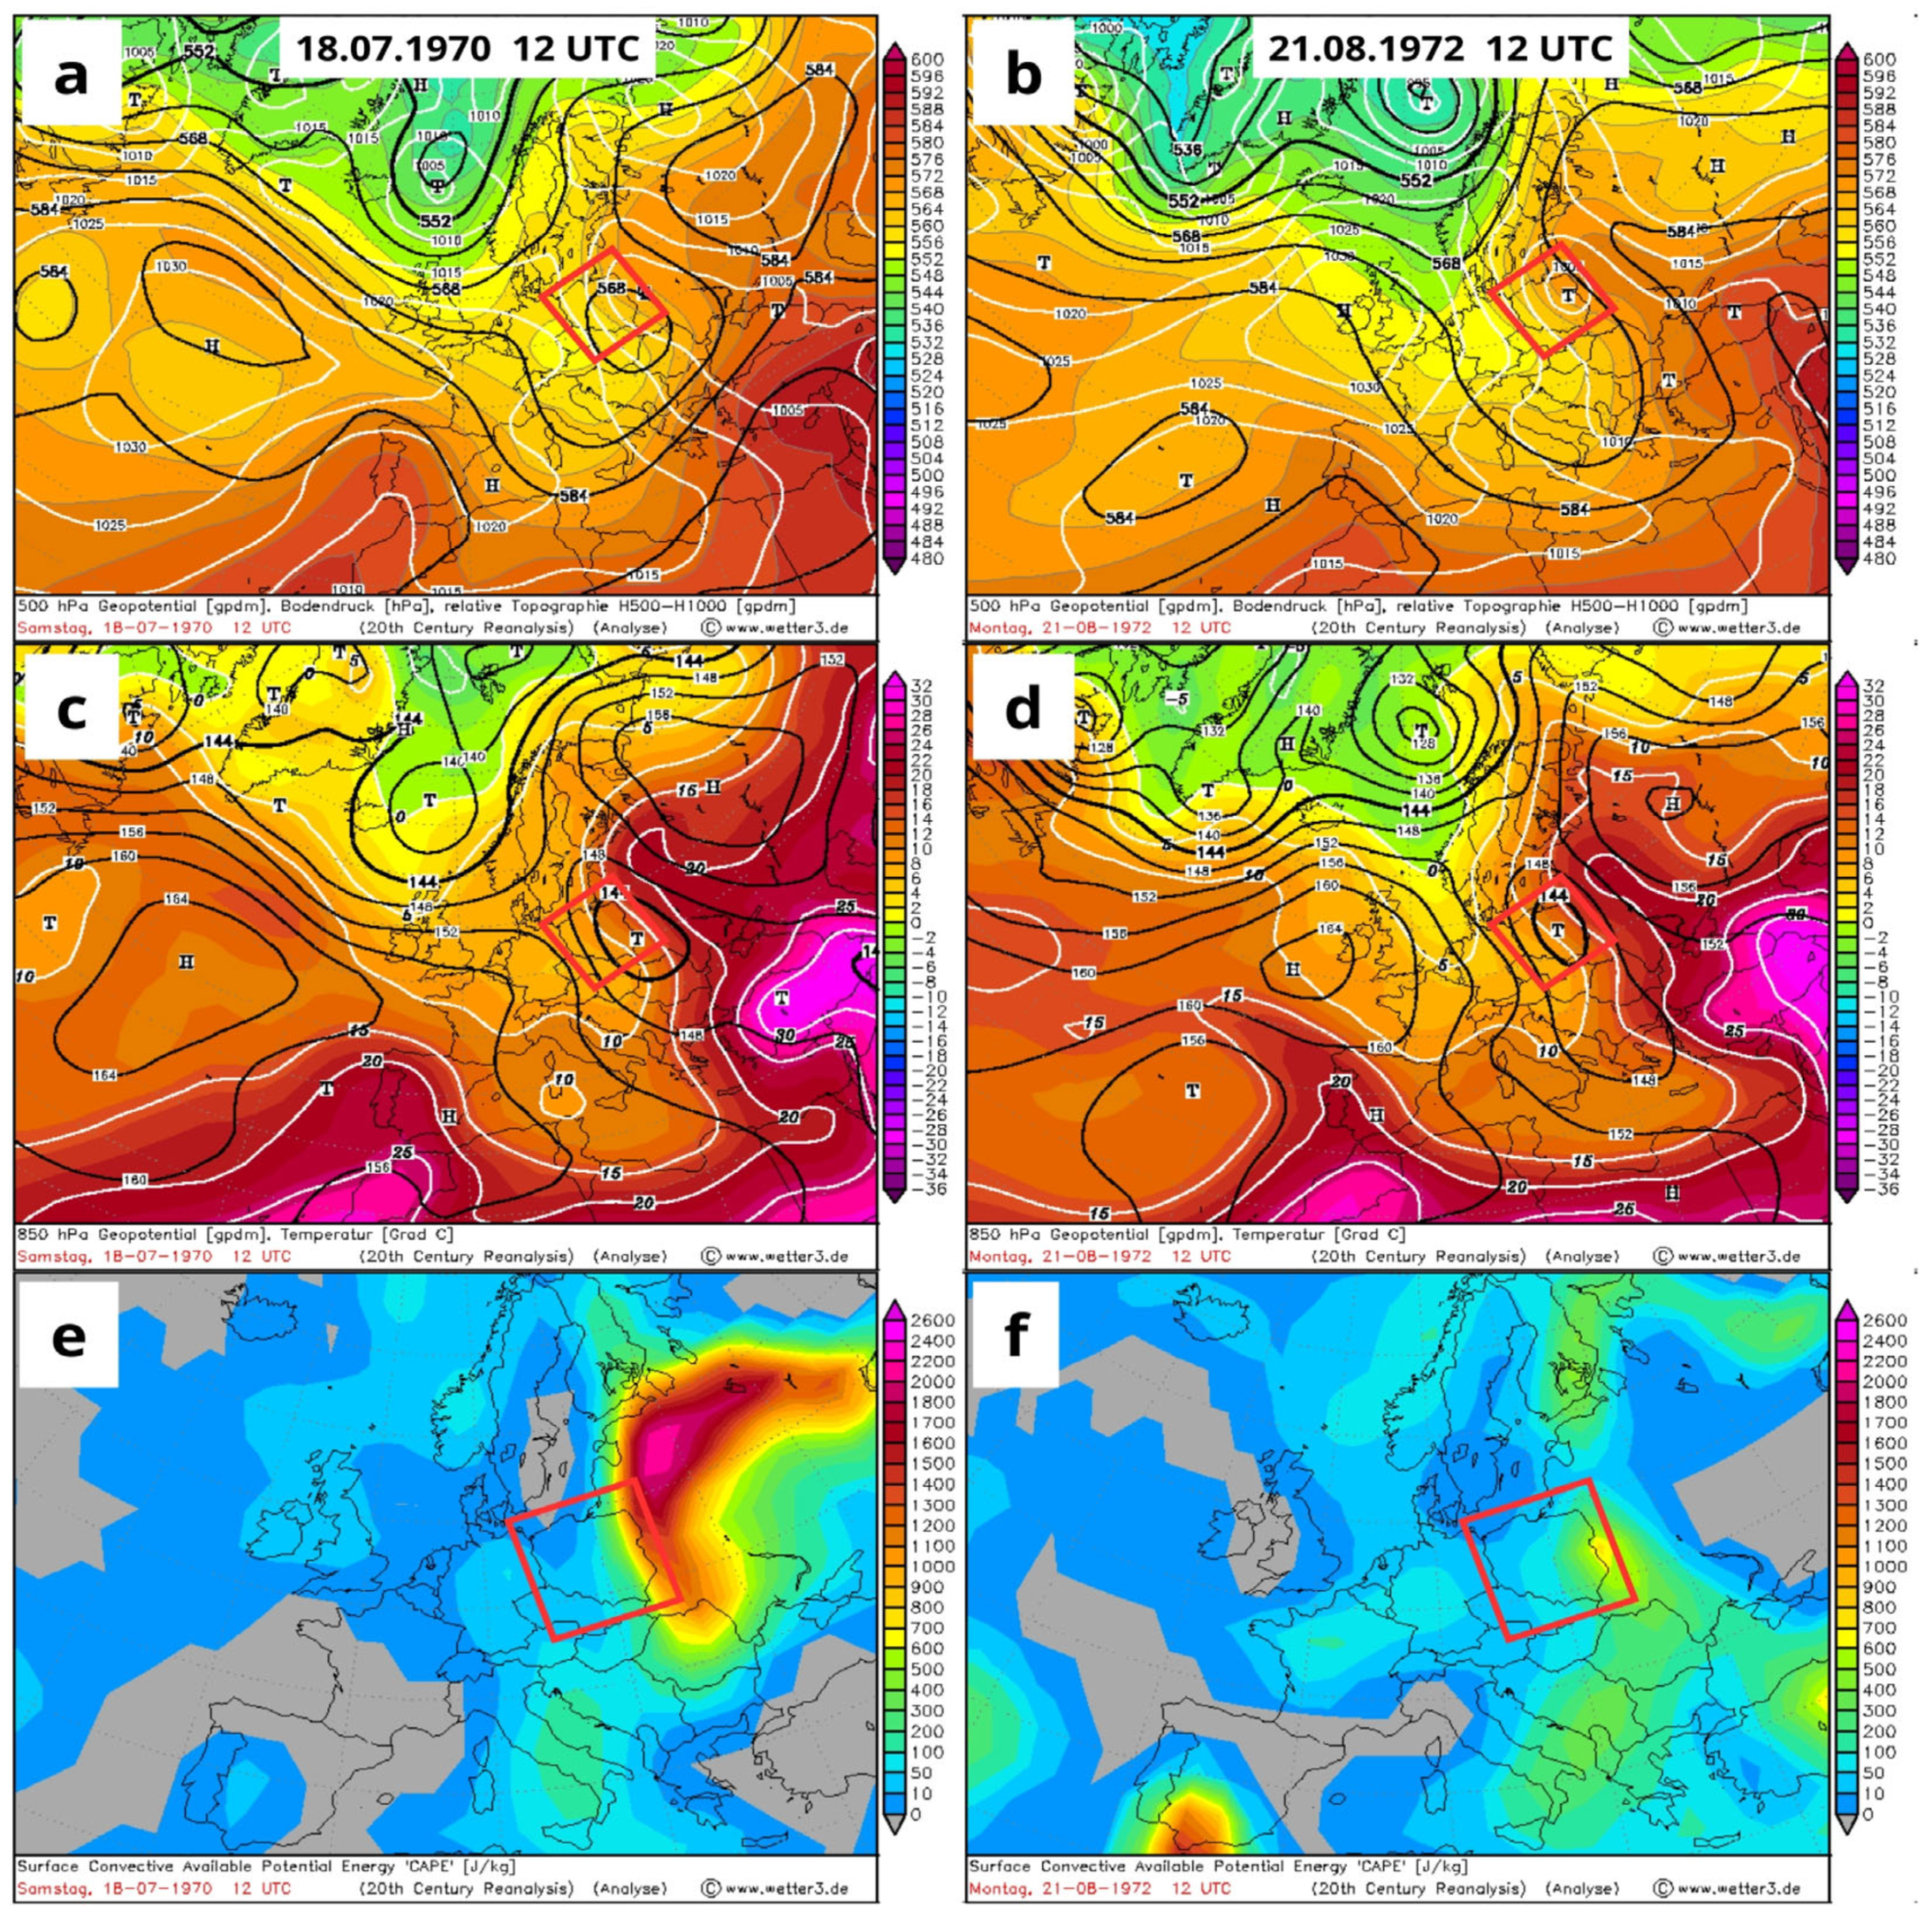
Four of the catastrophic rainfall events in the Bielsko-Biała area can be linked to the arrival of low-pressure systems moving northwards from their original area over the Gulf of Genoa. A synoptic analysis of two such events that occurred on 18 July 1970 and 21 August 1972 shows that over the preceding days, the low was moving over the Pannonian Basin along a trajectory running east from the study area (track Vb) [47]. That left the Bielsko-Biała area in the rear part of the low and meant that the air masses arrived from the northern sector, i.e., perpendicular to the longitudinally situated ranges of the Beskidy Mountains. An analysis of the geopotential maps at the 500 hPa and 850 hPa isobaric levels indicates that both cases were clearly visible in the vertical profile of the atmosphere (closed isohypses) and, as such, would qualify as mature cyclones (Figure 10a). In addition, a steep horizontal thermal gradient over southern Poland at the 850 hPa level (from 10 °C to 14 °C) confirms the presence of frontal zones and allows the incoming air masses to be classified as polar marine warm (Figure 10c). In both events, the thermodynamic conditions were typified by low CAPE values (100–300 J-kg−1) (Figure 10e). In synoptic practice, these kinds of values are indicative of low to moderate atmospheric instability, favouring a continuous rather than a thunderstorm type of precipitation. However, it is widely established that frontal zones often feature embedded Cumulonimbus clouds that have the potential to locally produce increased precipitation intensities, especially on the windward slopes of the Beskidy. The dynamics of the movement of the two lows also played an important role in producing the very high precipitation totals, as their northward thrust was slowed down by high-pressure systems centred over northwestern Russia (Figure 10a,b).
Although the cases analysed were not due to typical blocking situations, the slow movement of the lows and of their atmospheric frontal systems favoured prolonged and intense precipitation. As a result of these synoptic conditions, the daily precipitation totals in Bielsko-Biała reached exceptionally high levels. In the first case (18 July 1970), the total precipitation amounted to 132.1 mm, while in the second (21 August 1972), it was even greater at 147.4 mm. Both events triggered extensive floods, especially in south-eastern Poland, causing significant financial and environmental losses [48].
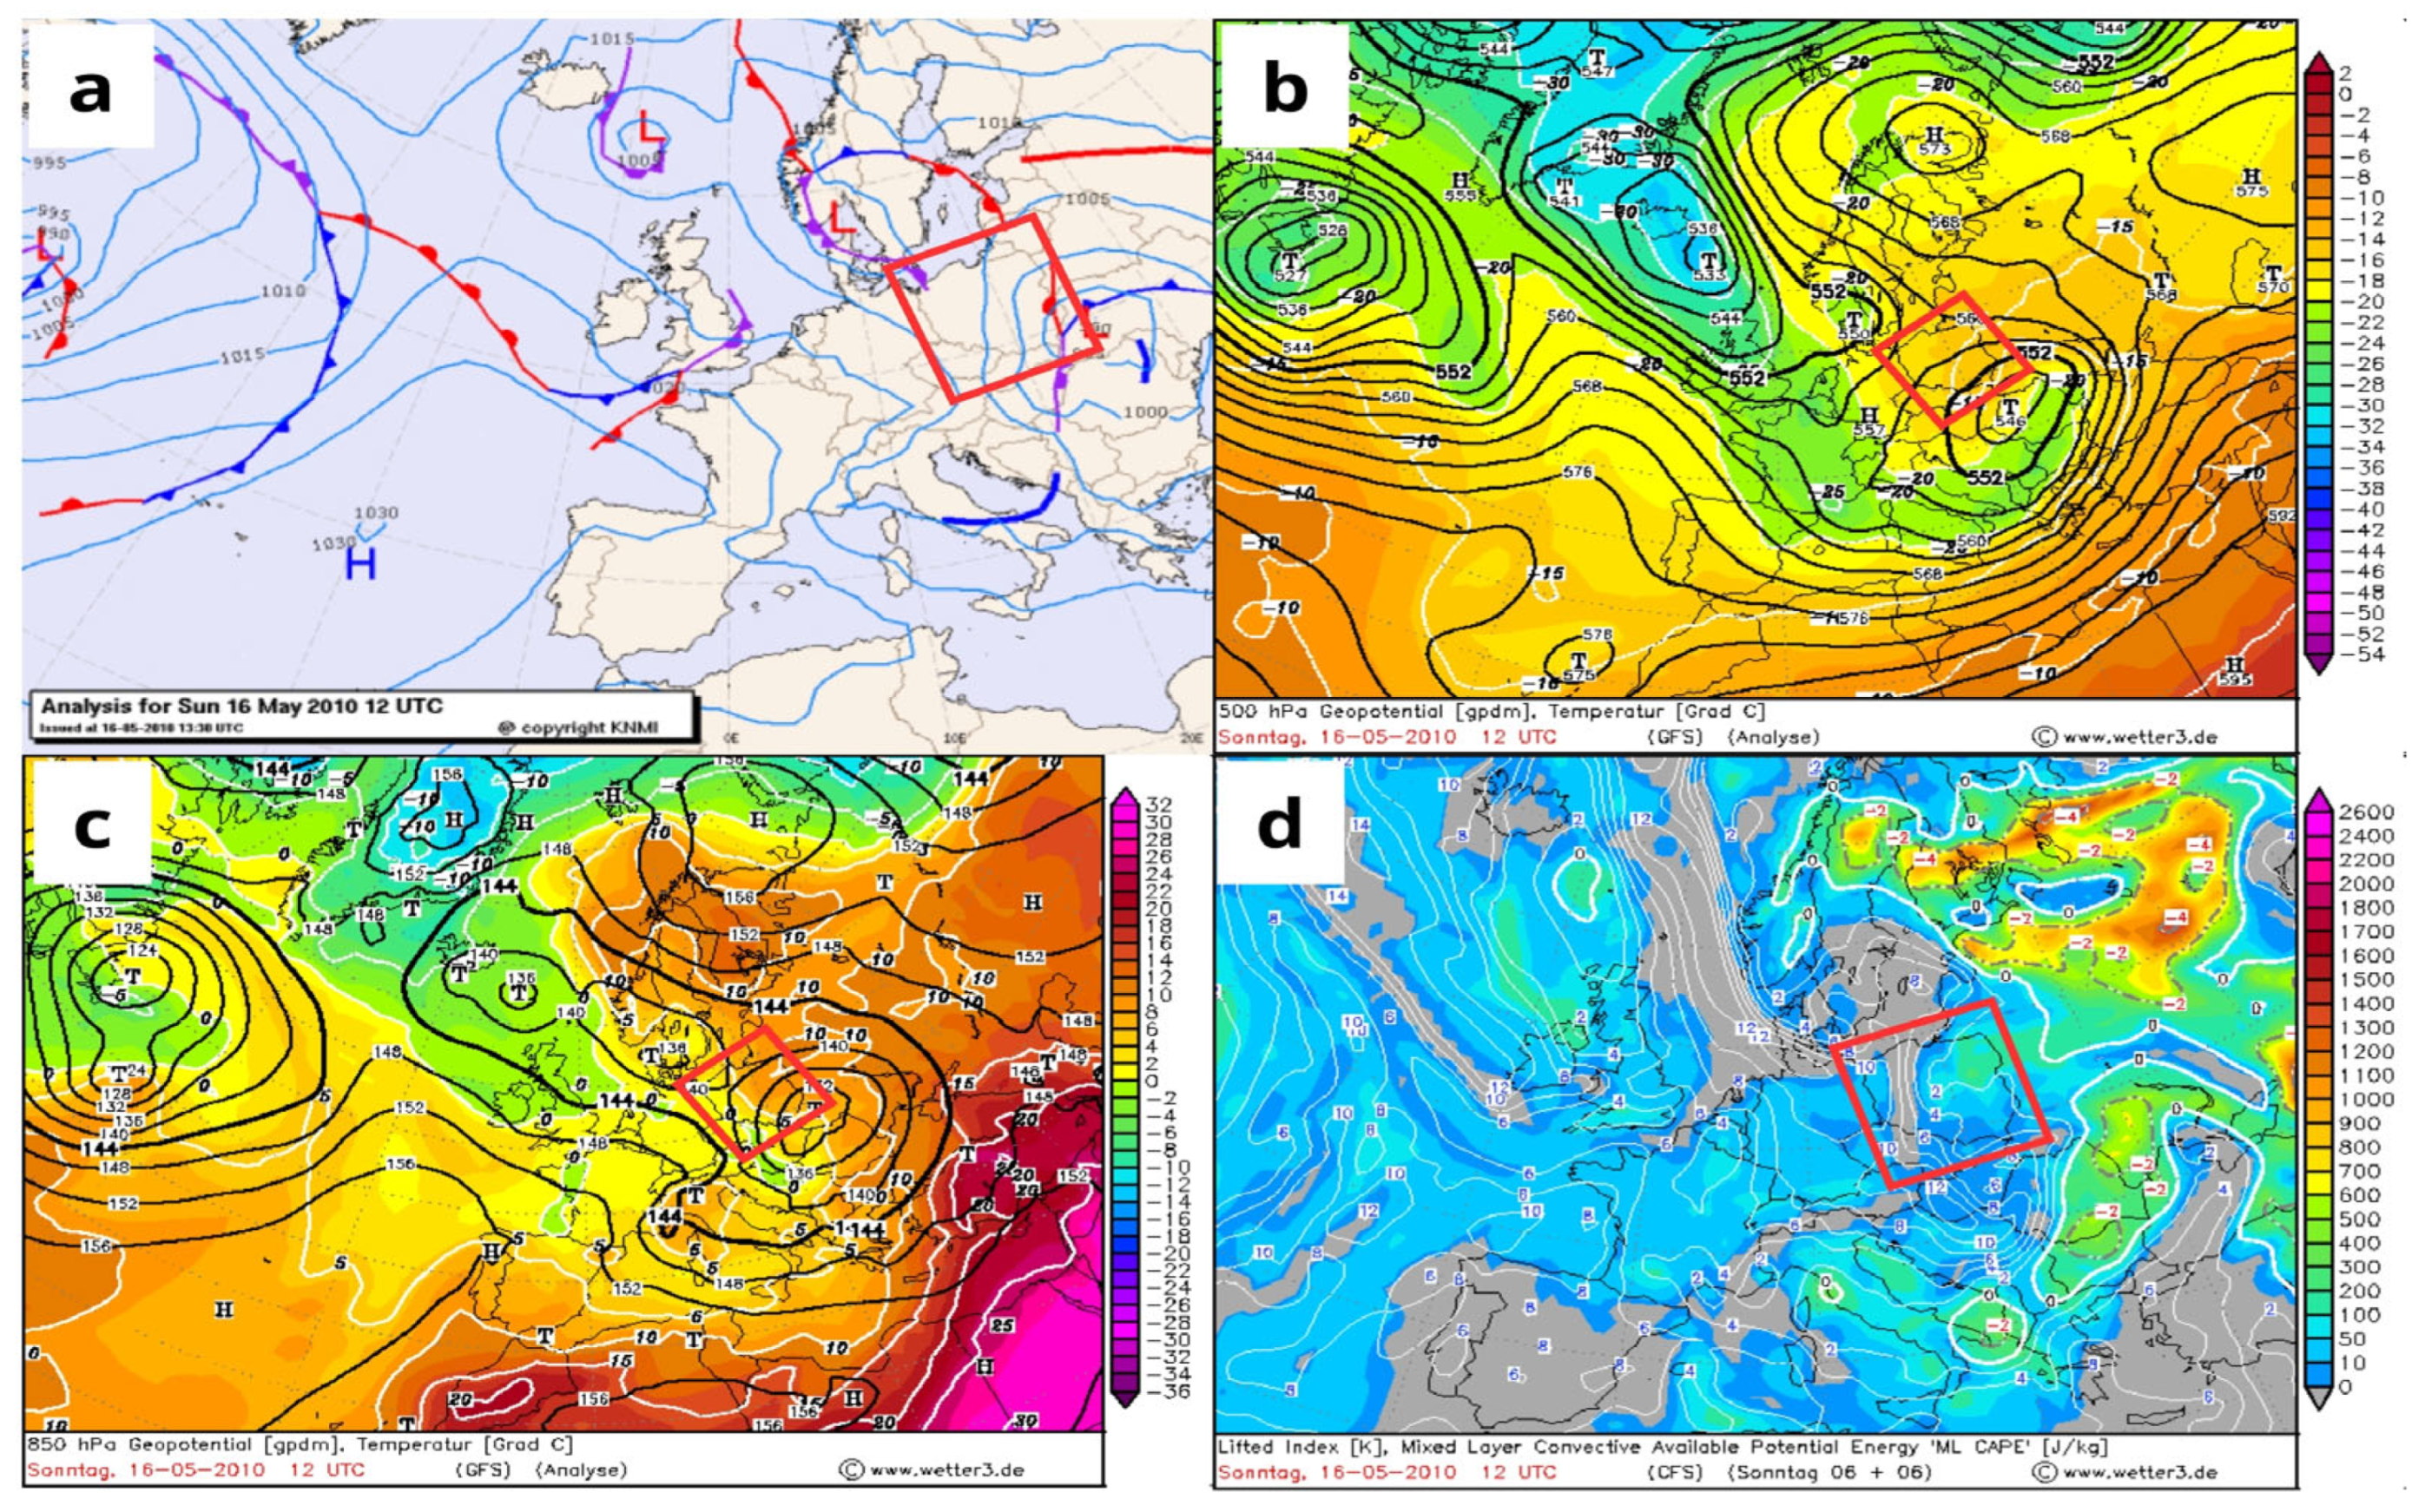
The next instance of rainfall exceeding 100 mm in a single day occurred in Bielsko-Biała on 16 May 2010. Similar to the previous two events, in July 1970 and August 1972, the synoptic situation over southern Poland was dominated by a Genoa low-pressure system and its associated system of atmospheric fronts. The system travelled north-eastwards from over Hungary towards western Ukraine. A warm front engulfed southern and eastern Poland, causing intense and prolonged rainfall both along the front itself and in a zone preceding it (Figure 11a). An analysis of the synoptic situation and the geopotential fields at the 500 hPa and 850 hPa levels reveals several closed isohypses suggesting an extensive vertical development of the low, typical of cyclones favouring prolonged precipitation (Figure 11b). At 850 hPa, the centre of the low was located close by, over Slovakia, translating into steep horizontal thermal gradients over southern Poland (Figure 11c). Again, like in the previous two cases, Bielsko-Biała found itself at the rear of the low with air masses arriving from the northern sector. Due to their longitudinal positioning, the Beskidy acted as an orographic barrier, triggering the associated effect: as the air masses climbed up the long northern slopes of Beskid Śląski, they rapidly shed humidity, producing heavy rainfall. It is worth noting, however, that the case in 2010 differed from those previously considered. The temperature at 850 hPa was about 5 °C, indicating an influx of relatively cooler marine polar air (Figure 11c). The ML CAPE values were low (100 to 300 J-kg−1) and the lifted index values were positive (about 4), indicating stable thermodynamic conditions (Figure 11d). In synoptic practice, cool air and stable thermodynamics favour the occurrence of Nimbostratus clouds that typically produce steady, prolonged and intense precipitation. While there was potential for the presence of individual embedded Cumulonimbus clouds, their role was secondary. This synoptic situation stood out in that it involved a typical blocking by high-pressure systems. Indeed, for several days the low either remained almost stationary or proceeded at a very slow pace in a north-easterly direction against the influence of strong high-pressure systems located over Scandinavia and north-western Russia (Figure 11a). Despite the relatively good thermodynamic stability of the atmosphere, rainfall amounts reached record quantities, and, according to data from IMGW-PIB, the daily total precipitation in Bielsko-Biała was as high as 162.7 mm. This figure was a result of the coming together of three major factors: (i) the stagnation of the warm front zone over the study area for many hours; (ii) the slow movement of the low-pressure system; and (iii) the orographic barrier effect. On the ground, the results included catastrophic river flooding, numerous inundations, and severe damage to infrastructure, described as the greatest recorded flooding in south-eastern Poland.
The last of these cases in the study where Bielsko-Biała received more than 100 mm of rainfall in a single day under the influence of a Genoa low occurred on 14 September 2024. What sets this particular event apart from the other cases was a shallow secondary low that emerged within a vast gulf of the main system centred over Ukraine. It was the centre of that secondary low, together with an occluding system of atmospheric fronts, that directly influenced the weather over southern Poland, including Bielsko-Biała and its vicinity (Figure 12a).
An analysis of the upper synoptic maps revealed a vertically extended structure of the low-pressure system, typical of mature cyclones and well-marked at both 850 hPa and 500 hPa (Figure 12b). It is widely established that the nearer to the centre of the pressure system, the higher the frontal activity and better the vertical and horizontal development of their cloud systems. Therefore, the mere fact that the secondary low had a direct influence on the weather in the study area would mean that the precipitation intensity had to increase. The thermodynamic conditions on 14 September were typical of a stable atmosphere characterised by continuous precipitation. This is confirmed by the low ML CAPE values (about 100 J-kg−1) and by the positive value of the lifted index (about 4) (Figure 12d), which clearly points to the dominance of Nimbostratus clouds. The precipitation was therefore continuous, but a local presence of well-formed frontal zones suggests that small convective cells, potentially embedded in these zones, could have intensified the rainfall. The most intense precipitation occurred on the night of 14–15 September, especially between 21 and 03 UTC, when the precipitation total in Bielsko-Biała reached as much as 105 mm in just six hours (Figure 12e). Between 23 and 00 UTC, the station recorded a total of 30.6 mm, which is also confirmed by the analysis of the DPSRI radar product (intensity of 30–40 mm/h over the city). Even greater intensity levels were recorded in the Beskidy Mountains above the city as the incoming air mass was forced up the northern slopes and across the ridge of the neighbouring ranges of Beskid Śląski and Beskid Mały in a classic orographic barrier effect (Figure 12f). Therefore, it was the presence of that secondary low directly over the study area that crucially differentiated this event from the previously described cases of 1970, 1972, and 2010. On the other hand, just as in the event of May 2010, the northward movement of the low-pressure system was considerably slowed down by the presence of extensive high-pressure systems: a strong high over north-western Russia and a high over the English Channel whose wedge reached as far as Scandinavia. This overall pattern of air pressure systems over Europe favoured the stagnation of the intense precipitation zones over southern Poland.
The combination of factors resulted in catastrophic hydrological consequences, including unusually heavy and intensive precipitation occurring in a short period of time, which triggered rapid swelling of watercourses and flash flooding. Overall, the intense precipitation event of 14 and 15 September 2024, despite some differences from previous ones, fits perfectly into the pattern of precipitation intensification in the Bielsko-Biała area under the influence of the Genoa low. Just as in the previous events, here the key roles were also played by the local orography and by a regional atmospheric circulation favouring extreme precipitation in mountainous areas and their foothills.

4. Discussion of Results

Bielsko-Biała’s specific location in the western part of the Polish Carpathian Mountains at the foot of Beskid Śląski and Beskid Mały ranges exposes it to intense precipitation associated with both atmospheric circulation and a strong impact of ground relief. During the study period, 1951–2024, there were six cases of catastrophic precipitation, in which the weather station recorded a daily precipitation total in excess of 100 mm. The empirical probability of these events ranged from 1.3 per cent to 6.7 per cent, with a respective recurrence interval of between 75 years and 15 years. The synoptic analysis of these events revealed that factors contributing to precipitation totals of this magnitude involved both deep convection with the occurrence of thunderstorms, and an impact of the Genoa lows passing over southern Poland along track Vb, according to Van Bebber’s nomenclature [47]. The local ground relief played a key role in the intensification of the rainfall. Indeed, the steep windward slopes of the Beskid Śląski and the Beskid Mały ranges provided an orographic barrier that sped up the ascent of the humid air masses (Figure 2), thus contributing to the record daily totals [49]. Typically, intense precipitation in the Polish Carpathian Mountains is triggered by low-pressure systems travelling from the Mediterranean and northern Italy to the north-east, usually through Hungary and across the Carpathian Mountains, into southern Poland, Ukraine or Belarus, as has been documented by many examples discussed in a range of studies on earlier floods, e.g., in 1970 [17], 1997 [50] and 2010 [43,51]. After crossing the main Carpathian ridge, such lows normally persist for two to three days, but sometimes even up to seven days, over south-eastern Poland and western Ukraine, providing a sustained inflow of moist air feeding intense precipitation on the northern slopes of the Western Beskidy Mountains. These ranges constitute orographic barriers contributing an additional factor responsible for the condensation of water vapour and the formation of a thick layer of low clouds, and the resulting long-term precipitation tends to cover large areas and cause regional flooding [5]. Mountain ranges can constitute orographic barriers that seriously impede the incoming air masses during the migration of low-pressure systems. While the lighter warm air crosses relatively easily over the ridges, leaving behind a thick cloud cover that produces intense precipitation on the windward slopes, the heavy cool air can be trapped by even relatively low mountain ranges and is likely to stagnate before it can make its way around such barriers [49]. During the filling phase, lows take on a quasi-stationary character and precipitation becomes long-lasting. Mediterranean lows are a rare occurrence over the Polish Carpathian Mountains. At around 7 cases per year, their probability of occurrence in any given year is less than 2 per cent [52,53,54]. There is a distinct seasonal variation in their occurrence, with maximums in the spring and autumn. The spring maximum has a higher profile and is linked to the meridional circulation over Europe, dominant at this time of year [2], which favours the northward migration of Mediterranean lows. However, their presence is associated with 88% of the strong floods in Poland [55,56]. Mediterranean lows, in contrast to North Atlantic lows, are less active and of shorter duration. One in every four cases of weather anomaly is attributed to Genoa cyclones [56]. Also, one in every four low-pressure systems active in Poland during the warm season is, on average, linked to daily precipitation totals of more than 50 mm [55]. The study found that the speed of movement of the lows and of their atmospheric fronts depended on whether there were any blocking situations and were that to be the case, the slowing down would lead to persistent precipitation zones and to record rainfall totals, of which the May 2010 event (162.7 mm) is an example. In another finding, the study pointed to a heightened risk of unusually heavy rainfall and resulting flash floods whenever local secondary lows developed within a widespread low bay, which was the situation in September 2024.

5. Conclusions

The following are the key takeaways from the study of catastrophic precipitation in Bielsko-Biała:
  • The key role in their formation is played by Genoa lows, which typically follow a northward trajectory moving to the east from the study area;
  • Proximity of the centre of the low to the atmospheric fronts increases the intensity of the precipitation;
  • Orography is a significant factor modifying precipitation, especially when air masses arrive from the northern sector and push up the northern mountain slopes, leading to a significant increase in precipitation totals;
  • The six catastrophic precipitation events were linked either with deep convection or with long stagnating low-pressure systems kept in check by surrounding high-pressure systems;
  • The synoptic situations associated with the Genoa low in July 1970 and August 1972 were the result of slow northward movement of low-pressure systems rather than their complete stagnation;
  • Their season of occurrence runs from May to September, and they are linked to cyclonic circulation types, namely with advection from the northern sector and a cyclonic trough over southern Poland;
  • When forecasting high precipitation totals, the likelihood of two alternative synoptic situations conducive to their emergence (i.e., convective vs. blocking situations) requires particular attention to the thermodynamic and dynamic profiles in each such case;
  • Due to the violent nature of the rainfall events, the local precipitation histories had no significant impact on the surface run-off in any of the six catastrophic rainfalls;
  • The six cases discussed indicate an urgent need for further monitoring and detailed synoptic analysis to help forecast similar extreme hydrometeorological events more effectively;
  • Considerable hydrological, infrastructural, and social damage resulted from the concentrated heavy precipitation, itself a product of a combination of synoptic (atmospheric fronts, Mediterranean lows), thermodynamic (warm and humid air masses), and orographic (Beskid ranges) conditions.

Author Contributions

Conceptualization, R.T. and M.C.; methodology, R.T., M.C. and I.G.; software, R.T., M.C. and I.G.; validation, R.T., M.C. and I.G.; formal analysis R.T., M.C. and I.G.; investigation, R.T., M.C. and I.G.; resources, R.T., M.C. and I.G.; data curation, R.T., M.C. and I.G.; writing—original draft preparation, R.T., M.C. and I.G.; writing—review and editing, R.T., M.C. and I.G.; visualization, R.T., M.C. and I.G.; supervision, R.T., M.C. and I.G.; project administration, R.T., M.C. and I.G. All authors have read and agreed to the published version of the manuscript.

Funding

Proofreading of this publication has been supported by a grant No U1U/W23/NS/03.05 from the Faculty of Geography and Geology under the Strategic Program Excellence Initiative at Jagiellonian University.

Data Availability Statement

Publicly available datasets were analysed in this study. These data can be found here: [https://danepubliczne.imgw.pl/], accessed on 10 December 2024.

Acknowledgments

We thank Paweł Pilch and Martin Cahn for reviewing the English.

Conflicts of Interest

The authors declare no conflicts of interest.

References

  1. IPCC. 6th Assessment Report Climate Change 2021. The Physical Science Basis; Masson-Delmotte, Cambridge University Press: Cambridge, UK, 2023; Available online: http://www.ipcc.ch (accessed on 19 January 2025).
  2. Niedźwiedź, T.; Ustrnul, Z. Change of Atmospheric Circulation. In Climate Change in Poland. Past, Present, Future; Falarz, M., Ed.; Springer Nature Switzerland AG: Berlin/Heidelberg, Germany, 2021; pp. 123–150. [Google Scholar]
  3. Şen, Z.; Şişman, E.; Dabanli, I. Wet and dry spell feature charts for practical uses. Nat. Hazards 2020, 104, 1975–1986. [Google Scholar] [CrossRef]
  4. Kostrakiewicz, L. Opady atmosferyczne na terenach nawietrznych i zawietrznych Polskich Karpat. Czas. Geogr. 1977, XLVIII, 2. [Google Scholar]
  5. Cebulak, E.; Limanówka, D.; Pyrc, R.; Starkel, L. Influence of selected mountain barrier for the distribution of precipitation in the Polish Carpathians. Przegląd Geofiz. 2018, 1–2, 123–133. [Google Scholar]
  6. Durło, G.; Małek, S.; Socha, J. Extreme precipitation events in the Forest Promotion Complex of Silesian Beskid. Folia For. Pol. 2015, 57, 18–27. [Google Scholar] [CrossRef]
  7. Wypych, A.; Ustrnul, Z.; Schmatz, D.R. Long-term variability of air temperature and precipitation conditions in the Polish Carpathians. J. Mt. Sci. 2018, 15, 237–253. [Google Scholar] [CrossRef]
  8. Niedźwiedź, T.; Łupikasza, E.; Pińskwar, I.; Kundzewicz, Z.W.; Stoffel, M.; Małarzewski, Ł. Variability of high rainfalls and related synoptic situations causing heavy floods at the northern foothills of the Tatra Mountains. Theor. Appl. Climatol. 2015, 11, 273–284. [Google Scholar] [CrossRef]
  9. Walanus, A.; Cebulska, M.; Twardosz, R. Long-term variability pattern of monthly and annual atmospheric precipitation in the Polish Carpathian Mountains and their foreland (1881–2018). Pure Appl. Geophys. 2021, 178, 633–650. [Google Scholar] [CrossRef]
  10. Ustrnul, Z.; Wypych, A.; Nejedlík, P.; Mikulová, K. The influence of circulation conditions on extreme precipitation totals over the territory of the Western Carpathians in the warm season. Contrib. Geophys. Geod. 2023, 53, 399–411. [Google Scholar] [CrossRef]
  11. Kaczorowska, Z. Przyczyny meteorologiczne letnich wezbrań Wisły. Prace PIM 1933, 2, 54. [Google Scholar]
  12. Michalczewski, J. Meteorologiczna analiza powodzi z 10 i 11 maja 1951 r. Przegląd Meteorol. Hydrol. 1953, 6, 107–113. [Google Scholar]
  13. Milata, W. Synoptyka wielkich opadów atmosferycznych w Karpatach. Przegląd Meteorol. Hydrol. 1955, 8, 210–217. [Google Scholar]
  14. Morawska, M. Meteorologiczna charakterystyka powodzi z czerwca 1948 r. Biul. PIHM 1963, 1, 28. [Google Scholar]
  15. Morawska-Horawska, M. Meteorologiczne przyczyny powodzi w Polsce Południowej w lipcu 1970 roku. Przegląd Geofiz. 1971, 16, 299–315. [Google Scholar]
  16. Morawska-Horawska, M. Meteorologiczne przyczyny letniego wezbrania w Karpatach Zachodnich w 1973 r. Przegląd Geofiz. 1979, 24, 339–347. [Google Scholar]
  17. Niedźwiedź, T. Heavy Rainfall in the Polish Carpathians during the Flood in July 1970. Stud. Geomorphol. Carpatho-Balc. 1972, 6, 194–199. [Google Scholar]
  18. Niedźwiedź, T. Sytuacje synoptyczne i ich wpływ na zróżnicowanie przestrzenne wybranych elementów klimatu w dorzeczu górnej Wisły. Rozpr. Habilitacyjne UJ 1981, 58, 165. [Google Scholar]
  19. Mycielska, H. Atlas Typowych Sytuacji Synoptycznych Przy Występowaniu Opadów Powodziowych w Dorzeczu Górnej Wisły (1951–1960); Wyd. IMGW: Warsaw, Poland, 1979; ss. 16. [Google Scholar]
  20. Cebulak, E. Wpływ sytuacji synoptycznej na maksymalne opady dobowe w dorzeczu górnej Wisły. Folia Geogr. Ser. Geogr.-Phys. 1992, 23, 81–95. [Google Scholar]
  21. Cebulak, E. Maksymalne opady dobowe w dorzeczu górnej Wisły. Zesz. Nauk. UJ Pr. Geogr. 1992, 90, 79–96. [Google Scholar]
  22. Niedźwiedź, T.; Czekierda, D. Cyrkulacyjne uwarunkowania katastrofalnej powodzi w lipcu 1997 roku. In Powódź w dorzeczu górnej Wisły w lipcu 1997, Proceedings of the Konferencja naukowa w Krakowie, 7–9 Maja 1998; Wydawnictwo Oddziału Polskiej Akademii Nauk: Kraków, Poland, 1998; pp. 53–66. [Google Scholar]
  23. Niedźwiedź, T. Rainfall characteristics in southern Poland during the severe flooding event of July 1997. Stud. Geomorphol. Carpatho-Balc. 1999, 33, 5–25. [Google Scholar]
  24. Nachlik, E.; Kundzewicz, Z.W. History of floods on the Upper Vistula. In Flood Risk in the Upper Vistula Basin; Kundzewicz, Z., Stoffel, M., Niedźwiedź, T., Wyżga, B., Eds.; Geo-Planet: Earth and Planetary Sciences; Springer: Cham, Switzerland, 2016; pp. 279–292. [Google Scholar]
  25. Twardosz, R.; Cebulska, M.; Walanus, A. Anomalously heavy monthly and seasonal precipitation in the Polish Carpathian Mountains and their foreland during the years 1881–2010. Theor. Appl. Climatol. 2016, 126, 323–337. [Google Scholar] [CrossRef]
  26. Niedźwiedź, T.; Obrębska-Starklowa, B. Klimat. In Dorzecze górnej Wisły; Dynowska, I., Maciejowski, M., Eds.; Wydawnictwo PWN: Warszawa, Poland, 1991; pp. 68–84. [Google Scholar]
  27. Niedźwiedź, T. Catalogue of Synoptic Situations and Circulation Indices in the Upper Vistula River Basin (1873–2024); Department of Climatology, University of Silesia: Sosnowiec, Poland, 2024; Available online: https://us.edu.pl/instytut/inoz/kalendarz-typow-cyrkulacji/ (accessed on 10 March 2025).
  28. Cebulska, M.; Twardosz, R. Variability of Dry Days and Sequences of Dry Days in the Polish Carpathians in the Period 1986–2020. Water 2024, 16, 2982. [Google Scholar] [CrossRef]
  29. Available online: www.knmi.nl (accessed on 5 March 2025).
  30. Available online: www.imgw.pl (accessed on 17 March 2025).
  31. Available online: www.wetter3.de (accessed on 15 March 2025).
  32. Available online: https://danepubliczne.imgw.pl/ (accessed on 3 January 2025).
  33. Lorenc, H. Klęski żywiołowe a bezpieczeństwo wewnętrzne kraju; IMGW Państwowy Instytut Badawczy: Warszawa, Poland, 2012; s. 39. [Google Scholar]
  34. McKee, T.B.; Doesken, N.J.; Kleist, J. The Relationship of Drought Frequency and Duration to Time Scales. In Proceedings of the Eighth Conference on Applied Climatology, Anaheim, CA, USA, 17–22 January 1993; pp. 179–184. [Google Scholar]
  35. McKee, T.B.; Doesken, N.J.; Kleist, J. Drought Monitoring with Multiple Time Scales. In Proceedings of the 9th Conference on Applied Climatology, Dallas, TX, USA, 15–20 January 1995; pp. 233–236. [Google Scholar]
  36. Bąk, B.; Łabędzki, L. Modification of standardized precipitation index SPI for drought monitoring in Poland. Meteorological services tasks in NATO operations, missions and exer cises. In Proceedings of the 5 Intern. Symp. Milit. Meteorol., Poznań, Poznań, 29 September–2 October 2003; pp. 15–22. [Google Scholar]
  37. Łabędzki, L. Susze rolnicze. Zarys problematyki oraz metody monitorowania i klasyfikacji. Woda Środowiso. Obszary. Wiejskie. Rozprawy Naukowe i Monografie. 2006; 17. [Google Scholar]
  38. Kożuchowski, K.; Żmudzka, E. 100-year series of areally averaged temperatures and precipitation totals in Poland. Stud. Geogr. Acta Univ. Wratislav. 2003, 2542, 116–122. [Google Scholar]
  39. Leśniak, B.; Obrębska-Starklowa, B. Klimat województwa bielskiego. Folia Geogr. 1983, 15, 21–47. [Google Scholar]
  40. Łupikasza, E.; Niedźwiedź, T.; Pińskwar, I.; Ruiz-Villanueva, V.; Kundzewicz, Z.W. Observed changes in air temperature and precipitation and relationship between them, in the Upper Vistula Basin. In Flood Risk in the Upper Vistula Basin; Kundzewicz, Z., Stoffel, M., Niedźwiedź, T., Wyżga, B., Eds.; GeoPlanet: Earth and Planetary Sciences; Springer: Cham, Switzerland, 2016; pp. 155–188. [Google Scholar]
  41. Łupikasza, E.; Małarzewski, Ł. Precipitation. In Climate Change in Poland. Past, Present, Future; Falarz, M., Ed.; Springer Nature Switzerland AG: Berlin/Heidelberg, Germany, 2021; pp. 349–374. [Google Scholar]
  42. Brzóska, B.; Jaczewski, A. Future changes of selected climate indices in Poland based on the results of dynamical downscaling. Pr. Geogr. 2017, 149, 7–14. [Google Scholar] [CrossRef]
  43. Bissolli, P.; Friedrich, K.; Rapp, J.; Ziese, M. Flooding in eastern central Europe in May 2010—Reasons, evolution and climatological assessment. Weather 2011, 66, 147–153. [Google Scholar] [CrossRef]
  44. Woźniak, A. Opady w 2010 roku w Karpatach polskich na tle wielolecia 1881–2010. Pr. Geogr. 2013, 133, 35–48. [Google Scholar] [CrossRef]
  45. Available online: https://bielsko-biala.pl/ (accessed on 5 April 2025).
  46. Available online: https://www.gov.pl/ (accessed on 5 April 2025).
  47. Van Bebber, W.J. Die Zugstrassen der barometrischen Minima. Meteorol. Z. 1891, 8, 361–366. [Google Scholar]
  48. Available online: https://dzieje.pl/ (accessed on 5 April 2025).
  49. Barry, R.G. Mountain Weather and Climate, 3rd ed.; Cambridge University Press: Cambridge, UK, 2008. [Google Scholar]
  50. Grela, J.; Słota, H.; Zieliński, J. Dorzecze Wisły–Monografia Powodzi, Lipiec 1997; Instytut Meteorologii i Gospodarki Wodnej: Warszawa, Poland, 1999. [Google Scholar]
  51. Maciejowski, M.; Ostojski, M.; Walczykiewicz, T. (Eds.) The Vistula River Basin: A Study of the May–June 2010 Flood; Instytut Meteorologii i Gospodarki Wodnej–Państwowy Instytut Badawczy: Warszawa, Poland, 2011. [Google Scholar]
  52. Degirmendžić, J.; Kożuchowski, K. Precipitation of the Mediterranean origin in Poland—Its seasonal and long-term variability. Quaest. Geogr. 2015, 34, 37–53. [Google Scholar] [CrossRef]
  53. Degirmendžić, J.; Kożuchowski, K. Niże Śródziemnomorskie Jako Czynnik Klimatu Polski; Wyd. Uniwersytetu Łódzkiego: Łódź, Poland, 2016. [Google Scholar]
  54. Degirmendžić, J.; Kożuchowski, K. Aktywność niżów śródziemnomorskich nad Polską a cyrkulacja w górnej i środkowej troposferze. Przegląd Geofiz. 2016, 1–2, 3–30. [Google Scholar]
  55. Morozowska, J. Opady ciągłe w Polsce związane z niżami pochodzenia południowo-europejskiego. Pr. PIHM 1971, 103, 57–67. [Google Scholar]
  56. Bartoszek, K. Niże śródziemnomorskie. Przegląd Geofiz. 2006, 1, 35–45. [Google Scholar]
Figure 1. Location of study area in Poland and Europe.
Water 17 01611 g001
Figure 2. River network and land relief.
Water 17 01611 g002
Figure 3. Statistical characteristics of the mean monthly precipitation (left) and mean number of days with precipitation (≥0.1 mm and ≥10.0 mm) in Bielsko-Biała (right) (1951–2024); vertical bars indicate standard error of the mean.
Water 17 01611 g003
Figure 4. Statistical characteristics of the mean monthly (left) and daily precipitation totals (right) in Bielsko-Biała (1951–2024); vertical bars indicate the range between the minimum and maximum values.
Water 17 01611 g004
Figure 5. The sequence of daily rainfall totals in the 30 days preceding the occurrence of catastrophic precipitation.
Water 17 01611 g005
Figure 6. Absolute topography at 500 hPa (gpdm, black lines), ground-level pressure (hPa, white lines), and relative topography 500–1000 hPa (gpdm, colours) (a), distribution of the geopotential field and air temperatures at the 850 hPa pressure levels (b), distribution of relative air humidity [%] at 700 hPa pressure levels (c), and CAPE [J·kg−1] (d) on 24 July 1966 (12 UTC) [31].
Water 17 01611 g006
Figure 7. Surface synoptic situation at 12 UTC [30] (a), distribution of the geopotential field and air temperature 500 hPa (b) and 850 hPa (c) lifted index [K] i ML CAPE [J·kg−1] (d), distribution of relative humidity [%] at 700 hPa (e), [31] radiosonde data from the city of Tarnów (f), (IMGW-PIB) at 12 UTC, DPSRI (dBR) products (g), CMAX (dBZ) (h), and vertical section of VCUT (dBZ) (i) from the radar in Ramża at 16:38 UTC [32] on 3 June 2024.
Water 17 01611 g007
Figure 8. Surface synoptic situation at 00 UTC (meteo.imgw.pl/) (a), lifted index [K] i ML CAPE [J·kg−1] (b) [31], radiosonde data from the city of Tarnów (c), and (IMGW-PIB) at 00 UTC, product (dBR) (d) z Ramża radar [32] at 01:43 UTC on 4 June 2024.
Water 17 01611 g008
Figure 9. Diurnal distribution of precipitation totals from 3 to 4 June 2024 in Bielsko-Biała.
Water 17 01611 g009
Figure 10. Absolute topography at 500 hp (gpdm, black lines), ground-level pressure (hPa, white lines) and relative topography 500–1000 hPa (gpdm, colours) (a,b), distribution of the geopotential field and air temperatures at the 850 hPa (c,d) and CAPE [J·kg−1] (e,f) [31] on 18 July 1970 (12 UTC) and 21 August 1972 (12UTC).
Water 17 01611 g010
Figure 11. Surface synoptic situation at 12 UTC [29] (a), distribution of the geopotential field and air temperatures at the isobaric levels of 500 hPa (b) and 850 hPa (c), lifted index [K] and ML CAPE [J·kg−1] (d) [31] on 16 May 2010 (12 UTC).
Water 17 01611 g011
Figure 12. Surface synoptic situation at 12 UTC [30] (a), distribution of the geopotential field and air temperatures at the isobaric levels of 500 hPa (b) and 850 hPa (c), lifted index [K] i ML CAPE [J·kg−1] (d) [31], 12 UTC, diurnal variation of precipitation from 14 to 15 September 2024 in Bielsko-Biała (e), DPSRI product (dBR) (f), from Ramża radar [32] at 23:58 UTC on 14 September 2024.
Water 17 01611 g012
Table 1. List of catastrophic precipitation events in Bielsko-Biala in the years 1951–2024 (in order of occurrence), their empirical probability, return period (in years) and the accompanying type of circulation.
NoDataTotals (mm)Empirical Probability
p(m, N) (%)
Return Period
(in Years) **
Circulation Type *
1.24 July 1966122.26.715Bc (cyclonic trough)
2.18 July 1970132.15.319Nc (cyclonic from north)
3.21 August 972147.44.025Nc (cyclonic from north)
4.16 May 2010162.71.375NEc (cyclonic from north-east)
5.3 June 2024127.36.017NEc (cyclonic from north-east)
6.14 September 2024149.42.738NEc (cyclonic from north-east)
Notes: * according to Niedźwiedź’s classification [18,27], ** return period was calculated using the formula: 100/p%, for example, No. 1.: 100/6.7 = 14.92 = 15 years.
Table 2. SPI values in the months immediately prior to catastrophic rainfall in city of Bielsko-Biała.
Months24 July 196618 July 197021 August 197216 May 20103 June 2024
14 September 2024
January0.320.38−0.350.500.67
February1.490.08−0.32−0.090.94
March1.51−0.60−1.76−1.150.28
Aprl1.080.471.800.260.47
May1.60−0.39−0.084.09−0.4
June0.410.00−0.34 1.72
July2.491.740.43 −1.84
August 3.12 −0.52
September 1.94
Notes: bold type indicates SPI values in the month with catastrophic precipitation.
Disclaimer/Publisher’s Note: The statements, opinions and data contained in all publications are solely those of the individual author(s) and contributor(s) and not of MDPI and/or the editor(s). MDPI and/or the editor(s) disclaim responsibility for any injury to people or property resulting from any ideas, methods, instructions or products referred to in the content.