1. Introduction
The proper design of open channels is essential in hydraulic engineering, as it directly impacts water transport efficiency, flood prevention, and the stability of hydraulic infrastructure. Poorly designed channels can result in energy losses, bank erosion, uncontrolled sedimentation, and even structural failure. Therefore, ensuring optimal hydraulic performance requires the careful consideration of channel geometry, flow conditions, and environmental interactions.
Traditionally, open-channel flow analysis has relied on graphical and empirical methods, such as design curves and hydraulic charts [
1,
2]. While these methods remain useful, they are often limited in accuracy and applicability to complex flow conditions. Additionally, their reliance on approximations can introduce calculation errors, as noted by [
3].
Advancements in computational hydraulics have transformed the design and analysis of open channels, shifting the focus toward numerical models and computational simulations. Techniques such as finite differences, finite volumes, and finite elements have significantly improved the ability to solve flow equations with high spatial and temporal precision. Tools such as ANSYS Fluent [
4] and HEC-RAS [
5] have further optimized the design process, enabling engineers to simulate various flow scenarios and assess extreme conditions. These computational advancements have enhanced engineers’ capacity to design more efficient, safer, and more sustainable hydraulic systems, addressing contemporary challenges such as climate change and water resource management.
Despite these developments, there remains a need for computational tools that provide simplified yet reliable calculations to optimize various channel design scenarios and support preliminary decision-making before employing more complex simulation software. The development of specialized software tailored for efficient open-channel design has therefore become increasingly important for hydraulic engineers and professionals.
Modern hydraulic software should incorporate robust numerical methods for solving implicit equations, such as fixed-point iteration, Newton–Raphson, and secant methods, as well as integration techniques like the trapezoidal rule, Simpson’s rule, and Richardson’s extrapolation [
6]. In addition, these tools should integrate modern flow analysis techniques, offer high computational accuracy, provide extensive functionality, and feature an intuitive interface to facilitate user adoption.
Currently, various open-channel flow analysis software tools, including CESDb-PipeFlow [
7], CESDb-CriticalDepthCalculatorInOpenChannel [
8], Hcanales [
9], and APP-Hydraulics Channels [
10], are widely used in both academia and professional practice.
Although several software tools are available for open-channel analysis, many require extensive setup or user training, or are limited to specific geometries and functionalities. Some commercial solutions also involve licensing fees or high computational demands, which can limit their accessibility for early-stage design or academic use.
To address this need, IpFlux was developed as a cost-free, user-friendly alternative focused on delivering rapid and reliable hydraulic calculations. It allows users to directly estimate flow parameters such as depth, discharge, and slope, supporting the quick evaluation of multiple design alternatives.
The aim of this study is to present the structure and capabilities of IpFlux and to validate its performance by comparing its results with analytical references and selected outputs from established software tools.
Table 1 provides a comparative analysis of several hydraulic software tools. The comparison considers key aspects such as hydraulic computation capabilities, channel geometries, the design of gates, orifices, and weirs, as well as the accessibility of their input and output interfaces.
From
Table 1, it is evident that no single software tool comprehensively addresses all aspects of open-channel flow analysis. Moreover, many existing tools present significant limitations, such as restricted functionality in free versions or high costs for full-feature access, making them less accessible to researchers and professionals.
In response to these challenges, this paper introduces IpFlux, a new software tool designed for accurate and efficient hydraulic analysis of open channels. Developed in Python 3.12, IpFlux offers unrestricted, cost-free access, making it a valuable tool for both academic and professional applications. Thanks to its accessible and user-friendly nature, IpFlux serves as an effective solution for early-stage hydraulic design and education.
IpFlux supports the analysis of open-channel systems with diverse geometries and applications, including conveyance, irrigation, sewerage, and drainage. It enables the computation of key hydrodynamic parameters such as normal and critical depths, channel optimization, composite roughness, compound section analysis, hydraulic jumps, and backwater curves. In addition, it facilitates the design of hydraulic structures, including step flow (both negative and positive), gates, orifices, and weirs. The software also allows for the export of specific results to Excel, streamlining data analysis and decision-making in hydraulic design projects.
The primary objective of this work is to document the features of IpFlux, compare its capabilities with existing hydraulic analysis tools, and evaluate its performance through theoretical analysis and practical case studies.
This paper is structured as follows:
Section 2 describes the software architecture and its various functional modules;
Section 3 outlines the numerical methodologies implemented for hydraulic calculations, including normal depth, critical depth, steps, weirs, backwater, orifices, most efficient cross-sections, minimal infiltration sections, and hydraulic jumps;
Section 4 presents the validation of the models; and finally,
Section 5 discusses the conclusions and future research directions.
2. Software Architecture and Design
IpFlux is built on a modular architecture that systematically organizes its functionalities into distinct layers, ensuring efficient hydraulic computations while maintaining a user-friendly interface. Developed in Python, it leverages high-performance scientific libraries such as NumPy and SciPy, which significantly enhance both the accuracy and computational efficiency of hydraulic analyses.
The following sections provide a detailed overview of IpFlux’s architectural layers and key user interface features.
2.1. Software Structure
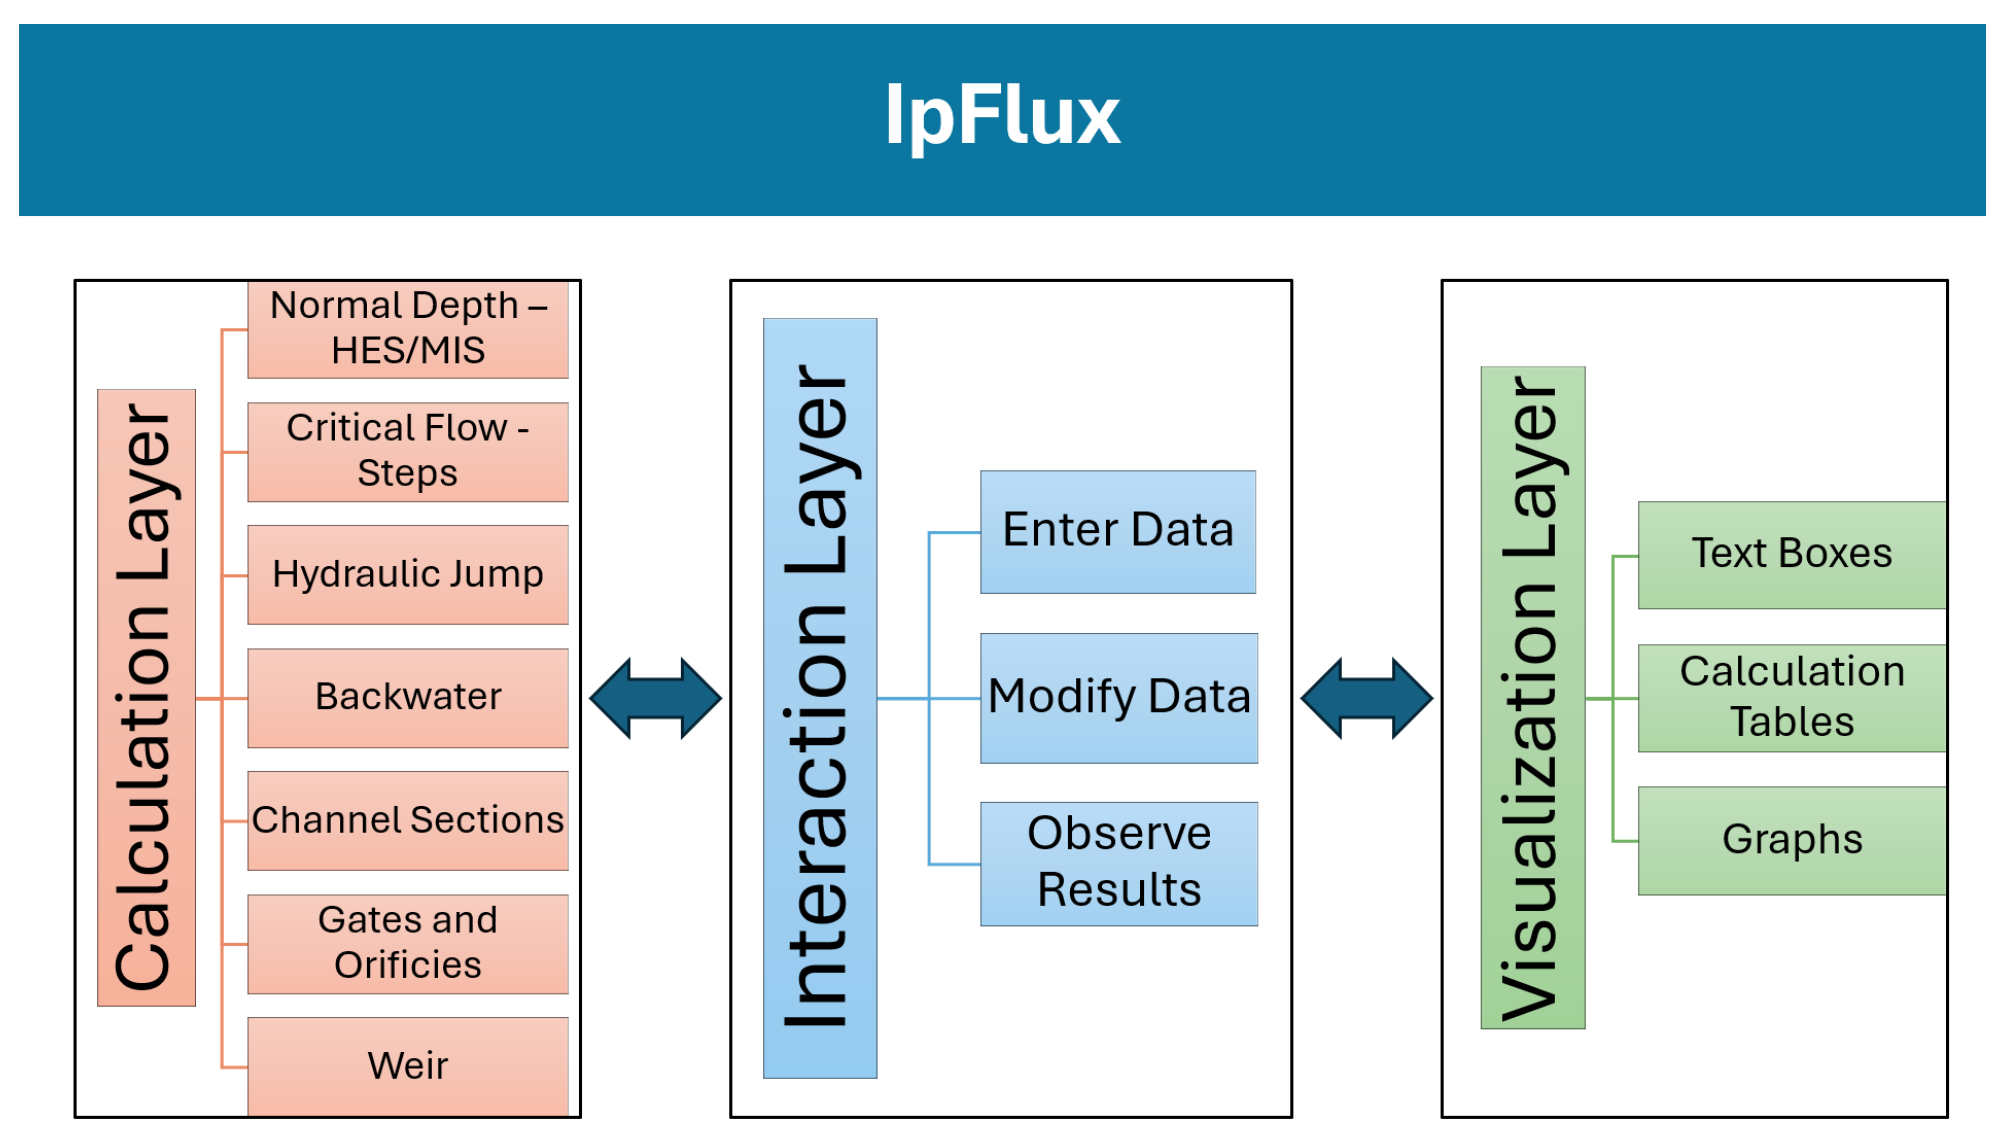
The software architecture is structured into three main layers, which work interactively to optimize the calculation of hydraulic parameters and enhance the user experience.
Figure 1 illustrates the internal structure and interactions among these layers.
The software architecture is composed of three interconnected layers: the calculation layer, the interaction layer, and the visualization layer.
The calculation layer implements mathematical models and algorithms for hydraulic parameter computations. It is responsible for processing all equations and ensuring computational accuracy.
The interaction layer serves as an interface between the calculation and visualization layers, allowing users to modify input variables and observe real-time changes in the results. Its flexibility enables IpFlux to accommodate a wide range of channel configurations and hydraulic structures.
The visualization layer provides users with access to specific calculation modules and presents results through graphs, tables, and text boxes, enhancing interpretability and decision-making.
This structured approach ensures efficient data processing, seamless user interaction, and clear result visualization.
2.2. User Interface and Key Functionalities
The IpFlux user interface features a side menu that organizes its functionalities, enabling intuitive navigation across various calculation tools. Each module is specifically optimized for a distinct type of hydraulic analysis, as detailed below.
2.2.1. Normal Flow Depth, Hydraulic Efficient, and Minimal Infiltration Sections Module
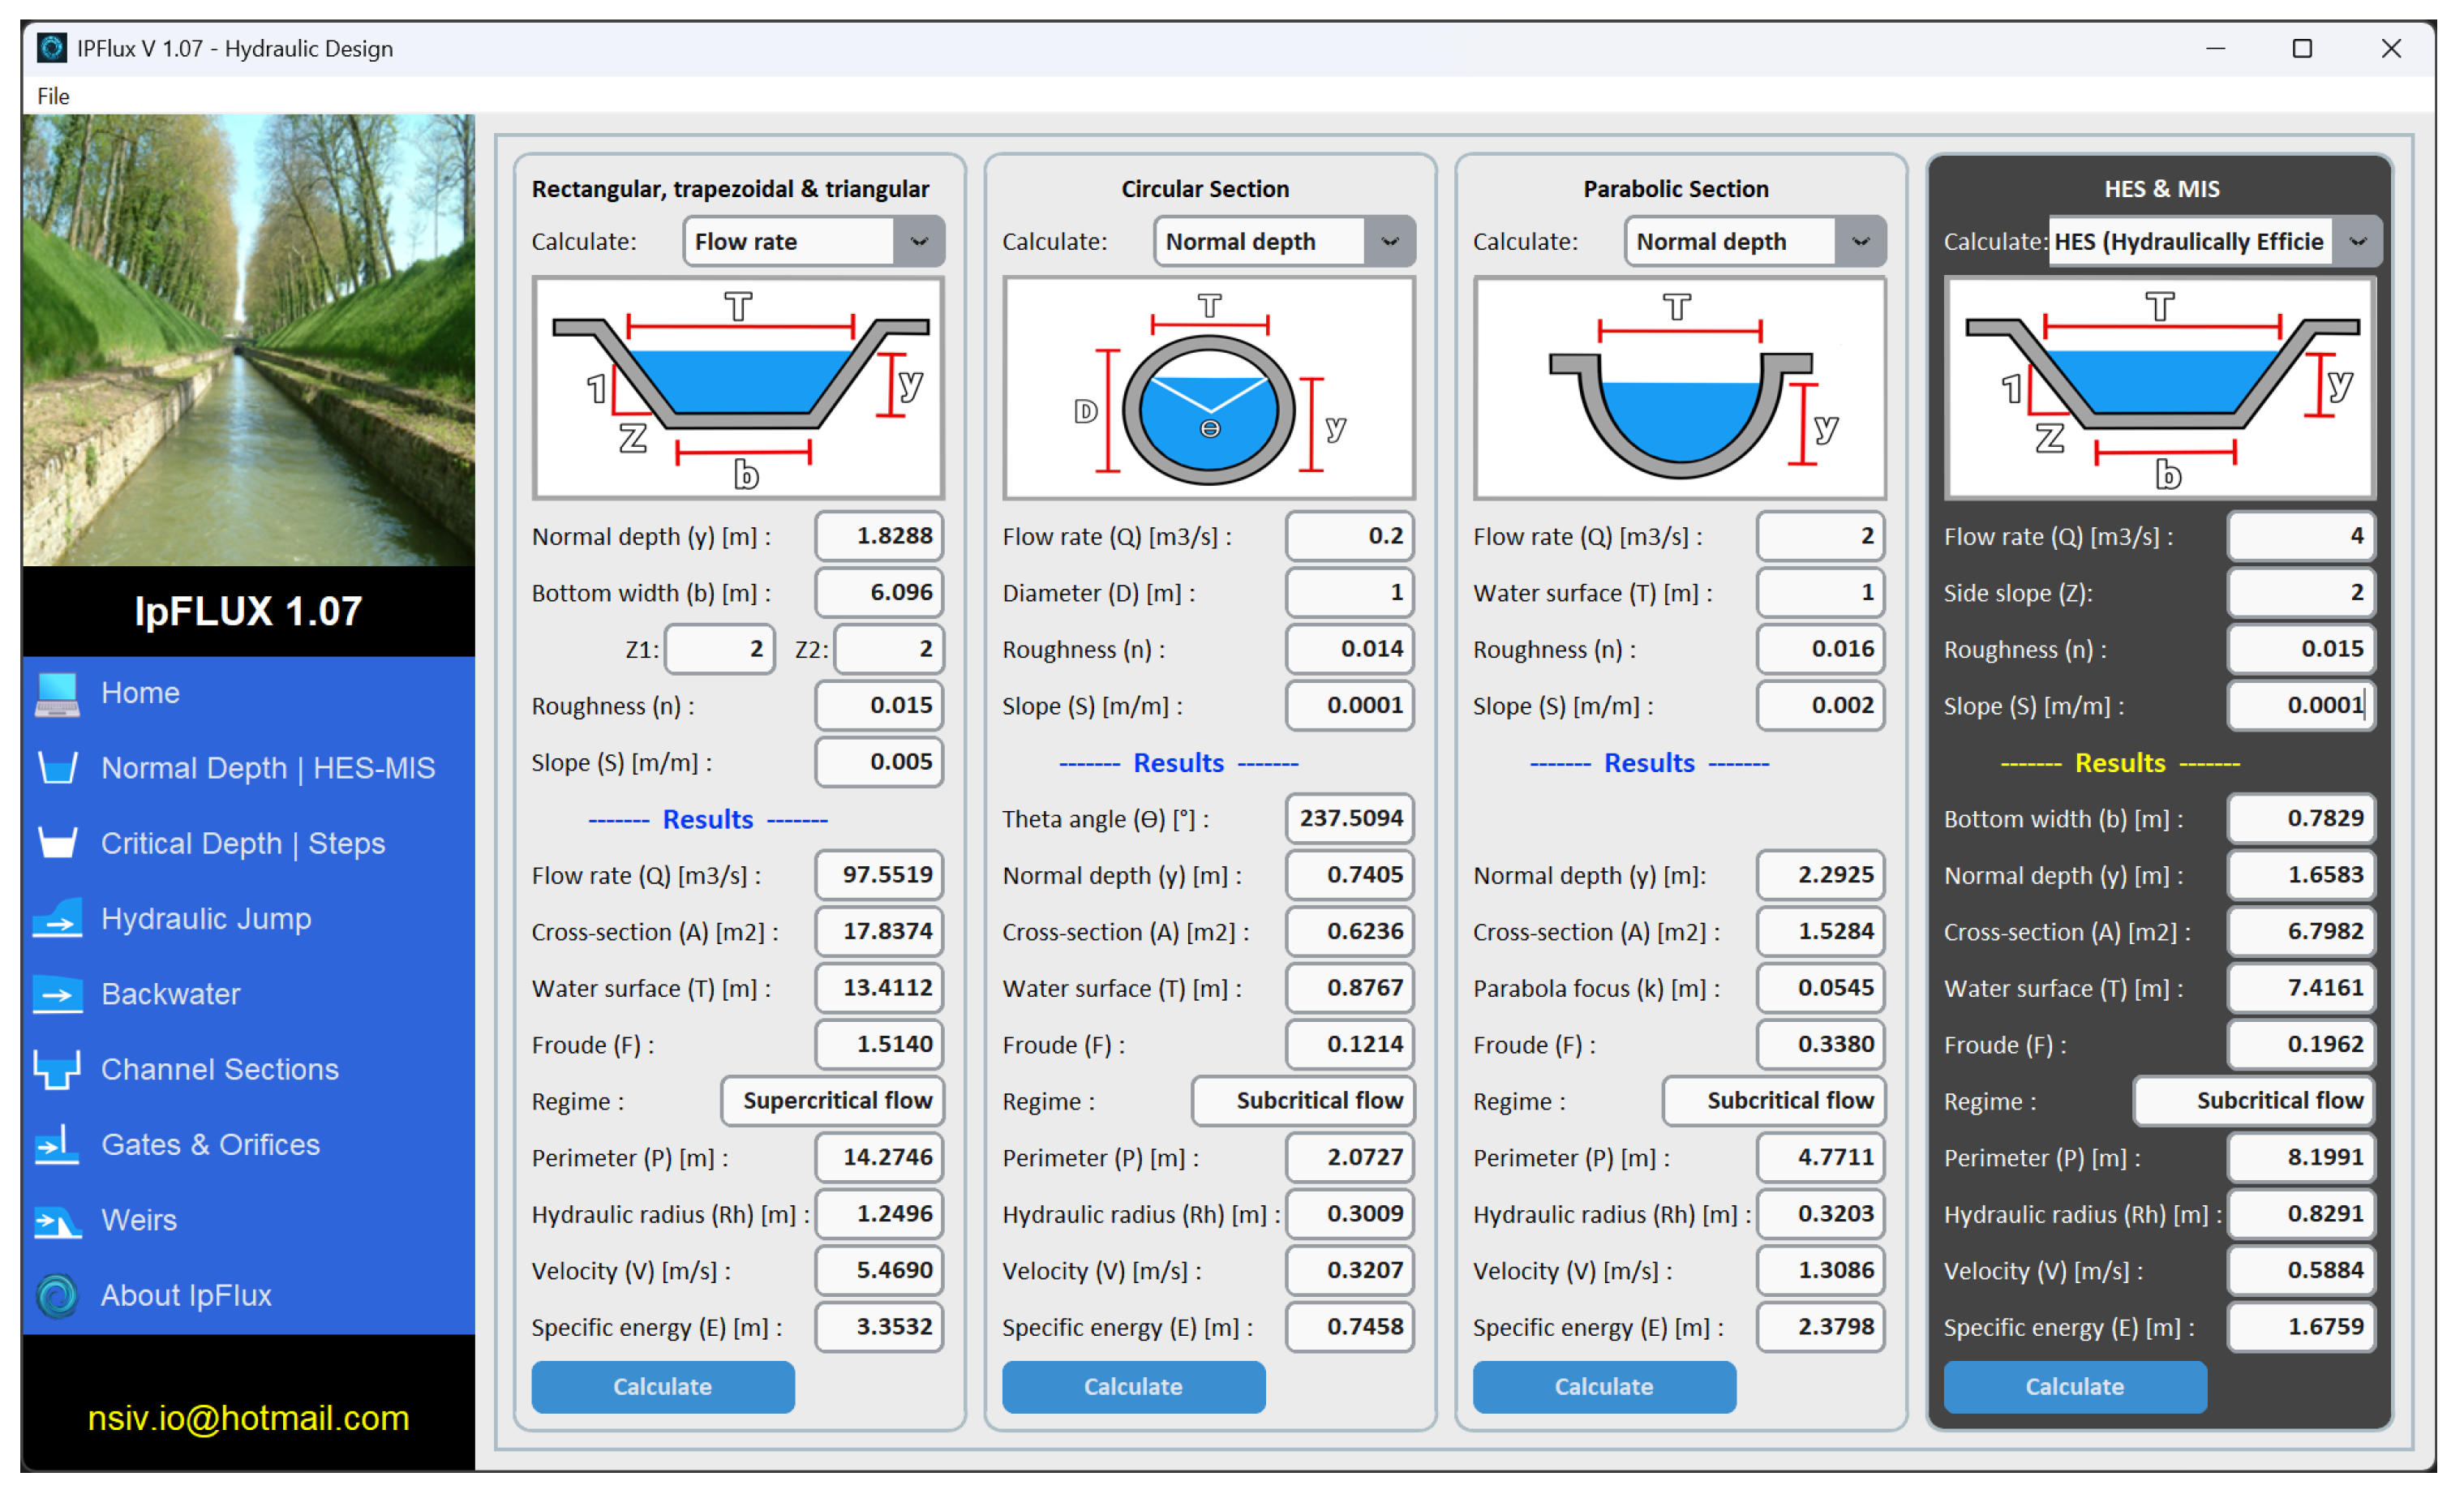
This module calculates normal flow depths or a derived variable such as roughness, slope, bottom width, or flow rate, and optimizes the cross-section (HES) and the minimal infiltration section (MIS). It provides detailed hydraulic parameters such as hydraulic area, hydraulic radius, and flow regime.
The module allows users to switch between different calculation modes based on the provided input parameters and the desired output variables. Depending on the selected inputs, it can compute normal depth, roughness, slope, channel width, or discharge. This functionality is illustrated in
Figure 2, while
Table 2 summarizes the available options and the input and output parameters the module can either compute or receive, depending on the channel geometry and the selected calculation mode.
IpFlux incorporates an interactive graphical interface that dynamically updates the schematic representation of the channel cross-section based on user-defined inputs, without requiring any additional action.
The left sidebar menu provides access to various software functions, including the calculation of normal flow depth, critical flow, hydraulic jumps, backwater profiles, and channel sections, as well as the design of hydraulic structures such as gates and weirs. In the normal flow depth module, users can select different channel sections, interact with input data, and define the unknown variable to be computed, ensuring a versatile and user-friendly experience. Additionally, the HES and MIS modules optimize the design of trapezoidal channels, improving both the efficiency and accuracy of hydraulic analysis.
2.2.2. Critical Flow Depth and Hydraulic Steps Module
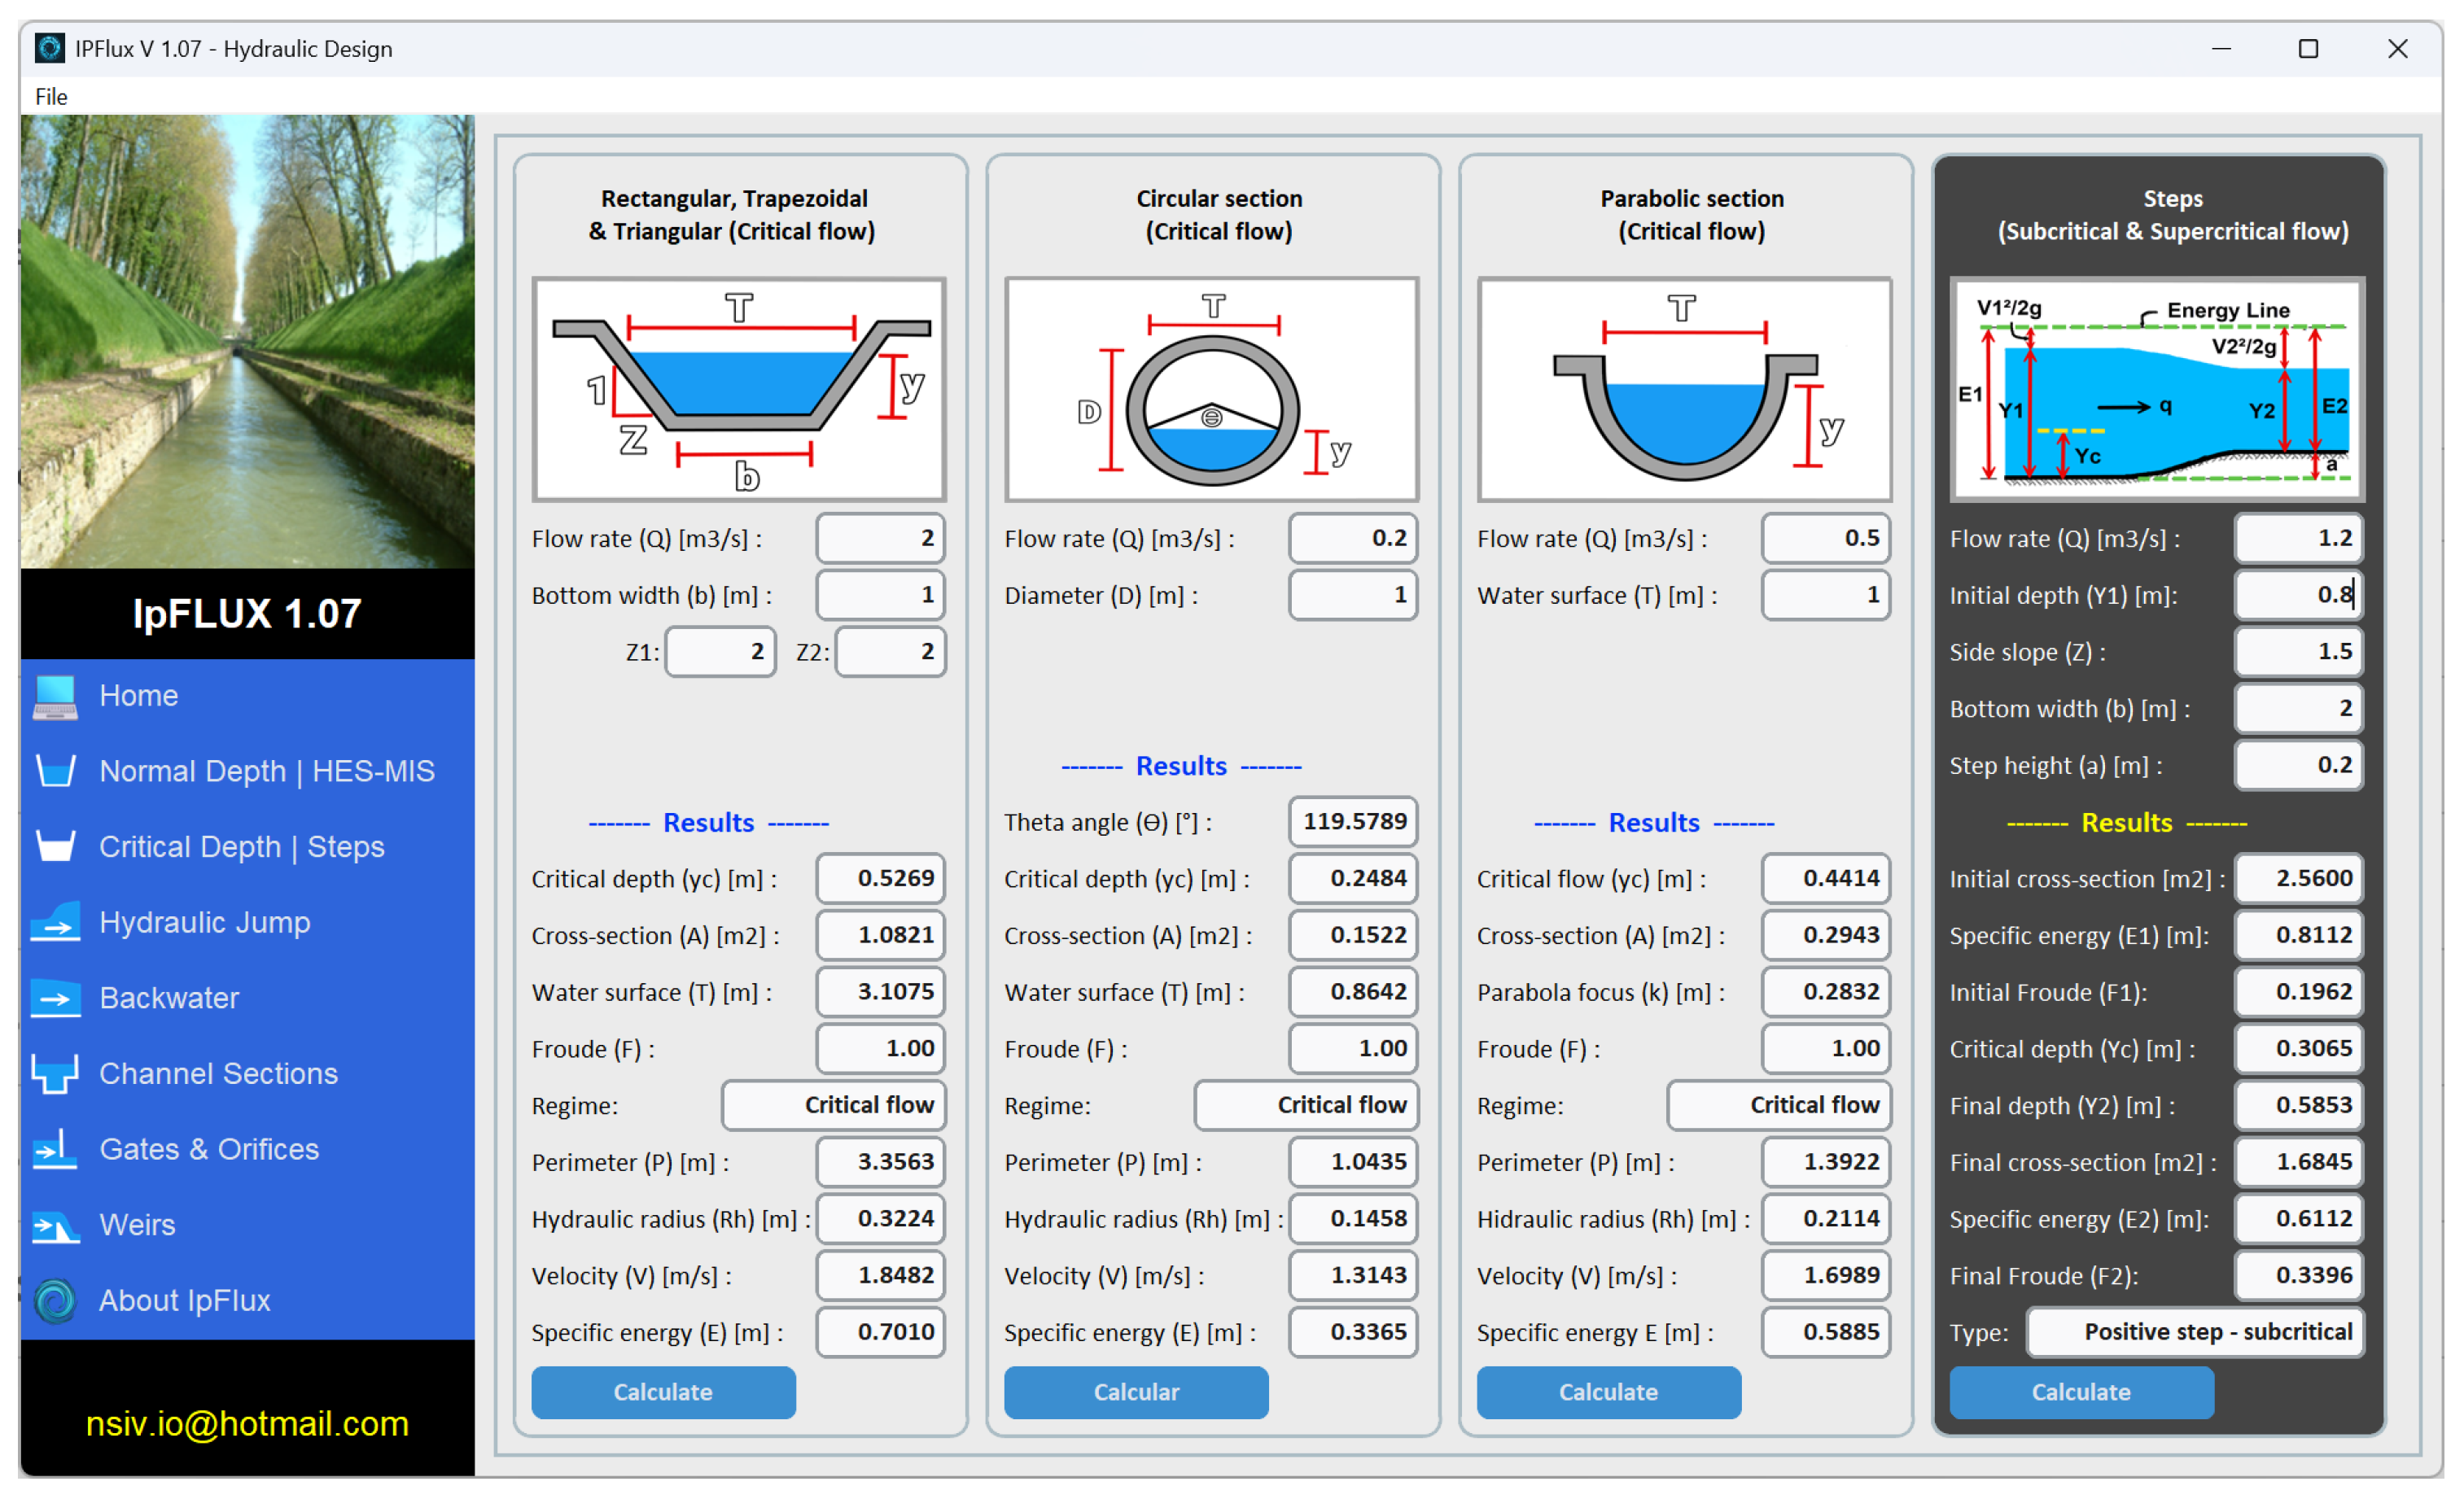
This module computes the critical flow depth for various channel configurations, including trapezoidal, rectangular, triangular, circular, and parabolic sections. It also determines key hydraulic parameters such as the hydraulic area and Froude number. The module interface is illustrated in
Figure 3, and
Table 3 presents the input and output parameters.
In the critical flow depth and steps module, the first three panels are organized according to common channel section shapes, providing rapid calculations of flow regime, velocity, and specific energy—parameters essential for channel design and inter-channel connections. The right panel displays the step configuration, presenting quick energy calculations that are critical for hydraulic design.
Additionally, the hydraulic steps module evaluates energy and flow behavior in stepped slopes, providing detailed outputs for initial and final depths, specific energy, and flow classification (river or torrent).
2.2.3. Hydraulic Jump Module
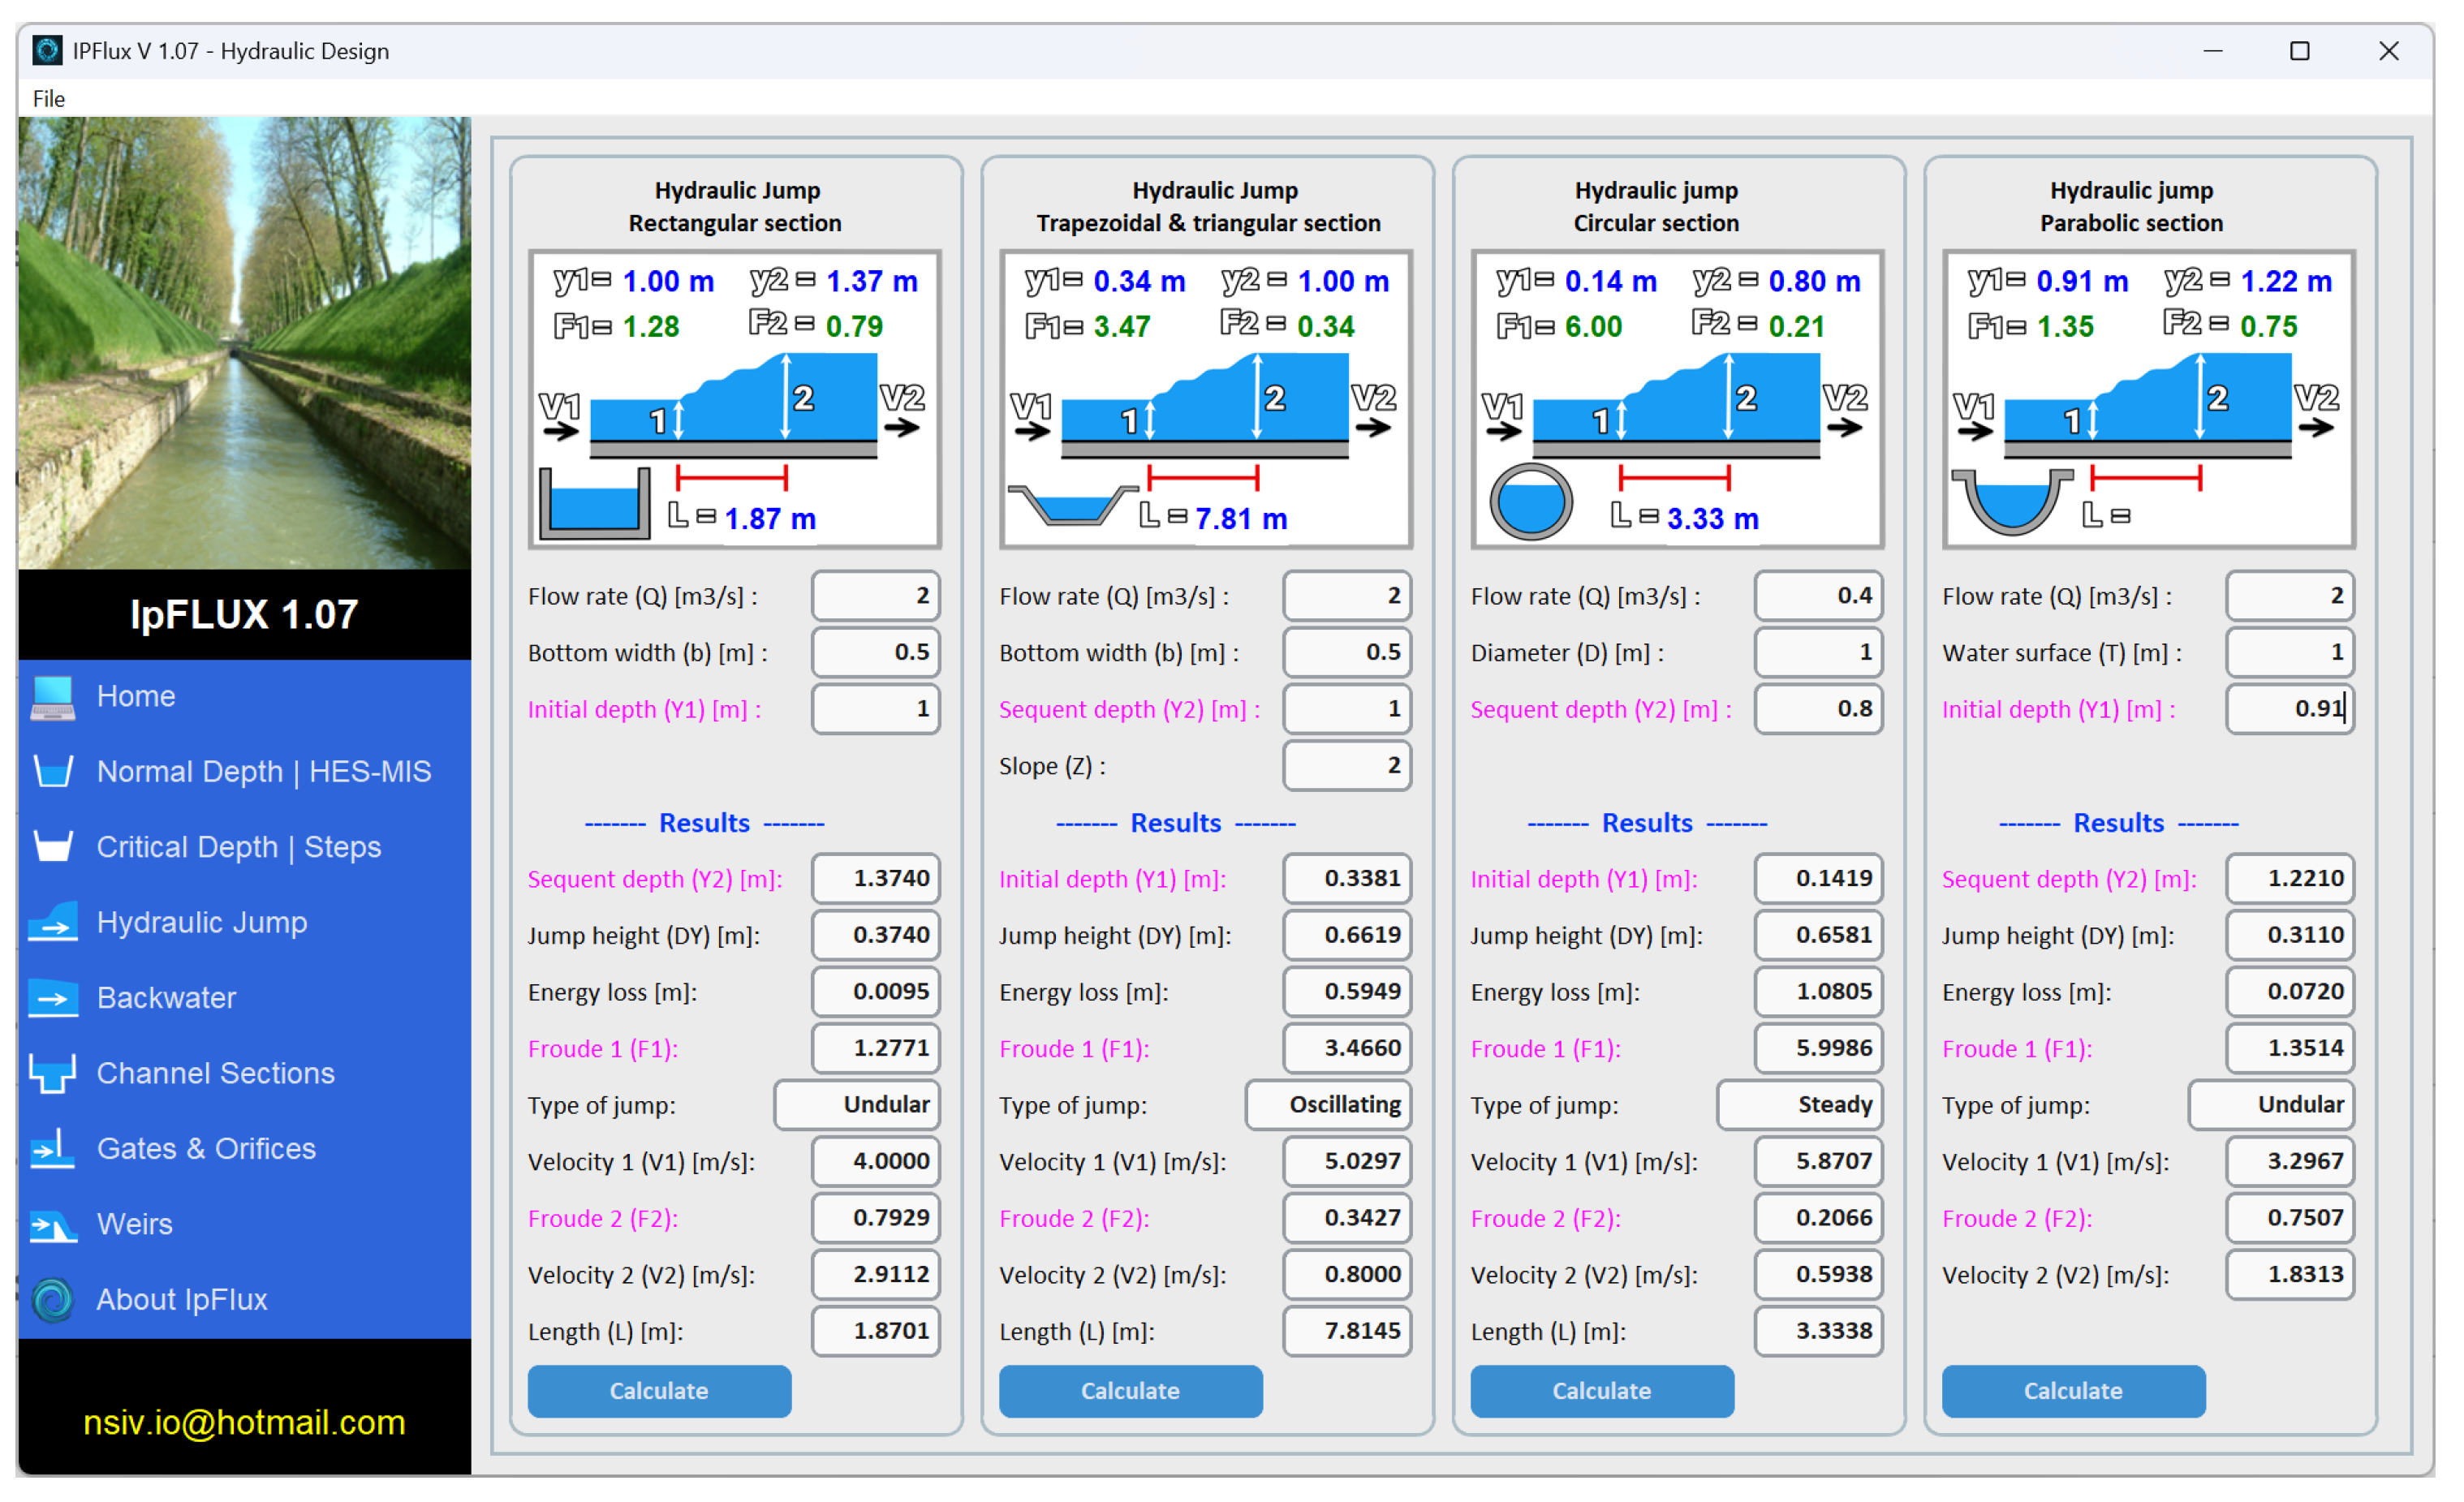
The hydraulic jump module in IpFlux allows users to compute conjugate depths, energy loss, Froude numbers, velocities, and jump length based on the input flow rate and channel geometry under the provided flow conditions.
Figure 4 shows the interface of this module.
This interface displays the graphical representation of the hydraulic jump for various channel geometries, highlighting the evolution of flow depth, energy dissipation, flow regime, jump length, and jump type—all of which are essential for assessing jump stability.
Table 4 presents the input and output parameters of this module. From the input depth, the supercritical or subcritical condition is determined and the conjugate depth is then computed accordingly. Depending on the geometry and input configuration, the input flow depth,
Y, or the initial or sequent depths
and
, respectively, may act as input, while the remaining depths and flow parameters are computed as outputs.
A distinctive feature of this module is its dynamic visual representation: as input values are entered, the schematic updates to display the computed depths (, ), Froude numbers (, ), and the estimated jump length (L). This visual feedback enhances the user’s understanding of jump formation and energy dissipation across different channel types.
The module provides detailed outputs, including upstream and downstream depths, energy loss, Froude numbers, jump classification, flow velocities, and jump length.
2.2.4. Backwater Curve Module
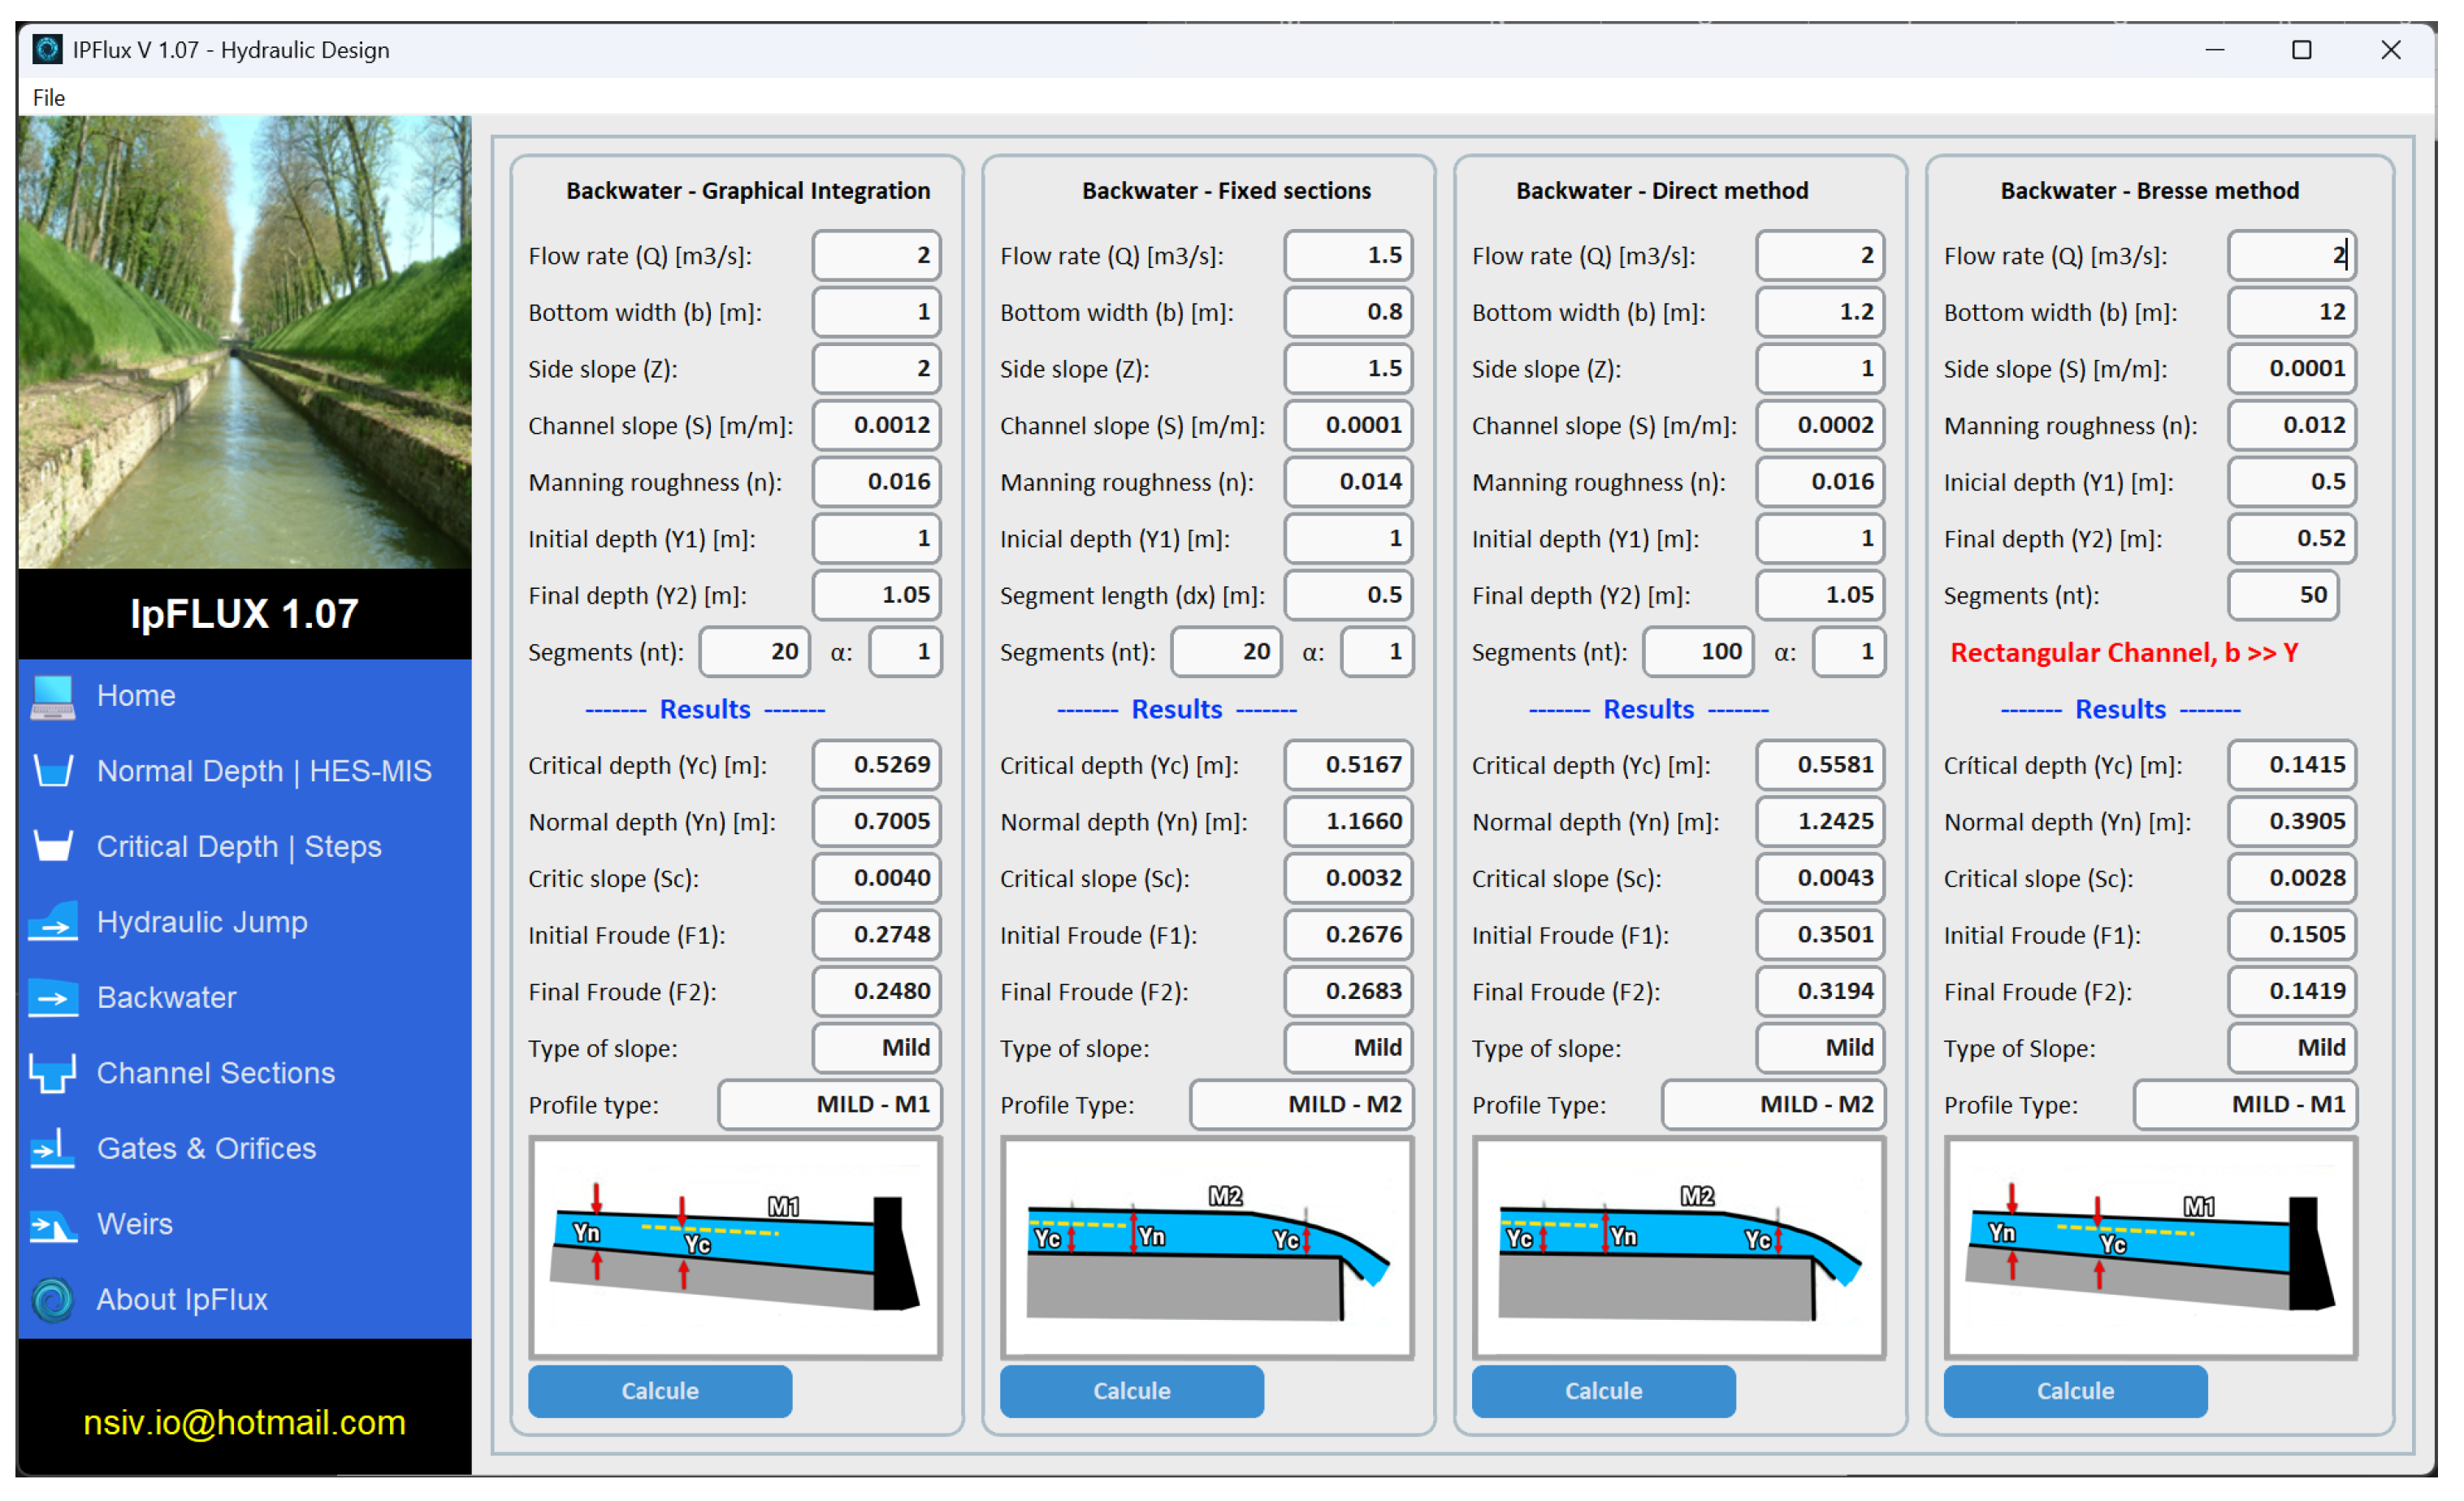
This module analyzes backwater profiles using methods such as graphical integration and fixed-increment techniques, while also automatically exporting detailed segment calculations to Excel.
Figure 5 illustrates the input data and numerical computation. It is possible to generate a graphical output of free surface profiles and numerical results in Excel tables, which are very useful for analyzing gradually varied flows.
This module calculates backwater curves using four different methods, allowing users to compare and apply multiple results to the same set of input data, including flow rates and channel characteristics.
Table 5 presents the input and output parameters of this module.
The choice of numerical method significantly influences calculation accuracy and the handling of large datasets. The results are categorized according on the type of backwater curve.
2.2.5. Compound Channel Sections Module
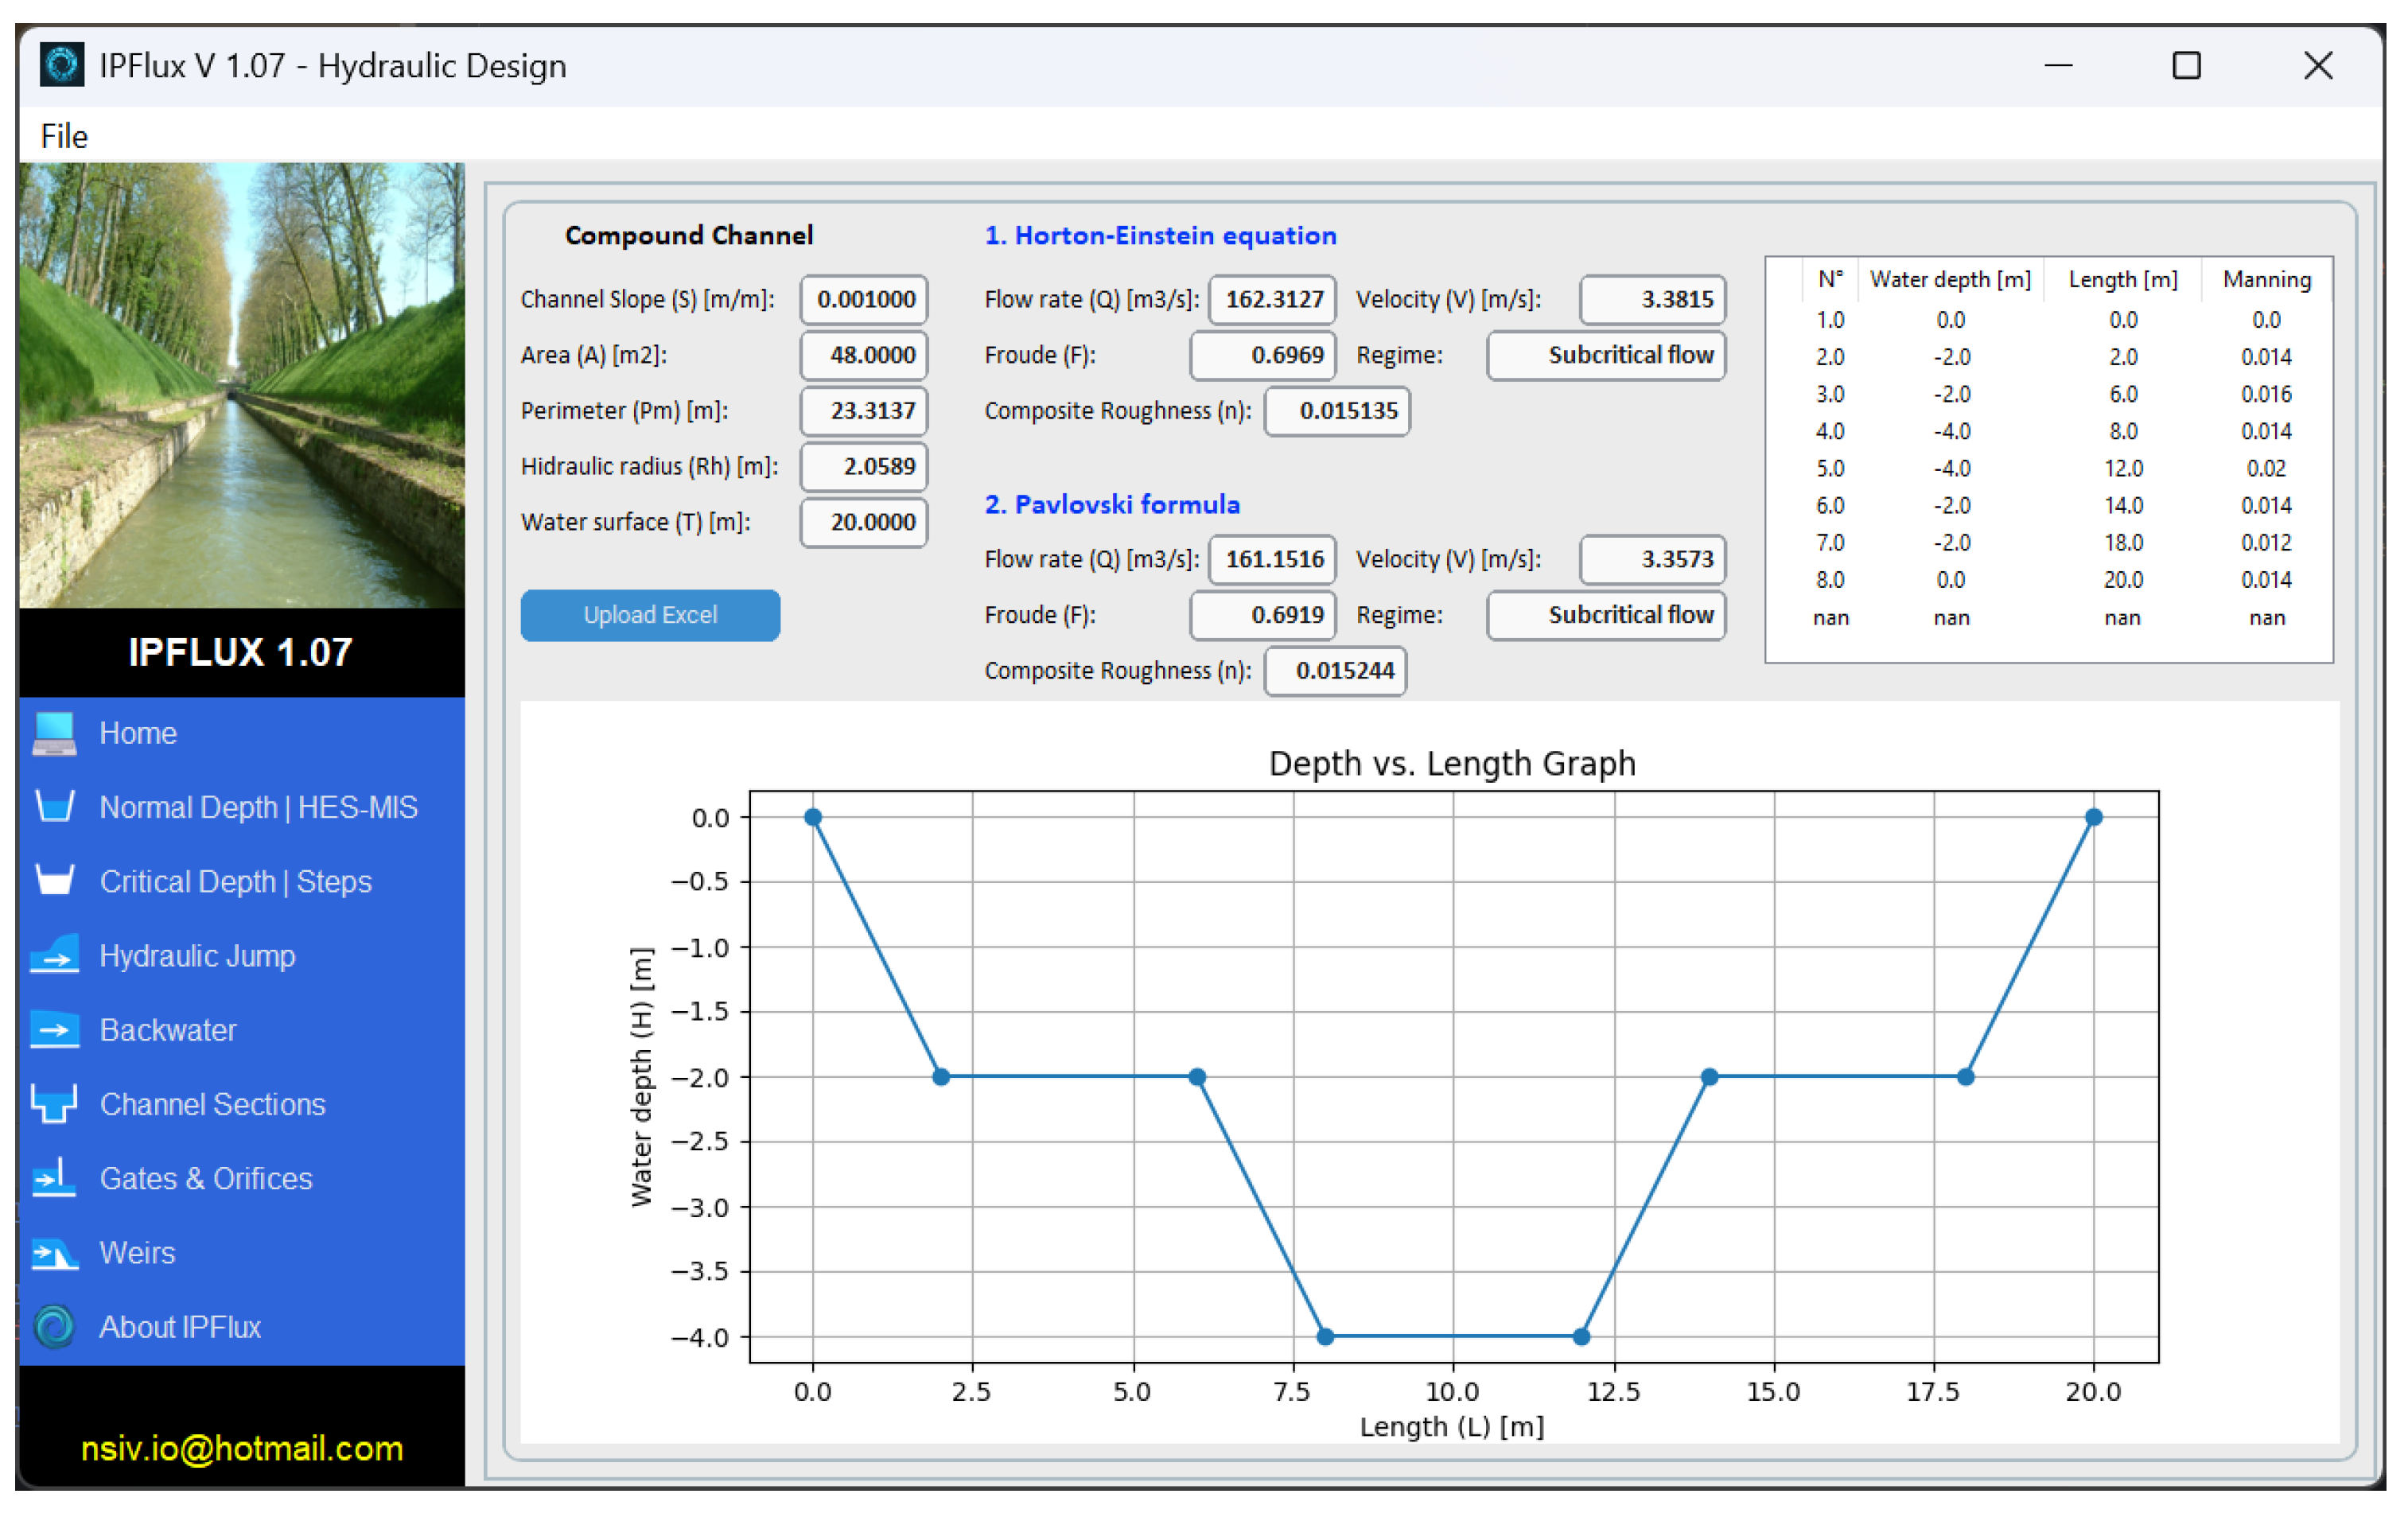
This module handles compound section geometries by importing section profiles from Excel files. It calculates composite roughness, flow regime and flow rate using methods such as Pavlovski and Horton–Einstein [
11], providing key parameters including hydraulic area, wetted perimeter, and hydraulic radius.
Figure 6 illustrates this functionality, whereas
Table 6 presents the characteristics of input data file, as well as the input and output parameters.
The module displays the compound section visualization, which can be imported from Excel. It applies two calculation methods for the composite n value using the Manning formula to determine the flow regime. This functionality allows the analysis of natural channels and design of hydraulic structures.
2.2.6. Gates Module
This module calculates flow through flat gates at various predefined inclination angles, based on user-defined gate dimensions.
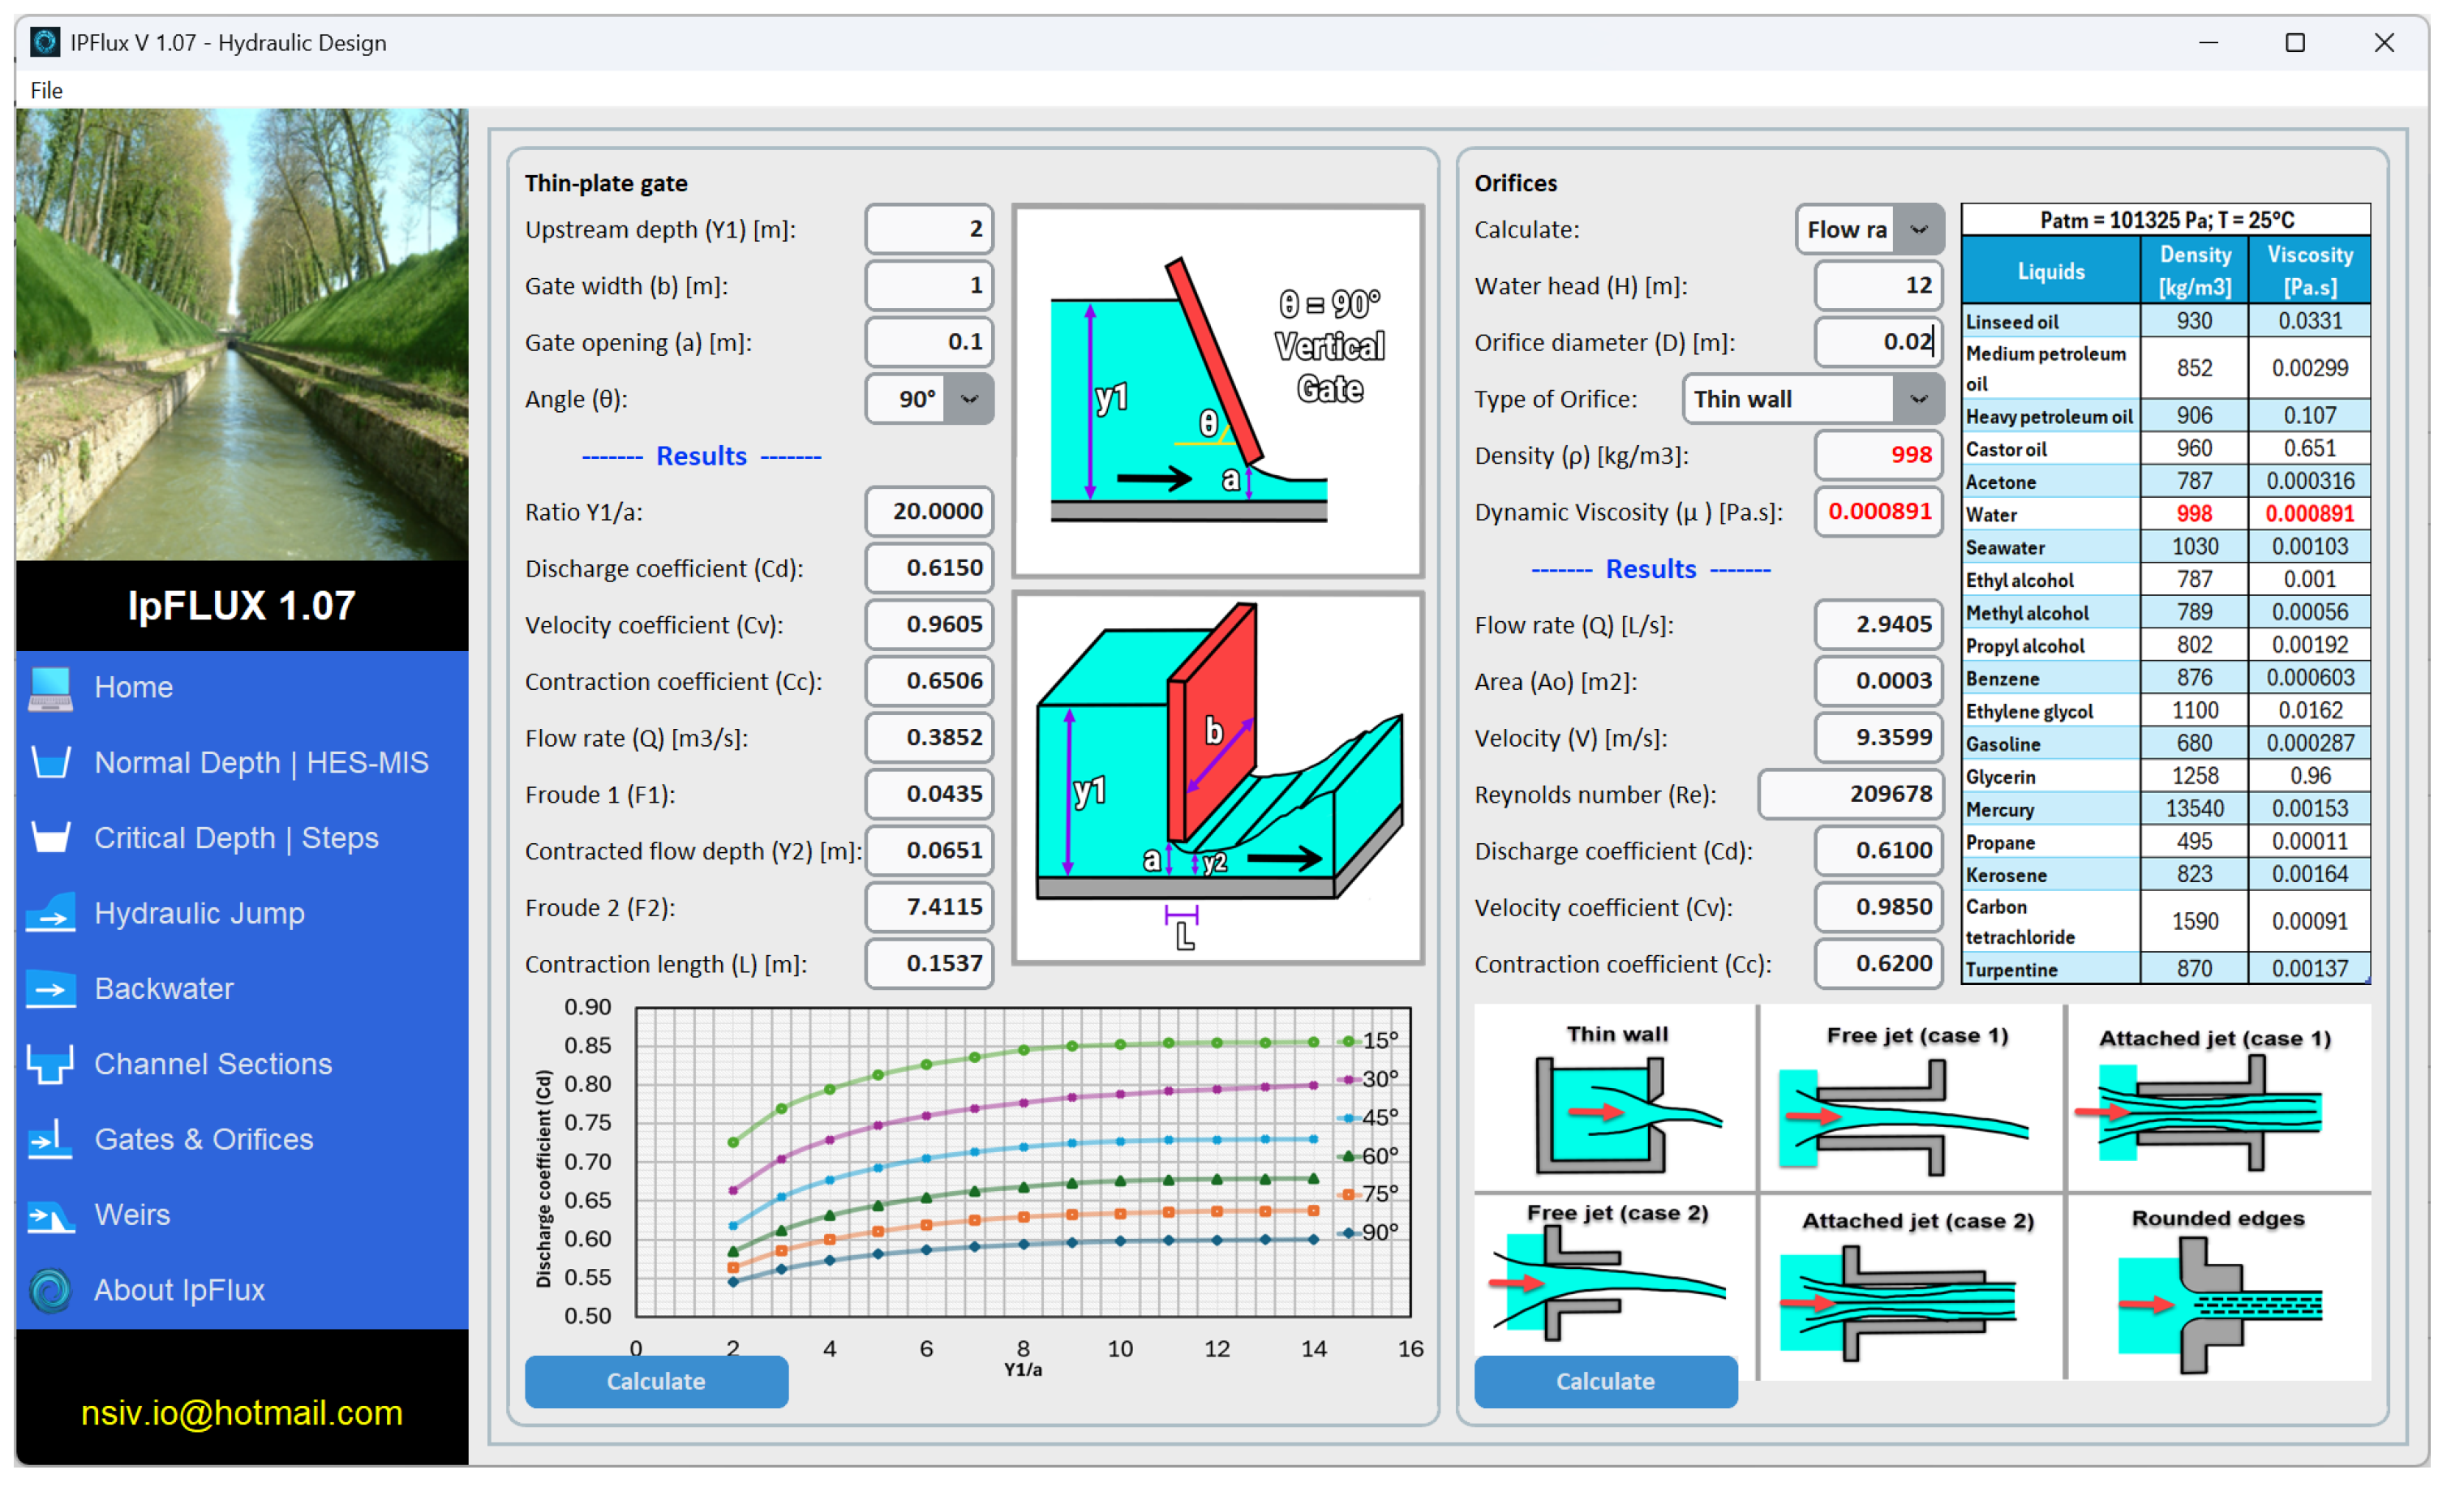
Figure 7 illustrates the input interface of this module.
The software computes the flow characteristics and the influence of the gate’s geometry on the discharge coefficient (
), velocity coefficient (
), and contraction coefficient (
) as well as the flow rate (
Q), Froude numbers (
and
), and contraction length (
L). In this module,
represents the ratio between the upstream depth (
) and the gate opening, and
is the contracted flow depth. The input and output parameters are presented in
Table 7.
2.2.7. Orifice Flow Module
This module performs calculations for various orifice types, including thin-wall and rounded-edge configurations. Users can choose between specifying the flow rate or the water head, and select the orifice type and fluid properties in order to obtain the flow rate, orifice area, mean velocity, Reynolds number, and the discharge, velocity, and contraction coefficients. The module also evaluates orifice dimensions and the corresponding coefficients based on the wall type.
Figure 7 shows the module’s interface, particularly the flow representation through flat gates at various inclination angles, including the calculation of discharge, velocity, and contraction coefficients, which are essential for hydraulic design.
Table 8 presents the module’s input and output parameters.
2.2.8. Weirs Module
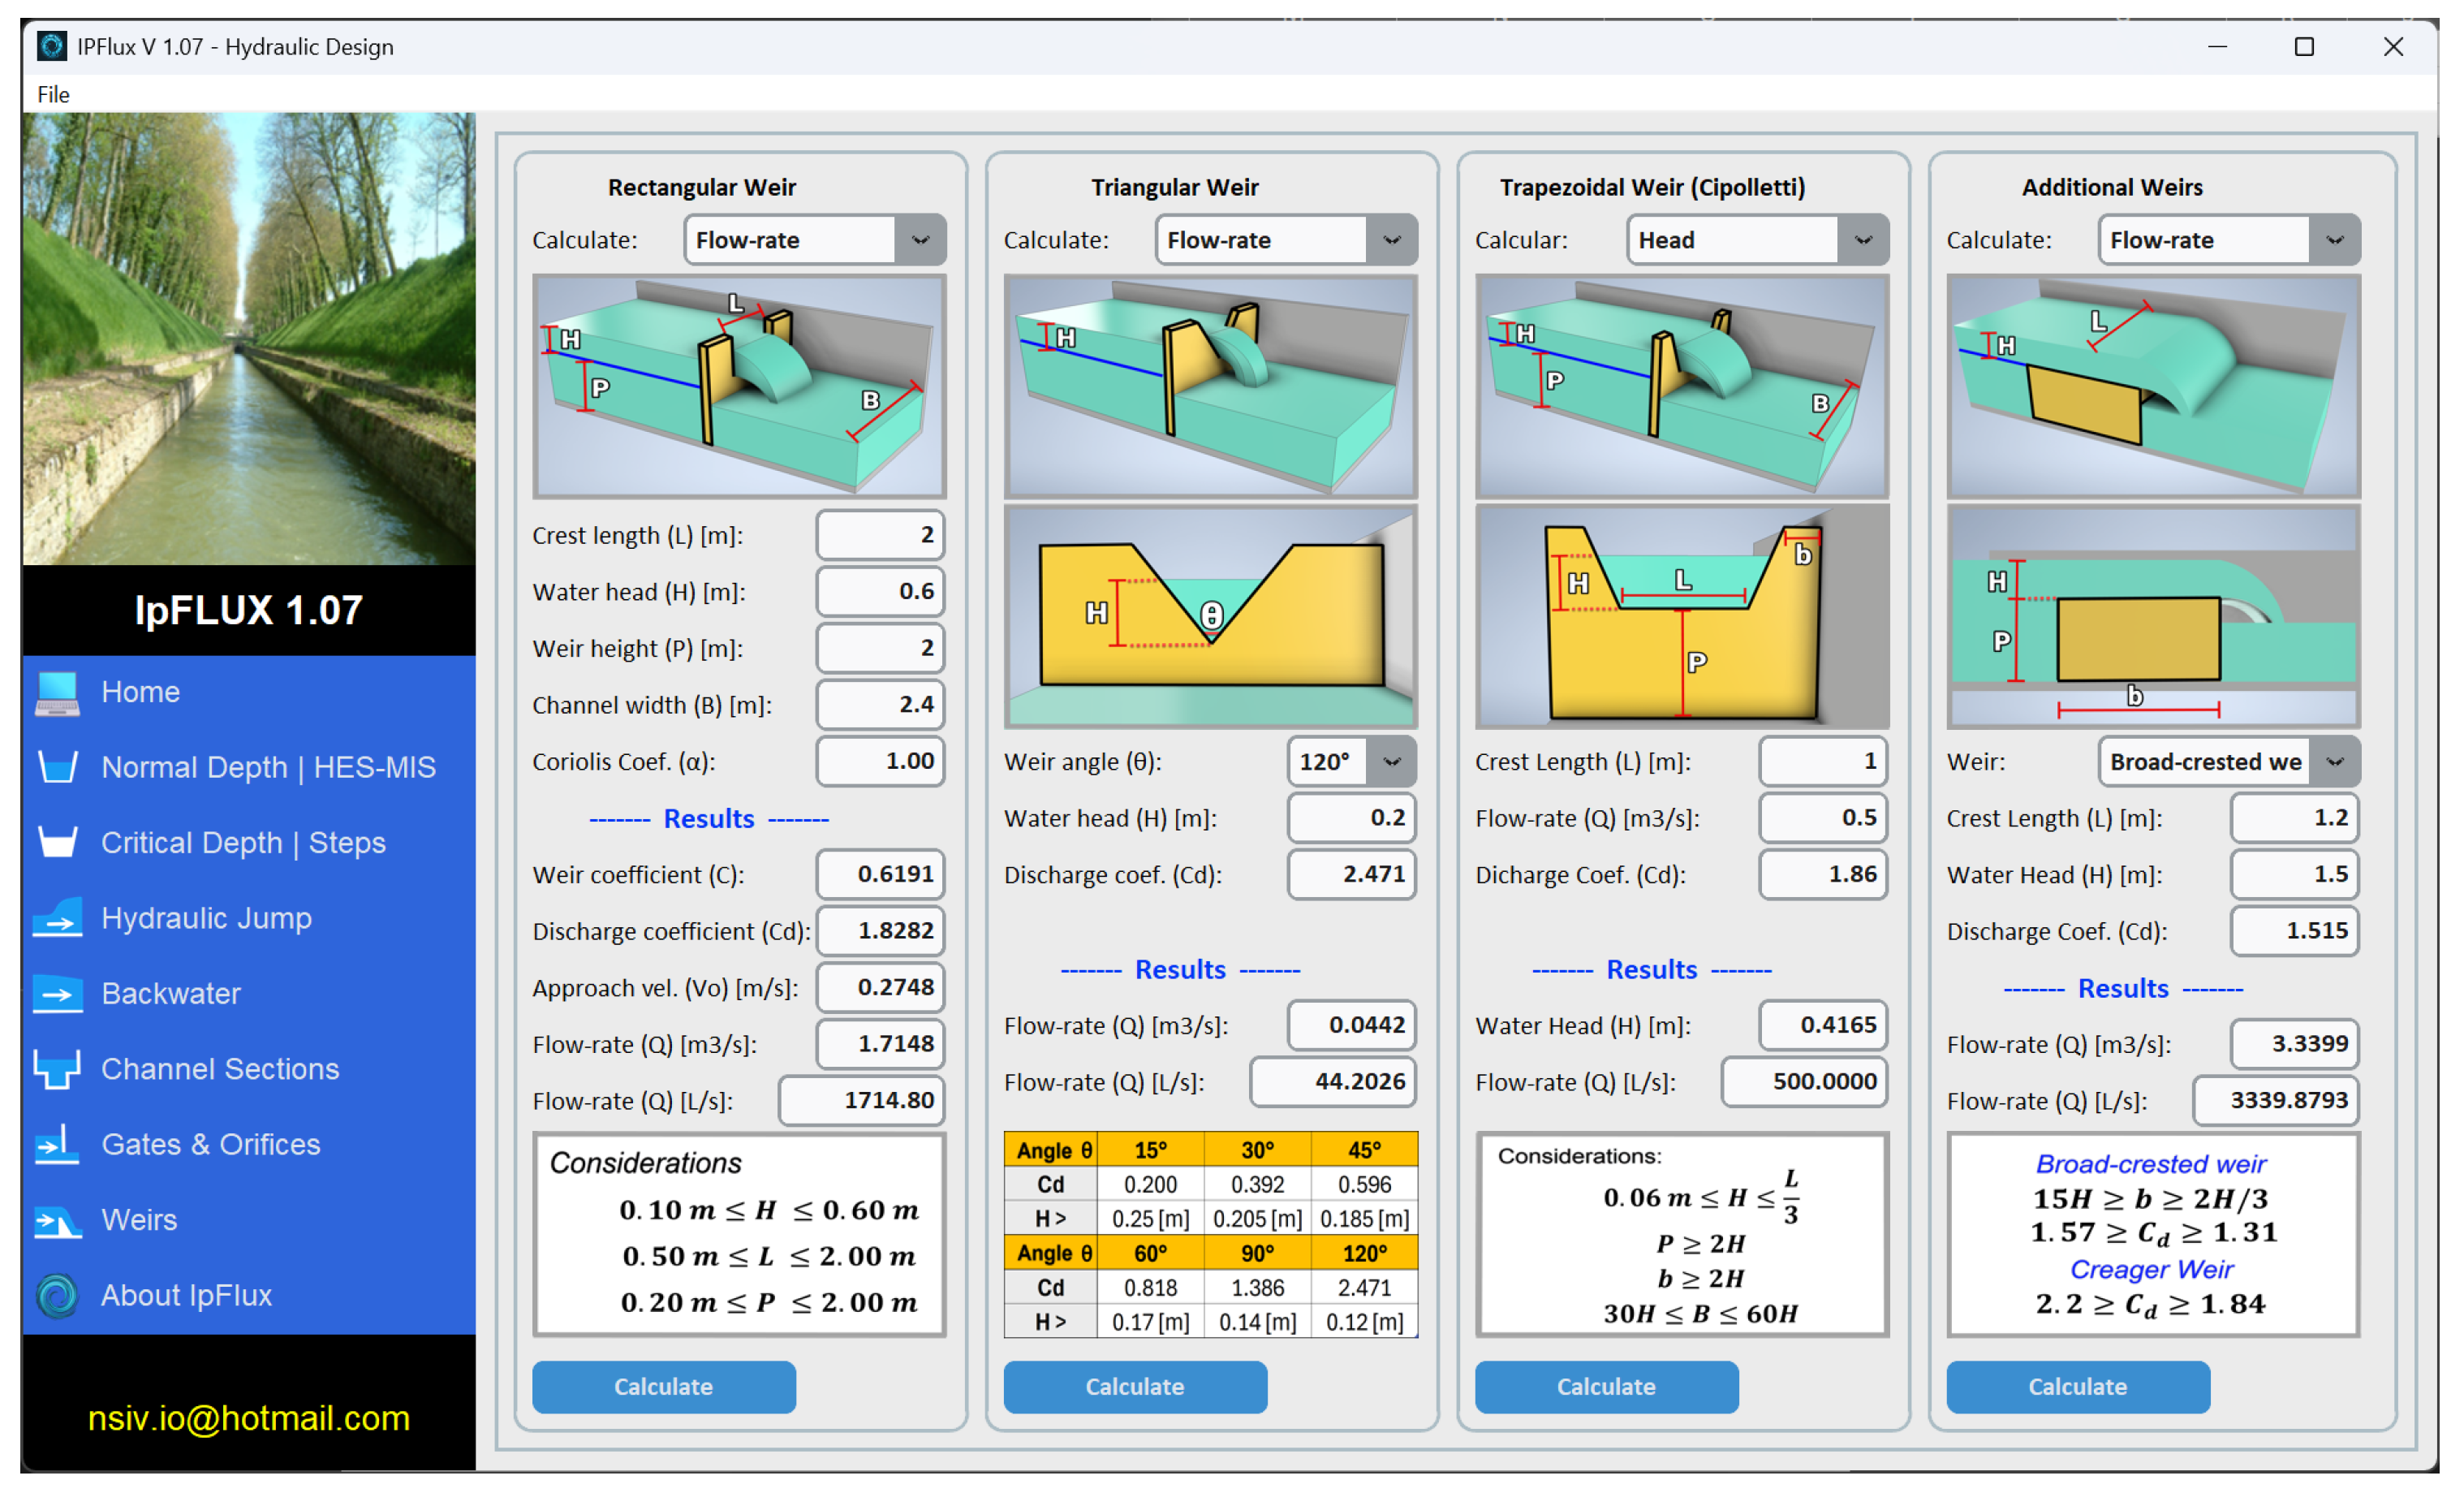
A dedicated module for weir analysis is included, supporting various weir types such as rectangular, triangular, trapezoidal, broad-crested, and Creager-type weirs [
12]. The module provides visual outputs to support the analysis. Users can choose between specifying the flow rate or the water head to obtain the weir coefficient, discharge coefficient, and the corresponding flow rate or head, depending on the selected variable. For rectangular weirs, an approximation of the approach velocity is also computed.
Figure 8 displays the weir calculation interface and the available modeling options.
The weir module incorporates various weir geometries, including rectangular, trapezoidal, triangular, broad-crested, and rounded shapes, among others.
Table 9 presents the input and output parameters of this module.
These integrated interfaces provide an intuitive design environment that facilitates quick comprehension and analysis.
4. Software Verification
To evaluate the accuracy and effectiveness of IpFlux, a series of test cases were conducted based on [
1], as well as on results obtained from other software tools and experimental data.
These test cases were selected due to their wide acceptance and reproducibility in open-channel hydraulics. Ven Te Chow’s analytical cases (1959) are frequently referenced in the academic and technical literature, providing reliable benchmarks for classical flow conditions such as gradually varied flow. Additionally, ANSYS Fluent (2024 R2) was used for hydraulic jump simulations due to its recognized precision in modeling complex flow dynamics using CFD.
Direct comparison between IpFlux and commercial software is challenging due to significant differences in simulation processes, including geometry creation, result generation, and processing time. However, in terms of data entry, IpFlux stands out for its simplicity, allowing users to input information within seconds—similar to HCanales—while other software require more extensive and complex procedures. Once the data are entered, IpFlux demonstrates substantially faster performance than the evaluated commercial tools, highlighting its computational efficiency.
Moreover, the intuitive interface of IpFlux, specifically designed for hydraulic applications, significantly reduces the learning curve, making it easier to use than commercial software that often requires advanced configuration and simulation expertise. While the latter are powerful and highly specialized tools, IpFlux is geared toward quick and effective calculations, making it an ideal choice for the preliminary assessment of flow behavior and hydraulic structures in engineering projects.
4.1. Normal Flow Calculations
To validate normal flow calculations, two test cases involving uniform flow conditions from [
1] were analyzed. In both cases, Manning’s roughness coefficient, channel side slope, channel width, and
z values are provided. In the first case, the channel discharge is computed based on a given normal depth, while in the second case, the normal depth is determined from a known channel discharge. The specific values of the variables are presented in
Table 13.
Table 14 presents the discharge values obtained with IpFlux, compared to those from HEC-RAS [
5], HCanales [
9], and the theoretical values reported by [
1]. The results obtained with IpFlux closely match the reference values, confirming the accuracy of the hydraulic calculations.
The results presented in
Table 14 indicate that IpFlux computes the normal depth with a maximum relative error close to 1% when compared to the analytical benchmark provided by Ven Te Chow. This low deviation supports the accuracy of IpFlux for uniform flow calculations. Moreover, all validation sections in the manuscript include quantitative comparisons—whether analytical, experimental, or numerical—providing a consistent framework for discrepancy analysis. These assessments help identify both the strengths and potential limitations of the software under varying conditions.
In both cases, the values obtained from all four software tools closely match the reference data, demonstrating that IpFlux accurately reproduces depth calculations under normal flow conditions. Overall, the consistency of results confirms that IpFlux, like the other tools, is capable of accurately computing open-channel flows.
Regarding the computation of slope, HEC-RAS [
5] does not calculate this variable directly, as it requires specific geometric input configurations. In contrast, IpFlux computes the slope automatically, offering a more user-friendly approach for preliminary analyses.
From a user interface perspective, IpFlux provides greater operational efficiency by allowing quick variable adjustments through a drop-down menu, whereas HCanales [
9] requires opening multiple windows, which may be less convenient for extensive calculations.
4.2. Hydraulic Jump Calculations
This section compares the conjugate depths computed by IpFlux for hydraulic jumps with experimental and numerical simulation data from [
20], focusing on a channel with a broad-crested weir. The referenced study included laboratory experiments conducted in a flume, along with numerical simulations using ANSYS Fluent [
4], which implemented the standard
k–
turbulence model and the Volume of Fluid (VOF) method to simulate the air–water interface.
IpFlux was used to compute the higher conjugate depth from the lower one, using the parameters reported in [
20], including the upstream depth (
m) and discharge conditions summarized in
Table 15.
The computed subcritical flow depth was then compared with the experimental and CFD results from the reference study. The results obtained with IpFlux showed a high level of agreement with both experimental measurements and numerical simulations for the conjugate depths.
Table 16 presents a comparison of the upstream and downstream conjugate depths across the hydraulic jump, as computed by IpFlux, measured experimentally, and simulated using CFD.
Both numerical predictions fall within the same order of magnitude as the experimental precision, approximately one millimeter. Although ANSYS Fluent is not typically used in practical applications for estimating hydraulic jumps due to its high computational cost, it serves as a high-fidelity reference for validation purposes. IpFlux computes a conjugate depth that overestimates the experimental value by 3.4%, closely matching the 3.6% deviation obtained with ANSYS Fluent. This close agreement confirms that IpFlux is capable of accurately reproducing the supercritical flow depth using a significantly simpler and more computationally efficient model.
4.3. Backwater Calculation via Graphical Integration
Backwater calculation using graphical integration enables the determination of free surface profiles in open channels under gradually varied flow conditions. This analysis is essential for the design of safe and efficient hydraulic infrastructure. The equation applied is based on the gradually varied flow model described in [
14].
A comparative analysis was conducted using data from [
1], with the initial conditions summarized in
Table 17.
Table 18 presents the comparison of results between Ven Te Chow’s data and IpFlux.
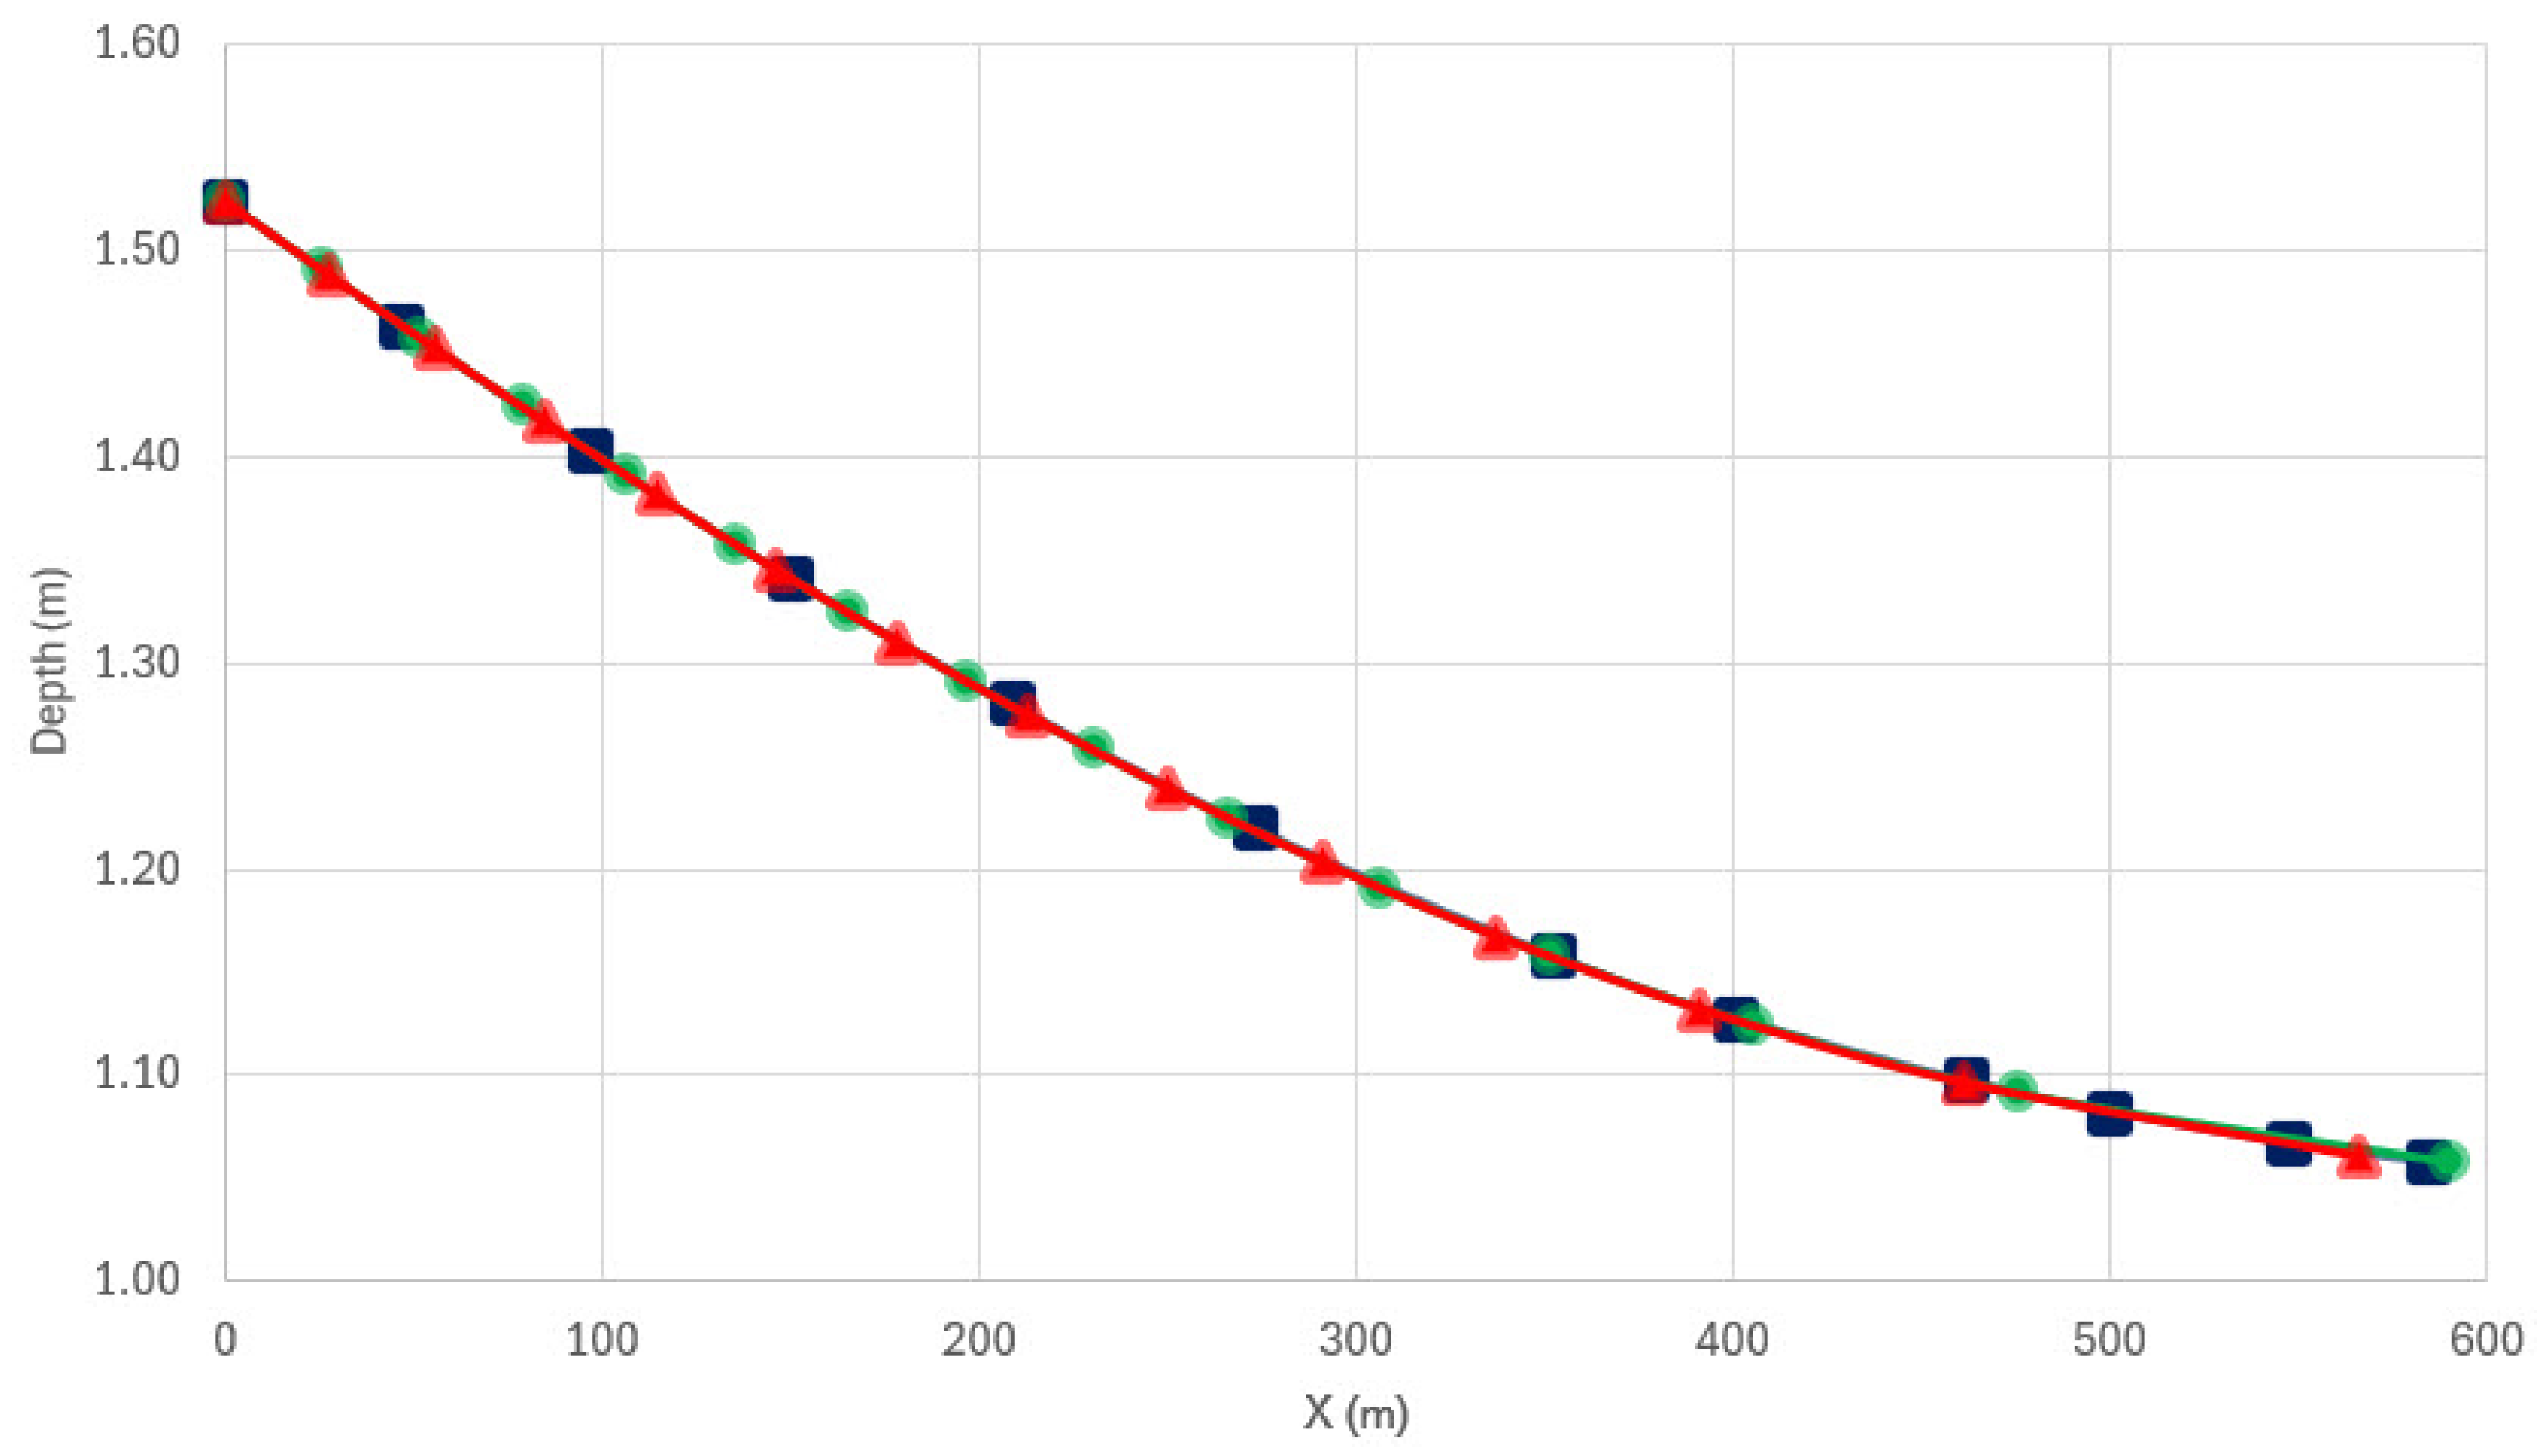
Figure 9 shows a graphical comparison of the backwater profiles obtained by both software tools. The curves demonstrate a very close match between the values calculated by IpFlux and the tabulated data from [
1].
The curves representing both numerical results are very close, confirming the accuracy of the software. Additionally, IpFlux enables the generation of a greater number of intermediate points, producing a detailed and continuous free surface profile that enhances comparison with tabulated data.
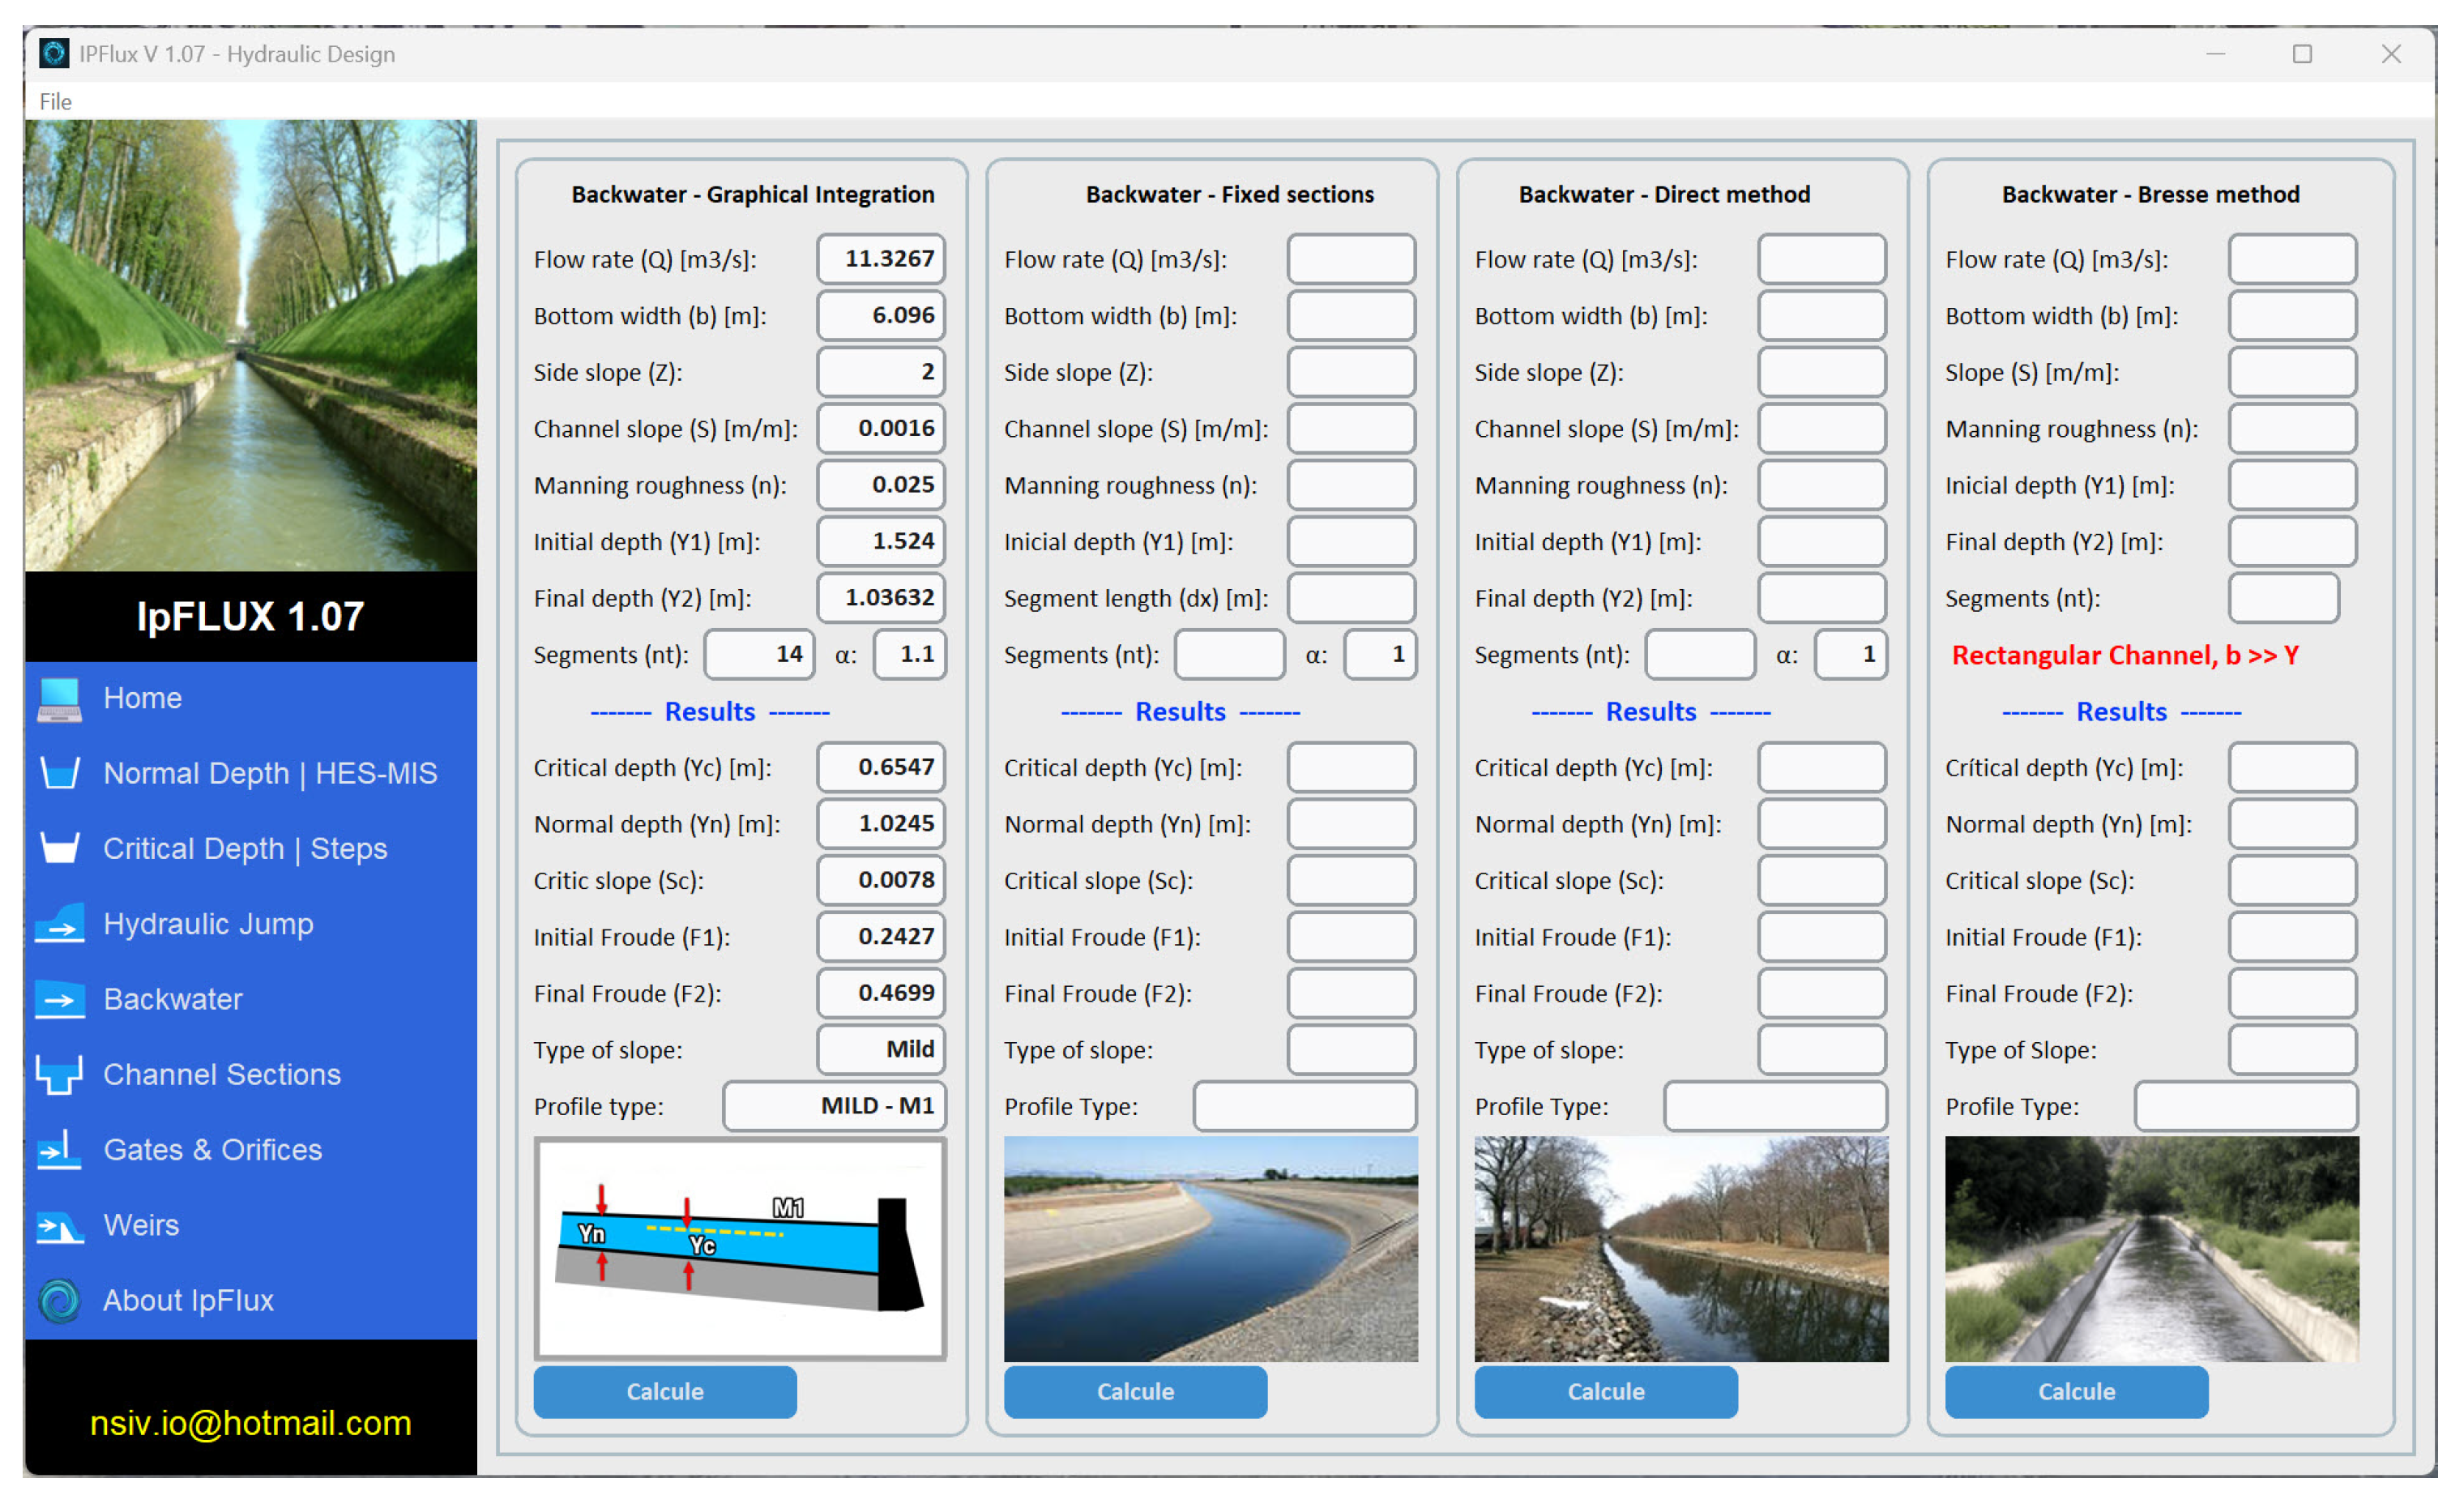
Figure 10 displays the hydraulic design windows, showing both the input parameters and output results for the analyzed case, as well as for two additional options: the Fixed Section Method and the Direct Method.
4.4. Analysis of Compound Sections
To test the method used to compute hydraulic parameters for compound sections, test cases based on the experimental analysis by [
21] were employed, as shown in
Figure 11.
The analyzed compound sections consist of a main channel with a Manning roughness of 0.014, bordered by floodplains on both sides with a Manning roughness of 0.013. This configuration is used to assess flow behavior under flooding conditions. The geometries considered are detailed in
Table 19.
Both configurations feature vertical or inclined slopes in the main channel, with vertical slopes on the floodplains. The channel’s longitudinal slope is 0.003 m/m.
To assess the performance of IpFlux in predicting flow rates, a comparison was conducted using laboratory data obtained with an ultrasonic flowmeter. The flow rates simulated by IpFlux were directly compared with those derived using the Single Channel Method applied to the experimental data [
21]. The results are presented in
Table 20.
Overall, the flow rates simulated by IpFlux closely match the experimental values, with differences below 6% in all studied cases. These results demonstrate that IpFlux can accurately compute flow rates in compound channels, showing low relative discrepancies compared to experimental data. Notably, the results remained consistent across both evaluated geometries, highlighting the tool’s robustness for various compound channel configurations.
To further explore the practical implementation of IpFlux and benchmark its computational performance, a comparative case study was conducted using a compound channel configuration with known geometric and hydraulic properties. Cross-section 1, shown in
Figure 11, features two roughness values:
for the lateral concrete sections and
for the central main channel. In this scenario, water depths were imposed along the cross-section, and IpFlux was used to compute the corresponding discharge. This discharge was then used as an upstream boundary condition in HEC-RAS, which computed the resulting flow depths and mean velocities under steady-state conditions. The results are presented in
Table 21.
Despite HEC-RAS requiring more time for model setup—including geometry creation and boundary condition configuration—the resulting flow depths closely matched those initially specified in IpFlux. The differences between the two programs were less than one significant figure for velocities and below 0.4% for depths, confirming the consistency and accuracy of IpFlux’s discharge predictions. Moreover, the modeling process in IpFlux proved to be significantly faster and more straightforward, emphasizing its efficiency as a lightweight yet robust tool for hydraulic simulation.
4.5. Additional Comments About of Potential Use of IpFlux in Engineering Practice and Education
IpFlux provides significant benefits in both engineering practice and education, particularly in contexts where accessibility, speed, and technical versatility are essential. As a free tool, it removes financial barriers, making it a viable option for engineering firms seeking cost-effective solutions during preliminary design phases. Its intuitive interface and low learning curve allow for rapid integration into professional workflows, enabling fast hydraulic assessments and early-stage decision-making with minimal resource investment. In the educational context, IpFlux fosters hands-on learning by allowing students to explore complex open-channel flow phenomena without the limitations of commercial software. This promotes deeper conceptual understanding and practical engagement, positioning the tool as a valuable asset for both academic instruction and real-world design processes (see
Table 22).
Moreover, IpFlux has demonstrated practical value in both professional and academic settings. In the private sector, it has been used by the consulting firm CFD Perú to support the preliminary design of hydraulic structures, providing fast, geometry-sensitive results in contexts where efficiency and flexibility are essential. In academia, IpFlux is currently being employed as a teaching aid in practical sessions within the Civil Engineering program at the Universidad Peruana de Ciencias Aplicadas (UPC). Although it is not yet formally integrated into the curriculum, its use in classroom activities allows students to engage with open-channel flow concepts through accessible, hands-on simulations—reinforcing its value as a complementary tool in engineering education.
5. Conclusions
The development of IpFlux represents a significant advancement in the design and analysis of open-channel flow systems, providing a reliable, accurate, and accessible tool for hydraulic studies. Its modular architecture ensures intuitive navigation, enabling efficient calculations ranging from critical depth determination to backwater curve analysis. The software has demonstrated robust performance across various geometric configurations—including trapezoidal, compound, and sloped sections—adapting effectively to diverse hydraulic conditions.
Validation tests confirmed IpFlux’s reliability, with discrepancies between simulated, experimental, and theoretical results remaining below 6%. These outcomes highlight its accuracy and applicability in hydraulic engineering. While the current version of IpFlux includes Excel export functionality exclusively for the backwater module, future updates will extend this feature to all hydraulic modules to enhance usability and integration with engineering workflows. This capability will allow users to seamlessly analyze and archive simulation outputs in widely compatible spreadsheet formats.
Building upon IpFlux’s modular architecture, a new software tool is being considered for the hydraulic design of structures such as chutes and drops. This future application would use simulation results from IpFlux—such as normal and critical depths, water surface profiles, and energy grade lines—as initial boundary conditions to automate structure dimensioning processes.
IpFlux stands out as a cost-free alternative to commercial hydraulic software, promoting broader accessibility in both academic and professional environments. Its user-friendly design and adaptability make it a valuable tool for preliminary-stage hydraulic projects and infrastructure optimization. These findings underscore its potential as a key resource in river engineering, sewer system design, and open-channel hydraulics education.
Additionally, IpFlux can support the design and analysis of energy-related water systems, such as hydropower channels, energy recovery in irrigation networks, and spillways in dam infrastructure. This broadens its applicability beyond conventional hydraulics, positioning it as a strategic tool in sustainable energy planning and water–energy nexus applications. IpFlux excels as an efficient tool for quickly obtaining a preliminary overview of a project and generating cost estimates that closely approximate final values. Its simplicity, speed, and hydraulic-specific features make it particularly advantageous during early-stage evaluations, educational use, and contexts where rapid assessments are critical.
Despite its advantages, IpFlux has certain limitations. It is not intended for the simulation of highly turbulent flows or vortex formation, as its scope is limited to steady and gradually varied open-channel conditions. Additionally, some modules do not yet support result export to Excel. Future developments will address these limitations by incorporating modules for complex hydraulic structures—such as chutes and siphons—and expanding Excel export functionality across all modules. These enhancements aim to further increase the tool’s applicability and usability in professional practice.
In summary, IpFlux emerges as a reliable and computationally efficient tool for the hydraulic analysis of open-channel flows. Its ability to deliver accurate results across a range of channel geometries—while maintaining ease of use and accessibility—positions it as a valuable asset for both early-stage design and engineering education. The software’s modular design and ongoing development roadmap offer promising opportunities for integration with more complex hydraulic structures and energy-related systems. As a cost-free platform, IpFlux not only democratizes access to hydraulic simulation tools but also fosters innovation in the modeling and design of sustainable water infrastructure.
