
Data Mining to Evaluate the Effect of Eichhornia crassipes and Lemna minor in the Phytoremediation of Wastewater in the Canton of Milagro

 , , , and
Abstract
:1. Introduction
2. Materials and Methods
2.1. Study Area
2.2. Selected Species
2.3. Sample Collection
2.4. Experimental Design
2.4.1. Physicochemical Parameters Evaluated
- -
- pH and temperature
- -
- Electrical conductivity and salinity
- -
- Total dissolved solids (TDSs)
- -
- Biochemical oxygen demand (BOD)
- -
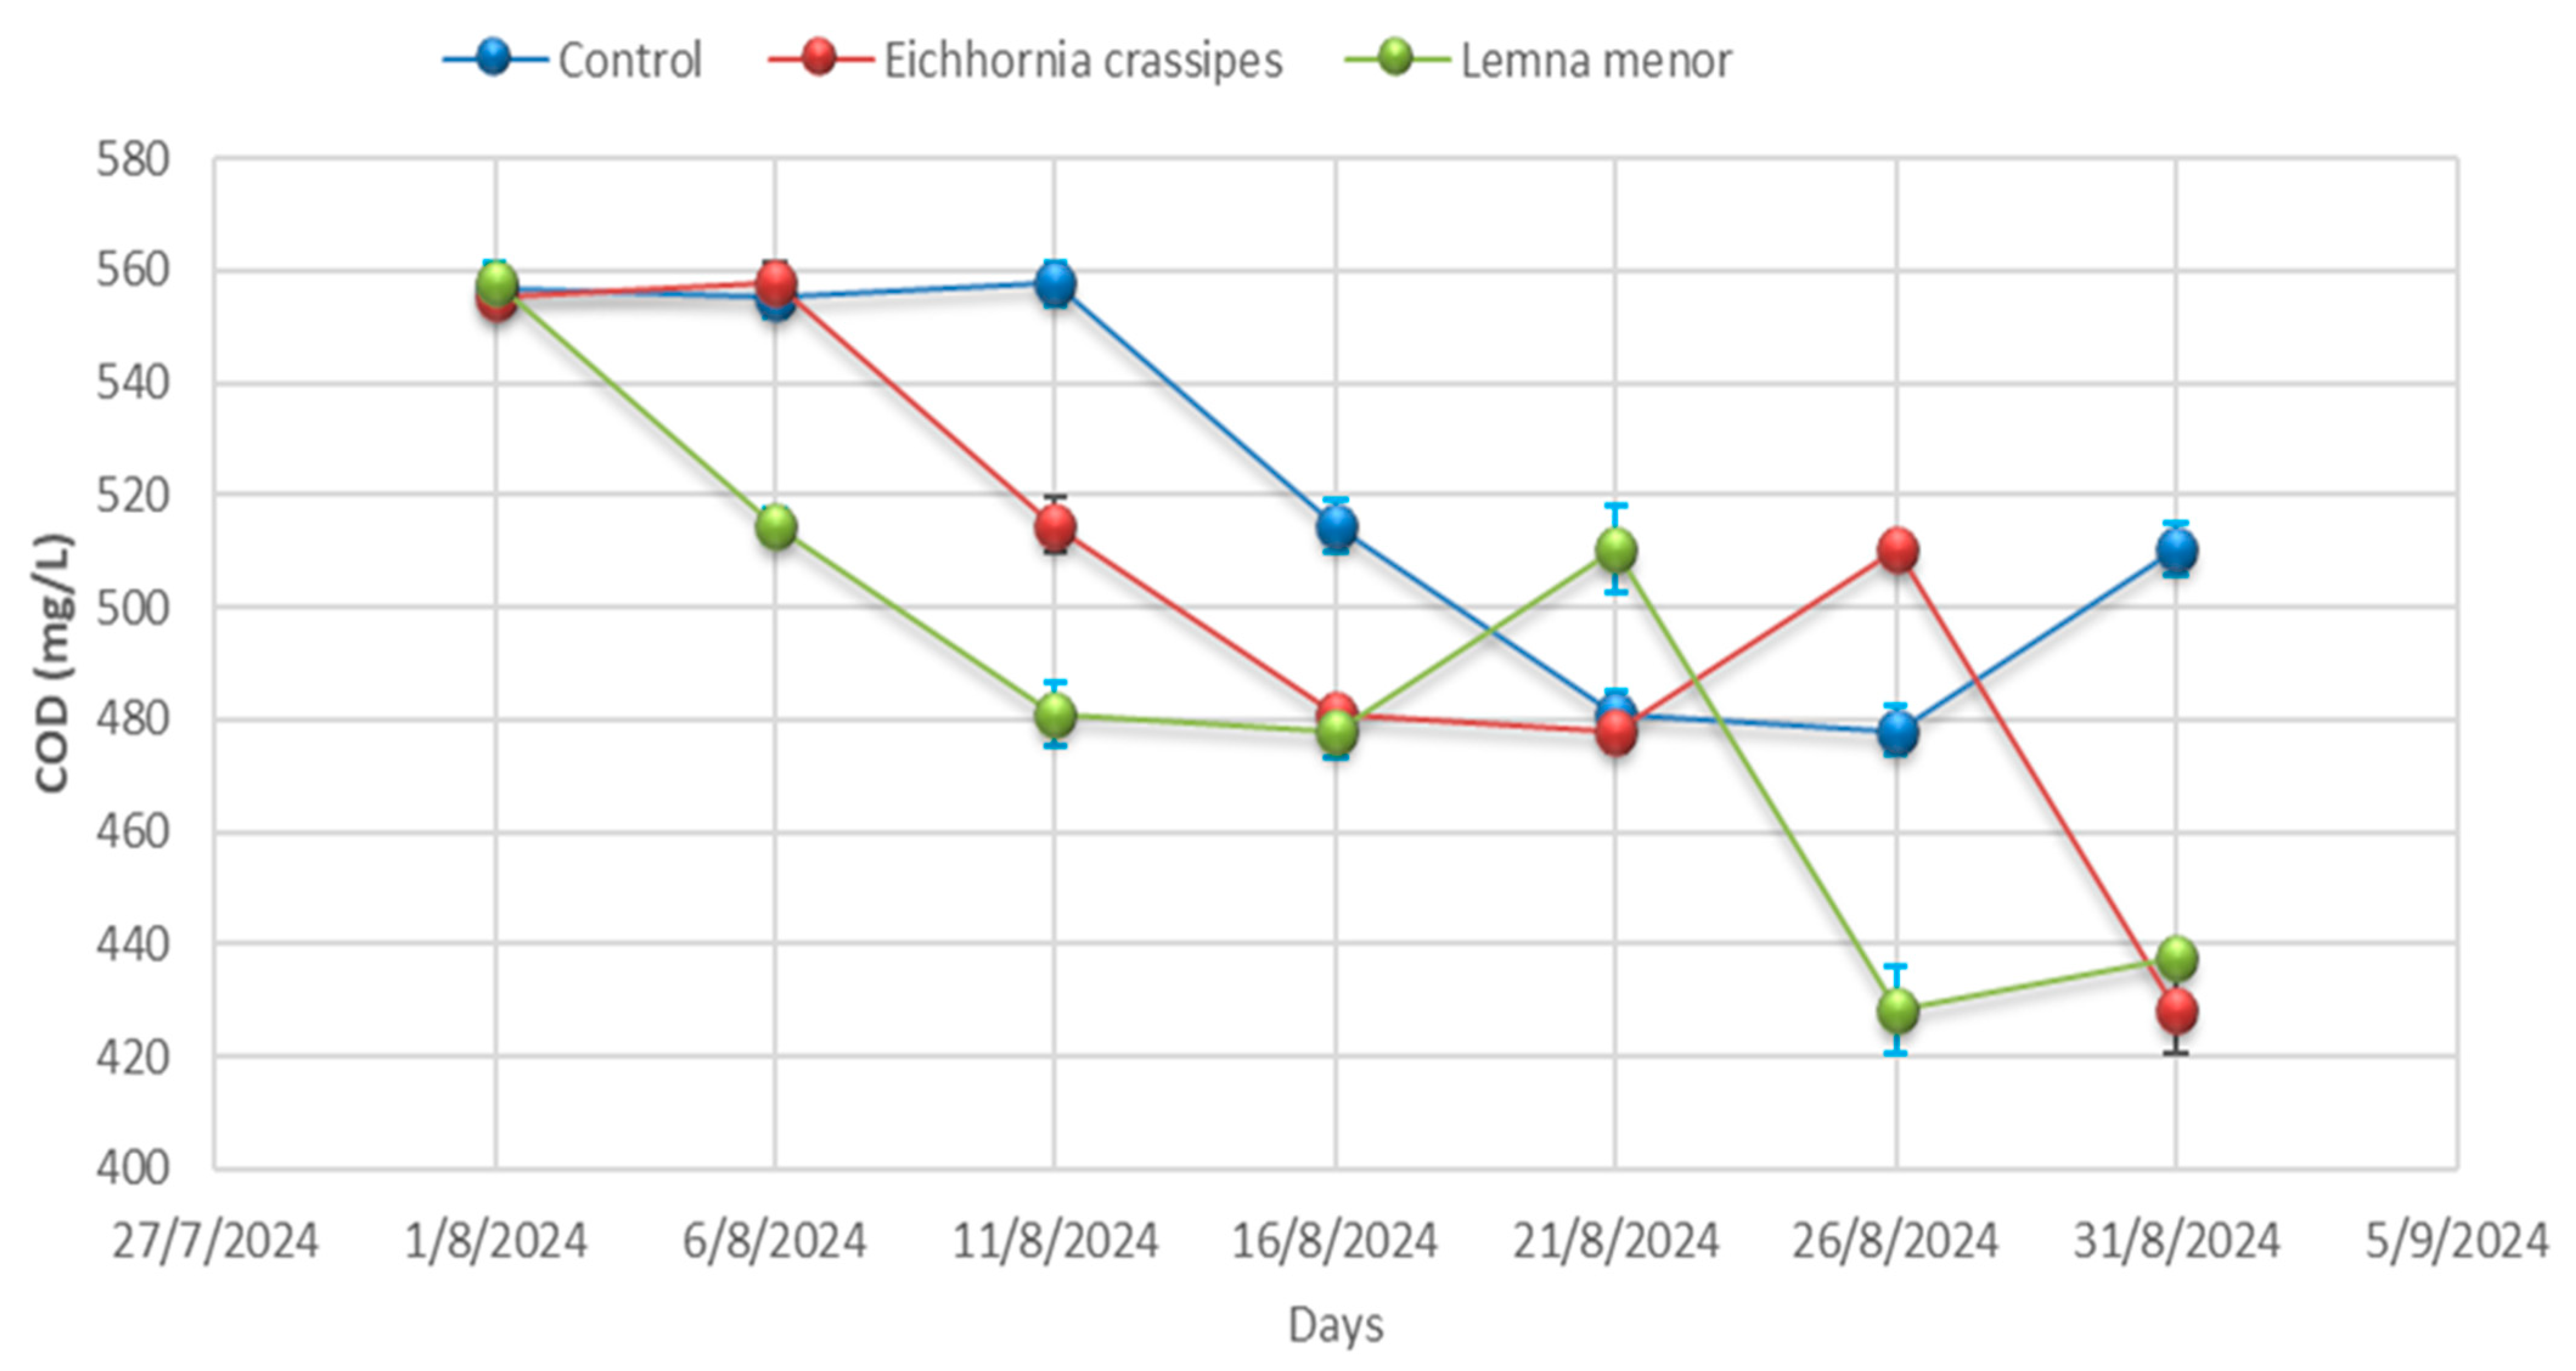
- Chemical oxygen demand (COD)
- -
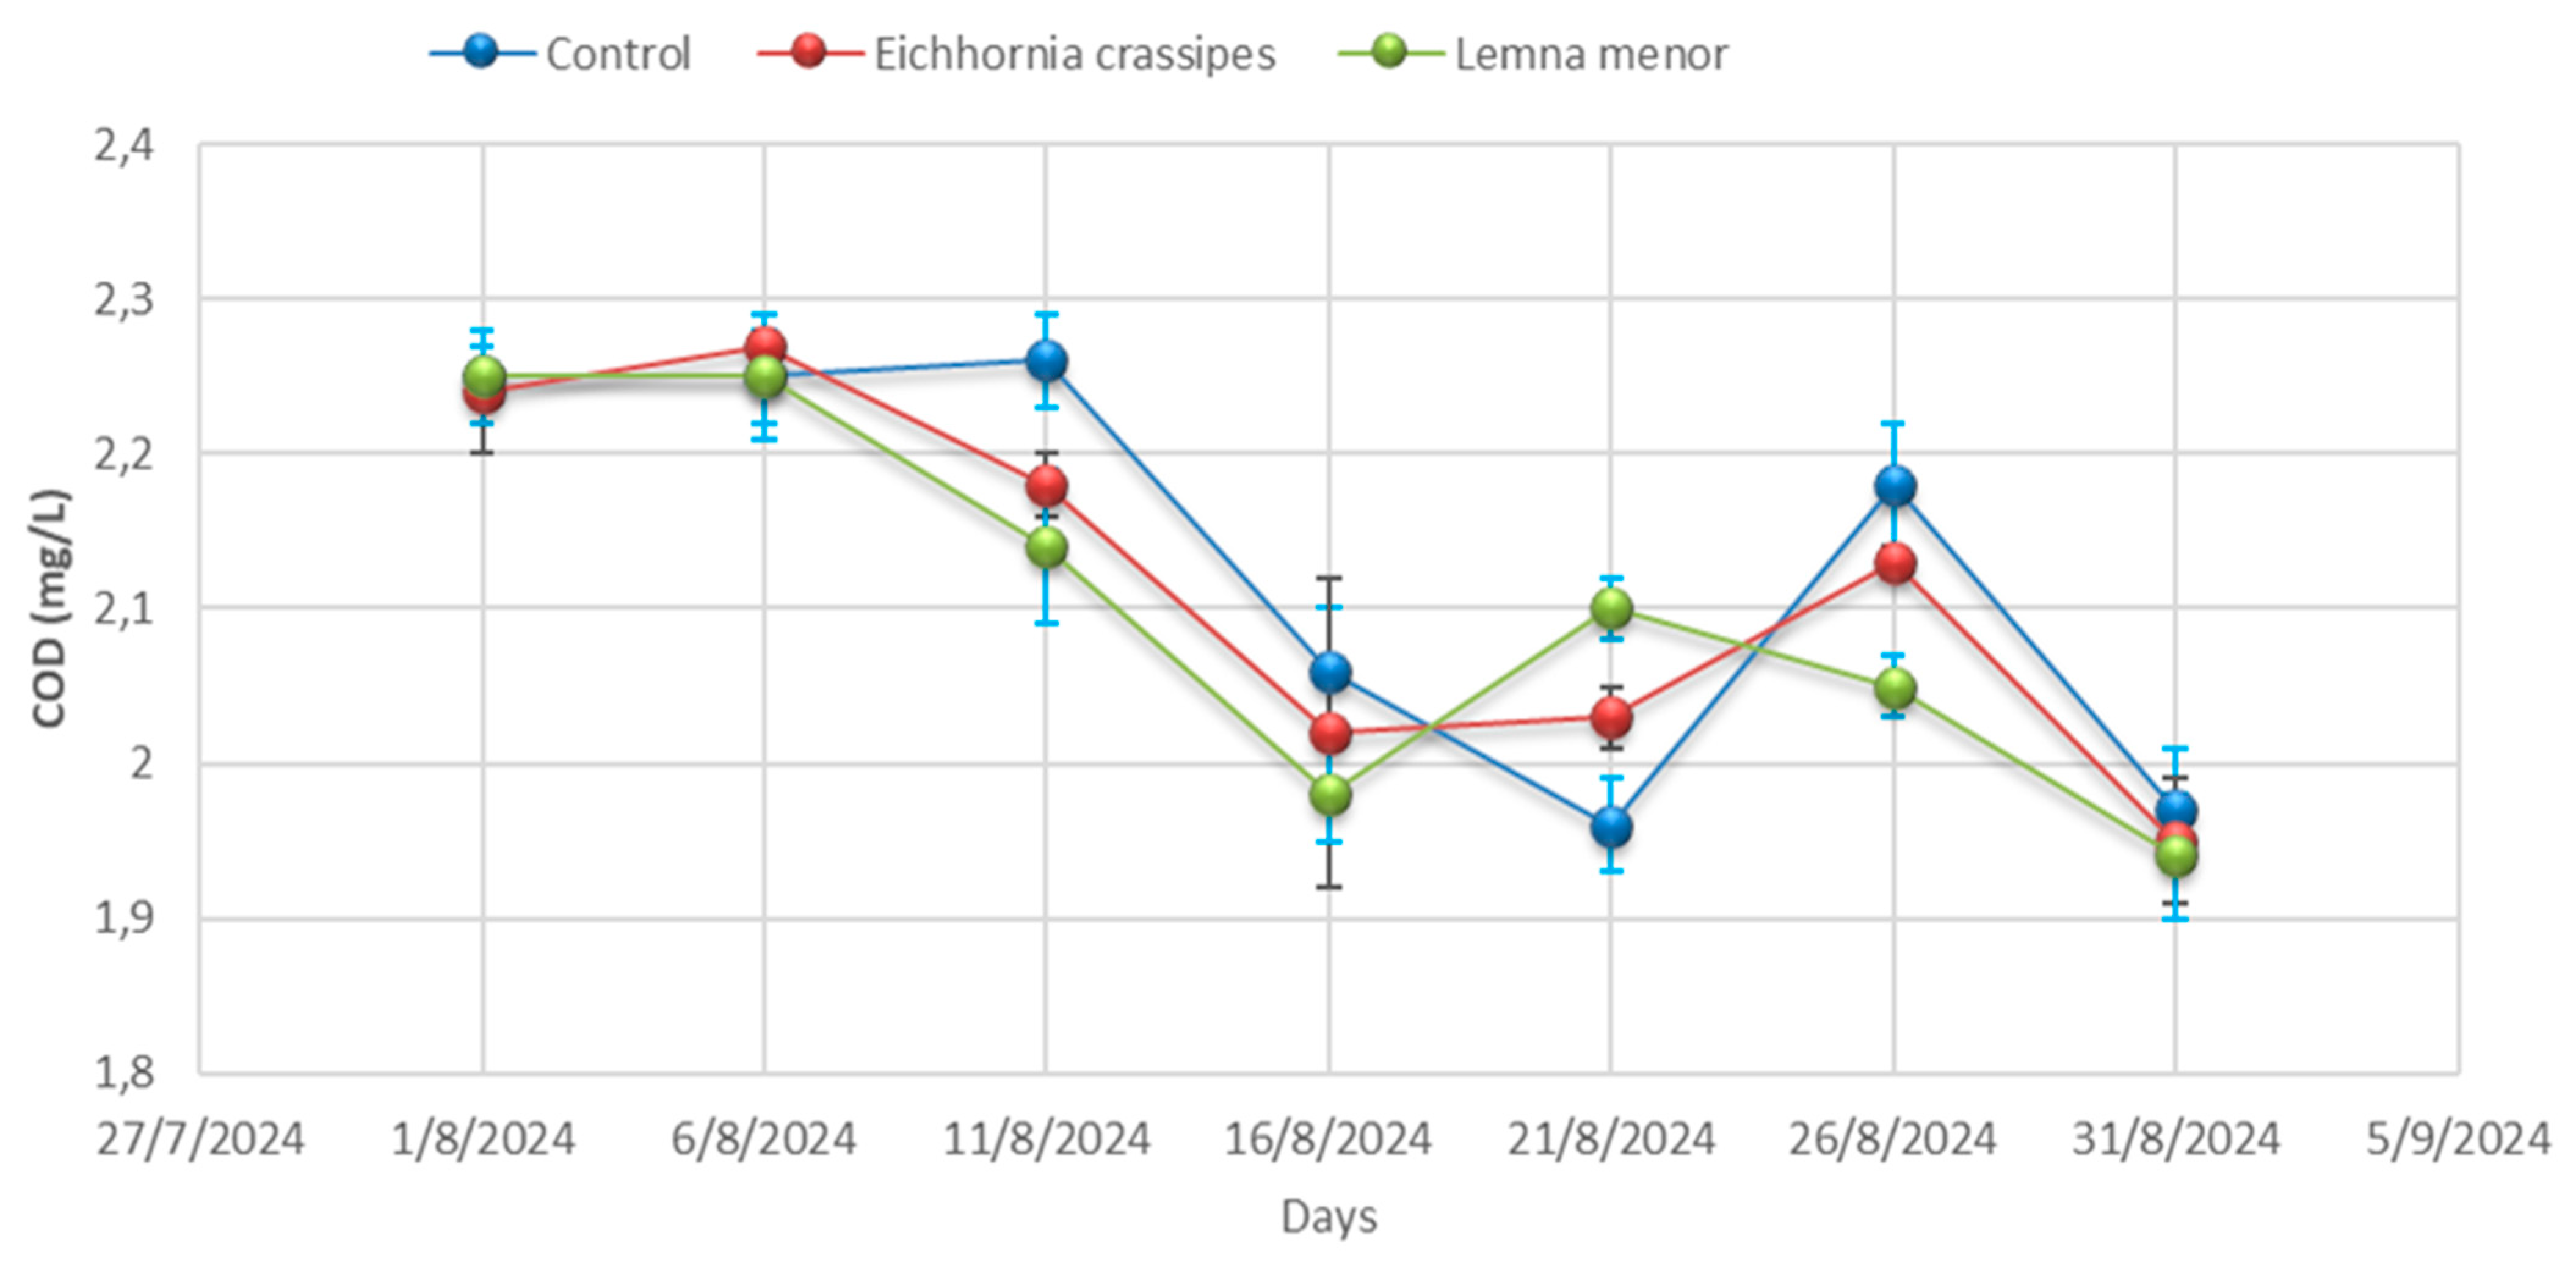
- Dissolved oxygen (DO)
- -
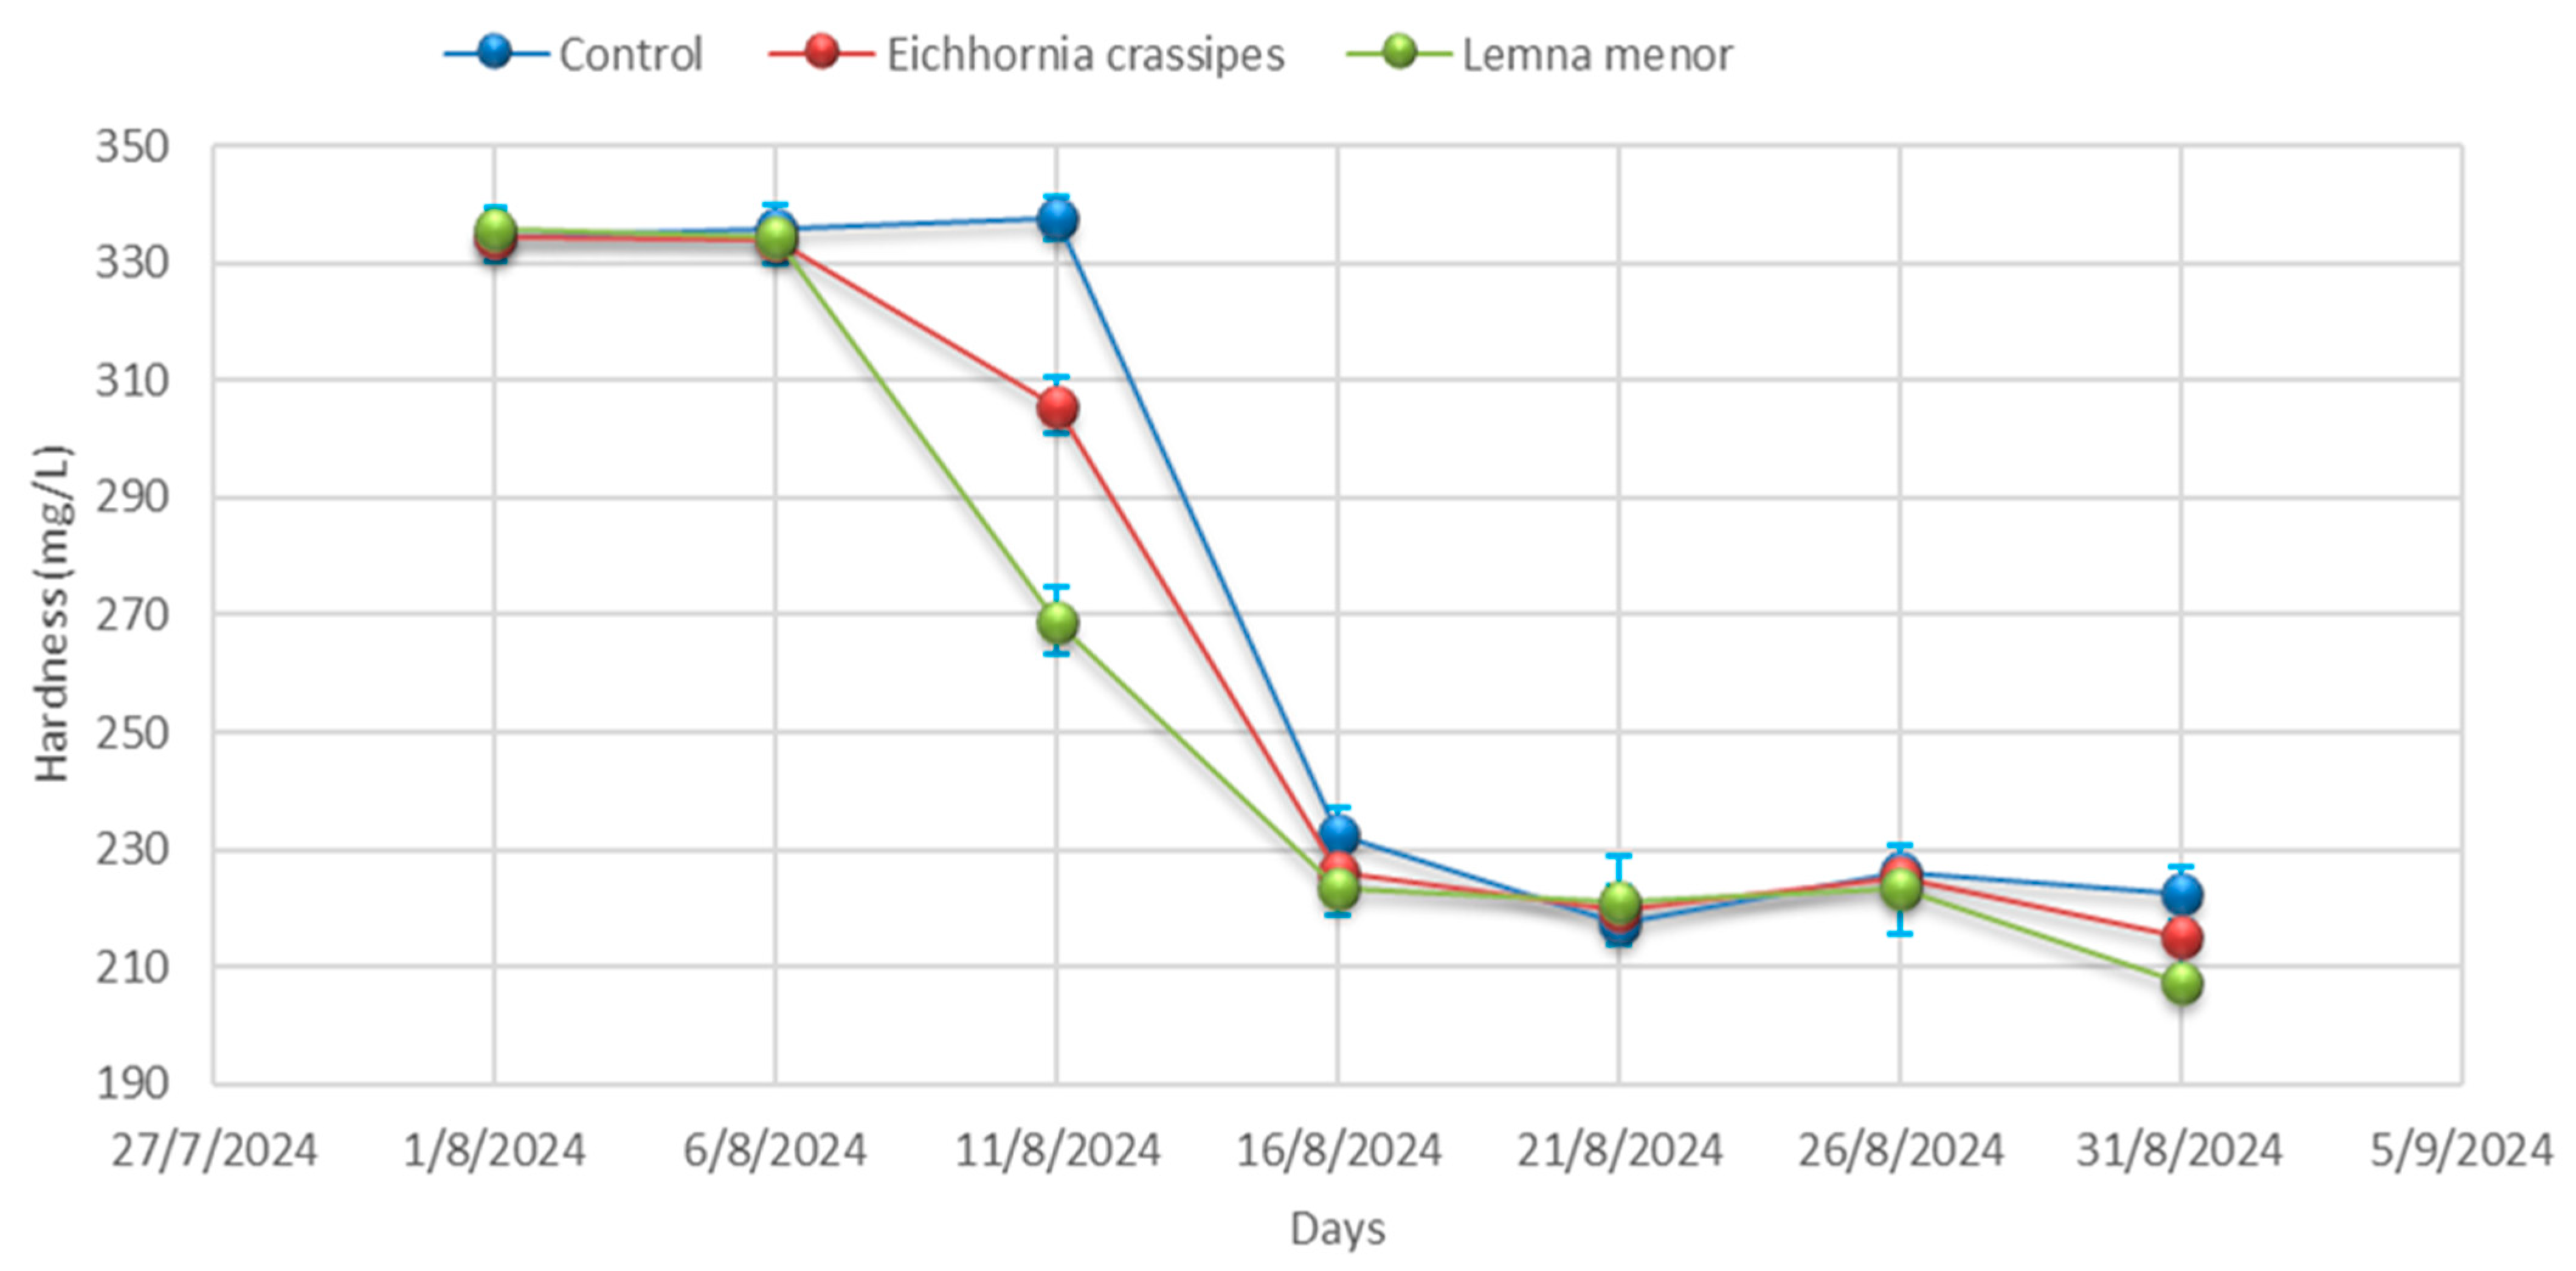
- Total hardness
2.4.2. Microbiological Parameters Evaluated
2.5. Statistical Analysis
2.5.1. Biplot Graph
2.5.2. Descriptive Statistics
3. Results and Discussion
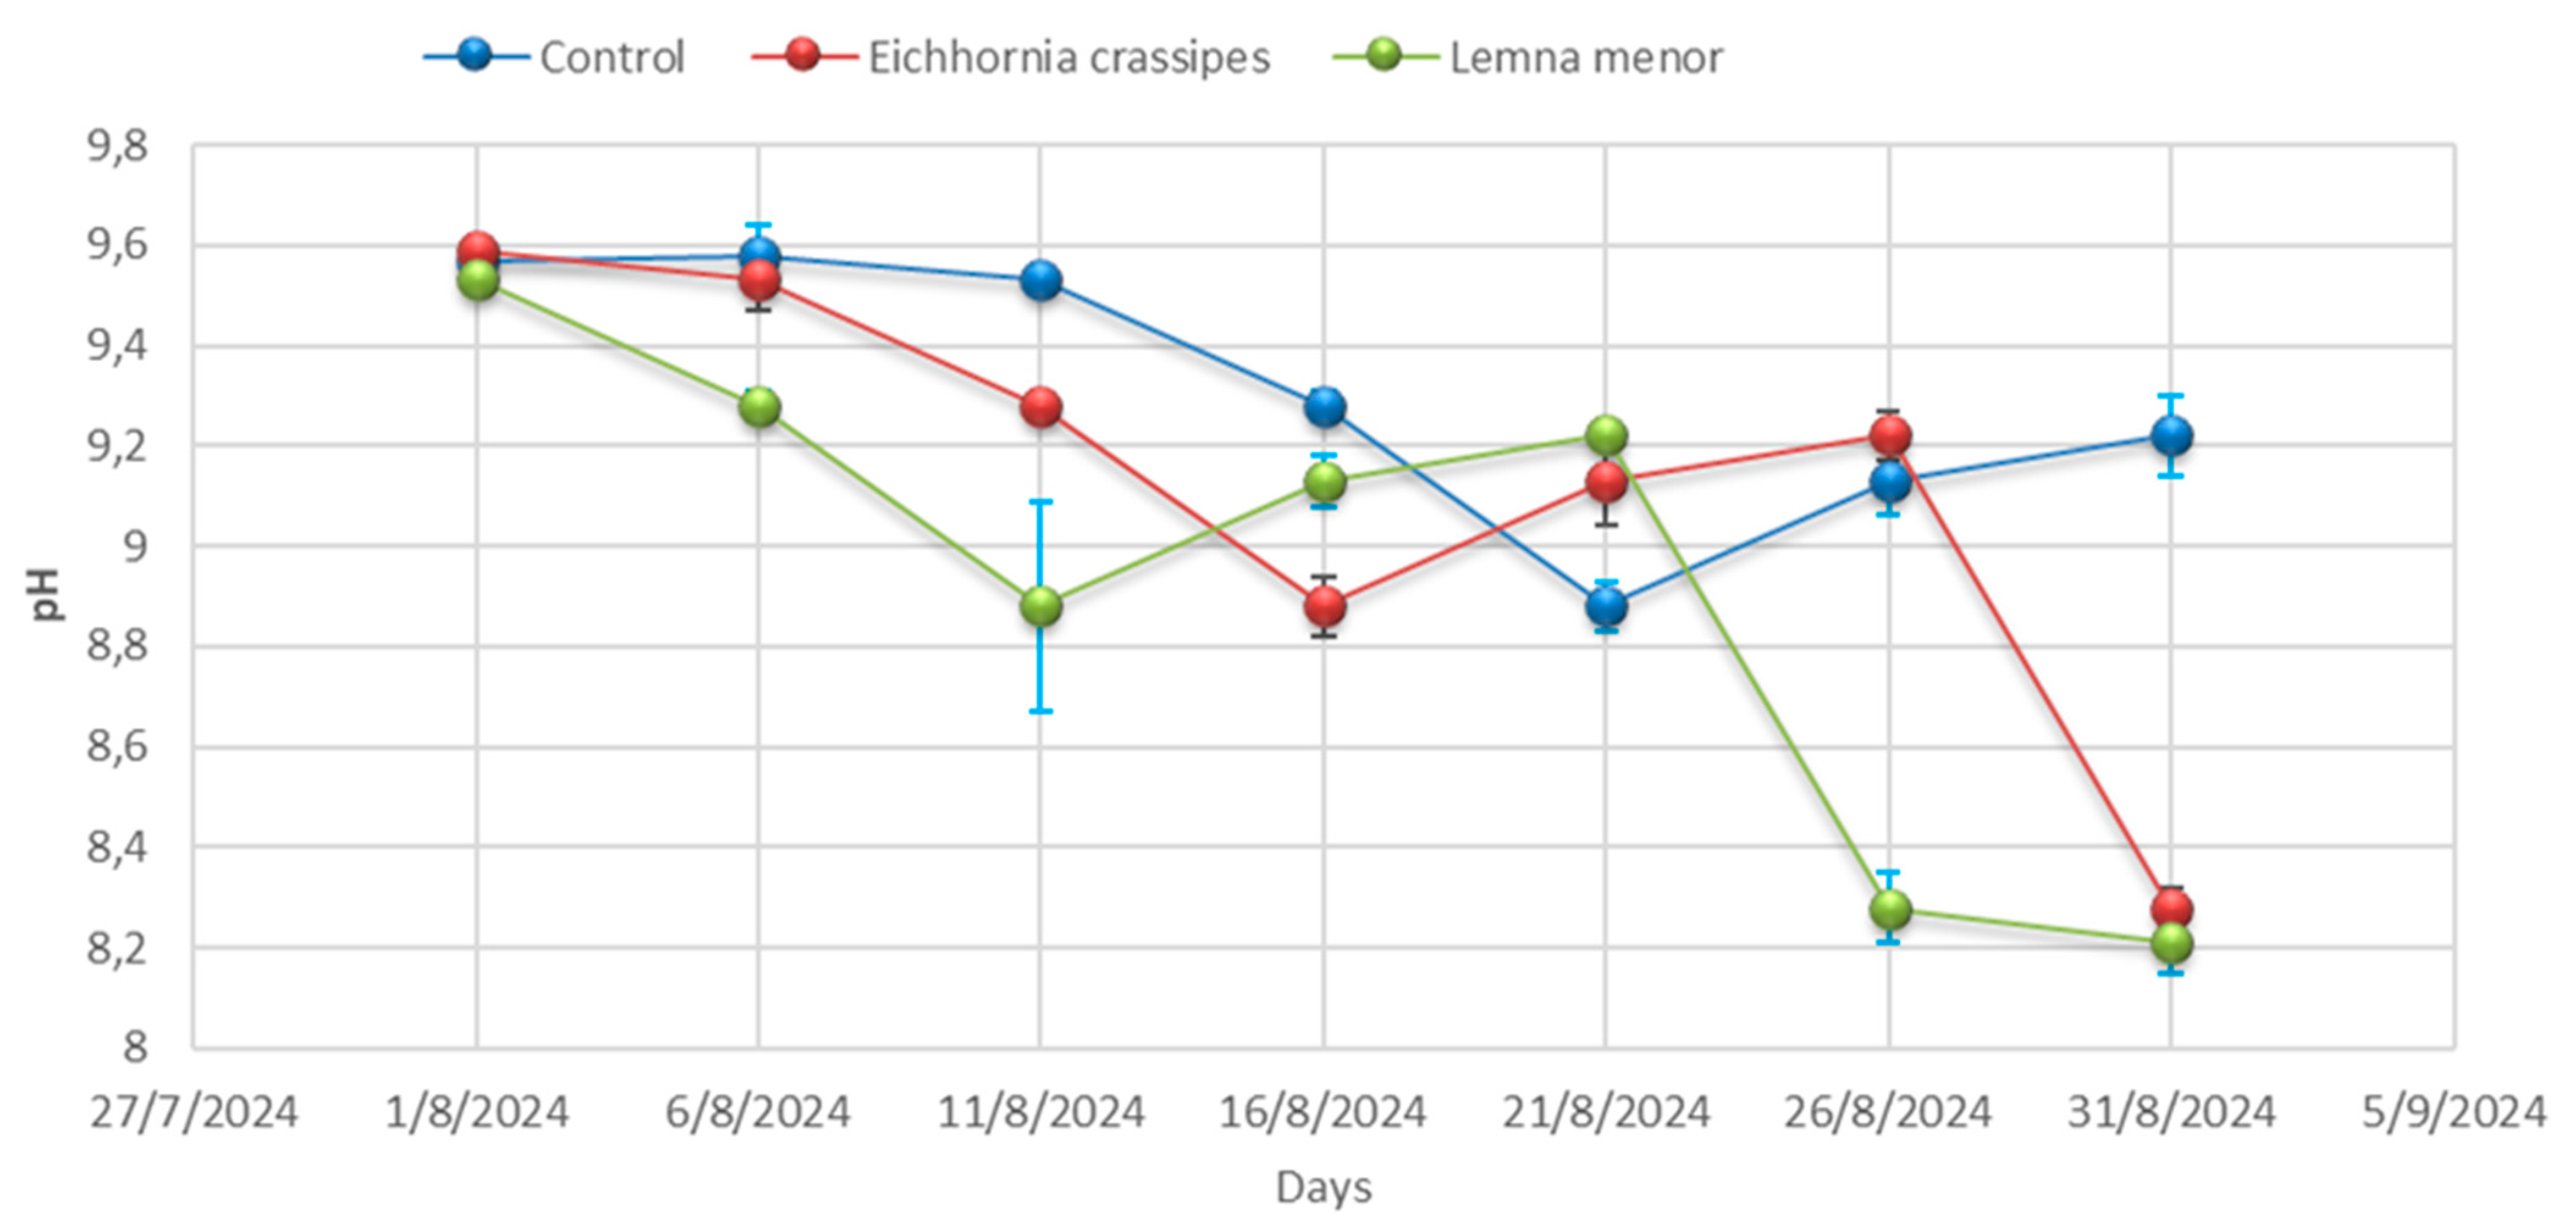
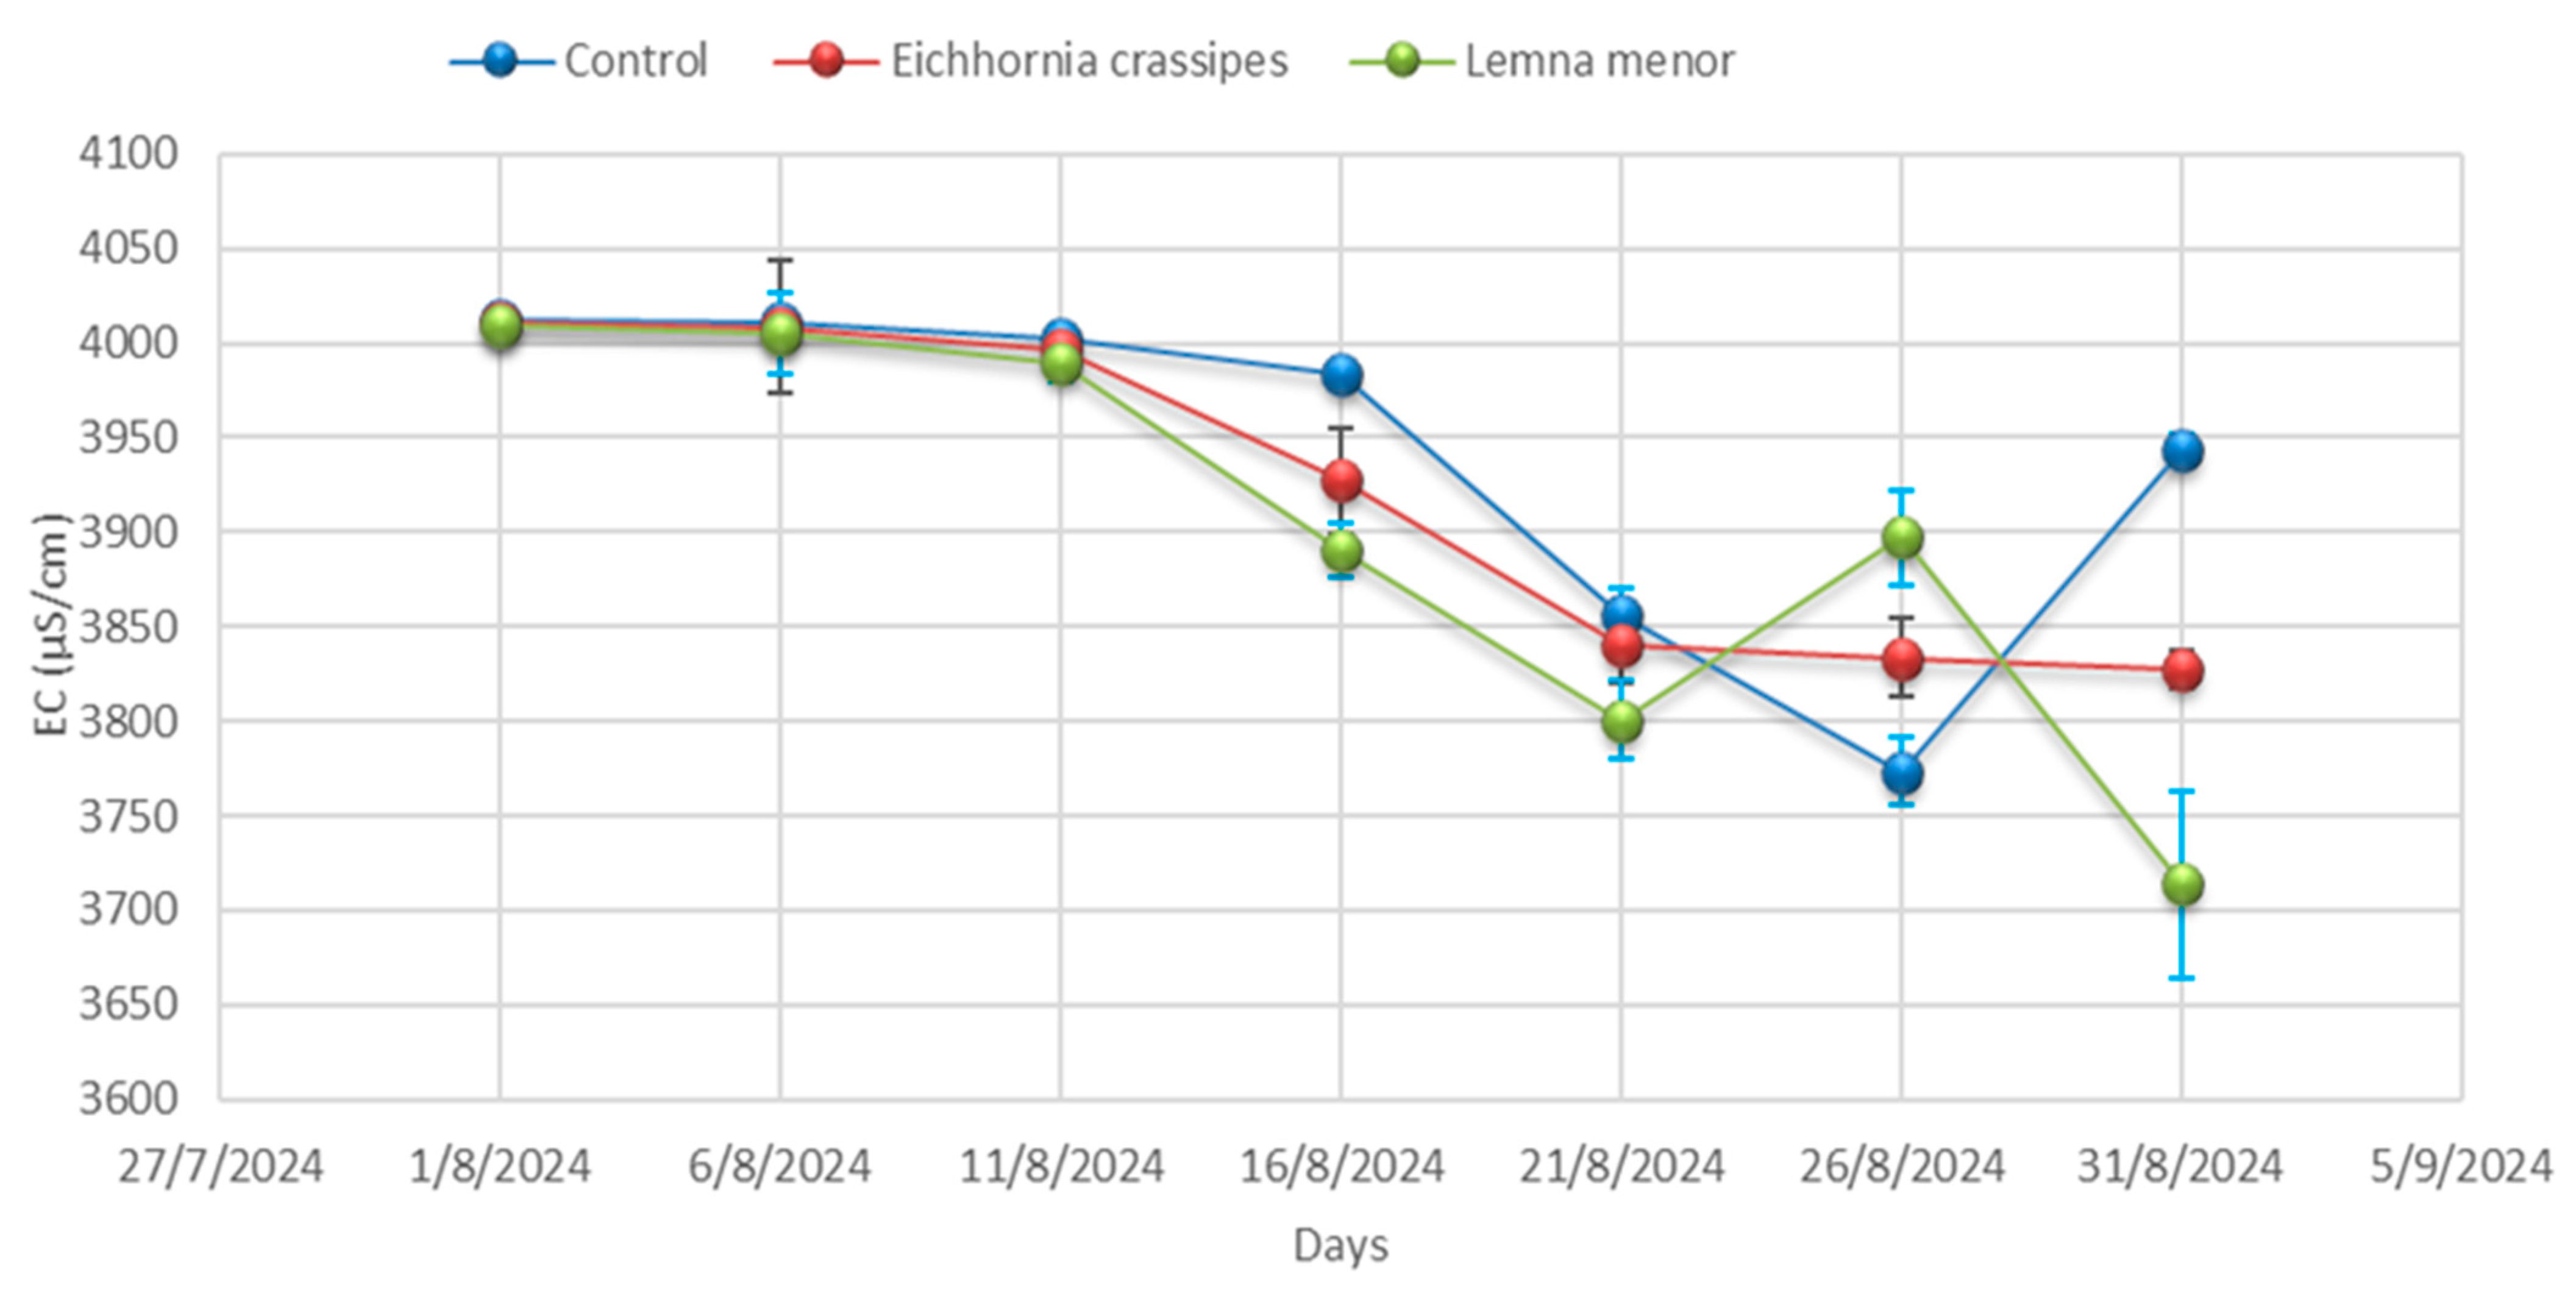
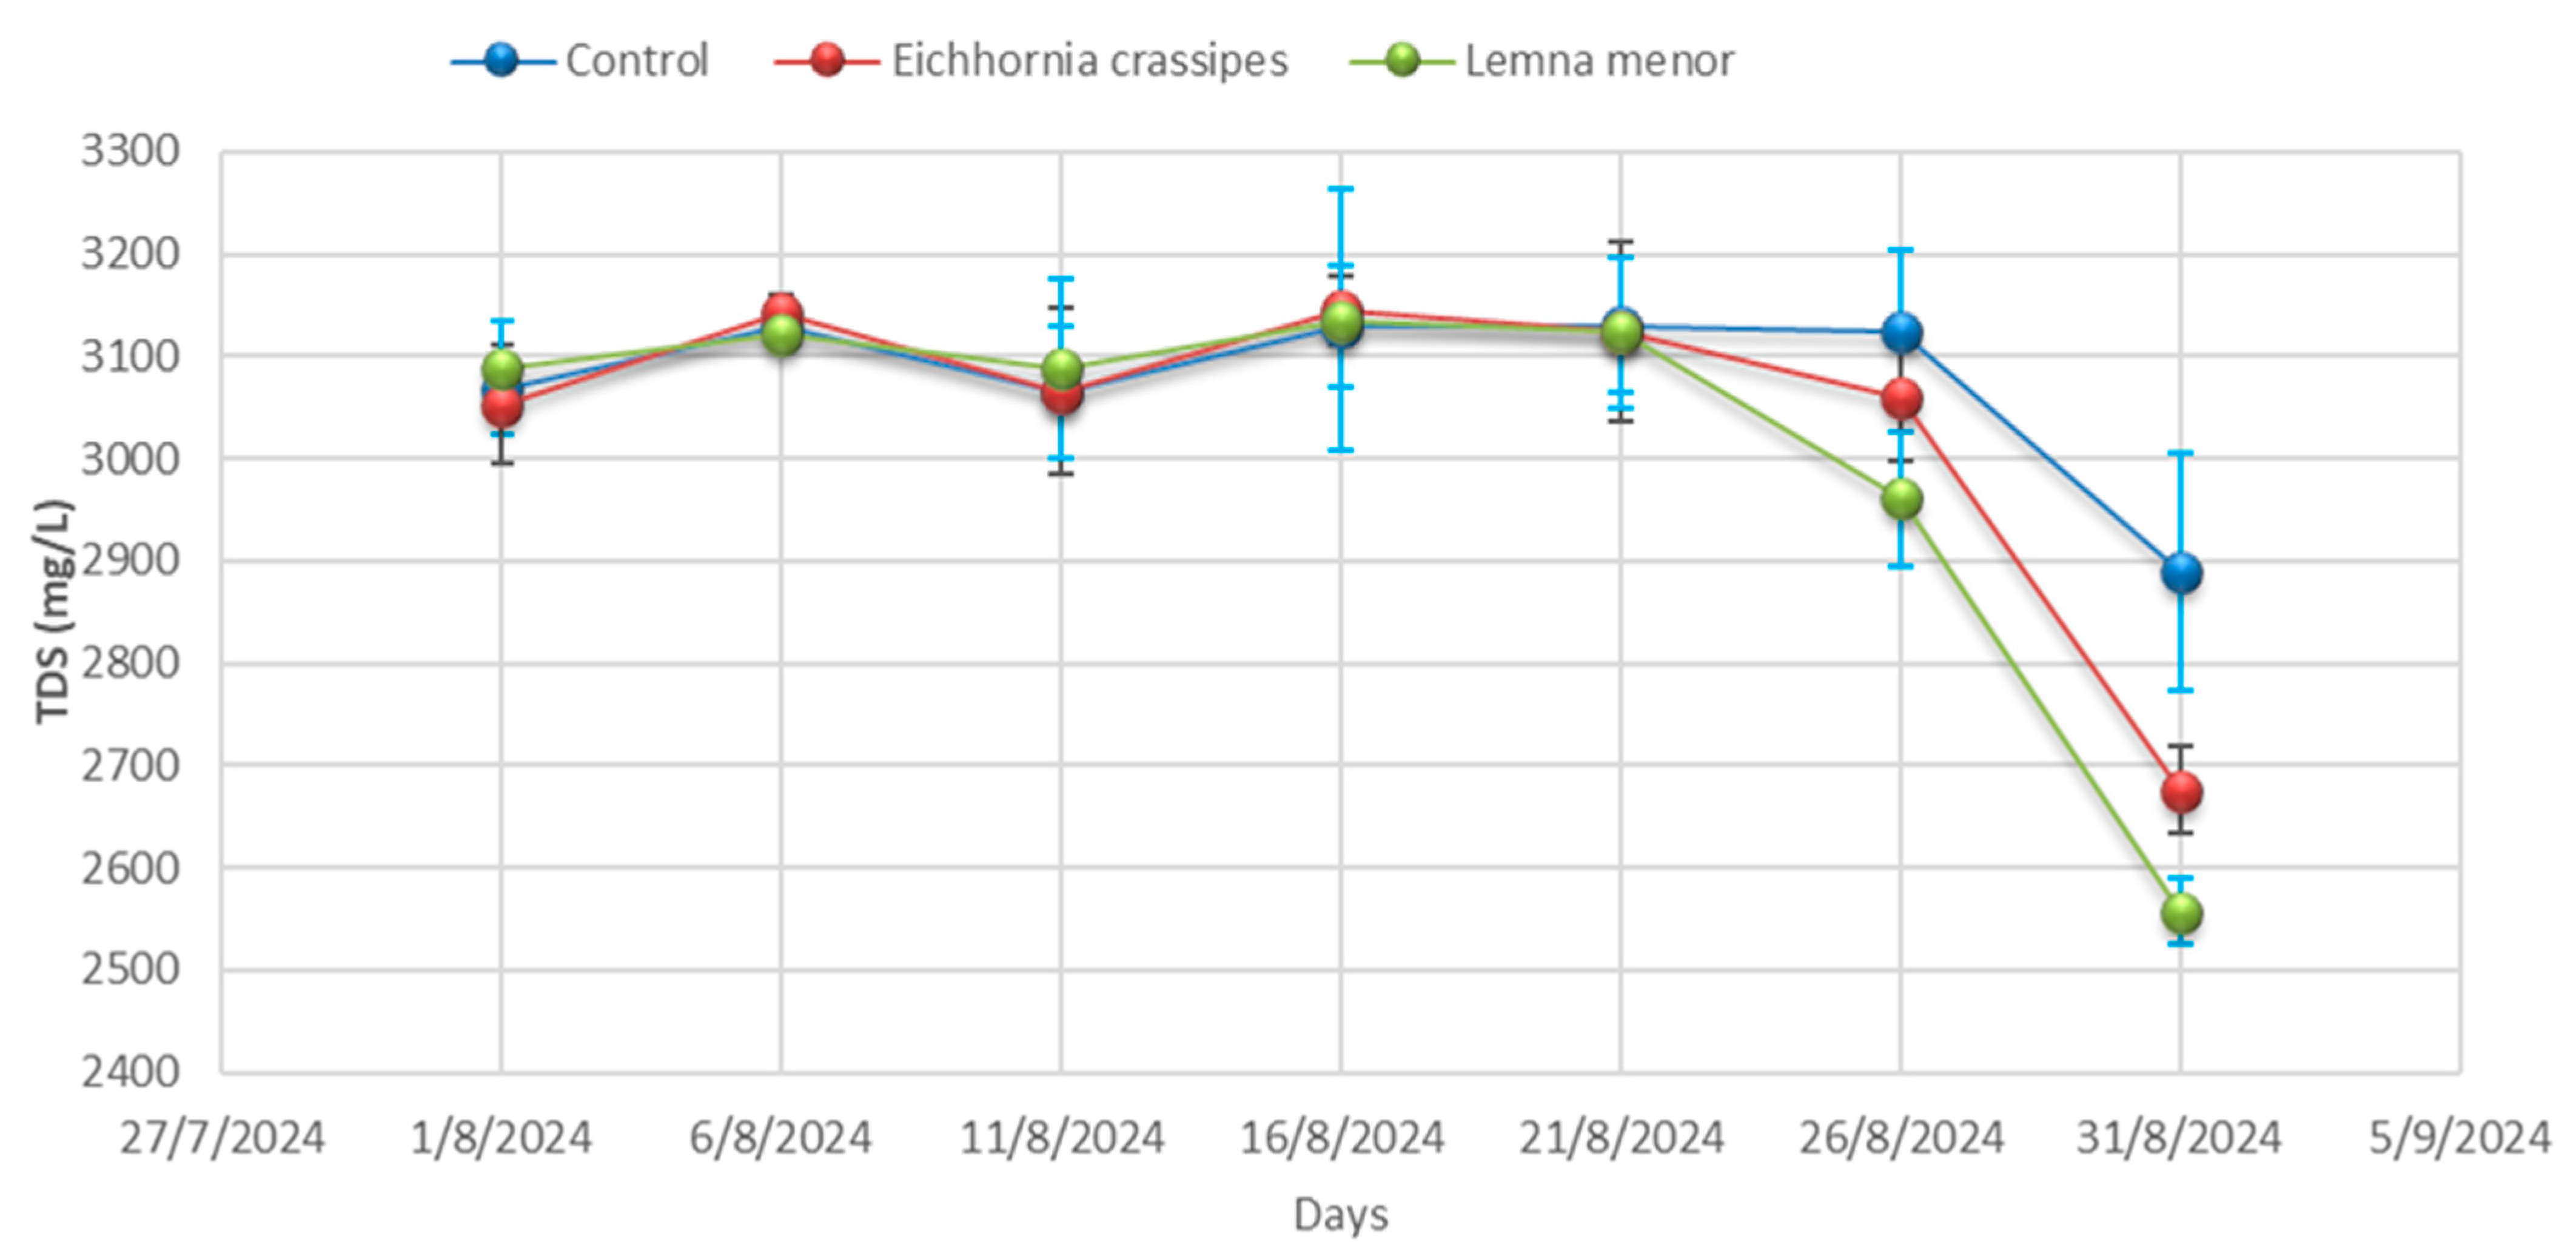
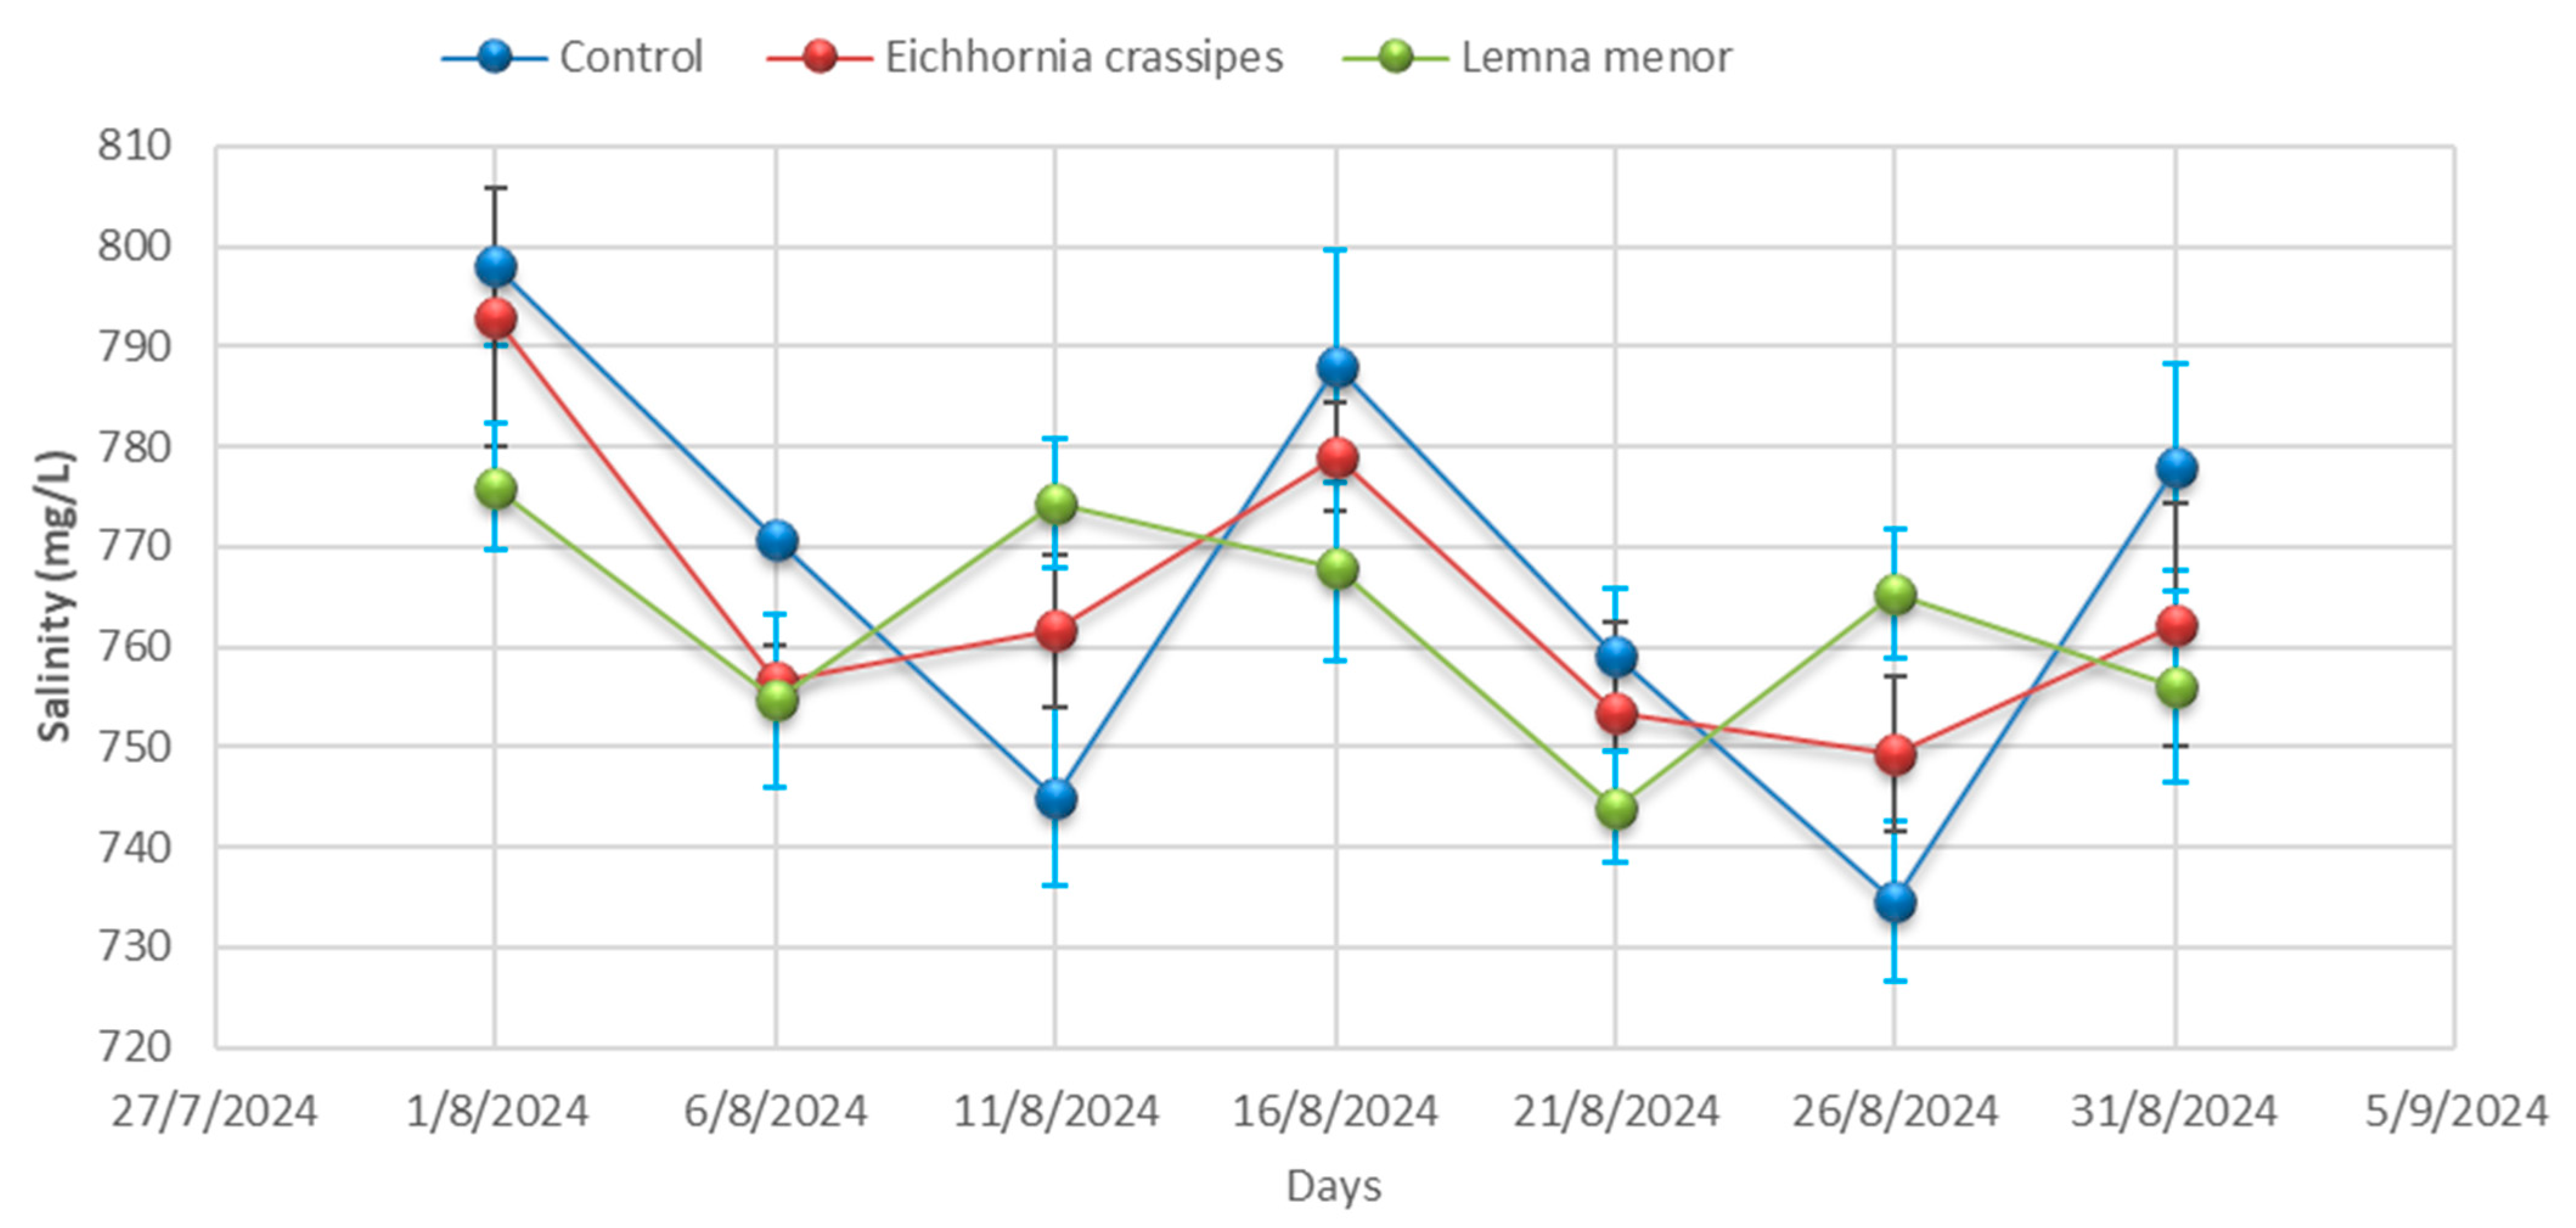
3.1. Physicochemical Analysis
3.2. A Statistical Algorithm for the Physicochemical Parameters in the Different Samples
3.3. The Microbial Load of the Effluent
4. Limitations and Future Research
5. Conclusions
Author Contributions
Funding
Data Availability Statement
Conflicts of Interest
Appendix A

| Time | Samples | pH | Temp °C | EC (µS/cm) | TDS (mg/L) | Salinity (mg/L) | BOD (mg/L) | COD (mg/L) | DO (mg/L) | Hardness (mg/L) |
|---|---|---|---|---|---|---|---|---|---|---|
| Day 01 | Control | 9.57 ± 0.04 | 25.20 ± 0.00 | 4012.33 ± 3.06 | 3068.33 ± 44.09 | 798.00 ± 7.94 | 355.33 ± 5.51 | 557.00 ± 4.36 | 2.25 ± 0.02 | 334.67± 4.51 |
| Day 01 | E. crassipes | 9.59 ± 0.01 | 25.23 ± 0.06 | 4010.33 ± 3.46 | 3052.67 ± 57.82 | 793.00 ± 12.86 | 359.67 ± 6.03 | 555.33 ± 0.58 | 2.24 ± 0.04 | 334.67 ± 4.36 |
| Day 01 | L. minor | 9.53 ± 0.02 | 25.27 ± 0.00 | 4009.67 ± 2.00 | 3088.67 ± 45.76 | 776.00 ± 6.25 | 356.33 ± 6.51 | 557.67 ± 3.21 | 2.25 ± 0.03 | 335.67 ± 4.04 |
| Day 06 | Control | 9.58 ± 0.06 | 25.27± 0.32 | 4011.00± 0.00 | 3130.00 ± 19.08 | 770.67 ± 0.00 | 356.67 ± 8.08 | 555.33 ± 3.79 | 2.25 ± 0.03 | 336.00 ± 3.79 |
| Day 06 | E. crassipes | 9.53 ± 0.06 | 25.23 ± 0.40 | 4008.67± 35.60 | 3141.00 ± 18.18 | 756.67 ± 3.46 | 353.00 ± 5.51 | 557.67 ± 4.04 | 2.27 ± 0.02 | 334.00 ± 4.04 |
| Day- 06 | L. minor | 9.28± 0.03 | 25.20 ± 0.21 | 4005.67± 21.50 | 3120.67 ± 7.37 | 754.67 ± 8.62 | 355.67 ± 8.08 | 514.67 ± 3.06 | 2.25 ± 0.04 | 334.67 ± 3.06 |
| Day 11 | Control | 9.53 ± 0.03 | 25.20 ± 0.17 | 4002.00± 7.23 | 3063.67 ± 64.63 | 745.00 ± 8.89 | 358.67 ± 10.00 | 557.67 ± 3.79 | 2.26 ± 0.03 | 337.67 ± 3.79 |
| Day 11 | E. crassipes | 9.28 ± 0.02 | 25.53 ± 0.26 | 3996.67± 7.02 | 3065.67 ± 81.50 | 761.67 ± 7.64 | 357.00 ± 3.21 | 514.67 ± 4.93 | 2.18 ± 0.02 | 305.67 ± 4.93 |
| Day 11 | L. minor | 8.88± 0.21 | 25.70 ± 0.15 | 3990.00± 10.54 | 3087.67 ± 88.15 | 774.33 ± 6.43 | 358.33 ± 3.51 | 481.00 ± 5.69 | 2.14 ± 0.05 | 269.00 ± 5.69 |
| Day 16 | Control | 9.28± 0.03 | 26.07 ± 0.35 | 3984.00 ± 5.03 | 3130.00 ± 59.50 | 788.00 ± 11.59 | 354.33 ± 0.00 | 514.67 ± 4.62 | 2.06 ± 0.04 | 232.67 ± 4.62 |
| Day 16 | E. crassipes | 8.88 ± 0.06 | 25.90 ± 0.10 | 3927.67± 28.01 | 3144.00 ± 33.62 | 779.00 ± 5.51 | 348.00 ± 3.46 | 481.00 ± 2.08 | 2.02 ± 0.10 | 226.00 ± 2.08 |
| Day 16 | L. minor | 9.13 ± 0.05 | 26.03 ± 0.29 | 3891.00± 14.53 | 3135.00± 127.58 | 768.00± 9.50 | 336.67 ± 4.51 | 478.00 ± 4.58 | 1.98 ± 0.03 | 223.33 ± 4.58 |
| Day 21 | Control | 8.88 ± 0.05 | 26.10 ± 4.35 | 3856.00± 15.04 | 3129.67 ± 65.91 | 759.00 ± 6.81 | 331.67 ± 3.21 | 481.00 ± 4.00 | 1.96 ± 0.03 | 217.67 ± 4.00 |
| Day 21 | E. crassipes | 9.13 ± 0.09 | 26.20 ± 0.12 | 3840.33± 20.42 | 3123.00 ± 87.64 | 753.33 ± 9.02 | 336.00 ± 6.03 | 478.00 ± 4.00 | 2.03 ± 0.02 | 219.67 ± 4.00 |
| Day 21 | L. minor | 9.22 ± 0.02 | 26.30 ± 0.19 | 3800.67± 20.98 | 3123.33 ± 73.73 | 744.00 ± 5.57 | 340.00 ± 4.73 | 510.33 ± 7.77 | 2.10 ± 0.02 | 221.33 ± 7.77 |
| Day 26 | Control | 9.13 ± 0.07 | 26.23 ± 0.17 | 3773.33± 18.01 | 3124.33 ± 79.76 | 734.67 ± 8.02 | 345.67 ± 5.51 | 478.00 ± 4.36 | 2.18 ± 0.04 | 226.33 ± 4.36 |
| Day 26 | E. crassipes | 9.22 ± 0.05 | 26.97 ± 0.36 | 3833.33± 20.88 | 3060.33± 63.89 | 749.33 ± 7.77 | 343.00 ± 5.19 | 510.33 ± 2.00 | 2.13± 0.01 | 225.33 ± 2.00 |
| Day 26 | L. minor | 8.28 ± 0.07 | 27.47 ± 0.39 | 3897.33± 24.99 | 2960.33 ± 64.86 | 765.33 ± 6.51 | 339.67 ± 2.08 | 428.33 ± 7.64 | 2.05 ± 0.02 | 223.33± 7.64 |
| Day 31 | Control | 9.22 ± 0.08 | 28.10 ± 0.15 | 3943.33 ± 8.33 | 2889.33 ± 115.86 | 778 ± 10.39 | 332.00 ± 5.86 | 510.33± 4.58 | 1.97 ± 0.04 | 222.67 ± 4.58 |
| Day 31 | E. crassipes | 8.28 ± 0.04 | 28.10 ± 0.21 | 3827.33 ± 9.54 | 2676.33 ± 42.32 | 762.33 ± 12.12 | 324.33 ± 4.16 | 428.33 ± 8.00 | 1.95 ± 0.04 | 215.00 ± 8.00 |
| Day 31 | L. minor | 8.21 ± 0.06 | 28.07 ± 0.15 | 3713.67 ± 49.24 | 2557.33 ± 33.08 | 756.00 ± 9.45 | 315.33 ± 7.77 | 437.67 ± 1.53 | 1.94 ± 0.04 | 207.33± 1.53 |
References
- ONU (United Nations). Water and Sanitation. Sustainable Development. Available online: https://www.un.org/sustainabledevelopment/ (accessed on 26 March 2025).
- Cetrulo, T.B.; Ferreira, D.F.C.; Marques, R.C.; Malheiros, T.F. Water Utilities Performance Analysis in Developing Countries: On an Adequate Model for Universal Access. J. Environ. Manag. 2020, 268, 110662. [Google Scholar] [CrossRef]
- Cabrera Barbecho, F.; Sarmiento, J.P. Exploring Technical Efficiency in Water Supply Evidence from Ecuador: Do Region Location and Management Type Matter? Sustainability 2023, 15, 6983. [Google Scholar] [CrossRef]
- Instituto Nacional de Estadística y Censos. Boletín Técnico: Estadística de Información Ambiental Económica en Gobiernos Autónomos Descentralizados Municipales. Available online: https://www.ecuadorencifras.gob.ec/documentos/web-inec/Encuestas_Ambientales/Municipios_2022/Agua_potable_alcantarillado/Documento_tecnico_APA_2022VFJA.pdf (accessed on 26 March 2025).
- Villegas, A.; Molinos-Senante, M.; Maziotis, A. Impact of Environmental Variables on the Efficiency of Water Companies in England and Wales: A Double-Bootstrap Approach. Environ. Sci. Pollut. Res. 2019, 26, 31014–31025. [Google Scholar] [CrossRef]
- Henze, M.; Van Loosdrecht, M.C.M.; Ekama, G.A.; Brdjanovic, D. Biological Wastewater Treatment: Principles, Modeling and Design; IWA Publishing: London, UK, 2019. [Google Scholar] [CrossRef]
- Von Sperling, M. Wastewater Characteristics, Treatment and Disposal. Water Intell. Online 2007, 6, 9781780402086. [Google Scholar] [CrossRef]
- Domínguez, M.C.; Gómez, S.; Ardila, A.N. Fitorremediación de Mercurio Presente En Aguas Residuales Pro-Venientes de La Industria Minera. UGCiencia 2016, 22, 227–237. [Google Scholar]
- Yan, A.; Wang, Y.; Tan, S.N.; Mohd Yusof, M.L.; Ghosh, S.; Chen, Z. Phytoremediation: A Promising Approach for Revegetation of Heavy Metal-Polluted Land. Front. Plant Sci. 2020, 11, 359. [Google Scholar] [CrossRef]
- Mishra, R.K.; Mentha, S.S.; Misra, Y.; Dwivedi, N. Emerging Pollutants of Severe Environmental Concern in Water and Wastewater: A Comprehensive Review on Current Developments and Future Research. Water-Energy Nexus 2023, 6, 74–95. [Google Scholar] [CrossRef]
- Delgadillo-López, A.E.; Prieto-García, F.; Villagómez-Ibarra, J.R.; Acevedo-Sandoval, O. Fitorremediación: Una Alternativa Para Eliminar La Contaminación. Tropical and Subtropical Agroecosystems. Trop. Subtrop. Agroecosyst. 2011, 14, 597–612. [Google Scholar]
- Intriago, L.M.R.; Intriago, H.R.R.; Palomeque, P.G.; Solano, J.L.C.; Delgado, I.R. Efecto Fitorremediador de Lemna Minor y Eichhornia Crassipes En Parámetros Físicos y Químicos En Aguas Residuales Domésticas. South Fla. J. Dev. 2024, 5, 688–696. [Google Scholar] [CrossRef]
- Rezania, S.; Taib, S.M.; Md Din, M.F.; Dahalan, F.A.; Kamyab, H. Comprehensive Review on Phytotechnology: Heavy Metals Removal by Diverse Aquatic Plants Species from Wastewater. J. Hazard. Mater. 2016, 318, 587–599. [Google Scholar] [CrossRef]
- Zhang, D.-Q.; Jinadasa, K.B.S.N.; Gersberg, R.M.; Liu, Y.; Tan, S.K.; Ng, W.J. Application of Constructed Wetlands for Wastewater Treatment in Tropical and Subtropical Regions (2000–2013). J. Environ. Sci. 2015, 30, 30–46. [Google Scholar] [CrossRef] [PubMed]
- Reddy, K.R.; De Busk, W.F. Nutrient Removal Potential of Selected Aquatic Macrophytes. J. Environ. Qual. 1985, 14, 459–462. [Google Scholar] [CrossRef]
- Vymazal, J. Constructed Wetlands for Wastewater Treatment: Five Decades of Experience. Environ. Sci. Technol. 2011, 45, 61–69. [Google Scholar] [CrossRef]
- Mishra, S.; Maiti, A. The Efficiency of Eichhornia Crassipes in the Removal of Organic and Inorganic Pollutants from Wastewater: A Review. Environ. Sci. Pollut. Res. 2017, 24, 7921–7937. [Google Scholar] [CrossRef] [PubMed]
- Qasaimeh, A.; AlSharie, H.; Masoud, T. A Review on Constructed Wetlands Components and Heavy Metal Removal from Wastewater. J. Environ. Prot. 2015, 6, 710–718. [Google Scholar] [CrossRef]
- Chaudhry, M.; Shafi, I.; Mahnoor, M.; Vargas, D.L.R.; Thompson, E.B.; Ashraf, I. A Systematic Literature Review on Identifying Patterns Using Unsupervised Clustering Algorithms: A Data Mining Perspective. Symmetry 2023, 15, 1679. [Google Scholar] [CrossRef]
- Valenzuela-Cobos, J.D.; Guevara-Viejó, F.; Grijalva-Endara, A.; Vicente-Galindo, P.; Galindo-Villardón, P. Production and Evaluation of Pleurotus Spp. Hybrids Cultivated on Ecuadorian Agro-Industrial Wastes: Using Multivariate Statistical Methods. Sustainability 2023, 15, 15546. [Google Scholar] [CrossRef]
- Martínez-Regalado, J.A.; Murillo-Avalos, C.L.; Vicente-Galindo, P.; Jiménez-Hernández, M.; Vicente-Villardón, J.L. Using HJ-Biplot and External Logistic Biplot as Machine Learning Methods for Corporate Social Responsibility Practices for Sustainable Development. Mathematics 2021, 9, 2572. [Google Scholar] [CrossRef]
- Villardón, M.P.G. Un Alternativa de Representación Simultánea: HJ-Biplot. Qüestiió 1986, 10, 13–23. [Google Scholar]
- Ali, S.; Abbas, Z.; Rizwan, M.; Zaheer, I.; Yavaş, İ.; Ünay, A.; Abdel-DAIM, M.; Bin-Jumah, M.; Hasanuzzaman, M.; Kalderis, D. Application of Floating Aquatic Plants in Phytoremediation of Heavy Metals Polluted Water: A Review. Sustainability 2020, 12, 1927. [Google Scholar] [CrossRef]
- Pádua, L.; Antão-Geraldes, A.M.; Sousa, J.J.; Rodrigues, M.Â.; Oliveira, V.; Santos, D.; Miguens, M.F.P.; Castro, J.P. Water Hyacinth (Eichhornia Crassipes) Detection Using Coarse and High Resolution Multispectral Data. Drones 2022, 6, 47. [Google Scholar] [CrossRef]
- Arroyave, M.D.P. La Lenteja de Agua (Lemna Minor L.): Una Planta Acuática Promisoria. Rev. EIA 2004, 1, 33–38. [Google Scholar]
- Villamagna, A.M.; Murphy, B.R. Ecological and Socio-economic Impacts of Invasive Water Hyacinth (Eichhornia Crassipes): A Review. Freshw. Biol. 2010, 55, 282–298. [Google Scholar] [CrossRef]
- Patel, S. Threats, Management and Envisaged Utilizations of Aquatic Weed Eichhornia Crassipes: An Overview. Rev. Environ. Sci. Biotechnol. 2012, 11, 249–259. [Google Scholar] [CrossRef]
- APHA (American Public Health Association). Standard Methods for the Examination of Water and Wastewater, 23rd ed.; American Public Health Association: Washington, DC, USA, 2017. [Google Scholar]
- NTE INEN 2169:2013; Agua. Calidad Del Agua. Muestreo. Manejo y Conservación de Muestras. INEN Instituto Ecuatoriano de Normalización: Quito, Ecuador, 2013.
- Boyd, C.E. Water Quality: An Introduction; Springer International Publishing: Cham, Switzerland, 2020. [Google Scholar] [CrossRef]
- Sawyer, C.N.; McCarty, P.L.; Parkin, G.F. Chemistry for Environmental and Engineering Science, 5th ed.; McGraw Hill Inc.: New York, NY, USA, 2003. [Google Scholar]
- Perrodin, Y.; Donguy, G.; Bazin, C.; Volatier, L.; Durrieu, C.; Bony, S.; Devaux, A.; Abdelghafour, M.; Moretto, R. Ecotoxicological Risk Assessment Linked to Infilling Quarries with Treated Dredged Seaport Sediments. Sci. Total Environ. 2012, 431, 375–384. [Google Scholar] [CrossRef]
- R Core Team. R: A Language and Environment for Statistical Computing; R Foundation for Statistical Computing: Vienna, Austria, 2023; Available online: https://www.r-project.org (accessed on 26 March 2025).
- Gower, J.C.; Lubbe, S.G.; Roux, N.J.L. Understanding Biplots; Wiley: Hoboken, NJ, USA, 2013. [Google Scholar]
- Engel, D.; Hüttenberger, L.; Hamann, B. A Survey of Dimension Reduction Methods for High-Dimensional Data Analysis and Visualization. OASIcs 2013, 27, 135–149. [Google Scholar] [CrossRef]
- Montes-Escobar, K.; De La Hoz-M, J.; Barreiro-Linzán, M.D.; Fonseca-Restrepo, C.; Lapo-Palacios, M.Á.; Verduga-Alcívar, D.A.; Salas-Macias, C.A. Trends in Agroforestry Research from 1993 to 2022: A Topic Model Using Latent Dirichlet Allocation and HJ-Biplot. Mathematics 2023, 11, 2250. [Google Scholar] [CrossRef]
- Silva Viamonte, C.F. HJ-Biplot Como Metodología Exploratoria Para El Análisis Multidimensional de Los Objetivos de Desarrollo Sostenible (ODS) a Nivel Municipios En Bolivia. Rev. Varianza 2024, 23, 29–55. [Google Scholar] [CrossRef]
- Zhang, H.; Wang, X.C.; Zheng, Y.; Dzakpasu, M. Removal of Pharmaceutical Active Compounds in Wastewater by Constructed Wetlands: Performance and Mechanisms. J. Environ. Manag. 2023, 325, 116478. [Google Scholar] [CrossRef]
- Tchobanoglous, G.; Stensel, D.H.; Tsuchihashi, R.; Burton, F.; Abu-Orf, M.; Bowden, G.; Pfrang, W.; Metcalf & Eddy, Inc.; Albert Einstein College of Medicine (Eds.) Wastewater Engineering: Treatment and Resource Recovery, 5th ed.; McGraw-Hill Education: New York, NY, USA, 2014. [Google Scholar]
- Xu, L.; Cheng, S.; Zhuang, P.; Xie, D.; Li, S.; Liu, D.; Li, Z.; Wang, F.; Xing, F. Assessment of the Nutrient Removal Potential of Floating Native and Exotic Aquatic Macrophytes Cultured in Swine Manure Wastewater. Int. J. Environ. Res. Public Health 2020, 17, 1103. [Google Scholar] [CrossRef]
- Adjovu, G.E.; Stephen, H.; James, D.; Ahmad, S. Measurement of Total Dissolved Solids and Total Suspended Solids in Water Systems: A Review of the Issues, Conventional, and Remote Sensing Techniques. Remote Sens. 2023, 15, 3534. [Google Scholar] [CrossRef]
- Hoogendijk, K.; Myburgh, P.A.; Howell, C.L.; Hoffman, J.E. Irrigation of Agricultural Crops with Municipal Wastewater—A Review. S. Afr. J. Enol. Vitic. 2023, 44, 31–54. [Google Scholar] [CrossRef]
- Deshmukh, A.A.; Bandela, N.N.; Chavan, J.R.; Nalawade, P.M. Studies on Potential Use of Water Hyacinth, Pistia and Azolla for Municipal Waste Water Treatment. Indian J. Appl. Res. 2011, 3, 226–228. [Google Scholar] [CrossRef]
- Jouanneau, S.; Recoules, L.; Durand, M.J.; Boukabache, A.; Picot, V.; Primault, Y.; Lakel, A.; Sengelin, M.; Barillon, B.; Thouand, G. Methods for Assessing Biochemical Oxygen Demand (BOD): A Review. Water Res. 2014, 49, 62–82. [Google Scholar] [CrossRef]
- Zimmels, Y.; Kirzhner, F.; Malkovskaja, A. Application of Eichhornia Crassipes and Pistia Stratiotes for Treatment of Urban Sewage in Israel. J. Environ. Manag. 2006, 81, 420–428. [Google Scholar] [CrossRef]
- Kadlec, R.H.; Wallace, S.D. Treatment Wetlands, 2nd ed.; CRC Press: Boca Raton, FL, USA, 2009. [Google Scholar]
- Rizwana, M.; Darshan, M.; Nilesh, D. Phytoremediation of Textile Waste Water Using Potential Wetland Plant: Eco Sustainable Approach. Int. J. Interdiscip. Multidiscip. Stud. (IJIMS) 2014, 1, 130–138. [Google Scholar]
- Wetzel, R.G. Limnology: Lake and River Ecosystems, 3rd ed.; Academic Press: San Diego, CA, USA, 2001. [Google Scholar]
- Shah, R.A.; Singh, N.; Wani, K.A. Water Hyacinth (Eichhornia Crassipes) as a Remediation Tool for Dye-Effluent Pollution. Int. J. Sci. Nat. 2010, 1, 172–178. [Google Scholar]
- Dhir, B.; Sharmila, P.; Saradhi, P.P. Potential of Aquatic Macrophytes for Removing Contaminants from the Environment. Crit. Rev. Environ. Sci. Technol. 2009, 39, 754–781. [Google Scholar] [CrossRef]
- Osorto Nuñez, M.H.; Martínez Rodríguez, D.; Merlo Rodríguez, V. Evaluacion de La Calidad de Agua Mediante Un Analisis Multivariante En Los Esteros Del Golfo de Fonseca, Honduras.: Calidad de Agua En Los Esteros Del Golfo de Fonseca. Bol. Investig. Mar. Costeras 2023, 52, 65–92. [Google Scholar] [CrossRef]
- Ministerio del Ambiente del Ecuador. Texto Unificado de Legislación Secundaria Del Ministerio Del Ambiente (TULSMA), Libro VI Anexo 1; Ministerio del Ambiente del Ecuador: Quito, Ecuador, 2015. [Google Scholar]
- Cabral, J.P.S. Water Microbiology. Bacterial Pathogens and Water. Int. J. Environ. Res. Public Health 2010, 7, 3657–3703. [Google Scholar] [CrossRef]
- World Health Organization (WHO). Guidelines for Safe Recreational Water Environments: Coastal and Fresh Waters; World Health Organization (WHO): Geneva, Germany, 2003; Volume 1. [Google Scholar]


| Samples | Total Coliforms (NMP/mL) | Fecal Coliforms (NMP/mL) | E. coli (UFC/mL) | Fecal Staphylococcus (UFC/mL) |
|---|---|---|---|---|
| Control | 3535.00 a ± 20.5 | 523.67 b ± 11.5 | 522.33 b ± 1.5 | 299.00 c ± 7.5 |
| E. crassipes | 3821.33 a ± 25.7 | 629.33 b ± 7.1 | 517.00 c ± 15.1 | 251.33 d ± 14.1 |
| L. minor | 3928.67 a ± 12.7 | 552.67 b ± 9. 2 | 413.67 c ± 3.1 | 274.00 d ± 4.6 |
Disclaimer/Publisher’s Note: The statements, opinions and data contained in all publications are solely those of the individual author(s) and contributor(s) and not of MDPI and/or the editor(s). MDPI and/or the editor(s) disclaim responsibility for any injury to people or property resulting from any ideas, methods, instructions or products referred to in the content. |
© 2025 by the authors. Licensee MDPI, Basel, Switzerland. This article is an open access article distributed under the terms and conditions of the Creative Commons Attribution (CC BY) license (https://creativecommons.org/licenses/by/4.0/).
Share and Cite
Moreno Castro, D.W.; Franco Arias, O.O.; Valenzuela Cobos, J.D.; Prieto Sánchez, D.; Pimenteira, C. Data Mining to Evaluate the Effect of Eichhornia crassipes and Lemna minor in the Phytoremediation of Wastewater in the Canton of Milagro. Water 2025, 17, 1551. https://doi.org/10.3390/w17101551
Moreno Castro DW, Franco Arias OO, Valenzuela Cobos JD, Prieto Sánchez D, Pimenteira C. Data Mining to Evaluate the Effect of Eichhornia crassipes and Lemna minor in the Phytoremediation of Wastewater in the Canton of Milagro. Water. 2025; 17(10):1551. https://doi.org/10.3390/w17101551
Chicago/Turabian StyleMoreno Castro, Denny William, Omar Orlando Franco Arias, Juan Diego Valenzuela Cobos, Daniel Prieto Sánchez, and Cícero Pimenteira. 2025. "Data Mining to Evaluate the Effect of Eichhornia crassipes and Lemna minor in the Phytoremediation of Wastewater in the Canton of Milagro" Water 17, no. 10: 1551. https://doi.org/10.3390/w17101551
APA StyleMoreno Castro, D. W., Franco Arias, O. O., Valenzuela Cobos, J. D., Prieto Sánchez, D., & Pimenteira, C. (2025). Data Mining to Evaluate the Effect of Eichhornia crassipes and Lemna minor in the Phytoremediation of Wastewater in the Canton of Milagro. Water, 17(10), 1551. https://doi.org/10.3390/w17101551