
Attribution Analysis of Runoff Change in a Changing Environment: A Case Study of the Dawen River Basin

Abstract
1. Introduction
2. Materials and Methods
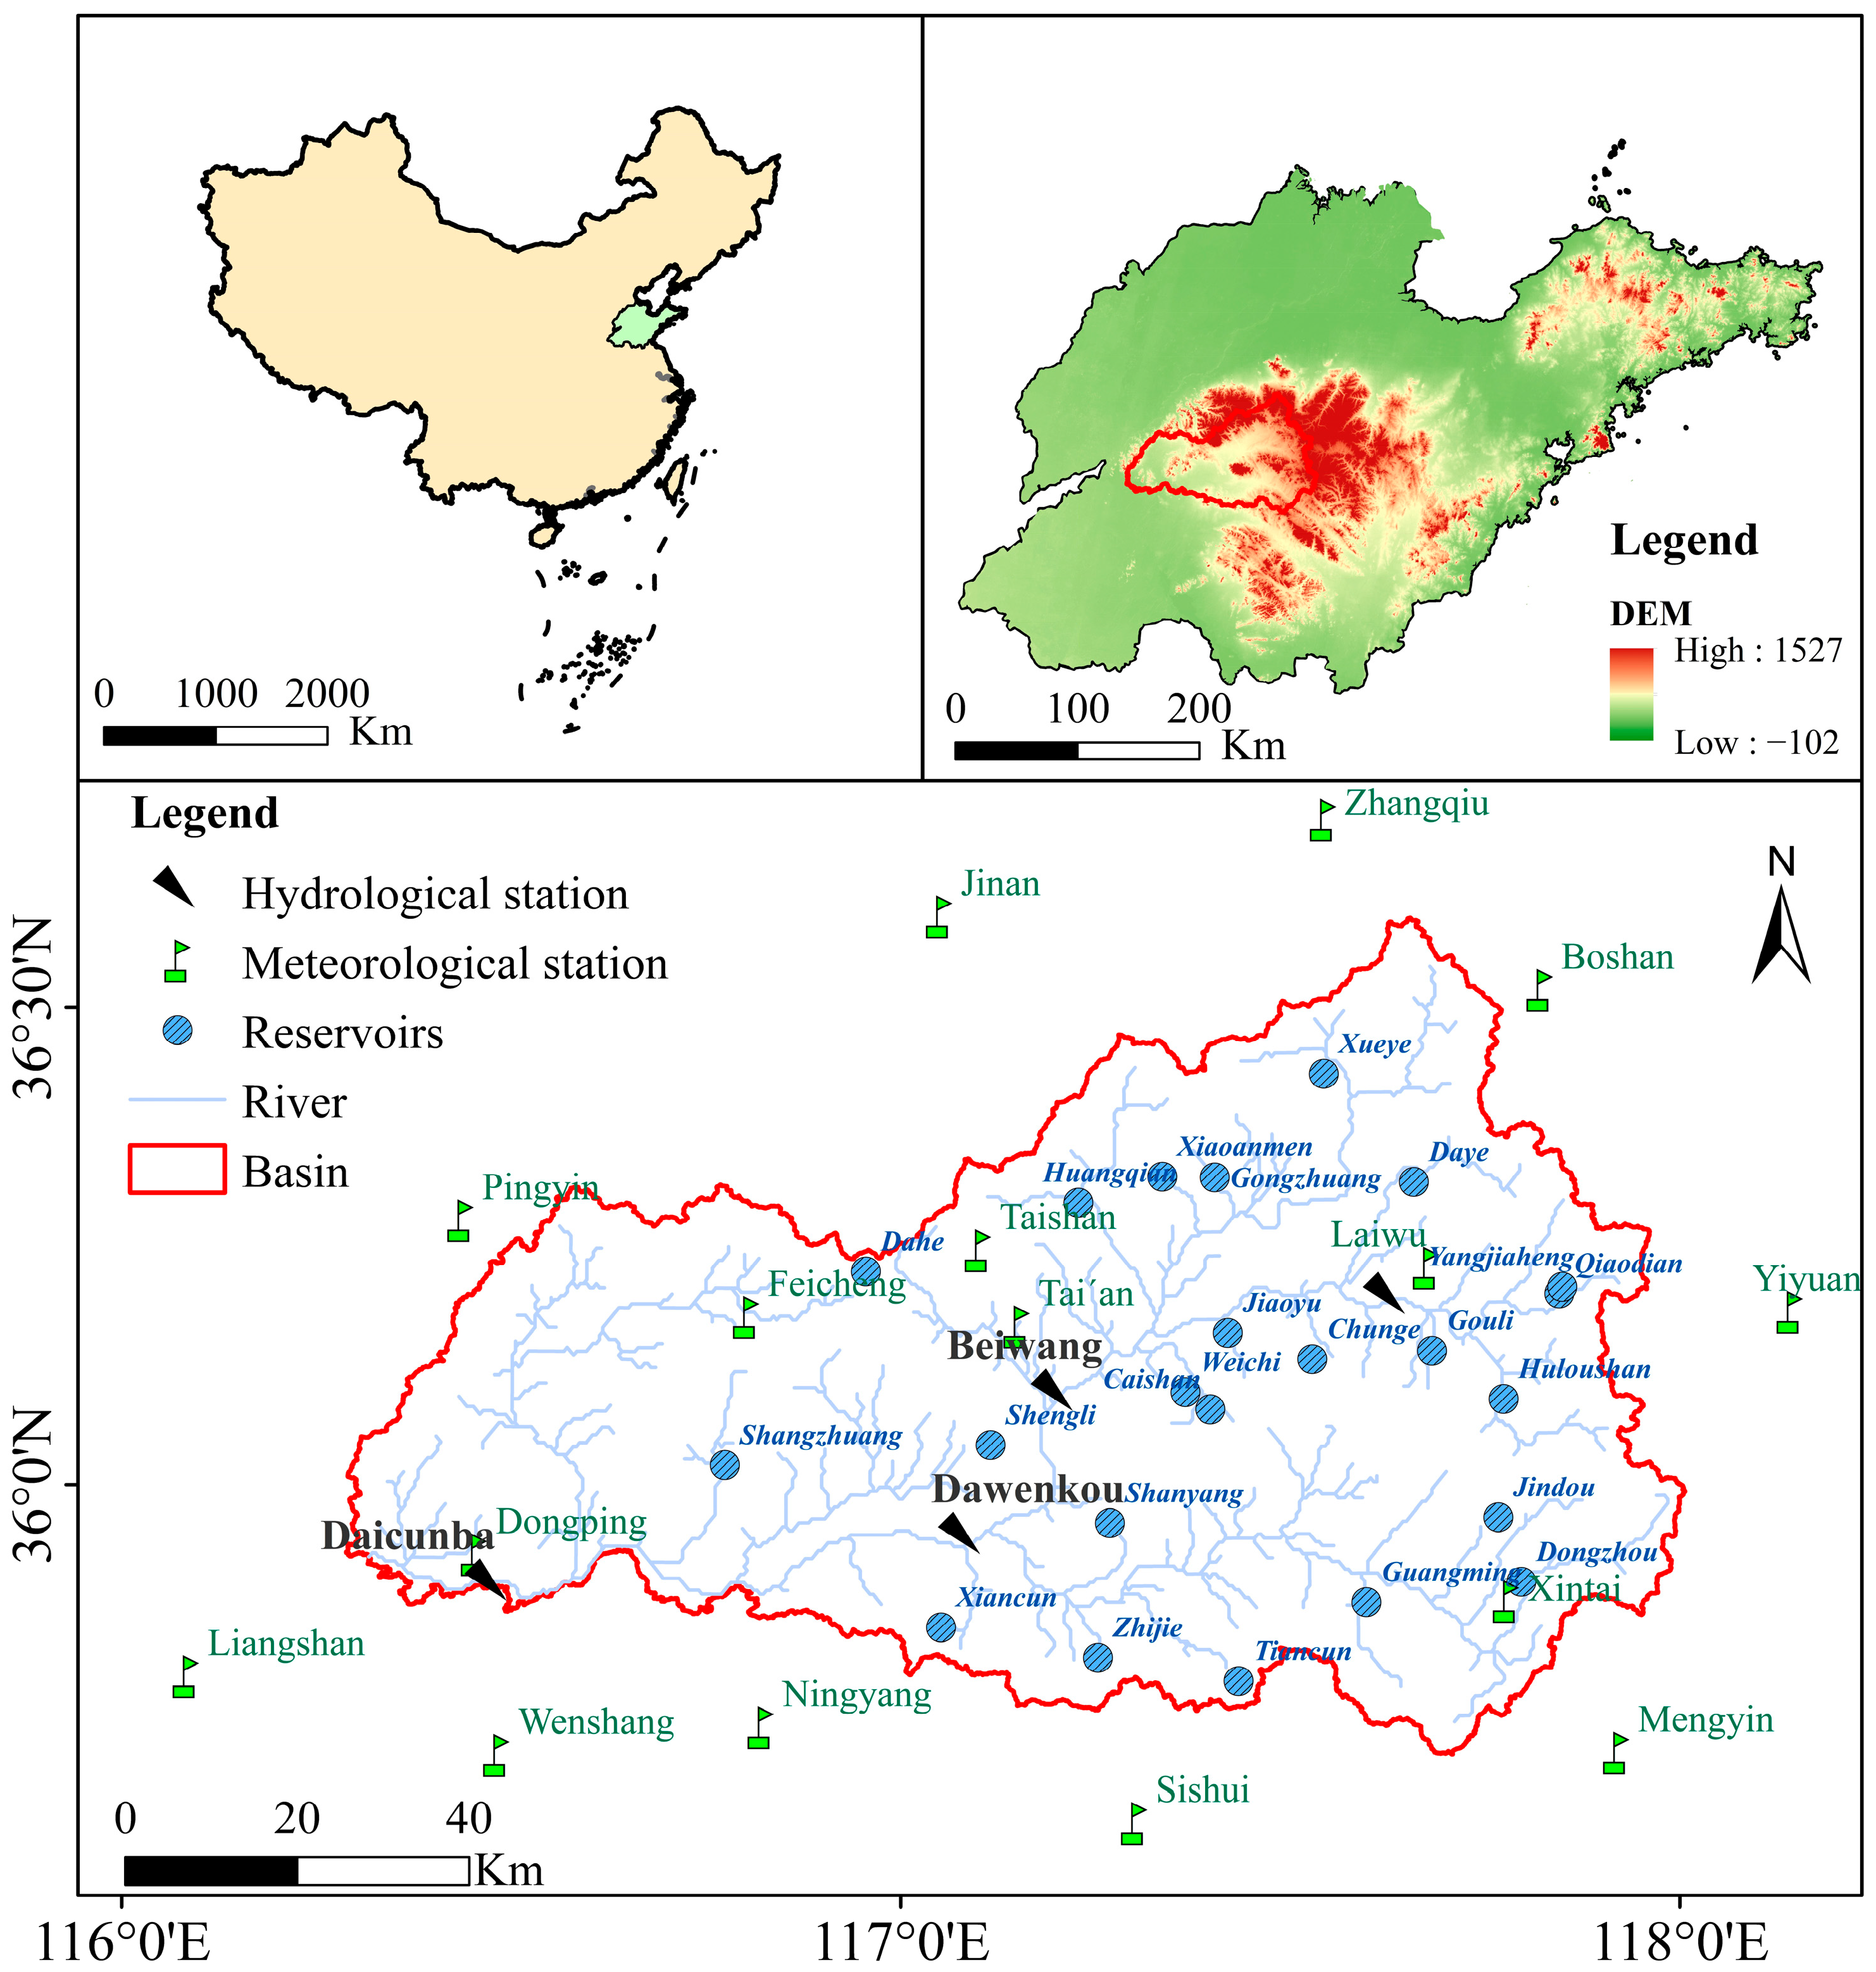
2.1. Study Area
2.2. Data
- DEM Data
- Hydrometeorological Data
- Soil Data
- Land Use Cover Data
- Reservoir data
- Consumptive water
2.3. Methods
2.3.1. Runoff Change Attribution Methodology
- (1)
- Precipitation–Runoff Double Mass Curve
- Establish Cumulative Precipitation–Runoff Linear Regression Equations
- Quantification of Runoff Change Attribution
- Evaluation Index
- (2)
- Elasticity Coefficient Method
- (3)
- Hydrological model
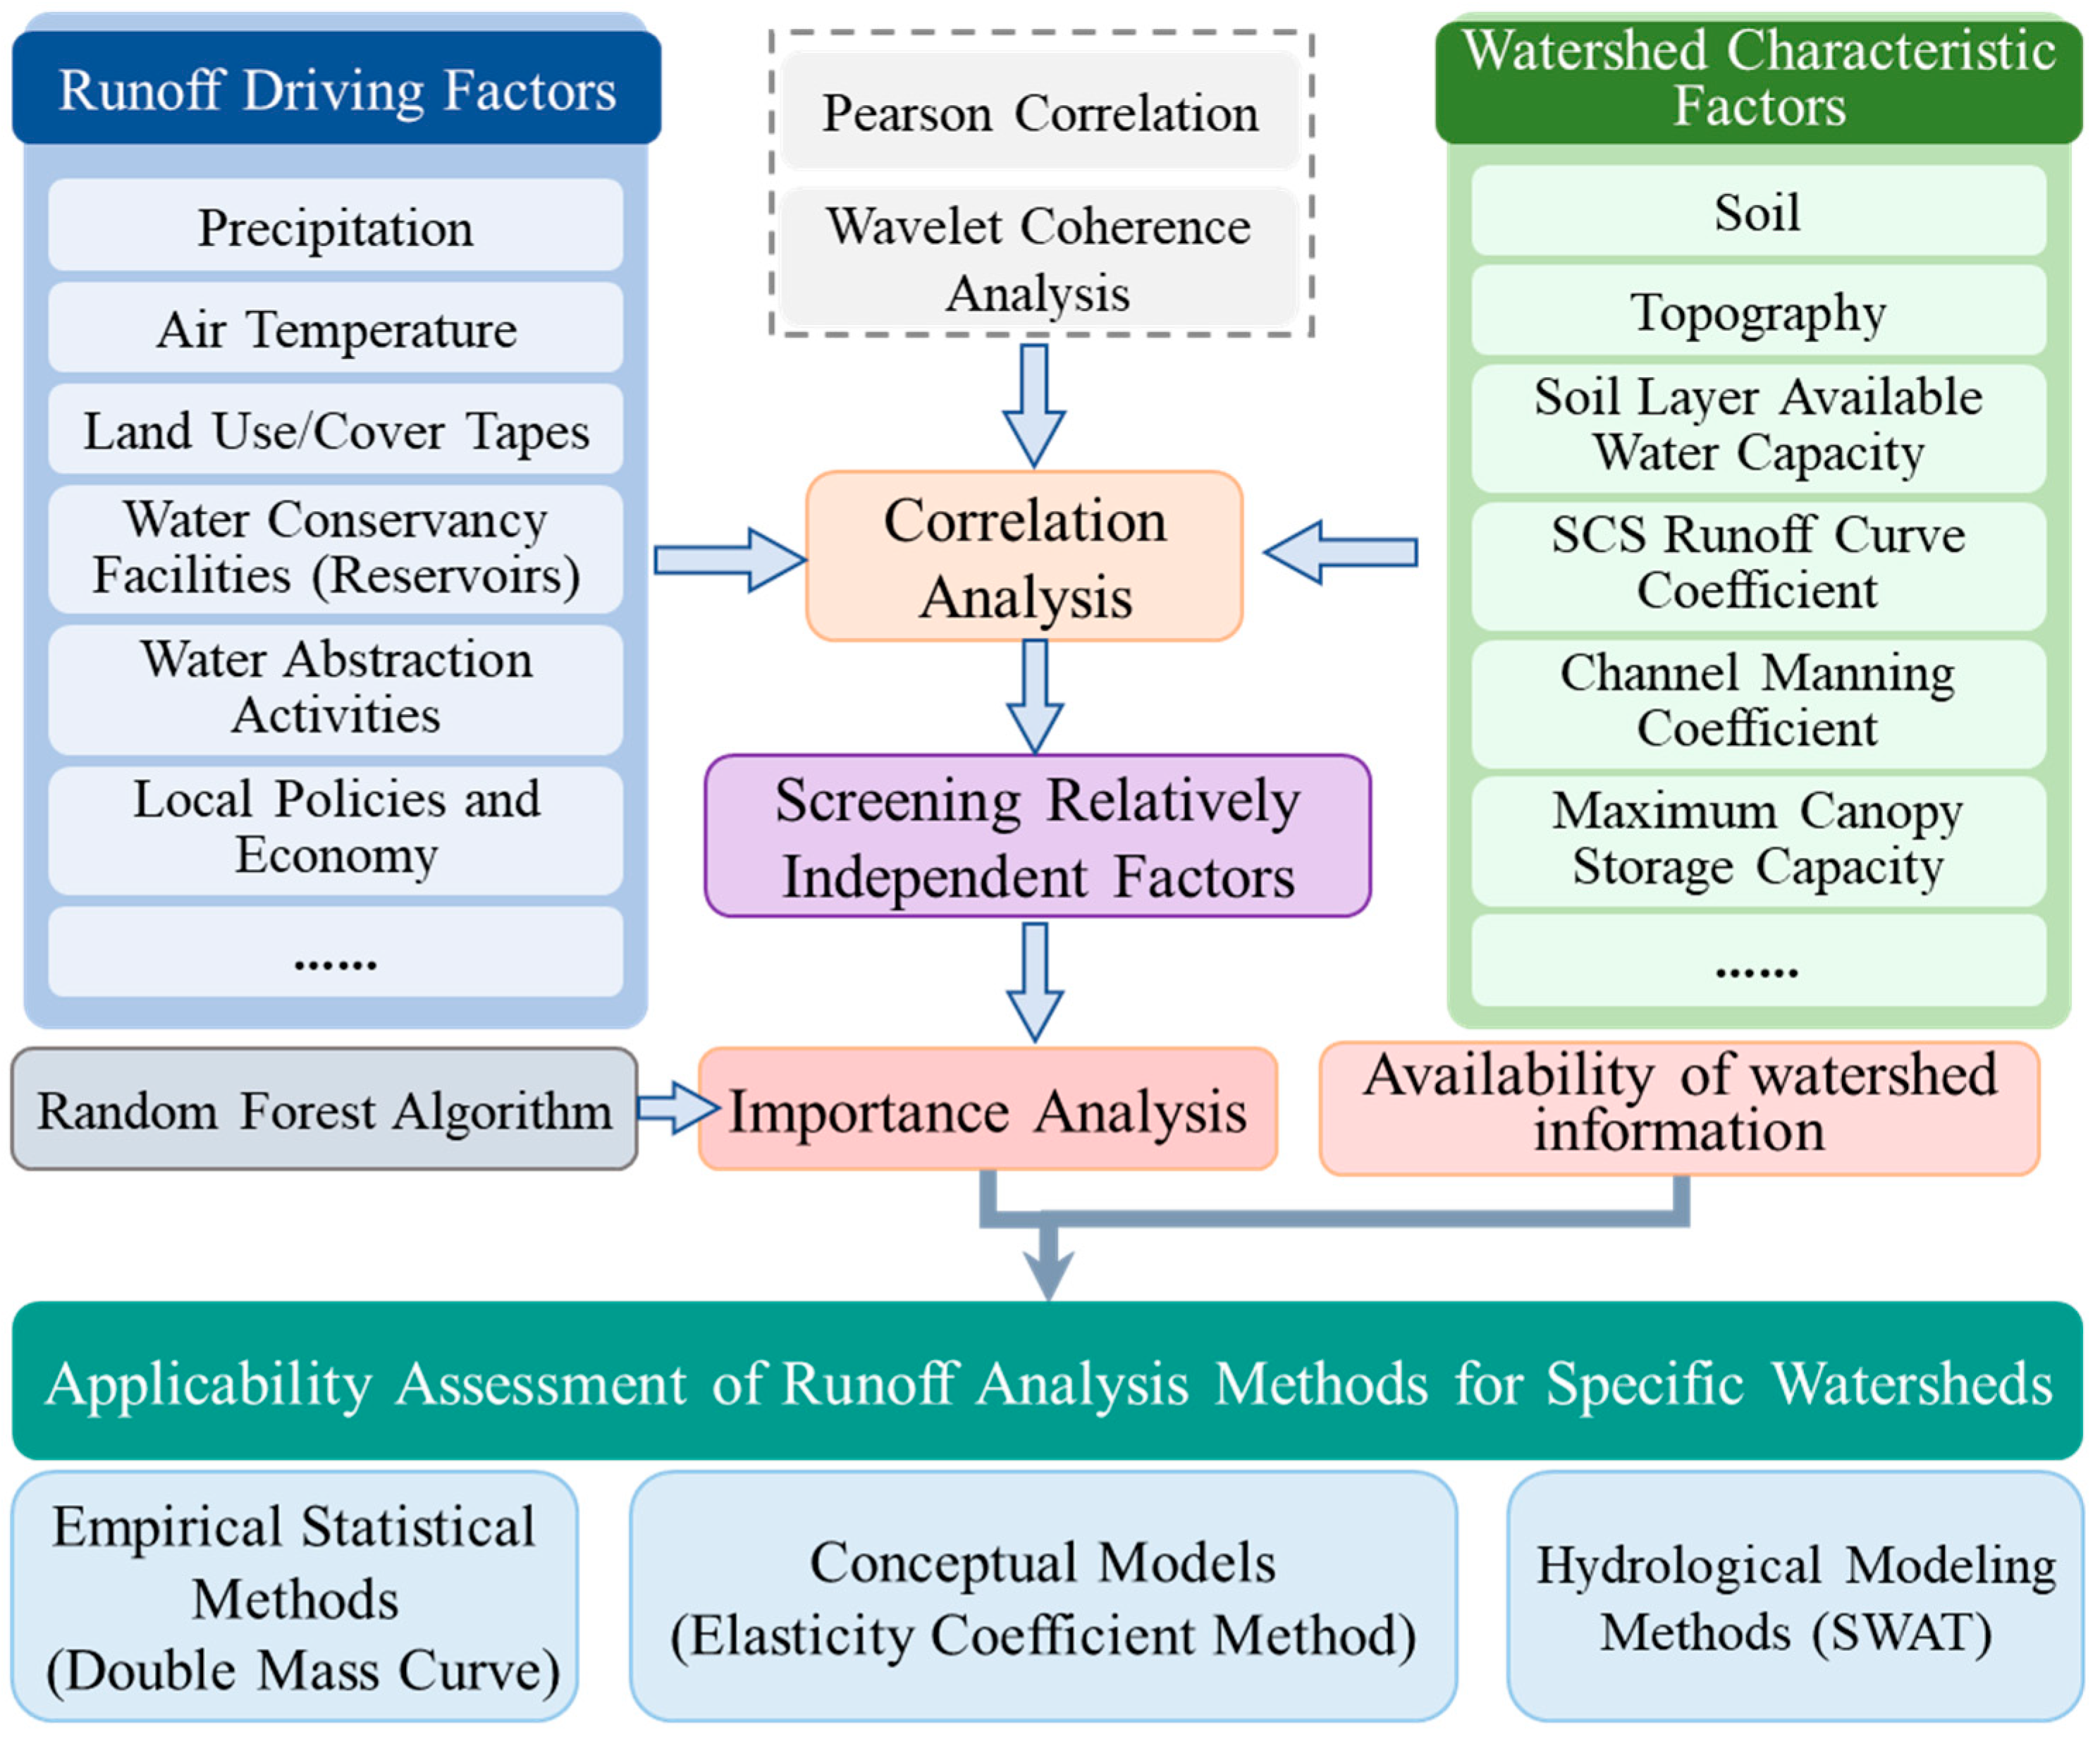
2.3.2. Framework for Adaptability Assessment of Runoff Change Attribution Methods
3. Results and Discussion
3.1. Delineation of Baseline and Change Periods
3.2. Precipitation–Runoff Double Mass Curve
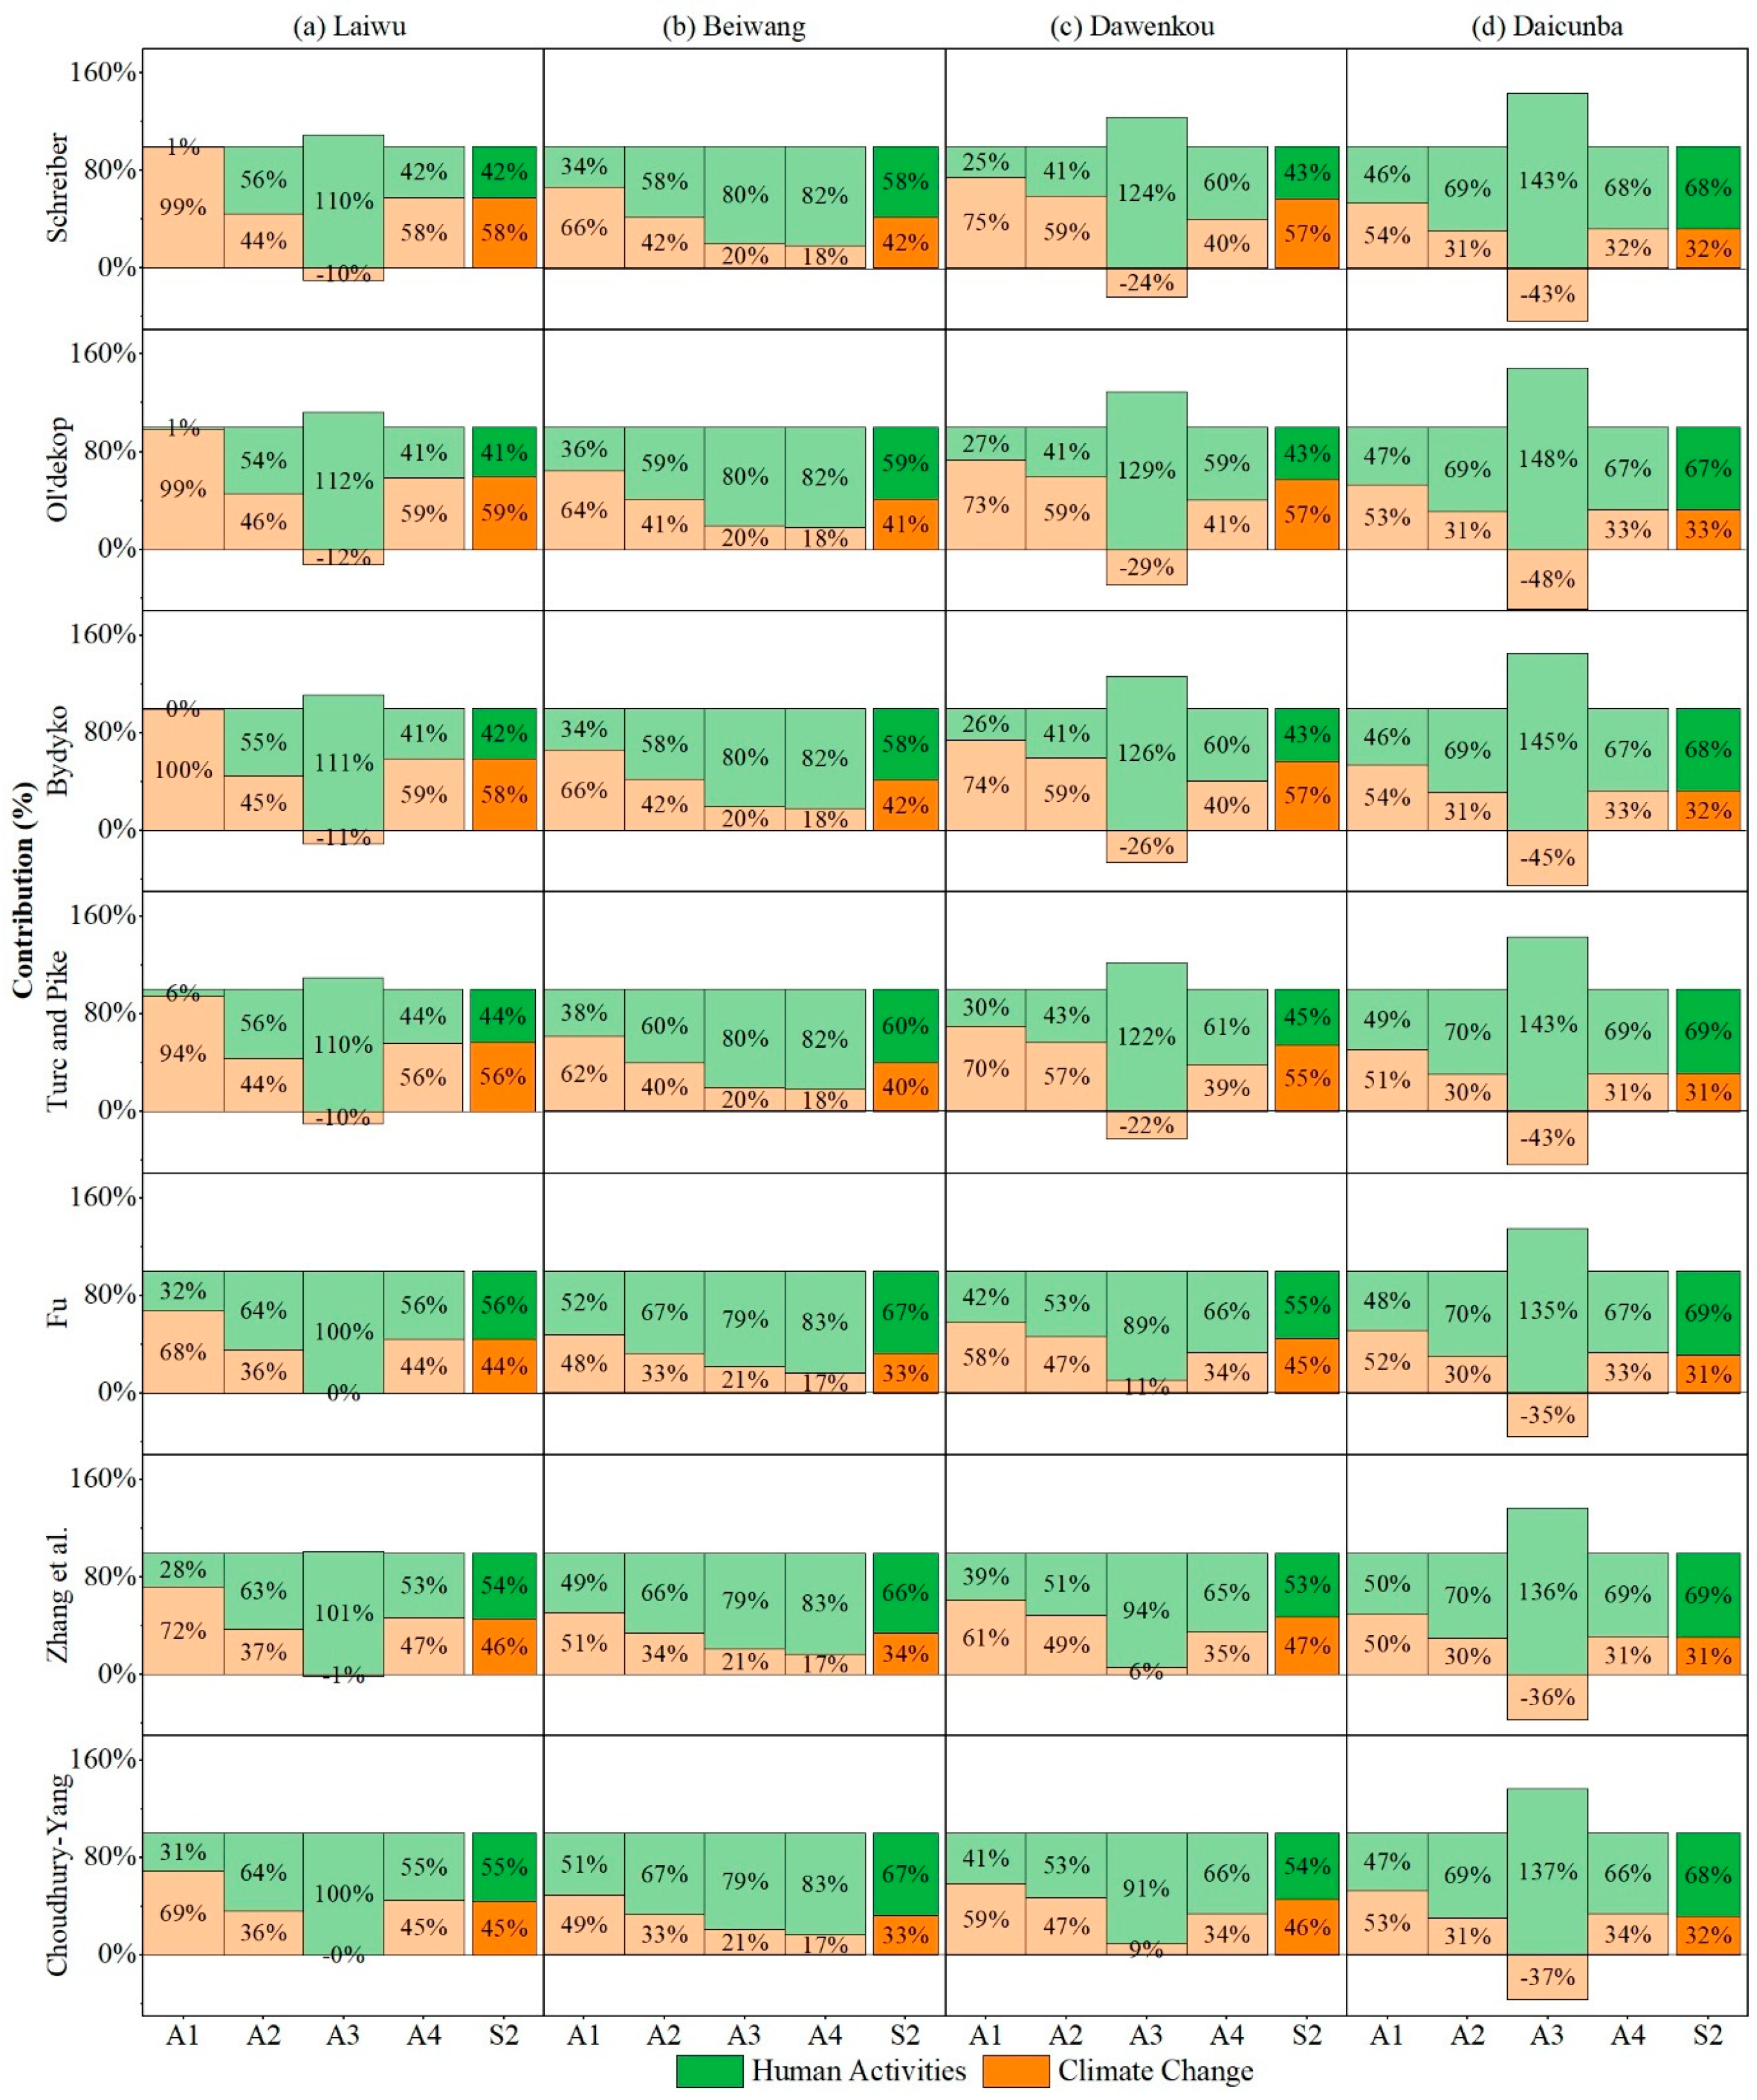
3.3. Elasticity Coefficient Method
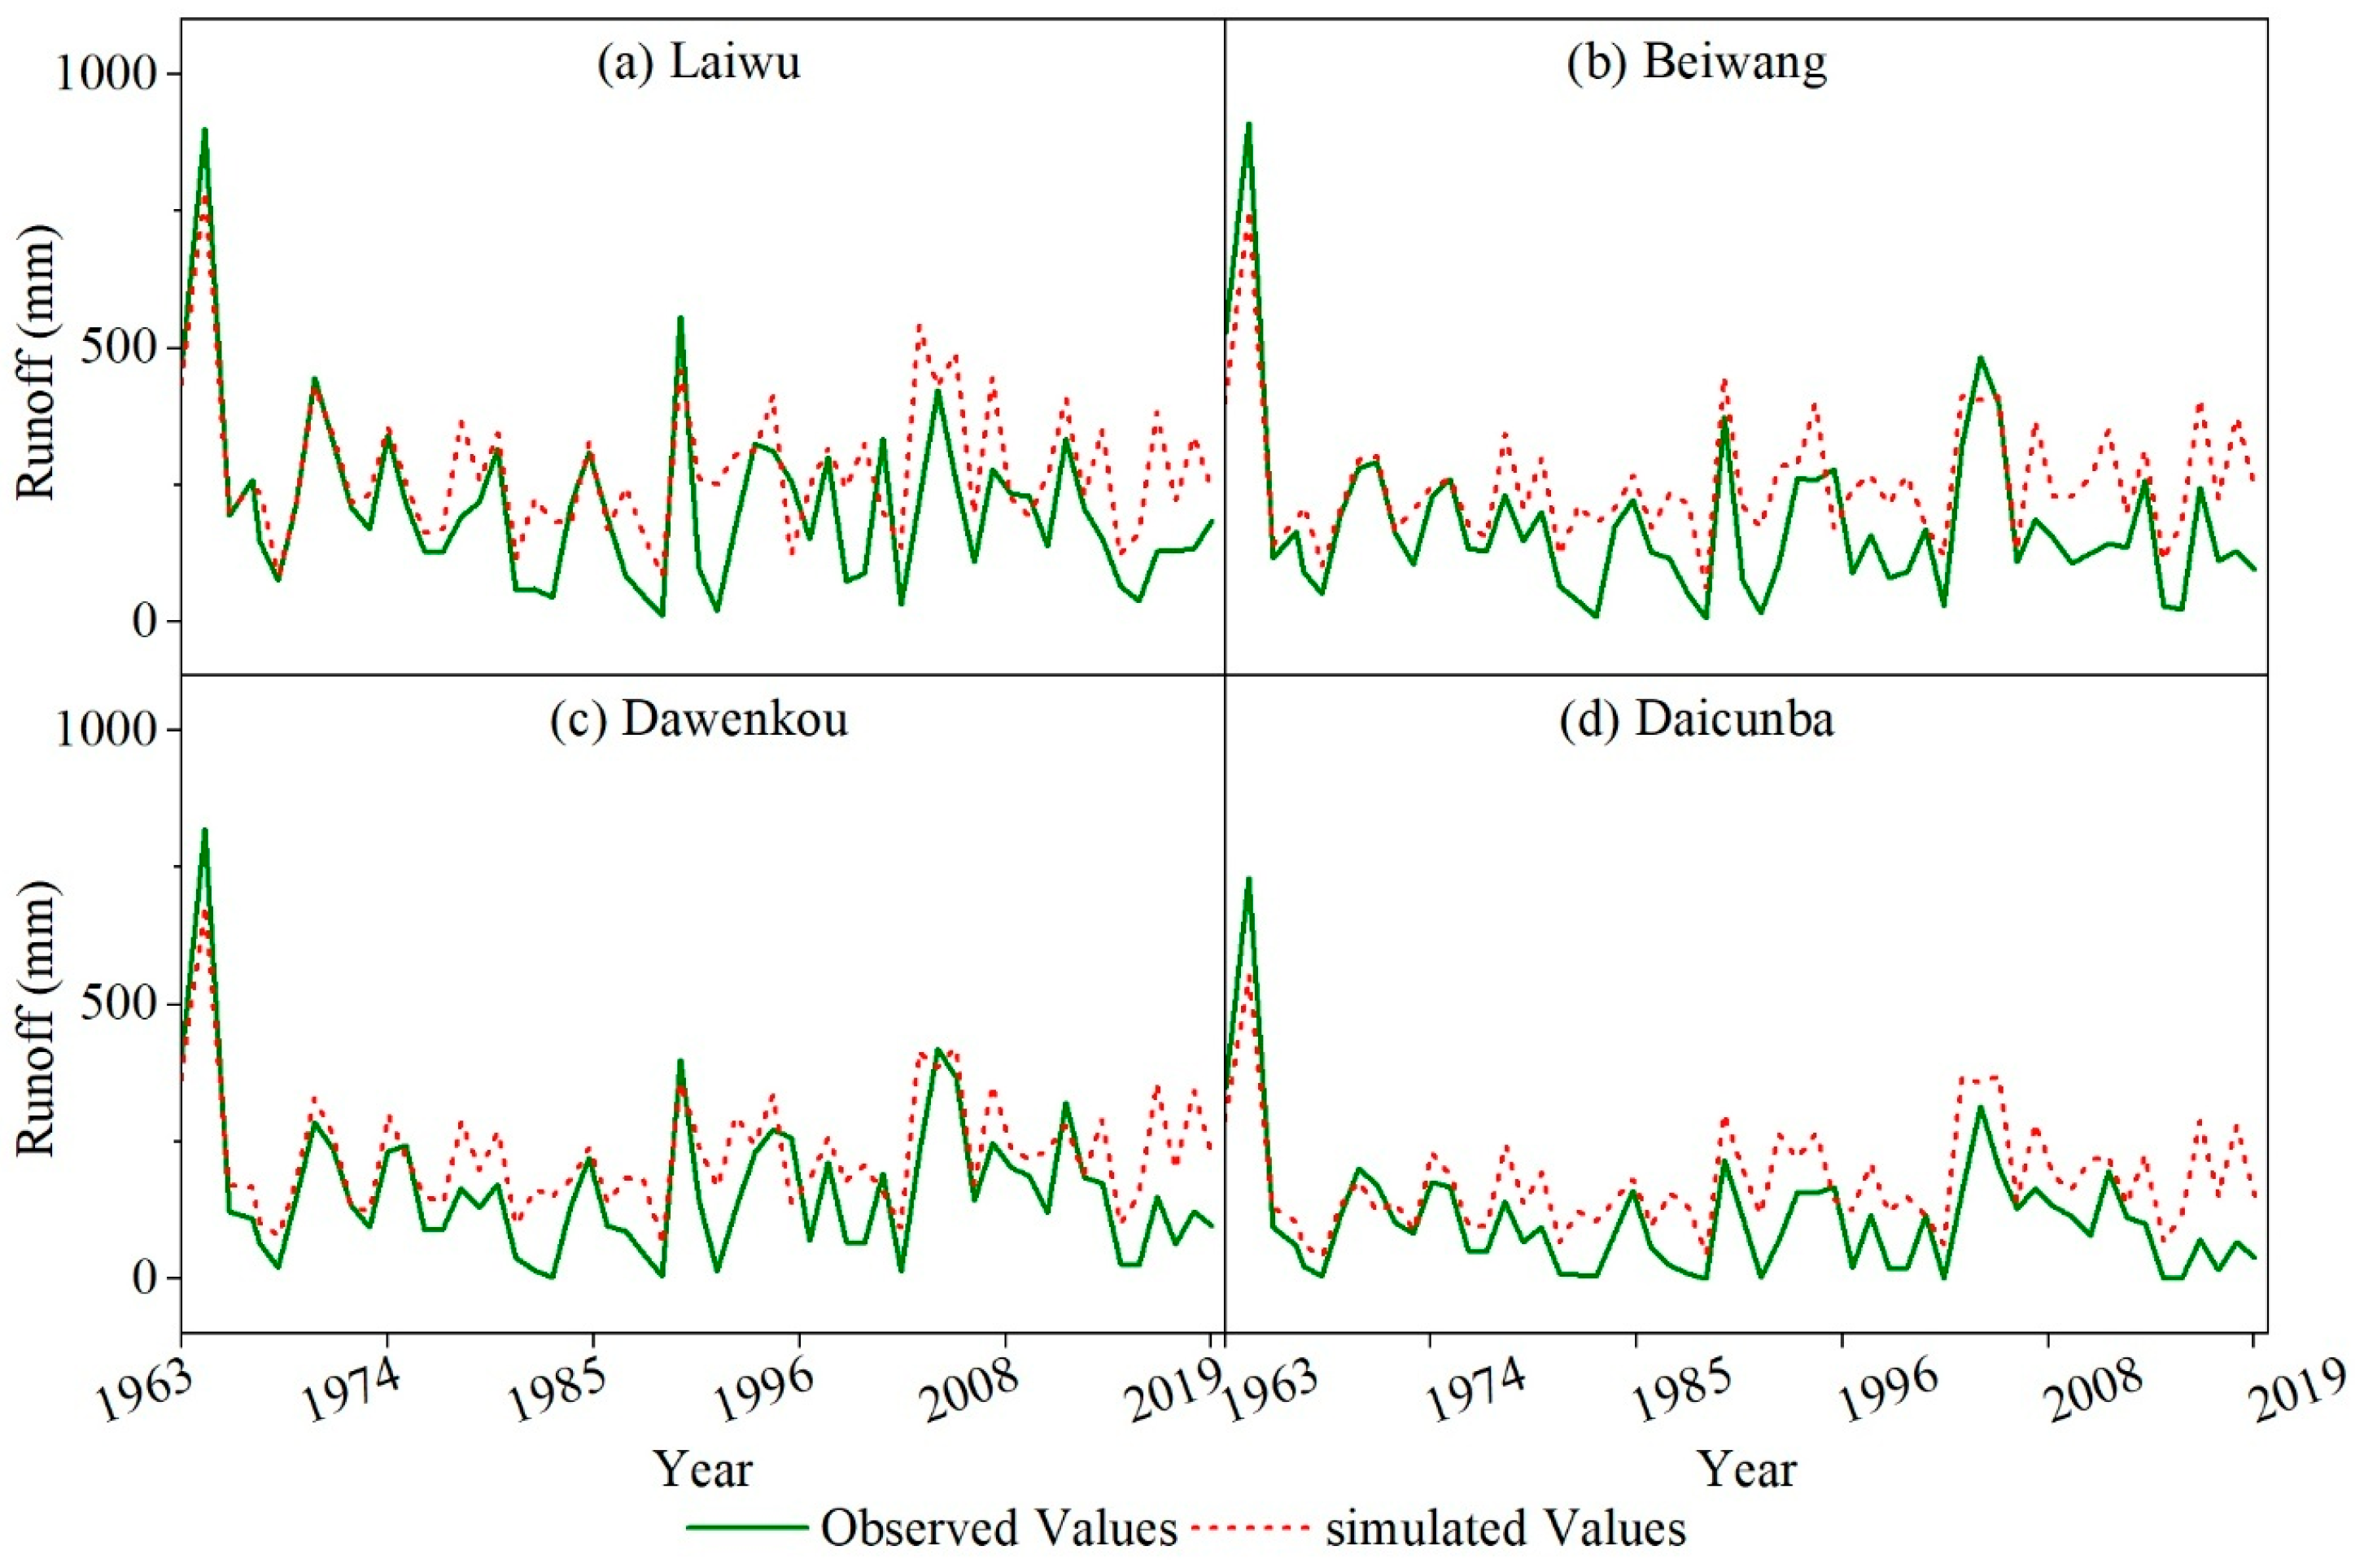
3.4. Hydrological Model
- (1)
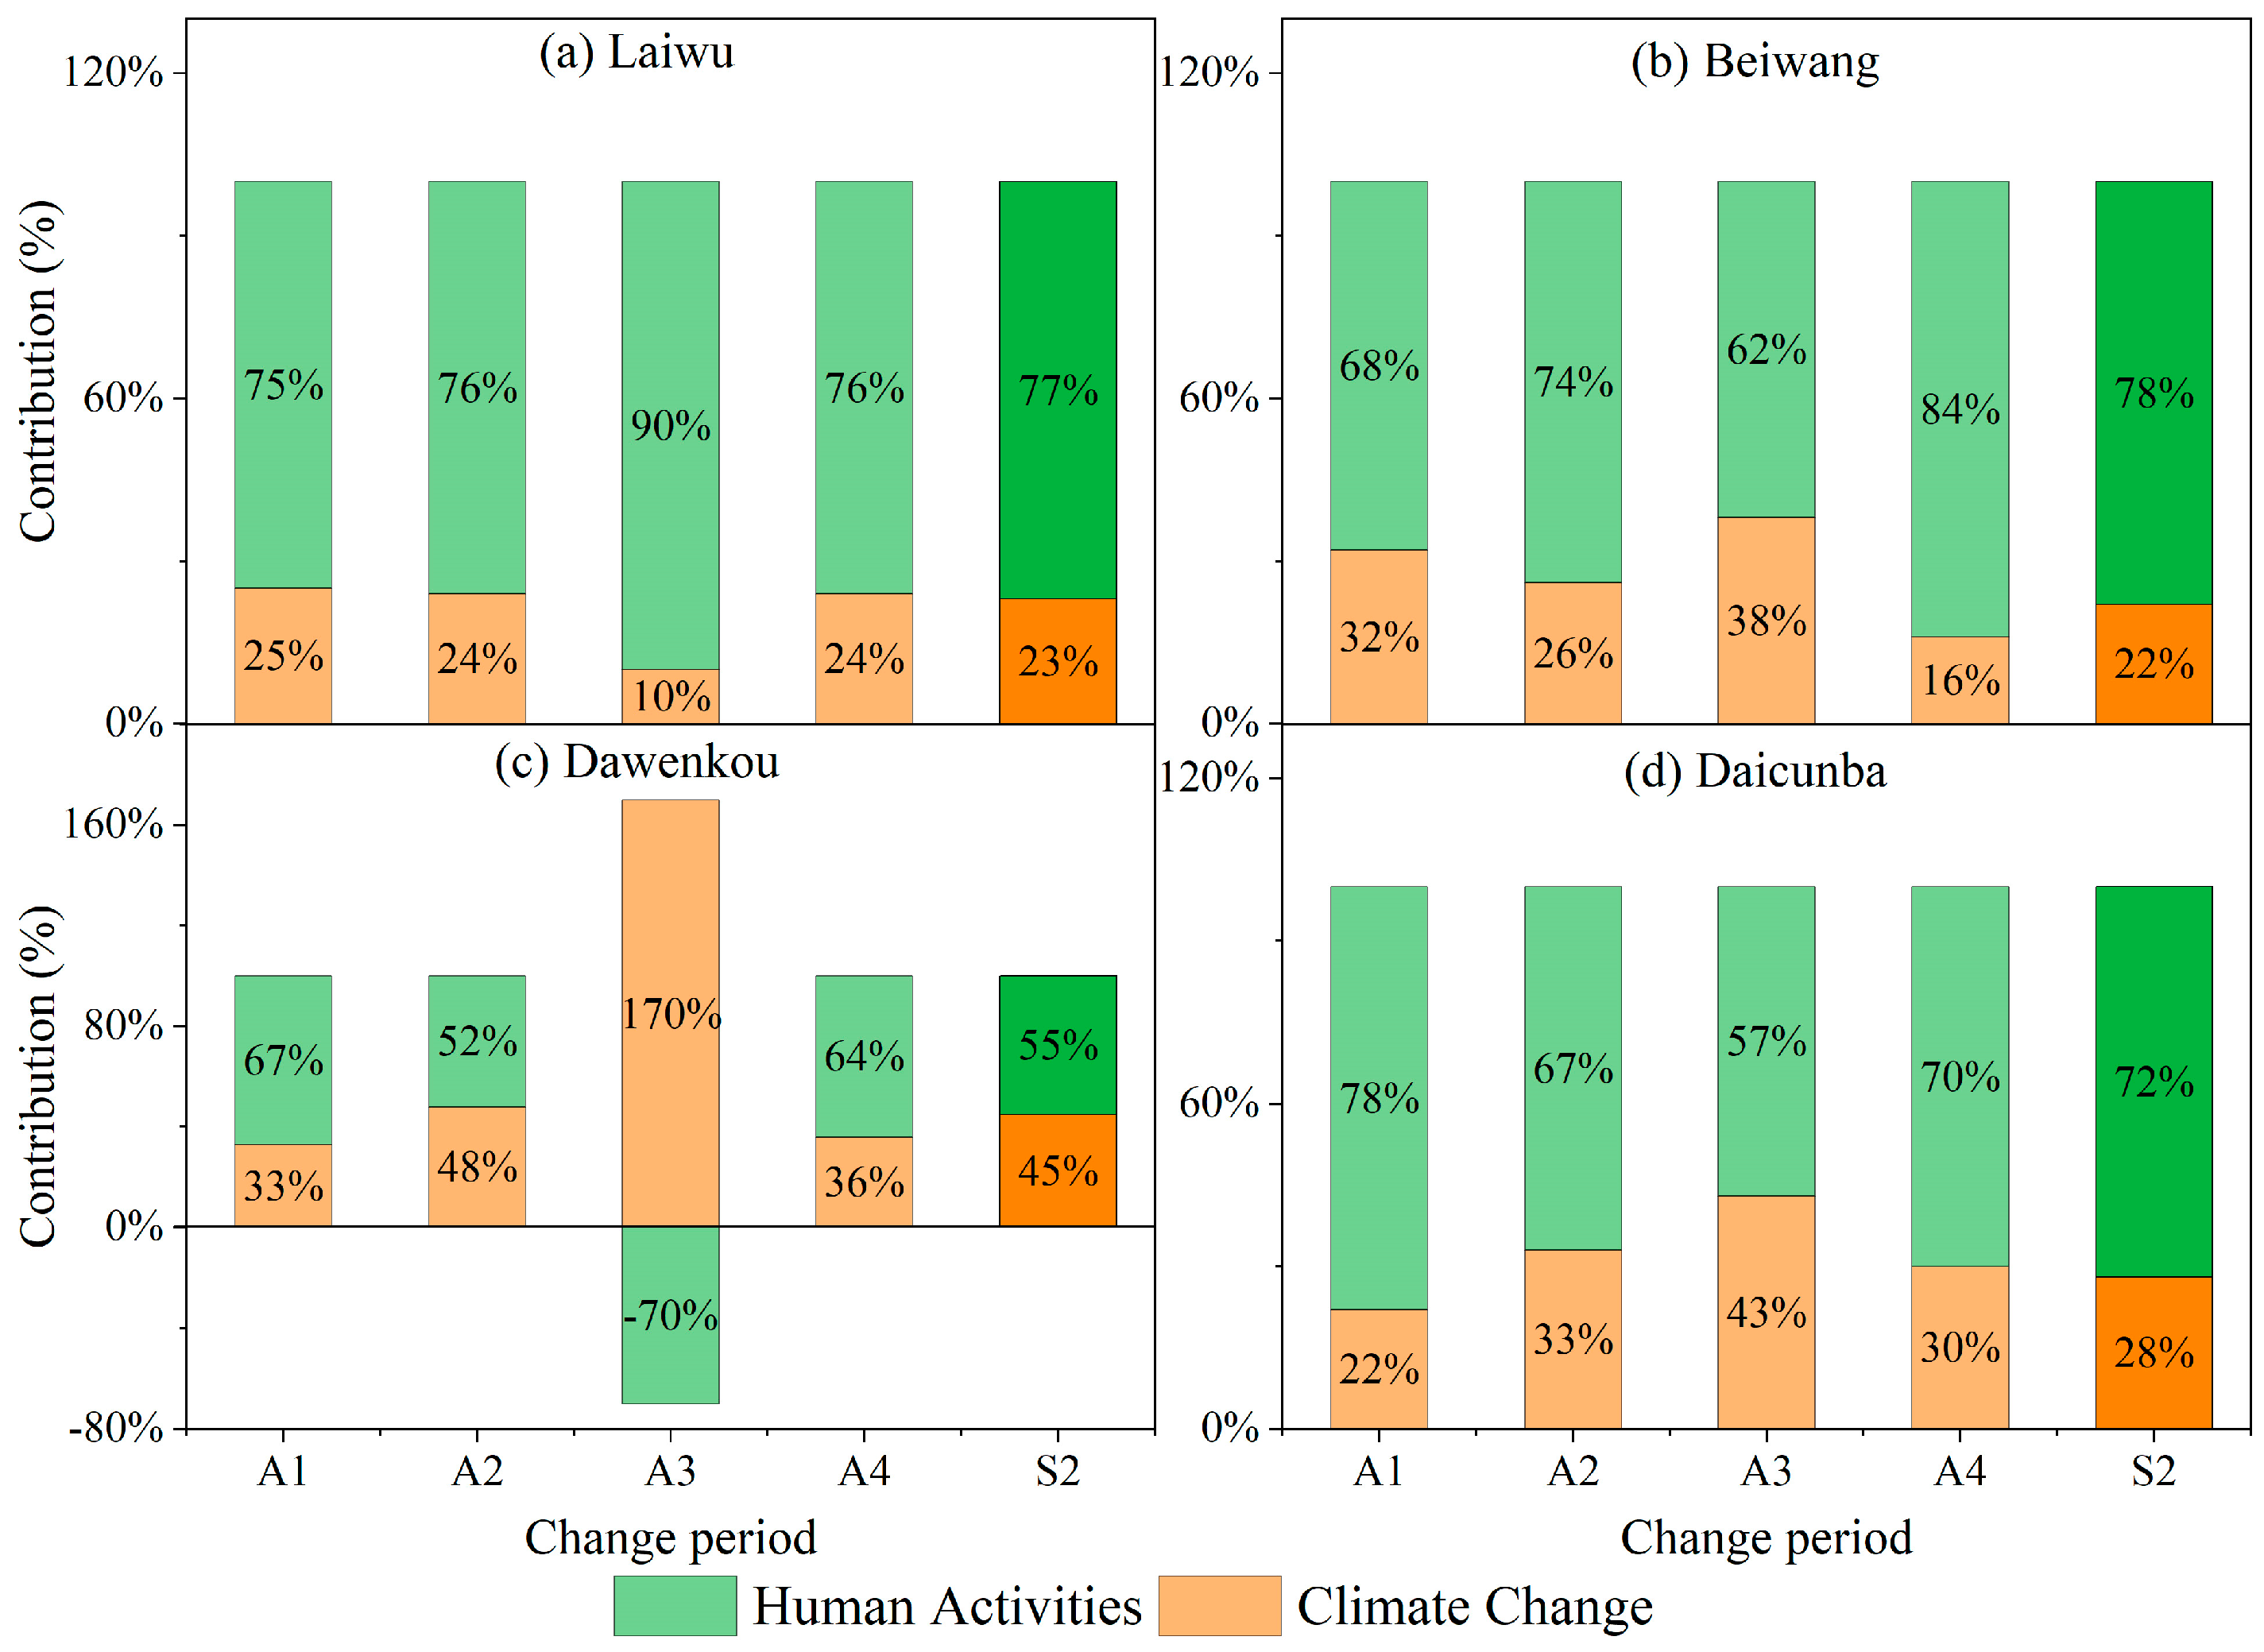
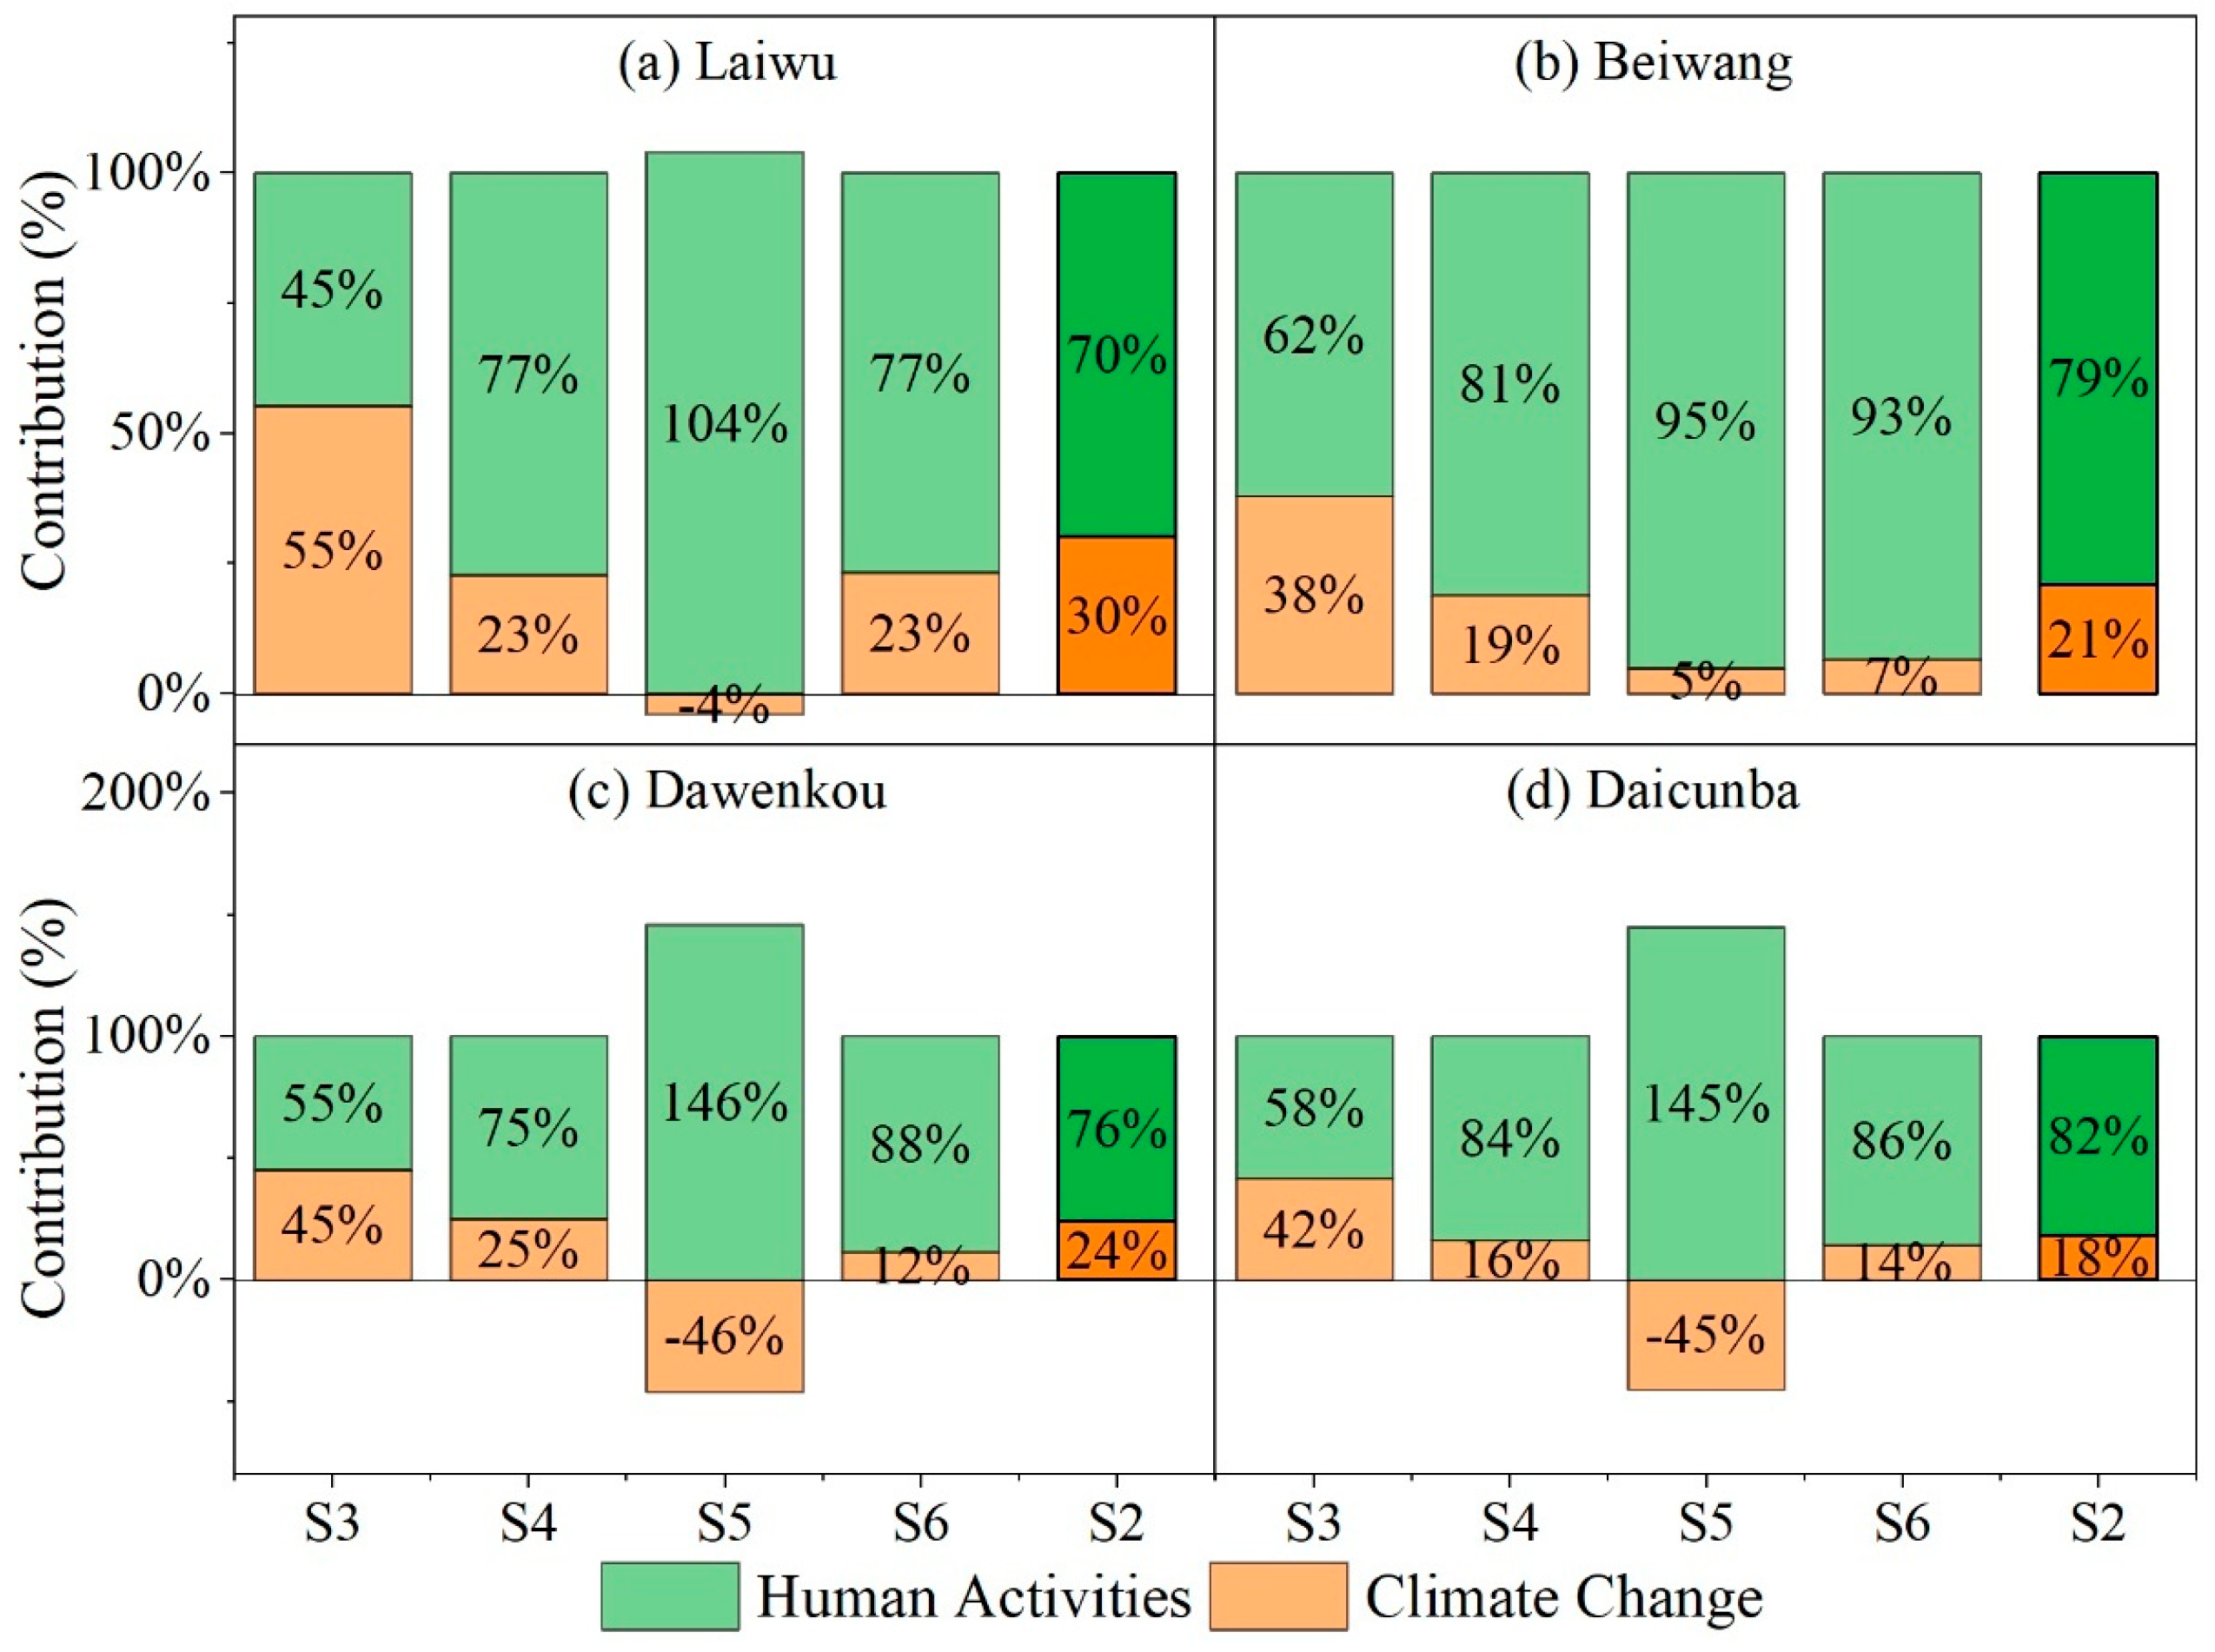
- Separation of Climate Change and Human Activity Contributions to Runoff Changes
- (2)
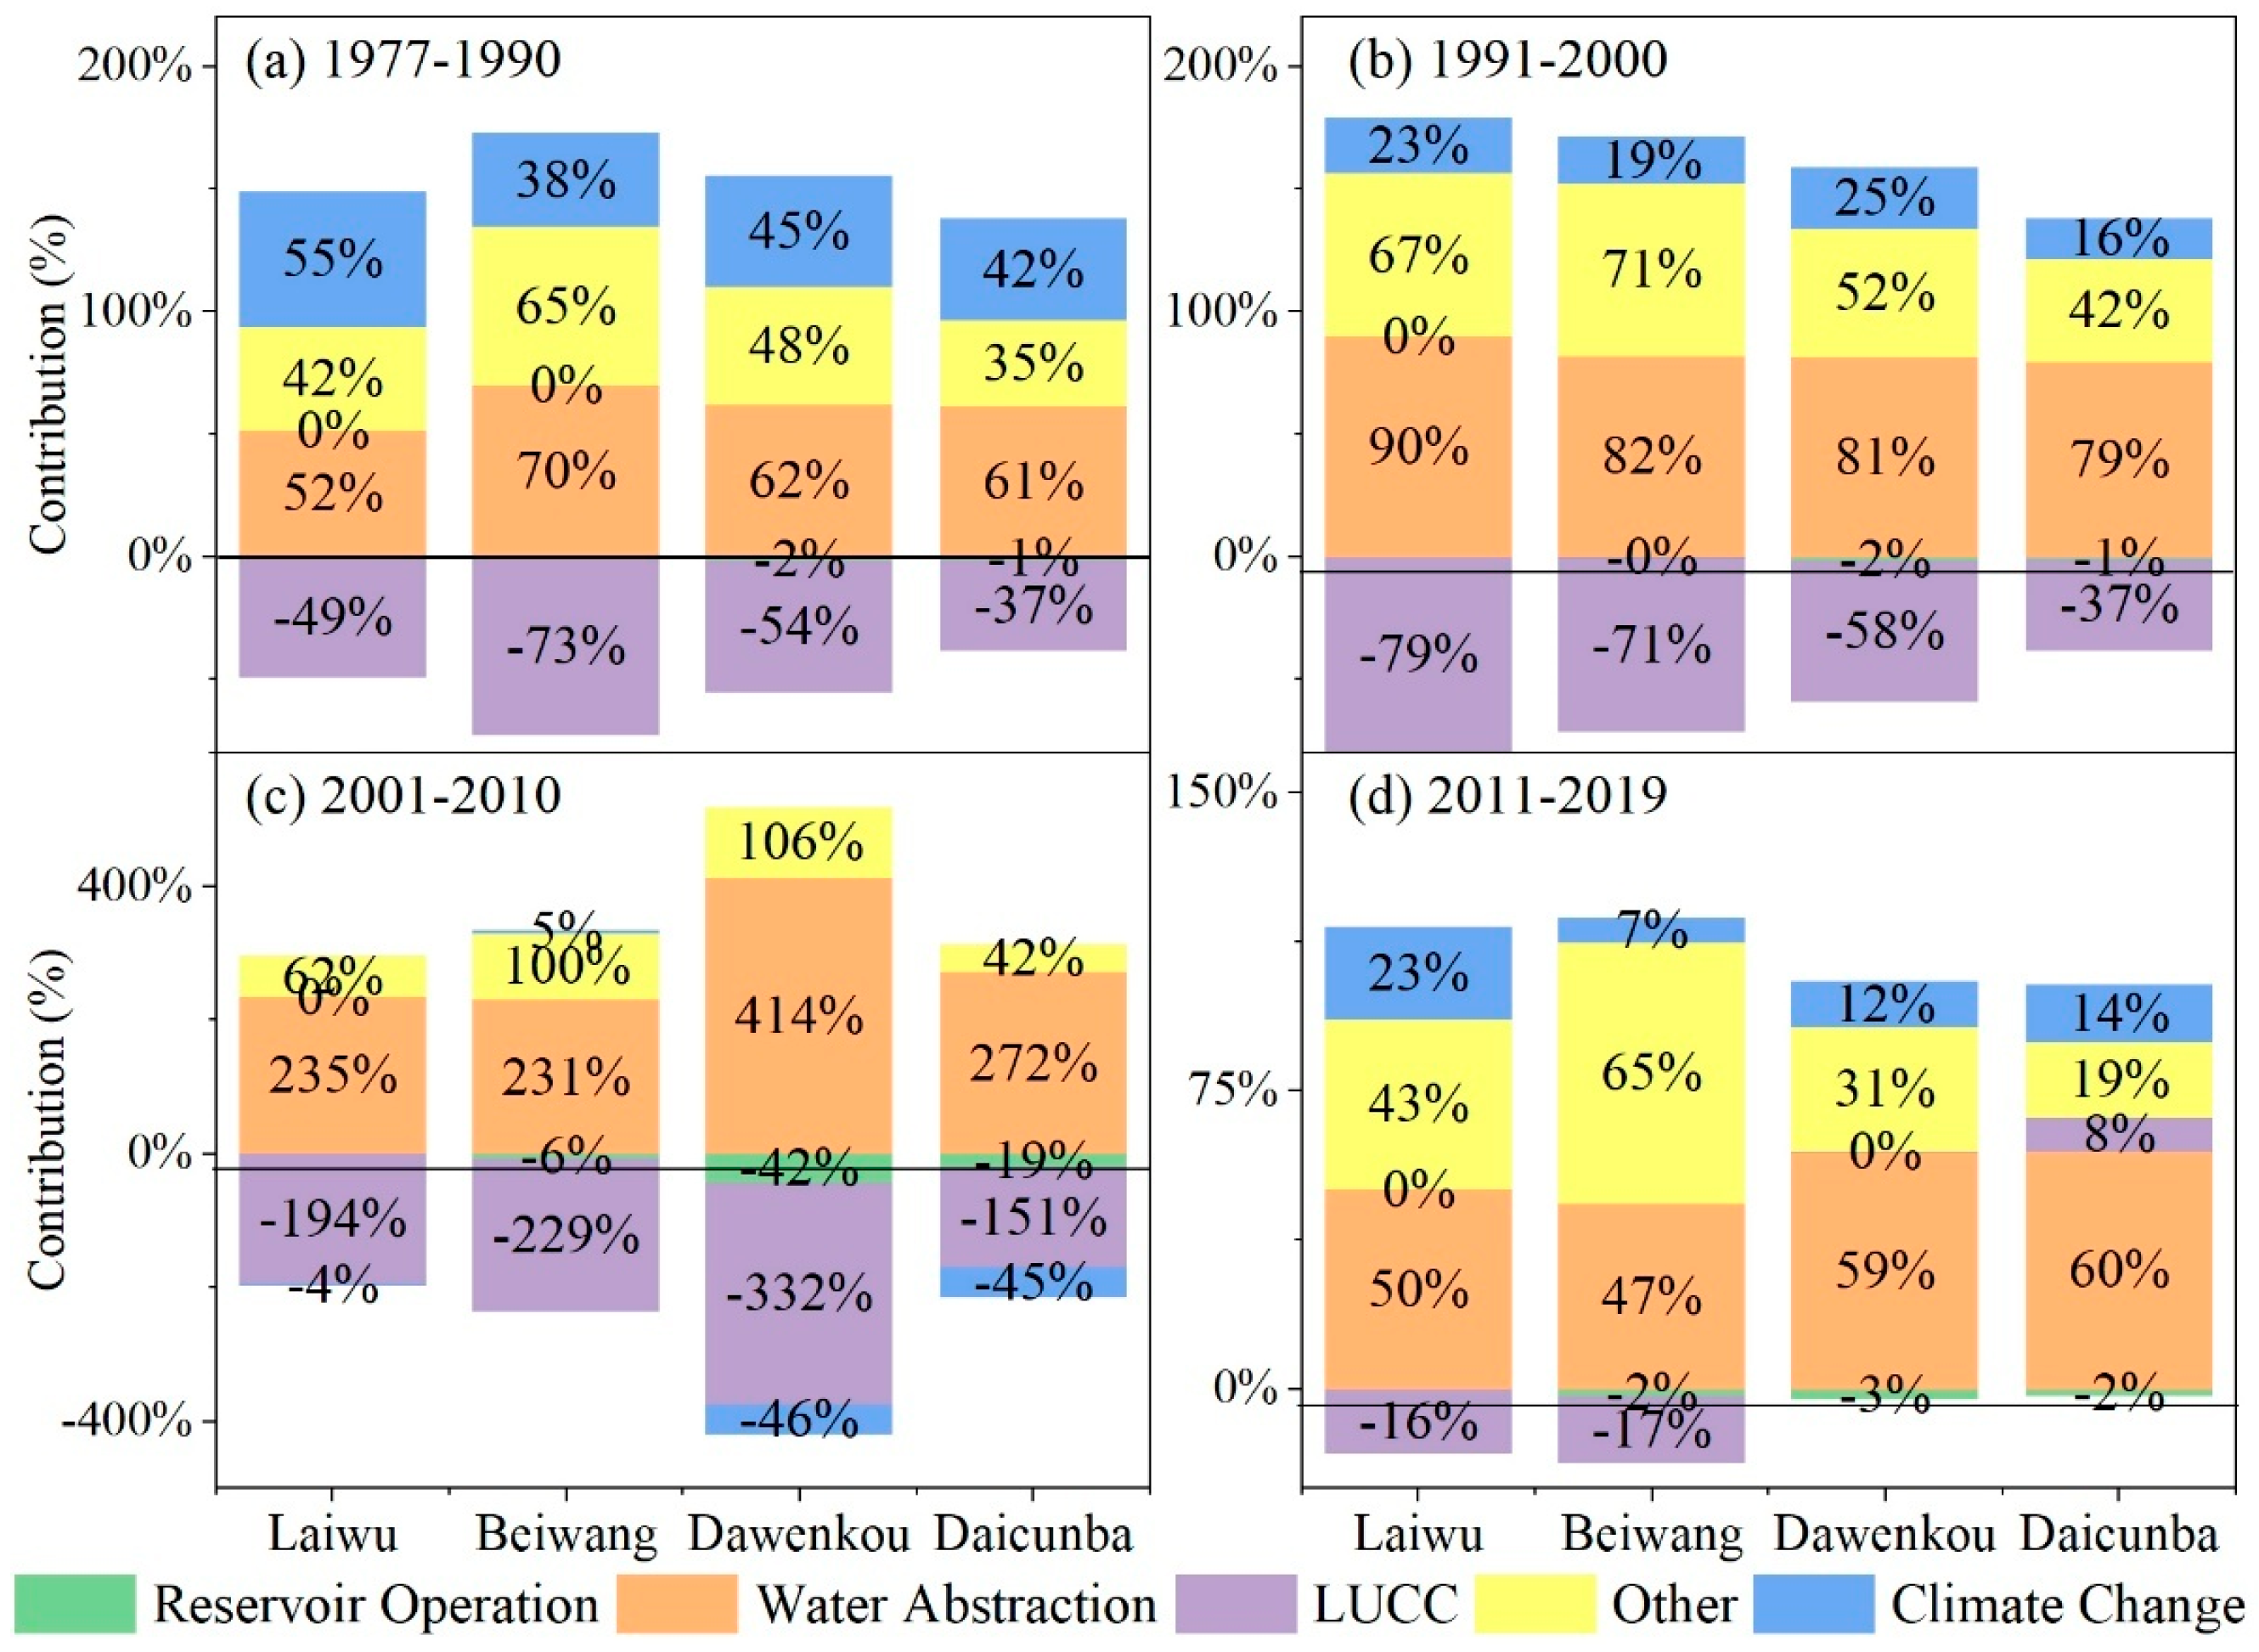
- Separation of Human Activity-Specific Contributions to Runoff Changes
3.5. Integrated Comparison of Tri-Method Results
3.6. Methodological Adaptation Framework for Runoff Attribution in Specific Basins
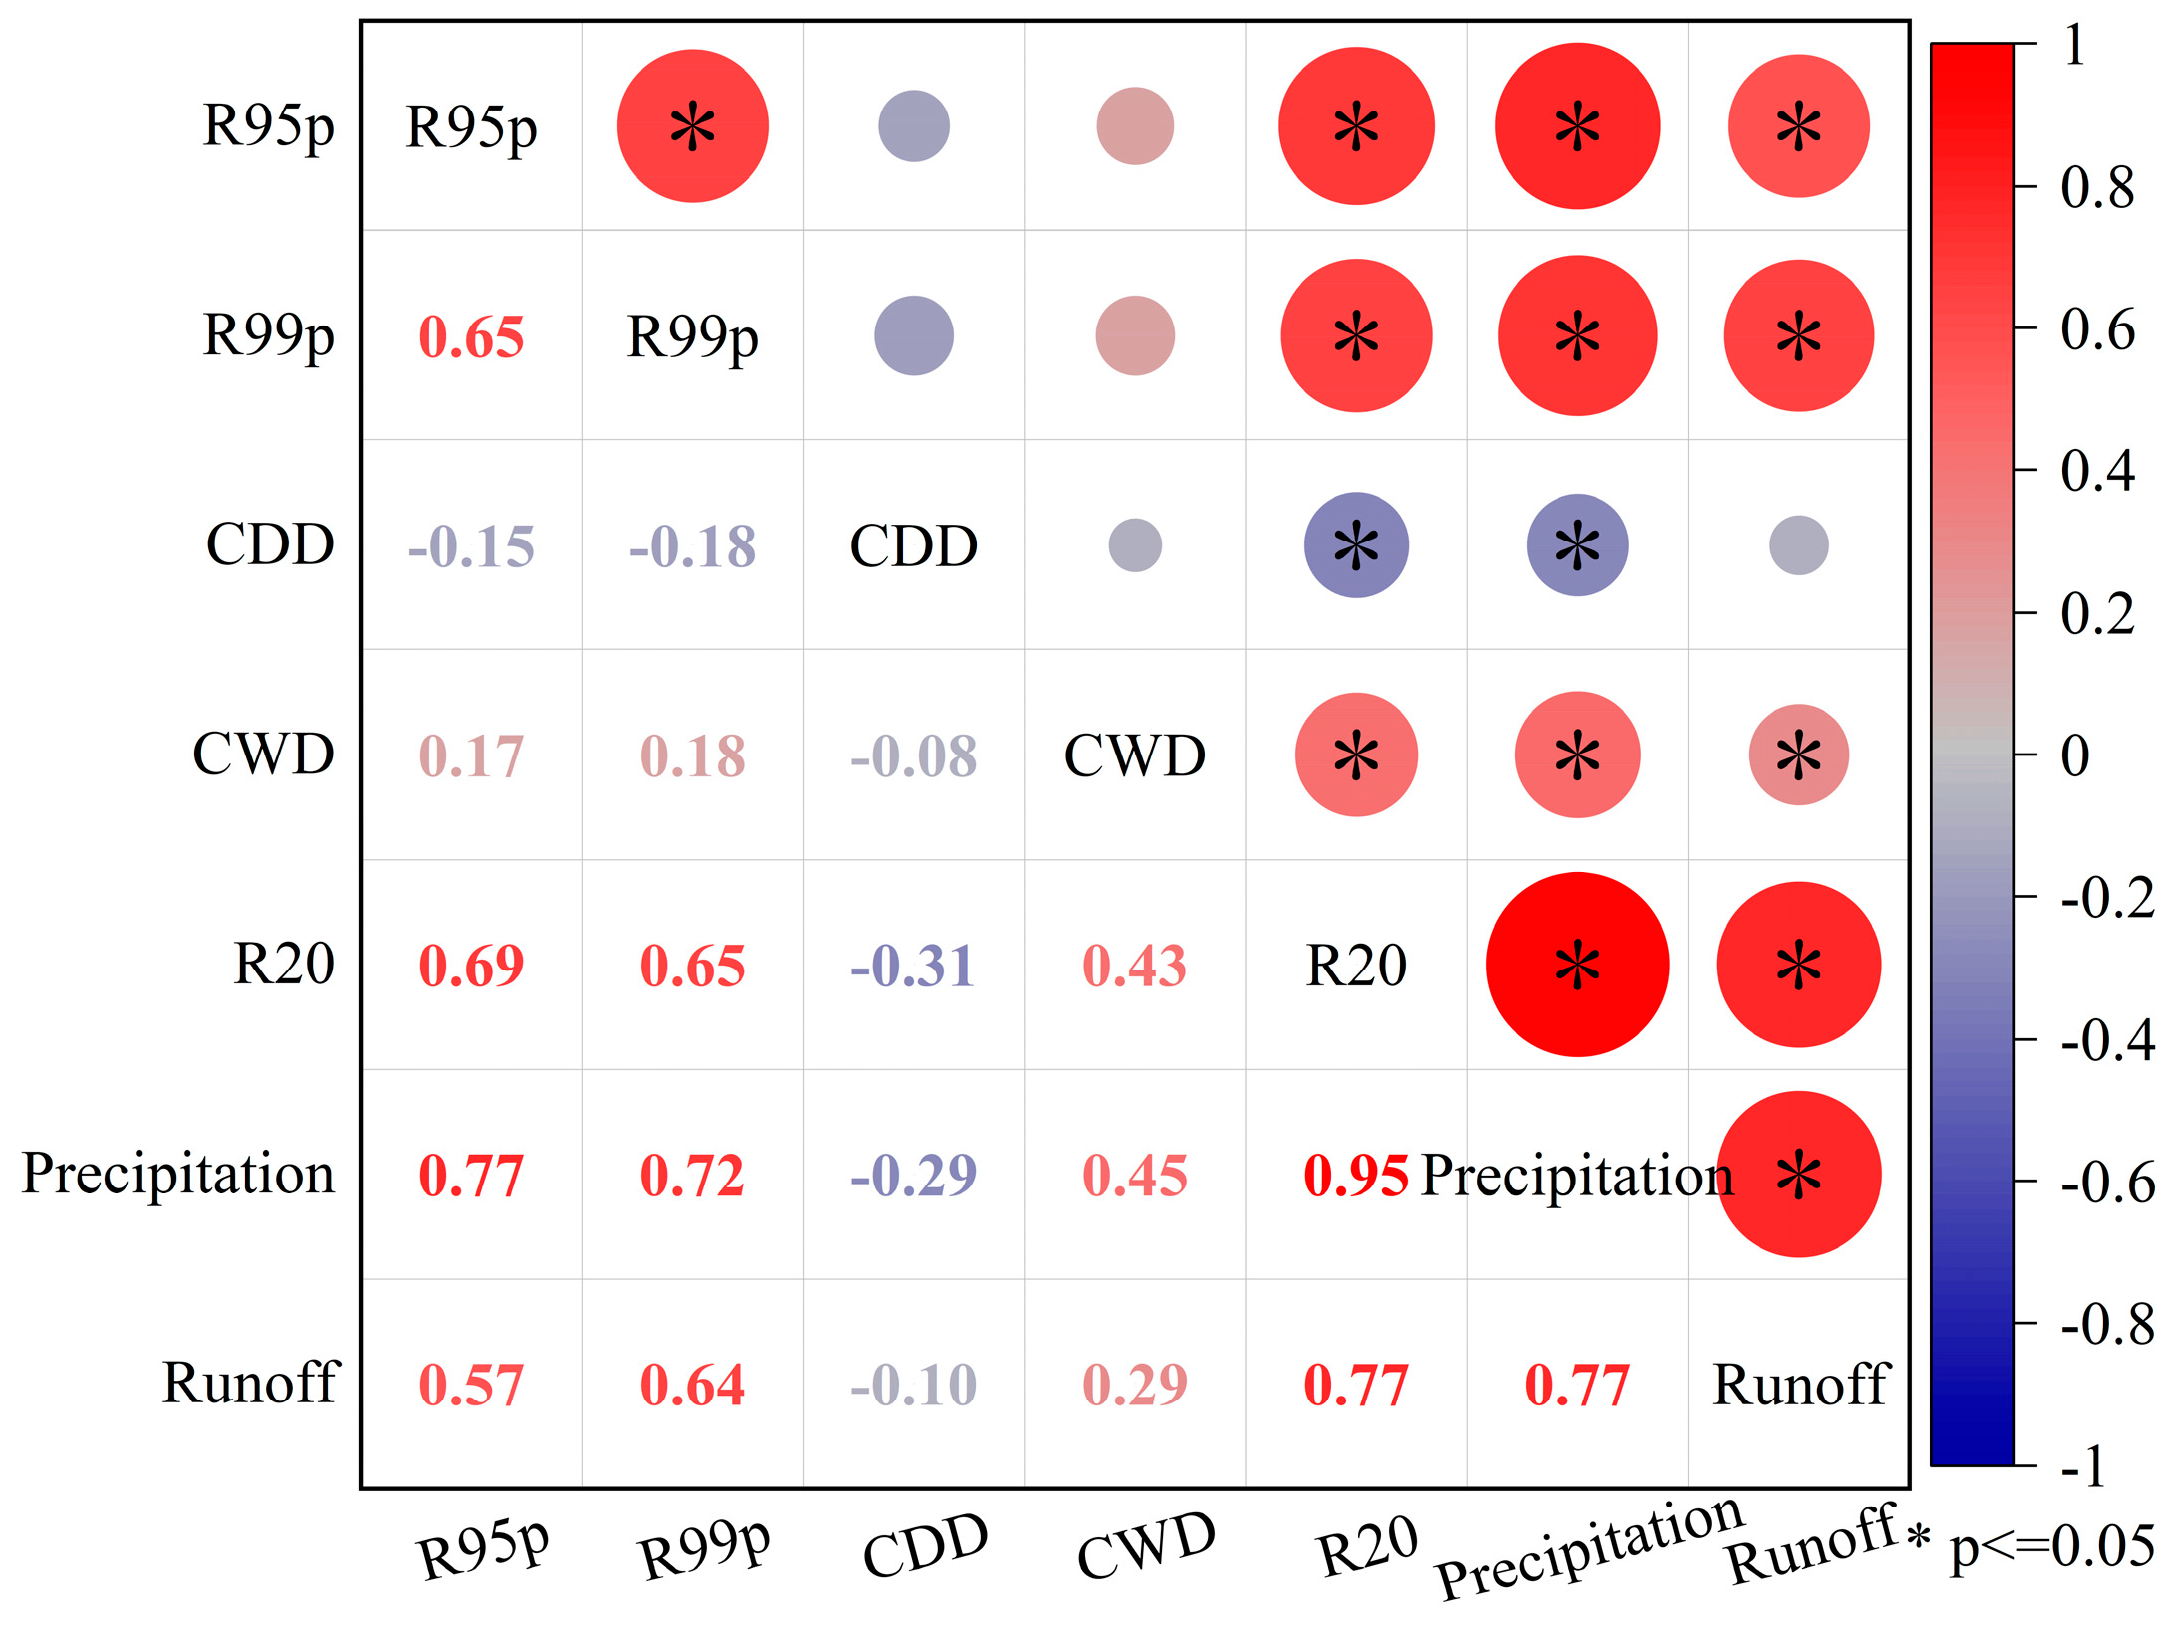
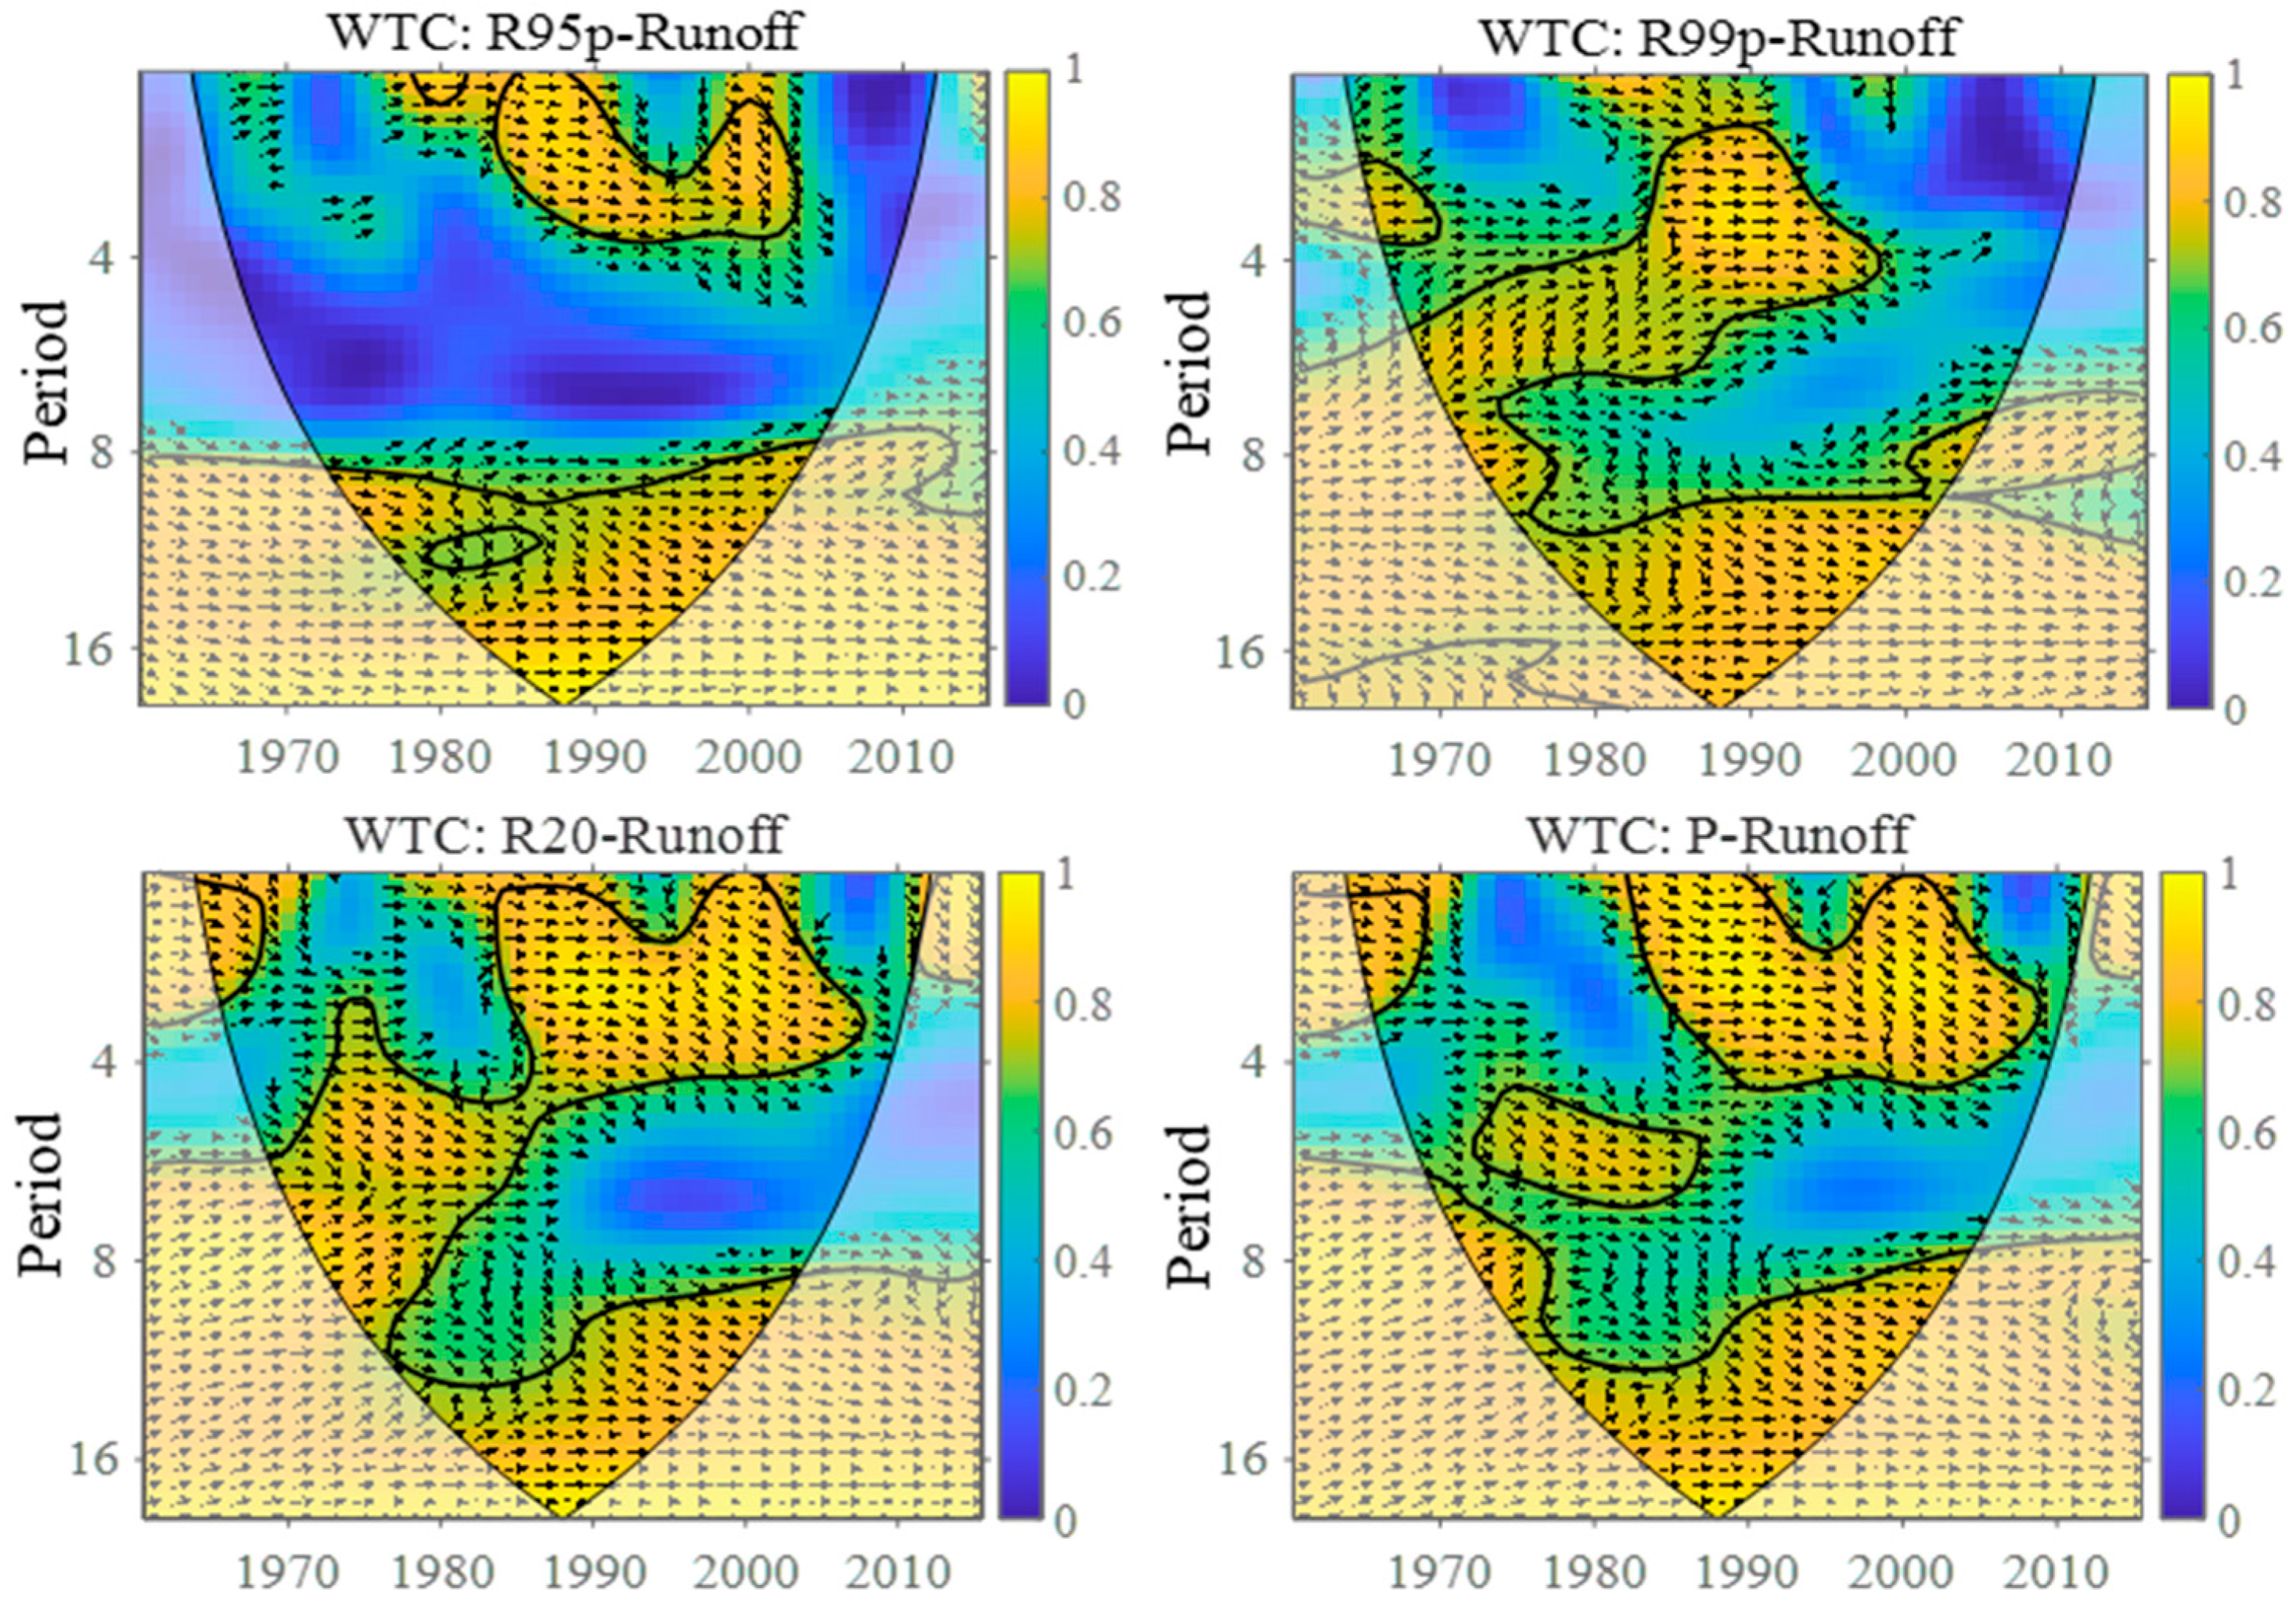
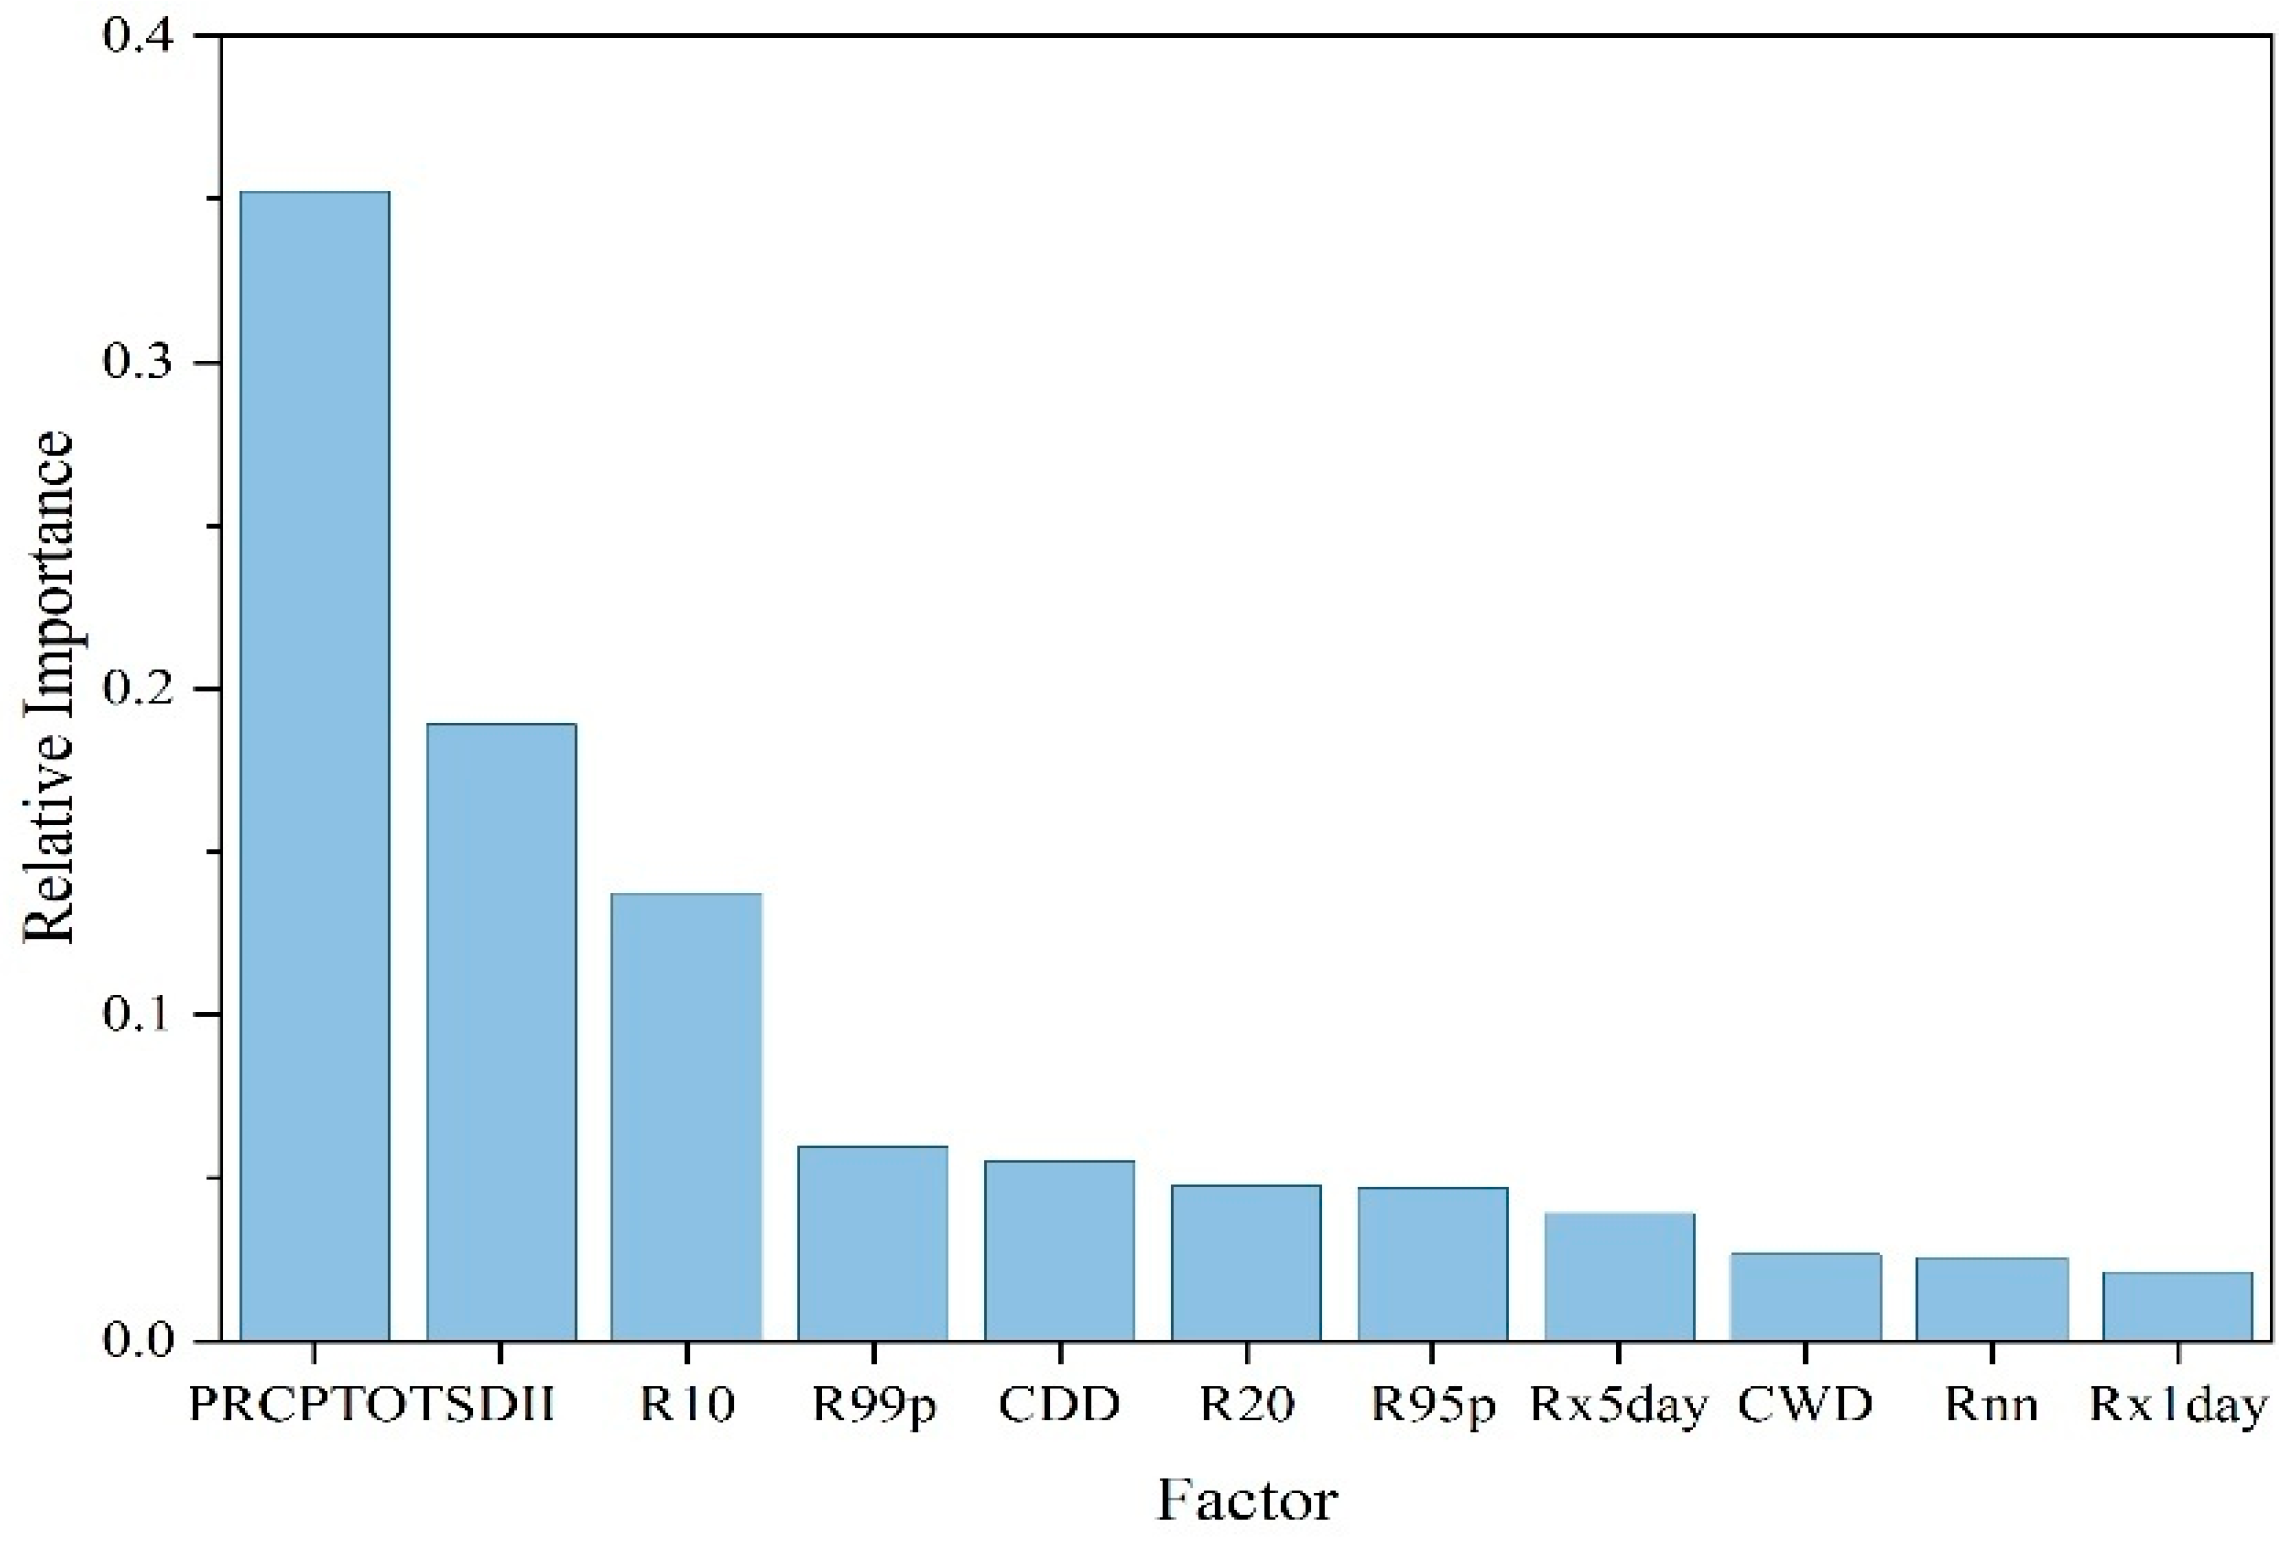
3.6.1. Identification of Runoff Change Drivers
- (1)
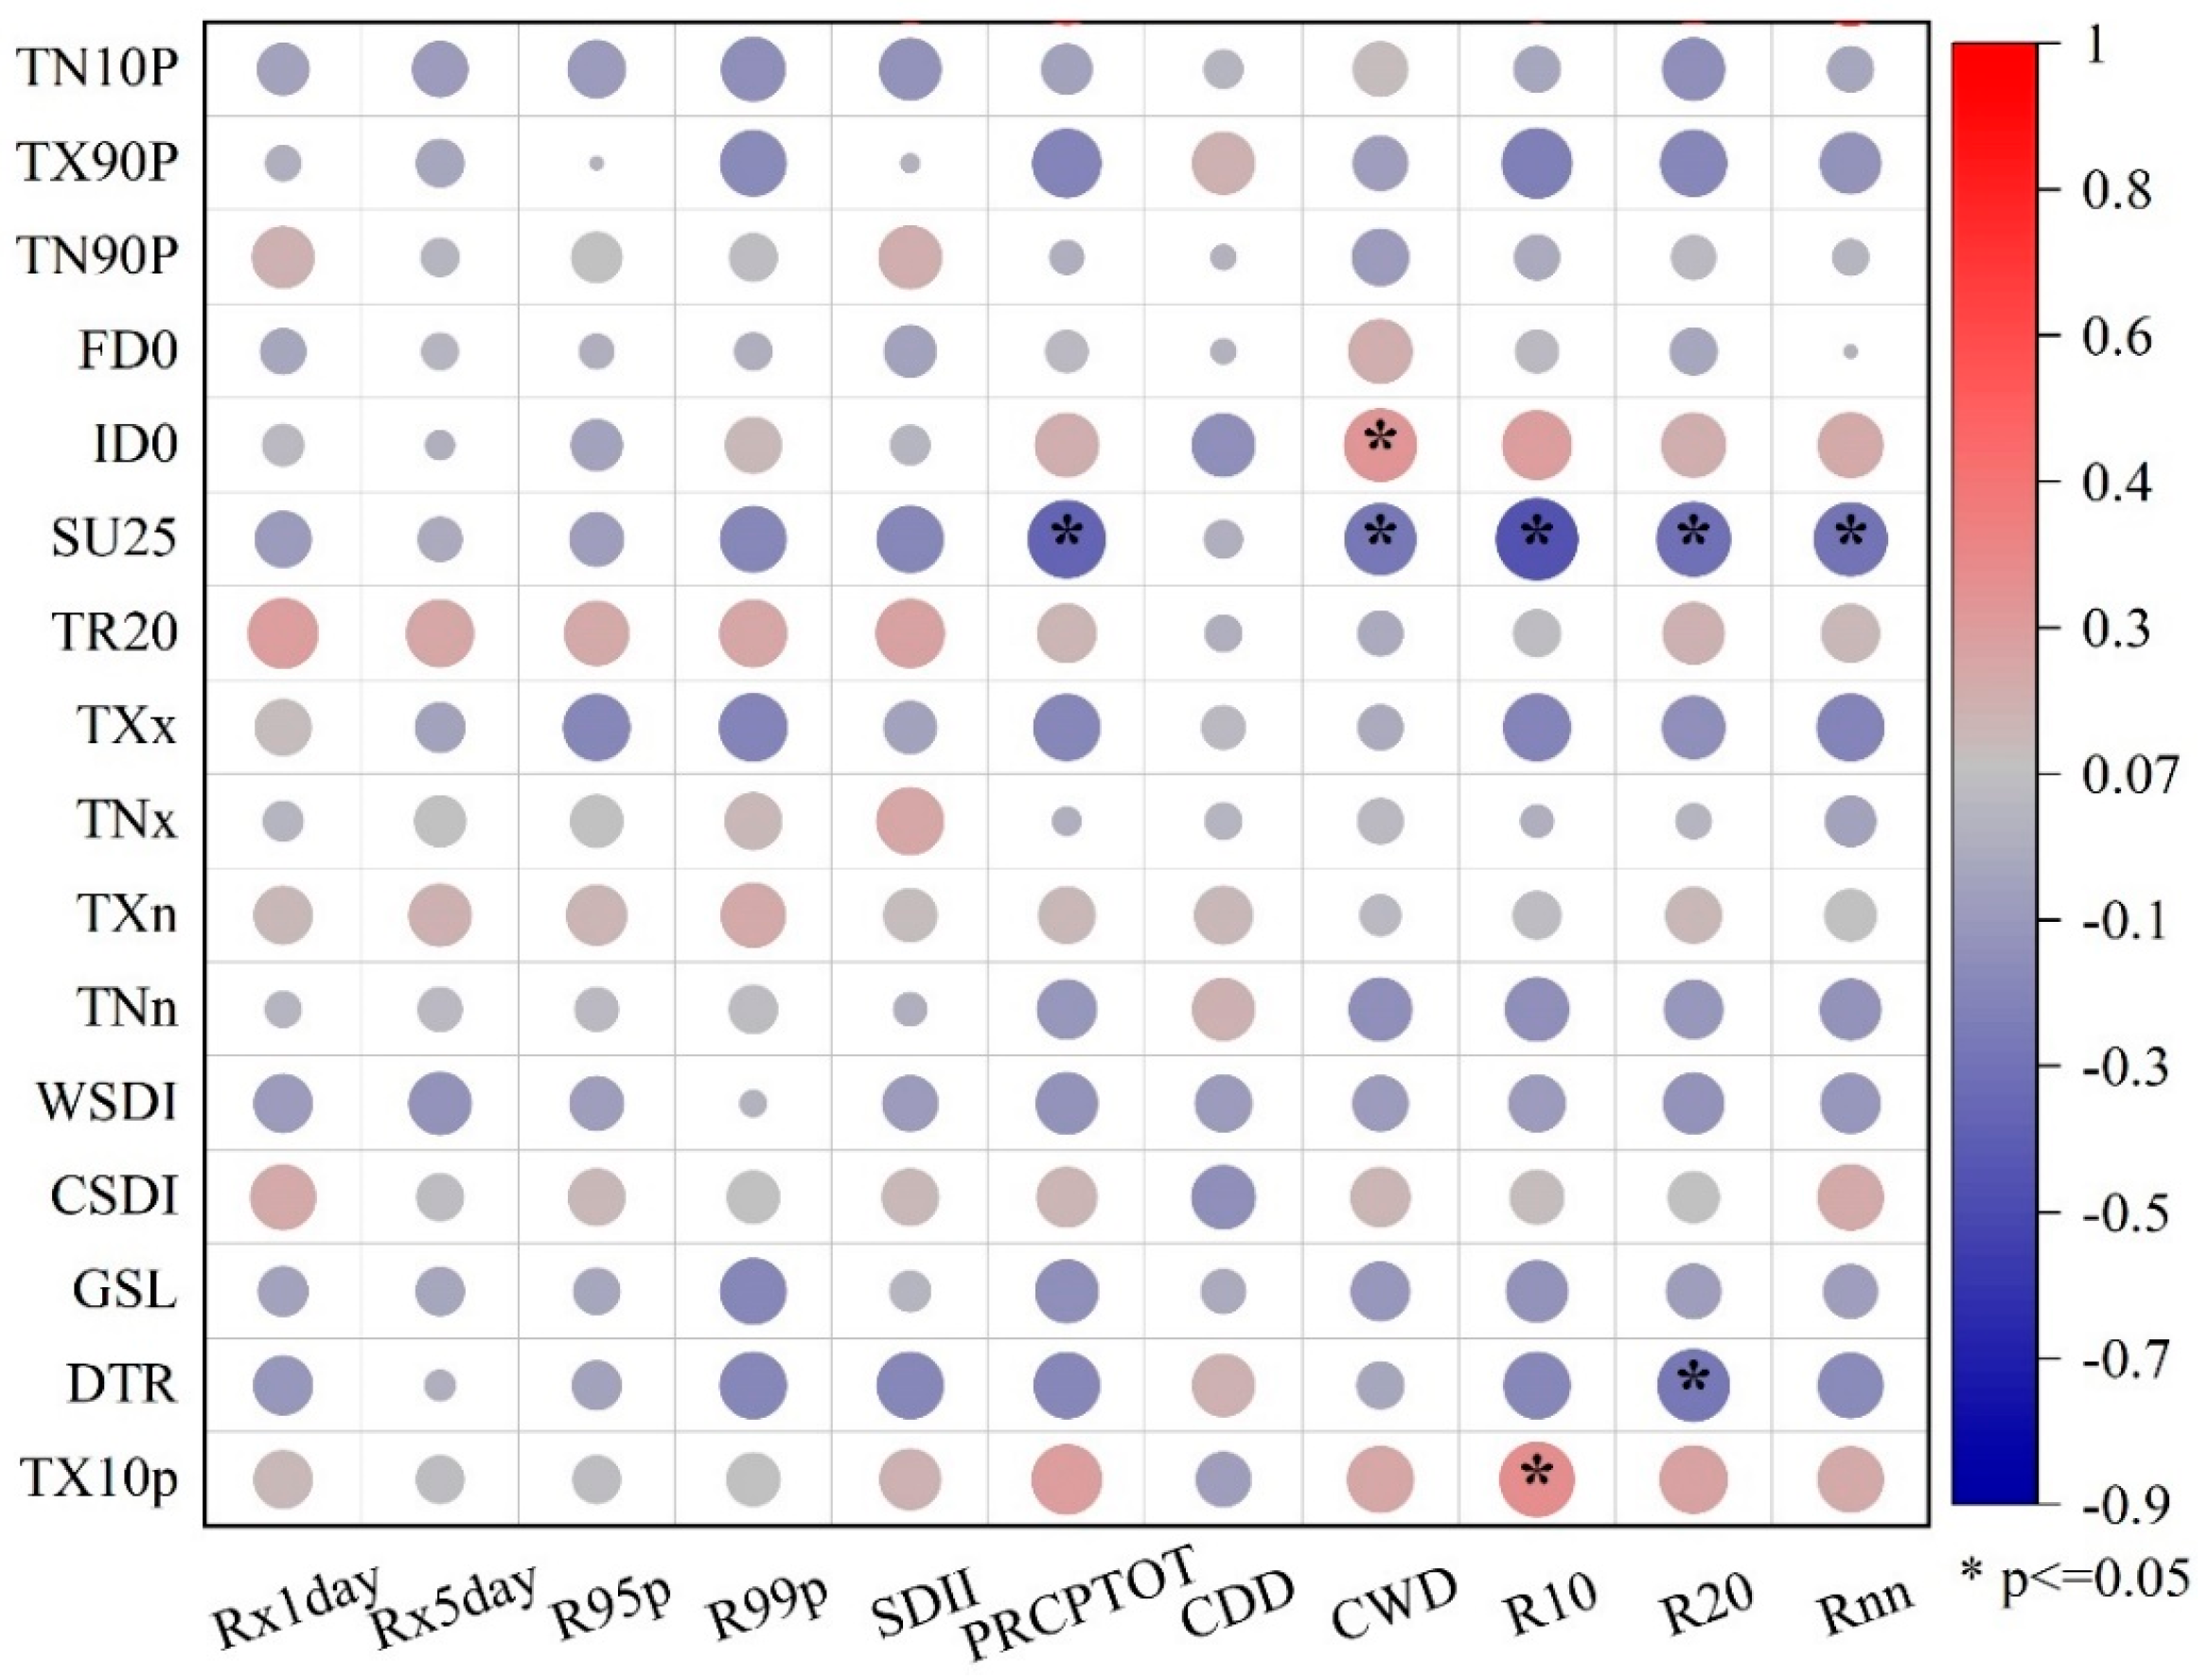
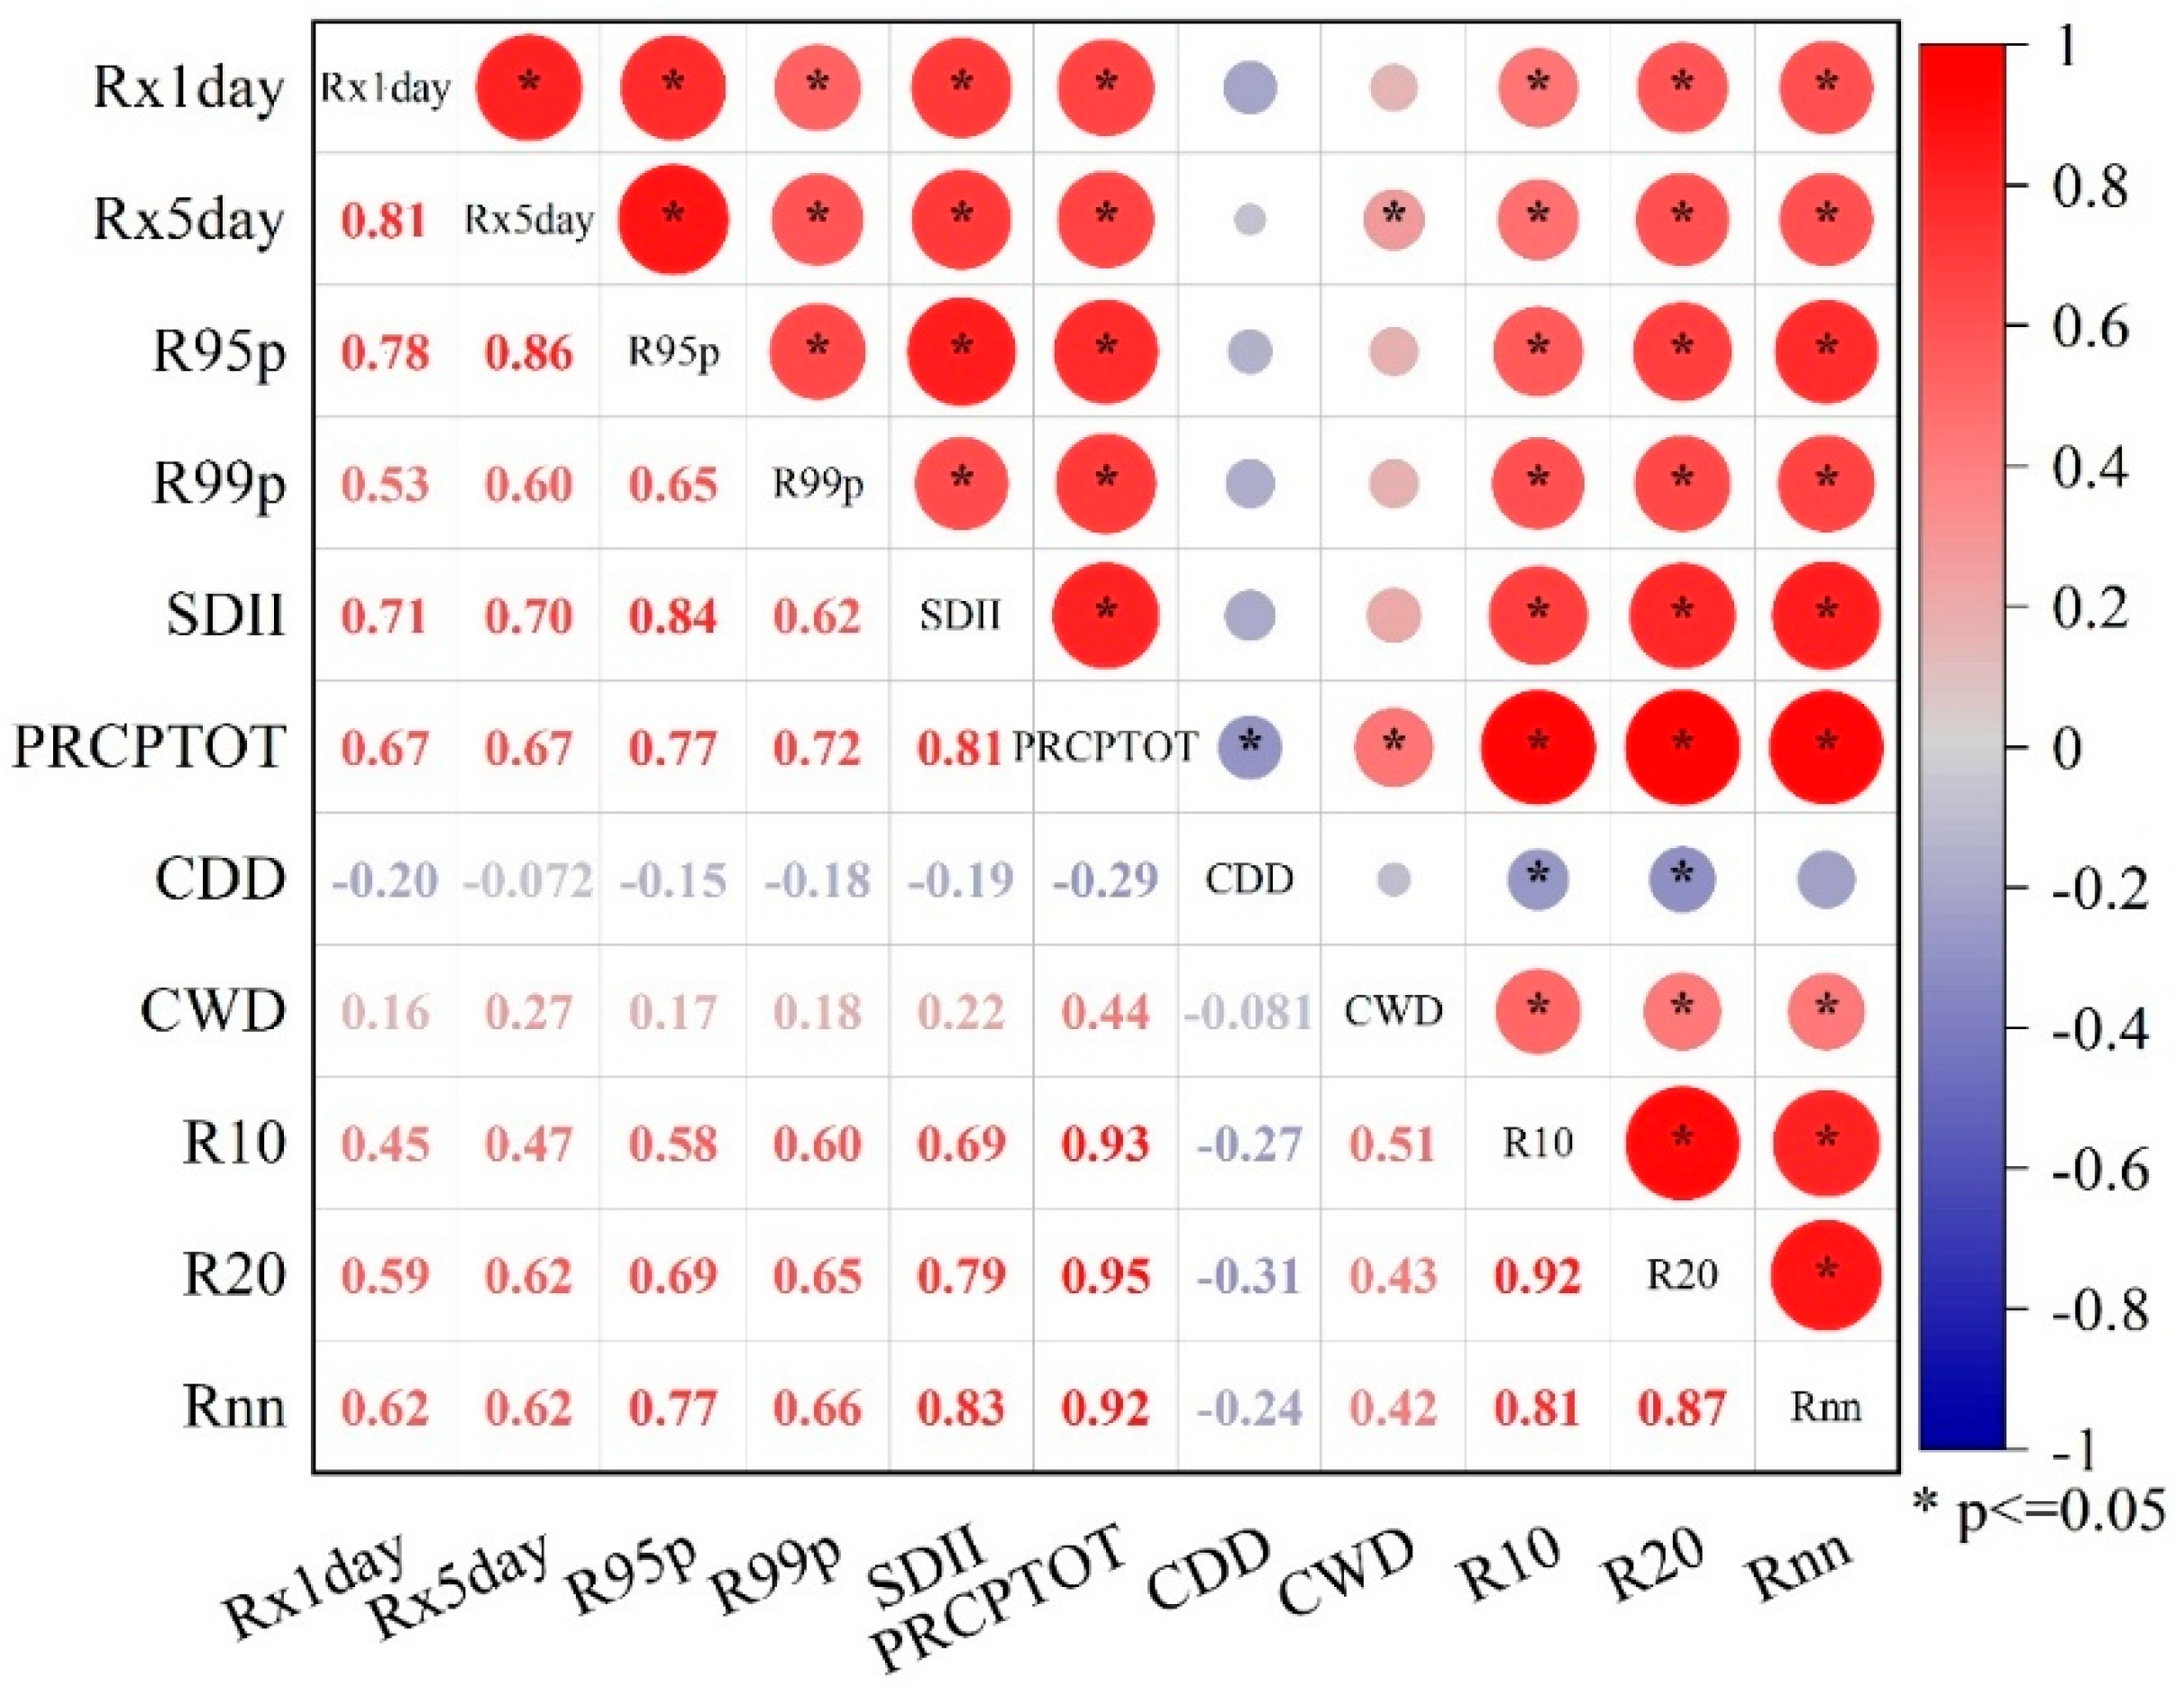
- Precipitation Factors
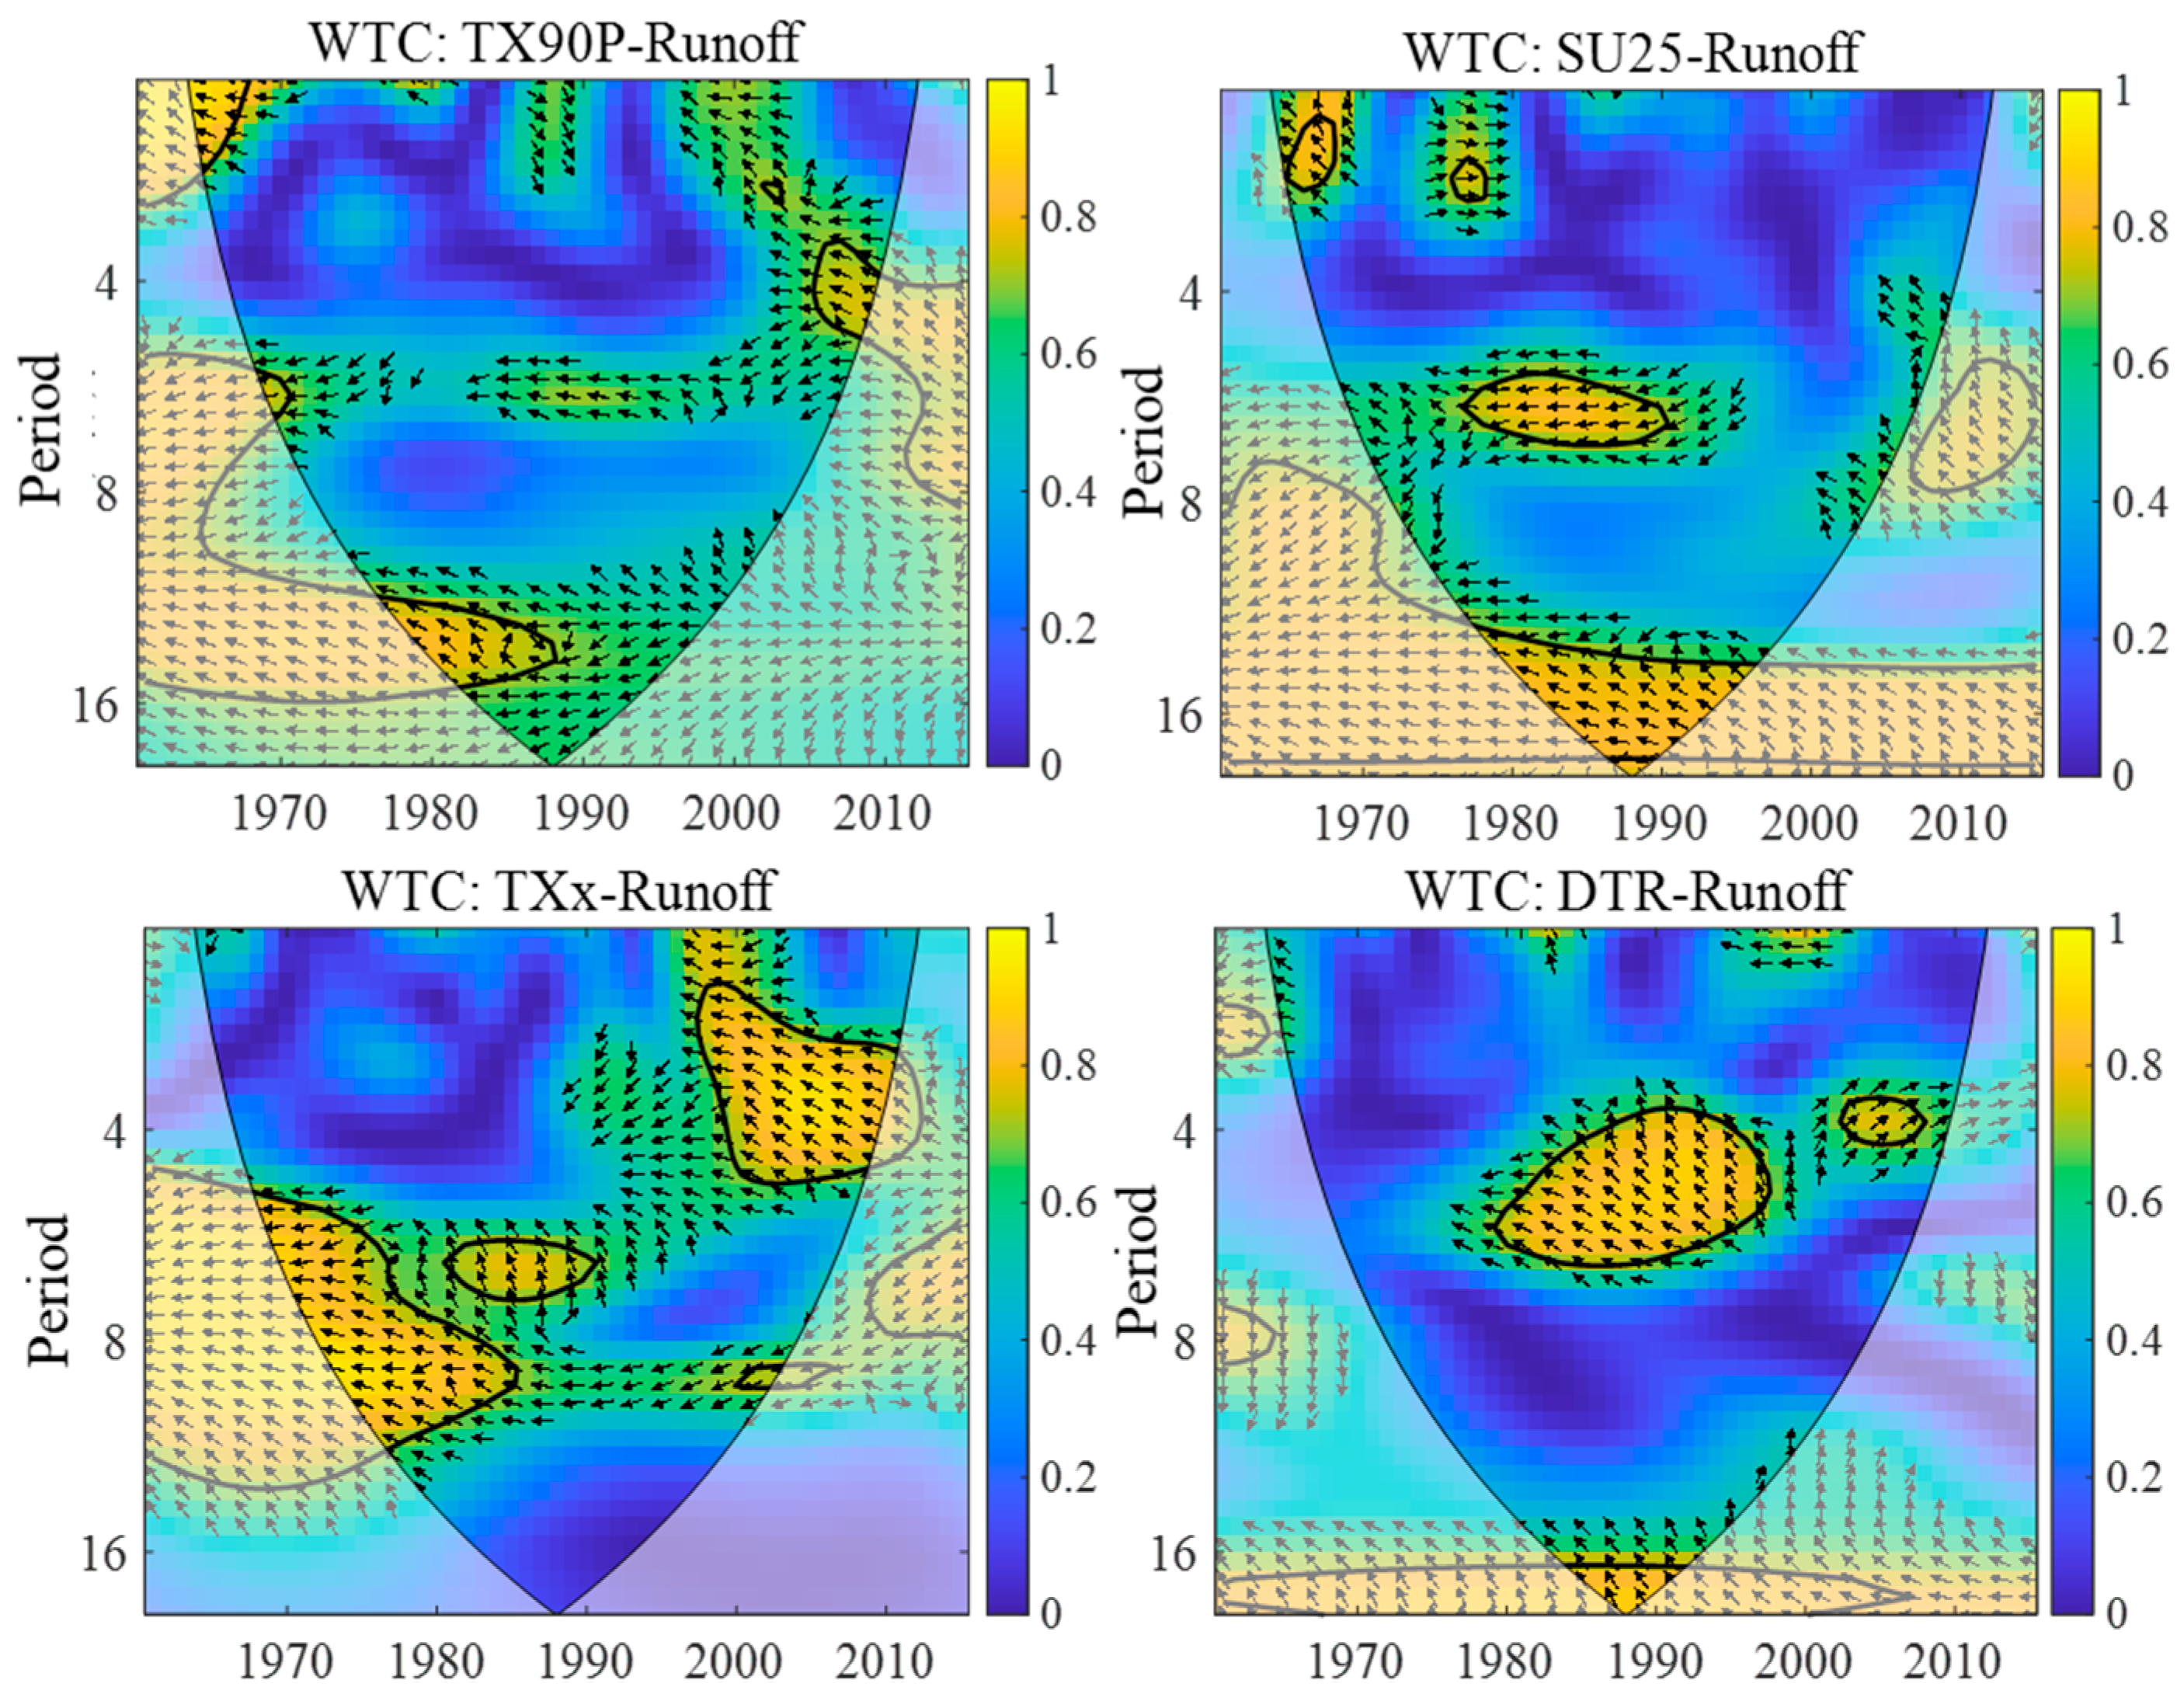
- (2)
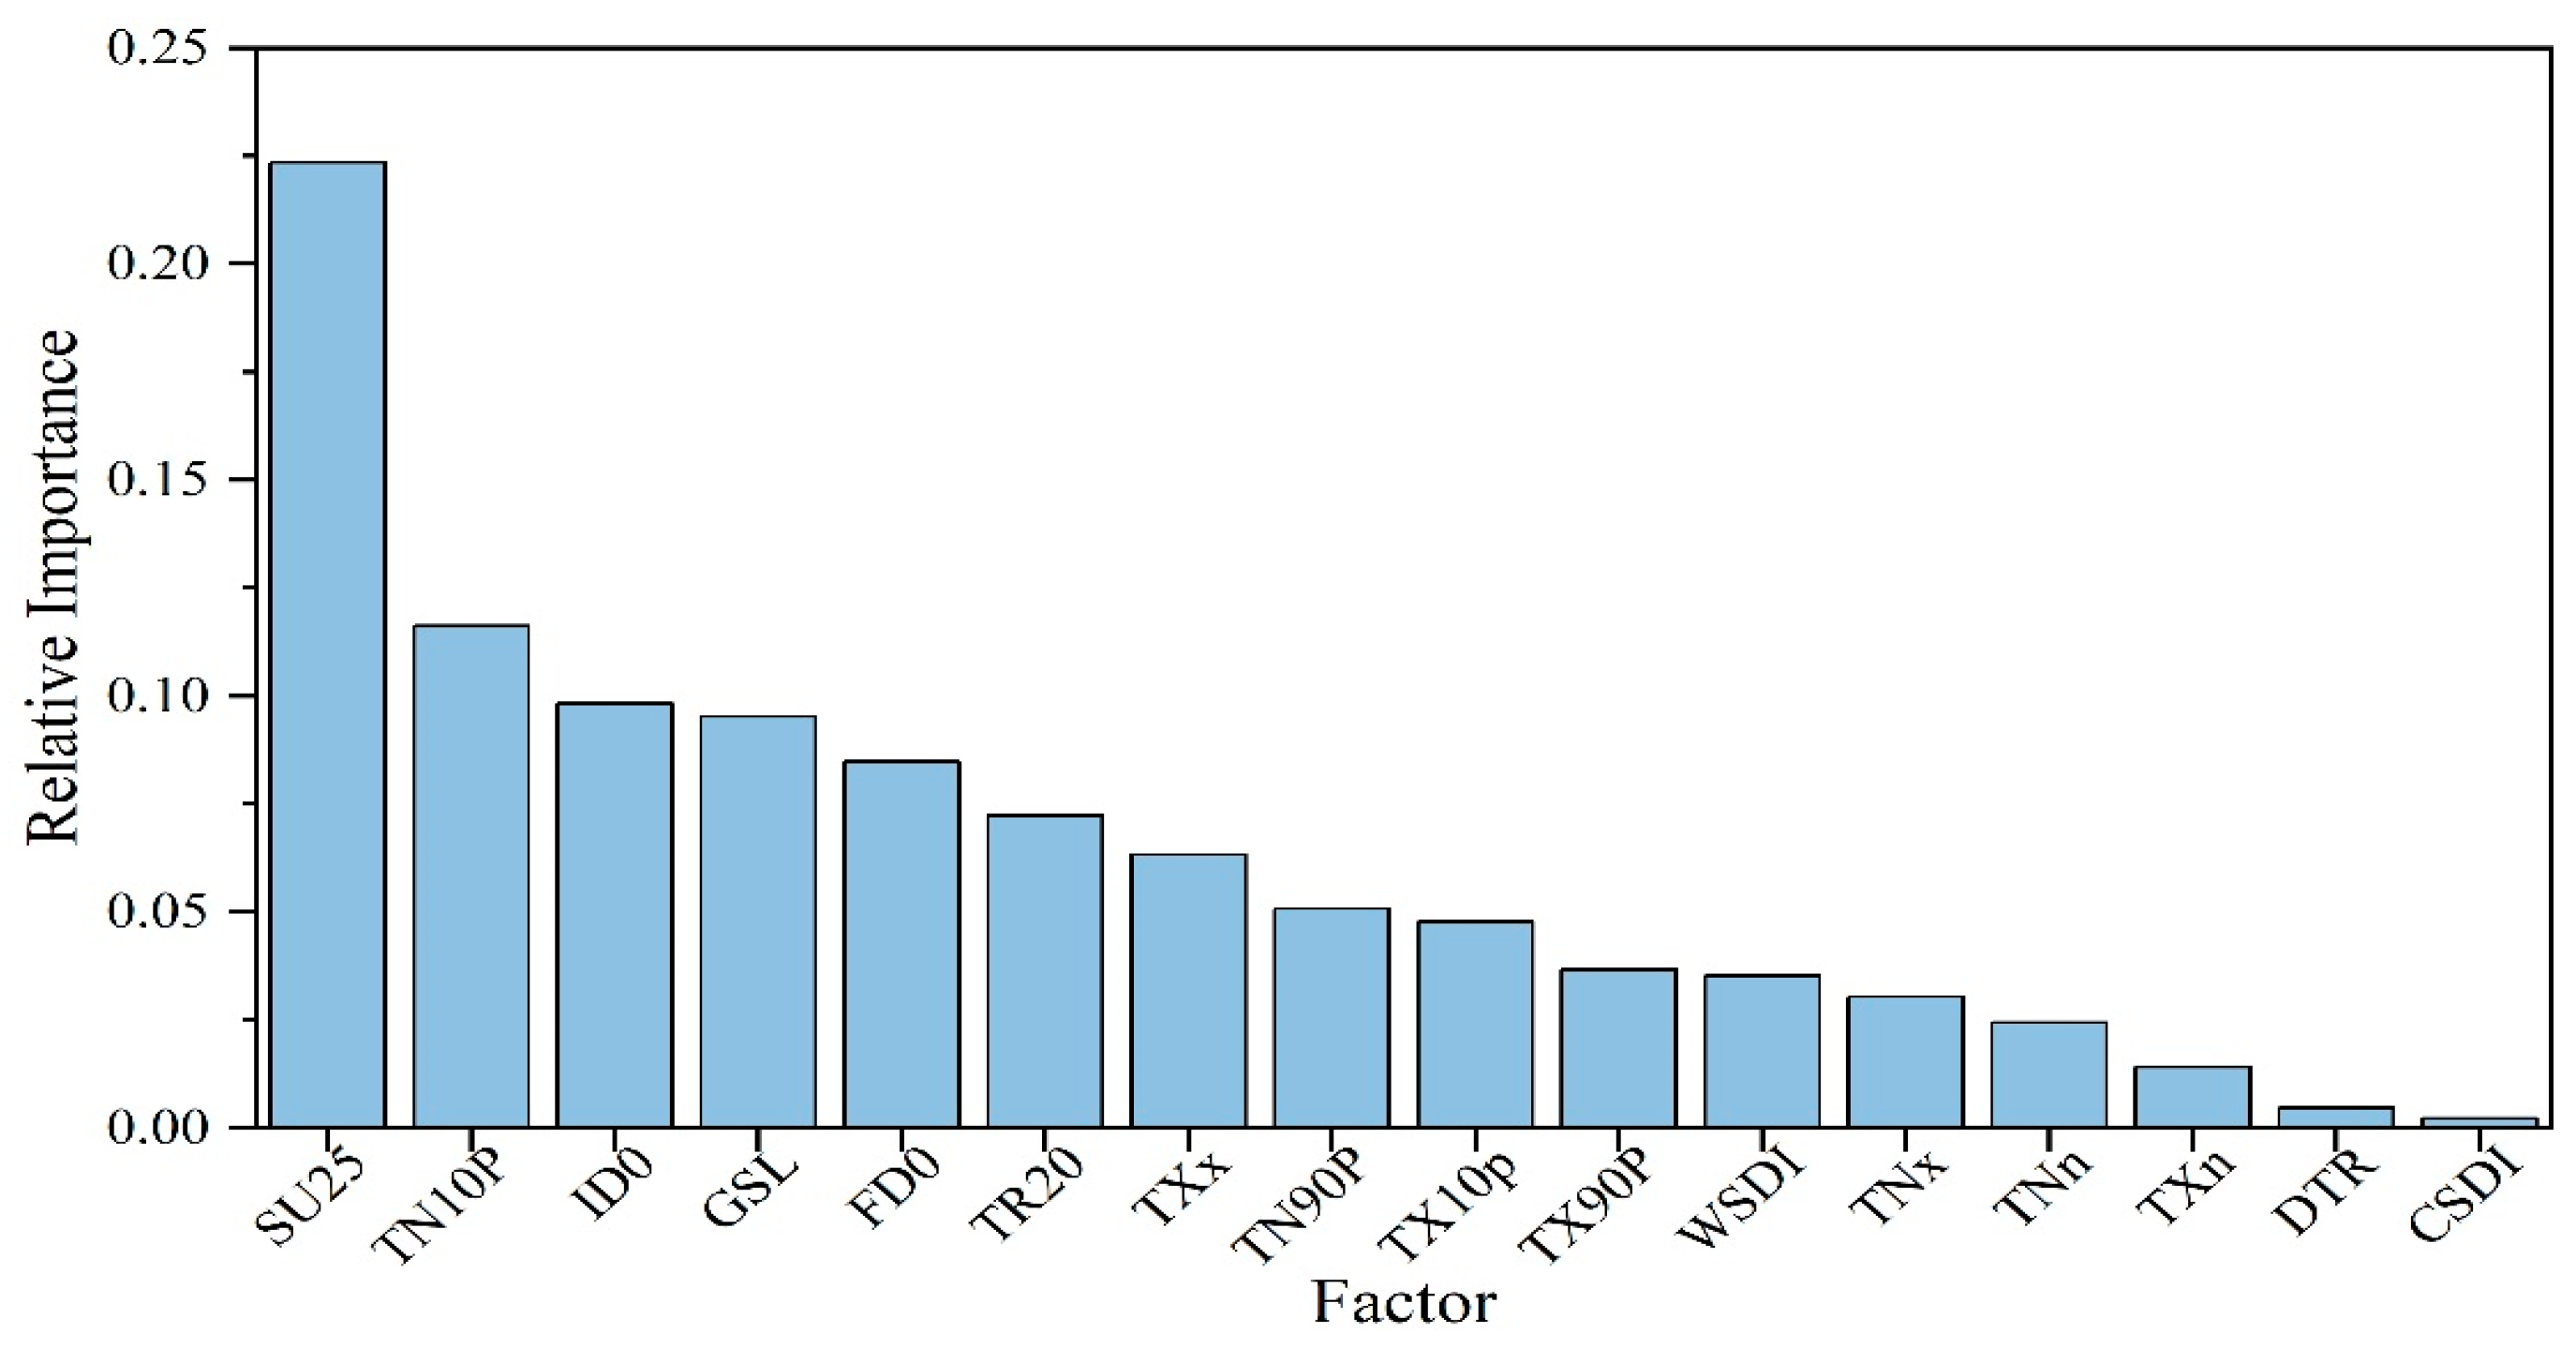
- Temperature Factors
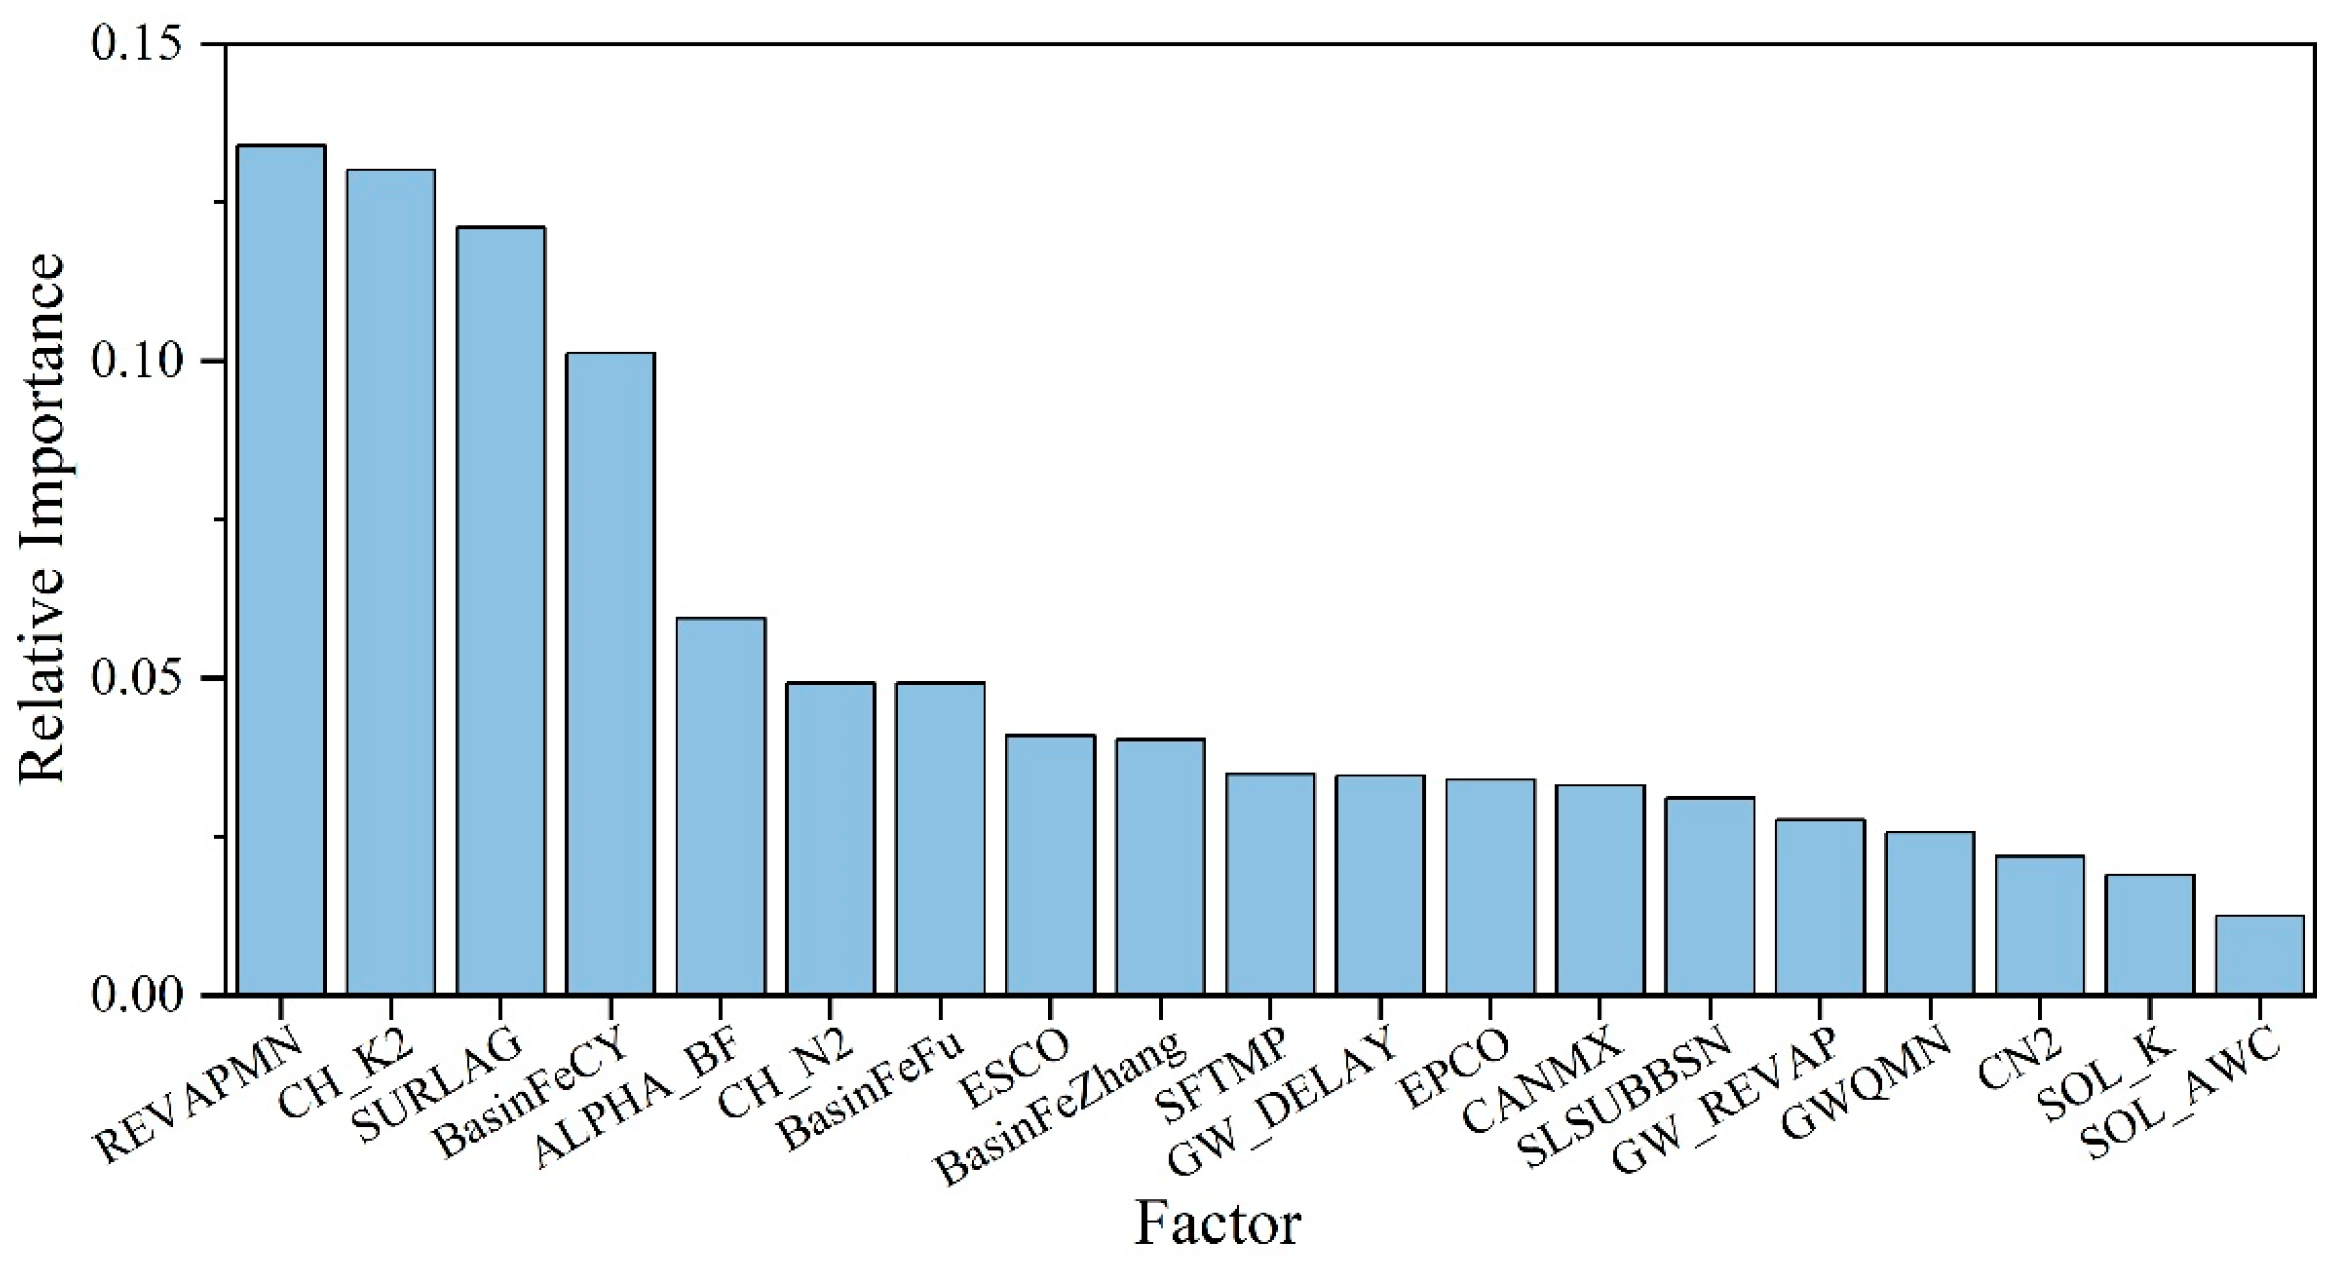
3.6.2. Basin Characteristic Factors
3.6.3. Adaptability Assessment of Runoff Attribution Methods
4. Conclusions
Author Contributions
Funding
Data Availability Statement
Acknowledgments
Conflicts of Interest
Appendix A

| Sub-Basin | Period | Observed Precipitation (mm) | Observed Runoff (mm) | Reconstructed Runoff (mm) | |||||
|---|---|---|---|---|---|---|---|---|---|
| Mean | Change | Mean | Change | ||||||
| Laiwu | Baseline Period | 1961–1976 | 748.66 | / | 293.98 | / | / | / | / |
| Change Periods | 1977–1990 | 619.53 | −129.13 | 174.17 | −119.81 | 263.92 | 25% | 75% | |
| 1991–2000 | 675.79 | −72.87 | 180.64 | −113.34 | 266.33 | 24% | 76% | ||
| 2001–2010 | 728.47 | −20.19 | 226.53 | −67.45 | 287.09 | 10% | 90% | ||
| 2011–2019 | 658.72 | −89.94 | 153.36 | −140.62 | 259.60 | 24% | 76% | ||
| 1977–2019 | 666.15 | −82.51 | 183.49 | −110.49 | 268.96 | 23% | 77% | ||
| Beiwang | Baseline Period | 1961–1976 | 702.49 | / | 248.39 | / | / | / | / |
| Change Periods | 1977–1990 | 586.88 | −115.61 | 119.21 | −129.19 | 207.69 | 32% | 68% | |
| 1991–2000 | 640.77 | −61.72 | 142.57 | −105.83 | 221.13 | 26% | 74% | ||
| 2001–2010 | 676.67 | −25.82 | 208.96 | −39.44 | 233.52 | 38% | 62% | ||
| 2011–2019 | 663.73 | −38.76 | 130.39 | −118.00 | 229.05 | 16% | 84% | ||
| 1977–2019 | 643.79 | −58.70 | 153.28 | −95.11 | 227.32 | 22% | 78% | ||
| Dawenkou | Baseline Period | 1961–1976 | 722.15 | / | 225.80 | / | / | / | / |
| Change Periods | 1977–1990 | 609.75 | −112.41 | 114.50 | −111.30 | 189.31 | 33% | 67% | |
| 1991–2000 | 647.56 | −74.59 | 145.82 | −79.99 | 187.66 | 48% | 52% | ||
| 2001–2010 | 703.69 | −18.46 | 212.94 | −12.86 | 203.93 | 170% | −70% | ||
| 2011–2019 | 659.72 | −62.44 | 129.29 | −96.51 | 191.19 | 36% | 64% | ||
| 1977–2019 | 651.94 | −70.21 | 147.65 | −78.16 | 190.77 | 45% | 55% | ||
| Daicunba | Baseline Period | 1961–1976 | 724.97 | / | 174.44 | / | / | / | / |
| Change Periods | 1977–1990 | 616.27 | −108.70 | 66.07 | −108.38 | 151.08 | 22% | 78% | |
| 1991–2000 | 653.64 | −71.34 | 84.95 | −89.49 | 145.17 | 33% | 67% | ||
| 2001–2010 | 722.18 | −2.80 | 141.71 | −32.73 | 160.40 | 43% | 57% | ||
| 2011–2019 | 642.42 | −82.55 | 67.44 | −107.00 | 142.68 | 30% | 70% | ||
| 1977–2019 | 655.06 | −69.91 | 88.34 | −86.10 | 150.12 | 28% | 72% | ||
| Method | Sub-Basin | Period | Parameter | ɛP | ɛE0 | ∆RP/mm | ∆RE0/mm | ∆RC/mm | ∆RH/mm | ∆R | ||
|---|---|---|---|---|---|---|---|---|---|---|---|---|
| Schreiber | Laiwu | 1977–1990 | / | 2.80 | −1.80 | −142.03 | 22.95 | −119.08 | −0.73 | −119.81 | 99% | 1% |
| 1991–2000 | / | 2.64 | −1.64 | −75.41 | 25.19 | −50.22 | −63.12 | −113.34 | 44% | 56% | ||
| 2001–2010 | / | 2.51 | −1.51 | −19.87 | 26.39 | 6.53 | −73.98 | −67.45 | −10% | 110% | ||
| 2011–2019 | / | 2.72 | −1.72 | −96.05 | 14.52 | −81.53 | −59.09 | −140.62 | 58% | 42% | ||
| 1977–2019 | / | 2.67 | −1.67 | −86.51 | 22.67 | −63.84 | −46.65 | −110.49 | 58% | 42% | ||
| Beiwang | 1977–1990 | / | 2.90 | −1.90 | −110.54 | 24.31 | −86.23 | −43.98 | −130.21 | 66% | 34% | |
| 1991–2000 | / | 2.81 | −1.81 | −74.34 | 22.81 | −51.53 | −72.00 | −123.53 | 42% | 58% | ||
| 2001–2010 | / | 2.71 | −1.71 | −35.21 | 23.97 | −11.25 | −45.89 | −57.14 | 20% | 80% | ||
| 2011–2019 | / | 2.74 | −1.74 | −48.92 | 24.17 | −24.75 | −110.95 | −135.70 | 18% | 82% | ||
| 1977–2019 | / | 2.80 | −1.80 | −70.83 | 23.85 | −46.98 | −65.83 | −112.81 | 42% | 58% | ||
| Dawenkou | 1977–1990 | / | 2.86 | −1.86 | −100.69 | 17.76 | −82.93 | −28.37 | −111.30 | 75% | 25% | |
| 1991–2000 | / | 2.75 | −1.75 | −64.26 | 16.96 | −47.30 | −32.69 | −79.99 | 59% | 41% | ||
| 2001–2010 | / | 2.60 | −1.60 | −15.03 | 18.09 | 3.06 | −15.92 | −12.86 | −24% | 124% | ||
| 2011–2019 | / | 2.73 | −1.73 | −53.34 | 14.60 | −38.75 | −57.76 | −96.51 | 40% | 60% | ||
| 1977–2019 | / | 2.75 | −1.75 | −61.21 | 16.99 | −44.22 | −33.81 | −78.03 | 57% | 43% | ||
| Daicunba | 1977–1990 | / | 2.83 | −1.83 | −75.60 | 15.46 | −60.14 | −51.90 | −112.05 | 54% | 46% | |
| 1991–2000 | / | 2.70 | −1.70 | −47.35 | 18.50 | −28.85 | −64.31 | −93.16 | 31% | 69% | ||
| 2001–2010 | / | 2.54 | −1.54 | −1.74 | 17.47 | 15.73 | −52.13 | −36.40 | −43% | 143% | ||
| 2011–2019 | / | 2.73 | −1.73 | −55.30 | 19.53 | −35.77 | −74.90 | −110.67 | 32% | 68% | ||
| 1977–2019 | / | 2.70 | −1.70 | −46.44 | 17.53 | −28.90 | −60.87 | −89.77 | 32% | 68% | ||
| Ol’dekop | Laiwu | 1977–1990 | / | 2.78 | −1.78 | −141.01 | 22.69 | −118.32 | −1.49 | −119.81 | 99% | 1% |
| 1991–2000 | / | 2.74 | −1.74 | −78.42 | 26.81 | −51.61 | −61.73 | −113.34 | 46% | 54% | ||
| 2001–2010 | / | 2.70 | −1.70 | −21.42 | 29.82 | 8.41 | −75.86 | −67.45 | −12% | 112% | ||
| 2011–2019 | / | 2.76 | −1.76 | −97.56 | 14.88 | −82.68 | −57.95 | −140.62 | 59% | 41% | ||
| 1977–2019 | / | 2.75 | −1.75 | −89.09 | 23.75 | −65.34 | −45.15 | −110.49 | 59% | 41% | ||
| Beiwang | 1977–1990 | / | 2.80 | −1.80 | −106.68 | 23.01 | −83.66 | −46.54 | −130.21 | 64% | 36% | |
| 1991–2000 | / | 2.78 | −1.78 | −73.59 | 22.45 | −51.14 | −72.39 | −123.53 | 41% | 59% | ||
| 2001–2010 | / | 2.76 | −1.76 | −35.91 | 24.71 | −11.19 | −45.95 | −57.14 | 20% | 80% | ||
| 2011–2019 | / | 2.77 | −1.77 | −49.40 | 24.54 | −24.86 | −110.84 | −135.70 | 18% | 82% | ||
| 1977–2019 | / | 2.78 | −1.78 | −70.37 | 23.61 | −46.76 | −66.05 | −112.81 | 41% | 59% | ||
| Dawenkou | 1977–1990 | / | 2.79 | −1.79 | −98.21 | 17.09 | −81.12 | −30.18 | −111.30 | 73% | 27% | |
| 1991–2000 | / | 2.77 | −1.77 | −64.62 | 17.11 | −47.52 | −32.47 | −79.99 | 59% | 41% | ||
| 2001–2010 | / | 2.73 | −1.73 | −15.77 | 19.54 | 3.77 | −16.63 | −12.86 | −29% | 129% | ||
| 2011–2019 | / | 2.77 | −1.77 | −53.99 | 14.88 | −39.11 | −57.40 | −96.51 | 41% | 59% | ||
| 1977–2019 | / | 2.77 | −1.77 | −61.73 | 17.22 | −44.51 | −33.52 | −78.03 | 57% | 43% | ||
| Daicunba | 1977–1990 | / | 2.79 | −1.79 | −74.44 | 15.09 | −59.34 | −52.70 | −112.05 | 53% | 47% | |
| 1991–2000 | / | 2.76 | −1.76 | −48.34 | 19.11 | −29.23 | −63.93 | −93.16 | 31% | 69% | ||
| 2001–2010 | / | 2.71 | −1.71 | −1.86 | 19.47 | 17.61 | −54.00 | −36.40 | −48% | 148% | ||
| 2011–2019 | / | 2.76 | −1.76 | −56.06 | 19.96 | −36.10 | −74.57 | −110.67 | 33% | 67% | ||
| 1977–2019 | / | 2.76 | −1.76 | −47.38 | 18.10 | −29.28 | −60.49 | −89.77 | 33% | 67% | ||
| Budyko | Laiwu | 1977–1990 | / | 2.81 | −1.81 | −142.32 | 23.02 | −119.30 | −0.52 | −119.81 | 100% | 0% |
| 1991–2000 | / | 2.68 | −1.68 | −76.83 | 25.95 | −50.88 | −62.47 | −113.34 | 45% | 55% | ||
| 2001–2010 | / | 2.59 | −1.59 | −20.51 | 27.81 | 7.30 | −74.76 | −67.45 | −11% | 111% | ||
| 2011–2019 | / | 2.75 | −1.75 | −97.03 | 14.76 | −82.27 | −58.35 | −140.62 | 59% | 41% | ||
| 1977–2019 | / | 2.71 | −1.71 | −87.82 | 23.22 | −64.60 | −45.89 | −110.49 | 58% | 42% | ||
| Beiwang | 1977–1990 | / | 2.88 | −1.88 | −109.65 | 24.01 | −85.64 | −44.57 | −130.21 | 66% | 34% | |
| 1991–2000 | / | 2.81 | −1.81 | −74.42 | 22.85 | −51.57 | −71.96 | −123.53 | 42% | 58% | ||
| 2001–2010 | / | 2.74 | −1.74 | −35.62 | 24.41 | −11.21 | −45.92 | −57.14 | 20% | 80% | ||
| 2011–2019 | / | 2.76 | −1.76 | −49.32 | 24.47 | −24.84 | −110.86 | −135.70 | 18% | 82% | ||
| 1977–2019 | / | 2.80 | −1.80 | −70.99 | 23.94 | −47.06 | −65.76 | −112.81 | 42% | 58% | ||
| Dawenkou | 1977–1990 | / | 2.85 | −1.85 | −100.26 | 17.65 | −82.61 | −28.69 | −111.30 | 74% | 26% | |
| 1991–2000 | / | 2.77 | −1.77 | −64.68 | 17.13 | −47.55 | −32.44 | −79.99 | 59% | 41% | ||
| 2001–2010 | / | 2.66 | −1.66 | −15.36 | 18.74 | 3.38 | −16.24 | −12.86 | −26% | 126% | ||
| 2011–2019 | / | 2.76 | −1.76 | −53.82 | 14.80 | −39.02 | −57.49 | −96.51 | 40% | 60% | ||
| 1977–2019 | / | 2.77 | −1.77 | −61.68 | 17.20 | −44.48 | −33.55 | −78.03 | 57% | 43% | ||
| Daicunba | 1977–1990 | / | 2.83 | −1.83 | −75.53 | 15.44 | −60.09 | −51.95 | −112.05 | 54% | 46% | |
| 1991–2000 | / | 2.73 | −1.73 | −47.92 | 18.85 | −29.07 | −64.09 | −93.16 | 31% | 69% | ||
| 2001–2010 | / | 2.61 | −1.61 | −1.79 | 18.31 | 16.52 | −52.92 | −36.40 | −45% | 145% | ||
| 2011–2019 | / | 2.75 | −1.75 | −55.82 | 19.83 | −36.00 | −74.67 | −110.67 | 33% | 67% | ||
| 1977–2019 | / | 2.74 | −1.74 | −46.99 | 17.86 | −29.12 | −60.65 | −89.77 | 32% | 68% | ||
| Turc–Pike | Laiwu | 1977–1990 | / | 2.64 | −1.64 | −133.79 | 20.88 | −112.91 | −6.90 | −119.81 | 94% | 6% |
| 1991–2000 | / | 2.58 | −1.58 | −73.86 | 24.35 | −49.50 | −63.84 | −113.34 | 44% | 56% | ||
| 2001–2010 | / | 2.53 | −1.53 | −20.04 | 26.77 | 6.73 | −74.19 | −67.45 | −10% | 110% | ||
| 2011–2019 | / | 2.61 | −1.61 | −92.24 | 13.61 | −78.63 | −61.99 | −140.62 | 56% | 44% | ||
| 1977–2019 | / | 2.59 | −1.59 | −84.04 | 21.64 | −62.41 | −48.08 | −110.49 | 56% | 44% | ||
| Beiwang | 1977–1990 | / | 2.67 | −1.67 | −101.62 | 21.32 | −80.31 | −49.90 | −130.21 | 62% | 38% | |
| 1991–2000 | / | 2.64 | −1.64 | −69.85 | 20.67 | −49.18 | −74.35 | −123.53 | 40% | 60% | ||
| 2001–2010 | / | 2.61 | −1.61 | −33.93 | 22.58 | −11.35 | −45.79 | −57.14 | 20% | 80% | ||
| 2011–2019 | / | 2.62 | −1.62 | −46.75 | 22.48 | −24.27 | −111.43 | −135.70 | 18% | 82% | ||
| 1977–2019 | / | 2.64 | −1.64 | −66.76 | 21.72 | −45.04 | −67.77 | −112.81 | 40% | 60% | ||
| Dawenkou | 1977–1990 | / | 2.66 | −1.66 | −93.42 | 15.79 | −77.63 | −33.67 | −111.30 | 70% | 30% | |
| 1991–2000 | / | 2.62 | −1.62 | −61.20 | 15.69 | −45.51 | −34.48 | −79.99 | 57% | 43% | ||
| 2001–2010 | / | 2.57 | −1.57 | −14.83 | 17.70 | 2.87 | −15.73 | −12.86 | −22% | 122% | ||
| 2011–2019 | / | 2.62 | −1.62 | −51.08 | 13.62 | −37.46 | −59.05 | −96.51 | 39% | 61% | ||
| 1977–2019 | / | 2.62 | −1.62 | −58.43 | 15.78 | −42.65 | −35.38 | −78.03 | 55% | 45% | ||
| Daicunba | 1977–1990 | / | 2.65 | −1.65 | −70.71 | 13.92 | −56.80 | −55.25 | −112.05 | 51% | 49% | |
| 1991–2000 | / | 2.61 | −1.61 | −45.66 | 17.45 | −28.21 | −64.95 | −93.16 | 30% | 70% | ||
| 2001–2010 | / | 2.54 | −1.54 | −1.75 | 17.53 | 15.78 | −52.18 | −36.40 | −43% | 143% | ||
| 2011–2019 | / | 2.61 | −1.61 | −53.02 | 18.26 | −34.76 | −75.91 | −110.67 | 31% | 69% | ||
| 1977–2019 | / | 2.61 | −1.61 | −44.76 | 16.53 | −28.23 | −61.54 | −89.77 | 31% | 69% | ||
| Fu | Laiwu | 1977–1990 | 1.93 | 1.80 | −0.80 | −91.50 | 10.25 | −81.25 | −38.56 | −119.81 | 68% | 32% |
| 1991–2000 | 2.05 | 1.90 | −0.90 | −54.40 | 13.88 | −40.52 | −72.82 | −113.34 | 36% | 64% | ||
| 2001–2010 | 1.97 | 1.80 | −0.80 | −14.31 | 14.10 | −0.20 | −67.25 | −67.45 | 0% | 100% | ||
| 2011–2019 | 2.14 | 2.00 | −1.00 | −70.57 | 8.43 | −62.14 | −78.48 | −140.62 | 44% | 56% | ||
| 1977–2019 | 2.00 | 1.86 | −0.86 | −60.31 | 11.69 | −48.61 | −61.87 | −110.49 | 44% | 56% | ||
| Beiwang | 1977–1990 | 2.09 | 1.97 | −0.97 | −75.06 | 12.41 | −62.65 | −67.55 | −130.21 | 48% | 52% | |
| 1991–2000 | 2.14 | 2.00 | −1.00 | −53.00 | 12.65 | −40.35 | −83.18 | −123.53 | 33% | 67% | ||
| 2001–2010 | 1.88 | 1.75 | −0.75 | −22.78 | 10.55 | −12.24 | −44.90 | −57.14 | 21% | 79% | ||
| 2011–2019 | 2.30 | 2.15 | −1.15 | −38.42 | 16.00 | −22.42 | −113.28 | −135.70 | 17% | 83% | ||
| 1977–2019 | 2.08 | 1.95 | −0.95 | −49.32 | 12.58 | −36.74 | −76.07 | −112.81 | 33% | 67% | ||
| Dawenkou | 1977–1990 | 2.27 | 2.14 | −1.14 | −75.15 | 10.84 | −64.31 | −46.99 | −111.30 | 58% | 42% | |
| 1991–2000 | 2.16 | 2.02 | −1.02 | −47.01 | 9.81 | −37.20 | −42.79 | −79.99 | 47% | 53% | ||
| 2001–2010 | 1.94 | 1.80 | −0.80 | −10.38 | 9.00 | −1.38 | −11.48 | −12.86 | 11% | 89% | ||
| 2011–2019 | 2.31 | 2.16 | −1.16 | −42.13 | 9.76 | −32.38 | −64.14 | −96.51 | 34% | 66% | ||
| 1977–2019 | 2.15 | 2.01 | −1.01 | −44.85 | 9.85 | −35.00 | −43.03 | −78.03 | 45% | 55% | ||
| Daicunba | 1977–1990 | 2.86 | 2.72 | −1.72 | −72.59 | 14.51 | −58.08 | −53.97 | −112.05 | 52% | 48% | |
| 1991–2000 | 2.79 | 2.61 | −1.61 | −45.78 | 17.52 | −28.26 | −64.90 | −93.16 | 30% | 70% | ||
| 2001–2010 | 2.47 | 2.27 | −1.27 | −1.56 | 14.45 | 12.89 | −49.29 | −36.40 | −35% | 135% | ||
| 2011–2019 | 3.00 | 2.83 | −1.83 | −57.48 | 20.75 | −36.73 | −73.94 | −110.67 | 33% | 67% | ||
| 1977–2019 | 2.74 | 2.57 | −1.57 | −44.12 | 16.15 | −27.98 | −61.80 | −89.77 | 31% | 69% | ||
| Zhang et al. | Laiwu | 1977–1990 | 0.23 | 1.93 | −0.93 | −97.93 | 11.87 | −86.07 | −33.75 | −119.81 | 72% | 28% |
| 1991–2000 | 0.41 | 2.03 | −1.03 | −58.04 | 15.84 | −42.20 | −71.14 | −113.34 | 37% | 63% | ||
| 2001–2010 | 0.31 | 1.91 | −0.91 | −15.14 | 15.95 | 0.81 | −68.26 | −67.45 | −1% | 101% | ||
| 2011–2019 | 0.53 | 2.13 | −1.13 | −75.37 | 9.58 | −65.79 | −74.83 | −140.62 | 47% | 53% | ||
| 1977–2019 | 0.34 | 1.99 | −0.99 | −64.45 | 13.43 | −51.02 | −59.47 | −110.49 | 46% | 54% | ||
| Beiwang | 1977–1990 | 0.44 | 2.13 | −1.13 | −81.11 | 14.43 | −66.67 | −63.54 | −130.21 | 51% | 49% | |
| 1991–2000 | 0.51 | 2.15 | −1.15 | −56.89 | 14.50 | −42.39 | −81.14 | −123.53 | 34% | 66% | ||
| 2001–2010 | 0.18 | 1.86 | −0.86 | −24.15 | 12.02 | −12.13 | −45.01 | −57.14 | 21% | 79% | ||
| 2011–2019 | 0.78 | 2.27 | −1.27 | −40.44 | 17.57 | −22.87 | −112.83 | −135.70 | 17% | 83% | ||
| 1977–2019 | 0.43 | 2.10 | −1.10 | −53.04 | 14.53 | −38.51 | −74.30 | −112.81 | 34% | 66% | ||
| Dawenkou | 1977–1990 | 0.71 | 2.27 | −1.27 | −79.93 | 12.14 | −67.79 | −43.51 | −111.30 | 61% | 39% | |
| 1991–2000 | 0.55 | 2.15 | −1.15 | −50.25 | 11.15 | −39.10 | −40.89 | −79.99 | 49% | 51% | ||
| 2001–2010 | 0.27 | 1.91 | −0.91 | −11.03 | 10.27 | −0.76 | −12.10 | −12.86 | 6% | 94% | ||
| 2011–2019 | 0.79 | 2.27 | −1.27 | −44.29 | 10.69 | −33.60 | −62.91 | −96.51 | 35% | 65% | ||
| 1977–2019 | 0.54 | 2.15 | −1.15 | −47.93 | 11.19 | −36.74 | −41.29 | −78.03 | 47% | 53% | ||
| Daicunba | 1977–1990 | 1.94 | 2.59 | −1.59 | −69.15 | 13.42 | −55.73 | −56.32 | −112.05 | 50% | 50% | |
| 1991–2000 | 1.72 | 2.52 | −1.52 | −44.15 | 16.51 | −27.64 | −65.52 | −93.16 | 30% | 70% | ||
| 2001–2010 | 1.09 | 2.31 | −1.31 | −1.58 | 14.86 | 13.28 | −49.68 | −36.40 | −36% | 136% | ||
| 2011–2019 | 2.28 | 2.61 | −1.61 | −52.91 | 18.20 | −34.71 | −75.96 | −110.67 | 31% | 69% | ||
| 1977–2019 | 1.62 | 2.50 | −1.50 | −42.95 | 15.44 | −27.50 | −62.27 | −89.77 | 31% | 69% | ||
| Choudhury–Yang | Laiwu | 1977–1990 | 1.21 | 1.84 | −0.84 | −93.39 | 10.73 | −82.66 | −37.15 | −119.81 | 69% | 31% |
| 1991–2000 | 1.34 | 1.93 | −0.93 | −55.35 | 14.39 | −40.96 | −72.38 | −113.34 | 36% | 64% | ||
| 2001–2010 | 1.26 | 1.83 | −0.83 | −14.50 | 14.53 | 0.03 | −67.48 | −67.45 | 0% | 100% | ||
| 2011–2019 | 1.43 | 2.04 | −1.04 | −72.02 | 8.78 | −63.24 | −77.38 | −140.62 | 45% | 55% | ||
| 1977–2019 | 1.29 | 1.90 | −0.90 | −61.40 | 12.15 | −49.25 | −61.24 | −110.49 | 45% | 55% | ||
| Beiwang | 1977–1990 | 1.37 | 2.02 | −1.02 | −76.92 | 13.03 | −63.89 | −66.32 | −130.21 | 49% | 51% | |
| 1991–2000 | 1.42 | 2.05 | −1.05 | −54.21 | 13.23 | −40.99 | −82.54 | −123.53 | 33% | 67% | ||
| 2001–2010 | 1.16 | 1.78 | −0.78 | −23.19 | 10.99 | −12.20 | −44.93 | −57.14 | 21% | 79% | ||
| 2011–2019 | 1.59 | 2.20 | −1.20 | −39.27 | 16.66 | −22.61 | −113.09 | −135.70 | 17% | 83% | ||
| 1977–2019 | 1.36 | 1.99 | −0.99 | −50.40 | 13.15 | −37.26 | −75.56 | −112.81 | 33% | 67% | ||
| Dawenkou | 1977–1990 | 1.55 | 2.19 | −1.19 | −77.05 | 11.36 | −65.69 | −45.61 | −111.30 | 59% | 41% | |
| 1991–2000 | 1.44 | 2.06 | −1.06 | −48.02 | 10.23 | −37.79 | −42.19 | −79.99 | 47% | 53% | ||
| 2001–2010 | 1.23 | 1.83 | −0.83 | −10.55 | 9.33 | −1.22 | −11.64 | −12.86 | 9% | 91% | ||
| 2011–2019 | 1.60 | 2.21 | −1.21 | −43.06 | 10.16 | −32.90 | −63.61 | −96.51 | 34% | 66% | ||
| 1977–2019 | 1.44 | 2.05 | −1.05 | −45.80 | 10.26 | −35.54 | −42.49 | −78.03 | 46% | 54% | ||
| Daicunba | 1977–1990 | 2.14 | 2.79 | −1.79 | −74.59 | 15.14 | −59.45 | −52.60 | −112.05 | 53% | 47% | |
| 1991–2000 | 2.07 | 2.67 | −1.67 | −46.86 | 18.19 | −28.67 | −64.49 | −93.16 | 31% | 69% | ||
| 2001–2010 | 1.76 | 2.31 | −1.31 | −1.59 | 14.89 | 13.31 | −49.71 | −36.40 | −37% | 137% | ||
| 2011–2019 | 2.28 | 2.91 | −1.91 | −58.92 | 21.55 | −37.37 | −73.30 | −110.67 | 34% | 66% | ||
| 1977–2019 | 2.02 | 2.63 | −1.63 | −45.16 | 16.77 | −28.39 | −61.38 | −89.77 | 32% | 68% |
| Sub-Basin | Scenario Setup | Observed Runoff (mm) | Simulated Runoff (mm) | Climate Change | Human Activities | |||
|---|---|---|---|---|---|---|---|---|
| Mean | Change | Change (mm) | Contribution | Change (mm) | Contribution | |||
| Laiwu | 1961–1976 S1 | 293.13 | / | 310.49 | / | / | / | / |
| 1977–2019 S2 | 183.49 | −127.00 | 272.20 | −38.29 | 30% | −88.71 | 70% | |
| 1977–1990 S3 | 174.17 | −136.32 | 235.19 | −75.30 | 55% | −61.02 | 45% | |
| 1991–2000 S4 | 180.64 | −129.85 | 280.87 | −29.62 | 23% | −100.23 | 77% | |
| 2001–2010 S5 | 226.53 | −83.96 | 313.77 | 3.28 | −4% | −87.24 | 104% | |
| 2011–2019 S6 | 153.36 | −157.13 | 273.96 | −36.53 | 23% | −120.60 | 77% | |
| Beiwang | 1961–1976 S1 | 356.77 | / | 394.05 | / | / | / | / |
| 1977–2019 S2 | 217.15 | −176.90 | 356.68 | −37.37 | 21% | −139.52 | 79% | |
| 1977–1990 S3 | 192.50 | −201.54 | 317.56 | −76.49 | 38% | −125.05 | 62% | |
| 1991–2000 S4 | 201.97 | −192.08 | 357.70 | −36.34 | 19% | −155.74 | 81% | |
| 2001–2010 S5 | 296.02 | −98.03 | 389.24 | −4.81 | 5% | −93.22 | 95% | |
| 2011–2019 S6 | 184.72 | −209.32 | 380.20 | −13.85 | 7% | −195.48 | 93% | |
| Dawenkou | 1961–1976 S1 | 304.30 | / | 356.16 | / | / | / | / |
| 1977–2019 S2 | 209.35 | −146.81 | 320.44 | −35.71 | 24% | −111.10 | 76% | |
| 1977–1990 S3 | 162.21 | −193.95 | 268.54 | −87.61 | 45% | −106.33 | 55% | |
| 1991–2000 S4 | 206.58 | −149.58 | 318.42 | −37.73 | 25% | −111.85 | 75% | |
| 2001–2010 S5 | 301.67 | −54.49 | 381.14 | 24.99 | −46% | −79.47 | 146% | |
| 2011–2019 S6 | 183.16 | −172.99 | 335.97 | −20.18 | 12% | −152.81 | 88% | |
| Daicunba | 1961–1976 S1 | 235.74 | / | 284.53 | / | / | / | / |
| 1977–2019 S2 | 125.15 | −159.39 | 255.46 | −29.07 | 18% | −130.31 | 82% | |
| 1977–1990 S3 | 93.59 | −190.94 | 205.16 | −79.38 | 42% | −111.56 | 58% | |
| 1991–2000 S4 | 120.35 | −164.18 | 257.50 | −27.03 | 16% | −137.16 | 84% | |
| 2001–2010 S5 | 200.76 | −83.77 | 322.22 | 37.69 | −45% | −121.46 | 145% | |
| 2011–2019 S6 | 95.54 | −188.99 | 257.26 | −27.27 | 14% | −161.72 | 86% | |
| Sub-Basin | Scenario Setup | Simulated Values (mm) | Contribution of Human Activities: Magnitudes and Rates | Climate Change (mm) | ||||||||||
|---|---|---|---|---|---|---|---|---|---|---|---|---|---|---|
| Human Activities | Water Withdrawal and Use | Reservoir Operation | LUCC | Other Factors | ||||||||||
| (mm) | (%) | (mm) | (%) | (mm) | (%) | (mm) | (%) | (mm) | (%) | (mm) | (%) | |||
| Laiwu | Baseline model A1 | 121.78 | −61.02 | 45% | −70.54 | 52% | 0.00 | 0% | 66.75 | −49% | −57.23 | 42% | −75.30 | 55% |
| A1,1 | 192.32 | |||||||||||||
| A1,2 | 192.32 | |||||||||||||
| A1,3 | 125.57 | |||||||||||||
| Baseline model A2 | 177.32 | −100.23 | 77% | −116.50 | 90% | 0.00 | 0% | 102.83 | −79% | −86.56 | 67% | −29.62 | 23% | |
| A2,1 | 293.83 | |||||||||||||
| A2,2 | 293.83 | |||||||||||||
| A2,3 | 191.00 | |||||||||||||
| Baseline model A3 | 222.84 | −87.24 | 104% | −197.71 | 235% | 0.00 | 0% | 162.49 | −194% | −52.02 | 62% | 3.28 | -4% | |
| A3,1 | 420.55 | |||||||||||||
| A3,2 | 420.55 | |||||||||||||
| A3,3 | 258.06 | |||||||||||||
| Baseline model A4 | 113.20 | −120.60 | 77% | −78.90 | 50% | 0.00 | 0% | 25.46 | −16% | −67.16 | 43% | −36.53 | 23% | |
| A4,1 | 192.10 | |||||||||||||
| A4,2 | 192.10 | |||||||||||||
| A4,3 | 166.64 | |||||||||||||
| Beiwang | Baseline model A1 | 115.44 | −125.05 | 62% | −140.63 | 70% | 0.00 | 0% | 146.54 | −73% | −130.96 | 65% | −76.49 | 38% |
| A1,1 | 256.07 | |||||||||||||
| A1,2 | 256.07 | |||||||||||||
| A1,3 | 109.53 | |||||||||||||
| Baseline model A2 | 139.22 | −155.74 | 81% | −157.34 | 82% | 0.28 | 0% | 136.89 | −71% | −135.56 | 71% | −36.34 | 19% | |
| A2,1 | 296.56 | |||||||||||||
| A2,2 | 296.28 | |||||||||||||
| A2,3 | 159.39 | |||||||||||||
| Baseline model A3 | 207.60 | −93.22 | 95% | −226.54 | 231% | 6.09 | −6% | 224.87 | −229% | −97.64 | 100% | −4.81 | 5% | |
| A3,1 | 434.13 | |||||||||||||
| A3,2 | 428.05 | |||||||||||||
| A3,3 | 203.18 | |||||||||||||
| Baseline model A4 | 107.65 | −195.48 | 93% | −97.74 | 47% | 3.89 | −2% | 35.42 | −17% | −137.04 | 65% | −13.85 | 7% | |
| A4,1 | 205.40 | |||||||||||||
| A4,2 | 201.51 | |||||||||||||
| A4,3 | 166.09 | |||||||||||||
| Dawenkou | Baseline model A1 | 102.80 | −106.33 | 55% | −120.38 | 62% | 3.45 | −2% | 104.03 | −54% | −93.44 | 48% | −87.61 | 45% |
| A1,1 | 223.17 | |||||||||||||
| A1,2 | 219.72 | |||||||||||||
| A1,3 | 115.69 | |||||||||||||
| Baseline model A2 | 128.77 | −111.85 | 75% | −121.89 | 81% | 2.41 | −2% | 86.02 | −58% | −78.40 | 52% | −37.73 | 25% | |
| A2,1 | 250.66 | |||||||||||||
| A2,2 | 248.24 | |||||||||||||
| A2,3 | 162.22 | |||||||||||||
| Baseline model A3 | 215.13 | −79.47 | 146% | −225.57 | 414% | 22.94 | −42% | 180.76 | −332% | −57.61 | 106% | 24.99 | −46% | |
| A3,1 | 440.69 | |||||||||||||
| A3,2 | 417.75 | |||||||||||||
| A3,3 | 236.99 | |||||||||||||
| Baseline model A4 | 78.99 | −152.81 | 88% | −102.75 | 59% | 4.77 | −3% | −0.77 | 0% | −54.06 | 31% | −20.18 | 12% | |
| A4,1 | 181.74 | |||||||||||||
| A4,2 | 176.97 | |||||||||||||
| A4,3 | 177.74 | |||||||||||||
| Daicunba | Baseline model A1 | 72.08 | −111.56 | 58% | −117.41 | 61% | 2.36 | −1% | 70.63 | −37% | −67.15 | 35% | −79.38 | 42% |
| A1,1 | 189.49 | |||||||||||||
| A1,2 | 187.12 | |||||||||||||
| A1,3 | 116.49 | |||||||||||||
| Baseline model A2 | 102.14 | −137.16 | 84% | −130.19 | 79% | 1.66 | −1% | 61.02 | −37% | −69.65 | 42% | −27.03 | 16% | |
| A2,1 | 232.33 | |||||||||||||
| A2,2 | 230.67 | |||||||||||||
| A2,3 | 169.65 | |||||||||||||
| Baseline model A3 | 163.12 | −121.46 | 145% | −228.24 | 272% | 15.77 | −19% | 126.57 | −151% | −35.56 | 42% | 37.69 | −45% | |
| A3,1 | 391.36 | |||||||||||||
| A3,2 | 375.59 | |||||||||||||
| A3,3 | 249.02 | |||||||||||||
| Baseline model A4 | 41.27 | −161.72 | 86% | −113.17 | 60% | 3.25 | −2% | −15.78 | 8% | −36.02 | 19% | −27.27 | 14% | |
| A4,1 | 154.45 | |||||||||||||
| A4,2 | 151.19 | |||||||||||||
| A4,3 | 166.97 | |||||||||||||
| ID | Indicator Name | Definitions | Units |
|---|---|---|---|
| TN10p | Cool nights | Percentage of days when TN < 10th percentile | Days |
| TX10p | Cool days | Percentage of days when TX < 10th percentile | Days |
| TN90p | Warm nights | Percentage of days when TN > 90th percentile | Days |
| TX90p | Warm days | Percentage of days when TX > 90th percentile | Days |
| FD0 | Frost days | Annual count when TN (daily minimum) < 0 °C | Days |
| SU25 | Summer days | Annual count when TX (daily maximum) > 25 °C | Days |
| ID0 | Ice days | Annual count when TX (daily maximum) < 0 °C | Days |
| TR20 | Tropical nights | Annual count when TN (daily minimum) > 20 °C | Days |
| TXx | Max Tmax | Monthly maximum value of daily maximum temp | °C |
| TNx | Max Tmin | Monthly maximum value of daily minimum temp | °C |
| TXn | Min Tmax | Monthly minimum value of daily maximum temp | °C |
| TNn | Min Tmin | Monthly minimum value of daily minimum temp | °C |
| WSDI | Warm spell duration indicator | Annual count of days with at least 6 consecutive days when TX > 90th percentile | Days |
| CSDI | Cold spell duration indicator | Annual count of days with at least 6 consecutive days when TN < 10th percentile | Days |
| DTR | Diurnal temperature range | Monthly mean difference between TX and TN | °C |
| GSL | Growing season Length | Annual (1 January to 31 December in NH, 1 July to 30 June in SH) count between first span of at least 6 days with TG > 5 °C and first span after 1 July (1 January in SH) of 6 days with TG < 5 °C | Days |
| RX1day | Max 1-day precipitation amount | Monthly maximum 1-day precipitation | Mm |
| Rx5day | Max 5-day precipitation amount | Monthly maximum consecutive 5-day precipitation | Mm |
| R95p | Very wet days | Annual total PRCP when RR > 95th percentile | Mm |
| R99p | Extremely wet days | Annual total PRCP when RR > 99th percentile | mm |
| SDII | Simple daily intensity index | Annual total precipitation divided by the number of wet days (defined as PRCP ≥ 1.0 mm) in the year | Mm/day |
| PRCPTOT | Annual total wet-day precipitation | Annual total PRCP in wet days (RR ≥ 1 mm) | mm |
| CDD | Consecutive dry days | Maximum number of consecutive days with RR < 1 mm | Days |
| CWD | Consecutive wet days | Maximum number of consecutive days with RR ≥ 1 mm | Days |
| R10 | Number of heavy precipitation days | Annual count of days when PRCP ≥ 10 mm | Days |
| R20 | Number of very heavy precipitation days | Annual count of days when PRCP ≥ 20 mm | Days |
| Rnn | Number of days above nn mm | Annual count of days when PRCP ≥ nn mm, nn is a user-defined threshold | Days |
Appendix B
Appendix B.1. The Construction of the SWAT Model
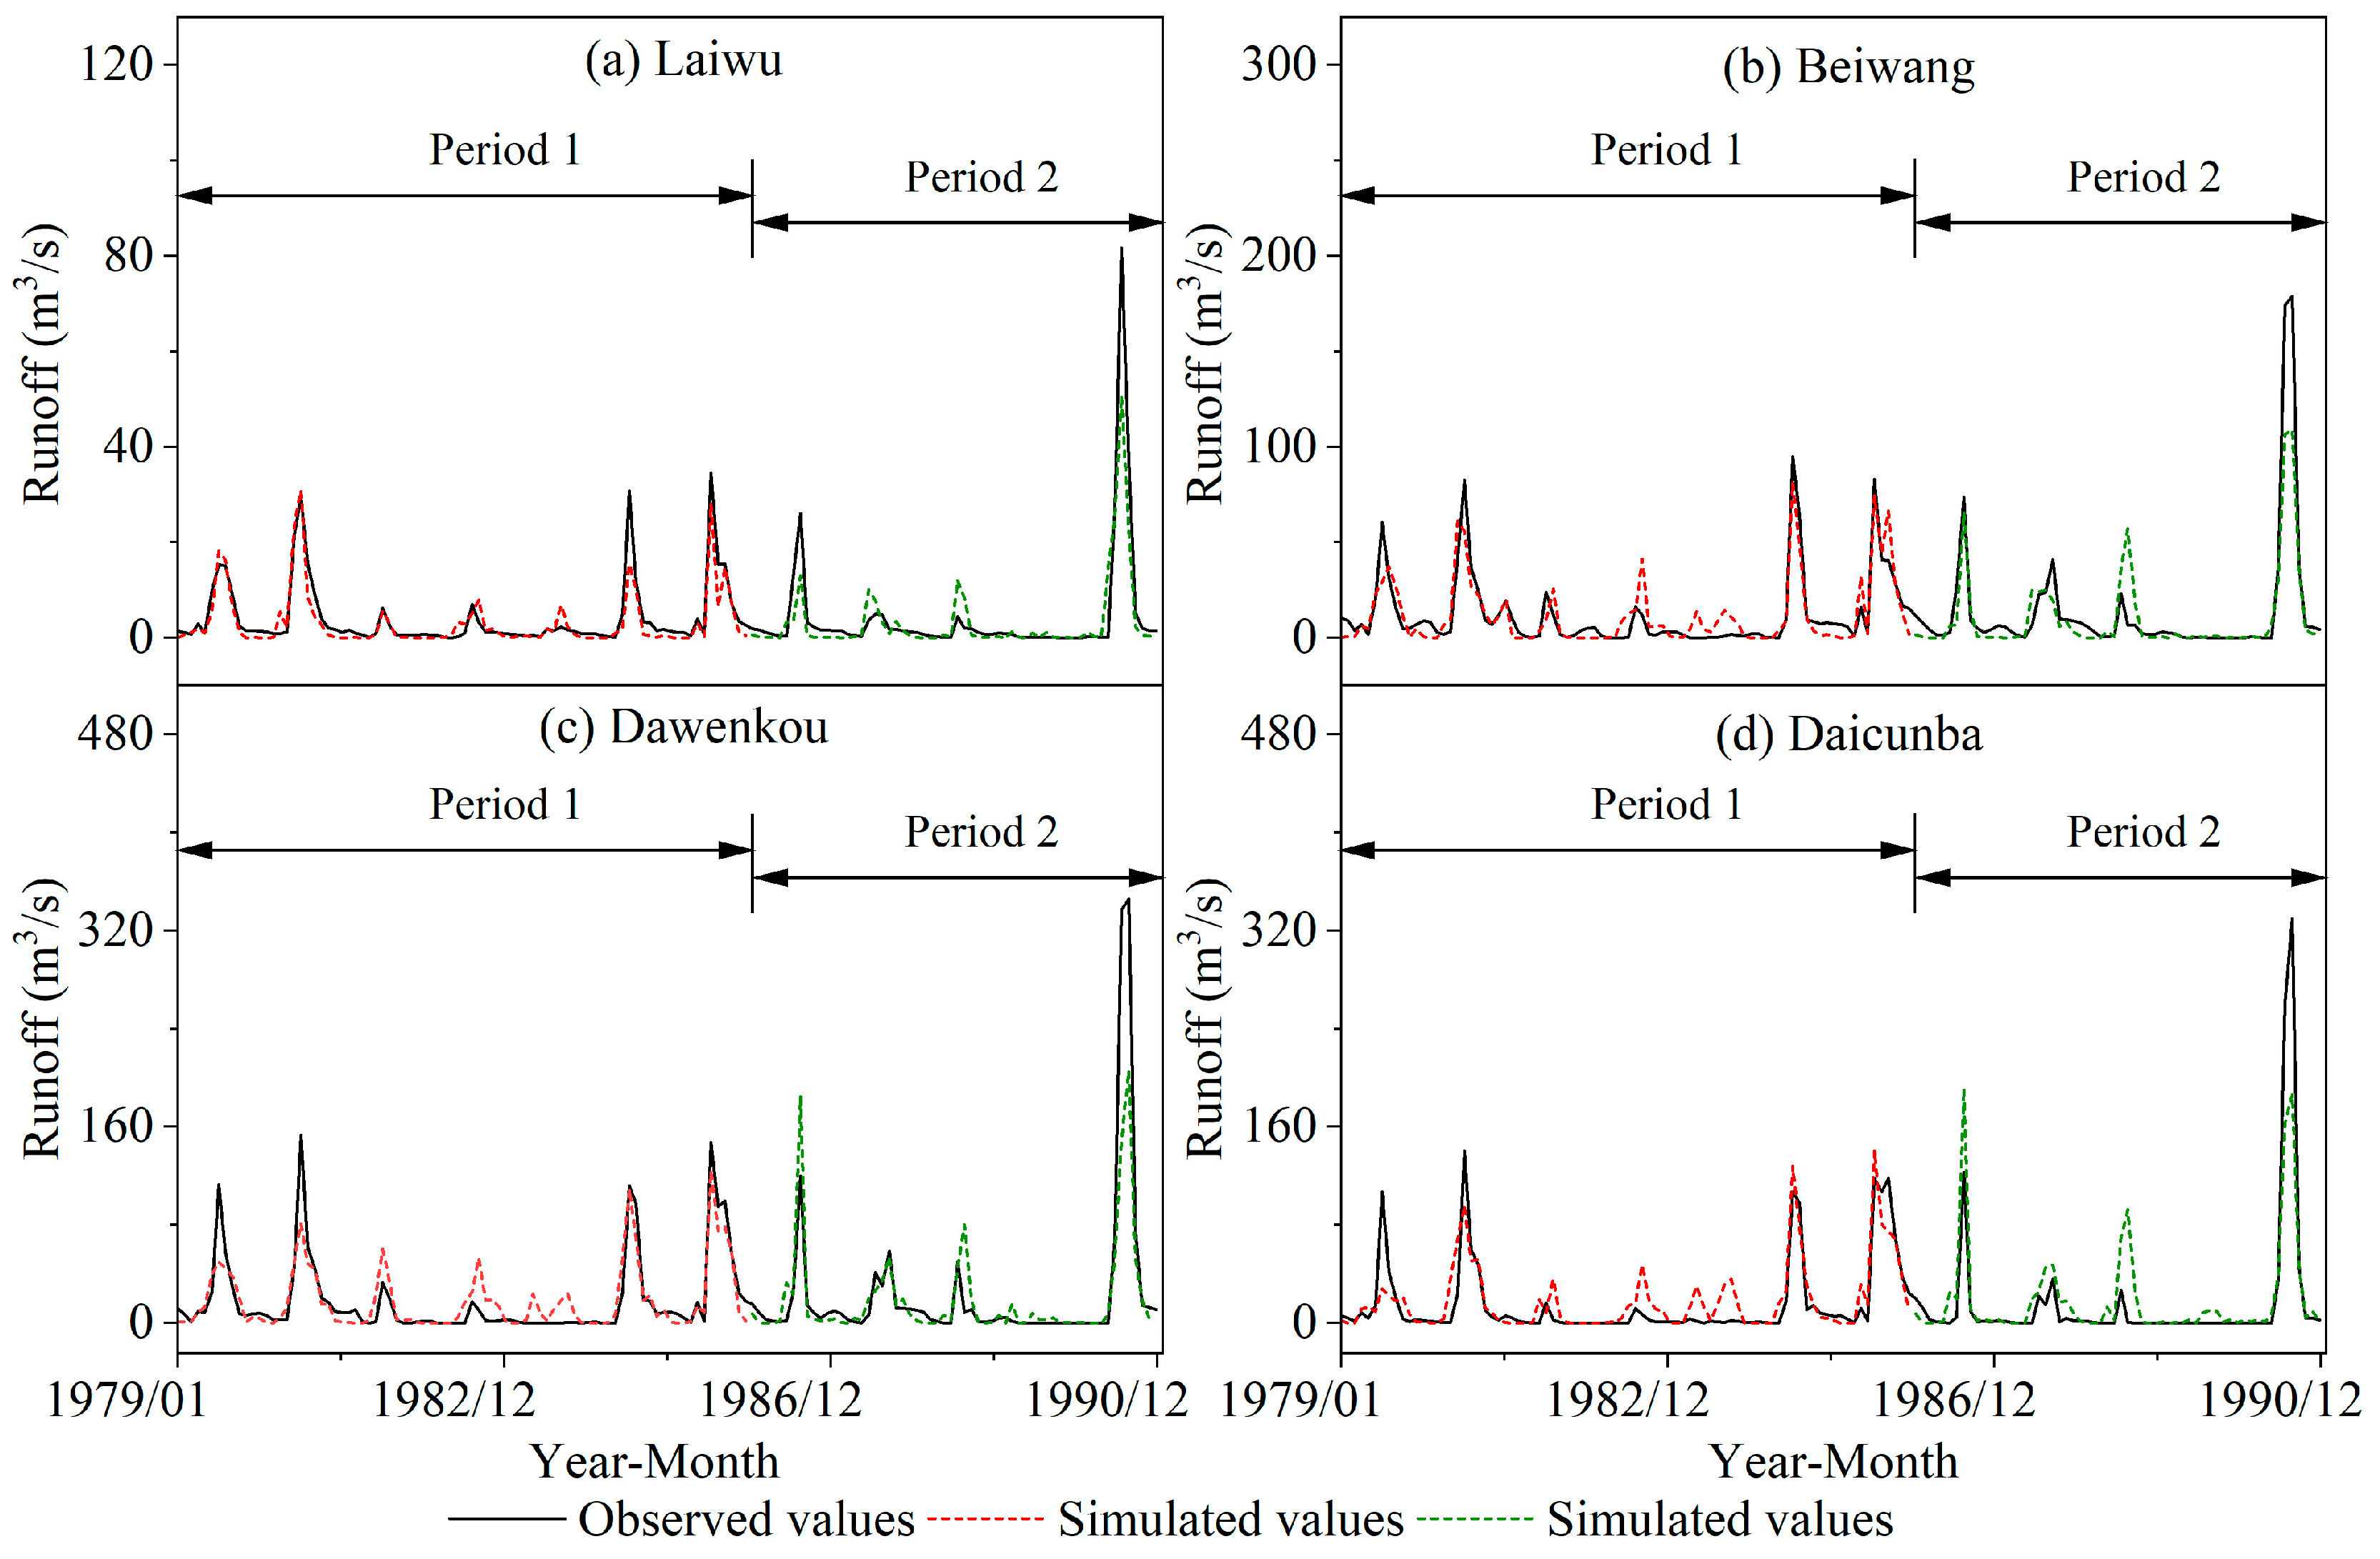
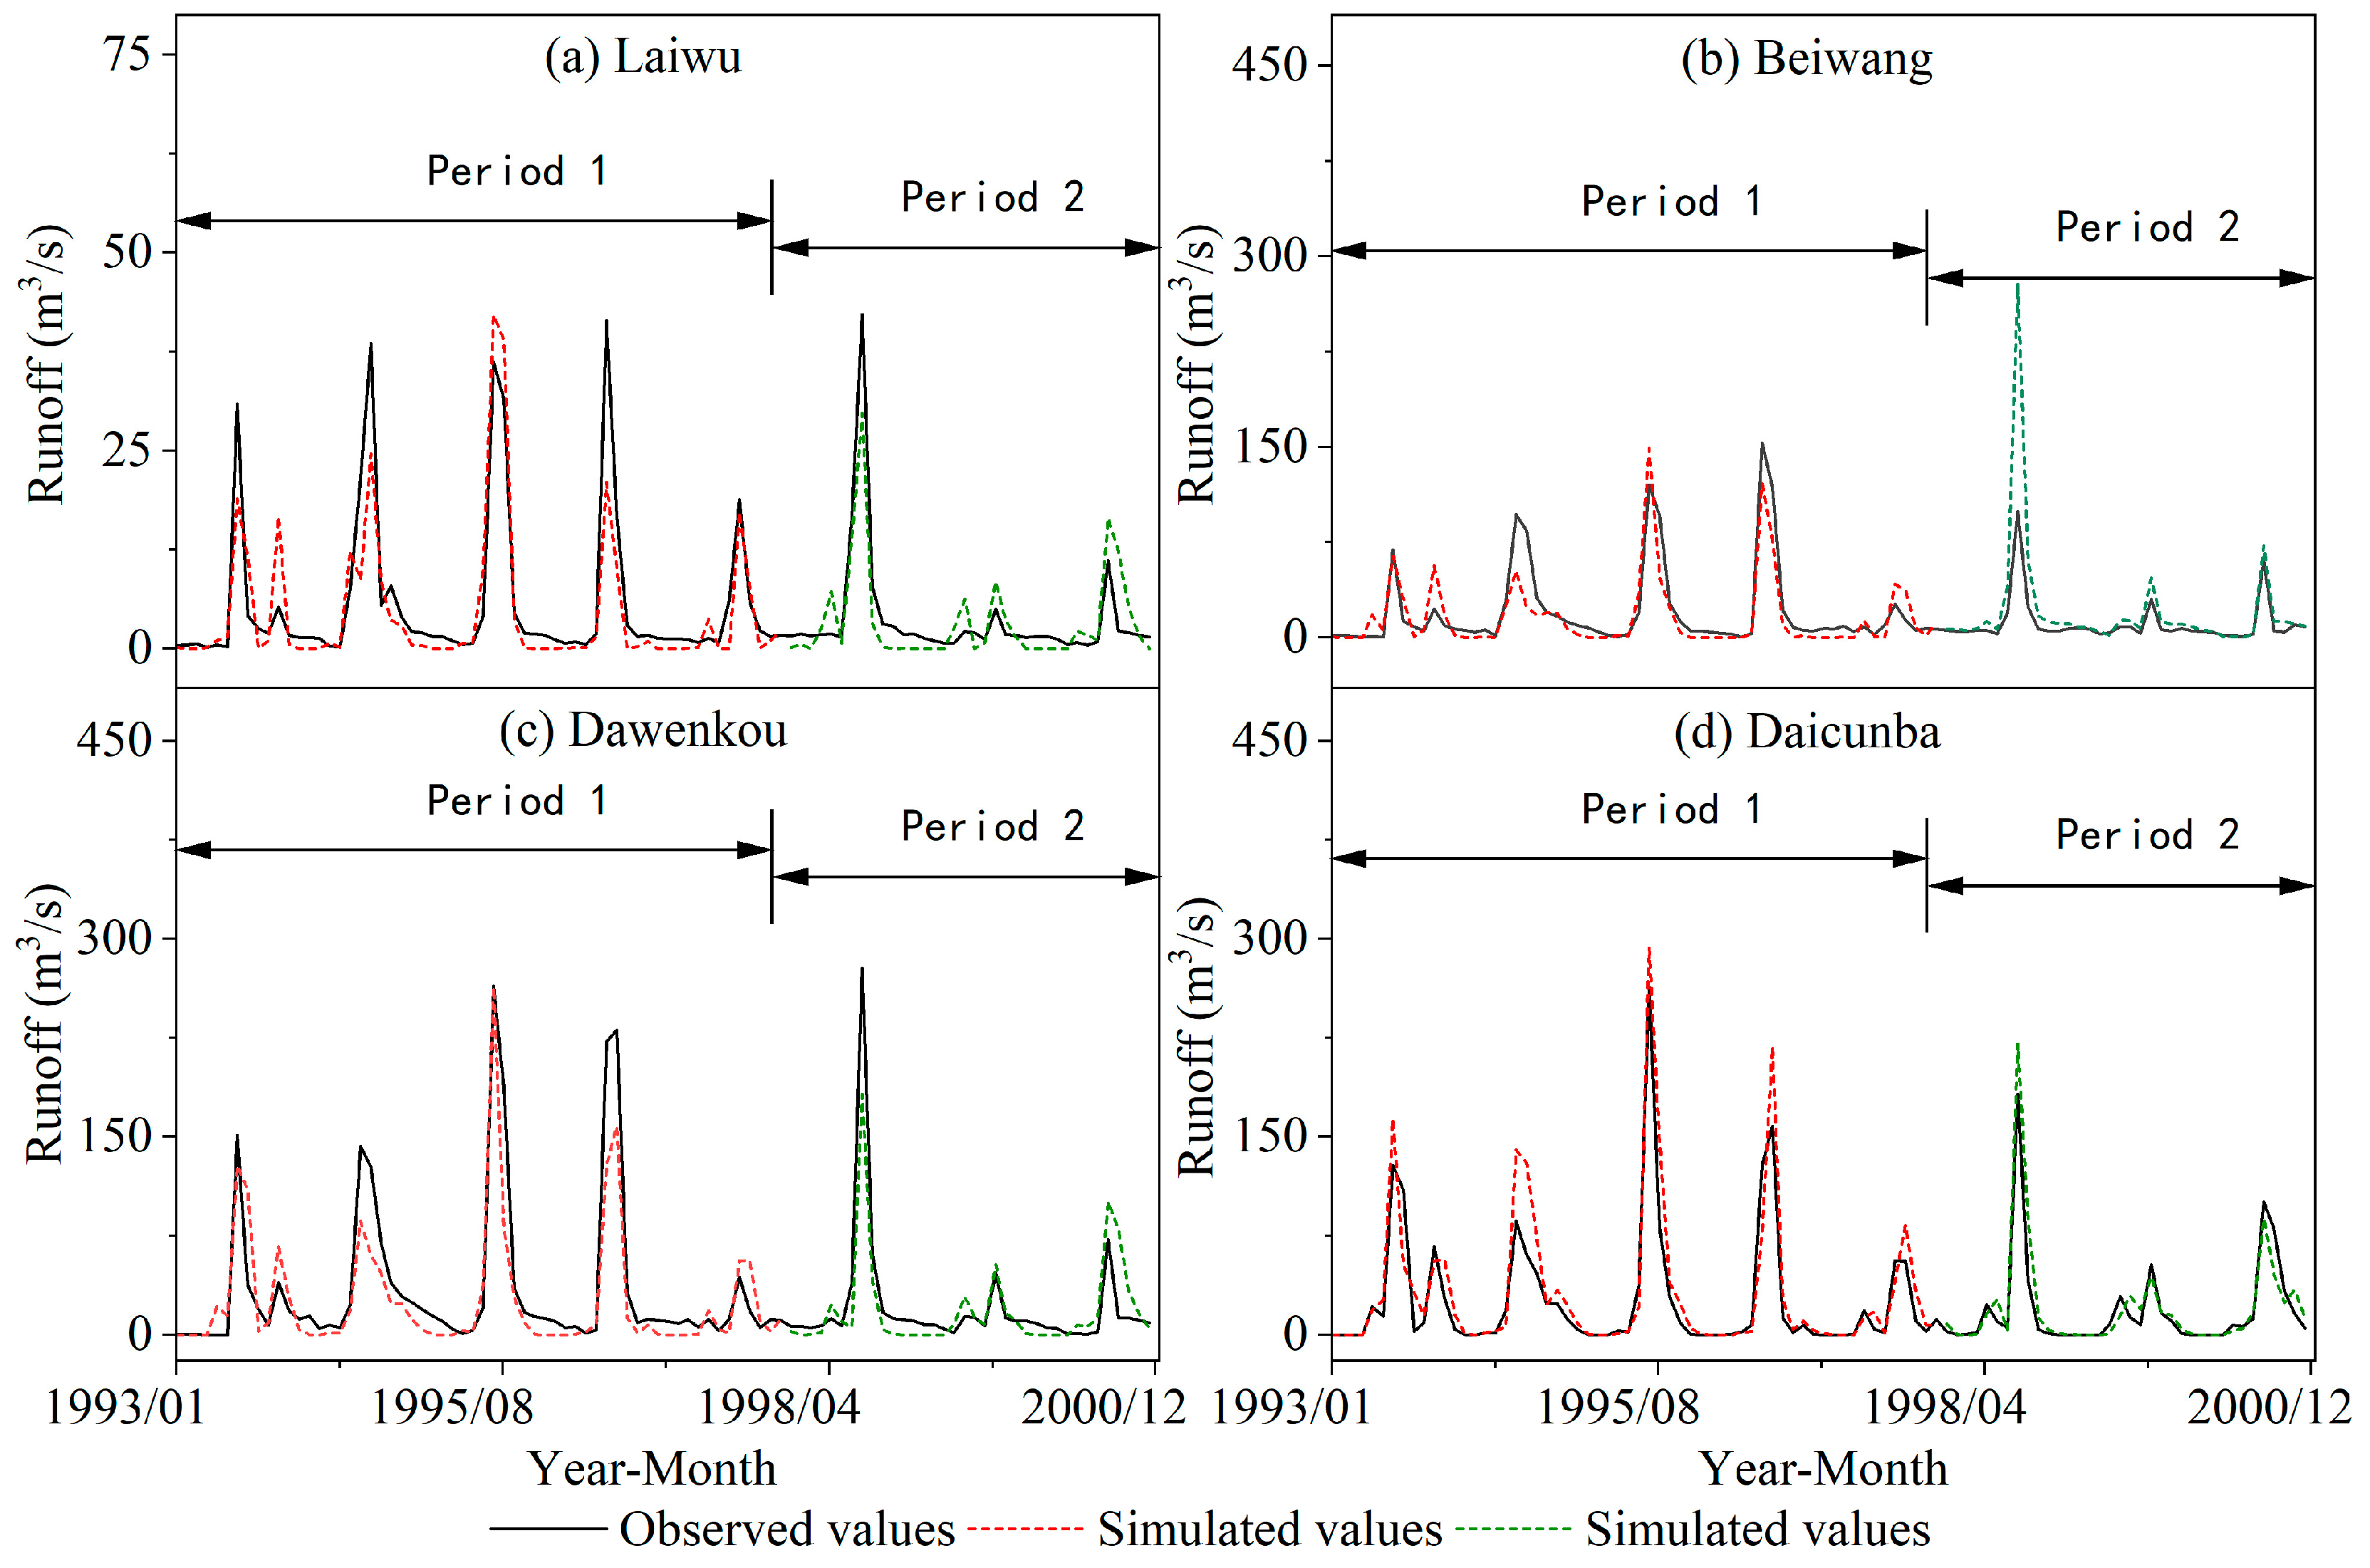
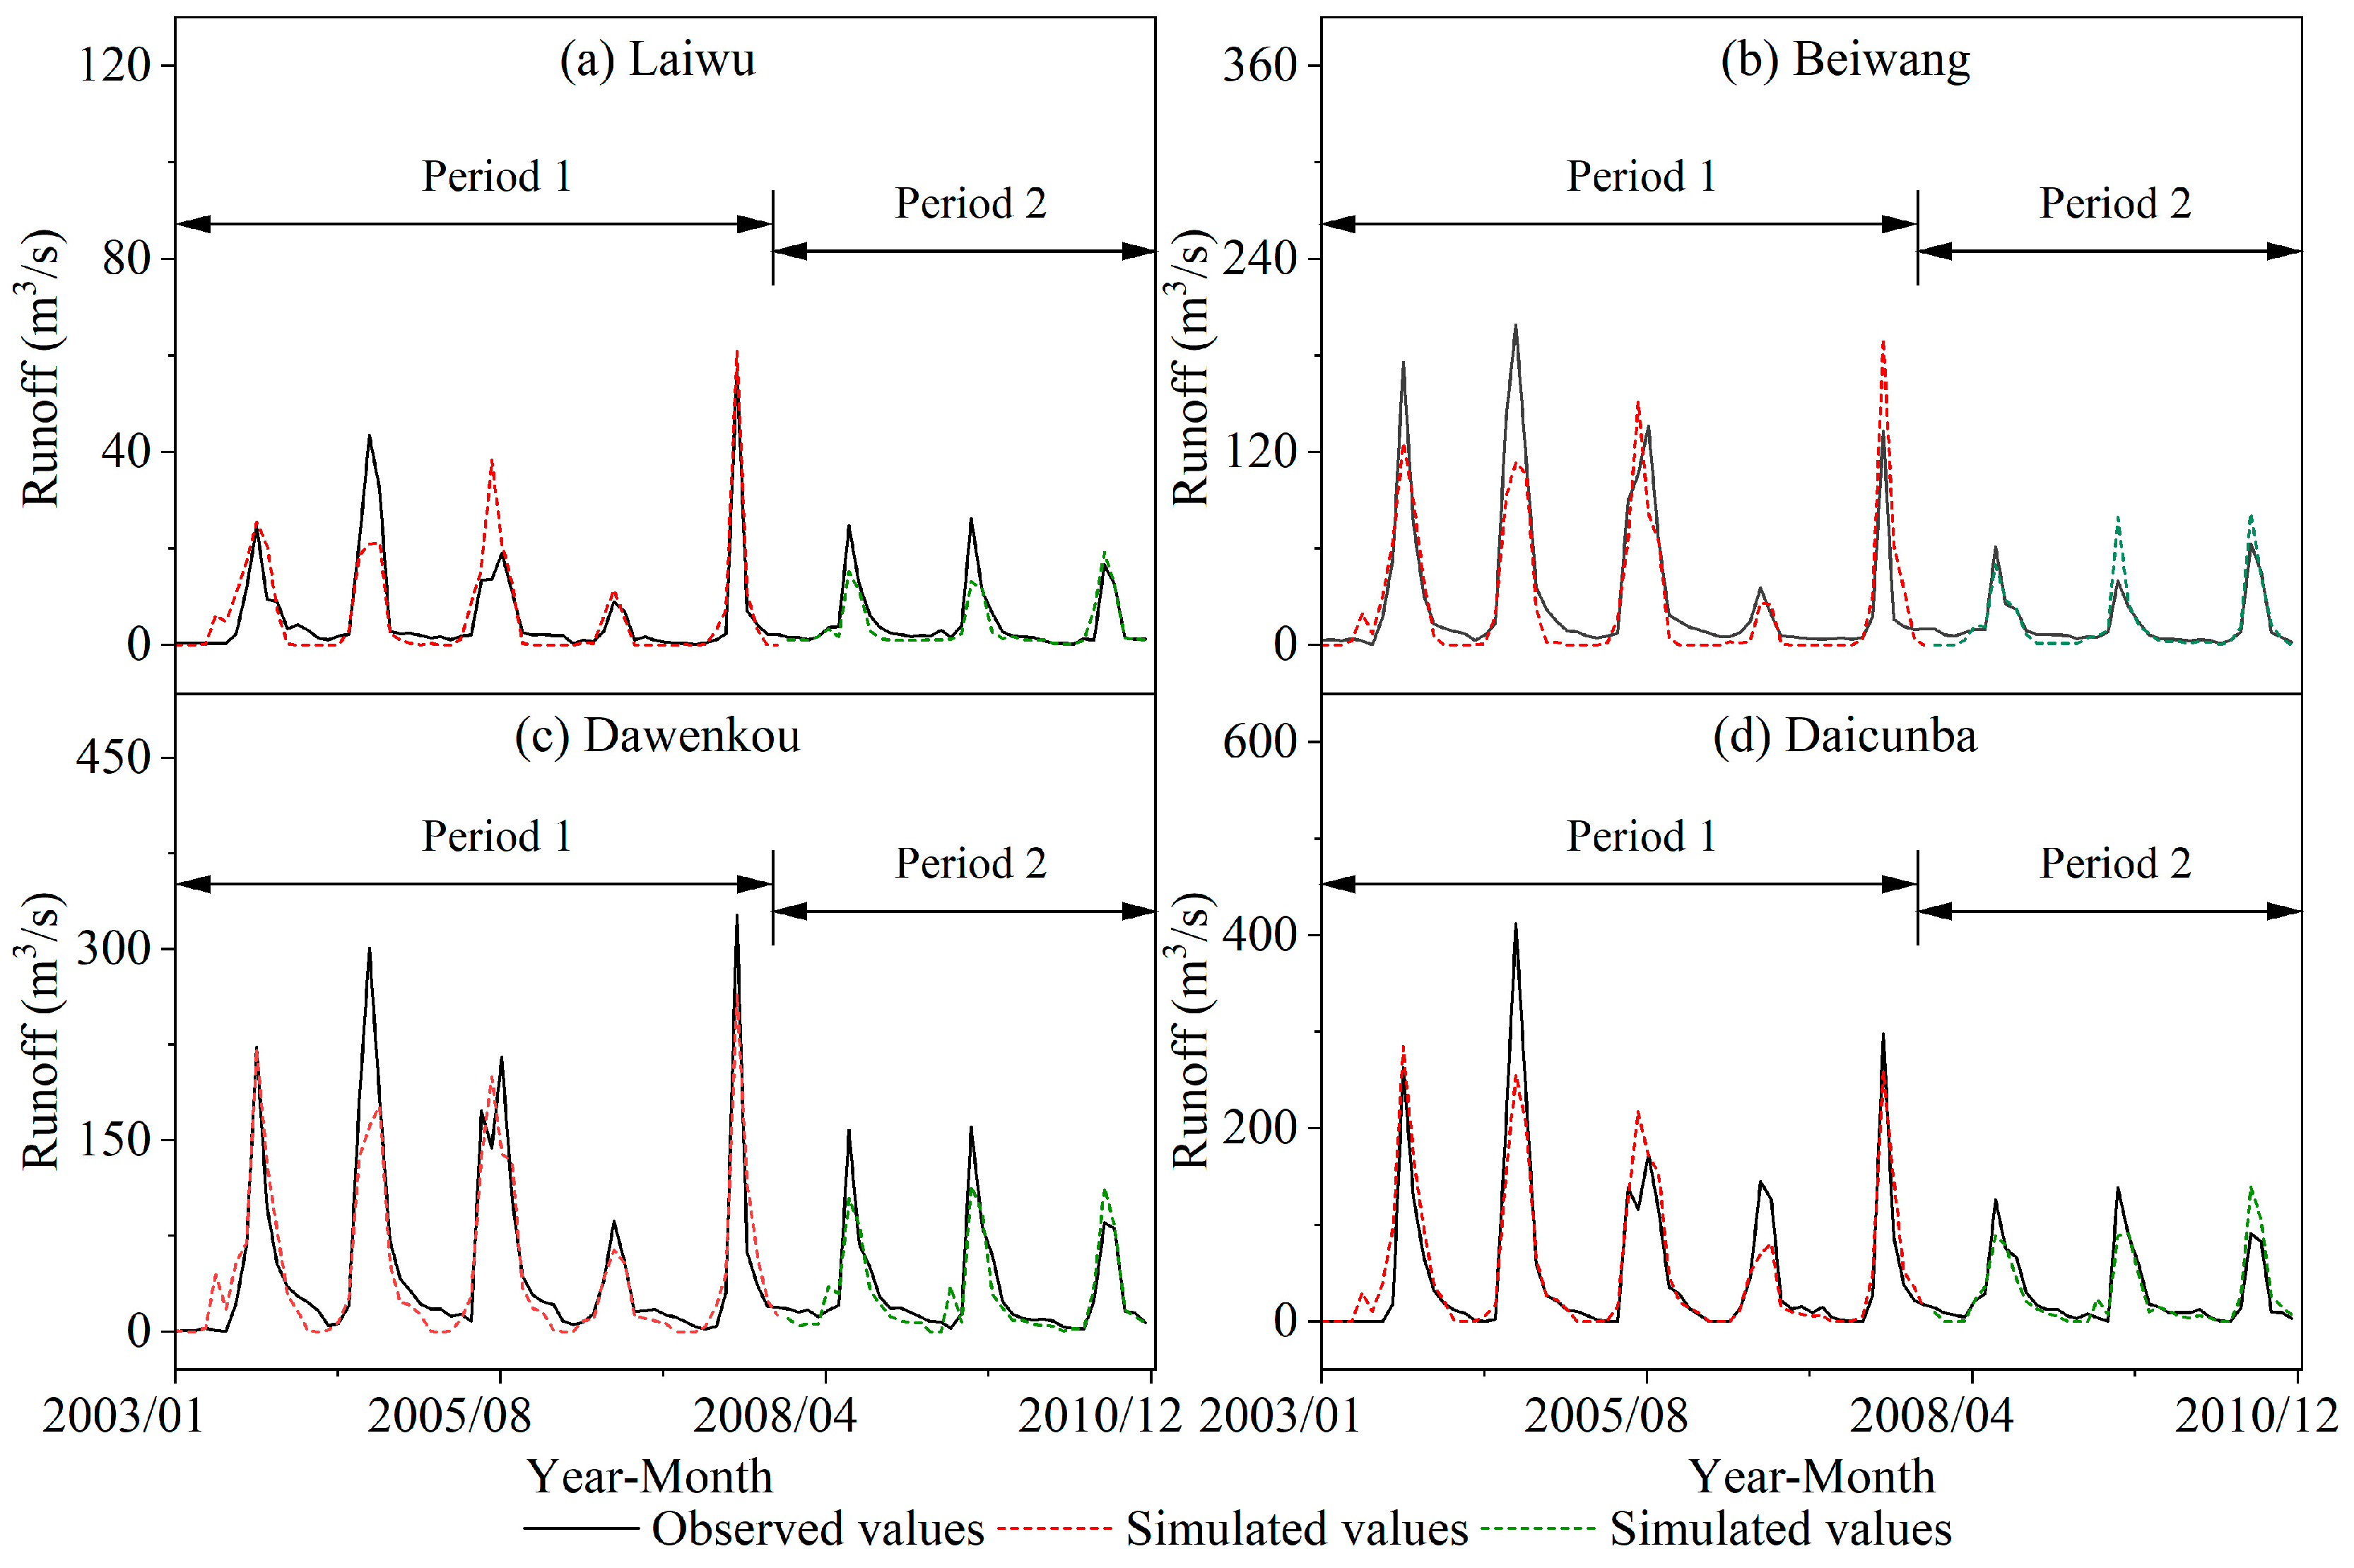
Appendix B.2. The Performance of the SWAT Model
| Model | Period | Laiwu | Beiwang | Dawenkou | Daicunba | ||||||||
|---|---|---|---|---|---|---|---|---|---|---|---|---|---|
| Re | R2 | NSE | Re | R2 | NSE | Re | R2 | NSE | Re | R2 | NSE | ||
| S1 | 1963–1976 | 2.3% | 0.84 | 0.84 | 0.4% | 0.84 | 0.84 | 8.9% | 0.79 | 0.79 | 7.8% | 0.83 | 0.81 |
| 1963–1970 | 8.5% | 0.87 | 0.85 | 10.3% | 0.86 | 0.84 | 2.7% | 0.81 | 0.79 | 4.2% | 0.86 | 0.81 | |
| 1971–1976 | 23.3% | 0.85 | 0.82 | 19.0% | 0.89 | 0.82 | 19.8% | 0.85 | 0.78 | 15.4% | 0.87 | 0.82 | |
| A1 | 1979–1990 | 21.9% | 0.84 | 0.80 | 10.1% | 0.79 | 0.78 | 8.4% | 0.77 | 0.73 | 17.7% | 0.73 | 0.72 |
| 1979–1985 | 21.1% | 0.86 | 0.84 | 1.4% | 0.78 | 0.78 | 0.7% | 0.79 | 0.78 | 16.9% | 0.72 | 0.71 | |
| 1986–1990 | 22.9% | 0.86 | 0.79 | 21.2% | 0.84 | 0.78 | 17.1% | 0.77 | 0.72 | 18.8% | 0.75 | 0.73 | |
| A2 | 1993–2000 | 15.8% | 0.77 | 0.76 | 16.4% | 0.77 | 0.76 | 20.7% | 0.81 | 0.78 | 11.2% | 0.88 | 0.87 |
| 1993–1997 | 19.5% | 0.77 | 0.76 | 19.7% | 0.78 | 0.76 | 24.4% | 0.82 | 0.79 | 8.2% | 0.86 | 0.86 | |
| 1998–2000 | 6.2% | 0.77 | 0.76 | 6.2% | 0.79 | 0.75 | 10.6% | 0.78 | 0.76 | 22.4% | 0.92 | 0.90 | |
| A3 | 2003–2010 | 6.1% | 0.75 | 0.73 | 12.2% | 0.80 | 0.79 | 10.5% | 0.85 | 0.84 | 0.5% | 0.84 | 0.84 |
| 2003–2007 | 2.0% | 0.76 | 0.73 | 15.0% | 0.79 | 0.78 | 9.7% | 0.85 | 0.84 | 2.8% | 0.84 | 0.84 | |
| 2008–2010 | 23.4% | 0.79 | 0.75 | 1.0% | 0.86 | 0.71 | 12.9% | 0.83 | 0.82 | 6.1% | 0.82 | 0.81 | |
| A4 | 2013–2019 | 20.2% | 0.94 | 0.92 | 15.7% | 0.96 | 0.95 | 16.0% | 0.96 | 0.95 | 3.1% | 0.92 | 0.92 |
| 2013–2016 | 20.1% | 0.97 | 0.91 | 21.8% | 0.98 | 0.95 | 18.1% | 0.97 | 0.95 | 15.8% | 0.93 | 0.92 | |
| 2017–2019 | 20.3% | 0.93 | 0.93 | 5.7% | 0.97 | 0.93 | 13.2% | 0.97 | 0.96 | 15.0% | 0.97 | 0.91 | |


References
- Berg, P.; Moseley, C.; Haerter, J.O. Strong Increase in Convective Precipitation in Response to Higher Temperatures. Nat. Geosci. 2013, 6, 181–185. [Google Scholar] [CrossRef]
- IPCC. IPCC Climate Change 2014 Synthesis Report Summary Chapter for Policymakers; IPCC: Geneva, Switzerland, 2014. [Google Scholar]
- Brown, A.E.; Zhang, L.; McMahon, T.A.; Western, A.W.; Vertessy, R.A. A Review of Paired Catchment Studies for Determining Changes in Water Yield Resulting from Alterations in Vegetation. J. Hydrol. 2005, 310, 28–61. [Google Scholar] [CrossRef]
- Wang, S.; Zhang, Z.; McVicar, T.R.; Guo, J.; Tang, Y.; Yao, A. Isolating the Impacts of Climate Change and Land Use Change on Decadal Streamflow Variation: Assessing Three Complementary Approaches. J. Hydrol. 2013, 507, 63–74. [Google Scholar] [CrossRef]
- Prowse, T.D.; Beltaos, S.; Gardner, J.T.; Gibson, J.J.; Granger, R.J.; Leconte, R.; Peters, D.L.; Pietroniro, A.; Romolo, L.A.; Toth, B. Climate Change, Flow Regulation and Land-Use Effects on the Hydrology of the Peace-Athabasca-Slave System; Findings from the Northern Rivers Ecosystem Initiative. Environ. Monit. Assess. 2006, 113, 167–197. [Google Scholar] [CrossRef]
- Ma, Z.; Kang, S.; Zhang, L.; Tong, L.; Su, X. Analysis of Impacts of Climate Variability and Human Activity on Streamflow for a River Basin in Arid Region of Northwest China. J. Hydrol. 2008, 352, 239–249. [Google Scholar] [CrossRef]
- Zhang, X.; Zhang, L.; Zhao, J.; Rustomji, P.; Hairsine, P. Responses of Streamflow to Changes in Climate and Land Use/Cover in the Loess Plateau, China. Water Resour. Res. 2008, 44, 1–12. [Google Scholar] [CrossRef]
- Soldini, L.; Darvini, G. Extreme Rainfall Statistics in the Marche Region, Italy. Hydrol. Res. 2017, 48, 686–700. [Google Scholar] [CrossRef]
- Wang, S.; McVicar, T.R.; Zhang, Z.; Brunner, T.; Strauss, P. Globally Partitioning the Simultaneous Impacts of Climate-Induced and Human-Induced Changes on Catchment Streamflow: A Review and Meta-Analysis. J. Hydrol. 2020, 590, 125387. [Google Scholar] [CrossRef]
- Libertino, A.; Ganora, D.; Claps, P. Evidence for Increasing Rainfall Extremes Remains Elusive at Large Spatial Scales: The Case of Italy. Geophys. Res. Lett. 2019, 46, 7437–7446. [Google Scholar] [CrossRef]
- Zhang, X.; Zwiers, F.W.; Hegerl, G.C.; Lambert, F.H.; Gillett, N.P.; Solomon, S.; Stott, P.A.; Nozawa, T. Detection of Human Influence on Twentieth-Century Precipitation Trends. Nature 2007, 448, 461–465. [Google Scholar] [CrossRef]
- Xia, J.; Chen, J.; She, D. Impacts and Countermeasures of Extreme Drought in the Yangtze River Basin in 2022. J. Hydraul. Eng. 2022, 53, 1143–1153. [Google Scholar] [CrossRef]
- Chahine, M.T. The Hydrological Cycle and Its Influence on Climate. Nature 1992, 359, 373–380. [Google Scholar] [CrossRef]
- Du, H.; Xia, J.; Yan, Y.; Lu, Y.; Li, J. Spatiotemporal Variations of Extreme Precipitation in Wuling Mountain Area (China) and Their Connection to Potential Driving Factors. Sustainability 2022, 14, 8312. [Google Scholar] [CrossRef]
- Engel, T.; Fink, A.; Knippertz, P. Extreme Flooding in the West African Cities of Dakar and Ouagadougou—Atmospheric Dynamics and Implications for Flood Risk Assessments. EGUGA 2017, 19, 11983. [Google Scholar]
- Wallemacq, P.; House, R. Economic Losses, Poverty & Disasters: 1998–2017; UNDRR: Geneva, Switzerland, 2018. [Google Scholar] [CrossRef]
- Milly, P.C.D.; Dunne, K.A.; Vecchia, A.V. Global Pattern of Trends in Streamflow and Water Availability in a Changing Climate. Nature 2005, 438, 347–350. [Google Scholar] [CrossRef]
- Sharifi, A.; Mirchi, A.; Pirmoradian, R.; Mirabbasi, R.; Tourian, M.J.; Haghighi, A.T.; Madani, K. Battling Water Limits to Growth: Lessons from Water Trends in the Central Plateau of Iran. Environ. Manag. 2021, 68, 53–64. [Google Scholar] [CrossRef]
- Salmoral, G.; Willaarts, B.A.; Troch, P.A.; Garrido, A. Drivers Influencing Streamflow Changes in the Upper Turia Basin, Spain. Sci. Total Environ. 2015, 503–504, 258–268. [Google Scholar] [CrossRef]
- The Water Cycle|U.S. Geological Survey. Available online: https://www.usgs.gov/special-topics/water-science-school/science/water-cycle (accessed on 3 April 2025).
- Jaramillo, F.; Destouni, G. Local Flow Regulation and Irrigation Raise Global Human Water Consumption and Footprint. Science 2015, 350, 1248–1251. [Google Scholar] [CrossRef]
- Song, X.; Zhang, J.; Zhan, C.; Liu, C. Review for Impacts of Climate Change and Human Activities on Water Cycle. J. Hydraul. Eng. 2013, 44, 779–790. [Google Scholar] [CrossRef]
- Xia, J.; Zhan, C.; Zeng, S.; Zou, L.; She, D.; Zuo, Q. Theoretical Method and Practical Exploration of Yangtze River Simulator Construction. Shuili Xuebao/J. Hydraul. Eng. 2022, 53, 505–514. [Google Scholar] [CrossRef]
- Xia, J.; Zeng, S.; Du, C.; Zhan, H. Quantifying the Effects of Climate Change and Human Activities on Runoff in the Water Source Area of Beijing, China. Hydrol. Sci. J. 2014, 59, 1794–1807. [Google Scholar] [CrossRef]
- Ma, H.; Yang, D.; Tan, S.K.; Gao, B.; Hu, Q. Impact of Climate Variability and Human Activity on Streamflow Decrease in the Miyun Reservoir Catchment. J. Hydrol. 2010, 389, 317–324. [Google Scholar] [CrossRef]
- Zheng, H.; Zhang, L.; Zhu, R.; Liu, C.; Sato, Y.; Fukushima, Y. Responses of Streamflow to Climate and Land Surface Change in the Headwaters of the Yellow River Basin. Water Resour. Res. 2009, 45, 1–12. [Google Scholar] [CrossRef]
- Wang, W.; Shao, Q.; Yang, T.; Peng, S.; Xing, W.; Sun, F.; Luo, Y. Quantitative Assessment of the Impact of Climate Variability and Human Activities on Runoff Changes: A Case Study in Four Catchments of the Haihe River Basin, China. Hydrol. Process. 2013, 27, 1158–1174. [Google Scholar] [CrossRef]
- Poelmans, L.; Van Rompaey, A.; Ntegeka, V.; Willems, P. The Relative Impact of Climate Change and Urban Expansion on Peak Flows: A Case Study in Central Belgium. Hydrol. Process. 2011, 25, 2846–2858. [Google Scholar] [CrossRef]
- D’Agostino, D.R.; Trisorio, L.G.; Lamaddalena, N.; Ragab, R. Assessing the Results of Scenarios of Climate and Land Use Changes on the Hydrology of an Italian Catchment: Modelling Study. Hydrol. Process. 2010, 24, 2693–2704. [Google Scholar] [CrossRef]
- Saidi, H.; Dresti, C.; Manca, D.; Ciampittiello, M. Quantifying Impacts of Climate Variability and Human Activities on the Streamflow of an Alpine River. Environ. Earth Sci. 2018, 77, 690. [Google Scholar] [CrossRef]
- Arnell, N.W. Climate Change and Global Water Resources. Glob. Environ. Change 1999, 9, S31–S49. [Google Scholar] [CrossRef]
- Cheng, S.J.; Wang, R.Y. An Approach for Evaluating the Hydrological Effects of Urbanization and Its Application. Hydrol. Process. 2002, 16, 1403–1418. [Google Scholar] [CrossRef]
- Bronstert, A.; Niehoff, D.; Brger, G. Effects of Climate and Land-Use Change on Storm Runoff Generation: Present Knowledge and Modelling Capabilities. Hydrol. Process. 2002, 16, 509–529. [Google Scholar] [CrossRef]
- Foley, J.A.; DeFries, R.; Asner, G.P.; Barford, C.; Bonan, G.; Carpenter, S.R.; Chapin, F.S.; Coe, M.T.; Daily, G.C.; Gibbs, H.K.; et al. Global Consequences of Land Use. Science 2005, 309, 570–574. [Google Scholar] [CrossRef] [PubMed]
- Oki, T.; Kanae, S. Global Hydrological Cycles and World Water Resources. Science 2006, 313, 1068–1072. [Google Scholar] [CrossRef] [PubMed]
- Liang, W.; Bai, D.; Wang, F.; Fu, B.; Yan, J.; Wang, S.; Yang, Y.; Long, D.; Feng, M. Quantifying the Impacts of Climate Change and Ecological Restoration on Streamflow Changes Based on a Budyko Hydrological Model in China’s Loess Plateau. Water Resour. Res. 2015, 51, 6500–6519. [Google Scholar] [CrossRef]
- Li, T.; Xia, J. Analysis of the Influence of Climate and Vegetation Change on Runoff Inthe Middle and Upper Reaches of the Pearl River Basin Based on Budyko Hypothesis. Adv. Earth Sci. 2018, 1248–1258. [Google Scholar] [CrossRef]
- People’s Government of Taishan District, Tai’an City. Notice on Issuing and Implementing the Modern Water Network Construction Plan of Taishan District, Tai’an City (2021–2035) (No. Taishan Zheng Zi [2022] 7) [Government Document]. 2022. Available online: http://www.sdtaishan.gov.cn/art/2022/12/27/art_181324_11765.html (accessed on 22 April 2025).
- Buishand, T.A. Some Methods for Testing the Homogeneity of Rainfall Records. J. Hydrol. 1982, 58, 11–27. [Google Scholar] [CrossRef]
- Searcy, J.K.; Hardison, C.H. Double-Mass Curves, Manual of Hydrology: Part 1. General Surface-Water Techniques, With a Section “Fitting Curves to Cyclic Data”; Geological Survey Water-Supply Paper 1541-B; Searcy, J., Ed.; United States Government Printing Office: Washington, DC, USA, 1960; pp. 1540–1545. [Google Scholar]
- Zhang, L.; Ma, J.; Zhang, Q.; Yu, R.; Ren, B.; Wang, Y.; Zhang, Y. Characteristics of Runoff-Sediment Variation of Dongting Lake in Recent Six Decades and Lts Relationship with Human Activities. J. Chang. River Sci. Res. 2021, 38, 14–20. [Google Scholar]
- Peng, T.; Jia, Y.; Liu, H. KHU Soon-Thiam Attribution of Runoff Attenuation in the Yongding River Basin Upstream of the Sanjiadian. Hydro-Sci. Eng. 2022, 1, 67–76. [Google Scholar]
- Xia, J.; Yang, X.Y.; Liu, J.; Wang, M.; Li, J. Dominant Change Pattern of Extreme Precipitation and Its Potential Causes in Shandong Province, China. Sci. Rep. 2022, 12, 858. [Google Scholar] [CrossRef]
- Yang, X.; Xia, J.; Liu, J.; Li, J.; Wang, M.; Li, Y. Evolutionary Characteristics of Runoff in a Changing Environment: A Case Study of Dawen River, China. Water 2023, 15, 636. [Google Scholar] [CrossRef]
- Wang, G.; Zhang, J.; Guan, X.; Bao, Z.; Liu, Y.; He, R.; Jin, J.; Liu, C.; Chen, X. Quantifying Attribution of Runoff Change for Major Rivers in China. Adv. Water Sci. 2020, 31, 313–323. [Google Scholar]


| Function | Description | Instructions |
|---|---|---|
| Schreiber | No parameters | |
| Ol’dekop | ||
| Budyko | ||
| Tirc–Pike | ||
| Fu | One parameter | |
| Zhang et al. | ||
| Choudhury–Yang |
| Model | Period | Warm-Up Period | Validation Period | Calibration Period | |
|---|---|---|---|---|---|
| Natural Period S1 | 1960~1976 | 1961~1962 | 1963~1969 | 1970~1977 | |
| Human Activity Period S2 | A1 | 1977~1990 | 1977~1979 | 1980~1985 | 1986~1990 |
| A2 | 1991~2000 | 1989~1990 | 1991~1995 | 1996~2000 | |
| A3 | 2001~2010 | 1999~2000 | 2001~2005 | 2006~2010 | |
| A4 | 2011~2019 | 2009~2010 | 2011~2015 | 2016~2019 | |
| Scenario Name | Hydrometeorological Data | Reservoir and Consumptive Water Use Data | LUCC Data |
|---|---|---|---|
| Natural Period S1 | 1961–1976 | 1961–1976 | 1980 |
| Human Activity Period S2 | 1977–2019 | 1961–1976 | 1980 |
| Human Activity Period S3 | 1977–1990 | 1961–1976 | 1980 |
| Human Activity Period S4 | 1991–2000 | 1961–1976 | 1980 |
| Human Activity Period S5 | 2001–2010 | 1961–1976 | 1980 |
| Human Activity Period S6 | 2011–2019 | 1961–1976 | 1980 |
| Scenario | Period | LUCC | Reservoir Operation | Consumptive Water Activities |
|---|---|---|---|---|
| Baseline A1 | 1977–1990 | 1990 | √ 1 | √ |
| A1,1 | √ | × 2 | ||
| A1,2 | × | × | ||
| A1,3 | 1977–1990 | 1980 | × | × |
| Baseline A2 | 1991–2000 | 2000 | √ | √ |
| A2,1 | √ | × | ||
| A2,2 | × | × | ||
| A2,3 | 1991–2000 | 1980 | × | × |
| Baseline A3 | 2001–2010 | 2010 | √ | √ |
| A3,1 | √ | × | ||
| A3,2 | × | × | ||
| A3,3 | 2001–2010 | 1980 | × | × |
| Baseline A4 | 2011–2019 | 2018 | √ | √ |
| A4,1 | √ | × | ||
| A4,2 | × | × | ||
| A4,3 | 2011–2019 | 1980 | × | × |
Disclaimer/Publisher’s Note: The statements, opinions and data contained in all publications are solely those of the individual author(s) and contributor(s) and not of MDPI and/or the editor(s). MDPI and/or the editor(s) disclaim responsibility for any injury to people or property resulting from any ideas, methods, instructions or products referred to in the content. |
© 2025 by the authors. Licensee MDPI, Basel, Switzerland. This article is an open access article distributed under the terms and conditions of the Creative Commons Attribution (CC BY) license (https://creativecommons.org/licenses/by/4.0/).
Share and Cite
Huang, C.; Yang, Z.; Yang, X.; Ma, H.; Yang, Y.; Zhang, J. Attribution Analysis of Runoff Change in a Changing Environment: A Case Study of the Dawen River Basin. Water 2025, 17, 1538. https://doi.org/10.3390/w17101538
Huang C, Yang Z, Yang X, Ma H, Yang Y, Zhang J. Attribution Analysis of Runoff Change in a Changing Environment: A Case Study of the Dawen River Basin. Water. 2025; 17(10):1538. https://doi.org/10.3390/w17101538
Chicago/Turabian StyleHuang, Chuan, Zhizhou Yang, Xuyang Yang, Huan Ma, Yinke Yang, and Jincheng Zhang. 2025. "Attribution Analysis of Runoff Change in a Changing Environment: A Case Study of the Dawen River Basin" Water 17, no. 10: 1538. https://doi.org/10.3390/w17101538
APA StyleHuang, C., Yang, Z., Yang, X., Ma, H., Yang, Y., & Zhang, J. (2025). Attribution Analysis of Runoff Change in a Changing Environment: A Case Study of the Dawen River Basin. Water, 17(10), 1538. https://doi.org/10.3390/w17101538