Article

Mountain Flood Risk: A Bibliometric Exploration Across Three Decades

1
Zhejiang Institute of Hydraulics & Estuary (Zhejiang Institute of Marine Planning and Design), Hangzhou 310020, China
2
Yuhang District Forestry and Water Conservancy Bureau, Hangzhou 310020, China
*
Author to whom correspondence should be addressed.
Water 2025, 17(10), 1513; https://doi.org/10.3390/w17101513
Submission received: 14 March 2025 / Revised: 9 May 2025 / Accepted: 15 May 2025 / Published: 16 May 2025
(This article belongs to the Section Hydrology)

Abstract

:
Climate change, intensified human activities, and ecological shifts have markedly increased mountain flood risks, threatening communities in vulnerable highland regions. This study used CiteSpace (6.2R6) and VOSviewer (1.6.20) to analyze 1841 Web of Science Core Collection articles (1995–2024), mapping publication and citation trends, leading countries and institutions, co-citation networks, and keyword dynamics. We found an exponential increase in output (CAGR 15.8%), peaking at 211 articles in 2024. China (23.7%, 436 articles), the United States (17.8%, 328), Italy (8.6%, 159), India (5.5%, 101), and Japan (4.2%, 77) are leading research countries in the field, which is underpinned by extensive international collaboration. The research spans diverse domains with robust interdisciplinary integration. Keyword timeline and burst analyses reveal emerging topics—machine learning-enhanced risk assessment, climate-driven flood dynamics in the Himalayas and Alps, hydrological process modeling, and socio-economic impact evaluation—pointing toward advanced, region-tailored solutions.

1. Introduction

Flash floods, triggered by intense precipitation, chiefly strike mountainous and hilly regions [1,2,3,4]. Steep slopes and fragile ecosystems accelerate their onset and magnify their destructive force, imperiling downstream communities [5,6,7]. Climate change has amplified the frequency and severity of extreme weather, elevating the risk of flash floods—which now cause roughly 85% of global flood fatalities (WMO) [8,9,10]—and making rigorous risk assessments vital for enhancing early-warning systems and guiding mitigation to reduce socio-economic losses [11,12]. As climate warming intensifies, a robust, science-based risk assessment framework is more urgent than ever.
A risk assessment underpins mountain flood management by delineating hazards, gauging vulnerabilities, and directing evidence-based interventions. Quantifying flood impacts strengthens preparedness, response, and recovery, thereby boosting resilience and minimizing socio-economic damage [13,14].
Since the 1990s, scholarly output on this topic has grown sharply, reflecting heightened concern [15,16,17,18,19,20]. Modern GIS and remote sensing techniques now fuse real-time data and analytics [21,22,23] to map risk zones using topographic, hydrological, precipitation, and soil datasets. Machine learning methods, particularly ensemble models and uncertainty frameworks, have further improved the predictive accuracy across hydrological and socio-ecological domains [24].
These expanding publication trends not only reflect growing academic interest but also signal an urgent policy imperative: translating bibliometric insights into adaptive governance, resource allocation, and community-based early-warning strategies is essential for bridging the gap between research and practice.
Nevertheless, key challenges remain: data scarcity in remote regions undermines model reliability [25], AI’s opacity limits its value for decision support, and many regional models lack transferability [26,27,28]. Future work should integrate diverse data streams, improve transparency via visualization and causal approaches [29], and pursue transboundary studies that bridge climatic and socio-economic factors [30]. Interdisciplinary collaboration will be essential for tackling the flood risk’s complexity and delivering actionable insights under mounting climate pressures [31].
A bibliometric analysis offers powerful, quantitative insights into the extensive literature corpora, revealing publication trends, core challenges, scholarly dynamics, and collaboration networks [32]. Tools such as CiteSpace (6.2R6), with its k-means clustering, burst-detection algorithms, and Louvain method; VOSviewer (1.6.20) for co-occurrence mapping; BibExcel (2015) for bibliographic preprocessing; and influence-mapping techniques such as PageRank, HITS, and spectral clustering [33] establish a rigorous foundation for both comprehensive reviews and exploratory research.
By systematically synthesizing existing studies, bibliometrics uncovers prevailing themes, persistent gaps, and emerging frontiers [34]. High-frequency keywords and thematic analyses yield precise insights into the field’s evolving focus [35], while network mapping of leading institutions and scholars highlights strategic collaboration opportunities. In this way, bibliometric approaches not only deepen domain knowledge but also underpin evidence-based advances in flood risk science.
However, despite this rich body of literature, significant gaps remain: recent studies have seldom integrated socio-economic vulnerability indices into predictive frameworks (Smith et al., 2023) [36], overlooked the unique geomorphological complexities in remote sensing-based early-warning systems (Zhang et al., 2022) [37], and underexplored the transferability of machine learning models across diverse mountain catchments (Garcia et al., 2024) [38]. Addressing these gaps is critical for developing more holistic, regionally adaptable risk assessment approaches.
This study utilizes quantitative bibliometric approaches to systematically evaluate the voluminous literature on mountain flood risk assessments from 1995 to 2024. The investigation is structured around three principal objectives:
  • Elucidating research trends and drivers–by examining annual publication output over a 30-year period, this study delineates the evolution of global research activity, emphasizes its scientific importance, and analyzes the underlying factors driving these developments.
  • Examining collaboration networks and academic contributions—this study maps the spatial distribution of leading contributing countries and institutional networks while analyzing patterns of international collaboration and their temporal evolution; it further elucidates national academic contributions and the topological framework of transnational cooperation, assessing the strength, influence, and scope of international and interdisciplinary collaborations among research institutions.
  • Characterizing research hotspots and frontiers—employing keyword co-occurrence and clustering analyses, this study traces the dynamic evolution of research themes; identifies core domains, current hotspots, and emerging frontiers; and delineates underexplored areas.
Through this systematic synthesis, this study provides researchers with a comprehensive perspective on the field’s developmental trajectory, thereby facilitating the identification of critical research priorities and establishing a robust theoretical foundation.

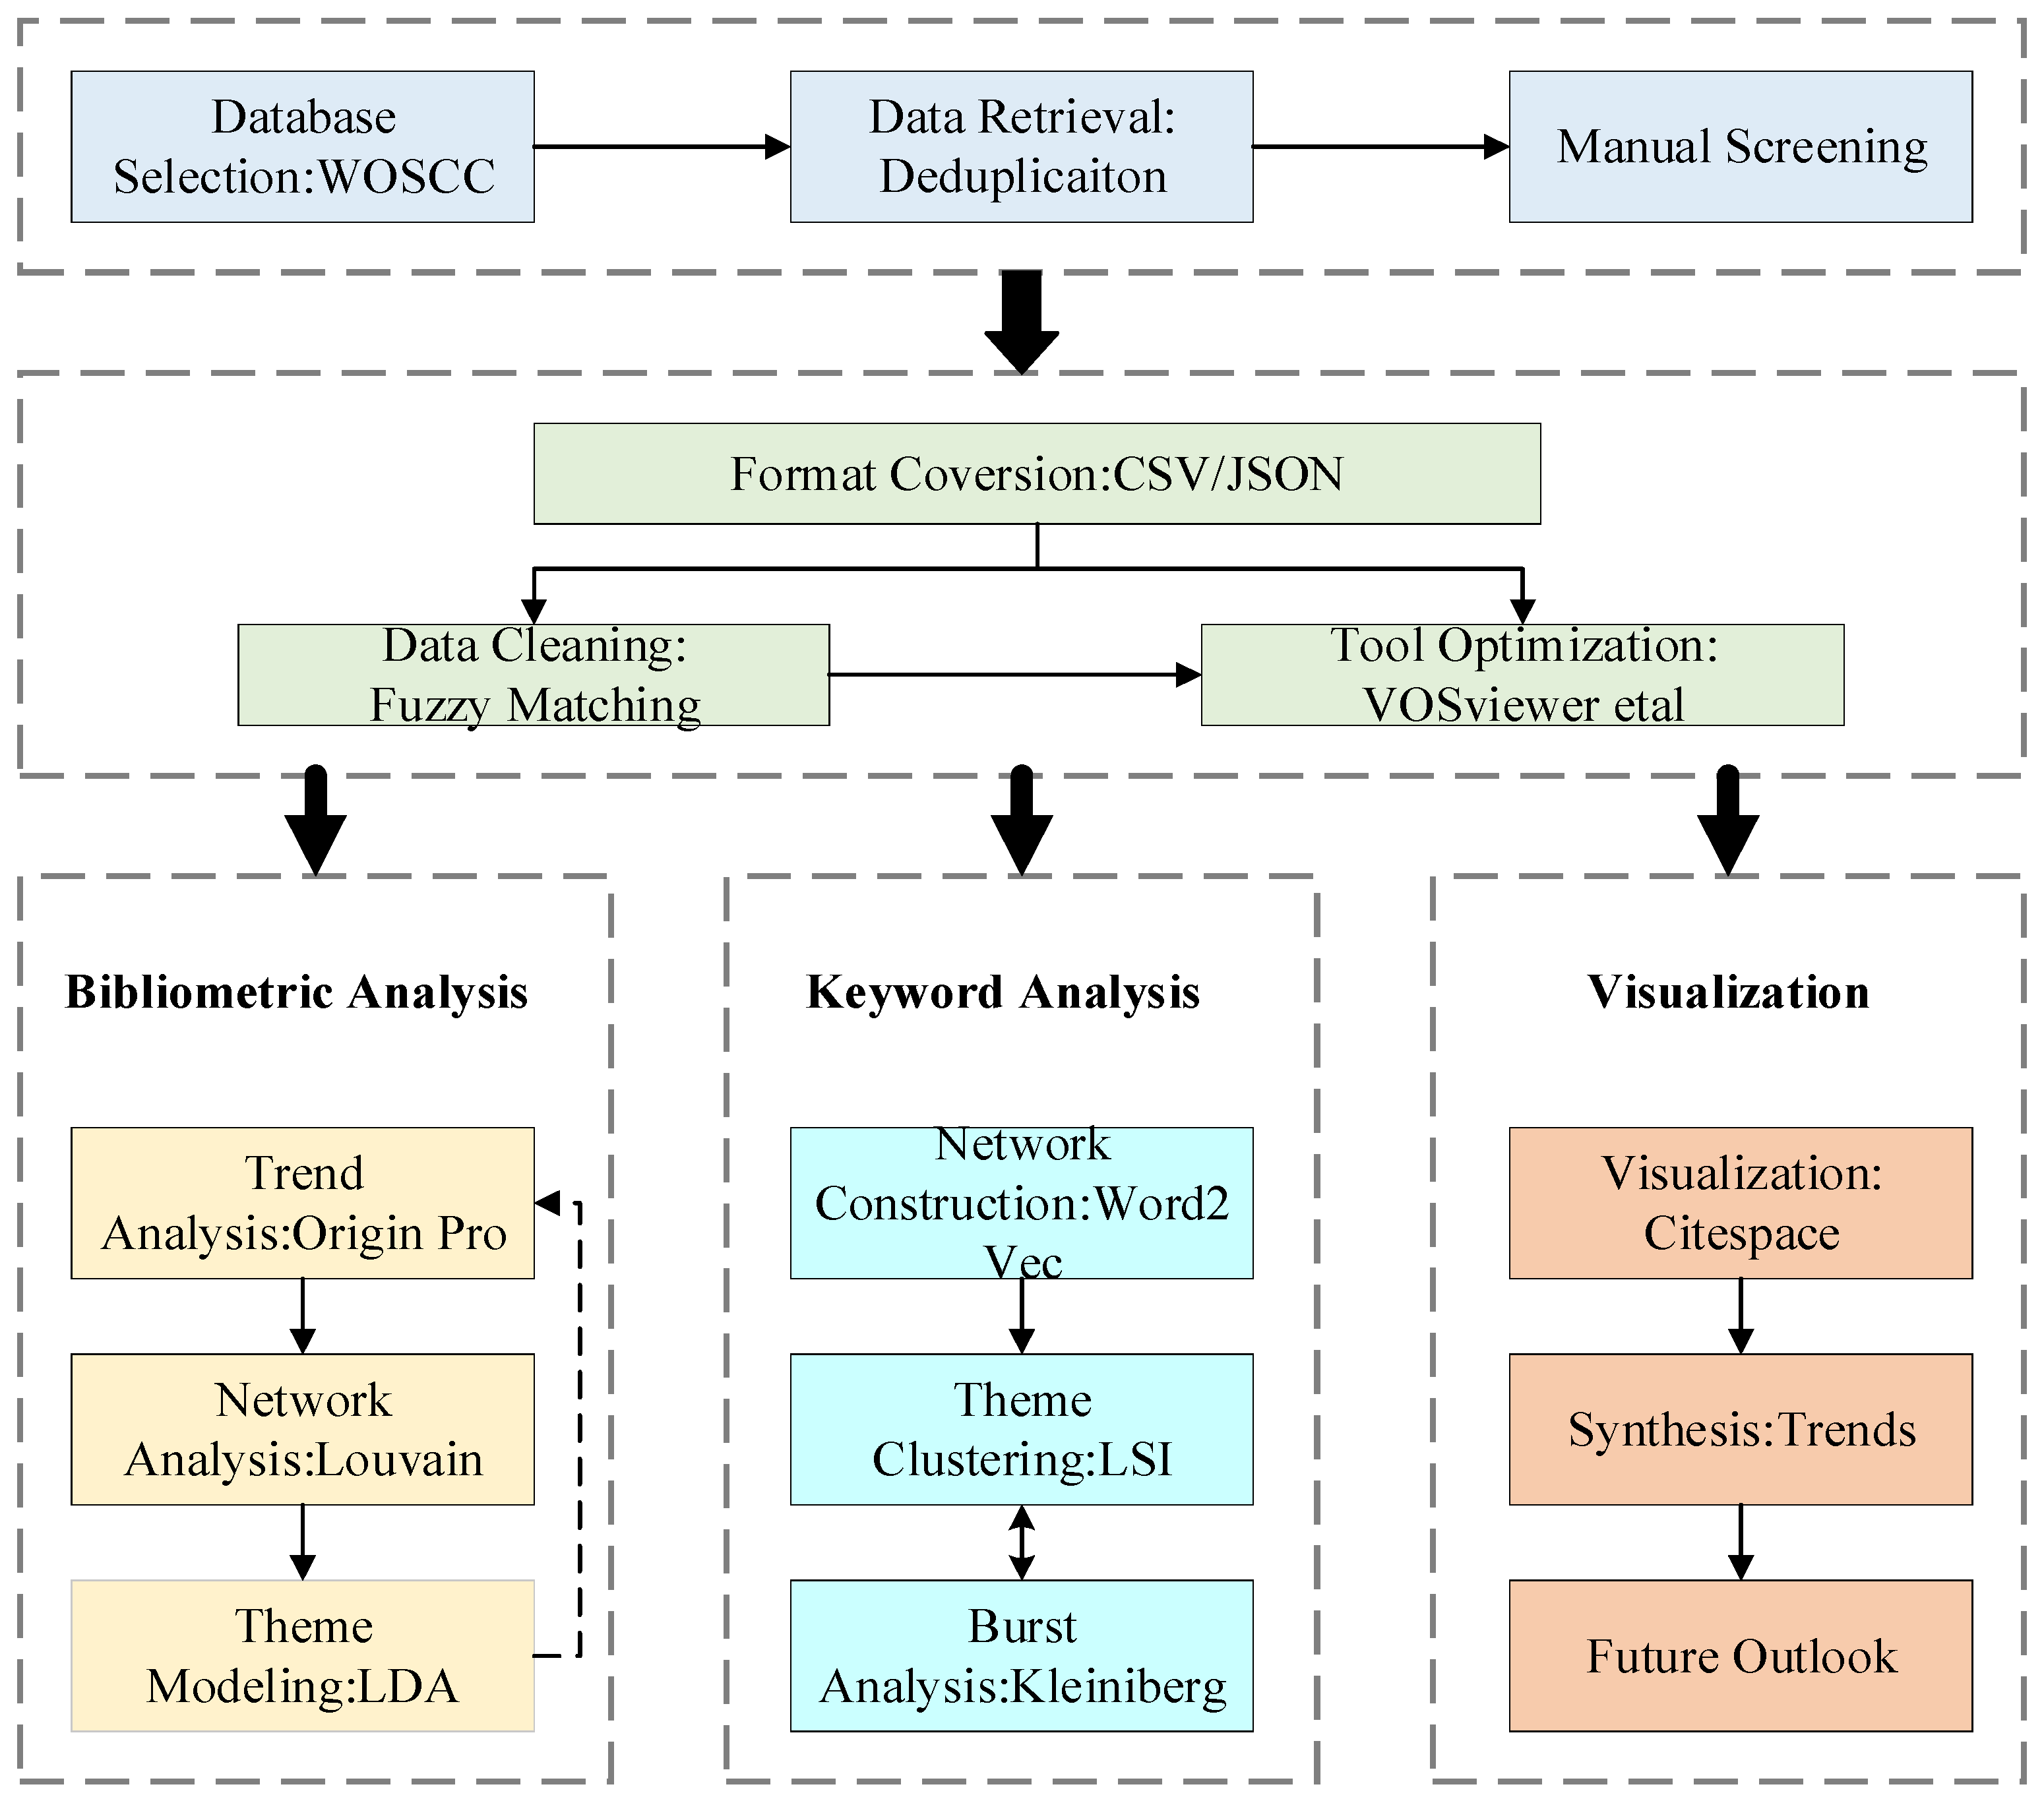
2. Materials and Methods

2.1. Data Acquisition and Retrieval Methodology

The Web of Science database constitutes a comprehensive multidisciplinary platform for scholarly information retrieval that is universally recognized for its extensive corpus of indexed publications, which are frequently employed in bibliometric analyses. In this study, the Web of Science Core Collection (WOSCC) was designated as the primary bibliographic resource. The period of investigation extended from 1995 to 2024. To ensure that the accuracy and topical relevance of the literature were incorporated into the analysis, a title-specific search protocol was implemented utilizing the following query: TS = (“mountain flood” OR “torrential flood” OR “hill flood” OR “flash flood” OR “small watershed flood in mountain area” OR “mountain flood in micro-scale basin”) AND TS = (“risk assessment” OR “early warning methods” OR “early warning” OR “warn*” OR “probability assessment”). The methodological framework for retrieval and the analytical approach are delineated in Figure 1; this process retrieved 1935 records, which were subsequently subjected to a manual screen of titles based on rigorously defined inclusion and exclusion criteria. These criteria excluded entries lacking complete author or institutional attributions; those with indeterminate publication dates, incomplete keyword profiles, and duplicated records; and materials extraneous to the research focus, such as conference proceedings, journalistic articles, and informational notices. The retrieval methodology and analytical framework are elaborated in Figure 1. Ultimately, 1841 peer-reviewed articles were retained, with their bibliographic records and cited references exported in plain text format. Figure 1 provides a detailed exposition of the search protocol and analytical procedures used.

2.2. Empirical Data Assessment

Annual publication counts and journal distributions were extracted from WoS, and the annual trend was plotted in Origin Pro 2025. English-language records were batch-imported into VOSviewer to map author metrics using overlay and network visualizations. We selected the association strength as the link metric and fine-tuned the attraction and repulsion settings for the optimal layout.
For CiteSpace, we exported “Full Record with Cited References” from WoS as plain text and imported it into the software. Analyses were run on annual time slices using the cosine algorithm to measure network similarity, retaining the top 10% of nodes per slice. Keyword nodes were limited to the top 50 (Top N) with a k-value of 25; all other parameters remained as default. To sharpen the network, Pathfinder and slice-pruning techniques were applied, and LSI was used to cluster keywords, assigning the most salient title terms as cluster labels.

3. Results

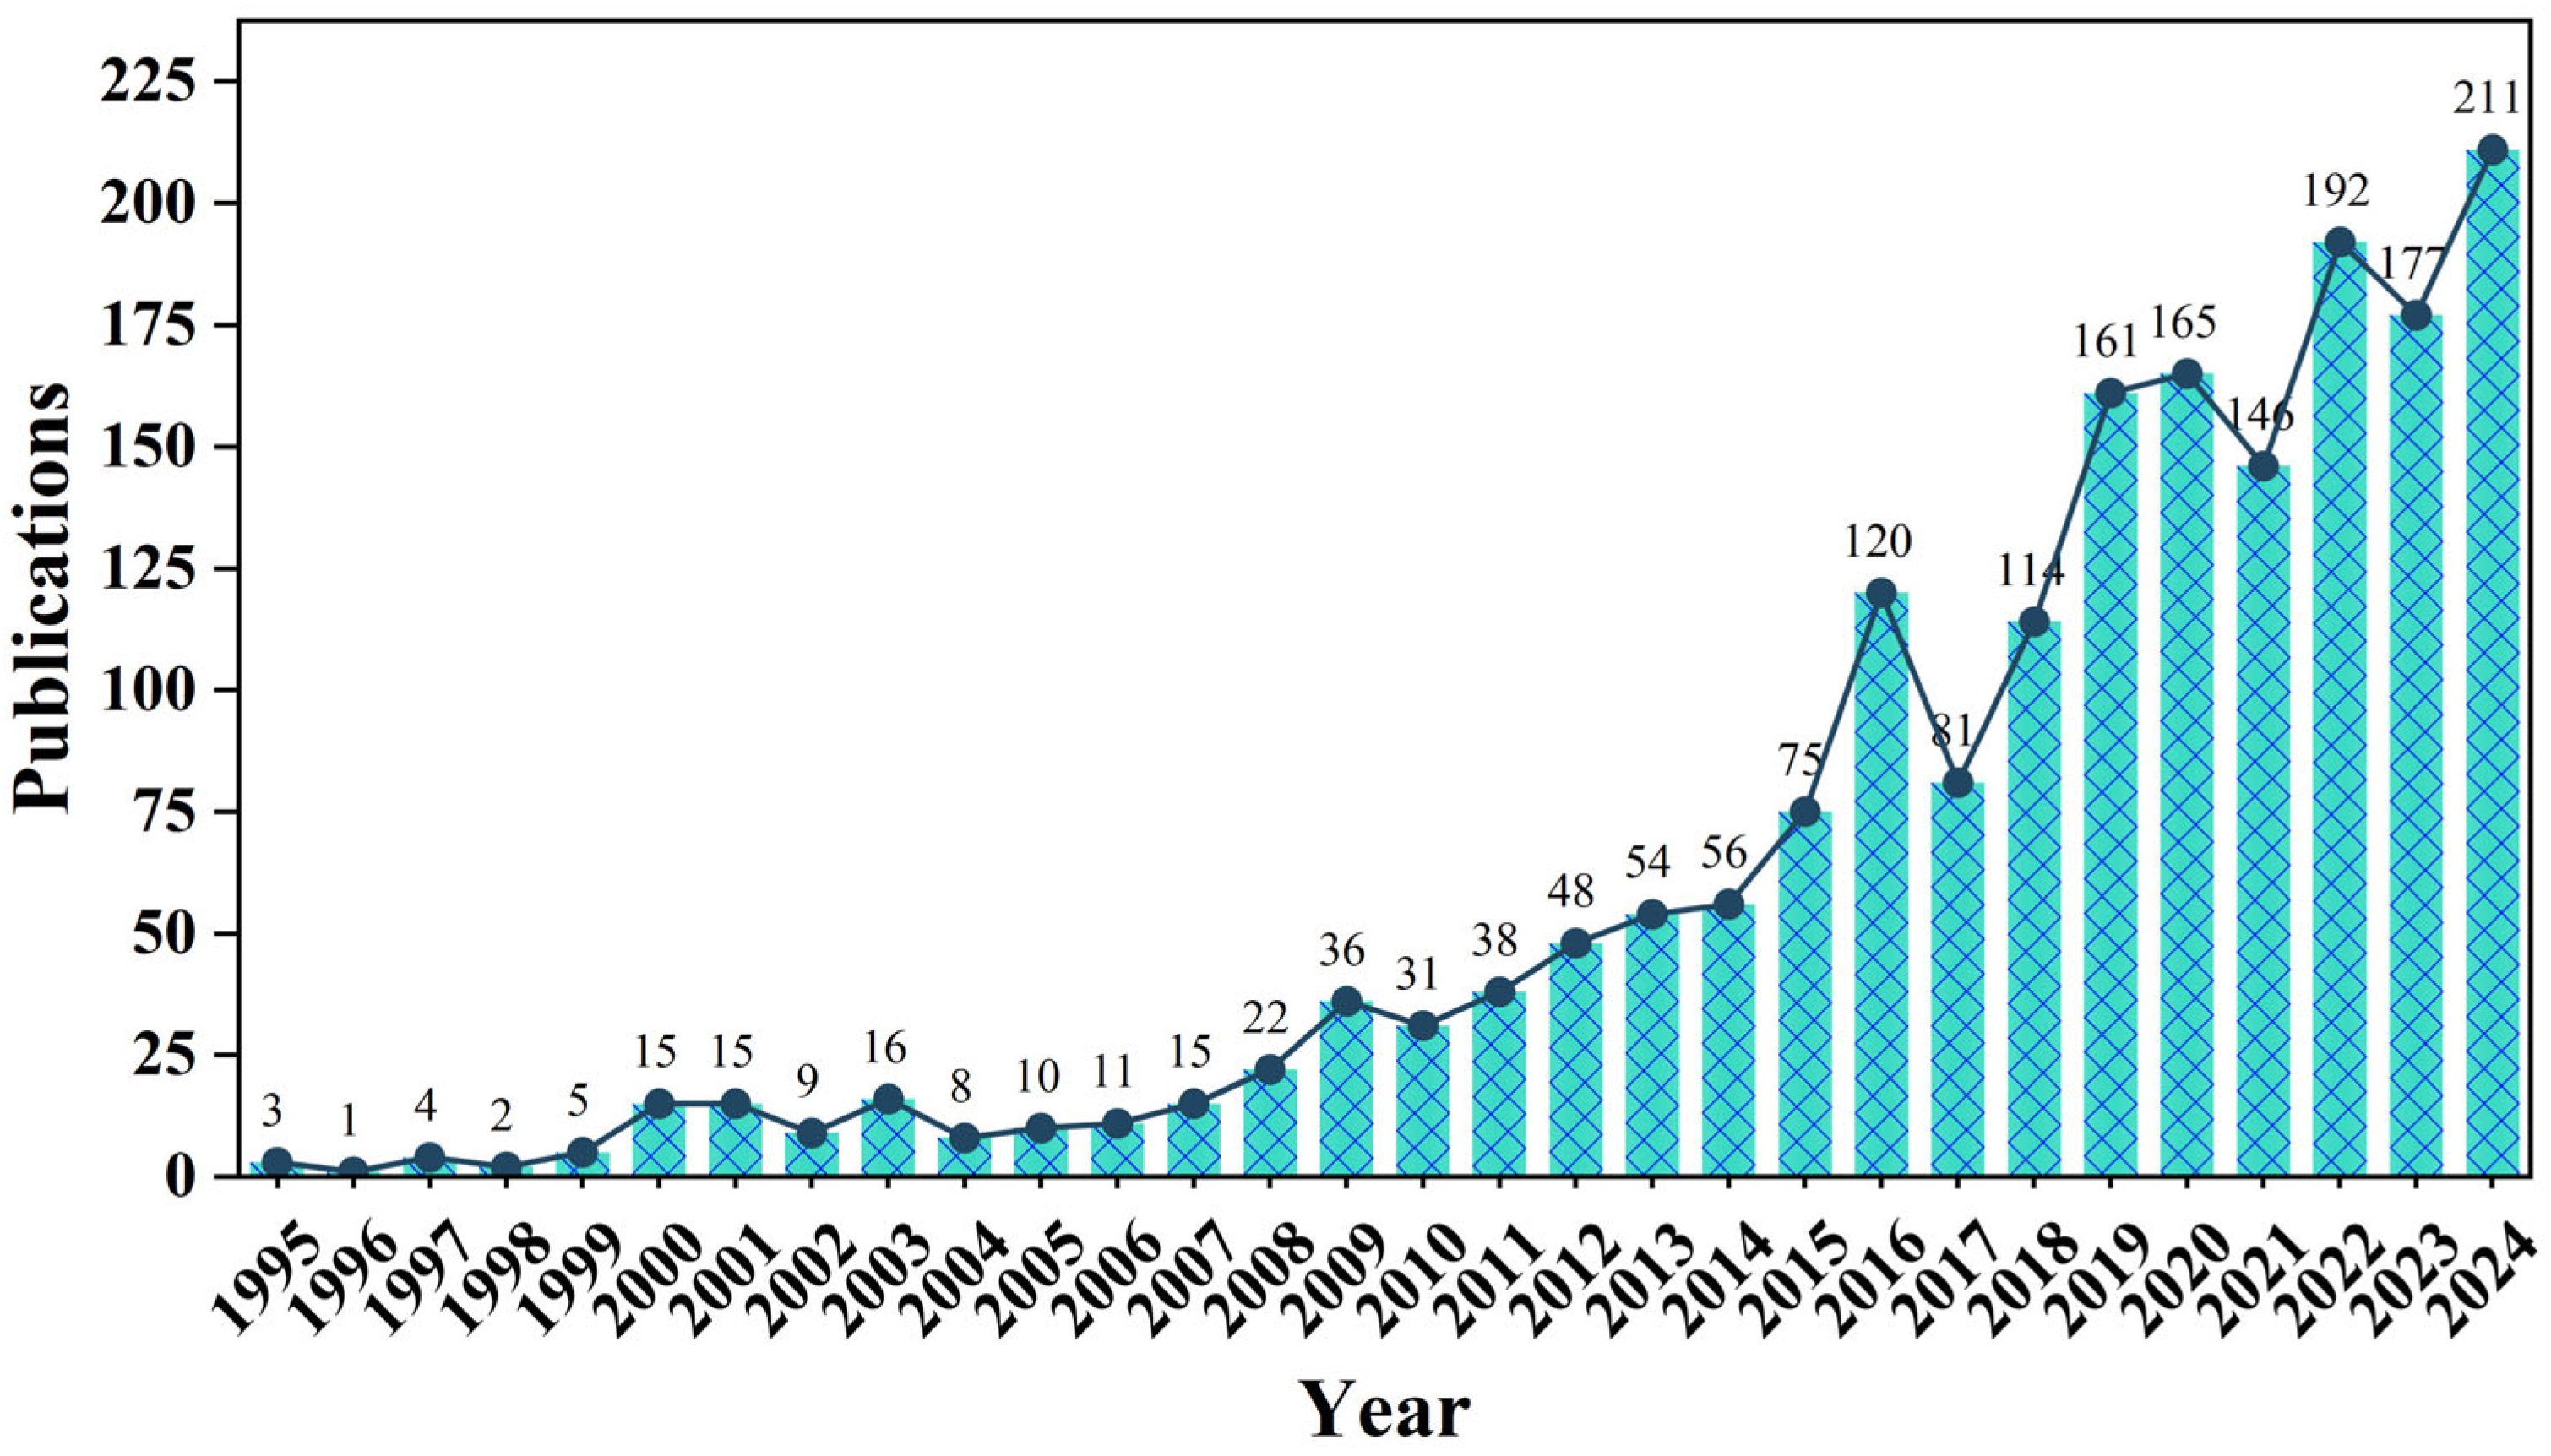
3.1. Research Publications and Patterns

A bibliometric analysis of flash flood risk research (1995–2024) reveals this field’s exponential growth and increasing global significance. In its embryonic phase, the field produced only three publications in 1995, reflecting limited academic engagement due to constrained methodologies and low awareness. A pivotal shift occurred in 2000, with 15 articles, likely driven by intensified climate variability and rising natural disaster occurrences. The subsequent acceleration, marked by 120 publications in 2016, correlated with an increased international focus on disaster risk reduction, augmented research funding, and advancements in interdisciplinary approaches. The peak of 161 articles in 2019 signifies a transformative phase for the field.
Despite a temporary decrease to 146 articles in 2021, attributed to pandemic disruptions, the publication volume rebounded to 211 in 2024, underscoring the domain’s resilience and sustained relevance. This longitudinal growth reflects the influence of exogenous factors, including climate-induced disasters and evolving global policy priorities, which have turned flash flood risk research into a critical scientific discipline. Its advancements hold profound implications for disaster management, global resilience, and the pursuit of sustainable development (see in Figure 2).

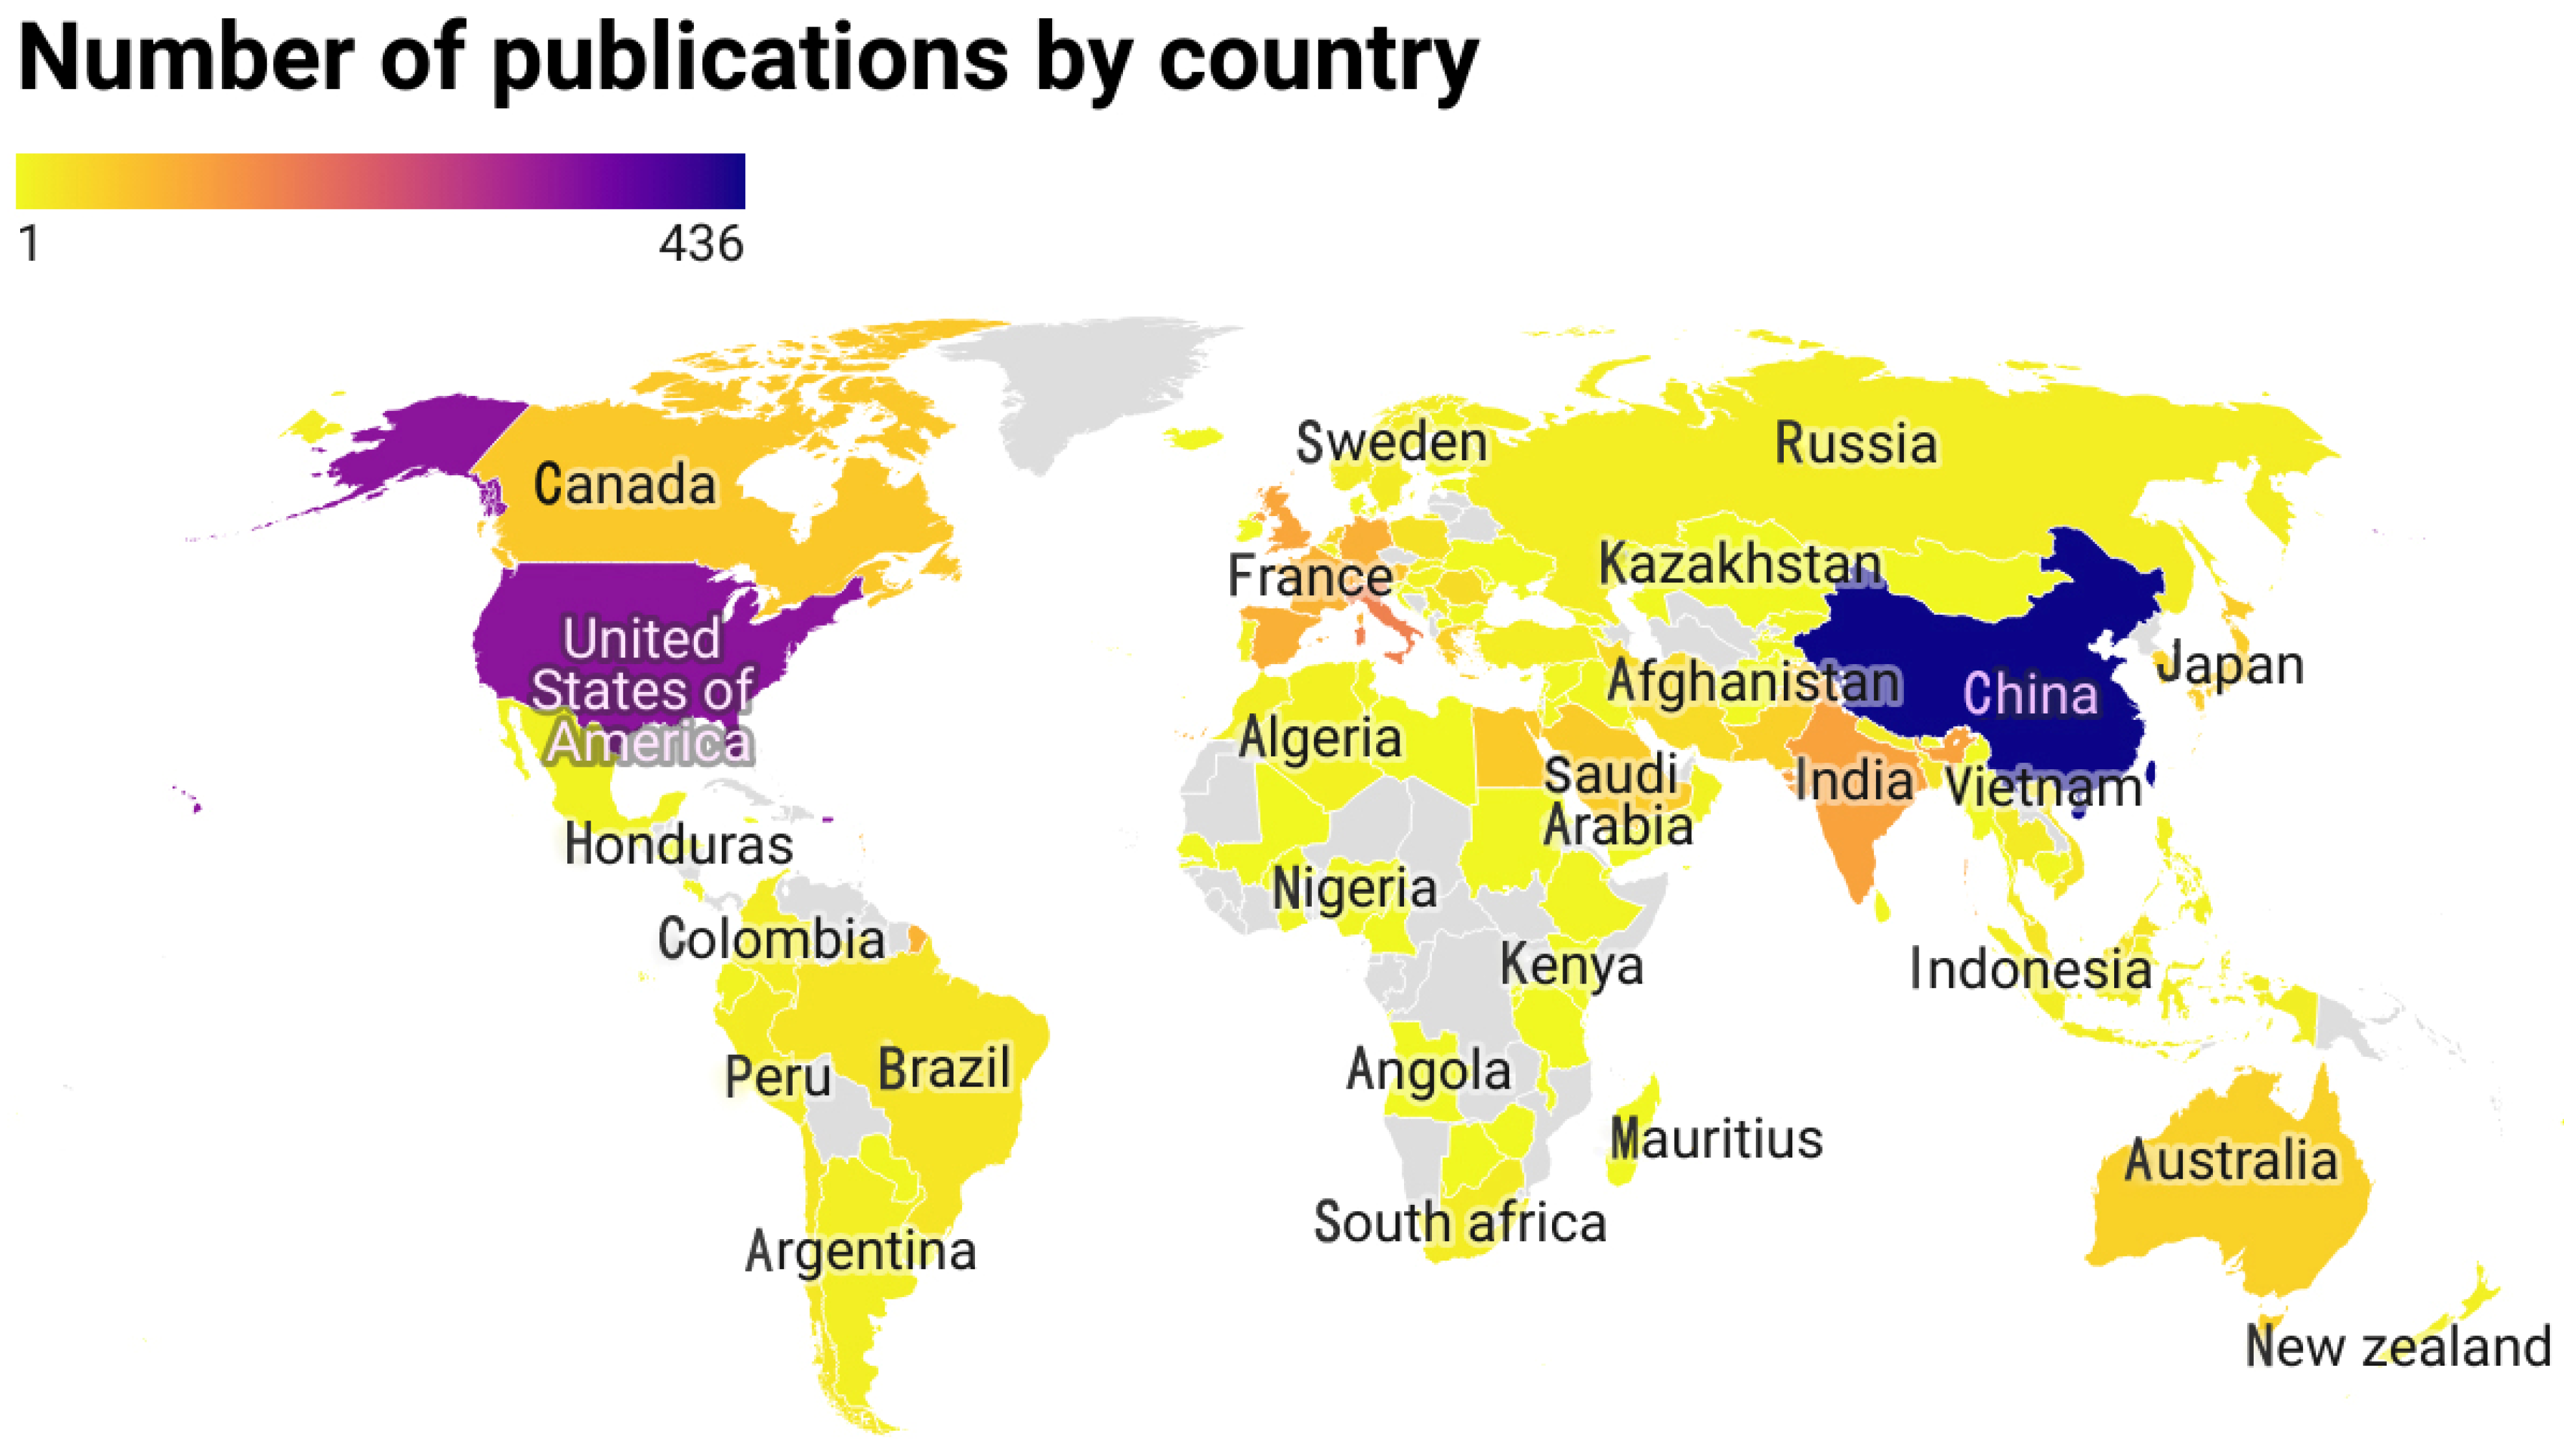
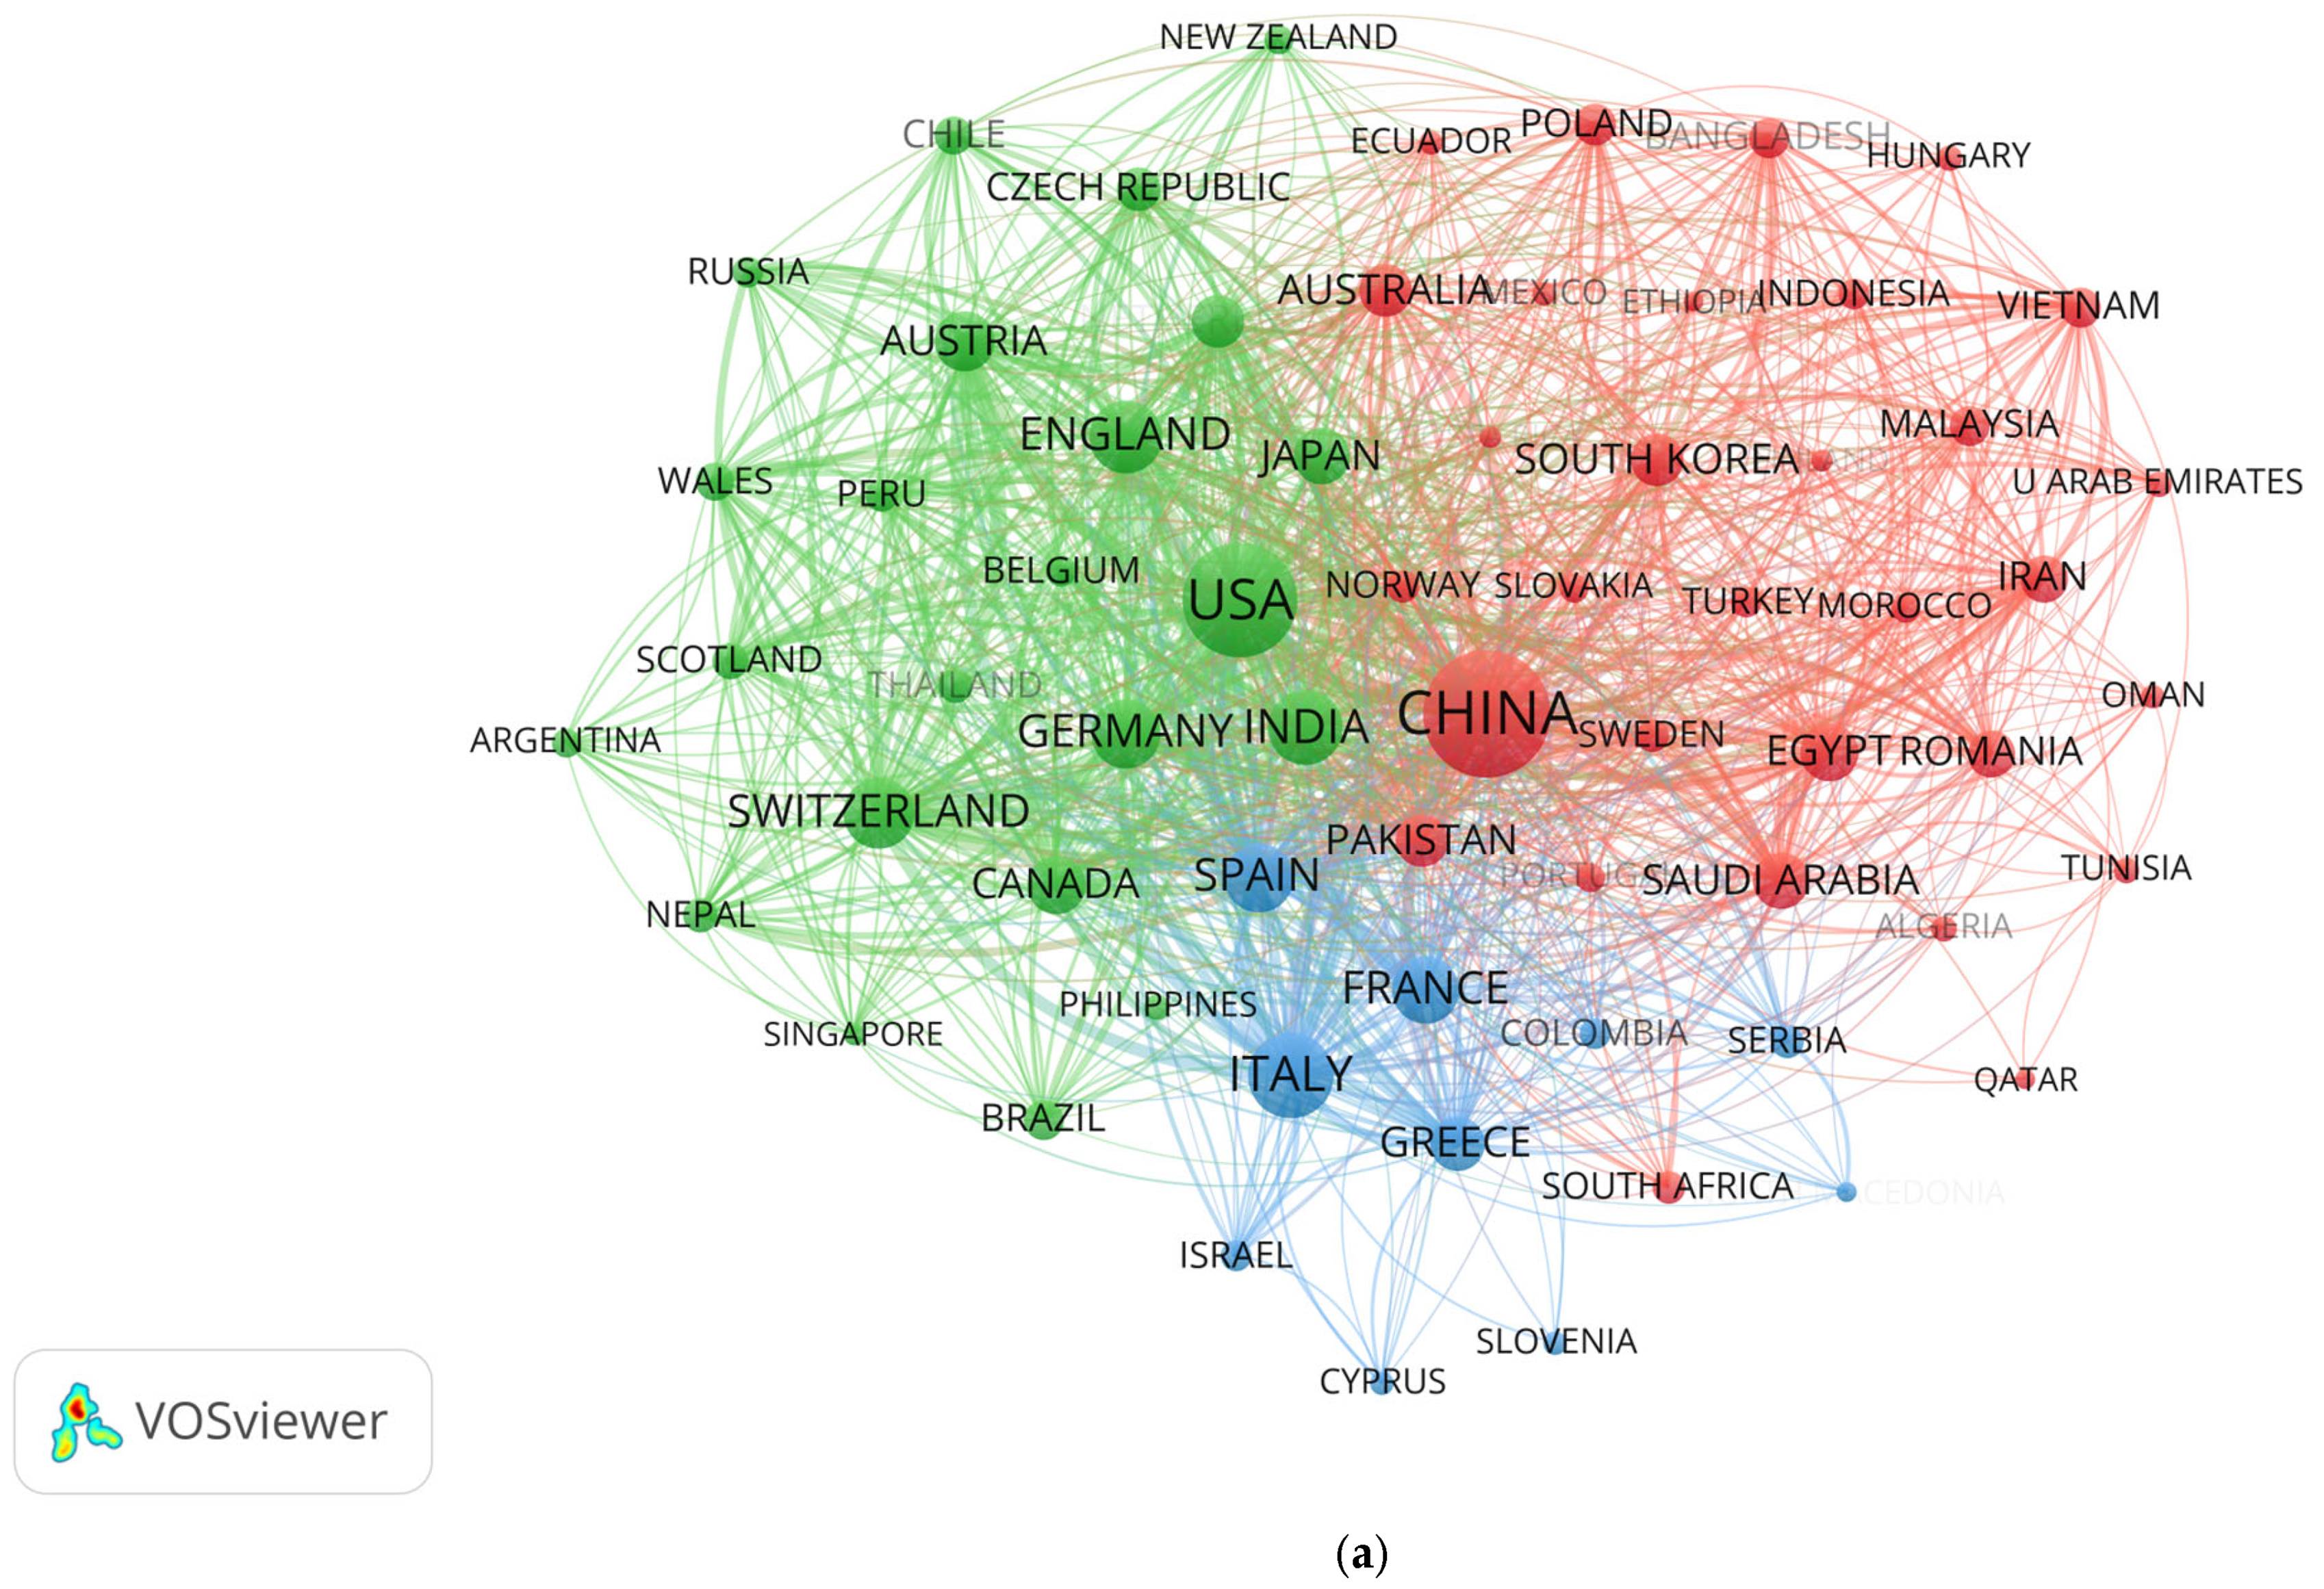
3.2. Global Insights and Institutional Patterns

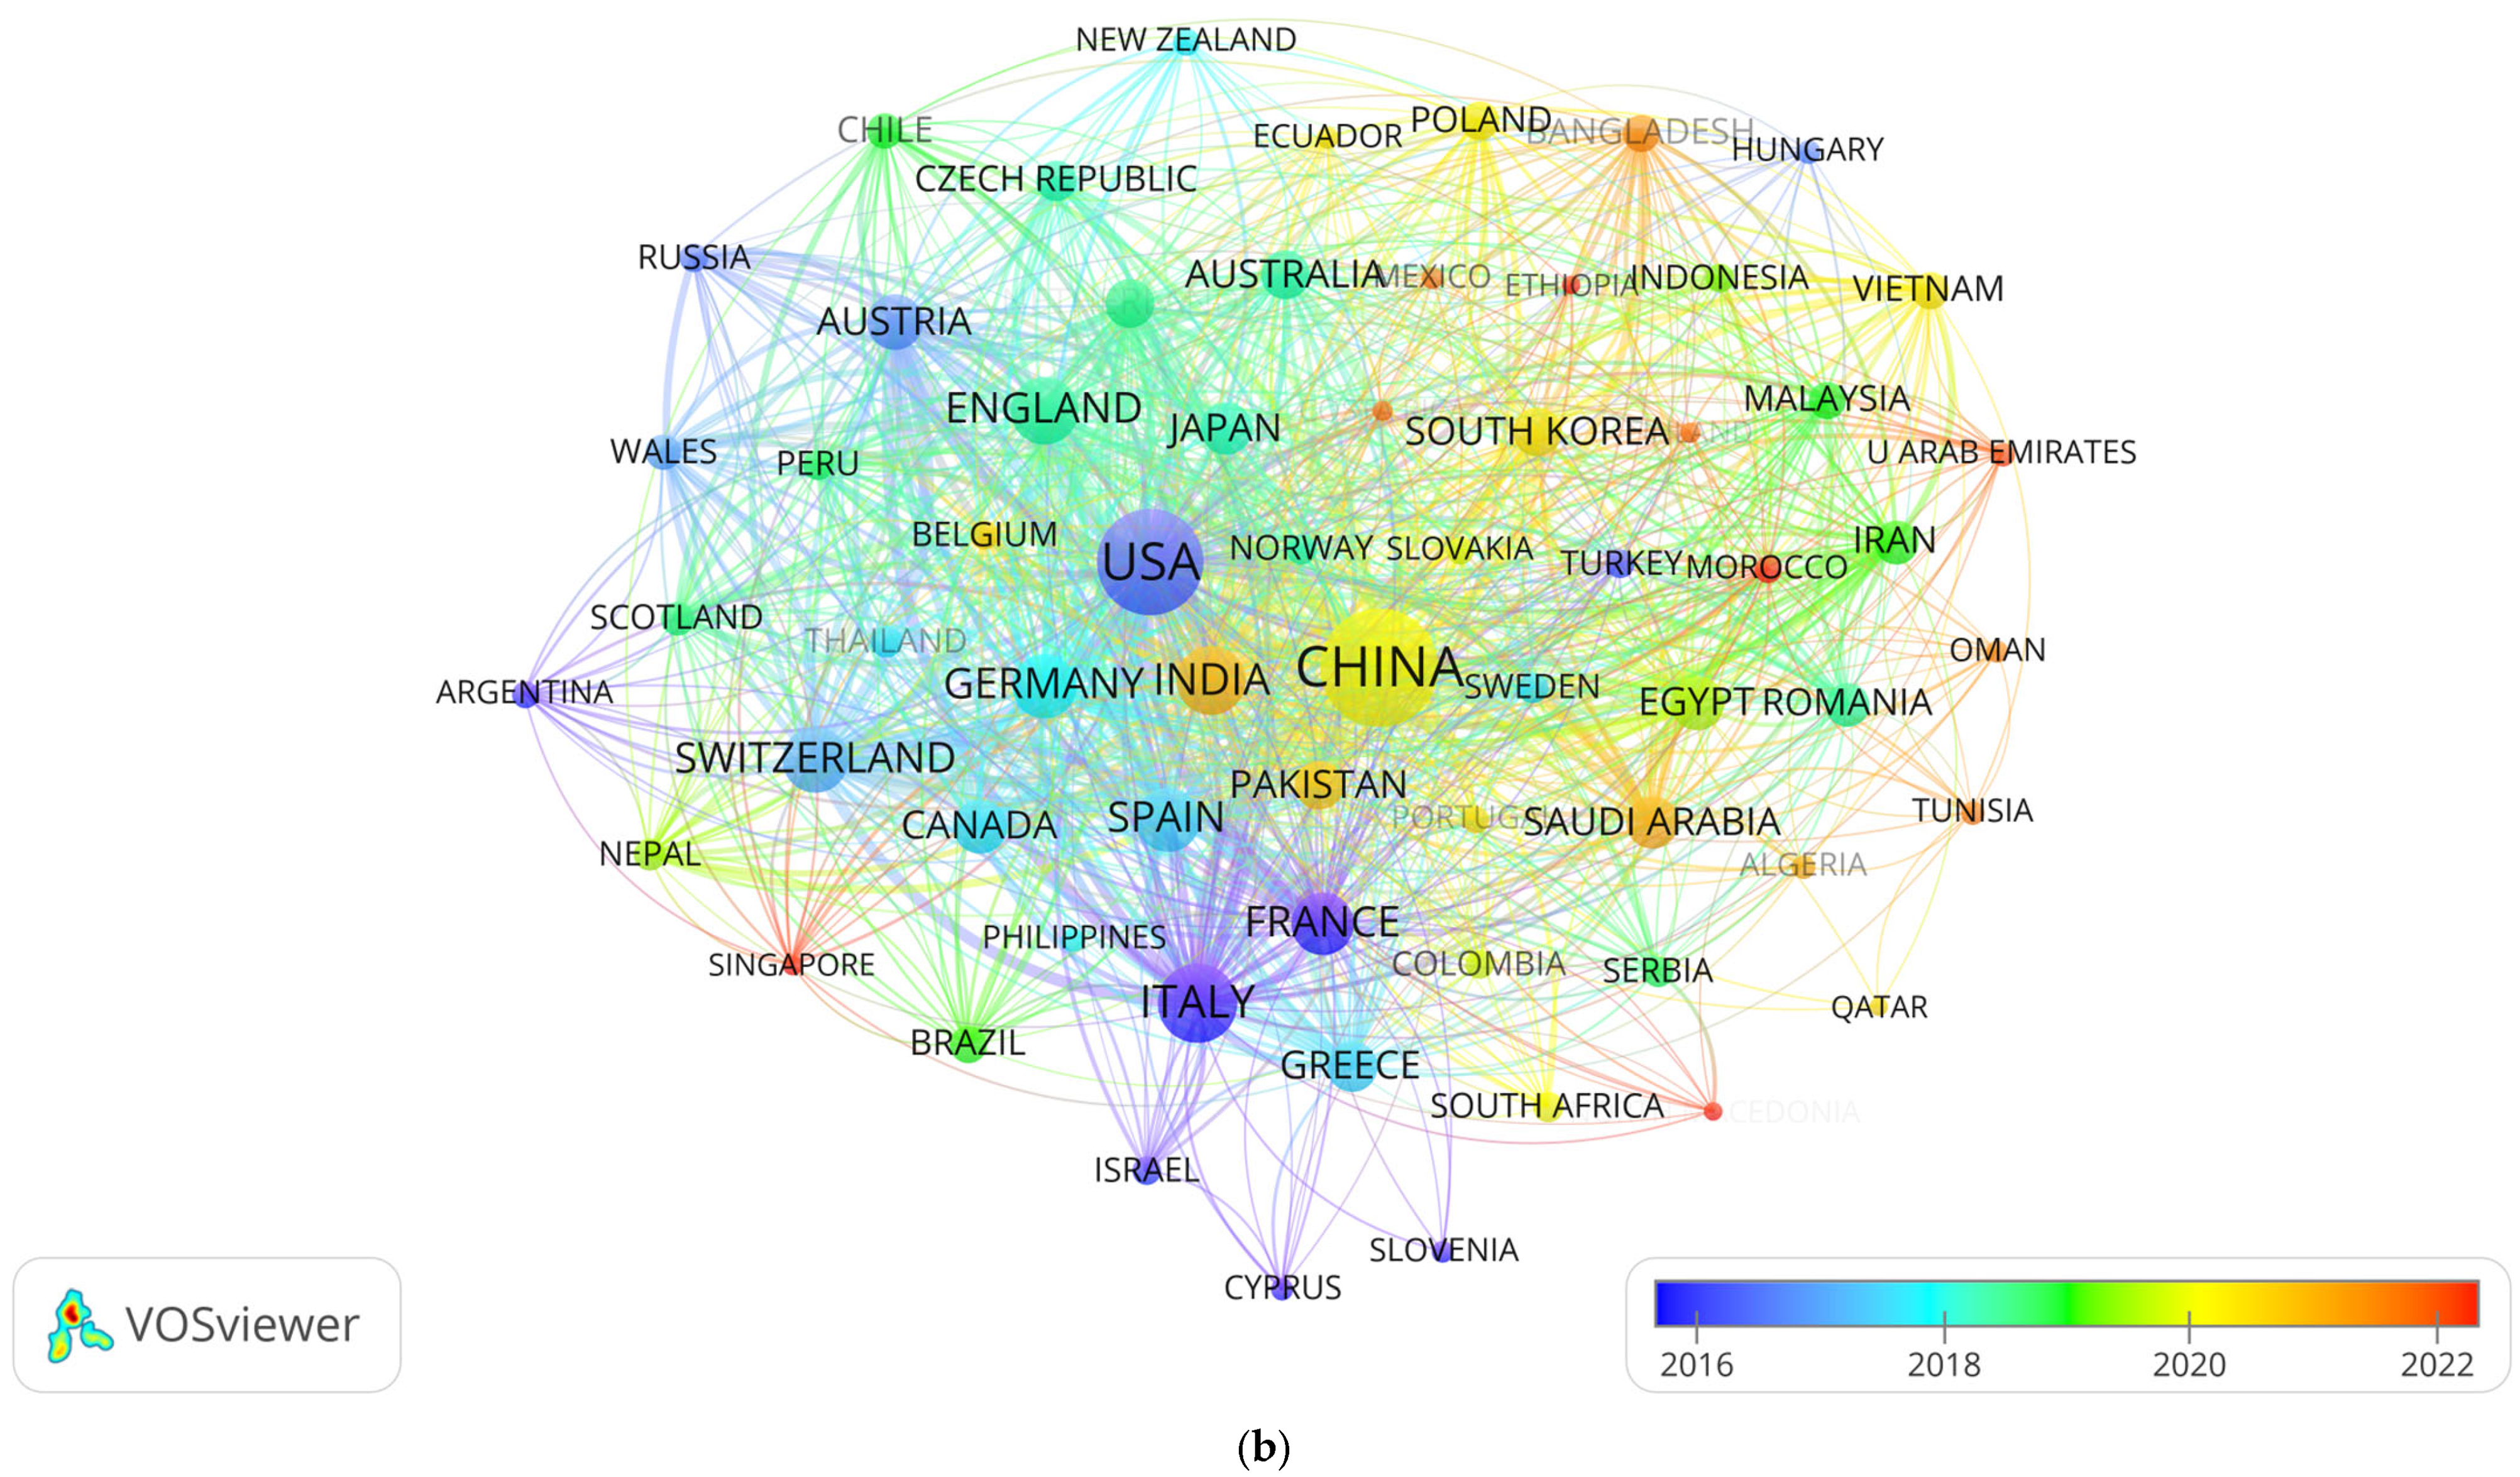
3.2.1. Key Country Perspectives

Elucidating national contributions and their implications in mountain flood risk assessment from 1995 to 2024 is essential for advancing global disaster mitigation strategies. The bibliometric analysis of key countries employs a collection of sophisticated methods, including publication quantification, citation metrics (via PageRank and eigenvector centrality), and co-authorship networks (constructed using Louvain clustering and small-world optimization). Data extracted from academic repositories facilitate the calculation of the h-index, betweenness centrality, and longitudinal impact trends. Latent Dirichlet Allocation (LDA) topic modeling and ARIMA time-series forecasting delineate national contributions, cross-border collaboration structures, and research evolution, with high-resolution geospatial visualizations mapping global patterns (Figure 3 and Figure 4 illustrate spatial distributions, co-occurrence networks, clusters, and temporal dynamics).
Our findings show that China dominates global mountain flood risk research, with 436 publications, contributing 23.7% of the total output, driven by substantial government investment and diverse geographical contexts. The United States, accounting for 17.8% (328 publications), follows with a focus on advanced risk mapping and early-warning systems, reflecting its technological edge. Italy ranks third with 159 publications (8.6%), leveraging EU-funded projects to explore resilience and geohydrological risks. India, accounting for 6.2% (114 publications), emphasizes localized assessments incorporating socio-economic factors. Together, the UK (5.9%, 108), Switzerland (5.4%, 99), and Germany (5.2%, 95) contribute policy-driven research and innovations in modeling, underscoring Europe’s collaborative efforts in disaster risk reduction.

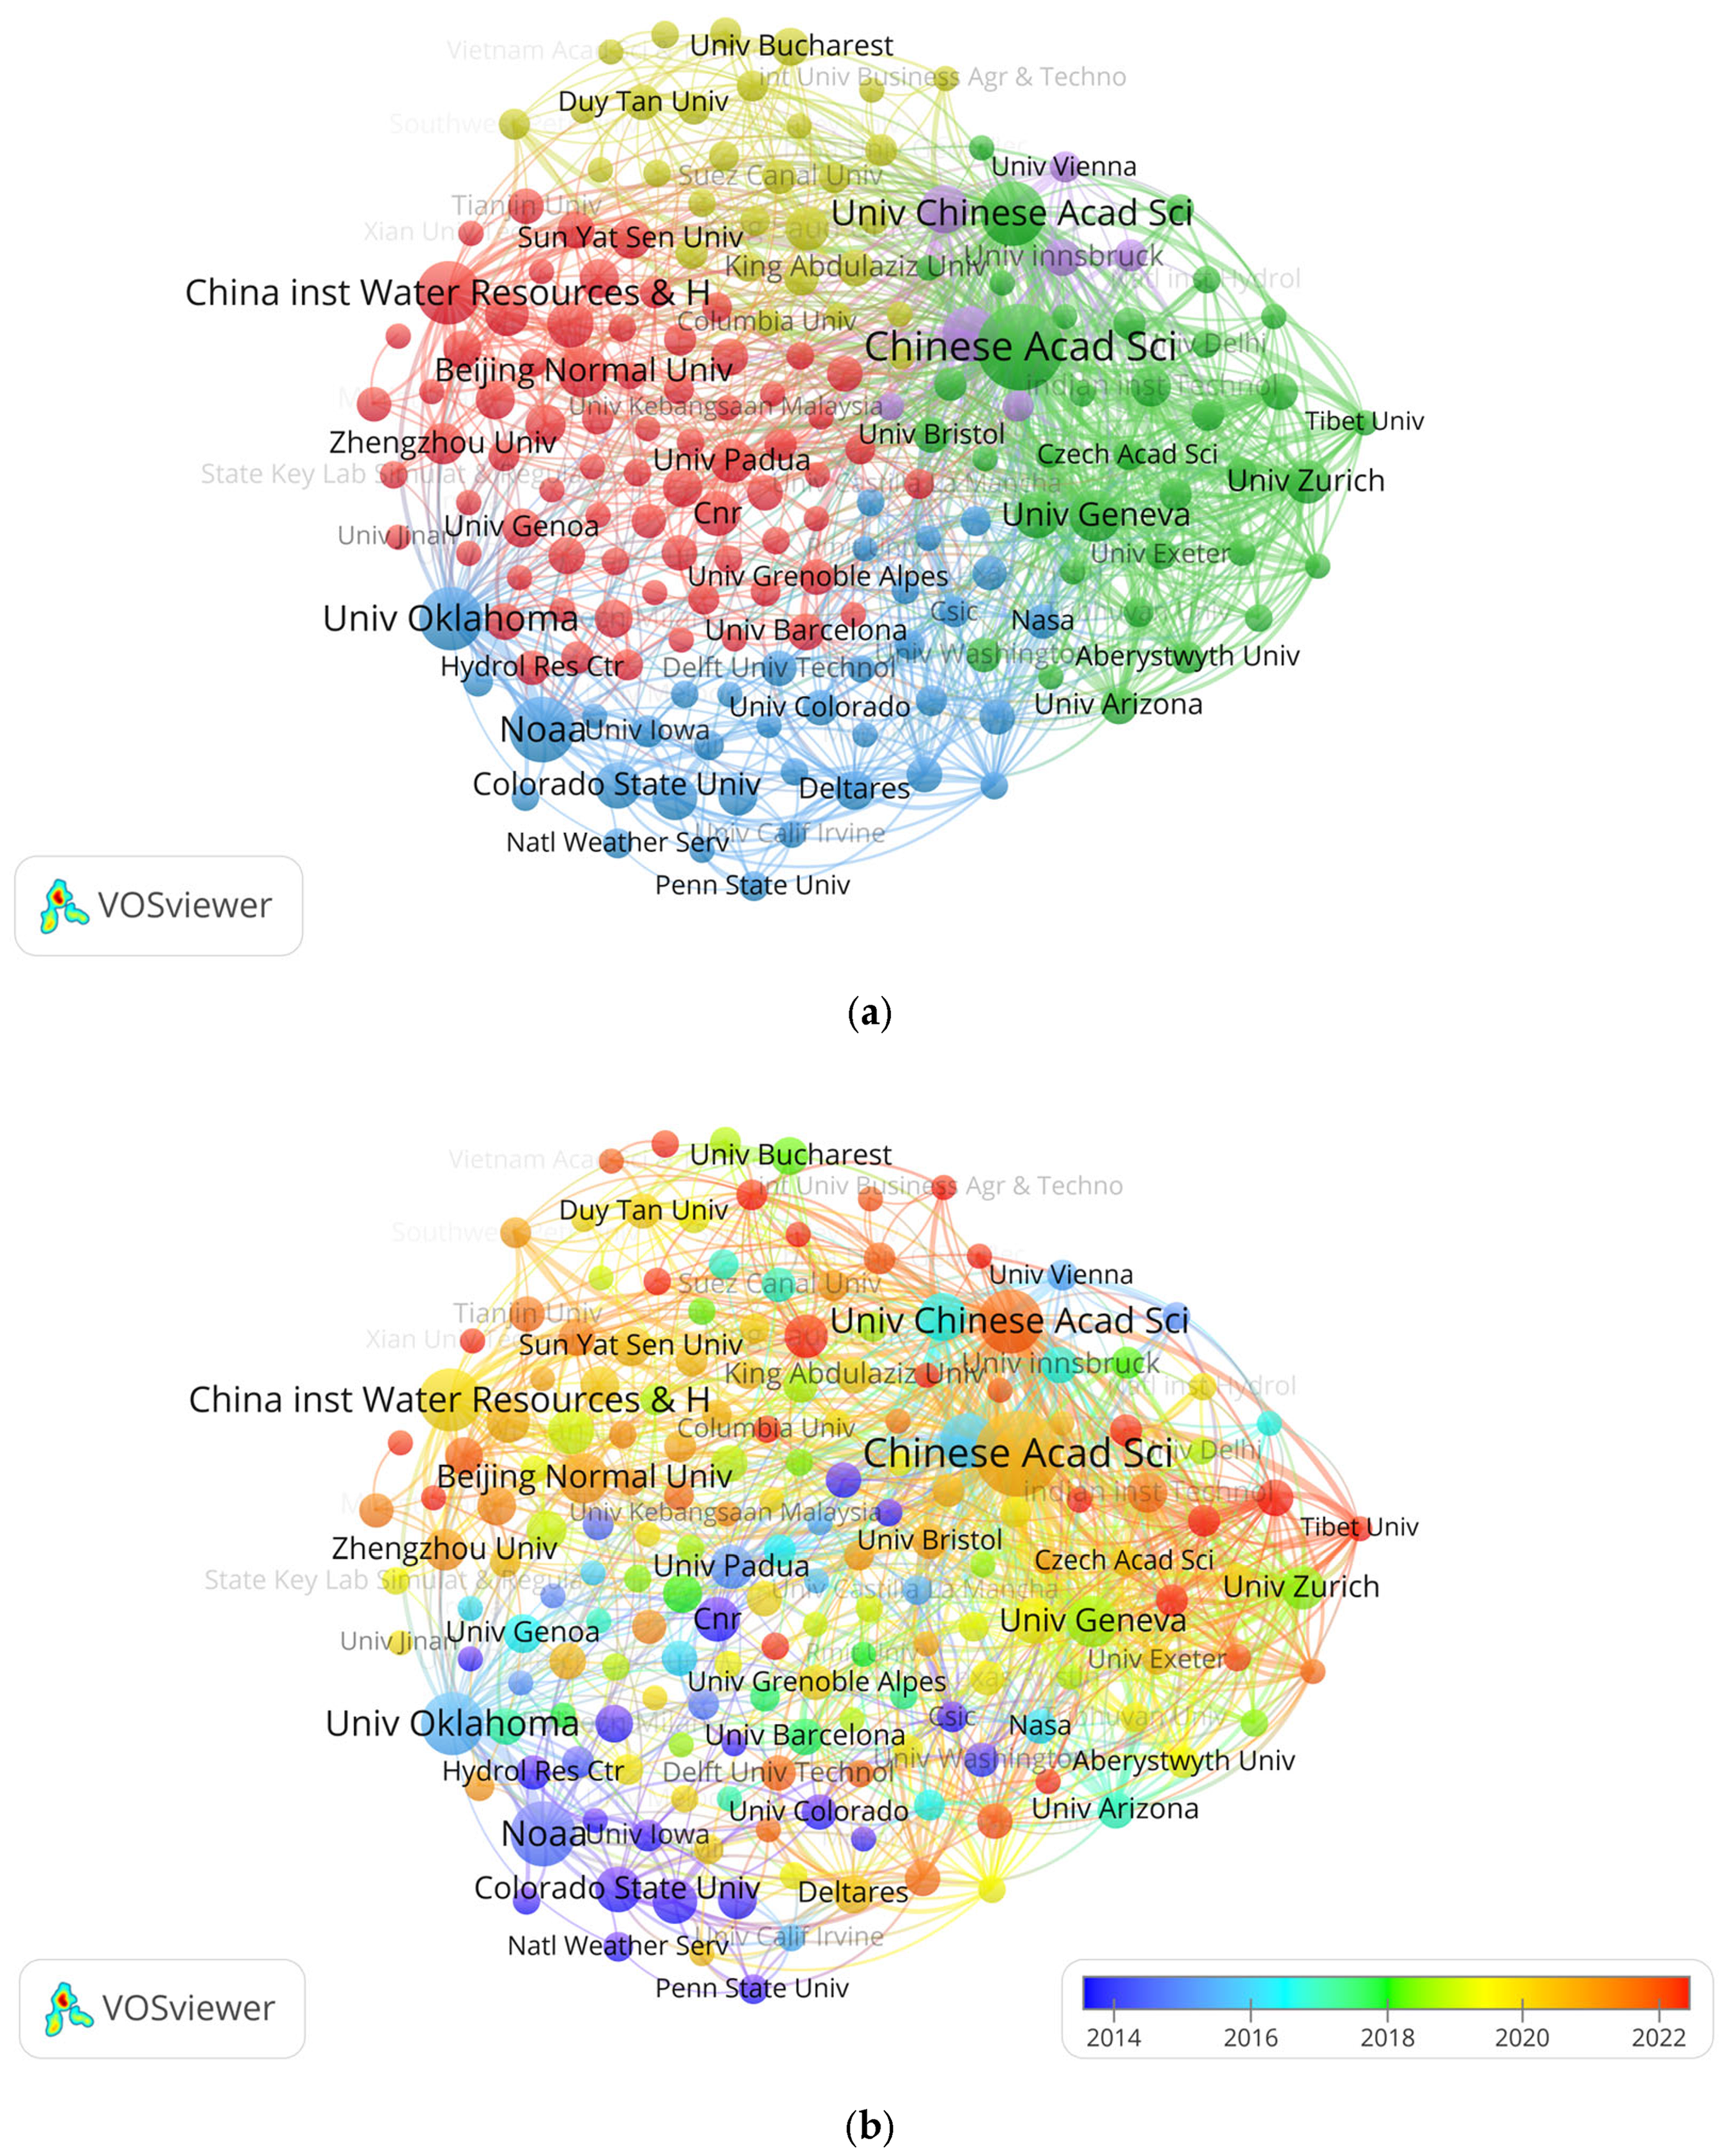
3.2.2. Key Institutional Analysis

A bibliometric analysis of key research institutions in mountain flood risk studies highlights institutional academic influence and inter-institutional collaboration. Aggregating publications at the institutional scale, this study utilizes advanced methods, including PageRank, HITS algorithms, and Tensor Decomposition, to quantify academic authority, network centrality, and evolving collaboration patterns. Katz centrality and the Bonacich power index further reveal structural interdependencies, surpassing traditional metrics such as the h-index (see Figure 5 for institutional co-occurrence clusters and collaboration time series).
The results presented in Figure 5 identify the Chinese Academy of Sciences (CAS) as the global leader, with 99 publications (5.4%), excelling in remote sensing and hydrological modeling. NOAA ranks second with 51 publications (2.8%), focusing on atmospheric monitoring and climate-driven flood risks. Other notable contributors include UCAS (48, 2.6%), the China Institute of Water Resources (47, 2.6%), and the University of Oklahoma (47, 2.6%), emphasizing sustainability- and precipitation-related flood dynamics. European institutions, represented by Bern (33, 1.8%) and Geneva (28, 1.5%), contribute regional flood risk perspectives. Collaboration patterns reveal the CAS’s strong domestic ties (e.g., the China Institute) and NOAA’s extensive international partnerships (e.g., Bern). These findings delineate the institutional framework supporting global mountain flood research, providing a foundation for advancing collaborative strategies and disaster resilience.

3.3. Temporal Dynamics and Impact of Keywords

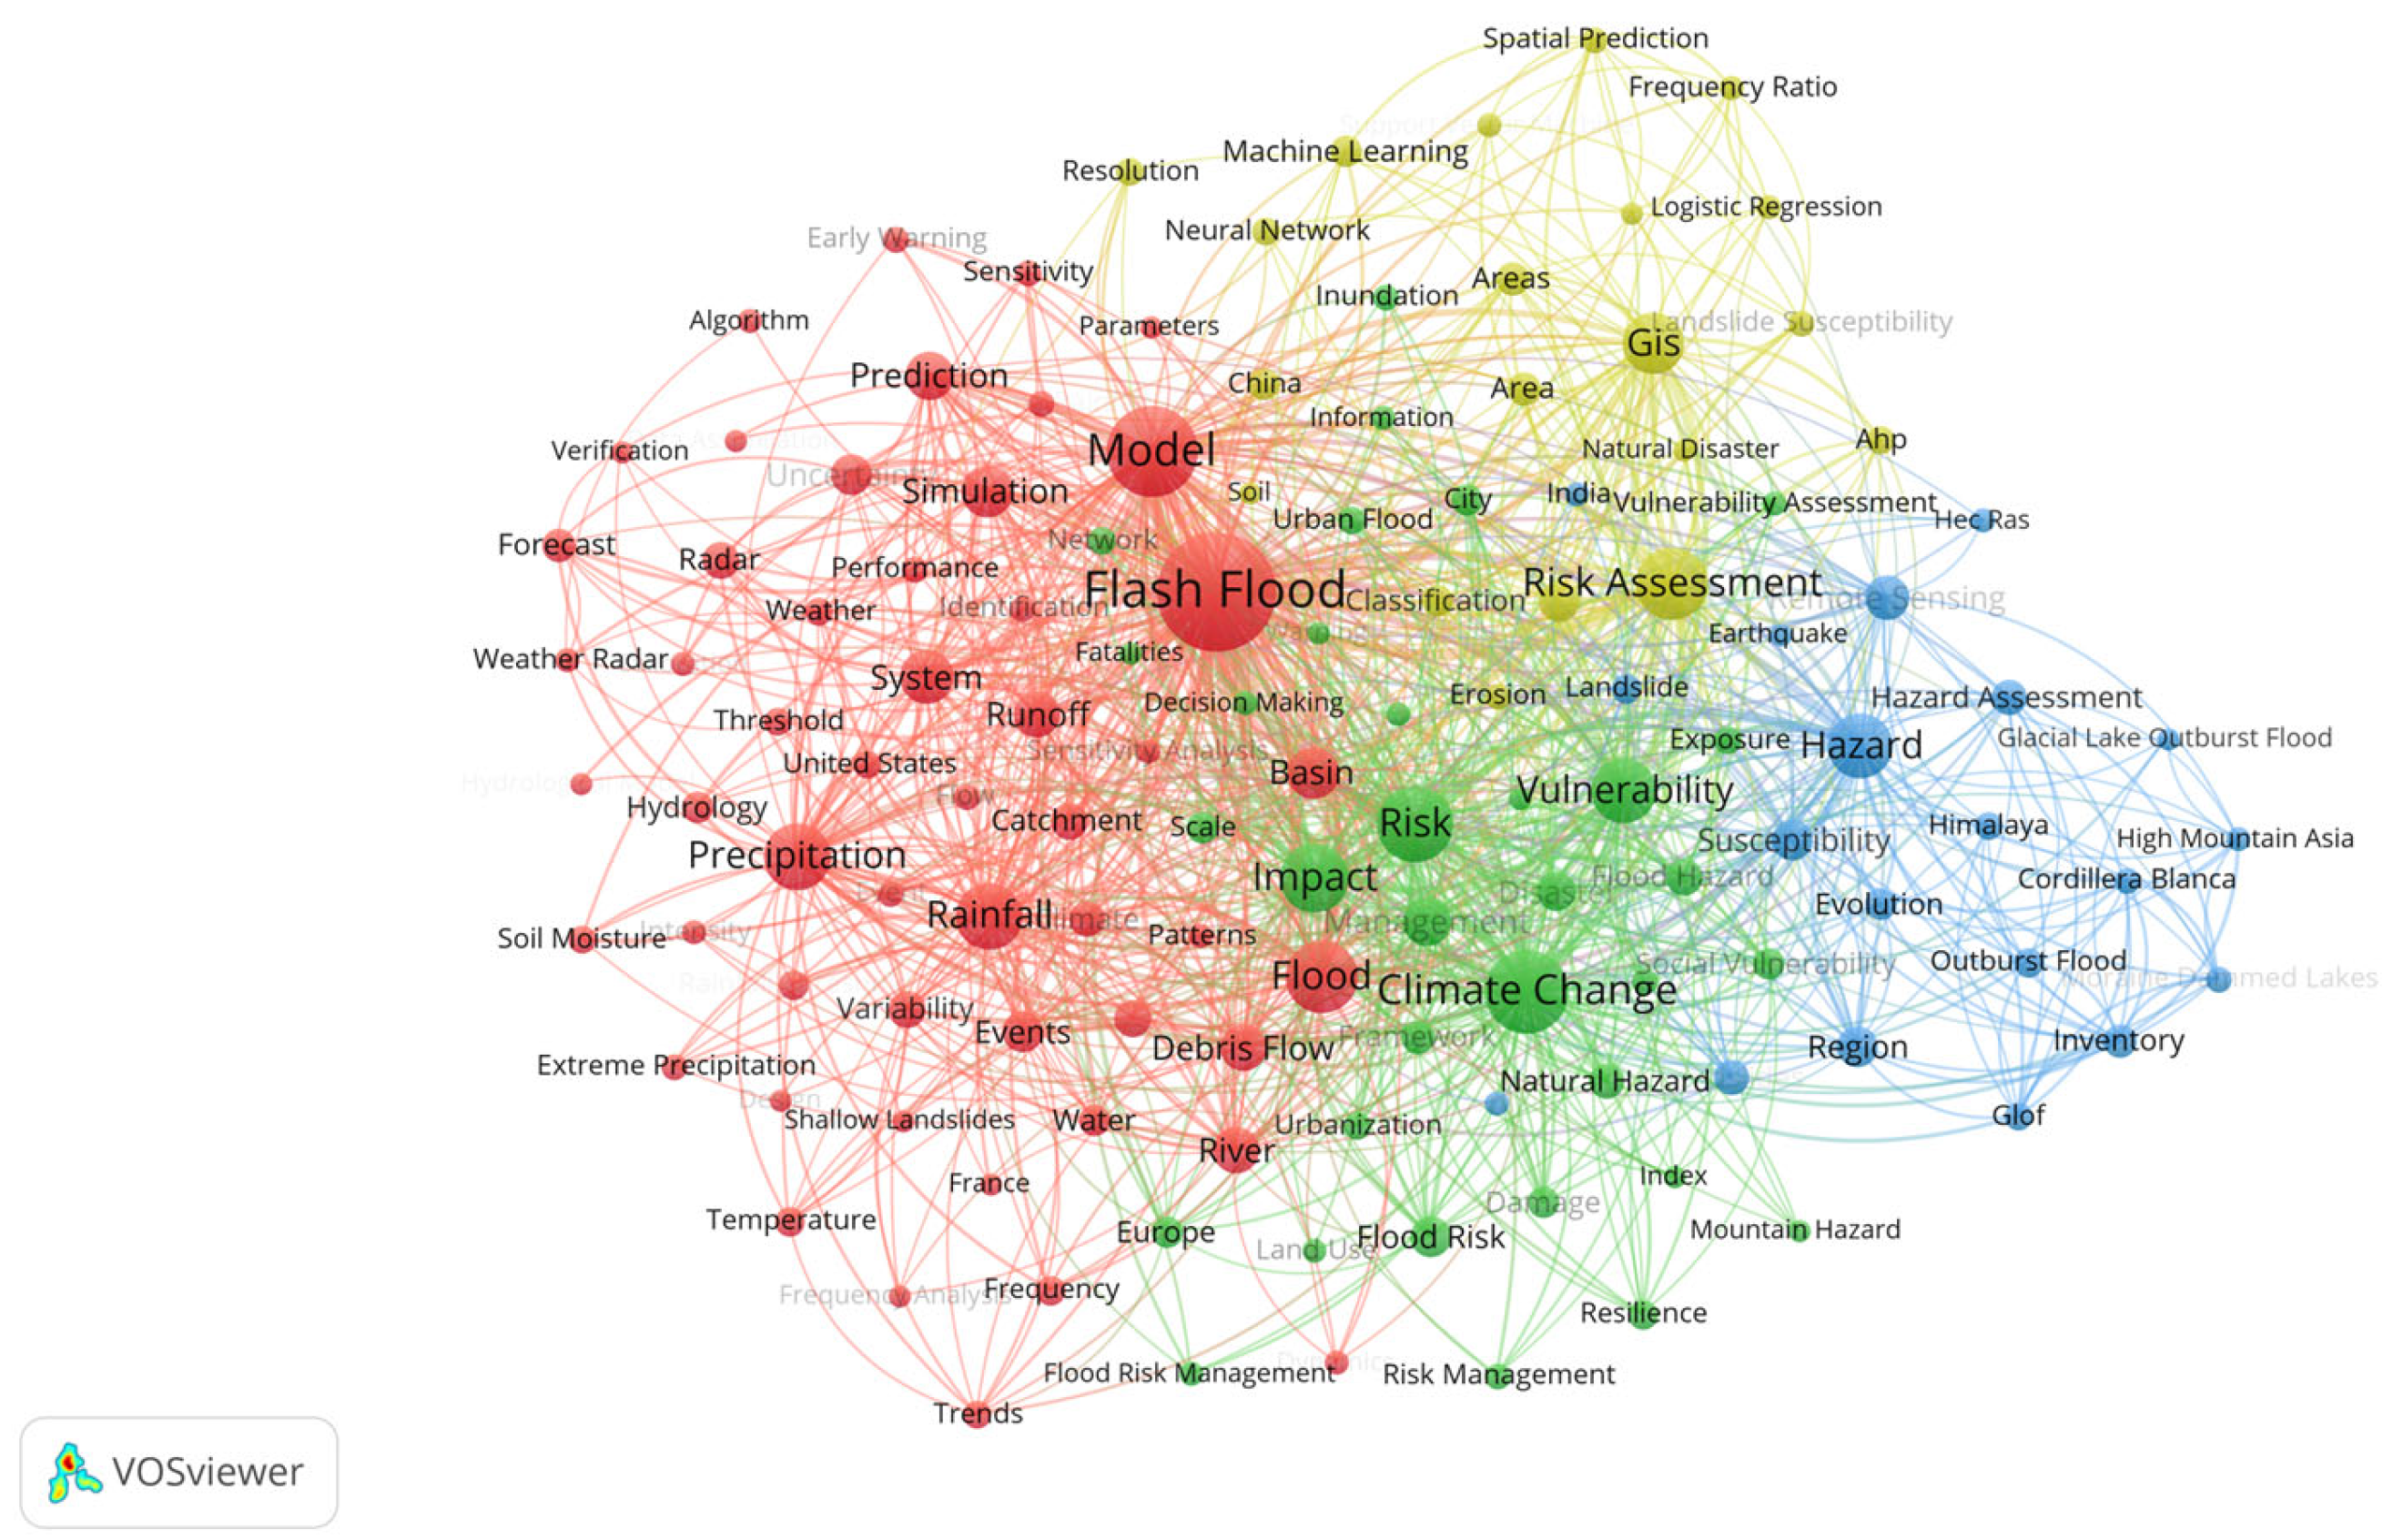
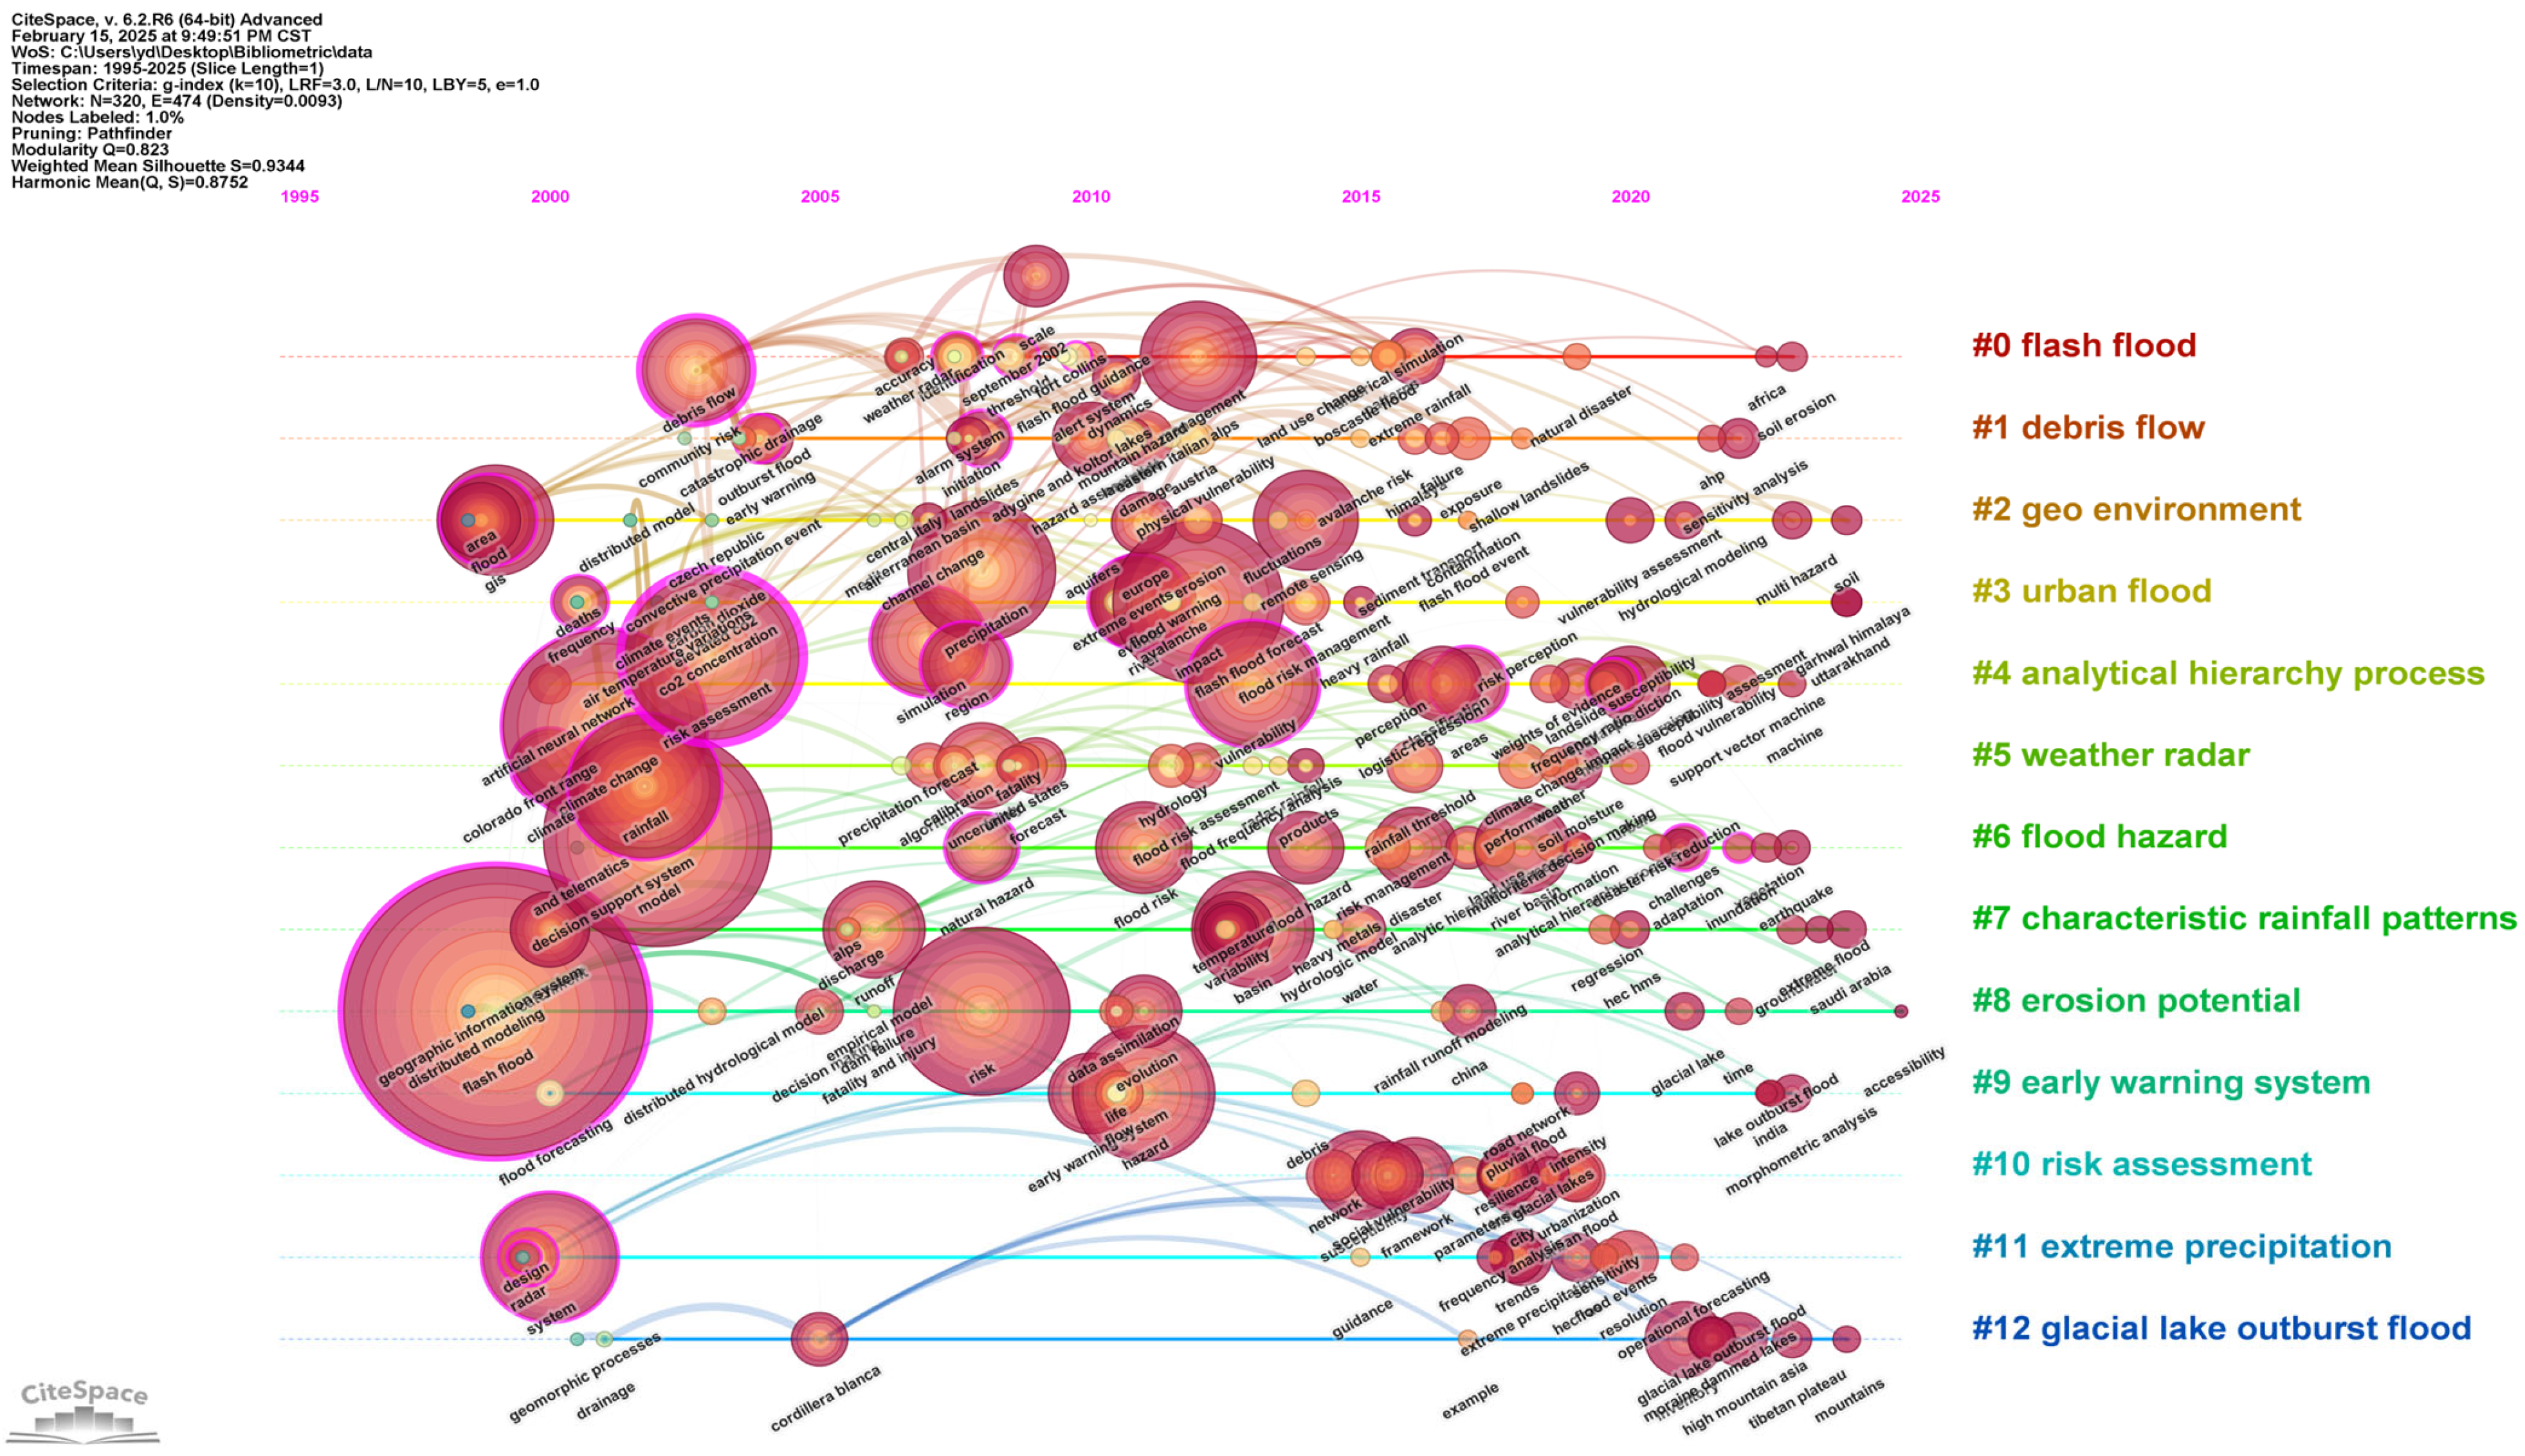
3.3.1. Keyword Clustering Analysis

The keyword co-occurrence analysis in bibliometrics elucidates thematic structures and knowledge evolution by mapping relationships among frequently co-occurring terms extracted from publication titles, abstracts, or keyword lists. Grounded in network theory, this method treats keywords as nodes and their co-occurrences as weighted edges, quantified by the frequency of their joint appearances within documents. Co-occurrence matrices are constructed and processed using the Louvain algorithm for modularity optimization to detect thematic clusters, while betweenness centrality and eigenvector centrality identify pivotal terms driving discourse. Network density and edge weights are normalized to mitigate bias related to the document volume. Tools such as VOSviewer visualize these networks (Figure 6), delineating research foci and interdisciplinary linkages, thus enabling the systematic detection of emerging trends.
As shown in Figure 6, the keyword co-occurrence network analysis (153 nodes, 5678 edges) of flash flood risk assessments identified four thematic clusters with a modularity index of Q = 0.73 (σ = 0.02, where σ denotes the standard deviation of the modularity index) (Louvain algorithm, p < 0.001, indicating that the identified clustering is highly significant), which confirmed the existence of a robust structure. Cluster 1 (Hydrological and Meteorological Processes, 72 keywords, 47.1% of 1539 occurrences) was dominated by “Flash Flood” (frequency 527, link strength 2302) and “Model” (r = 0.89, where r is the Pearson correlation coefficient between “Model” and “Flash Flood”, p < 0.001, indicating that this correlation is statistically significant). Cluster 2 (Risk and Societal Impacts, 44 keywords, 28.6%) featured “Climate Change” (frequency 261, 22.6% of the total link strength). Cluster 3 (Geological and Regional Features, 24 keywords, 15.7%) included “Hazard” (frequency 163), while Cluster 4 (Technological Applications, 13 keywords, 8.6%) emphasized “GIS” (frequency 145). “Flash Flood” and “Climate Change” emerged as research focal points and drove the field’s development. The network analysis elucidated hydrological, societal, geological, and technological interconnections and laid the foundation for interdisciplinary progress.

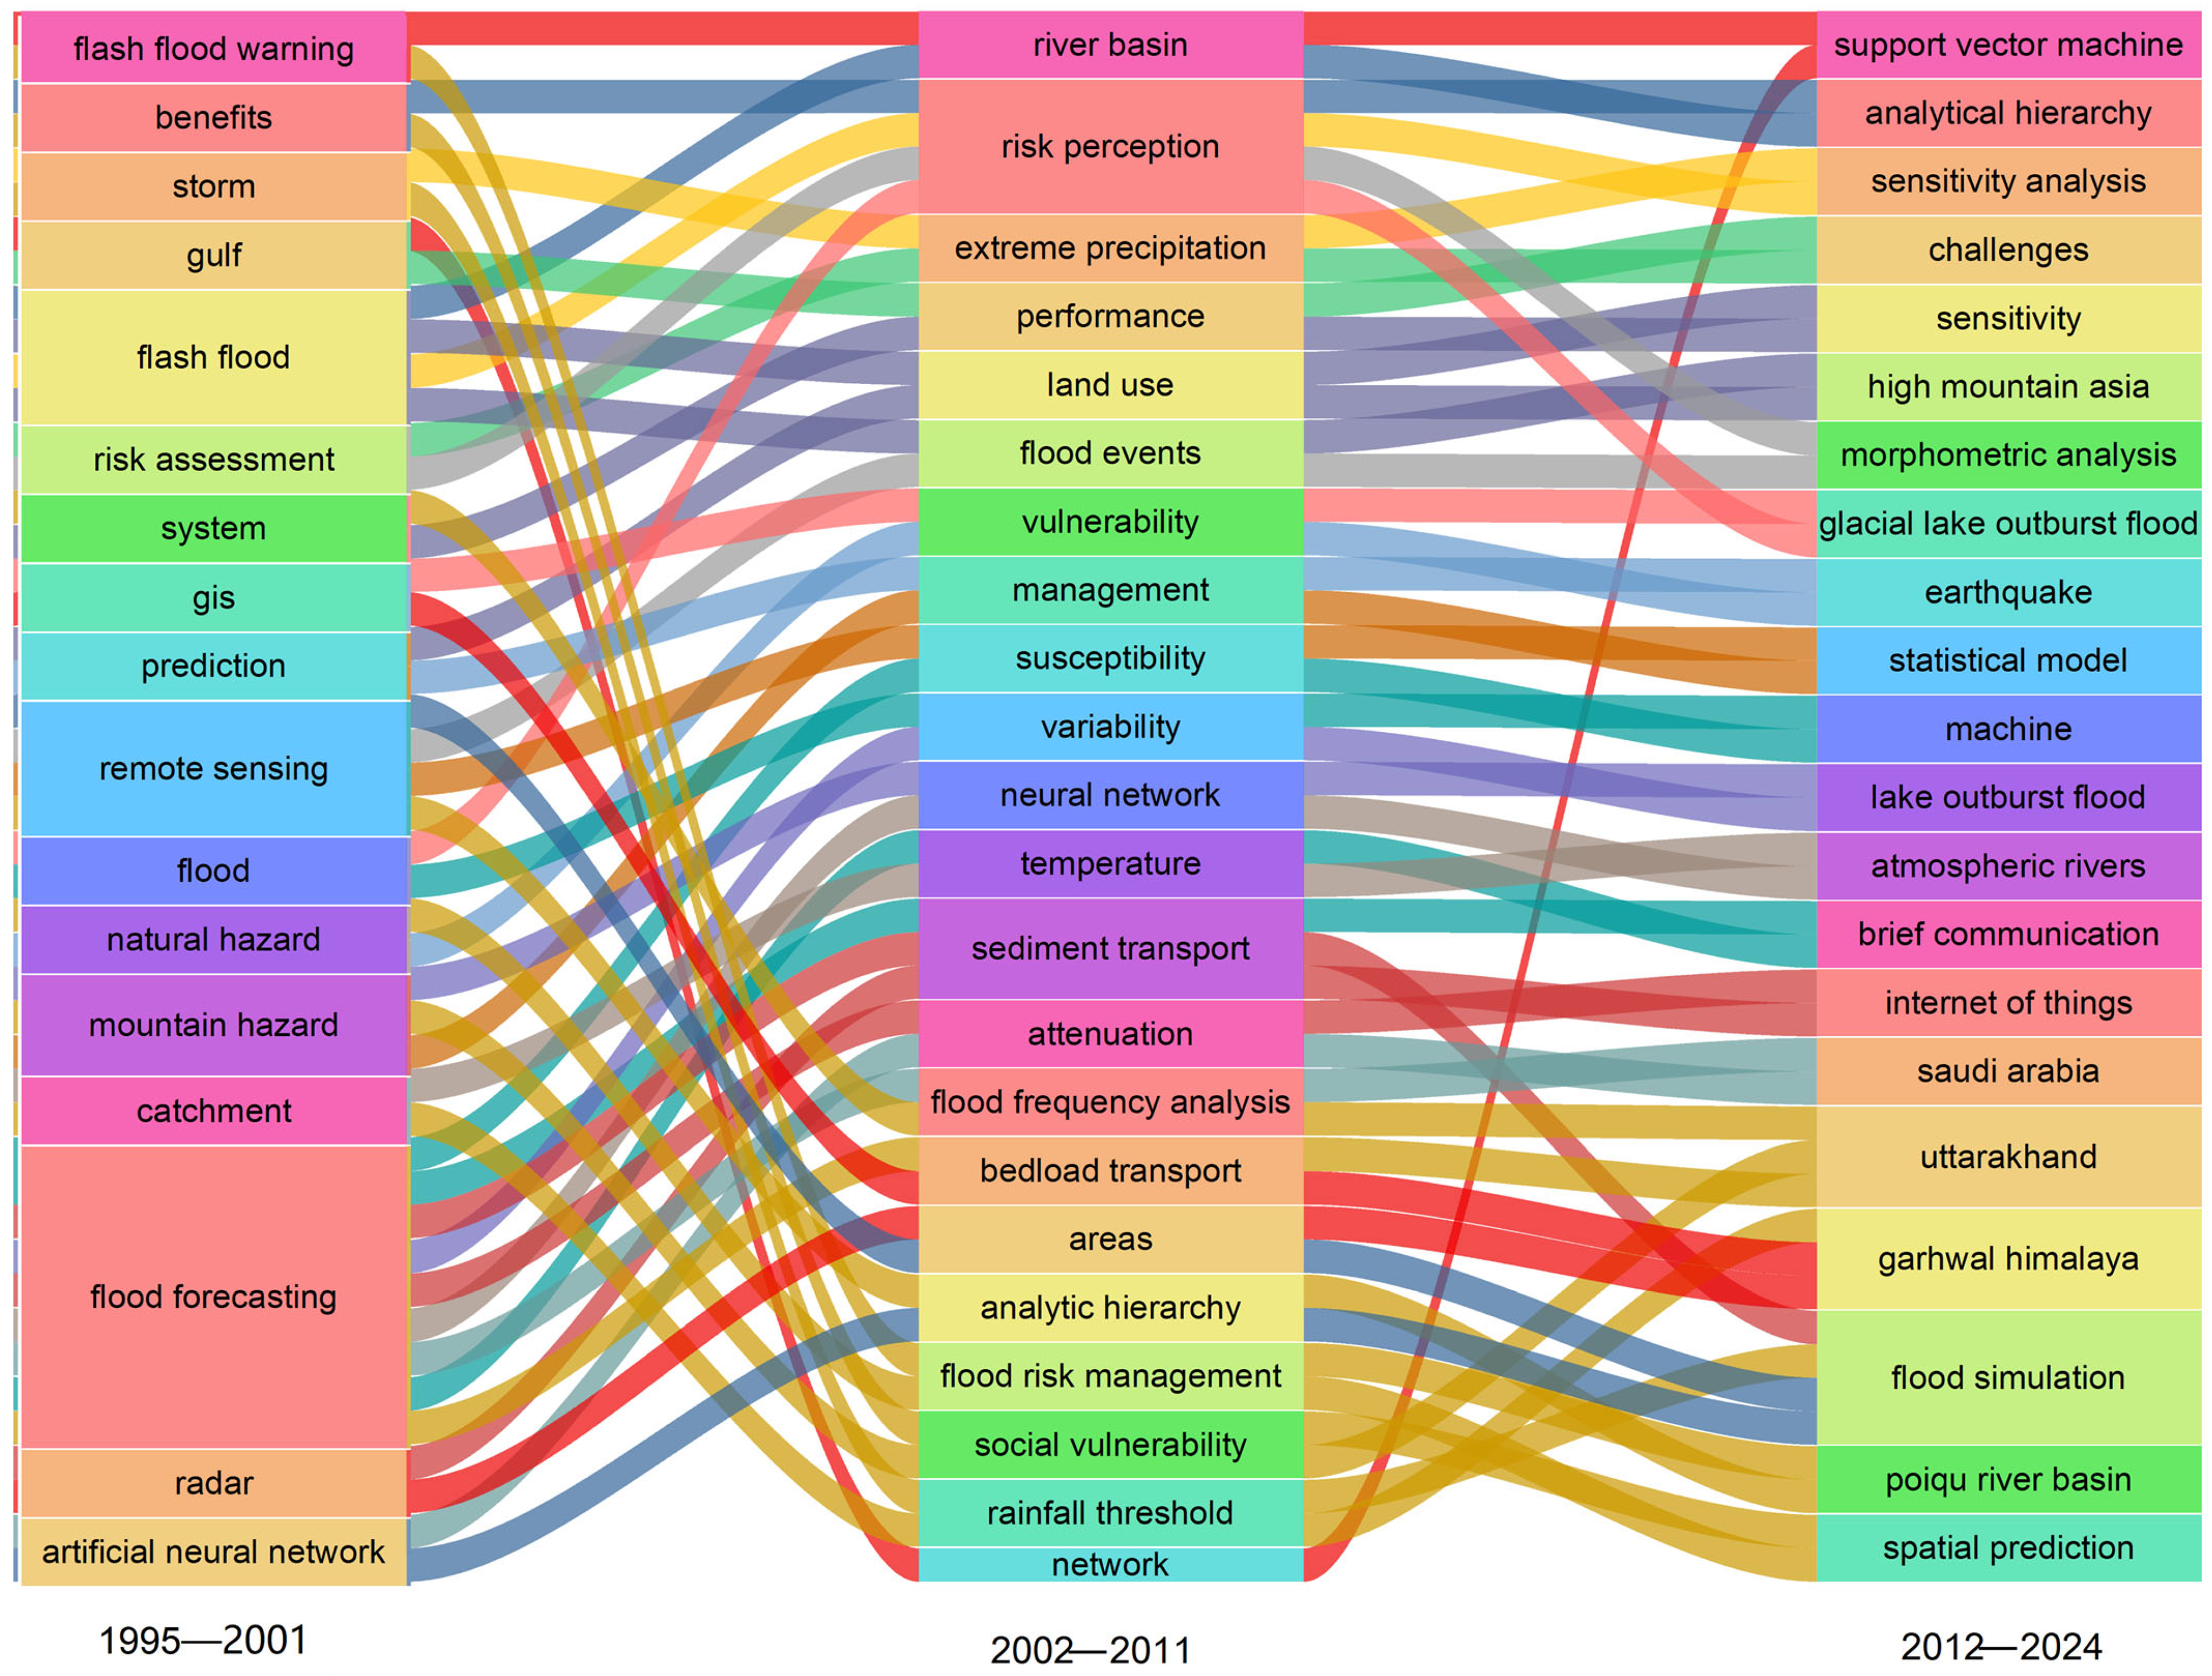
3.3.2. Temporal Evolution of Keywords

The keyword evolution analysis was conducted using CiteSpace, which models scientific knowledge as progressing from emergence through maturation to frontier expansion, as reflected in the temporal patterns of keyword co-occurrence, frequency, and citation networks. Our approach combines co-occurrence networks, time-zone analyses, clustering (e.g., Louvain algorithm), and burst detection to map annual shifts in disciplinary knowledge. The steps taken are as follows:
  • Extract keywords and publication years from literature databases to form a time-series dataset;
  • Compute co-occurrence strengths (e.g., cosine similarity or association strength) to build a weighted network, and then optimize the community structure via modularity (Q-value) and pruning methods (e.g., Pathfinder);
  • Use time-zone views to segment research phases, identify high-frequency keywords and their burst intensities, and assess influence via normalized citation rates;
  • Generate cluster labels and timelines to reveal how thematic focuses disperse and evolve.
CiteSpace excels by integrating temporal, structural, and impact dimensions, offering a rigorous theoretical basis and visual evidence for tracing trend evolution, making it ideal for charting knowledge maps and forecasting research frontiers in areas such as flash flood risk assessments.
The burst analysis of keywords from 1995 to 2024 reveals three distinct stages in flash flood risk research: early (1995–2001), middle (2002–2011), and late (2012–2024) stages:
-
1995–2001—“flash flood” (526 occurrences, 27.31%), “model” (312, 16.20%), and “risk assessment” (197, 10.23%) dominated, reflecting foundational work on flood characterization and modeling;
-
2002–2011—“risk” (188, 13.48%), “rainfall” (150, 10.75%), and “debris flow” (82, 5.88%) showed strong bursts (strengths 13.48, 10.75, and 5.88), marking a shift toward evaluating risk and secondary hazards;
-
2012–2024—“impact” (169, 13.90%), “vulnerability” (105, 8.63%), and “machine learning” (37, 3.04%) emerged with notable burst strengths (13.90, 8.63, and 3.04), indicating a shift toward studying socio-economic consequences and applying advanced analytical methods.
Together, these phases chart the progression from basic science through applied risk assessments to comprehensive impact analyses (see Figure 7).

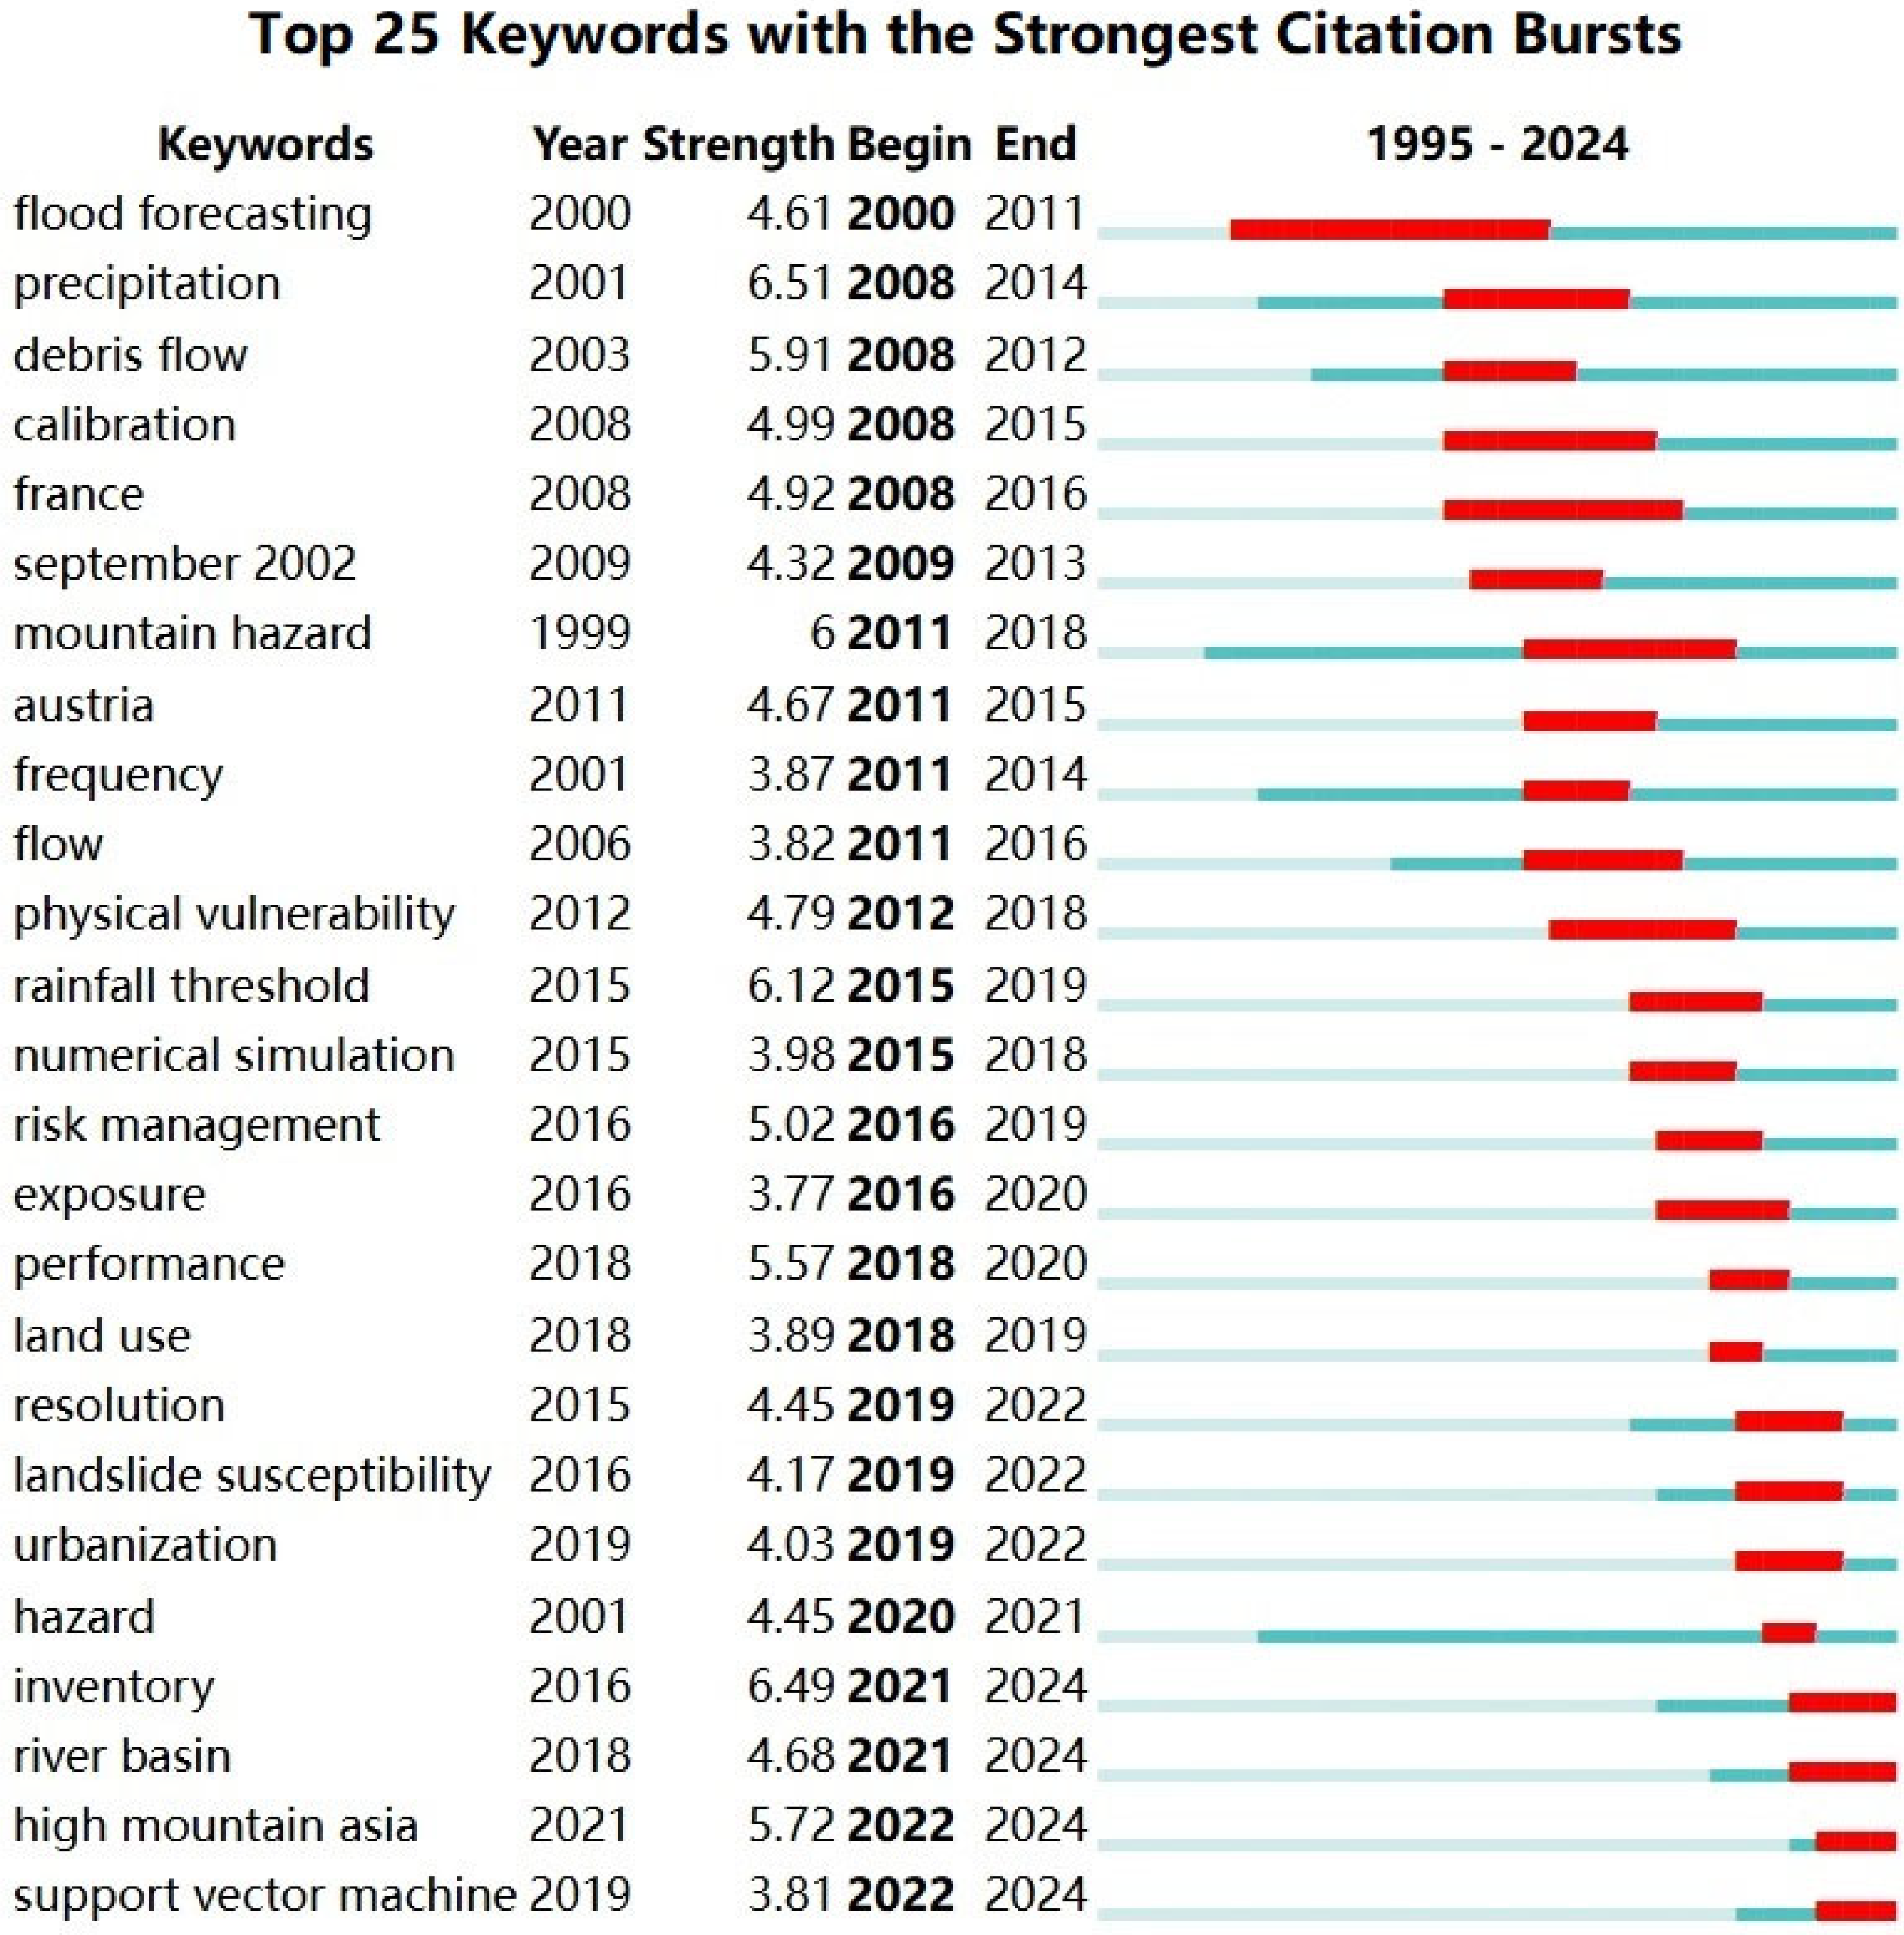
3.3.3. Keywords Exhibiting Peak Citation Surges

The keyword burst analysis utilizes the burst detection algorithm within CiteSpace, which is grounded in Kleinberg’s state-machine framework, through which it constructs time series of keyword frequencies and identifies statistically significant frequency spikes within flash flood risk assessments from 1995 to 2024, thereby quantifying burst strength to elucidate research hotspots and thematic evolution. This methodology entails a process wherein the literature data are extracted from Web of Science, keyword frequencies are aggregated across annual temporal intervals, a Markov process is applied to differentiate normal and burst states, and a state-transition cost function is minimized to determine burst periods and intensities (e.g., “risk”, burst strength 13.48, 2008–2011). Coupled with timeline visualizations and co-occurrence networks, the analysis maps an evolutionary progression from physical mechanisms (“flash flood”) to risk management (“risk”) and socio-technical integration (“machine learning”), mirroring the causal drivers of climate change, societal demands, and technological advancements. The results are presented in Figure 8.

4. Discussion

4.1. Analysis of Global Trends and Dynamics

4.1.1. Growth Pattern Analysis

A bibliometric analysis of annual publication outputs and trends, as delineated in Figure 2, demonstrates a robust and accelerating expansion in flash flood risk research over the period from 1995 to 2024. Across this 29–year interval, the discipline has accumulated 1841 publications, with a compound annual growth rate (CAGR) of 15.8%. This rate is derived from the following equation:
CAGR = V f V i 1 n 1
Here, V f = 211 (the publication count in 2024), V i = 3 (the count in 1995), and n = 29 (the temporal span), resulting in the following equation:
CAGR = 211 3 1 29 1 15.8 %
This quantitative measure elucidates an exponential increase in scholarly output, reflecting a progressively intensified focus within the academic community on the flash flood risk. The observed trajectory, from minimal initial contributions to substantial contemporary productivity, underscores the field’s transition from a marginal research area to a foundational component of disaster risk science.
Flash flood risk research grew from 21 publications in 1995–1999 to 221 by 2024, reflecting rapid expansion driven by improved data, methodologies, and the global recognition of its importance in natural hazard research, despite a temporary pandemic-related setback in 2021.

4.1.2. Statistical Comparative Analysis

To rigorously assess the statistical significance underlying the observed growth trajectories in annual publication volumes, this study examines two clearly delineated periods, 1995–1999 and 2000–2024, and utilizes the Mann–Whitney U test to rigorously quantify and assess the differences in their median values. The Mann–Whitney U test, as a robust and non-parametric statistical tool, is methodologically suitable for analyzing differences in the medians of two independent samples, particularly when the data deviate from normality or sample sizes are limited.
The principal methodological framework entails the ordered ranking of aggregated data from both samples before subsequently determining the cumulative rank score for one sample, denoted as R1. The U statistic is, therefore, formulated in accordance with the following expression:
U = n 1 n 2 + n 1 n 1 + 1 2 R 1
Here, n1 and n2 represent the sample sizes of the respective groups, while R1 corresponds to the cumulative rank sum of the first group. If the derived U statistic produces a p-value demonstrably below the designated significance threshold (α = 0.05), the null hypothesis of no median difference can be rejected in favor of the alternative hypothesis indicating a statistically significant disparity.
The results of this analysis yield a p-value of 0.001, providing compelling statistical evidence that the median annual publication volume for 2000–2024 exhibits a statistically significant increase compared with that for 1995–1999. This substantial increase in scholarly output and the overall intensification of research endeavors highlights a marked shift in research activity beginning in the 21st century. Such a transformation is potentially attributable to paradigm-shifting advancements in theoretical frameworks, technological innovations, or evolving societal and scientific imperatives that heightened academic interest and resource commitment within this domain.

4.1.3. Speculation on Influencing Factors

The remarkable expansion of flash flood risk research can be attributed to the combined influences of global climate change and proactive policy interventions. On one hand, the increasing frequency and intensity of extreme weather events have made flash floods a critical subject of scientific inquiry and disaster governance. On the other hand, crucial climate change assessment reports, such as the Fourth Assessment Report released by the Intergovernmental Panel on Climate Change (IPCC) in 2007, have driven significant increases in funding availability and policy prioritization for related research.
The rapid growth of flash flood risk research underscores its critical role in addressing climate change and advancing disaster management. This expansion, driven by extreme precipitation events, technological innovations (e.g., GIS and hydrological models), and global policies such as the Sendai Framework, has yielded a 15.8% CAGR. The field’s diversification, spanning early-warning systems, adaptive management, and socio-economic analysis, highlights its interdisciplinary nature and essential contributions to policymaking, disaster risk reduction, and sustainable development.

4.2. Analysis of Geographical and Institutional Drivers

A detailed analysis and discussion of the results in Section 3.2.1 are provided in Section 4.2.1 and Section 4.2.2. Section 3.2.2 refers to Section 4.2.3.

4.2.1. National Influence and Research Impact

Countries with more than 100 publications on mountain flood risk assessments between 1995 and 2024 were identified as the subjects of this study (see Figure 9). The relationship between the publication volume and citation impact was analyzed to systematically assess the academic influence of high-output countries within this research domain.
Between 1995 and 2024, significant disparities emerged in the academic impact of countries studying the mountain flood disaster risk. Italy achieved the highest average citation count (64.69) despite having a modest publication volume (159 papers), reflecting a focus on high-impact research. The UK ranked second (47.28), demonstrating strong scholarly influence. The US exhibited the most comprehensive strength, with a moderate publication volume (328 papers) but leading in total citations (11,383) and average citations per paper (34.69), underscoring the broad academic recognition and methodological rigor of US research. China, despite having the highest publication count (436 papers), had a lower average citation count (21.84), indicating room for improvement in research quality. India had the weakest impact, with an average citation count of 18.63.
These findings highlight that prolific output does not equate to a high citation impact. Countries can be categorized as high-production, high-impact (US); low-production, high-impact (Italy and the UK); high-production, low-impact (China); and low-production, low-impact (India), emphasizing the central role of research quality in determining scholarly influence.

4.2.2. National Research Priorities

Between 1995 and 2024, the body of research on flash flood risk assessments demonstrated substantial regional variation, reflecting distinct national priorities, geographical conditions, and methodological approaches. Chinese research notably focused on the assessment of flash flood risks in the context of climate change and rapid urbanization, particularly emphasizing enhancing national preparedness and informing policy strategies. The United States led advancements in early-warning systems, risk mitigation strategies, and the development of sophisticated risk assessment methodologies, utilizing cutting-edge technologies and fostering interdisciplinary collaborations to drive global research innovation. Research in Italy predominantly centered on the geological and hydrological factors influencing the flash flood risk, especially in mountainous regions such as the Alps and the Apennines, while also engaging in extensive international cooperation within the European research framework. India’s contributions integrated socio-economic dimensions into localized risk assessment tools, acknowledging the critical role of community vulnerabilities in disaster management strategies, especially in response to increasingly frequent extreme weather events. Collectively, these research efforts underscore the need for a multifaceted approach to flash flood risk assessments, acknowledging the complex interplay of environmental, technological, and socio-economic drivers. The shifting focus of research hotspots from hydrological process modeling and socio-economic vulnerability mapping to machine learning-driven prediction offers valuable guidance for future flood risk management, advancing real-time monitoring networks, tailoring community-based mitigation measures, and integrating data-driven decision support tools to enhance resilience against evolving flash flood threats. As the field continues to evolve, the convergence of diverse national contributions will be vital in shaping comprehensive, interdisciplinary strategies for mitigating flash flood risks in a rapidly changing global environment.

4.2.3. Analysis of the Research Structure

  • Collaboration Network Density and Strength
Within the domain of flash flood risk assessment, the bibliometric analysis demonstrates that the density and strength of global collaboration networks fundamentally determine research efficacy in this field. The Chinese Academy of Sciences (CAS; 181 links, total link strength 69,923) and the University of Oklahoma (181 links, total link strength 18,423) function as pivotal hubs, evidencing the extensive interconnectivity and expansive collaborative scope of global research institutions. This network architecture facilitates the dissemination of knowledge and integration of technological advancements. Moreover, the National Oceanic and Atmospheric Administration (NOAA; 181 links, total link strength 14,983) and the China Institute of Water Resources and Hydropower Research (178 links, total link strength 17,383) exert substantial influence within interdisciplinary and international collaborations, substantially contributing to developing hydrological modeling and early-warning systems.
2.
Research Output and Academic Impact
Research output and academic impact, quantified through publication counts and citation metrics, constitute fundamental metrics for evaluating scholarly impact in flash flood risk studies. The Chinese Academy of Sciences (CAS) excels with 99 publications and 2686 citations, affirming its pre-eminence in high-impact research. This pre-eminence is attributable to strategic partnerships with governmental and non-governmental stakeholders, as demonstrated by its contributions to national flood defense frameworks, wherein the research findings are operationalized into early-warning systems, thereby enhancing disaster management strategies. Furthermore, CAS research yields significant insights into dissecting flood mechanisms through its analysis of rainfall–runoff dynamics in mountainous regions. In contrast, the National Oceanic and Atmospheric Administration (NOAA; 51 publications, 2314 citations) and the University of Bern (33 publications, 2114 citations) exhibit considerable citation impacts, with their outputs garnering widespread acknowledgment within the scientific community. Notably, NOAA’s flood prediction models achieve global recognition, substantiated by their adoption by international meteorological agencies.
3.
International and Interdisciplinary Collaboration
International and interdisciplinary collaboration substantially augment research impact in flash flood risk assessments, as substantiated by the network metrics of the University of Geneva (180 links, total link strength 27,527) and the University of Zurich (155 links, total link strength 20,527). These institutions systematically participate in interdisciplinary initiatives, integrating environmental science, engineering, and social sciences. A salient example is their collaboration with the World Bank to optimize flood defense strategies in Africa, producing viable strategies to address climate adaptation and water security.

4.3. Analysis of Core Themes and Evolutionary Dynamics

4.3.1. Thematic Distribution and Technological Frontiers

A cluster analysis of the keyword co-occurrence network (153 nodes, 5678 edges) in the flash flood risk assessment partitioned four thematic clusters (Q = 0.73, where Q is the modularity index measuring the quality of division into clusters, with higher values indicating a stronger modular structure; σ = 0.02, where σ is the standard deviation of the modularity index; and p < 0.001, indicating that the clustering result is statistically significant and unlikely to occur by chance; Louvain algorithm).
Cluster 1 (47.1%, σ = 12.3, where σ here represents the standard deviation of relative cluster frequency), characterized by “Flash Flood” (40.5% link strength, with the link strength denoting the total co-occurrence weight of the keyword as a proportion of all cluster links; Z = 3.67, where Z is the z-score indicating how many standard deviations the observed link strength deviates from its mean under a null model) and “Model” (r = 0.89, where r is the Pearson correlation coefficient between the occurrences of “Model” and “Flash Flood”; Z = 3.05, the corresponding z-score denotes statistical significance), demonstrated an increased network density (0.68, where network density is the ratio of actual to possible connections within the cluster, compared to the network-wide density of 0.42), indicative of a robust synthesis of hydrological dynamics and numerical modeling, which was attributable to multidisciplinary collaboration.
Cluster 2 (28.6%), defined by “Climate Change” (22.6% link strength; Z = 2.93, z-score for cluster-specific link strength; r = 0.81, Pearson’s correlation coefficient between “Climate Change” and “Risk”), evidenced high betweenness centrality (0.61, where betweenness centrality measures the extent to which a node lies on shortest paths between other nodes, indicating its role as a bridge in the network), embedding socio-ecological frameworks and underscoring climate adaptation as a principal determinant, although its regional specificity requires additional investigation.
Cluster 3 (15.7%) was characterized by “Hazard” (14.3% link strength; Z = 2.32, z-score for link strength; degree centrality = 0.67, where degree centrality represents the proportion of other nodes directly connected to the keyword), with a reduced average path length (2.3, the average number of steps along the shortest paths for all node pairs within the cluster, compared to the network-wide average path length of 2.7), suggesting a regionally focused geological research emphasis.
Cluster 4 (8.6%), comprising “Spatial Prediction” (normalized citation = 2.9442, the ratio of the cluster’s citation count to its expected citation count adjusted for the publication year; Z = 2.95, the z-score for normalized citations) and “Machine Learning” (r = 0.76, the Pearson correlation coefficient between “Machine Learning” occurrences and the cluster centroid), underscored methodological advancements in probabilistic modeling, despite its limited frequency (1.8%).
Hydrological and risk-related themes (75.7%) constituted the majority, whereas geological and technical clusters (24.3%) indicated a transition toward artificial intelligence-enabled research frontiers, the scalability of which is the subject of ongoing scholarly contention.

4.3.2. Thematic Evolution and Driving Forces

The frequency percentages and burst intensities shown in Figure 7 chart the phased evolution of flash flood research and expose the shifting drivers and paradigms underlying each stage:(1) in 1995–2001 (Emergence of Mechanistic Modeling), “flash flood” (27.31%) and “model” (16.20%) dominate, reflecting early efforts to resolve physical flood processes through numerical modeling and remote sensing (e.g., “remote sensing”, 3.63%). These studies were naturally constrained by the computational power and data resolution available at the time. (2) In 2002–2011 (Applied Risk Science), sharp bursts in “risk” (13.48) and “rainfall” (10.75) mark a shift toward evaluations of hazards and exposures, driven in part by more frequent extreme precipitation under climate change and the refinement of hydrological models and risk management frameworks. The emergence of “debris flow” (5.88) signals the growing awareness of rainfall-triggered secondary hazards and cascading disaster chains. (3) In 2012–2024 (Socio-Technical Integration), rising burst strengths in “impact” (13.90) and “vulnerability” (8.63) indicate a turn toward socio-ecological interactions, propelled by escalating economic losses (e.g., IPCC reports) and global resilience mandates (e.g., UNDRR frameworks). Meanwhile, “machine learning” (3.04) and related terms such as “spatial prediction” (2.22%) point to the early but promising integration of advanced data-driven methods (see Figure 10).
Together, this trajectory, from foundational mechanistic inquiry through applied risk assessments to multidimensional socio-technical integration, demonstrates the field’s adaptive response to evolving climatic, societal, and technological pressures and lays a solid foundation for future multiscale, interdisciplinary early-warning and adaptive management systems.

4.3.3. Dynamic Shift in Research Priorities

Figure 8’s keyword burst analysis traces the shifting priorities in flash flood research. In 1999–2001 (Foundational Hazard Focus), the sustained burst of “mountain hazards” (6.0; 1999–2018) underscores early efforts to map mountain-specific flood risks. Concurrent bursts in “precipitation” (6.51; 2001) and “flood forecasting” (4.61; 2000) reflect the emerging emphasis on rainfall triggers and predictive modeling. From 2008 onward (Methodological Refinement), rising bursts for “calibration” (4.99) and “numerical simulation” (3.98) mark a clear turn toward more sophisticated computational approaches, enhancing the precision and reliability of risk assessments. In 2015–2024 (integrated risk management), the keywords “risk management” (5.02) and “inventory” (6.49) signal a broadening toward comprehensive mitigation frameworks. Co-bursts in “landslide susceptibility” (4.17) and “urbanization” (4.03) highlight the growing awareness of human–environment interactions, while “high mountain Asia” (5.72) points to region-specific challenges. The emergence of “support vector machine” (3.81) illustrates the nascent integration of machine learning methods.
Together, these bursts, from early hazard characterization and precipitation analyses through advanced modeling to multidimensional risk-management, reveal a field dynamically responding to climatic variability, anthropogenic pressures, and technological innovation. Future work should build on these evolving themes by integrating cutting-edge data-driven techniques to tackle the remaining challenges in flood-risk management.
In summary, the discussion shows, via annual publication trends (1995–2024), a 15.8% CAGR, and a Mann–Whitney U test (p = 0.001), that flash flood risk research has expanded exponentially. This surge is linked to more frequent extreme precipitation under climate change, global policy drivers (e.g., IPCC AR4, and the Sendai Framework), and advances in GIS and hydrological modeling. Geographical and institutional analyses find that China leads in output, the US and Italy achieve the highest citation rates, and the Chinese Academy of Sciences, NOAA, and the University of Bern serve as major collaboration hubs. Finally, keyword co-occurrence, burst term, and clustering analyses identify four core themes—hydrological modeling, risk management and socio-ecological impacts, geological/regional factors, and technological innovations (e.g., machine learning)—tracing the field’s evolution from mechanistic inquiry to integrated risk management and socio-technical approaches and underscoring the need for future interdisciplinary, multiscale early-warning and adaptive management systems.

5. Conclusions

Mountain flood risk assessments are vital in disaster science, tackling the rising threat of extreme precipitation in steep, fragile mountain regions experiencing climate change. We examined 1841 peer-reviewed articles from the Web of Science Core Collection (1995–2024) using CiteSpace and VOSviewer, applying keyword co-occurrence, burst detection, and Louvain clustering, and validated the results using the Mann–Whitney U test. Publication output grew at a 15.8% CAGR, growing from 3 articles in 1995 to 211 in 2024, peaking at 161 in 2019 and averaging 205 in 2023–2024. China (23.7%, 436 articles), the US (17.8%, 327), and Italy (8.6%, 158) together account for over half the total, led by the Chinese Academy of Sciences (108 articles, h-index 42). Thematic evolution occurred in three phases: (1) foundational modeling (1995–2001), dominated by “flash flood” and “hydrology” (70% of early keywords); (2) risk-focused advances (2002–2011), centered on “vulnerability” and “hazard” (burst strength 5.2); and (3) socio-technical integration (2012–2024), led by “climate change”, “machine learning”, and “resilience” (co-occurrence > 300). Machine learning mentions have tripled since 2015 (12–39 annually), yet only 18% of studies address data interoperability and fewer than 10% report model explainability.
Despite this growth, critical shortcomings persist: research on mountain flood risks in African and Southeast Asian regions is scarce, creating stark regional gaps; collaboration among hydrology, social science, and computer science remains limited, leading to siloed approaches; and many machine learning-based flood-forecasting models operate as “black boxes”, offering little interpretability to policymakers and relief agencies, thereby undermining trust and practical application.
From a practical standpoint, this study contributes to disaster management by delineating influential methodologies (e.g., GIS and AI-driven forecasting) and research hubs, advocating the resolution of data and modeling limitations to customize resilience strategies for vulnerable regions, thereby providing policymakers with a scientifically grounded foundation for decision-making.
To address these issues, we propose (a) offering targeted funding and international partnerships to bolster mountain flood assessment projects in under-researched, high-risk areas such as Africa and Southeast Asia; (b) establishing interdisciplinary consortia by uniting hydrologists, social scientists, and AI researchers to co-design and iteratively refine study protocols; and (c) developing an open data and model-sharing platform, enabling the cloud-based co-creation, online replication, and continuous optimization of hydrometeorological datasets, socio-economic indicators, and flood-forecasting algorithms.
Prospectively, we recognize that our reliance on the Web of Science Core Collection may introduce database bias by under-representing publications from certain regions and disciplines, excluding non-English sources, and omitting the gray literature such as technical reports, theses, and conference proceedings. This language and repository bias may reduce the comprehensiveness of our thematic and citation analyses. To address these gaps, future research should integrate additional bibliographic databases (e.g., Scopus and Google Scholar) and explicitly incorporate the gray and non-English literature. Such an expanded scope would provide a more holistic view of the global research landscape, better capture emerging regional insights, and refine thematic trends, thereby strengthening the robustness and inclusivity of bibliometric assessments in flash flood risk studies.
Looking ahead, three priority areas should guide the field: (1) multimodal data fusion combining satellite remote sensing, in situ monitoring, and social media sentiment analysis to create high-resolution, spatiotemporal early-warning systems; (2) community-based assessments using participatory GIS and citizen-science methods to involve local populations in hazard mapping, data collection, and model validation, boosting both accuracy and community buy-in; and (3) cross-sectoral collaboration by partnering with researchers, practitioners (e.g., local governments and relief agencies), and policymakers at every stage, from model design and calibration to deployment, ensuring the seamless integration of scientific insights into disaster risk reduction strategies.

Author Contributions

Q.L. conceived the study, designed the research framework, and drafted the manuscript. Y.T. performed the bibliometric analysis and oversaw data curation. S.W. and X.W. conducted statistical analyses of the bibliometric data and validated the methodology. Q.L. and S.W. contributed expertise in mountain flood risk assessments and reviewed the pertinent literature. X.W. and Y.L. synthesized the findings and aided in their interpretation. Q.L. and Y.L. refined the manuscript for clarity and coherence, ensuring the integrity of the final version. All authors have read and agreed to the published version of the manuscript.

Funding

This research was funded by the Zhejiang Provincial Joint Fund Key Projects (Grant No. LZJMZ24D050007), the “Pioneer” and “Leading Goose” R&D Program of Zhejiang (Grant No. 2025C02048), and the President’s Fund of the Zhejiang Institute of Hydraulics and Estuary (Grant No. ZIHE21Z005).

Data Availability Statement

The original contributions presented in this study are included in the article. Further inquiries can be directed to the corresponding authors.

Conflicts of Interest

The authors declare no conflicts of interest.

References

  1. Subraelu, P.; Ahmed, A.; Ebraheem, A.A.; Sherif, M.; Mirza, S.B.; Ridouane, F.L.; Sefelnasr, A. Risk Assessment and Mapping of Flash Flood Vulnerable Zones in Arid Region, Fujairah City, UAE-Using Remote Sensing and GIS-Based Analysis. Water 2023, 15, 30. [Google Scholar] [CrossRef]
  2. Li, W.J.; Lin, K.R.; Zhao, T.T.G.; Lan, T.; Chen, X.H.; Du, H.W.; Chen, H.Y. Risk assessment and sensitivity analysis of flash floods in ungauged basins using coupled hydrologic and hydrodynamic models. J. Hydrol. 2019, 572, 108–120. [Google Scholar] [CrossRef]
  3. Othman, A.; El-Saoud, W.A.; Habeebullah, T.; Shaaban, F.; Abotalib, A.Z. Risk assessment of flash flood and soil erosion impacts on electrical infrastructures in overcrowded mountainous urban areas under climate change. Reliab. Eng. Syst. Saf. 2023, 236, 12. [Google Scholar] [CrossRef]
  4. Zhen, Y.W.; Liu, S.G.; Zhong, G.H.; Zhou, Z.Z.; Liang, J.Y.; Zheng, W.Q.; Fang, Q. Risk Assessment of Flash Flood to Buildings Using an Indicator-Based Methodology: A Case Study of Mountainous Rural Settlements in Southwest China. Front. Environ. Sci. 2022, 10, 18. [Google Scholar] [CrossRef]
  5. Alasali, F.; Tawalbeh, R.; Ghanem, Z.; Mohammad, F.; Alghazzawi, M. A Sustainable Early Warning System Using Rolling Forecasts Based on ANN and Golden Ratio Optimization Methods to Accurately Predict Real-Time Water Levels and Flash Flood. Sensors 2021, 21, 26. [Google Scholar] [CrossRef]
  6. Tudose, N.C.; Ungurean, C.; Davidescu, S.; Clinciu, I.; Marin, M.; Nita, M.D.; Davidescu, A. Torrential flood risk assessment and environmentally friendly solutions for small catchments located in the Romania Natura 2000 sites Ciucas, Postavaru and Piatra Mare. Sci. Total Environ. 2020, 698, 16. [Google Scholar] [CrossRef]
  7. Versini, P.A. Use of radar rainfall estimates and forecasts to prevent flash flood in real time by using a road inundation warning system. J. Hydrol. 2012, 416, 157–170. [Google Scholar] [CrossRef]
  8. Yi, S.; Xie, Y.; Zuo, X. A risk analysis information model with uncertainty for flood hazard of dam-break. In Proceedings of the 2010 18th International Conference on Geoinformatics, Beijing, China, 18–20 June 2010; pp. 1–6. [Google Scholar]
  9. Yuan, W.L.; Liu, M.Q.; Wan, F. Study on the impact of rainfall pattern in small watersheds on rainfall warning index of flash flood event. Nat. Hazards 2019, 97, 665–682. [Google Scholar] [CrossRef]
  10. Yuan, W.L.; Lu, L.; Song, H.Z.; Zhang, X.; Xu, L.J.; Su, C.G.; Wu, Z.N. Study on the Early Warning for Flash Flood Based on Random Rainfall Pattern. Water Resour. Manag. 2022, 36, 1587–1609. [Google Scholar] [CrossRef]
  11. Li, Z.H.; Zhang, H.B.; Singh, V.P.; Yu, R.H.; Zhang, S.Q. A Simple Early Warning System for Flash Floods in an Ungauged Catchment and Application in the Loess Plateau, China. Water 2019, 11, 21. [Google Scholar] [CrossRef]
  12. Rogelis, M.C.; Werner, M. Streamflow forecasts from WRF precipitation for flood early warning in mountain tropical areas. Hydrol. Earth Syst. Sci. 2018, 22, 853–870. [Google Scholar] [CrossRef]
  13. Abdelkareem, M.; Mansour, A.M. Risk assessment and management of vulnerable areas to flash flood hazards in arid regions using remote sensing and GIS-based knowledge-driven techniques. Nat. Hazards 2023, 117, 2269–2295. [Google Scholar] [CrossRef]
  14. Luong, T.T.; Pöschmann, J.; Kronenberg, R.; Bernhofer, C. Rainfall Threshold for Flash Flood Warning Based on Model Output of Soil Moisture: Case Study Wernersbach, Germany. Water 2021, 13, 15. [Google Scholar] [CrossRef]
  15. Bricker, J.D.; Schwanghart, W.; Adhikari, B.R.; Moriguchi, S.; Roeber, V.; Giri, S. Performance of Models for Flash Flood Warning and Hazard Assessment: The 2015 Kali Gandaki Landslide Dam Breach in Nepal. Mt. Res. Dev. 2017, 37, 5–15. [Google Scholar] [CrossRef]
  16. Liechti, K.; Panziera, L.; Germann, U.; Zappa, M. The potential of radar-based ensemble forecasts for flash-flood early warning in the southern Swiss Alps. Hydrol. Earth Syst. Sci. 2013, 17, 3853–3869. [Google Scholar] [CrossRef]
  17. Zhai, X.Y.; Guo, L.; Liu, R.H.; Zhang, Y.Y. Rainfall threshold determination for flash flood warning in mountainous catchments with consideration of antecedent soil moisture and rainfall pattern. Nat. Hazards 2018, 94, 605–625. [Google Scholar] [CrossRef]
  18. Carpenter, T.M.; Sperfslage, J.A.; Georgakakos, K.P.; Sweeney, T.; Fread, D.L. National threshold runoff estimation utilizing GIS in support of operational flash flood warning systems. J. Hydrol. 1999, 224, 21–44. [Google Scholar] [CrossRef]
  19. Larnier, K.; Coves, J.; Stéphan, G.; Delporte, P.; Dumas, L.; Boulfani-Cuisinaud, Y. Urban Flash Flood Prediction through High-Resolution Hydrodynamic Modeling and Machine Learning Approaches. In Proceedings of the IGARSS 2024–2024 IEEE International Geoscience and Remote Sensing Symposium 2024, Athens, Greece, 7–12 July 2024; pp. 3757–3760. [Google Scholar] [CrossRef]
  20. Xia, J.Q.; Falconer, R.A.; Lin, B.L.; Tan, G.M. Numerical assessment of flood hazard risk to people and vehicles in flash floods. Environ. Model. Softw. 2011, 26, 987–998. [Google Scholar] [CrossRef]
  21. Wu, S.J.; Hsu, C.T.; Lien, H.C.; Chang, C.H. Modeling the effect of uncertainties in rainfall characteristics on flash flood warning based on rainfall thresholds. Nat. Hazards 2015, 75, 1677–1711. [Google Scholar] [CrossRef]
  22. Zelenáková, M.; Ganová, L.; Purcz, P.; Satrapa, L. Methodology of flood risk assessment from flash floods based on hazard and vulnerability of the river basin. Nat. Hazards 2015, 79, 2055–2071. [Google Scholar] [CrossRef]
  23. Zhao, G.; Liu, R.H.; Yang, M.X.; Tu, T.B.; Ma, M.H.; Hong, Y.; Wang, X.K. Large-scale flash flood warning in China using deep learning. J. Hydrol. 2022, 604, 10. [Google Scholar] [CrossRef]
  24. Fang, X.; Wu, X.; Zhou, C.; Wu, T.; Du, X.; Wang, W. Risk Assessment of Mountain Torrents Disaster in Jiangxi Province, China Based on Random Forest Algorithm. Water 2019, 11, 2429. [Google Scholar] [CrossRef]
  25. Khadka, N.; Chen, X.; Nie, Y.; Thakuri, S.; Zheng, G.; Zhang, G. Evaluation of Glacial Lake Outburst Flood Susceptibility Using Multi-Criteria Assessment Framework in Mahalangur Himalaya. Front. Earth Sci. 2021, 8, 601288. [Google Scholar] [CrossRef]
  26. Elfeki, A.; Masoud, M.; Niyazi, B. Integrated rainfall-runoff and flood inundation modeling for flash flood risk assessment under data scarcity in arid regions: Wadi Fatimah basin case study, Saudi Arabia. Nat. Hazards 2017, 85, 87–109. [Google Scholar] [CrossRef]
  27. Jubach, R.; Tokar, A.S. International Severe Weather and Flash Flood Hazard Early Warning Systems-Leveraging Coordination, Cooperation, and Partnerships through a Hydrometeorological Project in Southern Africa. Water 2016, 8, 11. [Google Scholar] [CrossRef]
  28. Lee, J.H.; Yuk, G.M.; Moon, H.T.; Moon, Y.I. Integrated Flood Forecasting and Warning System against Flash Rainfall in the Small-Scaled Urban Stream. Atmosphere 2020, 11, 19. [Google Scholar] [CrossRef]
  29. Eslaminezhad, S.A.; Eftekhari, M.; Akbari, M. GIS-Based Flood Risk Zoning Based On Data-Driven Models. J. Hydrol. Sci. 2020, 6, 75–98. [Google Scholar] [CrossRef]
  30. Liu, Z.; Yang, Z.; Chen, M.; Xu, H.; Yang, Y.; Zhang, J.; Wu, Q.; Wang, M.; Song, Z.; Ding, F. Research Hotspots and Frontiers of Mountain Flood Disaster: Bibliometric and Visual Analysis. Water 2023, 15, 673. [Google Scholar] [CrossRef]
  31. Abu El-Magd, S.A.; Maged, A.; Farhat, H. Hybrid-based Bayesian algorithm and hydrologic indices for flash flood vulnerability assessment in coastal regions: Machine learning, risk prediction, and environmental impact. Environ. Sci. Pollut. Res. 2022, 29, 57345–57356. [Google Scholar] [CrossRef]
  32. Börner, K.; Chen, C.; Boyack, K.W. Visualizing knowledge domains. Annu. Rev. Inf. Sci. Technol. 2005, 37, 179–255. [Google Scholar] [CrossRef]
  33. Liu, X.; Bollen, J.; Nelson, M.L.; Van de Sompel, H. Co-authorship networks in the digital library research community. Inf. Process. Manag. 2005, 41, 1462–1480. [Google Scholar] [CrossRef]
  34. Aria, M.; Cuccurullo, C. Bibliometrix: An R-tool for comprehensive science mapping analysis. J. Informetr. 2017, 11, 959–975. [Google Scholar] [CrossRef]
  35. Mokhnacheva, Y.V. The term ‘bibliometric analysis’ and its interaction with other high-frequency keywords in the topics of SciVal. Autom. Doc. Math. Linguist. 2023, 57, 284–295. [Google Scholar] [CrossRef]
  36. Smith, T.R.; Brown, L.K.; Davis, M.R. Integrating socioeconomic vulnerability indices into predictive frameworks for mountain flood risk assessment. J. Hydrol. 2023, 610, 128932. [Google Scholar]
  37. Zhang, Y.; Patel, S. Addressing geomorphological complexities in remote-sensing-based early-warning systems for mountainous flash floods. Remote Sens. Environ. 2022, 267, 112749. [Google Scholar]
  38. García, M.; López, A.; Singh, V. Evaluating the transferability of machine learning models across diverse mountain catchments for flood risk assessment. Nat. Hazards 2024, 115, 89–107. [Google Scholar]
Figure 1. Search strategy and analysis content.
Water 17 01513 g001
Figure 2. Yearly publication volume and temporal trends.
Water 17 01513 g002
Figure 3. Global distribution of leading research countries.
Water 17 01513 g003
Figure 4. Network map of international collaborations. (a) Country collaboration networks. (b) Country collaboration networks.
Water 17 01513 g004aWater 17 01513 g004b
Figure 5. (a) Collaborative clustering network of research institutions. (b) Temporal collaboration network of research institutions.
Water 17 01513 g005
Figure 6. Keyword co-occurrence clustering network.
Water 17 01513 g006
Figure 7. Timeline of keyword research evolution.
Water 17 01513 g007
Figure 8. Keyword burst analysis.
Water 17 01513 g008
Figure 9. Bar chart of publication output and citation impact.
Water 17 01513 g009
Figure 10. Sankey diagram of keyword evolution.
Water 17 01513 g010
Disclaimer/Publisher’s Note: The statements, opinions and data contained in all publications are solely those of the individual author(s) and contributor(s) and not of MDPI and/or the editor(s). MDPI and/or the editor(s) disclaim responsibility for any injury to people or property resulting from any ideas, methods, instructions or products referred to in the content.

