Article

Seasonal Precipitation and Anomaly Analysis in Middle East Asian Countries Using Google Earth Engine

by
Neyara Radwan
1,2,
Bijay Halder
3,*,
Minhaz Farid Ahmed
4,
Samyah Salem Refadah
5,
Mohd Yawar Ali Khan
6,7,
Miklas Scholz
8,9,10,11,*,
Saad Sh. Sammen
12 and
Chaitanya Baliram Pande
13,14
1
Industrial Management Department, Business Faculty, Liwa College, Abu Dhabi 41009, United Arab Emirates
2
Department of Mechanical Engineering, Faculty of Engineering, Suez Canal University, Ismailia 8366004, Egypt
3
Department of Earth Sciences and Environment, Faculty of Science and Technology, Universiti Kebangsaan Malaysia (UKM), Bangi 43600, Selangor, Malaysia
4
Institute for Environment and Development (LESTARI), Universiti Kebangsaan Malaysia (UKM), Bangi 43600, Selangor, Malaysia
5
Department of Geography and GIS, Faculty of Arts and Humanities, King Abdulaziz University, Jeddah 21589, Saudi Arabia
6
Faculty of Earth Sciences, King Abdulaziz University, Jeddah 21589, Saudi Arabia
7
State Key Laboratory of Eco-Hydraulics in Northwest Arid Region, School of Water Resources and Hydropower, Xi’an University of Technology, Xi’an 710048, China
8
Department of Civil Engineering Science, School of Civil Engineering, and the Built Environment, Faculty of Engineering and the Built Environment, University of Johannesburg, Kingsway Campus, P.O. Box 524, Aukland Park, Johannesburg 2006, South Africa
9
Department of Water Management, Sector of Regional Development, Environment and Construction, District of Herzogtum Lauenburg, Barlachstraße 2, 23909 Ratzeburg, Germany
10
Kunststoff-Technik Adams, Specialist Company According to Water Law, Schulstraße 7, 26931 Elsfleth, Germany
11
Nexus by Sweden, Skepparbacken 5, 722 11 Västerås, Sweden
12
Department of Civil Engineering, College of Engineering, Diyala University, Diyala Governorate 32001, Iraq
13
Department of Civil Engineering, School of Core Engineering, Faculty of Science, Technology and Architecture (FoSTA), Manipal University Jaipur, Dehmi Kalan, Jaipur 303007, India
14
New Era and Development in Civil Engineering Research Group, Scientific Research Center, Al-Ayen University, Thi-Qar, Nasiriyah 64001, Iraq
*
Authors to whom correspondence should be addressed.
Water 2025, 17(10), 1475; https://doi.org/10.3390/w17101475
Submission received: 14 March 2025 / Revised: 7 May 2025 / Accepted: 9 May 2025 / Published: 14 May 2025

Abstract

:
Middle East (ME) countries have arid and semi-arid climates with low annual precipitation and considerable geographical and temporal variability, which contribute to their extremely erratic rainfall. The generation of timely and accurate climatic information for the ME is anticipated to be aided by global reanalysis products and satellite-based precipitation estimations. Precipitation Estimation from Remotely Sensed Information using Artificial Neural Networks (PERSIANN) and Climate Hazards Group Infra-Red Precipitation (CHIRPS) on Google Earth Engine (GEE) were used to study rainfall in eleven chosen ME counties from 2000 to 2023. This study shows that Saudi Arabia (509.64 mm/December–January–February; DJF), Iraq (211.50 mm/September–October–November; SON), Iran (306.35 mm/SON), Jordan (161.28 mm/DJF), Kuwait (44.66 mm), Syria (246.51 mm/DJF), UAE–Qatar–Bahrain (28.62 mm/SON), Oman (64.90 mm/June–July–August; JJA), and Yemen (240.27 mm/SON) were the countries with the highest rainfall. Due to improved ground station integration, CHIRPS also reports larger rainfall anomalies, with a peak of 59.15 mm in DJF, mainly in northern Iran, Iraq, and Syria. PERSIANN understates heavy rainfall, probably because it relies on infrared satellite data, with a maximum anomaly of 4.15 mm. Saudi Arabia saw heavy rain during the JJA months, while others received less. More accurate rainfall forecasts in the ME can lessen the effects of floods and droughts, promoting environmental resilience and regional economic stability. Therefore, a more comprehensive understanding of all the relevant components is necessary to address these difficulties. Both environmental and human impacts must be taken into account for sustainable solutions.

1. Introduction

Water supports entire life on Earth, including humans, plants, and animals, and is crucial for ecosystems, daily activities, and life. Most freshwater on Earth is brought to the surface by rainfall, a key element in the water cycle [1,2]. Even though rain is essential for providing water, it may also result in severe weather that can destroy property and trigger flash floods and droughts that claim lives [3,4]. Hydrological forecasting, climate change research, and water resource management rely heavily on precipitation datasets [5]. There are issues with the geographical and temporal coverage of the data-gathering techniques used today, like ground-based point stations [6]. The rainfall data are then transformed into area-wide rainfall data using methods that have been tested beforehand, like geostatistical interpolation (e.g., kriging), bias correction techniques, machine learning algorithms, data fusion techniques, hydrological models (e.g., Soil and Water Assessment Tool/SWAT or Hydrologic Engineering Center—Hydrologic Modeling System/HEC-HMS), and spatial averaging and downscaling. Each technique tackles particular issues with satellite rainfall data, including bias, geographic uncertainty, and resolution mismatch [7]. Combining gauge and satellite-based precipitation data, the Climate Hazards Group InfraRed Precipitation with Station (CHIRPS) data offer precipitation across 50°S and 50°N from 1981 to the present. A short latency is accessible for daily to annual temporal resolutions, with spatial resolutions from 0.25° to 0.05° [8].
Research has indicated that changes in monsoon patterns, air circulation, and large-scale climate events like the Indian Ocean Dipole (IOD) and El Niño–Southern Oscillation (ENSO) all have an impact on rainfall anomalies [9]. For example, Huang et al. (2015) [10] discovered that during La Niña, positive rainfall anomalies in Southeast Asia typically move westward because of increased convection over the Maritime Continent. According to Nicholson, rainfall anomalies in sub-Saharan Africa frequently change meridionally, with wetter conditions moving northward during years with heavy monsoons [11]. According to researchers, there is an east–west trend to ENSO-driven anomalies in South America, with droughts in the Amazon basin and excessive rainfall on the southeast coast during the El Niño phases [12]. Wetter conditions move poleward due to changes in the Hadley circulation, according to researchers, who noted that rainfall anomalies show latitudinal movements in arid regions like the ME and North Africa [13]. Similarly, the movement of the Intertropical Convergence Zone (ITCZ) has a significant impact on anomalies in monsoon-dominated regions, causing seasonal precipitation patterns to shift from north to south [14]. For several Mediterranean locations, there is a paradoxical rise in the frequency of heavy precipitation days or the size of severe rainfall, even if overall precipitation has been found to decrease [15]. Extreme precipitation events can emerge from tropical–extratropical interactions, such as Active Red Sea Troughs, especially in the ME [16], and mid-latitude cut-off lows and highs connected to variations in the polar jet circulation [17,18,19].
Three satellite rainfall products, CHIRPS, Rainfall Estimates (RFEs) v2.0, and TAMSAT African Rainfall Climatology And Time-series (TARCAT) v2.0, were compared with independent gauge data collected between 2001 and 2012. Decadal rainfall amounts are generally underestimated by satellite products and overestimated by others. Rainfall Estimate (RFE) and CHIRPS perform similarly, outperforming three decadal (10-day) gridded satellite rainfall products (TARCAT, TAMSAT African Rainfall Climatology, and Time-series) on most statistical metrics of skill [20]. Heavy summer monsoon rains probably fell on the southern half of the area that is now the United Arab Emirates (UAE) during what is known as the “climatic optimum”, when the climate was considerably more temperate and suited for agriculture. In comparison, the northern half would have experienced dry summers and wet winters typical of the Mediterranean climate. These particular climates were crucial in forming the landscape and fostering the development of early human communities [21,22]. By calculating and assessing daily changes in rainfall in the basin region and utilizing Tropical Rainfall Measuring Mission (TRMM) satellite data to analyze rainfall patterns, researchers have carried out several studies about the usage of the GEE platform in rain satellite data processing, and the result indicates that the downscaled result is primarily inherited from the residuals, which are not based on the three projected results, and residual precipitation (RC) values more than (0.5) 50% indicate locations where the regression model is inefficient [23]. Many studies have examined rainfall anomalies in the Middle East using remote sensing over the past few decades. Important new information about precipitation patterns, drought events, and the impact of large-scale climatic drivers such as atmospheric rivers and the Indian Ocean Dipole has been made possible by these studies. For example, researchers found a substantial relationship between the surface temperatures of the Indian Ocean and the Middle East’s sub-seasonal precipitation variability [24]. Another study identified that atmospheric rivers also play a part in the region’s extreme precipitation occurrences [25]. However, water scarcity and rising climate unpredictability make rainfall and anomaly analysis essential for Middle Eastern nations. Even with existing research, ongoing observation is necessary to identify new trends and facilitate efficient resource management.
Several PERSIANN product variations are available, like PERSIANN-CDR (Climate Data Record) for long-term climate analysis, PERSIANN-SMART (Self-Monitoring and Recalibrating Technique) for enhanced accuracy through real-time adjustments, and PERSIANN-CCS (Cloud Classification System) with higher temporal resolution [26]. Real-time data availability and broad spatial and temporal coverage are the system’s main advantages, which make it particularly useful in remote or data-poor areas. But it also has drawbacks, like lower accuracy in areas with cold clouds, shallow precipitation, or complicated topography, and its effectiveness is dependent on the caliber of inputs collected from satellites [27]. Accessible to the general public via websites such as the Center for Hydrometeorology and Remote Sensing (CHRS) Data Portal, PERSIANN data are often offered in NetCDF and HDF formats that are compatible with GISs and hydrological modeling software [28]. The AutoRegressive Integrated Moving Average (ARIMA) model is a popular statistical method for time series forecasting. It is designed to analyze and predict future values by capturing underlying patterns in historical data [29]. Time series data are represented using a state-space framework in the Exponential Smoothing State Space (ETS) model, a statistical forecasting technique. The series is broken down into error (E), trend (T), and seasonality (S) components, enabling different combinations of multiplicative and additive effects [30].
There are several important reasons why research on seasonal variations in rainfall and anomalies in Middle Eastern countries is important. Because of the region’s arid and semi-arid environment, there are not many water resources; therefore, managing them effectively requires an awareness of rainfall patterns. Predicting rainfall accurately aids flood prevention, drought control, and water storage. Planning crop production and irrigation techniques and guaranteeing food security depend on an awareness of seasonal change, as rainfall is a major factor in agriculture in many parts of the ME. The significance of this research for preparing for increasingly frequent droughts and temperature extremes is increased by the way that climate change is changing rainfall patterns. This study’s primary contribution is finding the seasonal rainfall variations from CHIRPS and PERSIANN rainfall, as well as anomaly datasets of the eleven Middle Eastern countries of Saudi Arabia, Iraq, Iran, UAE, Qatar, Bahrain, Kuwait, Oman, Jordan, Syria, and Yemen between 2000 and 2023 using the dates December–January–February (DJF), March–April–May (MAM), June–July–August (JJA), and September–October–November (SON). This study also calculates the forecast using ARIMA and ETS models in R programming with an error matrix for rainfall data. The study also observed that governmental policies or initiatives for climate change affect the reduction in their respective countries. The research’s primary innovation is its identification of the seasonal variations in rainfall across national boundaries. Seasonal variations in rainfall and data were utilized for agricultural sector management, drought control, and the development of innovative adaptation measures.

2. Materials and Methods
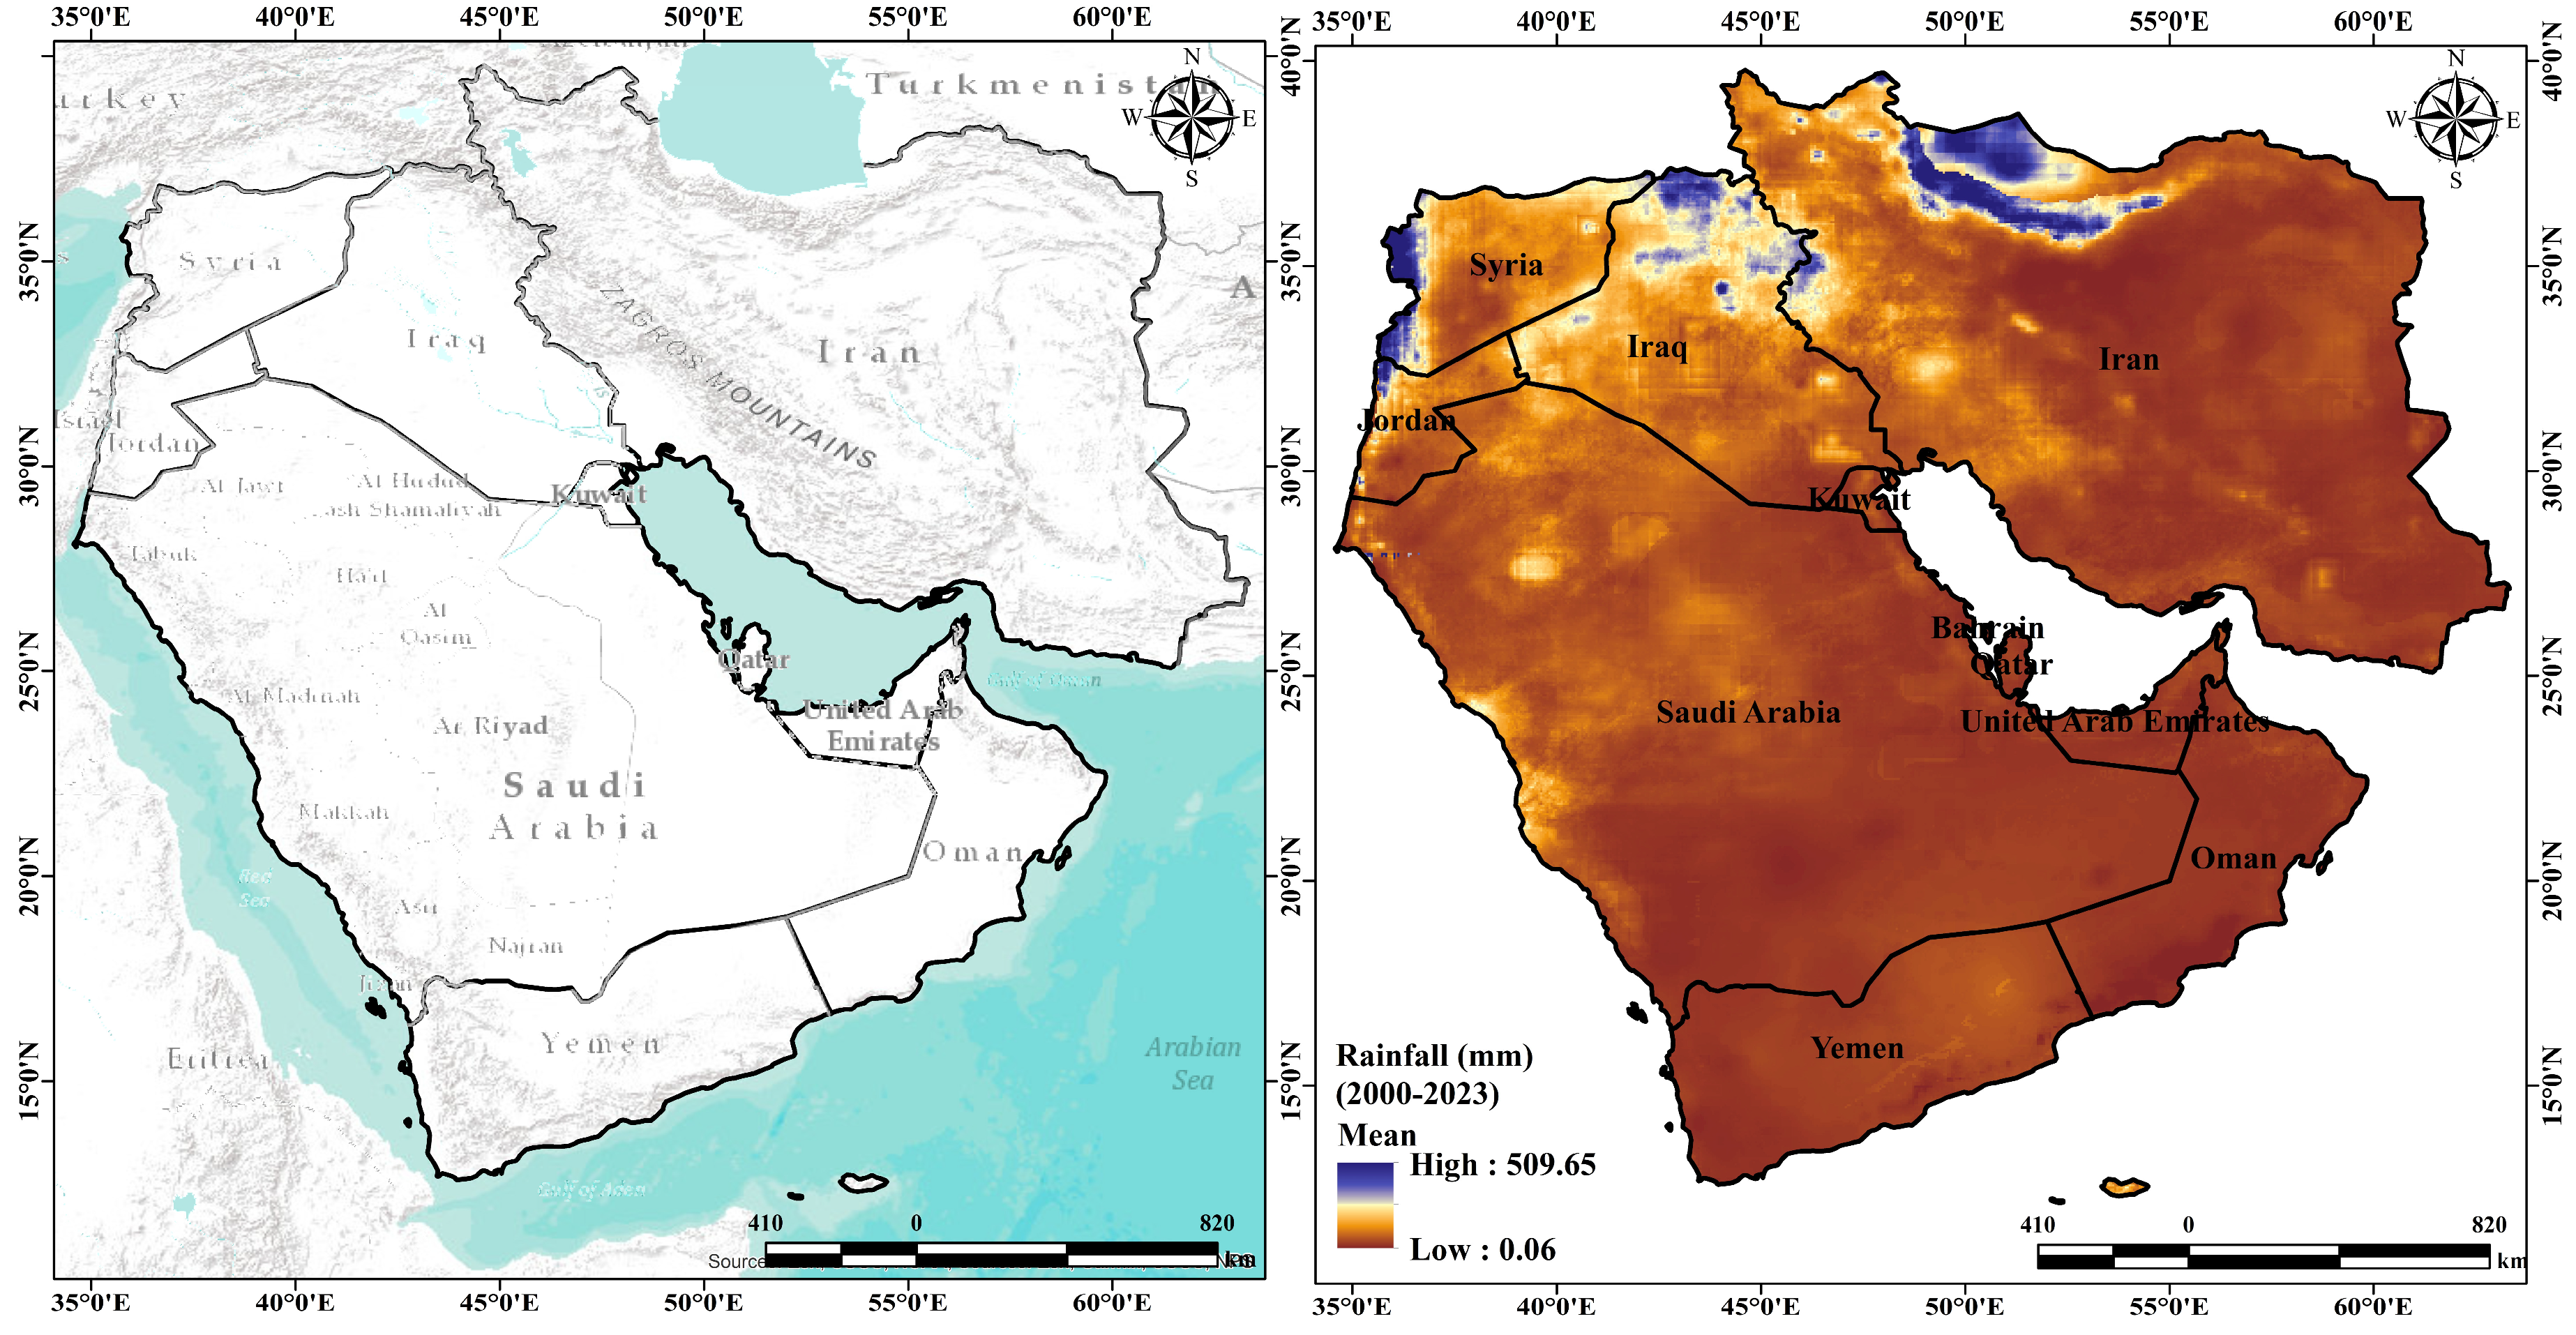
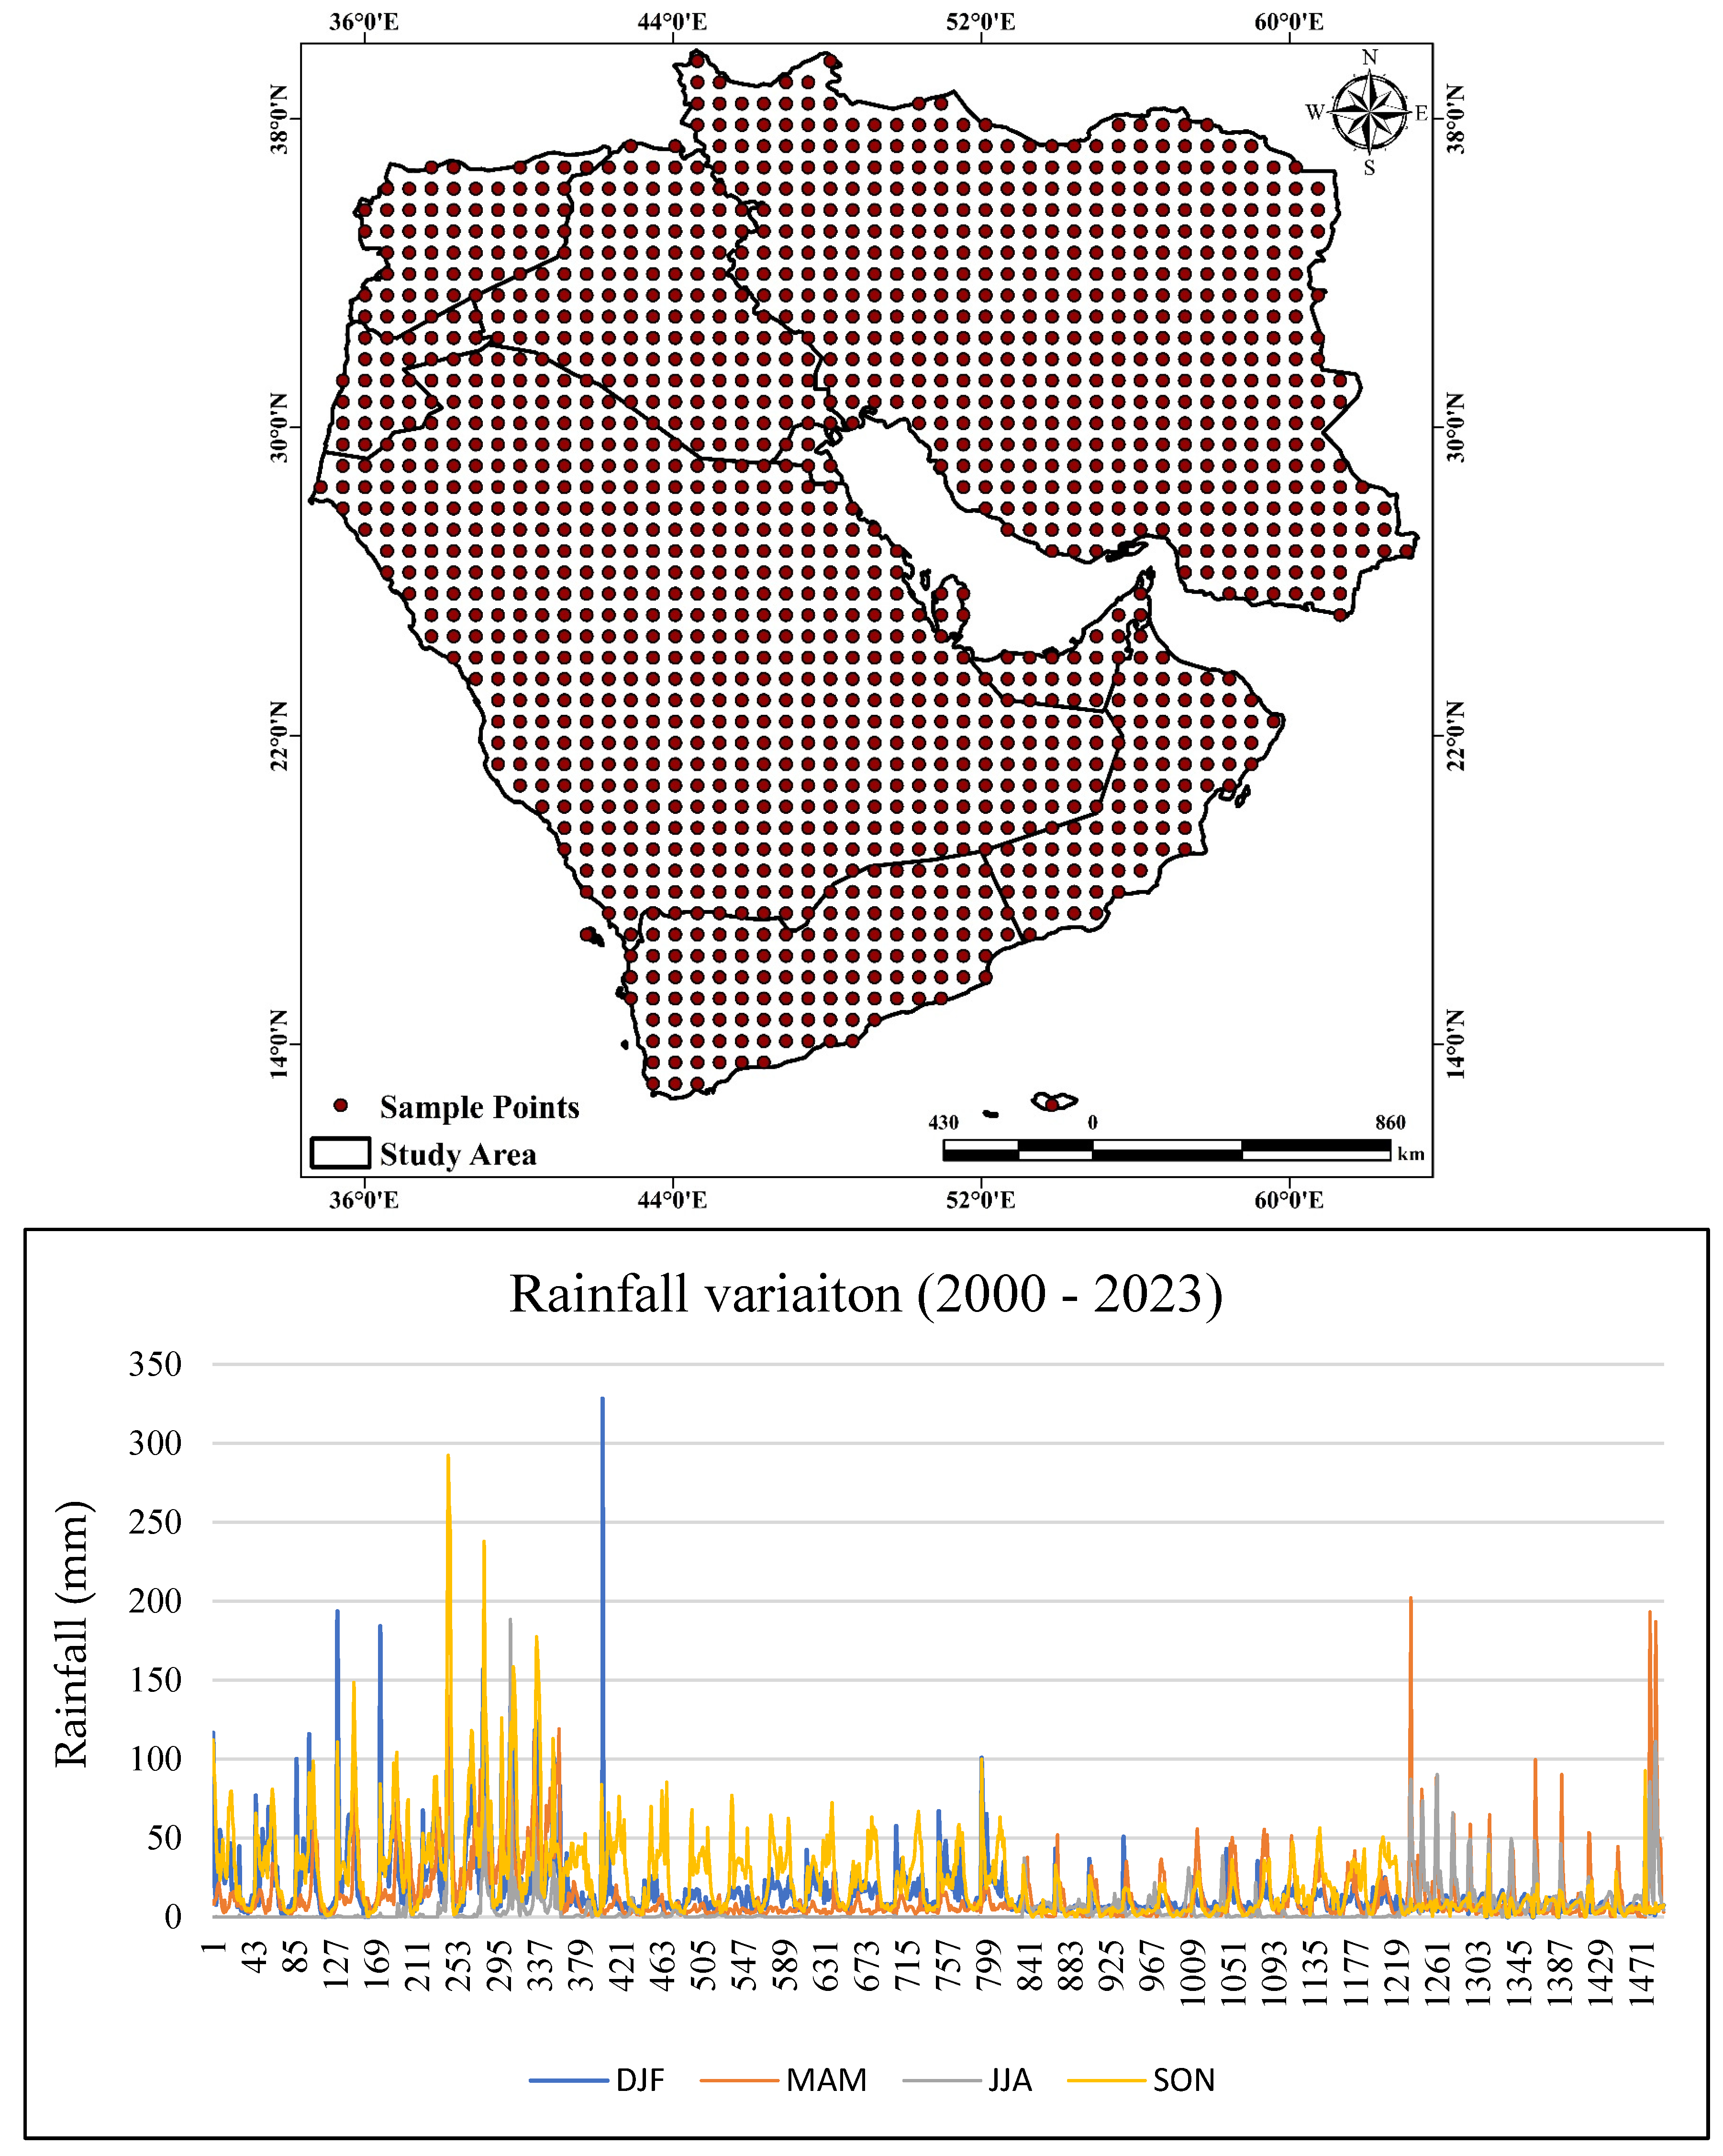
2.1. Study Area

The climate in the ME varies throughout the many countries, and it is often hot and dry for most of the year. The desert area of Saudi Arabia is distinguished by extremely little rainfall and erratic, sporadic, and powerful local storms. Mountainous regions rising beyond 2000 m above mean sea level can be found in the southwest. The latitudinal area of 29°11′0″ N to 33°22′0″ N and the longitudinal range of 34°19′0″ E to 39°18′0″ E encompass Jordan. The country’s terrain, which makes up more than 80% of its total area and has an annual rainfall of less than 100 mm, is primarily desert, with its expanse exceeding 89,000 km2 [31]. In contrast to arid regions that receive little to no rainfall for most of the year, the northern coast of Iraq has an average of over 140 mm to 145 mm of rainfall annually. Saudi Arabia has varying average rainfall, with 0 mm in June through December and the highest average of 22 mm in April. Meteorologists utilize the amount of precipitable water to gauge the atmosphere’s water vapor concentration.
With its diverse topography, the Middle East’s climate is significantly influenced by the Indian monsoon in the south and synoptic-scale Mediterranean systems in the north (Figure 1). A model grid spacing between 200 m and 10 km is defined as “Gray zone resolution” [32]. Since this resolution makes it possible to numerically resolve complex processes prone to high uncertainty, such as cloud development, convective transport, and turbulence, the adjective “Gray” alludes to the poor understanding. By the end of the 21st century, average global temperatures are expected to climb by more than 1.5 degrees, according to the Intergovernmental Panel on Climate Change (IPCC) [33]. The dry climatic characteristics of the Middle East and North Africa (MENA) have been highlighted as a hotspot for future temperature fluctuations [34]. Although there are no predicted warming rates throughout the winter, the area is anticipated to see extremely high summertime temperatures [35].

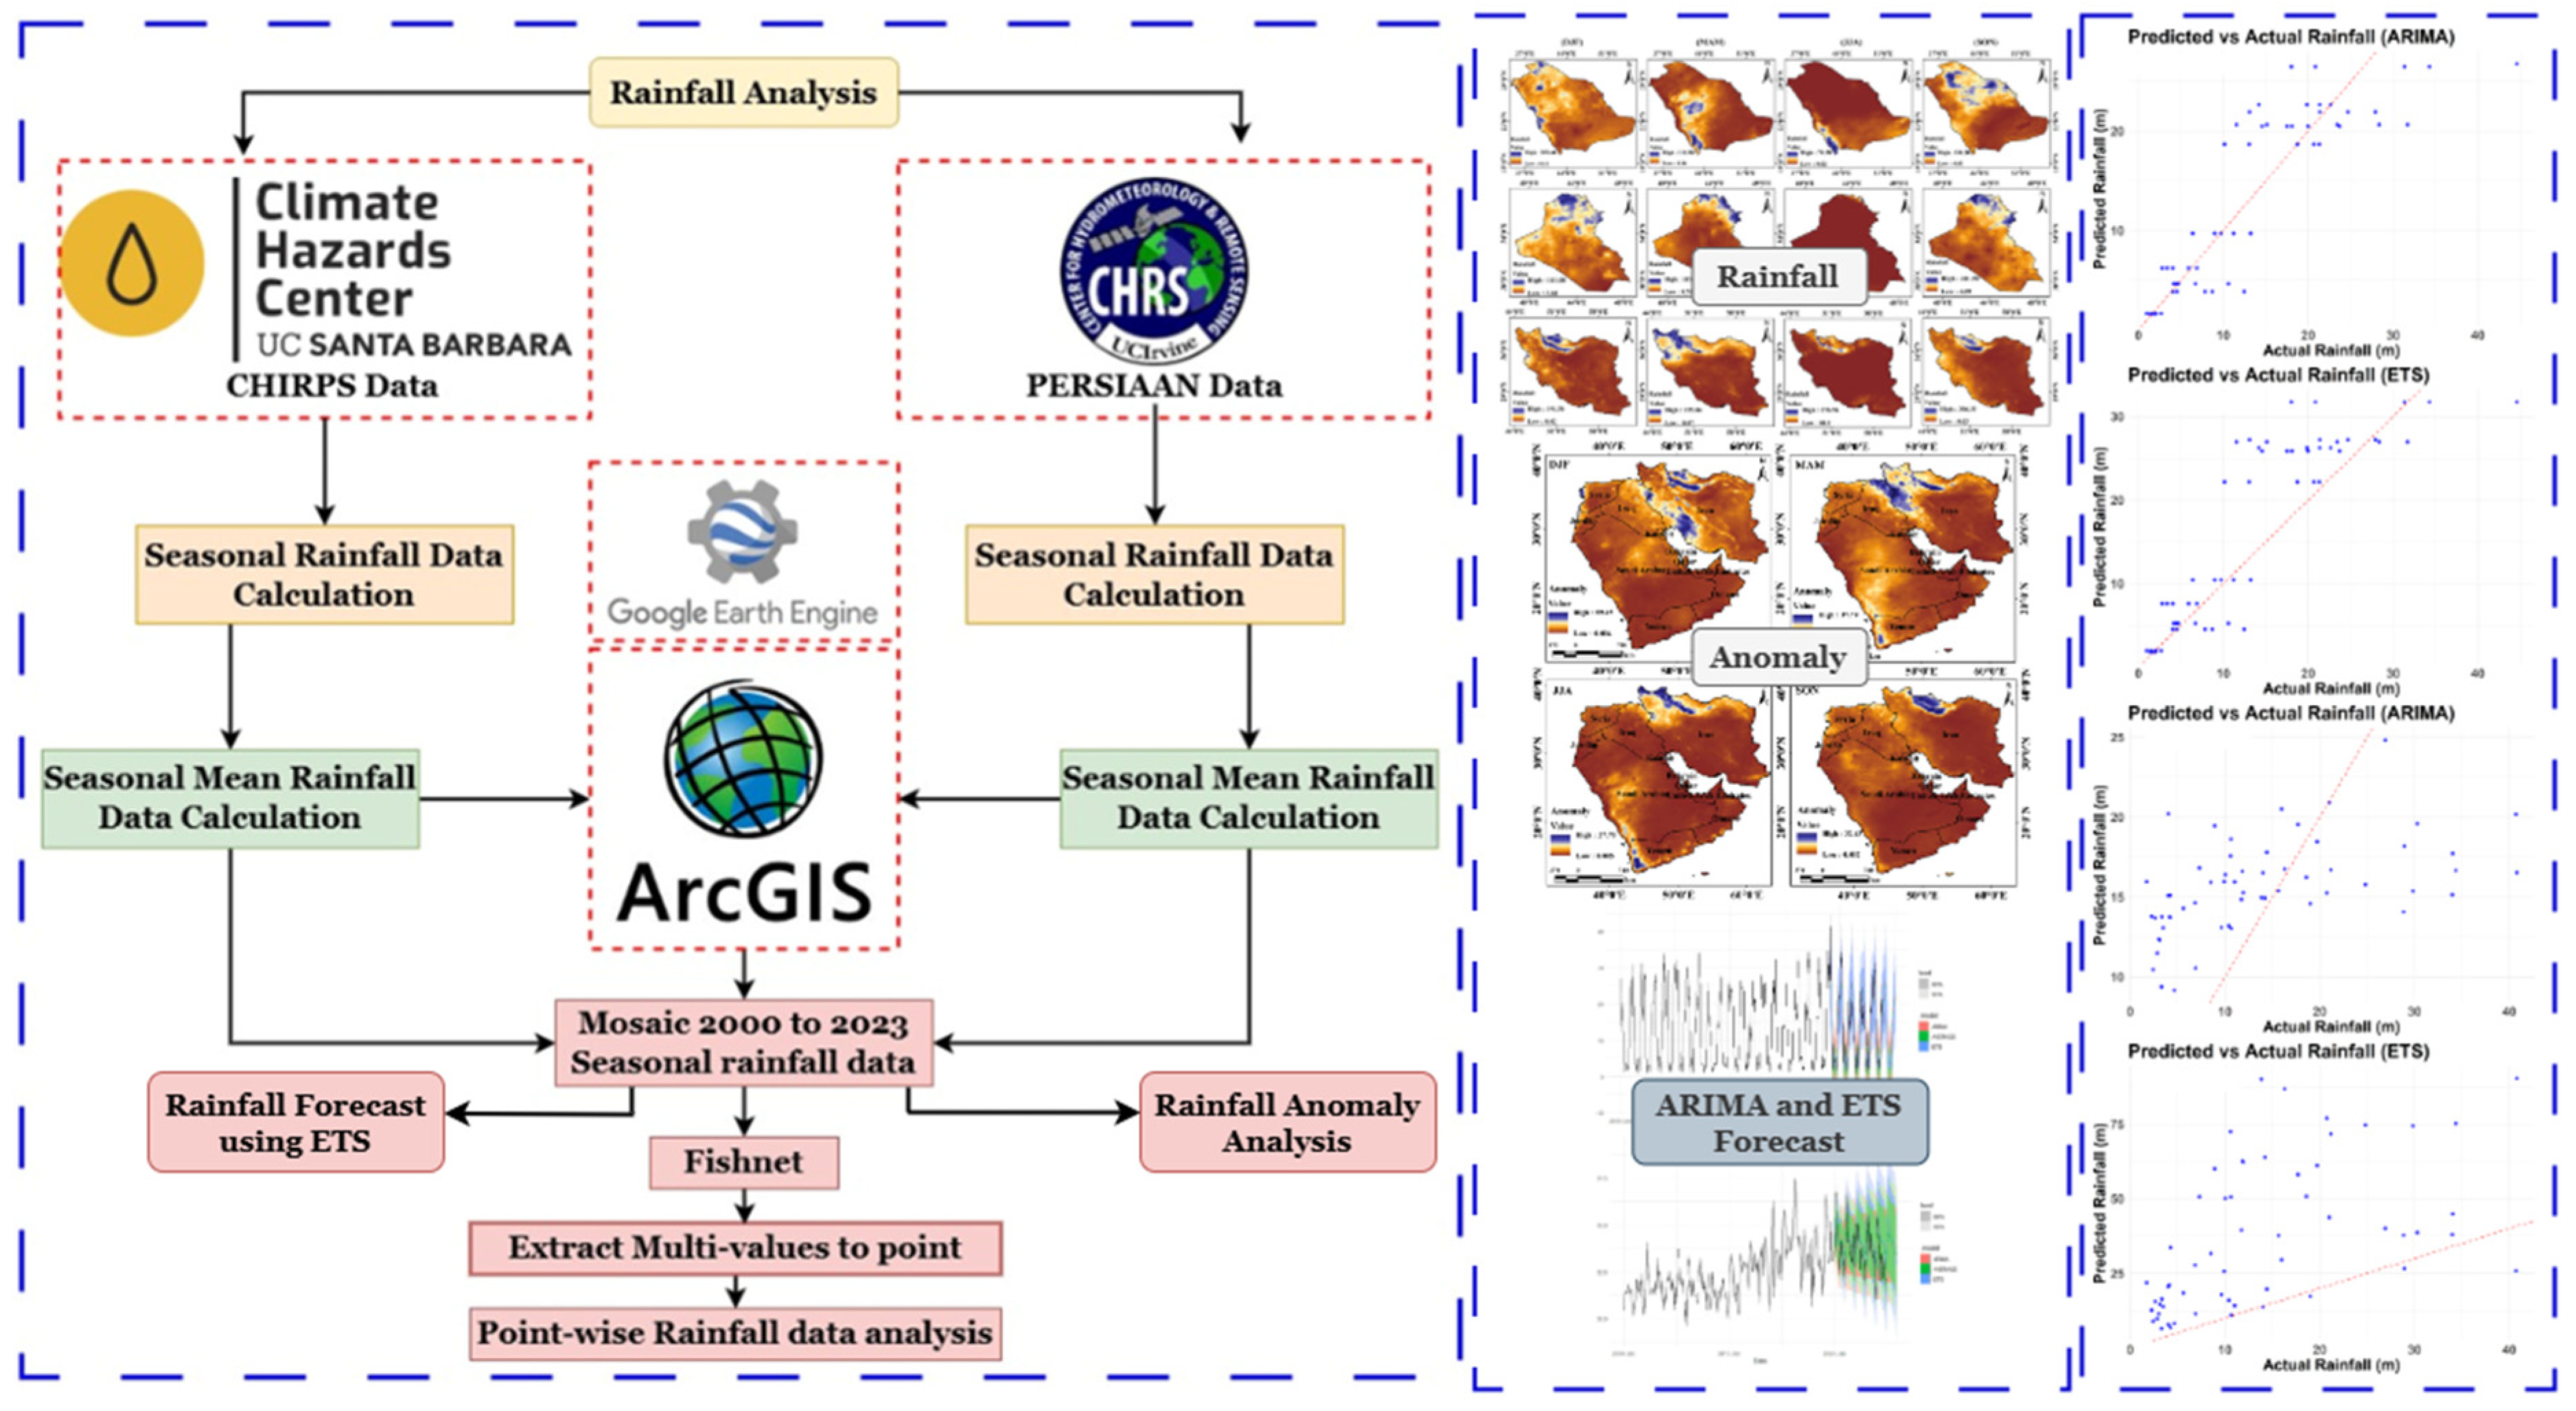
2.2. Data Collection and Quality

An almost thirty-year quasi-global rainfall dataset is available from the Climate Hazards Center InfraRed Precipitation with Station data. To construct gridded rainfall time series for trend analysis and seasonal drought monitoring, CHIRPS combines in situ station data with satellite images with a resolution of 0.05° [8], retrieving, via the GEE platform, CHIRPS monthly rainfall estimation data at a research area location. To analyze the seasonal variation in the rainfall in those chosen countries, the DJF, MAM, JJA, and SON changes in the CHRIPS and PERSIANN datasets were computed using ArcGIS software version 10.8 between 2000 and 2023. The script that may be used to retrieve data on rainfall estimates is available (Google Earth Engine Code Editor, https://code.earthengine.google.com/, accessed on 15 September 2024). With API documentation, the script initially used in this study to extract daily rainfall estimates was modified to enable its usage in extracting monthly rainfall predictions. To construct a model, the monthly rainfall, geolocation, and topography of the research region were taken into consideration while processing the rain value retrieved from the console menu in GEE. This was performed using the CHIRPS and PERSIANN monthly rainfall extraction method from 2000 to 2023 (Figure 2).
PERSIANN is a satellite-based rainfall estimation system that uses machine learning techniques in conjunction with infrared (IR) and microwave (MW) satellite observations to provide global precipitation data. To enable hydrological modeling, flood prediction, water resource management, and climate studies, its main objective is to track and estimate regional and worldwide precipitation trends. In addition to IR data from satellites like GOES and METEOSAT, the data are obtained from geostationary and low-Earth-orbit satellites, which include sensors like AMSR and SSM/I. The method uses Artificial Neural Networks (ANNs) calibrated with radar measurements and ground-based rain gauge networks to create a link between cloud-top brightness temperatures and surface rainfall rates. In GEE, precipitation anomaly analysis compares seasonal precipitation with long-term means to find deviations; CHIRPS, which incorporates ground station data, tends to capture localized extreme precipitation events more effectively, whereas PERSIANN, which relies on infrared satellite estimates, tends to underestimate anomalies, particularly in mountainous regions; the disparity is most noticeable in northern Iran, Iraq, and Syria, where CHIRPS records significantly higher anomalies; seasonal variations correspond with climatic patterns, with DJF and MAM showing higher anomalies due to mid-latitude westerlies; PERSIANN’s lower anomalies indicate an underrepresentation of extreme rainfall, affecting climate risk assessments.

2.3. Rainfall Variation Analysis

One of the newest and most precise spatially dispersed precipitation products is CHIRPS. It is frequently used as a substitute source of precipitation data, particularly in regions with few or no observations [36]. The high spatial resolution (0.05°) and longer time series from 1981 to the present are offered by the CHIRPS gridded precipitation product. CHIRPS offers daily, monthly, and yearly temporal resolutions. Three datasets, in situ measurements, satellite-based estimates, and global precipitation climatology, are used to create CHIRPS [37]. The rainfall analysis data for the eleven Middle Eastern countries chosen for the seasonal variation study from 2000 to 2023 came from the GEE platform and mosaic in ArcGIS software v10.8. The deviations included DJF, MAM, JJA, and SON in Saudi Arabia, Iraq, Iran, UAE, Qatar, Bahrain, Kuwait, Oman, Jordan, Syria, and Yemen.
Notwithstanding its benefits, PERSIANN has several drawbacks. Accurately recording precipitation over areas with chilly clouds, shallow rainfall events, or complicated terrains may be difficult. The system’s dependability depends on how well satellite data inputs are covered and of what quality. Nonetheless, its accuracy and performance are always being enhanced by developments in machine learning algorithms and remote sensing technology. The datasets are commonly accessible in NetCDF and HDF formats, which are compatible with platforms for hydrological modeling and geographic information systems (GISs). Through websites like the Center for Hydrometeorology and Remote Sensing (CHRS) Data Portal, PERSIANN data are publicly available for use in operational and research applications across the globe. Its applicability as a tool for tackling urgent environmental and societal issues about precipitation variability and water resource management is highlighted by its incorporation into international hydrological and climatic monitoring systems.
Using satellite-based rainfall data, such as CHIRPS or PERSIANN, which give historical rainfall data, this work uses GEE and ArcGIS to analyze rainfall variance in the ME from 2000 to 2023. Following GEE registration and dataset access, this study imported the data into the workspace and applied date and region filters. We imported rainfall data for analysis into ArcGIS by downloading it in formats like GeoTIFF or CSV from the source data. In ArcGIS software, the datasets obtained from GEE were generated based on seasonal variation, and the raster files were Mosaicked into a single raster file to analyze the overall variation in rainfall. ArcGIS’s (version 10.8) extract by mask tool was used to reclaim the random point data once it was calculated using the Fishnet tool. Accurate data processing and visualization throughout the process are crucial, as is taking into account the constraints of the temporal and spatial resolution of the satellite-based datasets.
For the transformation and analysis of geographic rainfall data in this study, ArcGIS’s Fishnet and Multi-Values to Points tools were essential. A consistent cell grid was created throughout the study area using the Fishnet program, providing the spatial framework for further investigation. This grid’s creation aimed to simplify the analysis of rainfall variation across various regions by breaking the territory into smaller, more uniform sections. Because each grid cell represents a distinct physical area, the analysis was applied consistently throughout the research zone. Following grid establishment, rainfall data were extracted from raster layers (e.g., CHIRPS or PERSIANN datasets) using the Multi-Values to Points tool, thus assigning a rainfall value to each grid cell. The rainfall values of each raster cell are assigned to the center of each grid cell produced by the Fishnet using this program, which transforms raster data into point data to allow for more accurate spatial analysis. By computing the mean or standard deviation of rainfall within each grid cell and showing the geographical distribution of rainfall throughout the region, the resulting point dataset enables the statistical study of rainfall variance.

2.4. Rainfall Anomaly Variation Analysis

The precipitation anomaly formula calculates how much precipitation deviates from the long-term mean within a certain period, which aids in evaluating climate trends and variability. The calculation is as follows:
  A = P season   P mean   P mean   × 100
where A   denotes the precipitation anomaly (%), P season represents precipitation in a specific season or time, and P mean denotes the long-term mean precipitation for that period. Above-average precipitation is indicated by a positive anomaly (A > 0), and below-average rainfall is indicated by a negative anomaly (A < 0). This formula is frequently used in climate studies to monitor seasonal fluctuations, drought trends, and flood trends.

2.5. Rainfall Forecast Using ARIMA and ETS

First, the time series data were gathered and pre-processed to guarantee consistency and completeness. After that, R transformed the data into a time series object (ts) to make additional analysis easier. Through visualization, exploratory data analysis was carried out to find trends, seasonality, and stationarity features. Utilizing the prediction package’s ets() function, the Exponential Smoothing State Space (ETS) model was used, automatically choosing the best-fit components according to the Akaike Information Criterion (AIC). After that, future forecasts were created using the forecast() function, and the results were shown for interpretation using autoplot(). Lastly, the model was validated by comparing the predicted values with the actual observations, and if needed, tweaks were made to maximize prediction accuracy.

2.6. Error Matrix Analysis

The error matrix provides a quantitative assessment of the performance of different forecasting models (ARIMA, ETS, and the ensemble average) for CHIRPS and PERSIANN datasets. The key evaluation metrics used are the Mean Error (ME), Root-Mean-Squared Error (RMSE), Mean Absolute Error (MAE), Mean Percentage Error (MPE), Mean Absolute Percentage Error (MAPE), and the first-order autocorrelation of residuals (ACF1).
  M E = 1 n i = 1   P i A i
R M S E = 1 n i = 1 n     P i A i 2
M A E = 1 n i = 1 n   P i A i
M P E = 100 n i = 1 n   P i A i A i
M A P E = 100 n i = 1 n   P i A i A i
A C F 1 = i = 2 n     e i e e i 1 e i = 1 n     e i e 2
where P i denotes the predicted value, A i represents the actual value, n denotes the total number of observations, e i   d e n o t e s   A i P i (residual errors), and e represents the mean of residuals. The RMSE assigns greater weight to larger errors by measuring the average magnitude of the error. The mean absolute difference (MAE) between actual and anticipated values is calculated. Overestimation is indicated by positive numbers, while underestimation is shown by negative values. The MPE provides the average percentage error. The forecast error is represented by the MAPE as a percentage of actual values.

3. Results and Discussion

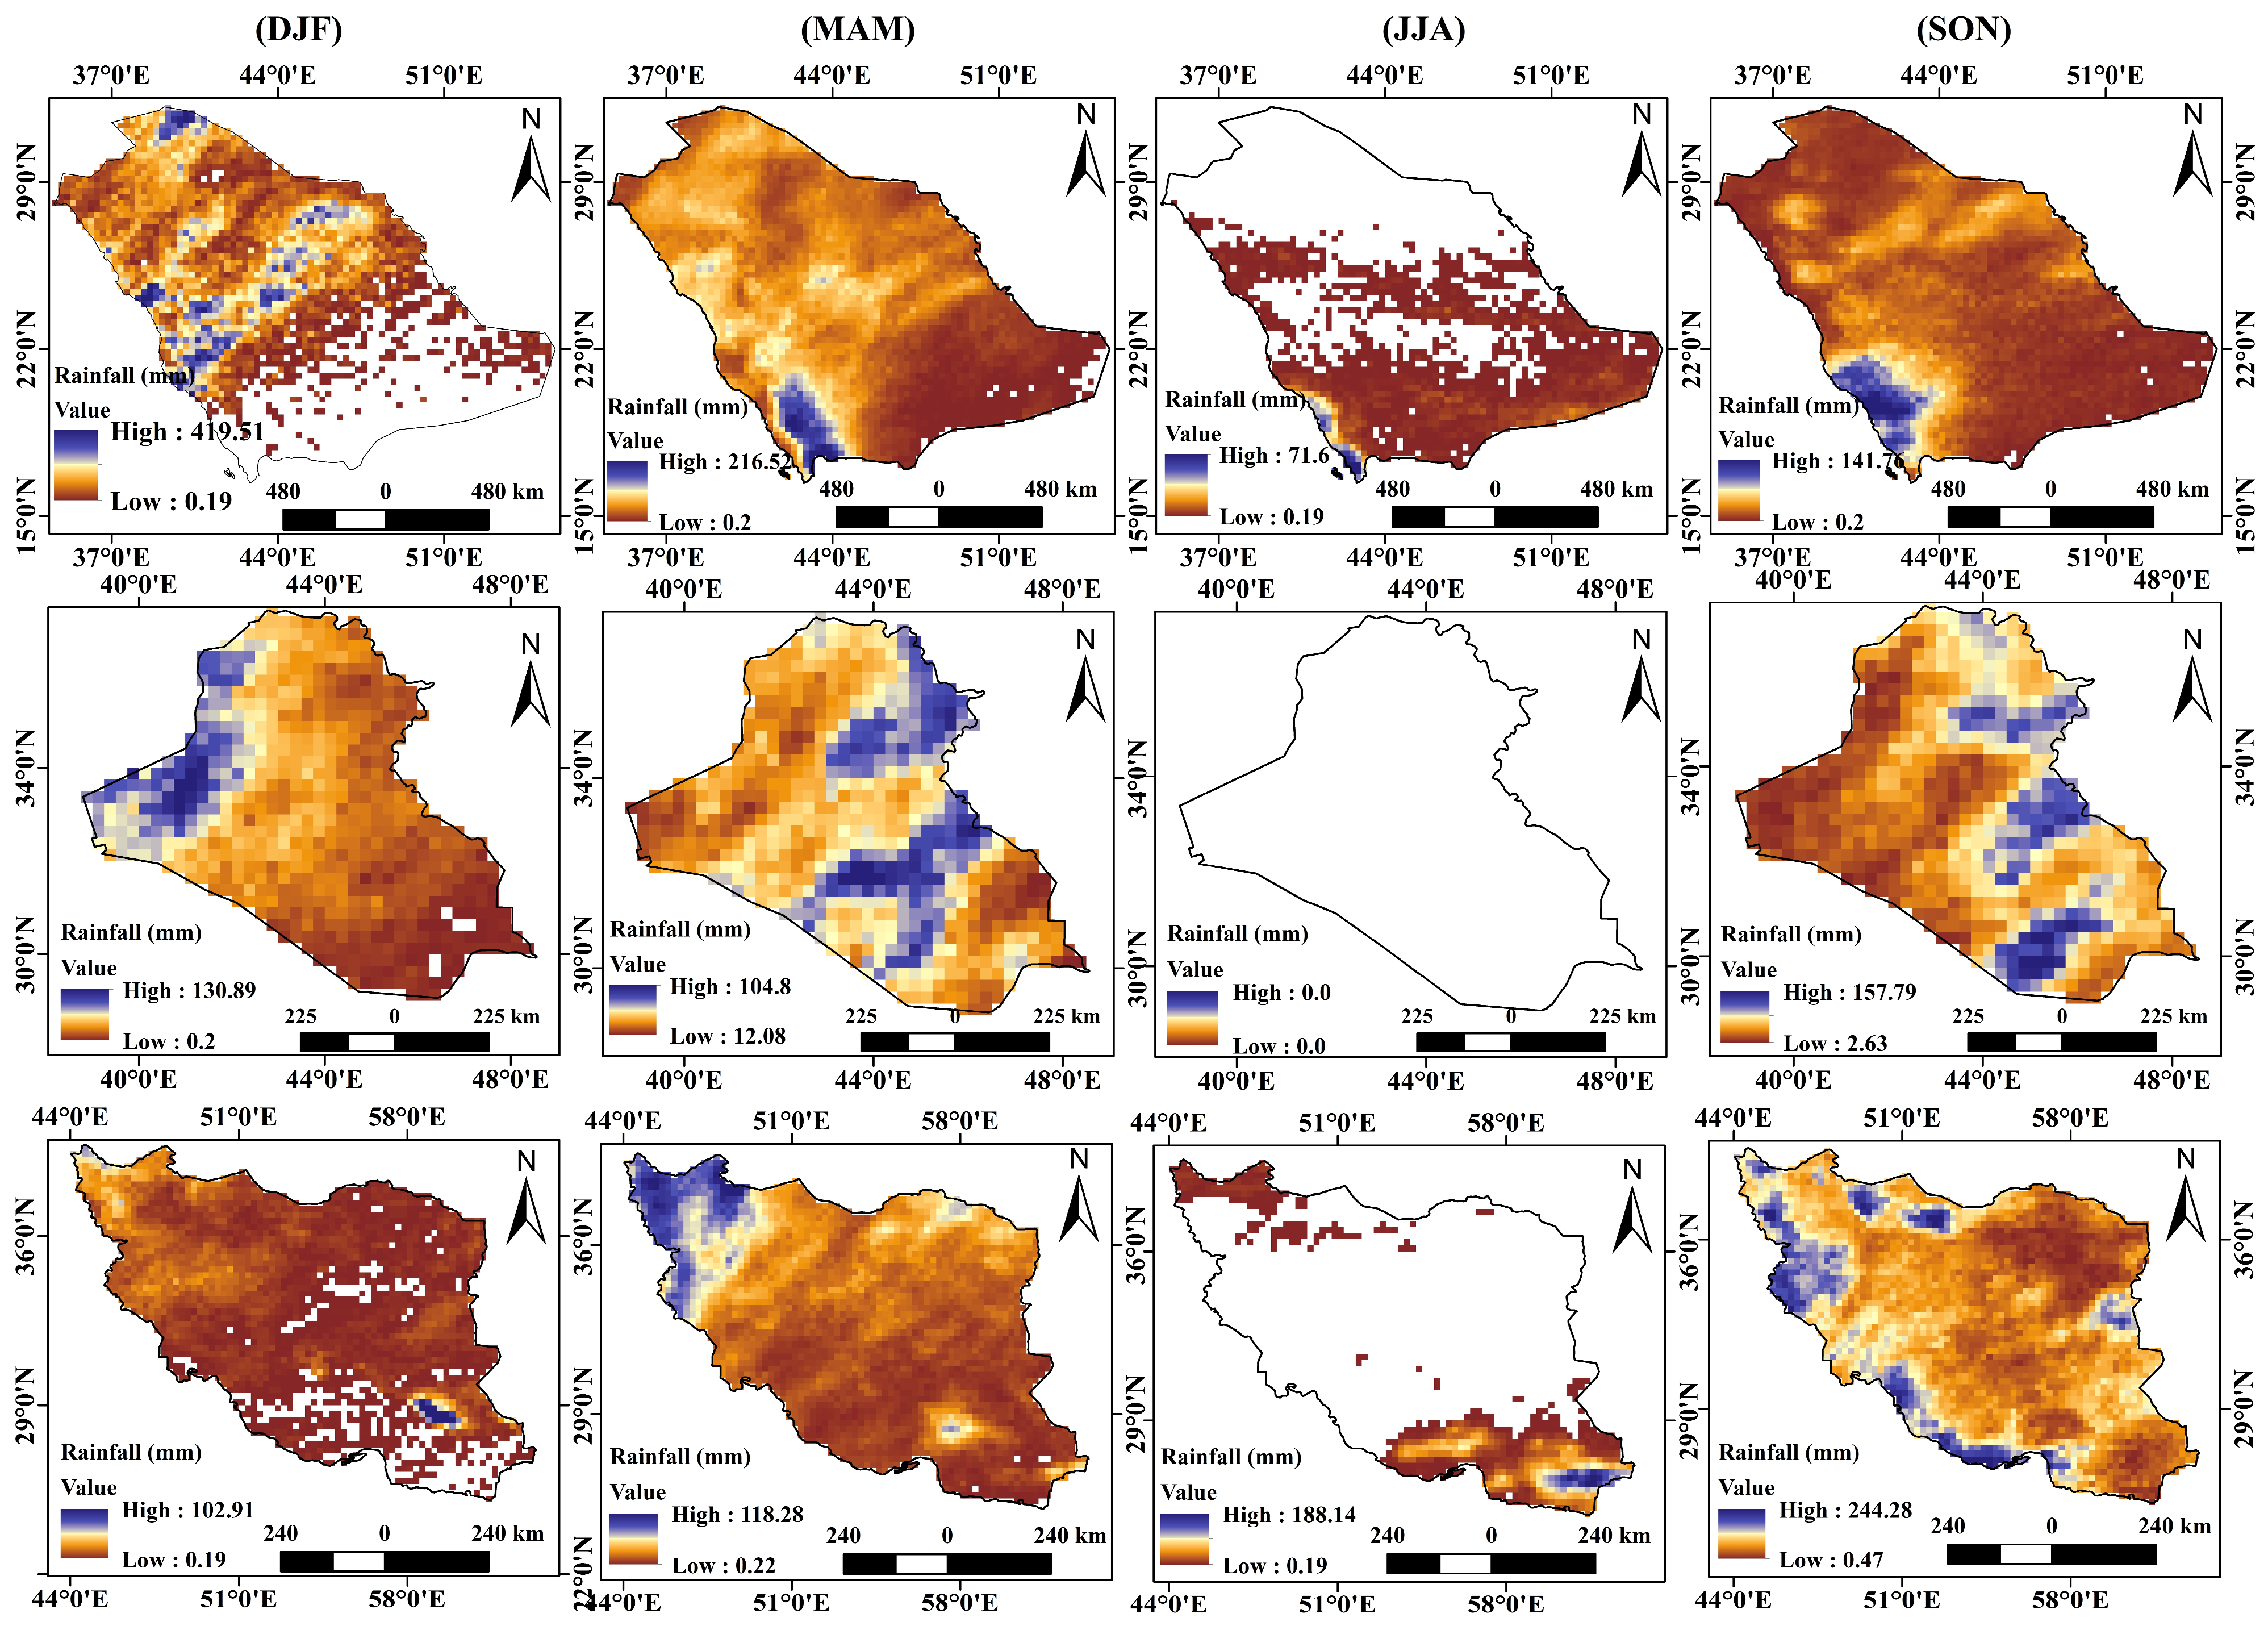
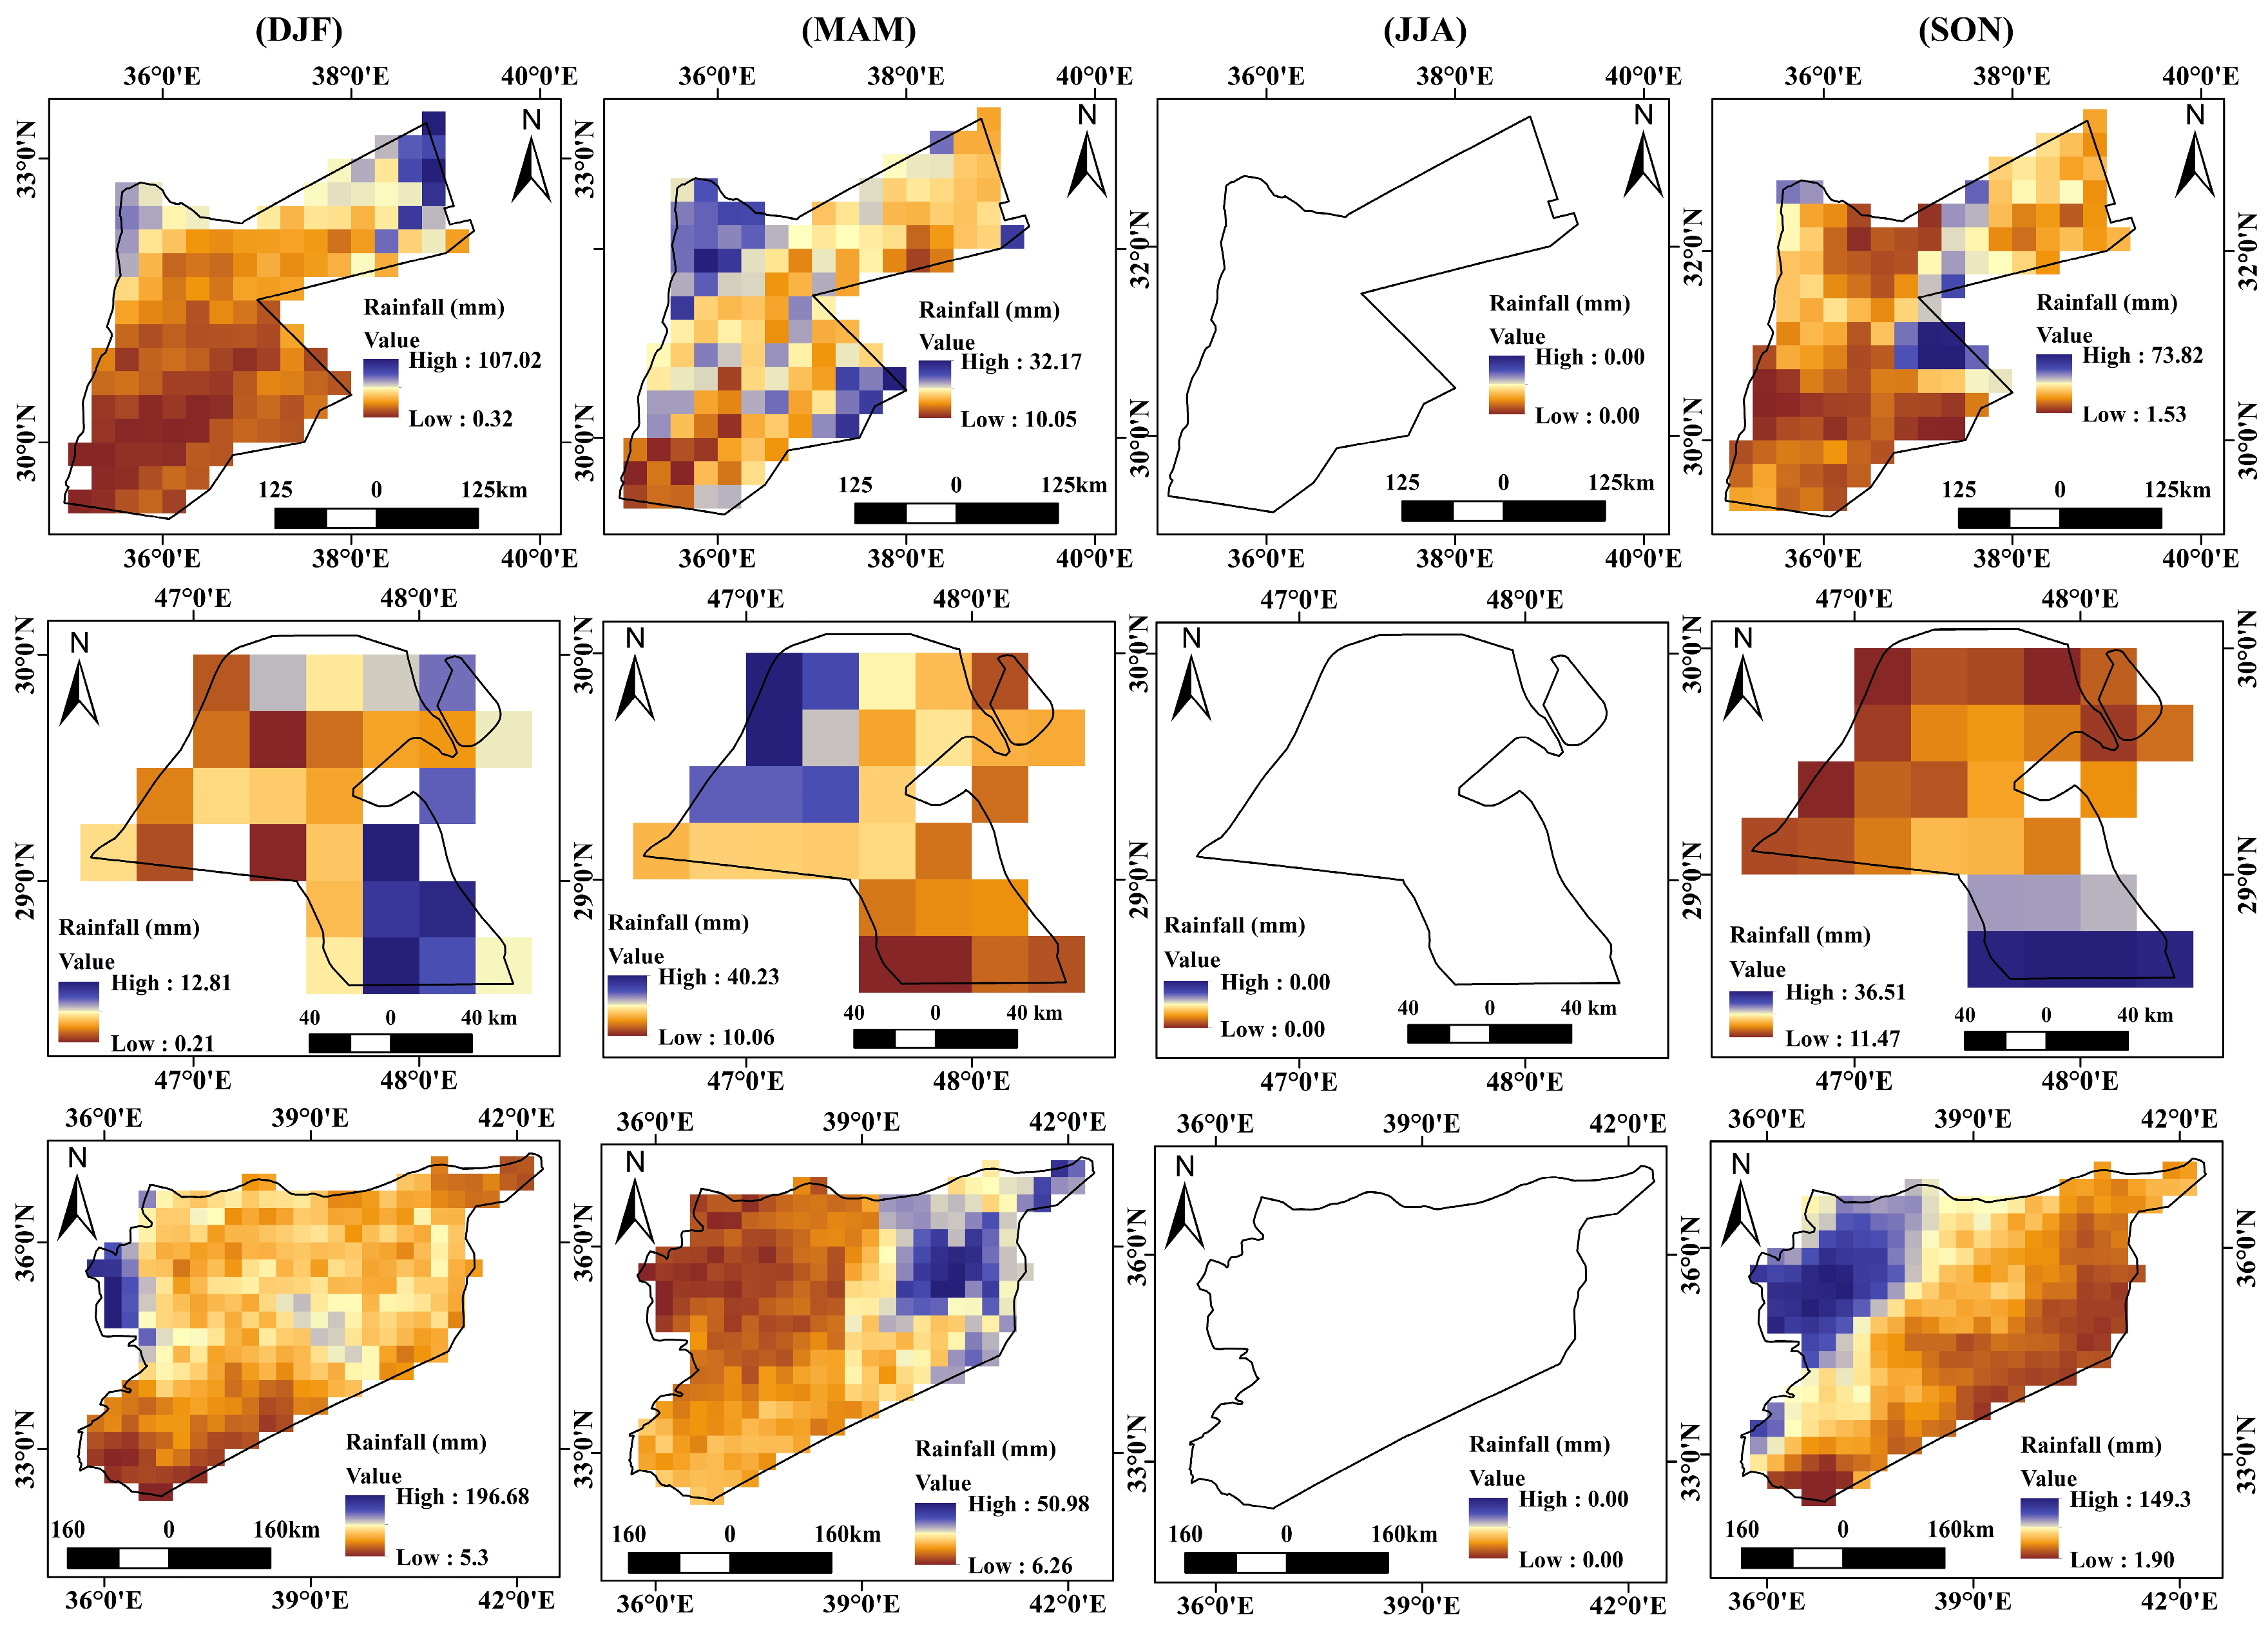
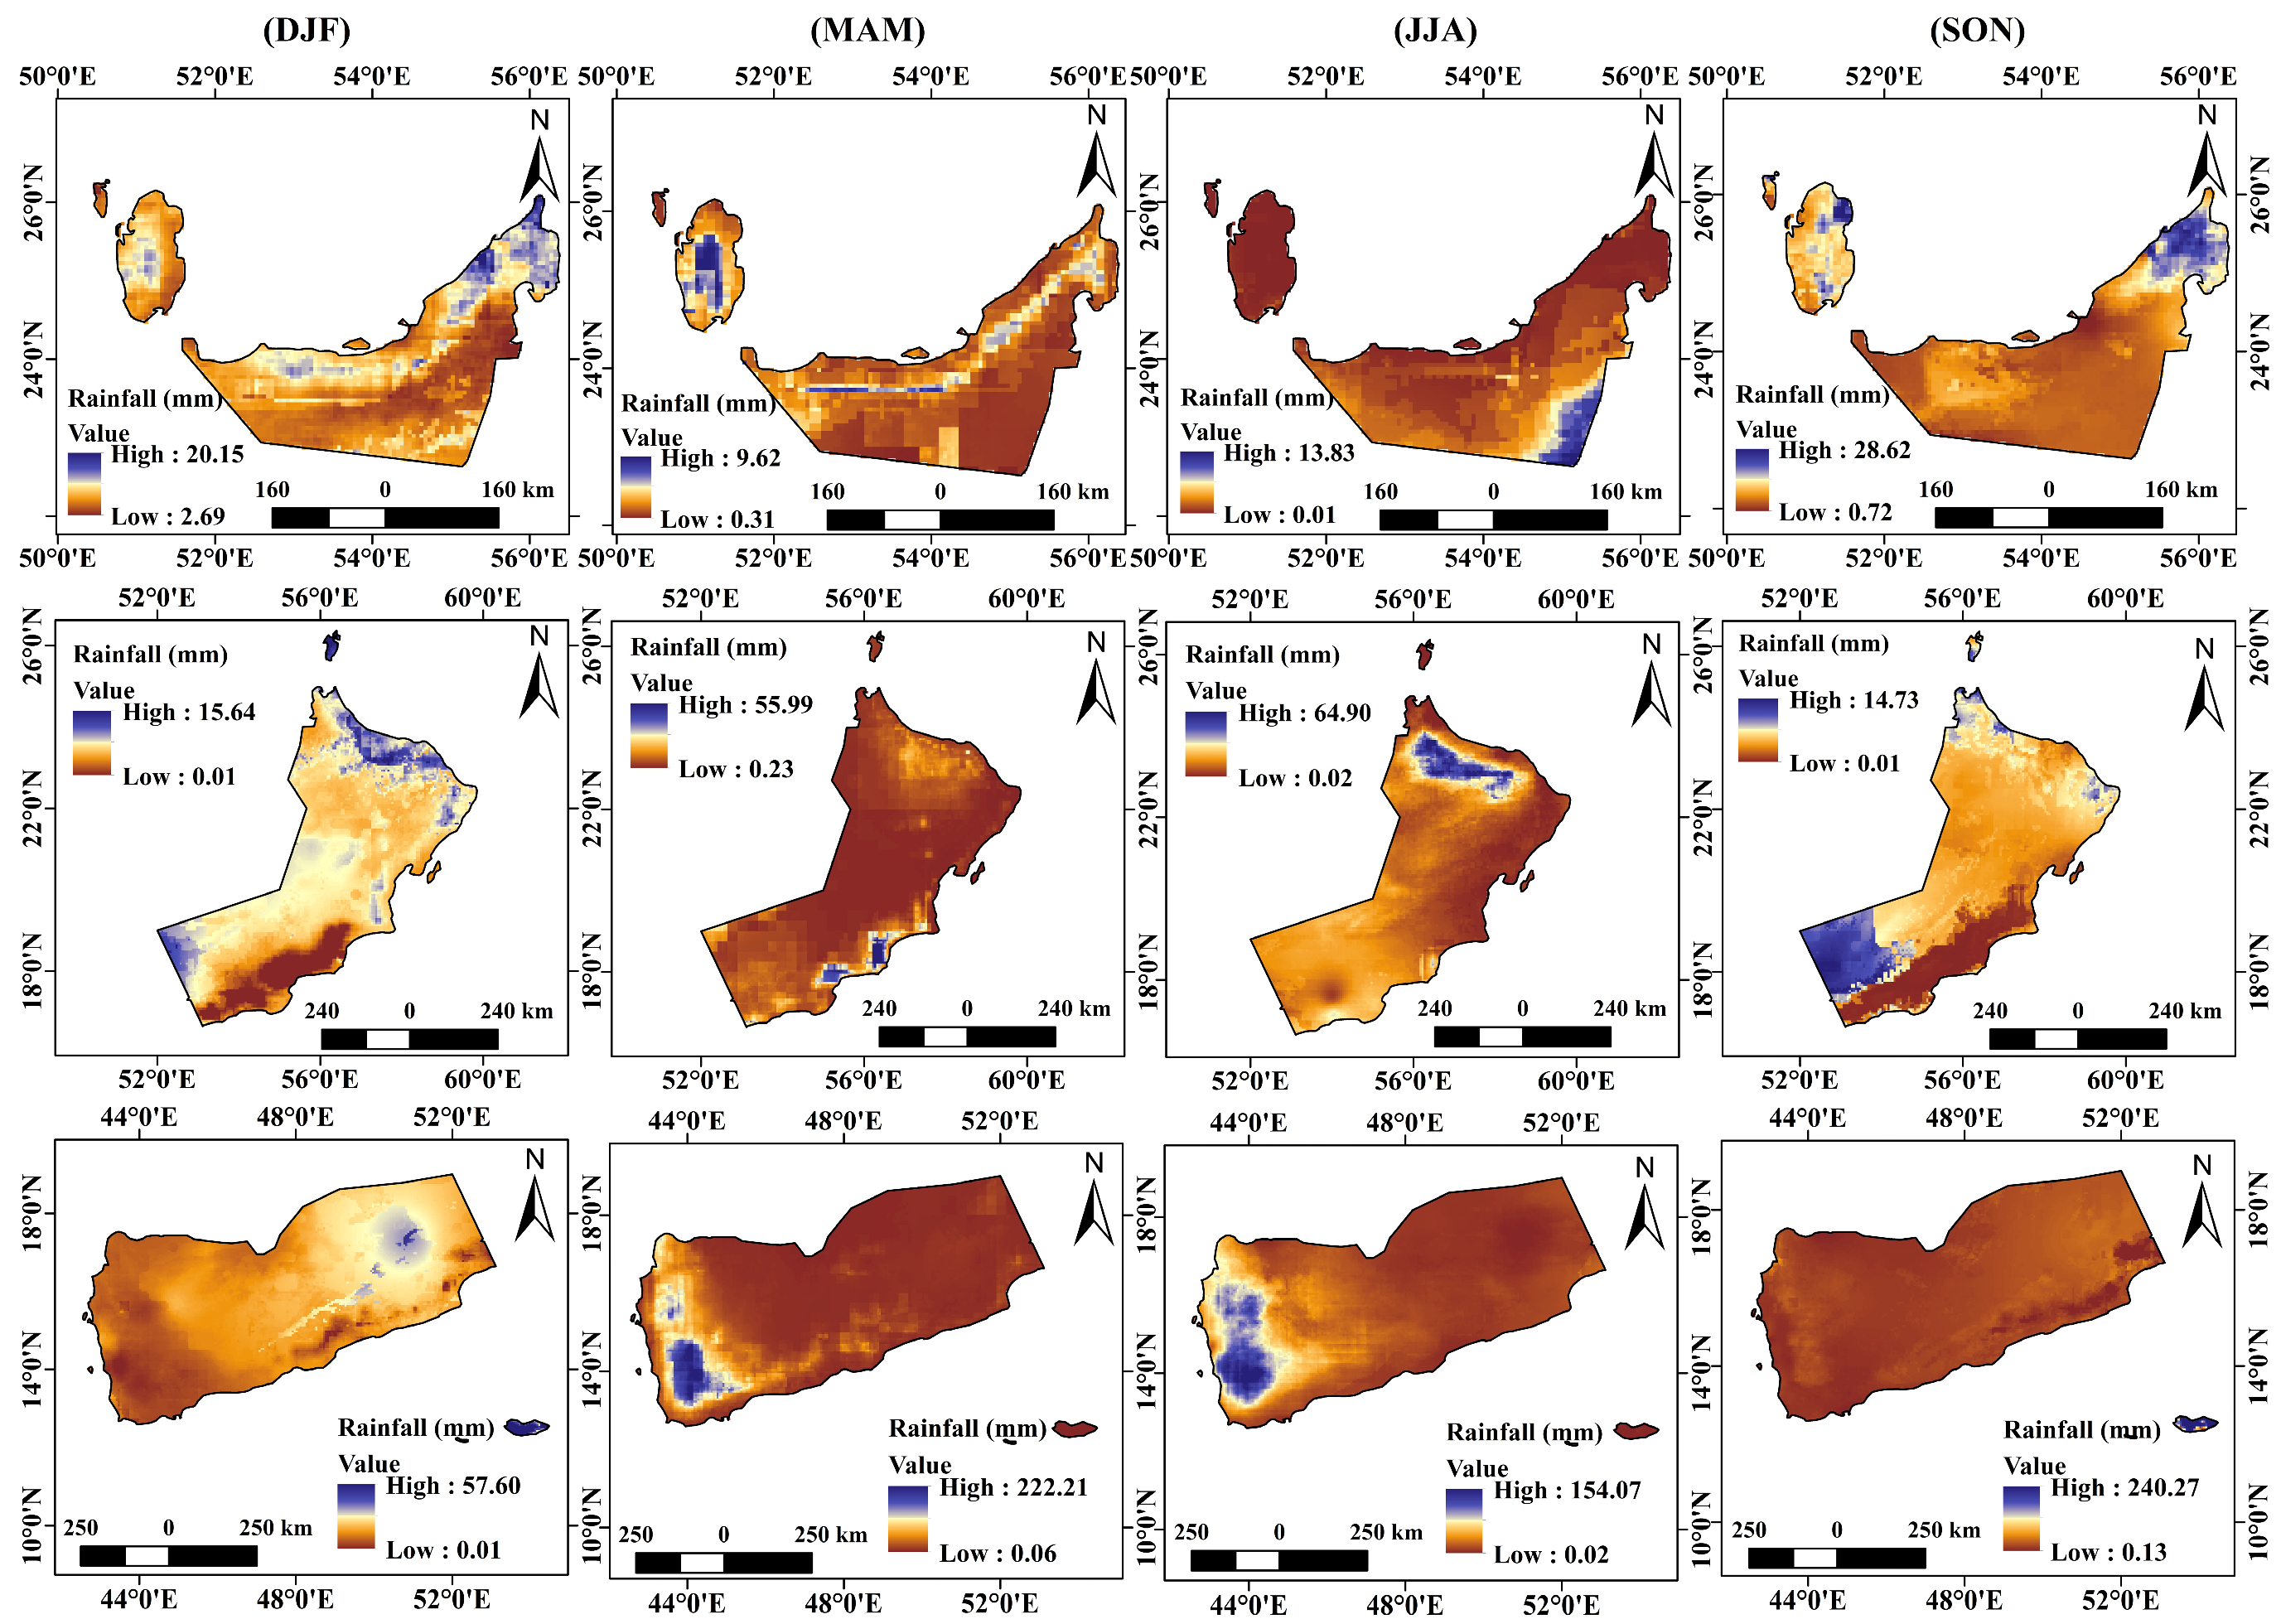
3.1. Rainfall Variation Analysis

The long-term seasonal rainfall variation in the selected ME countries is important for climate change monitoring and identifying water cycles. Rainfall is essential for monitoring the flood, drought, water scarcity, and food scarcity problems in a particular area. Therefore, this study examines the eleven Middle Eastern countries for seasonal rainfall analysis from 2000 to 2023. The study results identified that in Saudi Arabia, the highest total mean rainfall was observed in different seasons at 509.64 mm (DJF), 110.95 mm (MAM), 79.38 mm (JJA), and 184.26 mm (SON), but the highest-rainfall-received locations are different in different seasons while the lowest maximum rainfall varies from 0.61 mm to 0.02 mm throughout the year from 2000 to 2023 (Figure 3). In the DJF months, high rainfall was recorded in the west (Yanbu, Umluj, Khaybar, and Madinah) and the north (Hali, Sakaka, and Arar). Similarly, in the MAM months, rainfall was recorded in the southwest (Abha, Najran, and Al-namas) and the middle part (Al Duwadimi, Al Quwaiiyah, Riyadh) of Saudi Arabia (Table 1). In JJA, rainfall was recorded as very low in southwest Saudi Arabia. But SON months are high-rainfall observed in the north and northeast (Hafar Al Batin, Al Majma’ah, and Abu Hadriya) parts.
Iraq’s highest mean rainfall recorded in different seasons is 141.08 mm (DJF), 115.40 mm (MAM), 20.39 mm (JJA), and 211.50 mm (SON) (Table 1). Mainly, the northern parts of Iraq received a high amount of rainfall during September–February, while low rainfall was recorded at 4.89 mm to 0.01 mm throughout the year from 2000 to 2023 in Iraq based on the CHIRPS data. This study observed that high rainfall was recorded in locations such as DJF (Masul, Erbil, Duhok, Al-Ba’aj, Kirkuk, and Sulaymaniyah), MAM (Sulaymaniyah, Barjan, Halabja, Ranya, and Amedi), JJA (Sheladiz, and Batifa), and SON (Masul, Erbil, and Sulaymaniyah) (Figure 3). Similarly, in Iran, the highest mean rainfall was recorded at 191.56 mm (DJF), 155.84 mm (MAM), 276.96 mm (JJA), and 306.35 mm (SON), and the lowest maximum rainfall was recorded at 0.07 mm to 0.02 mm throughout the year from 2000 to 2023. The northern parts of Iran have received high rainfall throughout the year, but in June–August, very low rainfall was received in different parts of Iran. The seasonal rainfall recorded in Iran in different seasons was DJF (Tabriz, Tehran, Sari, and Chalus), MAM (Tabriz, part of Tehran, Mahabad, and Sanandaj), JJA (Rasht, Ramsar, Sari, and Chalus), and SON (Ramsar, Sari, and Chalus) (Figure 3). The Rasht, Ramsar, Sari, and Chalus belt areas are more vegetated due to the high rainfall received in Iran.
Seasonal rainfall data based on the PERSIANN rainfall data from 2000 to 2023 is shown in the accompanying graphic. It is broken down into four seasons, DJF (December-February), MAM (March–May), JJA (June–August), and SON (September–November), and covers three regions, most likely Saudi Arabia, Iraq, and Iran. The maximum rainfall in the DJF is 419.51 mm in Saudi Arabia, 130.89 mm in Iraq, and 102.91 mm in Iran; these locations have their most rainfall during the winter months. With maximums of 216.52 mm, 104.8 mm, and 118.28 mm, respectively, MAM indicates a transition period with decreased rainfall. JJA is defined by low precipitation levels, with maximums of 71.6 mm in Saudi Arabia, 0.0 mm in Iraq, and 188.14 mm in Iran (Figure 4). This highlights the arid summer conditions, particularly in Iraq, where there is no rainfall. As the wet season begins, SON shows a moderate rebound in rainfall, with maximums of 141.9 mm in Saudi Arabia, 157.79 mm in Iraq, and 244.28 mm in Iran (Figure 4).
In Jordan, rainfall recorded in different months based on the CHIRPS data are 161.28 mm (DJF), 20.88 mm (MAM), 0.38 mm (JJA), and 98.08 mm (SON), while low rainfall was observed at 2.51 mm to 0.01 mm throughout the years from 2000 to 2023 (Table 1). In Jordan, in the northeast and northern parts, most rainfall was observed in DJF (Amman, Irbid, and Al-Mafraq), MAM (Ruwaished), JJA (very low rainfall), and SON (Amman and Irbid). Similarly, in Syria, the highest rainfall was recorded at 246.51 mm (DJF), 45.18 mm (MAM), 15.93 mm (JJA), and 208.59 mm (SON), while the lowest maximum rainfall was recorded at 14.59 mm to 0.02 mm throughout the year from 2000 to 2023 (Figure 5). Season-wise, high rainfall was observed in locations in Syria in DJF (Damascus and As Suwayda), MAM (Al Hasakah, Qamishli, and Al-Maabadah), JJA (Homs and Latakia), and SON (Al-Maabadah, Homs, and Damascus), respectively. In Kuwait, rainfall was recorded as very low concerning other countries, and the highest rainfall recorded in different seasons is DJF (20.49 mm), MAM (6.18 mm), JJA (0.73 mm), and SON (44.66 mm), while the lowest maximum rainfall was observed as 19.29 mm to 0.01 mm throughout the year from 2000 to 2023 (Figure 5).
The PERSIANN rainfall data in DJF indicate notable winter precipitation variability, with the greatest recorded rainfall amounts being 107.02 mm in Jordan, 12.81 mm in Kuwait, and 196.68 mm in Syria. A seasonal shift with sporadic rainfall is suggested by the decrease in rainfall during MAM in all locations, with the highest values of 32.17 mm in Jordan, 40.23 mm in Kuwait, and 50.98 mm in Syria. With the maximum recorded rainfall of 0.0 mm in Jordan, Kuwait, and Syria, all regions in JJA receive little to no rainfall, indicating a markedly dry summer season typical of arid climates. SON signals the start of more rainfall, with maximums of 149.3 mm in Syria, 36.51 mm in Kuwait, and 73.82 mm in Jordan, demonstrating the seasonal rebound of precipitation (Figure 6). The spatial distribution shows that low-lying desert regions consistently have low rainfall values, while concentrated rainfall occurs in isolated high-elevation locations (Figure 5). In every location, rainfall minima continue to be abnormally low, frequently falling below 0.2 mm, particularly during JJA.
The patchy and uneven distribution of precipitation across regions is a clear indication of the variability in MAM and SON. Because summer precipitation is so minimal in many areas, the sharp seasonal difference highlights how winter rainfall predominates. While Syria has higher overall rainfall intensity, Jordan exhibits comparatively balanced rainfall patterns during DJF and SON. In contrast, rainfall in Kuwait is typically lower throughout the year, with only a little increase during MAM and SON. To maintain the sustainability of their water resources, these areas are critically dependent on seasonal precipitation, especially during the winter. Overall, the dataset does a good job of capturing the seasonal and regional variability of rainfall, highlighting its significance for climate studies, water management, and hydrological modeling throughout the region.
Due to the small area, Bahrain, Qatar, and UAE based on the CHIRPS data are presented in the same area and the recorded rainfall varies at 20.15 mm (DJF), 9.62 mm (MAM), 13.83 mm (JJA), and 28.62 mm (SON), while lowest maximum rainfall was recorded at 2.69 mm to 0.01 mm from 2000 to 2023 throughout the years (Figure 7). These countries are severely impacted and result in climate change; there is a greater scarcity of rainfall in those countries. Cloud seeding can be employed in drought-prone areas to lessen the negative consequences of extended dry spells, remove fog, and enhance safety and visibility at airports and other important locations. Increased rainfall can help agriculture by supplying essential water while dry outside. In Oman, the highest rainfall was recorded at 15.64 mm (DJF), 55.99 mm (MAM), 64.90 mm (JJA), and 14.73 mm (SON), while the lowest maximum rainfall was recorded at 0.23 mm to 0.01 mm from 2000 to 2023 throughout the years (Table 1). In Oman, rainfall was recorded as DJF (Muscat, Sur, Sohar, and Haima), MAM (Ras Madrakah, and Al Khaluf), JJA (Nizwa, Jalan Bani Buali, and Al Khaburah, Sohar), and SON (Sohar, Al Mazyunah, and Dhalkut). Similarly, in Yemen, rainfall variations in different seasons based on the CHIRPS data are 57.60 mm (DJF), 222.21 mm (MAM), 154.07 mm (JJA), and 240.27 mm (SON), while the lowest maximum rainfall varies from 0.13 mm to 0.01 from 2000 to 2023 throughout the year (Figure 8). In Yemen, high-rainfall locations are Sana’s, Dhamar, Taizz, Aden, Ibb, and Al Hudaydah (mainly in western Yemen). This result indicates that rainfall is highly observed in the south-southwest (Saudi Arabia and Yemen) and northeast (Iran and Iraq) (Figure 9). The 50 × 50 (row and column) scale and 1498 out of 1600-point datasets are applied for line graph analysis (because of some no-data values).
Maximum rainfall levels of 12.53 mm in the United Arab Emirates, 12.94 mm in Oman, and 45.65 mm in Yemen, according to the PERSIANN rainfall data in DJF, indicate mild winter precipitation. Seasonal rainfall peaks, particularly in Yemen, are highlighted by the notable increase in rainfall during MAM, with a maximum of 23.22 mm in the UAE, 42.58 mm in Oman, and 356.54 mm in Yemen. Yemen recorded a maximum of 247.75 mm, Oman 43.32 mm, and the UAE 5.84 mm in JJA, indicating that summer rainfall persists in Yemen and Oman reaches moderate levels while the UAE remains comparatively dry. Transitional precipitation patterns are indicated by SON’s rainfall recovery, which shows peaks of 29.64 mm in the United Arab Emirates, 32.62 mm in Oman, and 60.48 mm in Yemen. In all regions, rainfall minima are constantly low, frequently less than 0.2 mm, and show ongoing aridity over large areas, especially throughout the summer (Figure 7). Higher rainfall concentrations are found in coastal and highland regions, while inland deserts receive very little precipitation, according to a spatial study. Yemen shows the highest seasonal rainfall variability, especially during MAM and JJA, where rainfall values exceed 350 mm in certain regions (Figure 8).

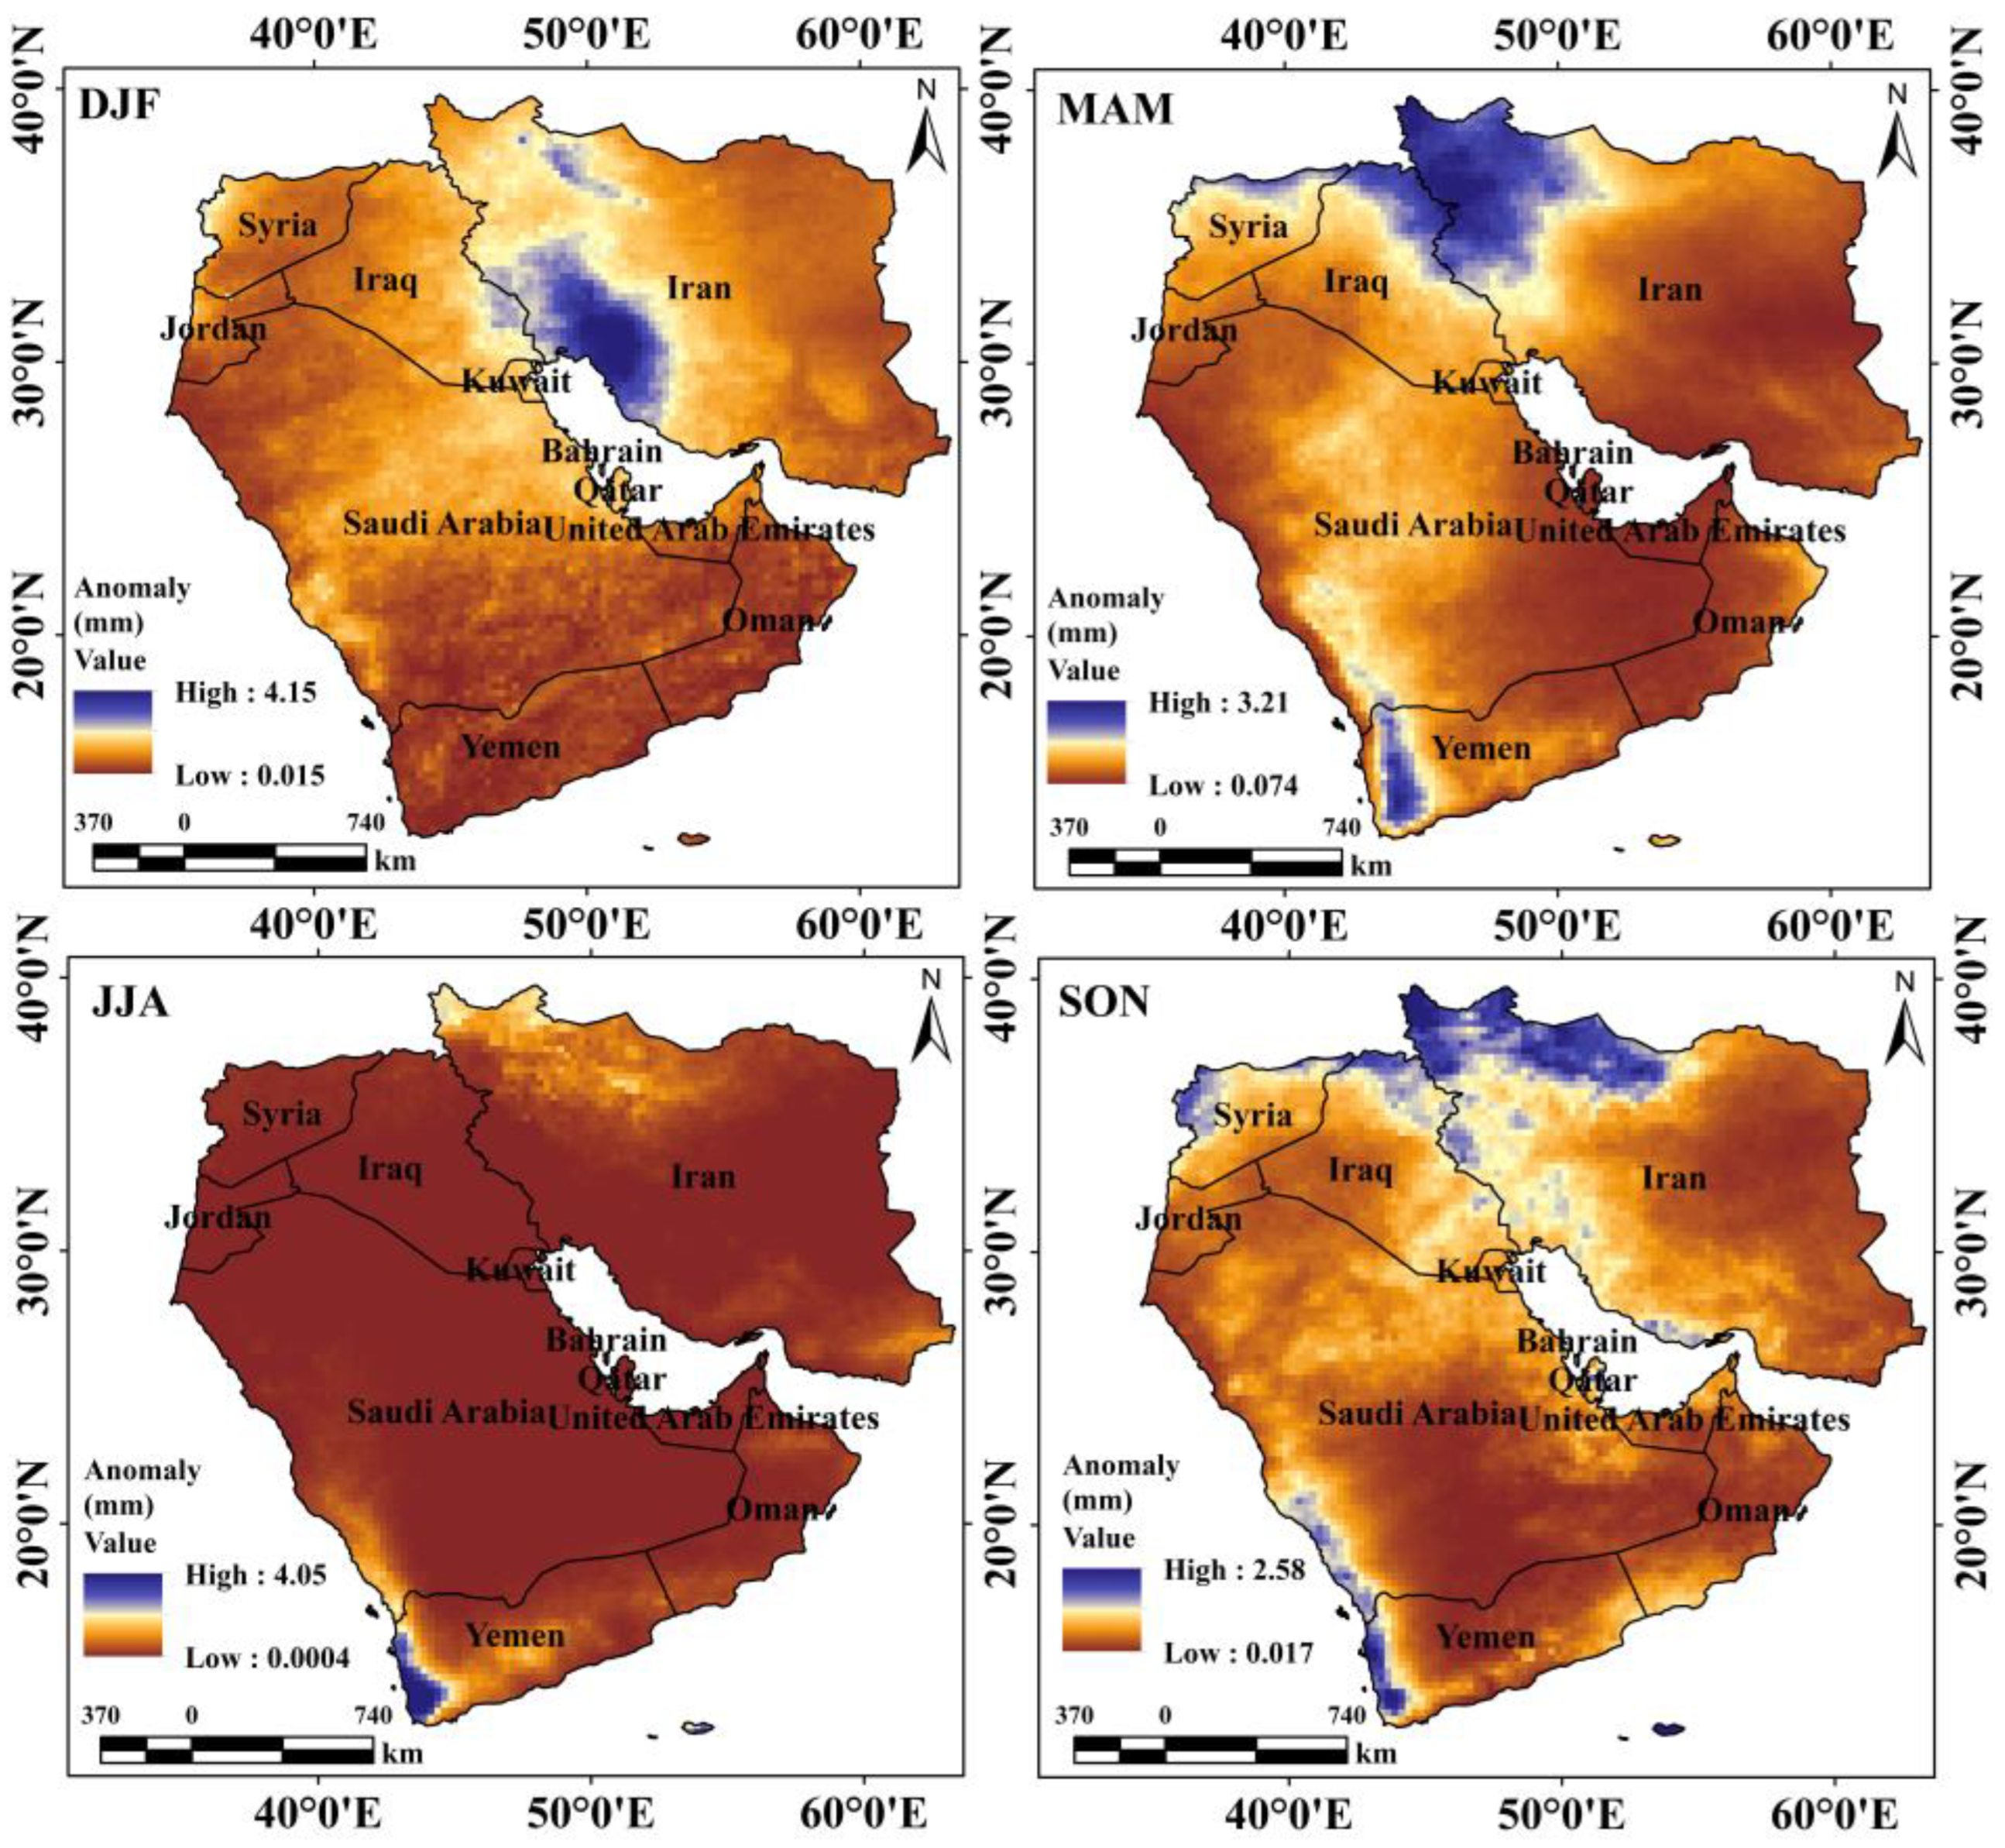
3.2. Rainfall Anomaly Variation Analysis

With the biggest discrepancies in northern and hilly areas like Iran, Iraq, Syria, and Yemen, CHIRPS predicts noticeably greater precipitation anomalies across all seasons than PERSIANN. There is a significant difference in the precipitation estimation between CHIRPS and PERSIANN in DJF, with CHIRPS recording anomalies up to 59.15 mm in northern Iran and PERSIANN showing a high of 4.15 mm (Figure 10). In CHIRPS, Iraq and Syria likewise show high DJF anomalies, ranging from 40 to 50 mm and 30 to 40 mm, respectively, while PERSIANN estimates remain below 4 mm. These disparities are still present in MAM, where CHIRPS shows abnormalities as high as 37.79 mm in Iran and as low as 20–30 mm in Iraq and Syria, whereas PERSIANN reports anomalies as low as 3.21 mm (Figure 11). Even though JJA is often dry, CHIRPS may nevertheless identify moderate anomalies (up to 27.78 mm in some places), while PERSIANN anomalies remain below 4.05 mm. CHIRPS anomalies in SON can reach 32.43 mm, especially in northern locations, but PERSIANN only reaches a peak of 2.58 mm. Due to CHIRPS’s capacity to account for ground-based station corrections, the disparities are most noticeable in northern Iran, Iraq, and Syria, where it displays noticeably greater anomalies. PERSIANN, on the other hand, seems to reduce overall anomalies by smoothing out intense precipitation occurrences. While CHIRPS detects somewhat higher values in the western highlands of Saudi Arabia and Yemen during DJF and SON, both datasets on the Arabian Peninsula reveal modest precipitation anomalies (Figure 12). This implies that precipitation is generated in these areas by orographic effects, which CHIRPS better catches. Precipitation variability is often minimal in dry and lowland regions, where the two datasets overlap more closely. The observed seasonal fluctuations are consistent with regional climate patterns, whereby mid-latitude westerlies influence DJF and MAM to deliver increased precipitation to northern regions, while dominating high-pressure systems keep JJA mostly dry. PERSIANN’s smaller anomalies, especially during rainy seasons, imply that it might understate extreme precipitation occurrences, which would make it less appropriate for capturing short-term climate variability in some areas. Studies on the effects of climate change, the management of water resources, and disaster planning may all be impacted by this, as precise depictions of precipitation anomalies are essential.

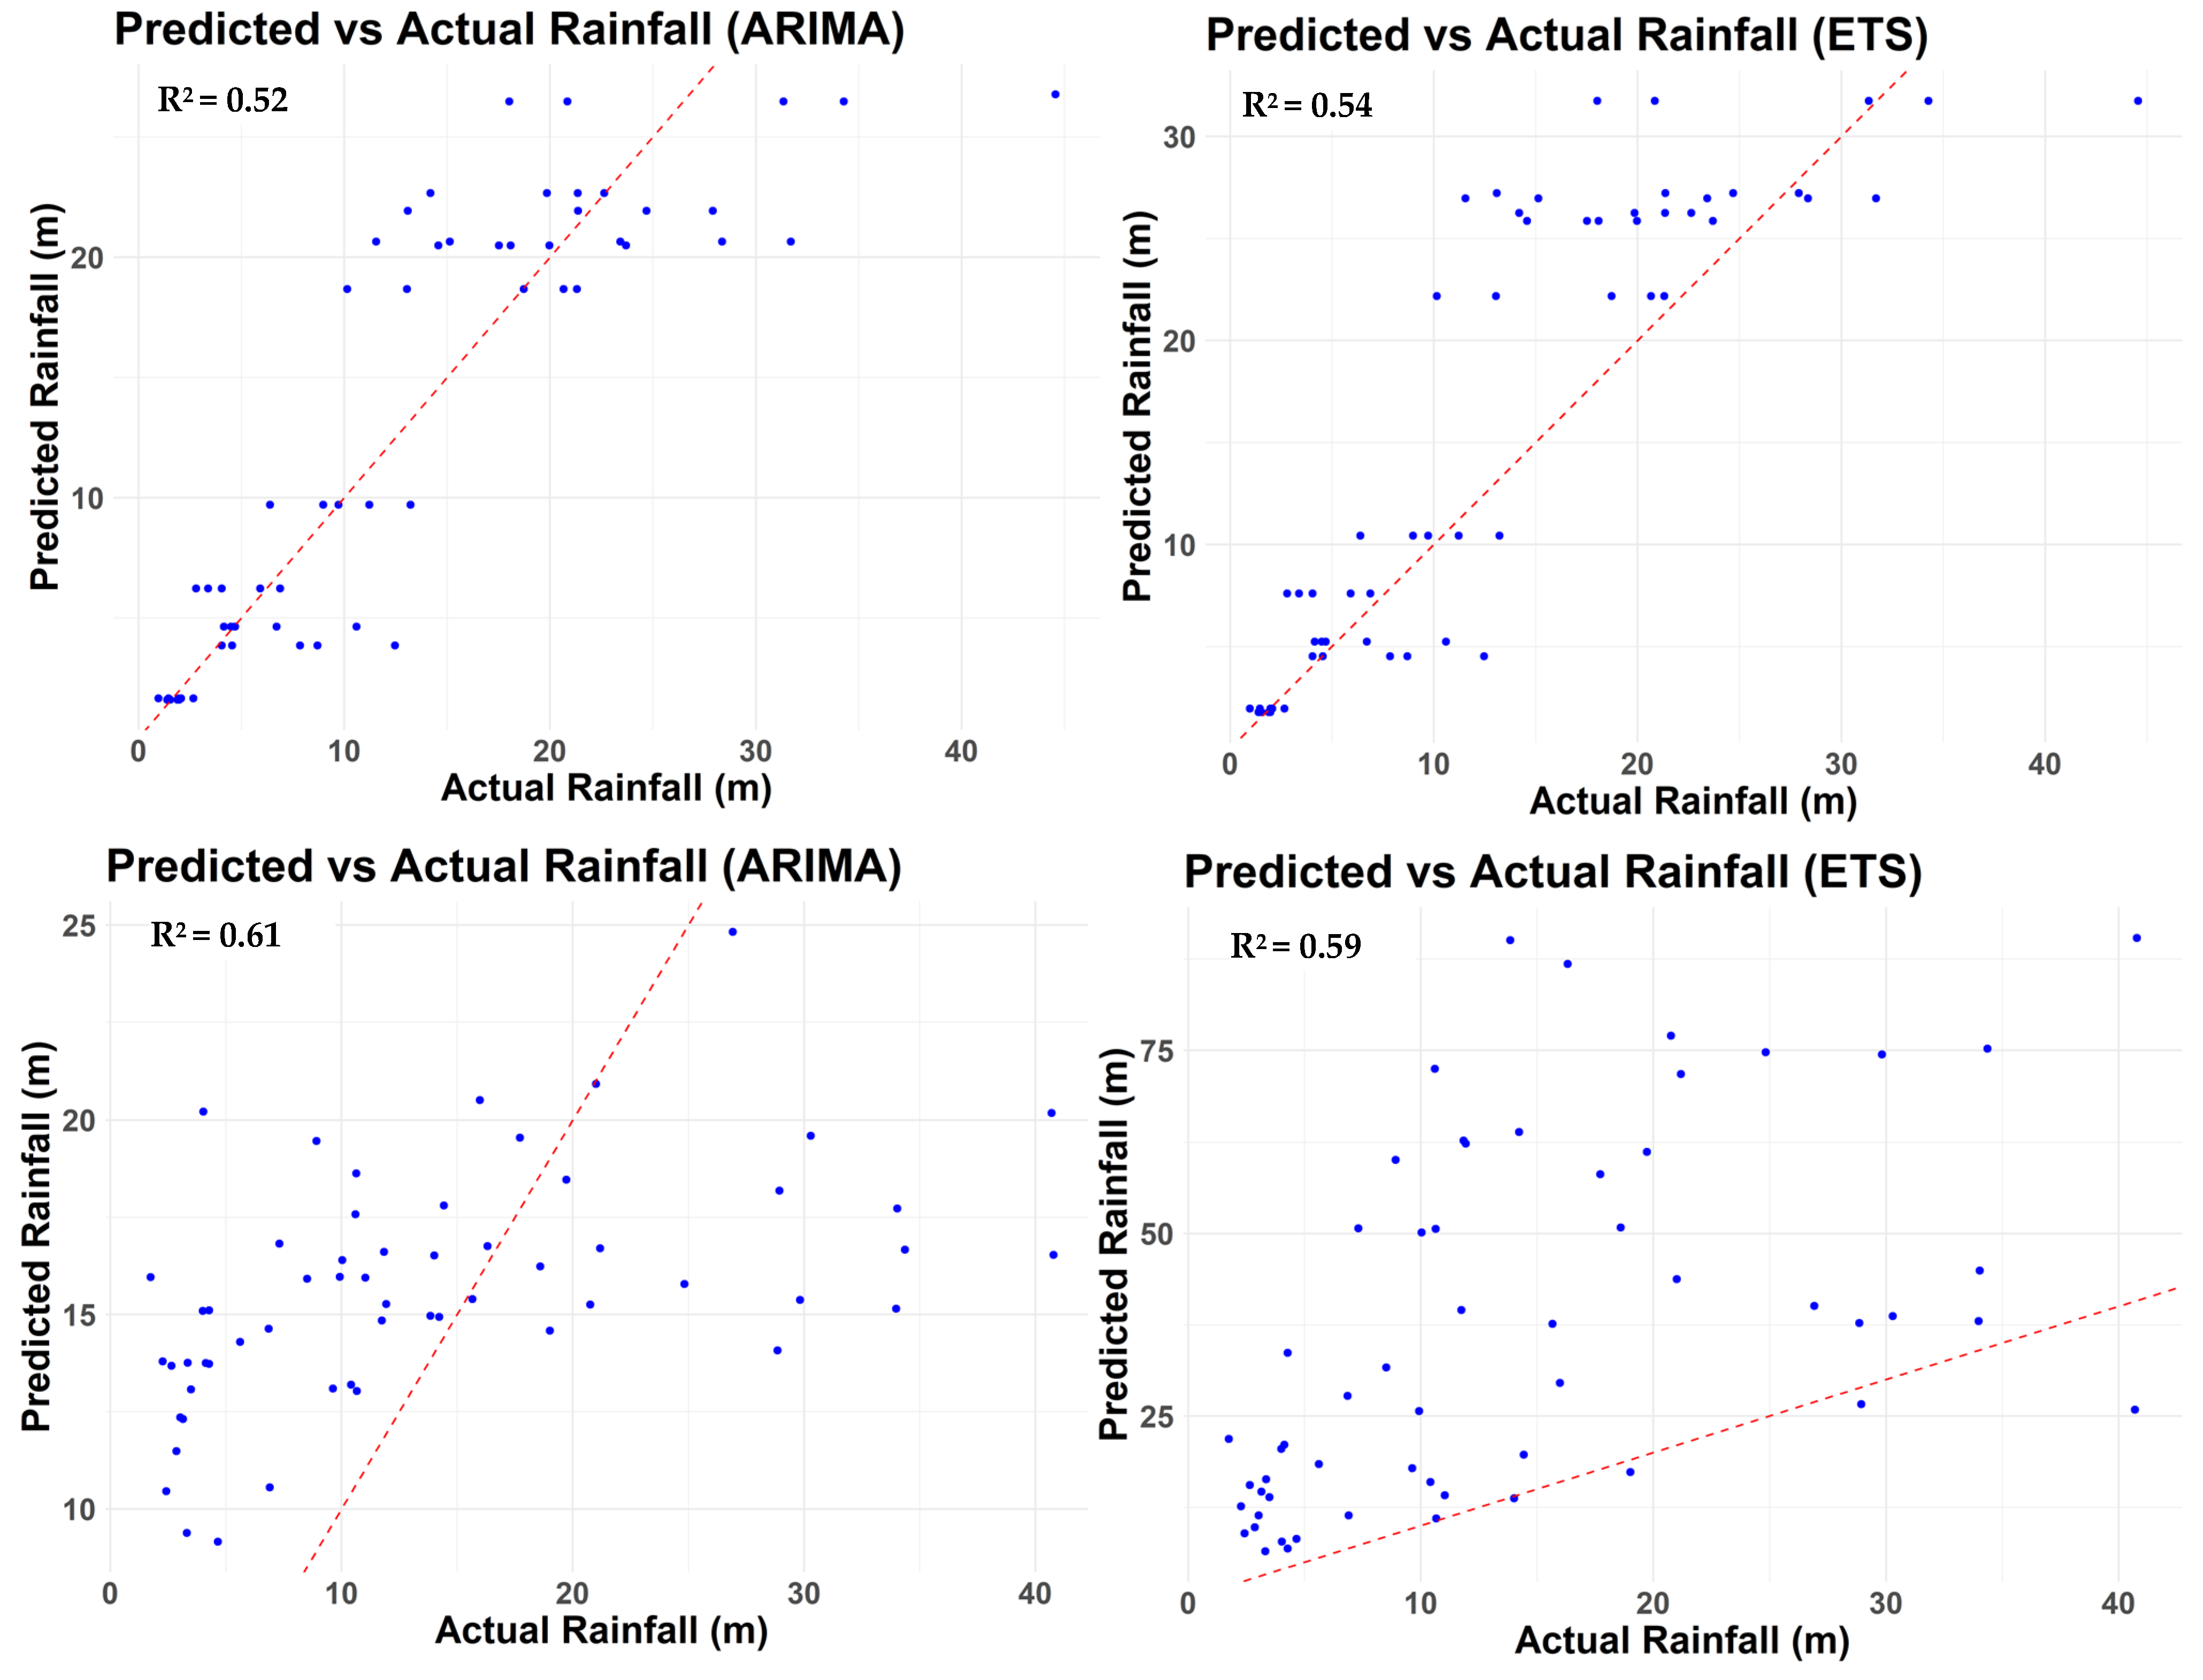
3.3. Rainfall Forecast Using the ARIMA and ETS Models

Strong seasonality is evident in the CHIRPS dataset, which includes historical rainfall data from 2000 to 2020. The rainfall values in this dataset range from 0 mm to 35 mm. This seasonal pattern is predicted to continue from 2020 to 2025 using ARIMA, ETS, and an ensemble model. While the lowest readings remain around 5 mm, the predicted peak rainfall reaches about 40 mm. According to forecasts, the average rainfall during peak months will be between 25 and 30 mm. The confidence intervals are wider as time goes on, indicating an increase in uncertainty. With lower projections of around 5 mm and higher estimates of over 45 mm, the anticipated rainfall range widens by 2025. Historical rainfall data from 2000 to 2020 for the PERSIANN dataset vary between 30 and 35 mm, with some maxima beyond 35 mm after 2010. The prognosis for 2020–2025 indicates that rainfall will primarily fall between 30 and 37 mm. While ARIMA and the ensemble model indicate more consistent trends, with rainfall amounts centered around 32 mm to 35 mm, ETS projections show more unpredictability (Figure 13). A steady rise in uncertainty is evident by 2025, when the lower and upper bounds of the confidence interval are roughly 28 and 38 mm, respectively. A comparison of the two datasets shows that PERSIANN shows a more stable trend, with rainfall centered around 32 to 35 mm, whereas CHIRPS projections show more seasonal variance, with extreme values surpassing 40 mm. Beyond 2023, there is a large rise in uncertainty in both projections, highlighting the increasing variability in rainfall patterns. Effective management of water resources, planning for drought risk, and evaluating the effects of climate change all depend on these estimates.
ARIMA is the most accurate model in the CHIRPS dataset, even if its MPE of −5.168 indicates an underestimate. It has the lowest RMSE (0.491) and MAE (0.339) and a slight positive bias (ME = 0.211). With an MAPE value of 2.871, its better relative accuracy is confirmed. The ensemble average model outperforms ARIMA in terms of RMSE (0.584), MAE (0.348), and negative bias (ME = −0.294), but its MAPE (3.485) is marginally worse. With the highest RMSE (0.603), MAE (0.419), and MAPE (3.954), ETS exhibits the worst performance and the worst forecasting mistakes (Table 2). ETS’s ACF1 value of 0.461 indicates a higher residual correlation and fewer independent error terms. With the highest RMSE (1.214) and MAE (0.977) for the PERSIANN dataset, ARIMA exhibits the most forecast errors despite exhibiting a modest negative bias (ME = −0.237). According to the MAPE (2.918) and MPE (−0.833), there is a substantial underestimate. The accuracy of the ensemble average model is higher than that of ARIMA, with lower RMSE (1.047) and MAE (0.858). Additionally, its MAPE (2.570) shows better relative performance. With the lowest RMSE (0.984), MAE (0.807), and MAPE (2.420), ETS performs better than the other models for PERSIANN and is therefore the most accurate. ETS is more dependable since it has the lowest ACF1 (0.304), which indicates stronger residual independence. Due to its seasonal adaptability and lower error values, ARIMA performs best overall for CHIRPS, but ETS is the most successful model for PERSIANN, exhibiting the lowest error and superior residual behavior.
The ARIMA and ETS models’ anticipated and actual rainfall values are displayed in scatter plots using the CHIRPS and PERSIANN datasets. The distribution of points along the ideal 1:1 line for CHIRPS is close for both the ARIMA and ETS models, indicating that the models can capture broad trends in rainfall. Some points, however, show examples of either overprediction or underprediction because they diverge greatly from the line (Figure 14). ETS seems to have a slightly wider dispersion than ARIMA, which could indicate that its forecasts are more variable. The more concentrated point spread that ARIMA displays for PERSIANN suggests a generally consistent forecast tendency, although there are still some notable deviations. With several points straying far from the 1:1 line, the ETS model for PERSIANN exhibits more dispersion and makes fewer accurate predictions. PERSIANN’s ETS also exhibits a propensity toward overprediction at higher rainfall values. ARIMA produces more reliable predictions on both datasets, whereas ETS shows more forecast variance, especially when using the PERSIANN dataset. The performance variations between datasets and models demonstrate how input data properties affect prediction accuracy.

4. Discussion

Seasonal rainfall patterns show greater regional diversity in rainfall, with notable summer dryness and winter maxima. The lowest maximum rainfall levels are consistently found in dry regions, whereas higher rainfall is confined to isolated pockets, particularly in mountainous and elevated places. Iraq shows a sharp reduction in rainfall during the summer compared to neighboring regions. With significantly larger annual rainfall totals in Saudi Arabia and Iran than in Iraq, the data highlight notable spatiotemporal heterogeneity [38]. Seasonally consistent low rainfall, often less than 0.2 mm, emphasizes the region’s arid environment. Variability in the SON and MAM seasons suggests periods of transitional weather with sporadic patterns of precipitation. All things considered, the dataset successfully depicts the regional and seasonal variations in rainfall variability, intensity, and distribution throughout the two-decade period. With somewhat higher DJF and SON values, the UAE has little rainfall all year long. Oman exhibits mild rainfall peaks in MAM and JJA, consistent with its distinct topography. While Oman and the United Arab Emirates rely more on transitional and winter seasons for precipitation, Yemen is more dependent on summer monsoon systems, according to the statistics. Every region has notable seasonal variations, with winter and spring accounting for the majority of the year’s precipitation.
Because of the ongoing alterations in weather patterns and climate, it is necessary to continuously examine, analyze, and discover change points in climatic variables around the globe [39]. Changes in air temperature have a major impact on crop production, according to the Food and Agriculture Organization (FAO). According to the FAO, temperature changes have caused yields to drop by 15–35% in areas like West Asia and Africa. The crop yields have decreased by about 25 to 35% in the ME as a result of an increase in average temperatures of 2 to 4 °C (Forest Resources Assessment—WP 56, https://www.fao.org/4/ad652e/ad652e00.htm, accessed on 27 September 2024). The Indian Summer Monsoon (ISM) system can be strengthened by Middle Eastern dust particles by heating the troposphere, according to major research; nevertheless, there are significant differences in the ISM rainfall responses concerning geographic pattern and amplitude. The findings demonstrated a substantial and positive correlation between the ISM rainfall in the southwest coastal areas, Northern Central India, the southern slope of the Tibetan Plateau, and the Aerosol Optical Depth (AOD) over the Arabian Sea and the southern Arabian Peninsula [10]. According to a worldwide model simulation, the reactions of monsoonal rainfall to dust are negative in Northeast India and positive in South India [40]. The observed ISM rainfall response patterns to dust were accurately represented by one high-resolution regional model simulation, whereas the rainfall response pattern in another regional model study was entirely different [41]. Scholars have discussed the uncertainties in modeling studies and the irregular rainfall responses of the monsoon season to Arabian dust particles [42].
The correlation for the other techniques was not greater than 0.36. Furthermore, compared to kriging and inverse distance weighted (IDW) methods, co-kriging’s Root-Mean-Square Error (RMSE) was lower [43]. In recent decades, an increasing frequency of severe extreme events, including heavy floods, protracted droughts, and drying lakes, has occurred on the Arabian Peninsula. The Arabian Peninsula is one of the places that is sensitive to climate change [44]. The environmental, agricultural, and public health problems have been made worse by these climate-related problems [45,46]. Due to the present water shortage in the Arabian Peninsula, many desalinated waters from the Arabian Gulf provide for the neighboring towns’ water demands. However, this greater dependence on desalination has put the water body under more environmental stress [47,48]. Additionally, the notable regional variability in precipitation has an impact on the precipitation patterns over the Arabian Peninsula. Numerous climatic factors, including the Indian monsoon, the Mediterranean climate, and orographic fluctuations, are responsible for this variability [49]. Because there are not enough observations, the precipitation mechanisms over this region have not been well studied in prior research despite their significance [50]. It is acknowledged that the Arabian Peninsula is one area that is especially vulnerable to the effects of climate change due to the likelihood that desert regions may spread in response to a hotter environment [51]. To improve future climate predictions, it is essential to have a solid grasp of local circumstances. Evans highlights that to provide accurate evaluations of water stress in a changing climate, it is crucial to understand the variability in precipitation throughout the Arabian Peninsula [52]. The regional spread of changes in precipitation patterns in response to climate change makes this understanding more important.
The ME is arid and semi-arid, with intermittent and highly localized rainfall, which makes satellite-based precipitation datasets like CHIRPS and PERSIANN useful resources [53]. In many areas of the region, weather stations are sparsely distributed, leaving observational gaps filled by the spatially wide coverage provided by both databases. Because it improves accuracy through calibration, CHIRPS, which combines satellite data with station observations, is especially useful in areas where some station data are available. For examining long-term climate patterns and variability, its extensive historical record, which dates back to 1981, is particularly helpful [54]. However, because of its high temporal resolution and reliance on infrared and microwave satellite data in conjunction with machine learning techniques, PERSIANN is a valuable tool for recording severe and brief rainfall events, which are frequent in the area [55]. In regions prone to political unrest or violence, where conventional ground-based observation systems could be destroyed or interrupted, the remote sensing methodology of both datasets offers an additional significant benefit [56]. They can also be used for free by scholars, government organizations, and humanitarian groups due to their open-access nature, which is especially advantageous for countries with limited resources.
Due to the region’s distinct climatic features, both databases have considerable limits in the ME despite their benefits [57]. Since light or trace rainfall events are frequent in the area, the primarily arid and desert terrain makes it difficult to estimate precipitation accurately. In regions with few or no ground stations, CHIRPS often has trouble accurately calibrating satellite data [58]. Relying solely on infrared data may cause precipitation to be overestimated or underestimated in severely arid areas. Despite exhibiting a high temporal resolution, PERSIANN is not very good at identifying light rain or precisely recording brief, intense rainfall episodes, especially when localized convective storms are present [59]. Its reliance on infrared data from satellites could also result in errors in areas with wildly fluctuating patterns of cloud cover or during dust storms, which are common in the ME [60]. Additionally, during infrequent but noteworthy meteorological events like tropical cyclones or atypical monsoon invasions, both databases are susceptible to inaccuracies. The coarse geographic resolution of these datasets is another drawback; it was not sufficient in detecting localized precipitation variability in complicated terrains, such as the mountainous areas of Yemen, Oman, or Iran [61]. Fine-scale resolution is frequently needed for flood forecasting, agricultural planning, and water resource management; CHIRPS and PERSIANN’s poor resolution may make these methods less accurate [62].
In the ME, the decision between CHIRPS and PERSIANN frequently comes down to the particular application, spatial size, and temporal resolution needed for a project or study [63]. Because CHIRPS integrates station data and has a longer historical record, it is typically chosen for long-term climatological studies and drought evaluations [64]. On the other hand, high-frequency rainfall episodes are better captured and monitored in real-time by PERSIANN [65]. Both datasets, however, need to be carefully validated and calibrated using local ground-based observations to increase their accuracy and dependability in the ME’s varied topography and climate. To solve the hydrological and meteorological issues facing the area, combining the two datasets or combining them with ground measurements may provide a more reliable answer.
The water crisis that already exists in the Middle East has become worse due to climate change [66]. Evaporation rates have risen in response to rising temperatures, and conventional farming methods have been disturbed by unpredictable rainfall patterns. Forecasts indicate that the region’s already scarce water supplies may be further threatened by a further reduction in average rainfall in several areas. Furthermore, the frequency of extreme weather events has increased, putting infrastructure, agriculture, and human settlements at risk from droughts and flash floods [67]. To better manage water resources and adjust to shifting climatic circumstances, Middle Eastern countries have implemented several laws and initiatives after realizing how urgent it is to combat climate change:
  • Projects for Water Resource Management: To cut down on water wastage, countries like Saudi Arabia, the United Arab Emirates, and Jordan have made significant investments in desalination facilities, water recycling systems, and cutting-edge irrigation system technology [68].
  • National Climate Change Strategies: Certain goals for cutting carbon emissions, advancing renewable energy, and improving water sustainability are included in Saudi Arabia’s Vision 2030 and the United Arab Emirates’ National Climate Change Plan.
  • Afforestation and Green Initiatives: The UAE’s afforestation initiatives [69] and Saudi Arabia’s Green Initiative [70] seek to counteract desertification, increase biodiversity, and improve water retention.
  • International Cooperation: To obtain funds and technical support for climate resilience initiatives, numerous Middle Eastern countries take part in international accords, including the Paris Agreement, and work with international organizations.
  • Early Warning Systems: For extreme weather occurrences like flash floods and droughts, early warning systems have been enhanced by investments in hydrological and meteorological monitoring systems.
Challenges still exist despite large investments and policy frameworks. The use of unsustainable water extraction methods, political unpredictability, and a lack of funding in some countries continue to impede development. Long-term water security is also an issue because the region relies on non-renewable water sources such as fossil aquifers [71]. The future entails investing in cutting-edge water harvesting and desalination technology, raising public awareness of water conservation, and strengthening regional cooperation. Strategies for climate adaptation must also address socioeconomic inequality made worse by the effects of climate change and give priority to populations who are most at risk [72] with global climate change impact on biodiversity [73].

5. Limitations and Future Research Direction

Rain gauge data show trends in rainfall indices, which are not necessarily reflected in CHIRPS data, save for the maximum duration of the dry period. This is due to the possibility that CHIRPS may overlook localized differences that rain gauges record when estimating rainfall over broader areas. Ground-based rain gauges provide accurate data, particularly to a certain location, whereas CHIRPS aggregates rainfall across larger areas. For large-scale rainfall pattern analysis, CHIRPS is nevertheless helpful, particularly in places with little ground station coverage, even though the maximum length of dry spells determined using CHIRPS data did not closely match the values acquired using rain gauge stations. Because the approach is not very good at capturing the impacts of orography on precipitation, complex topography like the Zagros Mountains in Iran and mountainous areas in Yemen adds another complication. Furthermore, the credibility of PERSIANN predictions is diminished by the limited capacity to check and calibrate them due to the lack of ground-based weather sensors in many regions. There are further difficulties in detecting warm cloud rainfall, which is typical in the area because PERSIANN depends on cloud-top temperature data from infrared (IR) sensors. High concentrations of aerosols and dust storms often cause interference with satellite sensors, resulting in inaccurate rainfall detection. Small-scale, localized precipitation events in the ME are frequently missed or underreported due to spatial and temporal resolution. Furthermore, the system’s propensity to function better during wet seasons than dry ones as the yearly unpredictability of rainfall patterns introduces other biases.
High-resolution regional climate modeling should be the main focus of future research to better understand local rainfall variability and the effects of climate change across the various topographies and microclimates of the ME. Research on how climate change affects water resources is crucial, especially when evaluating how rainfall variability affects aquifers, reservoirs, and agricultural systems. Exploring the role of land-use changes and urbanization in altering regional rainfall patterns and exacerbating climate risks is another crucial avenue. For rainfall estimates to be less unpredictable, multi-model ensemble techniques that combine the results of regional and global climate models are also required. Furthermore, large climate datasets may be analyzed, rainfall predictions can be enhanced, and hidden patterns in historical climate data can be found using machine learning (ML) and artificial intelligence (AI). Finally, considering the shared water resources and transboundary character of many climate-related issues, Middle Eastern countries must collaborate across borders on climate research, data sharing, and coordinated mitigation initiatives. Future research will use regional climate models to examine the related modifications in air circulation and the impact of external forcing. It would make it easier for professionals, scientists, and decision makers to discern how human activity and climate change affect variations in precipitation rate and drought features. This may also prompt officials to devise suitable contingency plans to address local water-related issues.

6. Conclusions

The seasonal and regional discrepancies between CHIRPS and PERSIANN precipitation estimates in the Middle East are illustrated in this work, particularly in northern and hilly locations like Iran, Iraq, Syria, and Yemen. With a peak of 59.15 mm in DJF across northern Iran, CHIRPS reliably forecasts larger precipitation anomalies, whereas PERSIANN records noticeably lower values, peaking at 4.15 mm. PERSIANN estimations remain below 4 mm, but CHIRPS detects anomalies up to 37.79 mm in MAM, 27.78 mm in JJA, and 32.43 mm in SON. These disparities persist throughout the seasons. Underestimations result from PERSIANN’s reliance on infrared-based estimations, particularly in orographic areas such as the Alborz and Zagros. According to ARIMA, ETS, and ensemble models, future rainfall forecasts indicate that PERSIANN is steadier, with a center of 32–35 mm, whereas CHIRPS rainfall peaks could reach 40 mm by 2025. By 2025, rainfall is expected to range from 5 mm to over 45 mm for CHIRPS and from 28 mm to 38 mm for PERSIANN, but uncertainty grows over time. These results show how rainfall patterns are becoming more variable and emphasize how crucial precise precipitation estimation is for managing water resources, planning for drought risk, and evaluating the effects of climate change. To support regional adaptation efforts and improve future rainfall estimates, a mix of diverse datasets, enhanced satellite algorithms, and ground validation is essential.
Further insights into intricate climatic patterns and enhanced forecasting abilities can be obtained using cutting-edge technology like AI and ML. Research should also focus on creating climate-resilient infrastructure and regulations, encouraging sustainable water resource management, and comprehending the socioeconomic effects of rainfall variability. Addressing transboundary climate concerns will require cross-border collaboration and data exchange to ensure that scientific discoveries are translated into workable policy solutions. By following these research avenues, the ME can protect its water supplies, create a more resilient future, and lessen the negative impacts of climate change on its ecosystems, economies, and society. This study helps document climate-related risks within a country to feed into impact studies in important development sectors, like agriculture and water resources. Previous studies have concentrated on regional and sub-regional scales. This study helps deliver climate information at a country level that is more relevant for decision making and policymakers.

Author Contributions

Conceptualization, N.R., B.H. and C.B.P.; methodology, N.R. and B.H.; software, N.R. and B.H.; validation, N.R., B.H., M.F.A. and C.B.P.; formal analysis, N.R., M.F.A., S.S.S. and B.H.; investigation, N.R. and B.H.; resources, B.H., M.S. and C.B.P.; data curation N.R., S.S.R., M.Y.A.K., C.B.P. and B.H.; writing—original draft preparation, B.H., M.F.A., S.S.R., M.Y.A.K., S.S.S., C.B.P. and B.H.; writing—review and editing, B.H., M.F.A., S.S.R., M.Y.A.K., S.S.S., C.B.P., S.S.S. and M.S.; visualization, B.H. and S.S.S.; supervision, C.B.P., N.R. and B.H.; project administration, B.H. and M.S.; funding acquisition, M.S. All authors have read and agreed to the published version of the manuscript.

Funding

This research has not received any funding from any source.

Data Availability Statement

Data will be supplied upon request from the corresponding author.

Acknowledgments

The authors would like to thank the reviewers and editors for their comprehensive and constructive comments for improving the manuscript.

Conflicts of Interest

The authors declare no competing interests.

References

  1. Panda, K.C.; Singh, R.M.; Singh, V.K.; Singla, S.; Paramaguru, P.K. Impact of Climate Change Induced Future Rainfall Variation on Dynamics of Arid-Humid Zone Transition in the Western Province of India. J. Environ. Manag. 2023, 325, 116646. [Google Scholar] [CrossRef] [PubMed]
  2. Moazzam, M.F.U.; Rahman, G.; Munawar, S.; Farid, N.; Lee, B.G. Spatiotemporal Rainfall Variability and Drought Assessment during Past Five Decades in South Korea Using SPI and SPEI. Atmosphere 2022, 13, 292. [Google Scholar] [CrossRef]
  3. Mokhtar, M.B.; Ahmed, M.F. Managing a Road as a River to Mitigate the Impact of Urban Flash Floods. J. Flood Risk Manag. 2022, 15, 1. [Google Scholar] [CrossRef]
  4. Al Mahasneh, L.; Abuhamoor, D.; Al Sane, K.; Aldashti, H.; Haddad, N. Mapping the Potential Flood Frequency Zones in Jordan Using Gumbel Distribution and GIS. DYSONA-Appl. Sci. 2025, 6, 343–350. [Google Scholar]
  5. Xu, M.; Bravo de Guenni, L.; Córdova, J.R. Climate Change Impacts on Rainfall Intensity-Duration-Frequency Curves in Local Scale Catchments. Environ. Monit. Assess. 2024, 196, 372. [Google Scholar] [CrossRef]
  6. Mishra, A.K.; Dinesh, A.S.; Kumari, A.; Pandey, L.K. Precipitation Extremes over India in a Coupled Land–Atmosphere Regional Climate Model: Influence of the Land Surface Model and Domain Extent. Atmosphere 2024, 15, 44. [Google Scholar] [CrossRef]
  7. Al-Sheriadeh, M.; Al-Sharman, A.R. Evaluation of Satellite Rainfall Estimates Using PERSIANN-CDR and TRMM over Three Critical Cells in Jordan. J. Hydroinform. 2024, 26, 424–440. [Google Scholar] [CrossRef]
  8. Funk, C.; Peterson, P.; Landsfeld, M.; Pedreros, D.; Verdin, J.; Shukla, S.; Husak, G.; Rowland, J.; Harrison, L.; Hoell, A. The Climate Hazards Infrared Precipitation with Stations—A New Environmental Record for Monitoring Extremes. Sci. Data 2015, 2, 150066. [Google Scholar] [CrossRef]
  9. Lenka, S.; Devi, R.; Joseph, C.M.; Gouda, K.C. Effect of Large-Scale Oceanic and Atmospheric Processes on the Indian Summer Monsoon. Theor. Appl. Climatol. 2022, 147, 1561–1576. [Google Scholar] [CrossRef]
  10. Jin, Q.; Wei, J.; Yang, Z.-L.; Pu, B.; Huang, J. Consistent Response of Indian Summer Monsoon to Middle East Dust in Observations and Simulations. Atmos. Chem. Phys. 2015, 15, 9897–9915. [Google Scholar] [CrossRef]
  11. Nicholson, S.E. Climate of the Sahel and West Africa. In Oxford Research Encyclopedia of Climate Science; Oxford University Press: Oxford, UK, 2018. [Google Scholar]
  12. Taschetto, A.S.; Ummenhofer, C.C.; Stuecker, M.F.; Dommenget, D.; Ashok, K.; Rodrigues, R.R.; Yeh, S. ENSO Atmospheric Teleconnections. In El Niño Southern Oscillation in a Changing Climate; AGU Publications: Washington, DC, USA, 2020; pp. 309–335. [Google Scholar]
  13. Almazroui, M. The Influence of the Madden–Julian Oscillation on the Wet Season Rainfall over Saudi Arabia. Earth Syst. Environ. 2023, 7, 1–14. [Google Scholar] [CrossRef]
  14. Faraji, M.; Borsato, A.; Frisia, S.; Hartland, A.; Hellstrom, J.C.; Greig, A. High-Resolution Reconstruction of Infiltration in the Southern Cook Islands Based on Trace Elements in Speleothems. Quat. Res. 2024, 118, 20–40. [Google Scholar] [CrossRef]
  15. Founda, D.; Giannakopoulos, C. The Exceptionally Hot Summer of 2007 in Athens, Greece—A Typical Summer in the Future Climate? Glob. Planet. Change 2009, 67, 227–236. [Google Scholar] [CrossRef]
  16. de Vries, A.J.; Tyrlis, E.; Edry, D.; Krichak, S.O.; Steil, B.; Lelieveld, J. Extreme Precipitation Events in the Middle East: Dynamics of the Active Red Sea Trough. J. Geophys. Res. Atmos. 2013, 118, 7087–7108. [Google Scholar] [CrossRef]
  17. Francis, D.; Alshamsi, N.; Cuesta, J.; Gokcen Isik, A.; Dundar, C. Cyclogenesis and Density Currents in the Middle East and the Associated Dust Activity in September 2015. Geosciences 2019, 9, 376. [Google Scholar] [CrossRef]
  18. Francis, D.; Eayrs, C.; Chaboureau, J.; Mote, T.; Holland, D.M. Polar Jet Associated Circulation Triggered a Saharan Cyclone and Derived the Poleward Transport of the African Dust Generated by the Cyclone. J. Geophys. Res. Atmos. 2018, 123, 11–899. [Google Scholar] [CrossRef]
  19. Liu, J.; Wu, D.; Xu, X.; Ji, M.; Chen, Q.; Wang, X. Projection of Extreme Precipitation Induced by Arctic Amplification over the Northern Hemisphere. Environ. Res. Lett. 2021, 16, 74012. [Google Scholar] [CrossRef]
  20. Toté, C.; Patricio, D.; Boogaard, H.; Van Der Wijngaart, R.; Tarnavsky, E.; Funk, C. Evaluation of Satellite Rainfall Estimates for Drought and Flood Monitoring in Mozambique. Remote Sens. 2015, 7, 1758–1776. [Google Scholar] [CrossRef]
  21. Lüning, S.; Vahrenholt, F. Holocene Climate Development of North Africa and the Arabian Peninsula. In The Geology of the Arab World—An Overview; Springer International Publishing: Cham, Switzerland, 2019; pp. 507–546. [Google Scholar]
  22. Charpentier, V.; Méry, S. A Neolithic Settlement near the Strait of Hormuz: Akab Island, United Arab Emirates. Proc. Semin. Arab. Stud. 2008, 38, 117–136. [Google Scholar]
  23. Elnashar, A.; Zeng, H.; Wu, B.; Zhang, N.; Tian, F.; Zhang, M.; Zhu, W.; Yan, N.; Chen, Z.; Sun, Z. Downscaling TRMM Monthly Precipitation Using Google Earth Engine and Google Cloud Computing. Remote Sens. 2020, 12, 3860. [Google Scholar] [CrossRef]
  24. Hochman, A.; Shachar, N.; Gildor, H. Unraveling Sub-Seasonal Precipitation Variability in the Middle East via Indian Ocean Sea Surface Temperature. Sci. Rep. 2024, 14, 2919. [Google Scholar] [CrossRef]
  25. Massoud, E.; Massoud, T.; Guan, B.; Sengupta, A.; Espinoza, V.; De Luna, M.; Raymond, C.; Waliser, D. Atmospheric Rivers and Precipitation in the Middle East and North Africa (MENA). Water 2020, 12, 2863. [Google Scholar] [CrossRef]
  26. Nguyen, P.; Shearer, E.J.; Tran, H.; Ombadi, M.; Hayatbini, N.; Palacios, T.; Huynh, P.; Braithwaite, D.; Updegraff, G.; Hsu, K. The CHRS Data Portal, an Easily Accessible Public Repository for PERSIANN Global Satellite Precipitation Data. Sci. Data 2019, 6, 180296. [Google Scholar] [CrossRef] [PubMed]
  27. Nguyen, P.; Ombadi, M.; Gorooh, V.A.; Shearer, E.J.; Sadeghi, M.; Sorooshian, S.; Hsu, K.; Bolvin, D.; Ralph, M.F. Persiann Dynamic Infrared–Rain Rate (PDIR-Now): A near-Real-Time, Quasi-Global Satellite Precipitation Dataset. J. Hydrometeorol. 2020, 21, 2893–2906. [Google Scholar] [CrossRef] [PubMed]
  28. Hsu, K.L.; Gao, X.; Sorooshian, S.; Gupta, H.V. Precipitation estimation from remotely sensed information using artificial neural networks. J. Appl. Meteorol. 1997, 36, 1176–1190. [Google Scholar] [CrossRef]
  29. Pham, Q.B.; Abba, S.I.; Usman, A.G.; Linh, N.T.T.; Gupta, V.; Malik, A.; Costache, R.; Vo, N.D.; Tri, D.Q. Potential of Hybrid Data-Intelligence Algorithms for Multi-Station Modelling of Rainfall. Water Resour. Manag. 2019, 33, 5067–5087. [Google Scholar] [CrossRef]
  30. Shi, Y. Forecasting Mortality Rates with the Penalized Exponential Smoothing State Space Model. J. Oper. Res. Soc. 2022, 73, 955–968. [Google Scholar] [CrossRef]
  31. Al-Bakri, J.T.; Suleiman, A.S. NDVI Response to Rainfall in Different Ecological Zones in Jordan. Int. J. Remote Sens. 2004, 25, 3897–3912. [Google Scholar] [CrossRef]
  32. P Sabin, T.; Krishnan, R.; Ghattas, J.; Denvil, S.; Dufresne, J.-L.; Hourdin, F.; Pascal, T. High Resolution Simulation of the South Asian Monsoon Using a Variable Resolution Global Climate Model. Clim. Dyn. 2013, 41, 173–194. [Google Scholar] [CrossRef]
  33. Özdemir, S.; Özkan, K.; Mert, A. An Ecological Perspective on Climate Change Scenarios. Biol. Divers. Conserv. 2020, 13, 361–371. [Google Scholar] [CrossRef]
  34. Adloff, F.; Somot, S.; Sevault, F.; Jordà, G.; Aznar, R.; Déqué, M.; Herrmann, M.; Marcos, M.; Dubois, C.; Padorno, E. Mediterranean Sea Response to Climate Change in an Ensemble of Twenty First Century Scenarios. Clim. Dyn. 2015, 45, 2775–2802. [Google Scholar] [CrossRef]
  35. Lelieveld, J.; Proestos, Y.; Hadjinicolaou, P.; Tanarhte, M.; Tyrlis, E.; Zittis, G. Strongly Increasing Heat Extremes in the Middle East and North Africa (MENA) in the 21st Century. Clim. Change 2016, 137, 245–260. [Google Scholar] [CrossRef]
  36. Le, A.M.; Pricope, N.G. Increasing the Accuracy of Runoff and Streamflow Simulation in the Nzoia Basin, Western Kenya, through the Incorporation of Satellite-Derived CHIRPS Data. Water 2017, 9, 114. [Google Scholar] [CrossRef]
  37. Funk, C.; Verdin, A.; Michaelsen, J.; Peterson, P.; Pedreros, D.; Husak, G. A Global Satellite-Assisted Precipitation Climatology. Earth Syst. Sci. Data 2015, 7, 275–287. [Google Scholar] [CrossRef]
  38. Aldughairi, A.A. Climate Change Assessment in Middle and Northern Saudi Arabia: Alarming Trends. DYSONA-Appl. Sci. 2025, 6, 60–69. [Google Scholar]
  39. Ilori, O.W.; Ajayi, V.O. Change Detection and Trend Analysis of Future Temperature and Rainfall over West Africa. Earth Syst. Environ. 2020, 4, 493–512. [Google Scholar] [CrossRef]
  40. Vinoj, V.; Rasch, P.J.; Wang, H.; Yoon, J.-H.; Ma, P.-L.; Landu, K.; Singh, B. Short-Term Modulation of Indian Summer Monsoon Rainfall by West Asian Dust. Nat. Geosci. 2014, 7, 308–313. [Google Scholar] [CrossRef]
  41. Solmon, F.; Nair, V.S.; Mallet, M. Increasing Arabian Dust Activity and the Indian Summer Monsoon. Atmos. Chem. Phys. 2015, 15, 8051–8064. [Google Scholar] [CrossRef]
  42. Jin, Q.; Wei, J.; Lau, W.K.M.; Pu, B.; Wang, C. Interactions of Asian Mineral Dust with Indian Summer Monsoon: Recent Advances and Challenges. Earth-Sci. Rev. 2021, 215, 103562. [Google Scholar] [CrossRef]
  43. Abo-Monasar, A.; Al-Zahrani, M.A. Estimation of Rainfall Distribution for the Southwestern Region of Saudi Arabia. Hydrol. Sci. J. 2014, 59, 420–431. [Google Scholar] [CrossRef]
  44. World Bank Publications. Turn Down the Heat: Confronting the New Climate Normal; World Bank Publications: Washington, DC, USA, 2014; ISBN 1464804370. [Google Scholar]
  45. Ebrahim, M.F.; Meisner, C.M. Sustainable Land Management and Restoration in the Middle East and North Africa Region: Issues, Challenges, and Recommendations; World Bank Group: Washington, DC, USA, 2019. [Google Scholar]
  46. Pal, J.S.; Eltahir, E.A.B. Future Temperature in Southwest Asia Projected to Exceed a Threshold for Human Adaptability. Nat. Clim. Change 2016, 6, 197–200. [Google Scholar] [CrossRef]
  47. Brown, O.; Crawford, A. Climate Change and Security in Africa; International Institute for Sustainable Development: Winnipeg, MB, Canada, 2009. [Google Scholar]
  48. Sheppard, C.; Al-Husiani, M.; Al-Jamali, F.; Al-Yamani, F.; Baldwin, R.; Bishop, J.; Benzoni, F.; Dutrieux, E.; Dulvy, N.K.; Durvasula, S.R.V.; et al. The Gulf: A Young Sea in Decline. Mar. Pollut. Bull. 2010, 60, 13–38. [Google Scholar] [CrossRef] [PubMed]
  49. Bucchignani, E.; Mercogliano, P.; Rianna, G.; Panitz, H. Analysis of ERA-Interim-driven COSMO-CLM Simulations over Middle East–North Africa Domain at Different Spatial Resolutions. Int. J. Climatol. 2016, 36, 3346–3369. [Google Scholar] [CrossRef]
  50. Xue, P.; Eltahir, E.A.B. Estimation of the Heat and Water Budgets of the Persian (Arabian) Gulf Using a Regional Climate Model. J. Clim. 2015, 28, 5041–5062. [Google Scholar] [CrossRef]
  51. Almazroui, M.; Islam, M.N.; Jones, P.D.; Athar, H.; Rahman, M.A. Recent Climate Change in the Arabian Peninsula: Seasonal Rainfall and Temperature Climatology of Saudi Arabia for 1979–2009. Atmos. Res. 2012, 111, 29–45. [Google Scholar] [CrossRef]
  52. Evans, J.P. 21st Century Climate Change in the Middle East. Clim. Change 2009, 92, 417–432. [Google Scholar] [CrossRef]
  53. Nashwan, M.S.; Shahid, S.; Dewan, A.; Ismail, T.; Alias, N. Performance of Five High Resolution Satellite-Based Precipitation Products in Arid Region of Egypt: An Evaluation. Atmos. Res. 2020, 236, 104809. [Google Scholar] [CrossRef]
  54. Swetnam, T.W.; Lynch, A.M. Multicentury, Regional-scale Patterns of Western Spruce Budworm Outbreaks. Ecol. Monogr. 1993, 63, 399–424. [Google Scholar] [CrossRef]
  55. Nguyen, P.; Ombadi, M.; Sorooshian, S.; Hsu, K.; AghaKouchak, A.; Braithwaite, D.; Ashouri, H.; Thorstensen, A.R. The PERSIANN Family of Global Satellite Precipitation Data: A Review and Evaluation of Products. Hydrol. Earth Syst. Sci. 2018, 22, 5801–5816. [Google Scholar] [CrossRef]
  56. Moltz, J. The Politics of Space Security: Strategic Restraint and the Pursuit of National Interests; Stanford University Press: Redwood City, CA, USA, 2011; ISBN 0804778582. [Google Scholar]
  57. Waha, K.; Krummenauer, L.; Adams, S.; Aich, V.; Baarsch, F.; Coumou, D.; Fader, M.; Hoff, H.; Jobbins, G.; Marcus, R.; et al. Climate Change Impacts in the Middle East and Northern Africa (MENA) Region and Their Implications for Vulnerable Population Groups. Reg. Environ. Change 2017, 17, 1623–1638. [Google Scholar] [CrossRef]
  58. Musa, Z.N.; Popescu, I.; Mynett, A. A Review of Applications of Satellite SAR, Optical, Altimetry and DEM Data for Surface Water Modelling, Mapping and Parameter Estimation. Hydrol. Earth Syst. Sci. 2015, 19, 3755–3769. [Google Scholar] [CrossRef]
  59. Osborn, T.; Barichivich, J.; Harris, I.; van der Schrier, G.; Jones, P. Monitoring Global Drought Using the Self-Calibrating Palmer Drought Severity Index [in “State of the Climate in 2016”]. Bull. Am. Meteorol. Soc. 2017, 98, S32–S33. [Google Scholar]
  60. Namdari, S.; Karimi, N.; Sorooshian, A.; Mohammadi, G.; Sehatkashani, S. Impacts of Climate and Synoptic Fluctuations on Dust Storm Activity over the Middle East. Atmos. Environ. 2018, 173, 265–276. [Google Scholar] [CrossRef] [PubMed]
  61. Kantoush, S.A.; Saber, M.; Abdel-Fattah, M.; Sumi, T. Integrated Strategies for the Management of Wadi Flash Floods in the Middle East and North Africa (MENA) Arid Zones: The ISFF Project. In Wadi Flash Floods: Challenges and Advanced Approaches for Disaster Risk Reduction; Springer: Berlin/Heidelberg, Germany, 2022; pp. 3–34. [Google Scholar]
  62. Thakur, D.A.; Mohanty, M.P. Exploring the Fidelity of Satellite Precipitation Products in Capturing Flood Risks: A Novel Framework Incorporating Hazard and Vulnerability Dimensions over a Sensitive Coastal Multi-Hazard Catchment. Sci. Total Environ. 2024, 920, 170884. [Google Scholar] [CrossRef]
  63. Katiraie-Boroujerdy, P.-S.; Asanjan, A.A.; Hsu, K.; Sorooshian, S. Intercomparison of PERSIANN-CDR and TRMM-3B42V7 Precipitation Estimates at Monthly and Daily Time Scales. Atmos. Res. 2017, 193, 36–49. [Google Scholar] [CrossRef]
  64. Garreaud, R.D. Record-Breaking Climate Anomalies Lead to Severe Drought and Environmental Disruption in Western Patagonia in 2016. Clim. Res. 2018, 74, 217–229. [Google Scholar] [CrossRef]
  65. Levizzani, V.; Amorati, R.; Meneguzzo, F. A Review of Satellite-Based Rainfall Estimation Methods; Consiglio Nazionale delle Ricerche Istituto di Scienze dell’Atmosfera e del Clima: Bologna, Italy, 2002. [Google Scholar]
  66. Hanjra, M.A.; Qureshi, M.E. Global Water Crisis and Future Food Security in an Era of Climate Change. Food Policy 2010, 35, 365–377. [Google Scholar] [CrossRef]
  67. Paul, V.K.; Rastogi, A.; Dua, S.; Basu, C. Healthcare Infrastructure, Resilience and Climate Change: Preparing for Extreme Weather Events; Routledge: London, UK, 2023; ISBN 1003393101. [Google Scholar]
  68. Burt, J.A. Managing the Growing Impacts of Development on Fragile Coastal and Marine Systems: Lessons from the Gulf; UNU-INWEH: Hamilton, ON, Canada, 2011. [Google Scholar]
  69. Fayssal, F. Sustainable Water Management in Naturally Deforested Regions & Proportional Accreditation: UAE Case Study. Int. J. Environ. Eng. Dev. 2024, 2, 269–282. [Google Scholar]
  70. Ghanem, A.M.; Alamri, Y.A. The Impact of the Green Middle East Initiative on Sustainable Development in the Kingdom of Saudi Arabia. J. Saudi Soc. Agric. Sci. 2023, 22, 35–46. [Google Scholar] [CrossRef]
  71. Agarwal, P.K. Climate Change: Implications for Indian Agriculture. Jalvigyan Sameeksha 2007, 22, 37–46. [Google Scholar]
  72. Khedher, K.M.; Abu-Taweel, G.M.; Al-Fifi, Z.; Qoradi, M.D.; Al-Khafaji, Z.; Halder, B.; Bandyopadhyay, J.; Shahid, S.; Essaied, L.; Yaseen, Z.M. Farasan Island of Saudi Arabia Confronts the Measurable Impacts of Global Warming in 45 Years. Sci. Rep. 2022, 12, 14322. [Google Scholar] [CrossRef]
  73. Agha, H.M.; Alkamil, A.A.; Yahya, R.T.; Mohammed, A.A.; Ali, Z.T.; Alsayadi, M.M.S. Consequences of Global Climate Change on Biodiversity and Food Security: A Mini Review. AUIQ Complement. Biol. Syst. 2024, 1, 43–51. [Google Scholar] [CrossRef]
Figure 1. Location map of selected countries for seasonal rainfall variation from 2000 to 2023 from CHIRPS data (used datasets are CHIRPS and PERSIANN).
Water 17 01475 g001
Figure 2. The methodology adopted in this study by CHIRPS and PERSIANN rainfall data.
Water 17 01475 g002
Figure 3. Seasonal rainfall variation from CHIRPS data for Saudi Arabia, Iraq, and Iran.
Water 17 01475 g003
Figure 4. Seasonal rainfall variation from PERSIANN data for Saudi Arabia, Iraq, and Iran.
Water 17 01475 g004
Figure 5. Seasonal rainfall variation CHIRPS data for Jordan, Kuwait, and Syria.
Water 17 01475 g005
Figure 6. Seasonal rainfall variation PERSIANN data for Jordan, Kuwait, and Syria.
Water 17 01475 g006
Figure 7. Seasonal rainfall variation from CHIRPS data of UAE, Qatar, Bahrain, Oman, and Yemen.
Water 17 01475 g007
Figure 8. Seasonal rainfall variation from PERSIANN data of UAE, Qatar, Bahrain, Oman, and Yemen.
Water 17 01475 g008
Figure 9. The point-wise seasonal rainfall variation of the eleven selected countries in Asia.
Water 17 01475 g009
Figure 10. Rainfall anomaly from 2000 to 2023 derived from CHIRPS data.
Water 17 01475 g010
Figure 11. Rainfall anomaly from 2000 to 2023 derived from PERSIANN data.
Water 17 01475 g011
Figure 12. Rainfall anomaly from 2000 to 2023 derived from CHIRPS and PERSIANN data.
Water 17 01475 g012
Figure 13. Rainfall forecasting based on ARIMA and ETS models (CHIRPS and PERSIANN data).
Water 17 01475 g013
Figure 14. ARIMA and ETS forecast accuracy analysis using actual and predicted values derived from 80% and 20% training and testing data in R programming.
Water 17 01475 g014
Table 1. Seasonal rainfall values from 2000 to 2023 in study area (max, min, and mean).
Sl. No. 1CountryDJFMAMJJASON
MaxMinMeanMaxMinMeanMaxMinMeanMaxMinMean
CHIRPS dataSaudi Arabia509.640.06254.85110.950.0655.5179.380.0239.7184.260.0392.15
Iraq141.083.672.34115.40.3157.8620.390.0110.2211.54.89108.2
Iran191.560.0295.79155.840.0777.96276.960.1138.53306.350.03153.19
Jordan161.280.7481.0120.880.1310.510.380.010.298.082.5150.3
Kuwait20.492.7411.626.180.493.340.730.010.3744.6619.2631.96
Syria246.513.12124.8245.184.7624.9715.930.027.98208.5914.59111.59
UAE-Qatar-
Bahrain
20.152.6911.429.620.314.9713.830.016.9228.620.7214.67
Oman15.40.017.7155.990.2328.1164.90.0232.4614.760.017.39
Yemen57.60.0128.81222.210.06111.14154.070.0277.05240.270.13120.2
Sl. No. 21CountryDJFMAMJJASON
MaxMinMeanMaxMinMeanMaxMinMeanMaxMinMean
PERSIANN dataSaudi Arabia419.510.19209.85216.520.2108.3671.60.1935.9171.70.285.95
Iraq130.890.265.55104.812.0858.44000157.792.6380.21
Iran102.910.1951.55118.280.2259.25188.140.1994.17244.280.47122.38
Jordan107.020.3253.6732.1710.0521.1100073.821.5337.68
Kuwait12.810.216.5140.2310.0625.1500036.5111.4723.99
Syria196.685.3100.9950.986.2628.62000149.31.975.6
UAE-Qatar-
Bahrain
12.530.236.3823.220.3911.815.840.23.0229.640.2214.93
Oman12.940.196.5742.580.1921.3943.320.2221.7732.620.2116.42
Yemen45.650.222.93356.540.26178.4247.750.2123.9860.480.230.34
Table 2. Error matrix of ARIMA, ETS, and average models for both rainfall datasets.
DataModelError Matrix
MERMSEMAEMPEMAPEACF1
CHIRPSARIMA0.2110.4910.339−5.1682.8710.353
Average−0.2940.5840.348−2.1423.4850.314
ETS−0.2490.6030.419−2.5203.9540.461
PERSIANNARIMA−0.2371.2140.977−0.8332.9180.440
Average−0.3361.0470.858−1.1042.5700.359
ETS−0.4350.9840.807−1.3742.4200.304
Disclaimer/Publisher’s Note: The statements, opinions and data contained in all publications are solely those of the individual author(s) and contributor(s) and not of MDPI and/or the editor(s). MDPI and/or the editor(s) disclaim responsibility for any injury to people or property resulting from any ideas, methods, instructions or products referred to in the content.

