
Remote Sensing Identification of Harmful Algae in Ulansuhai Lake with Machine Learning

Abstract
1. Introduction
2. Materials and Methods
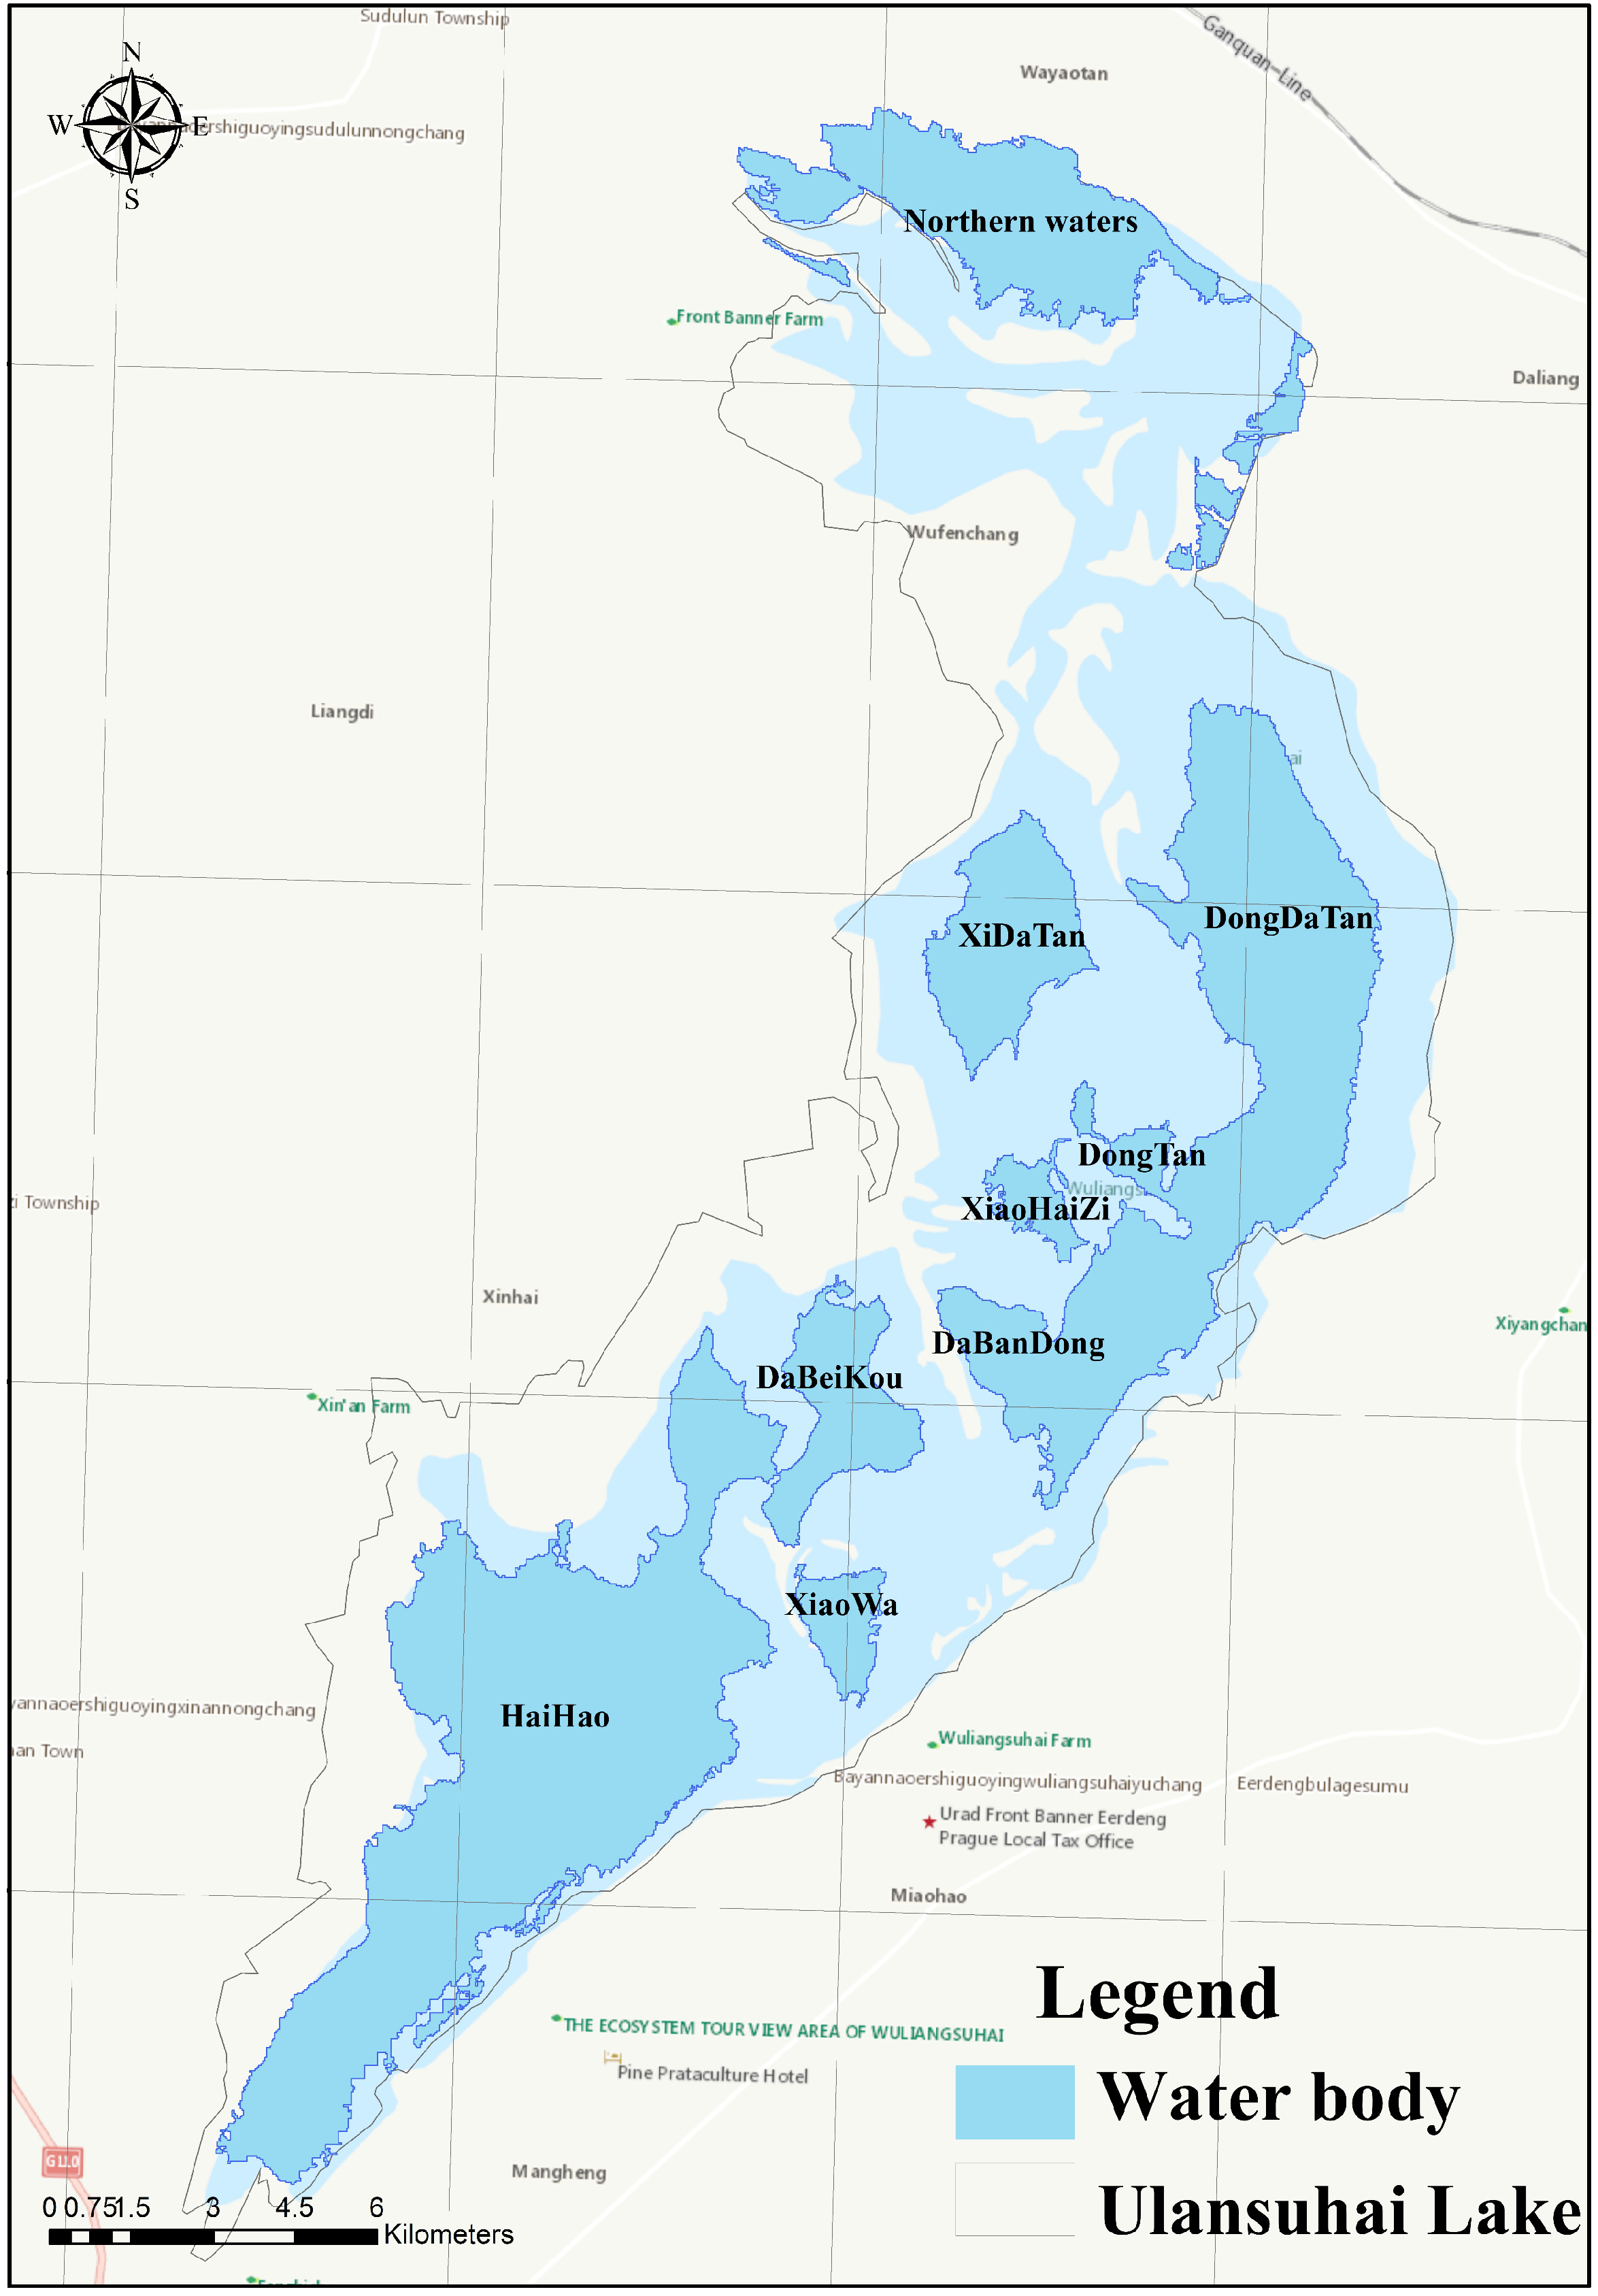
2.1. Study Area
2.2. Data
2.2.1. Remote Sensing Image Data
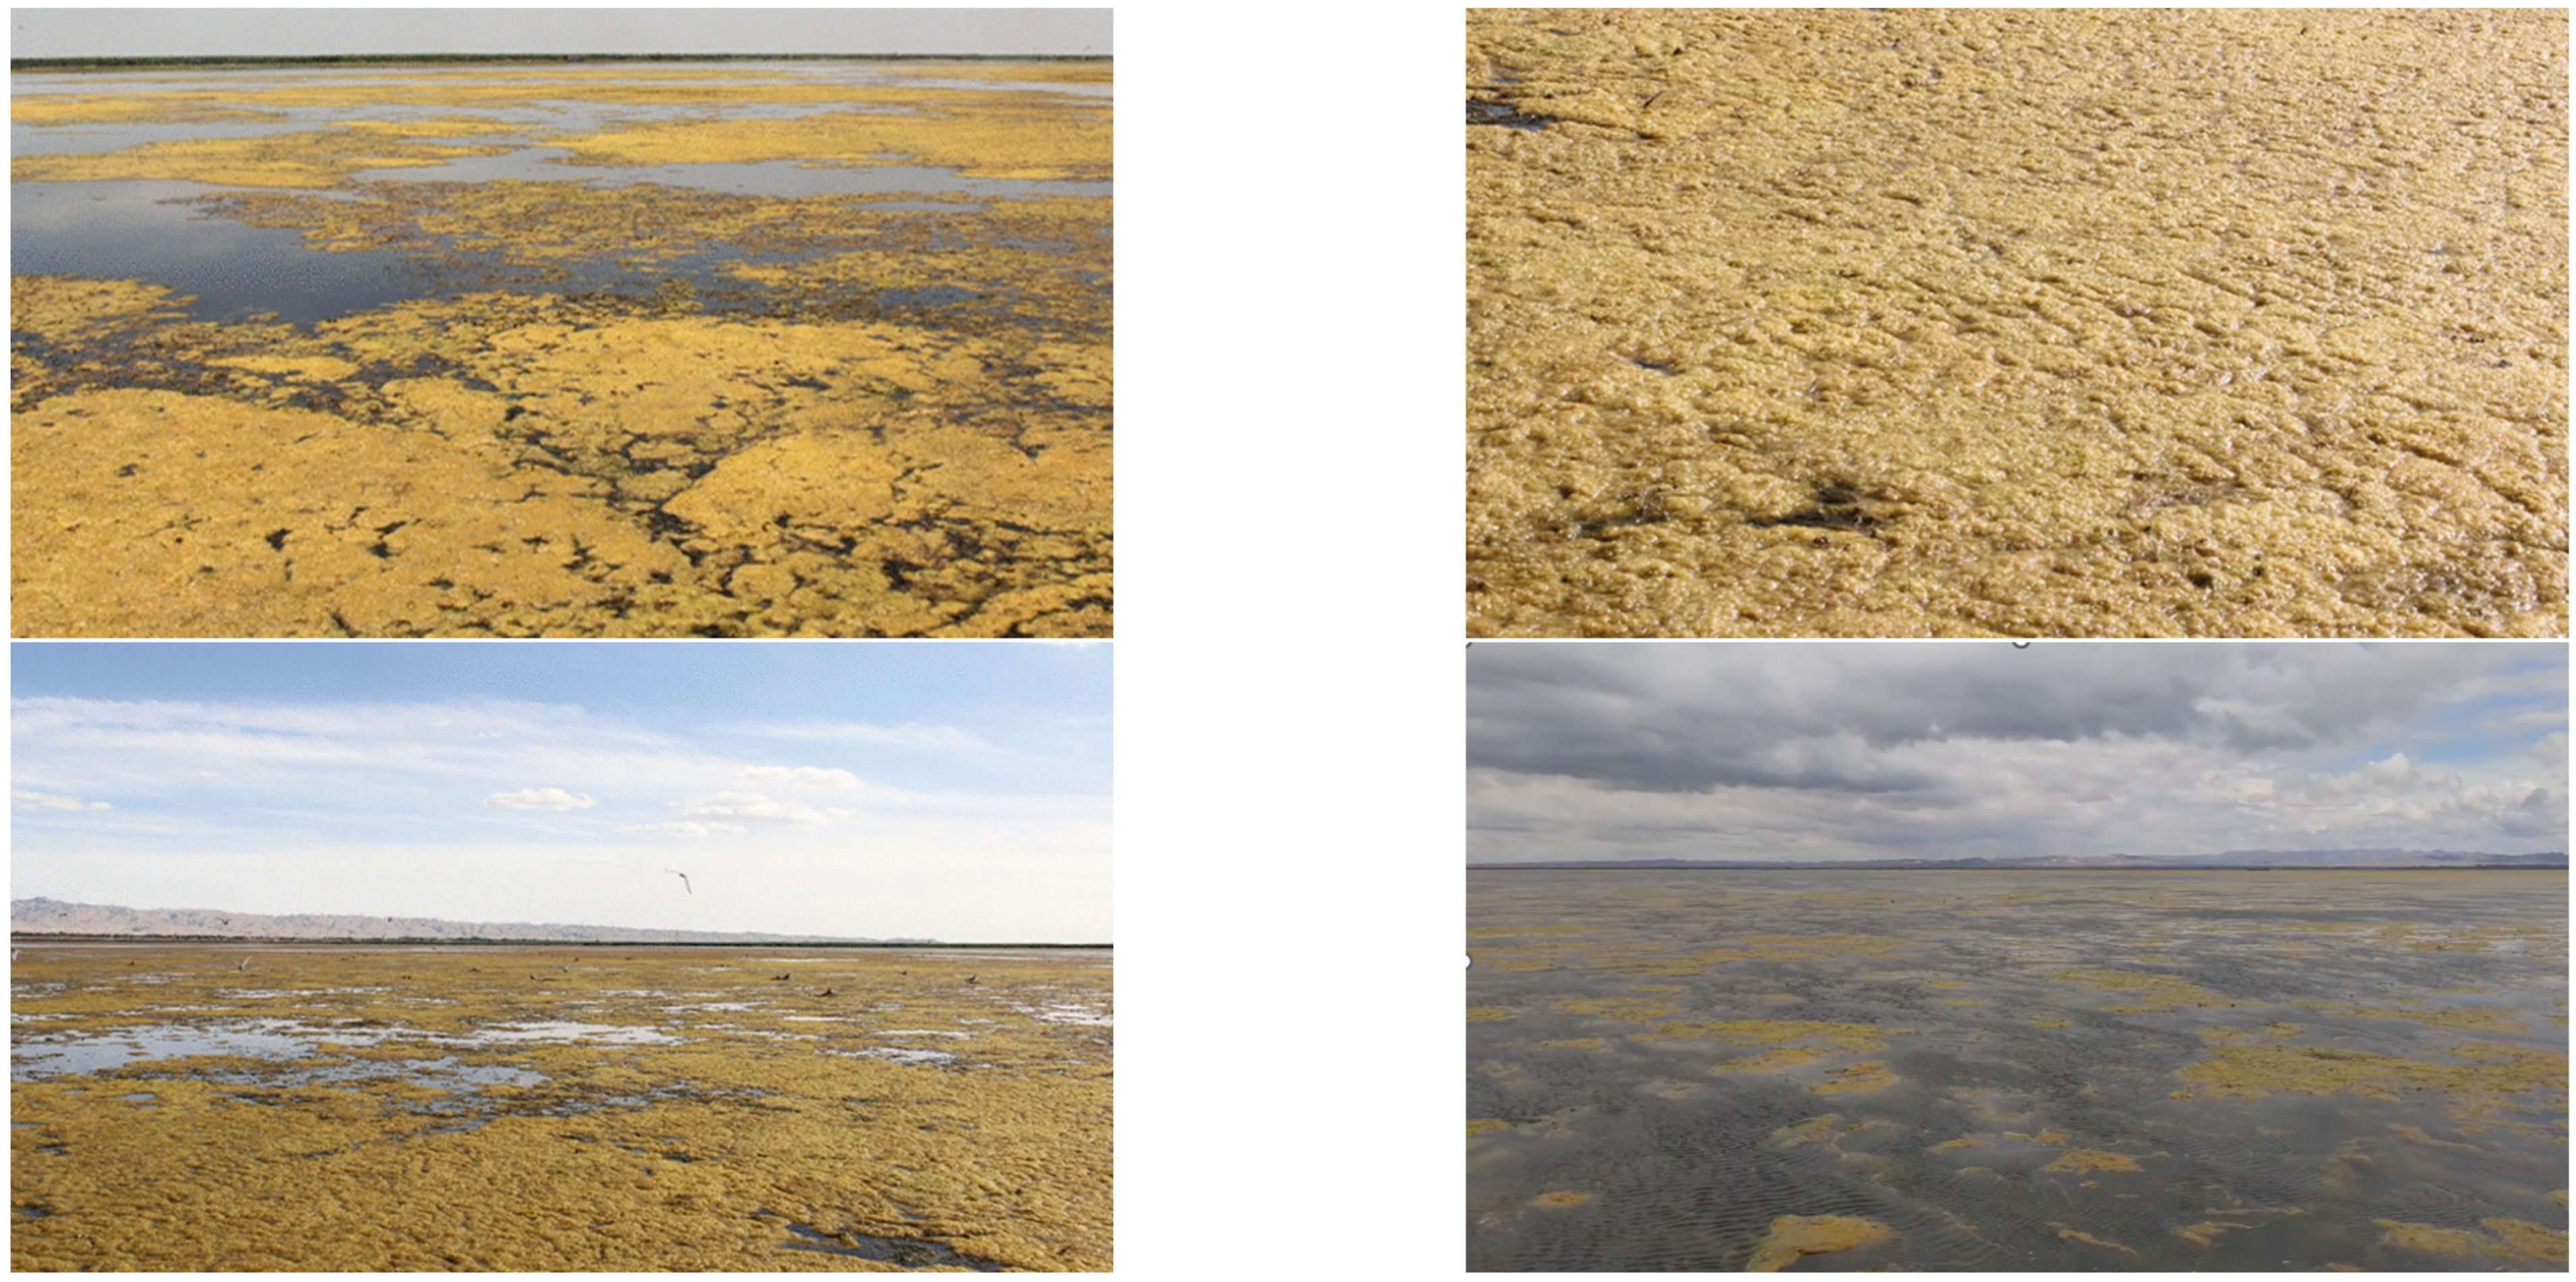
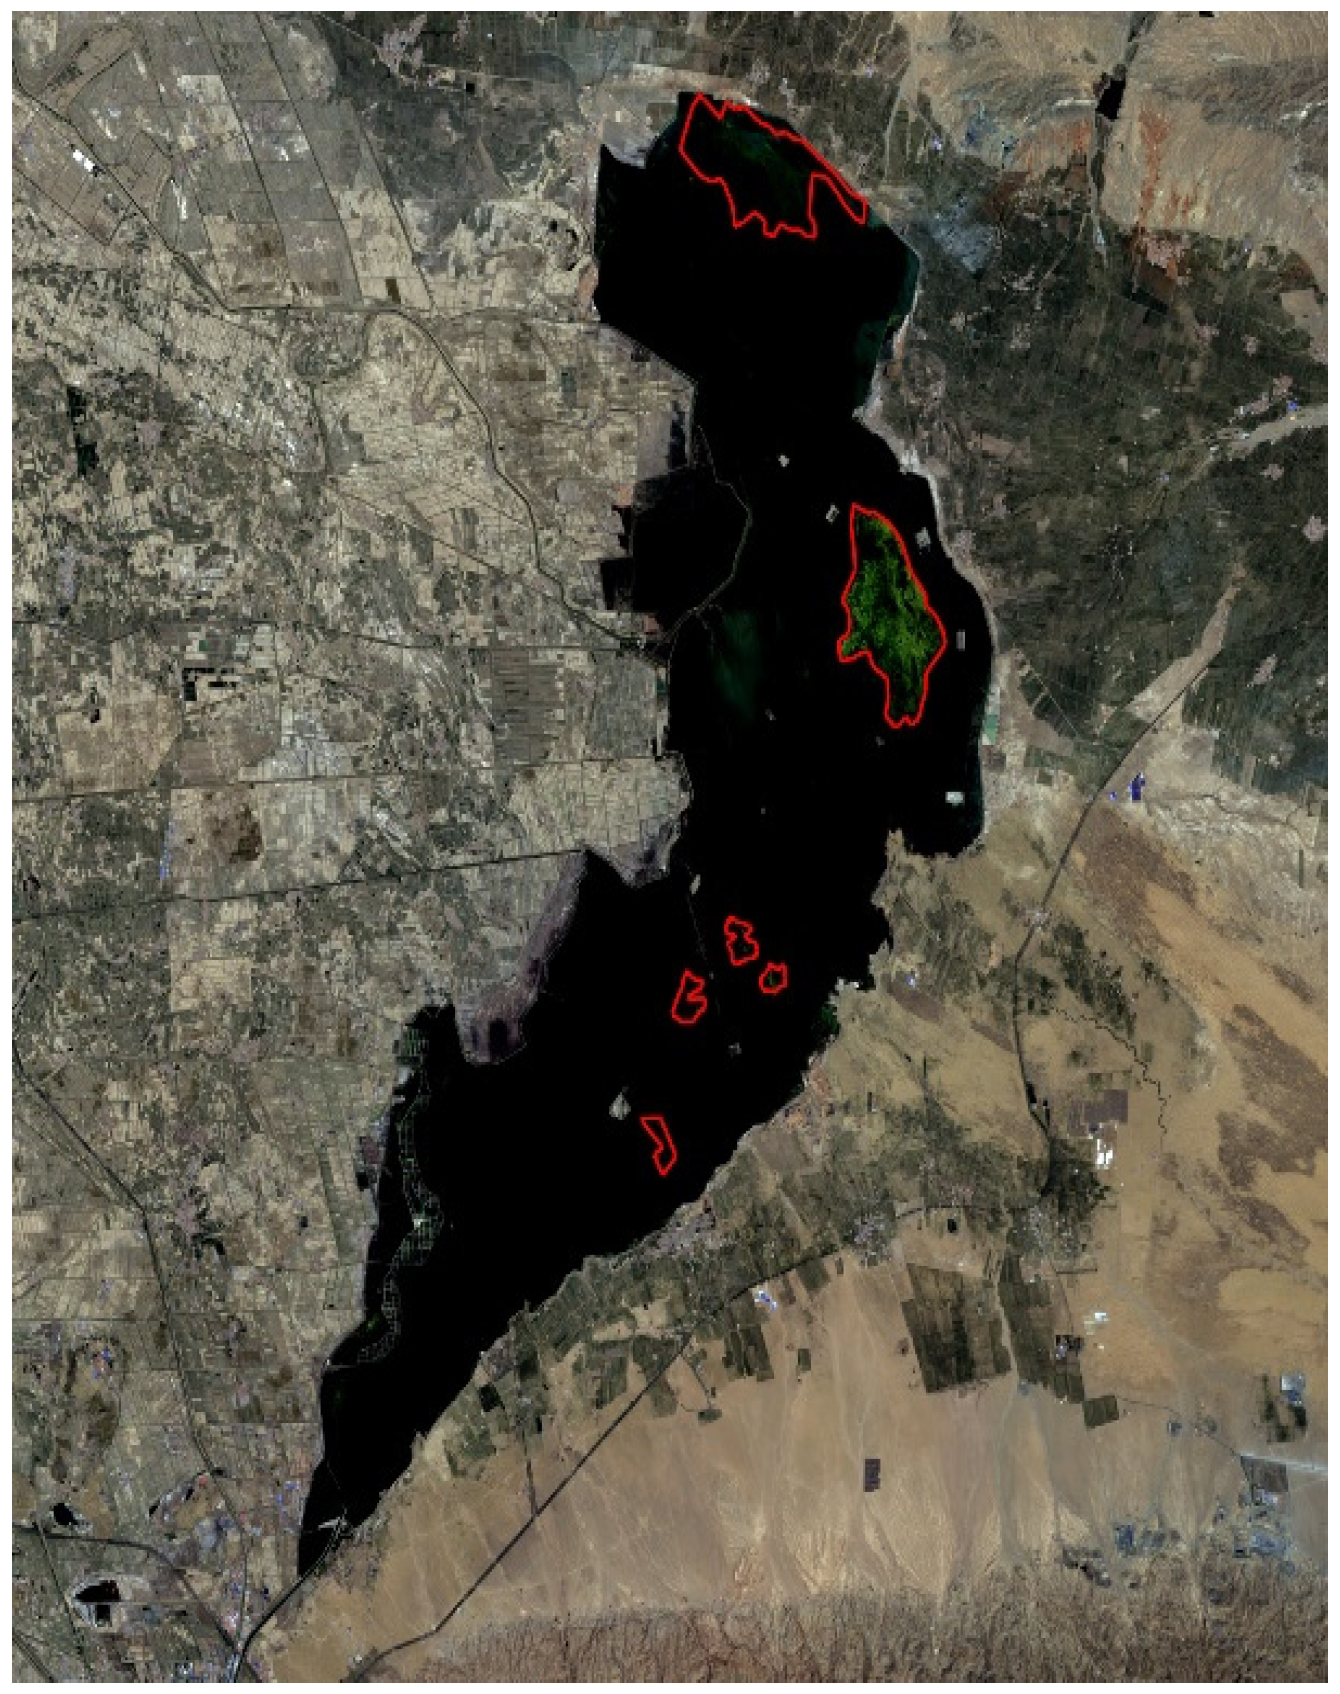
2.2.2. Huangtai Algae Aerial Data
2.3. Model
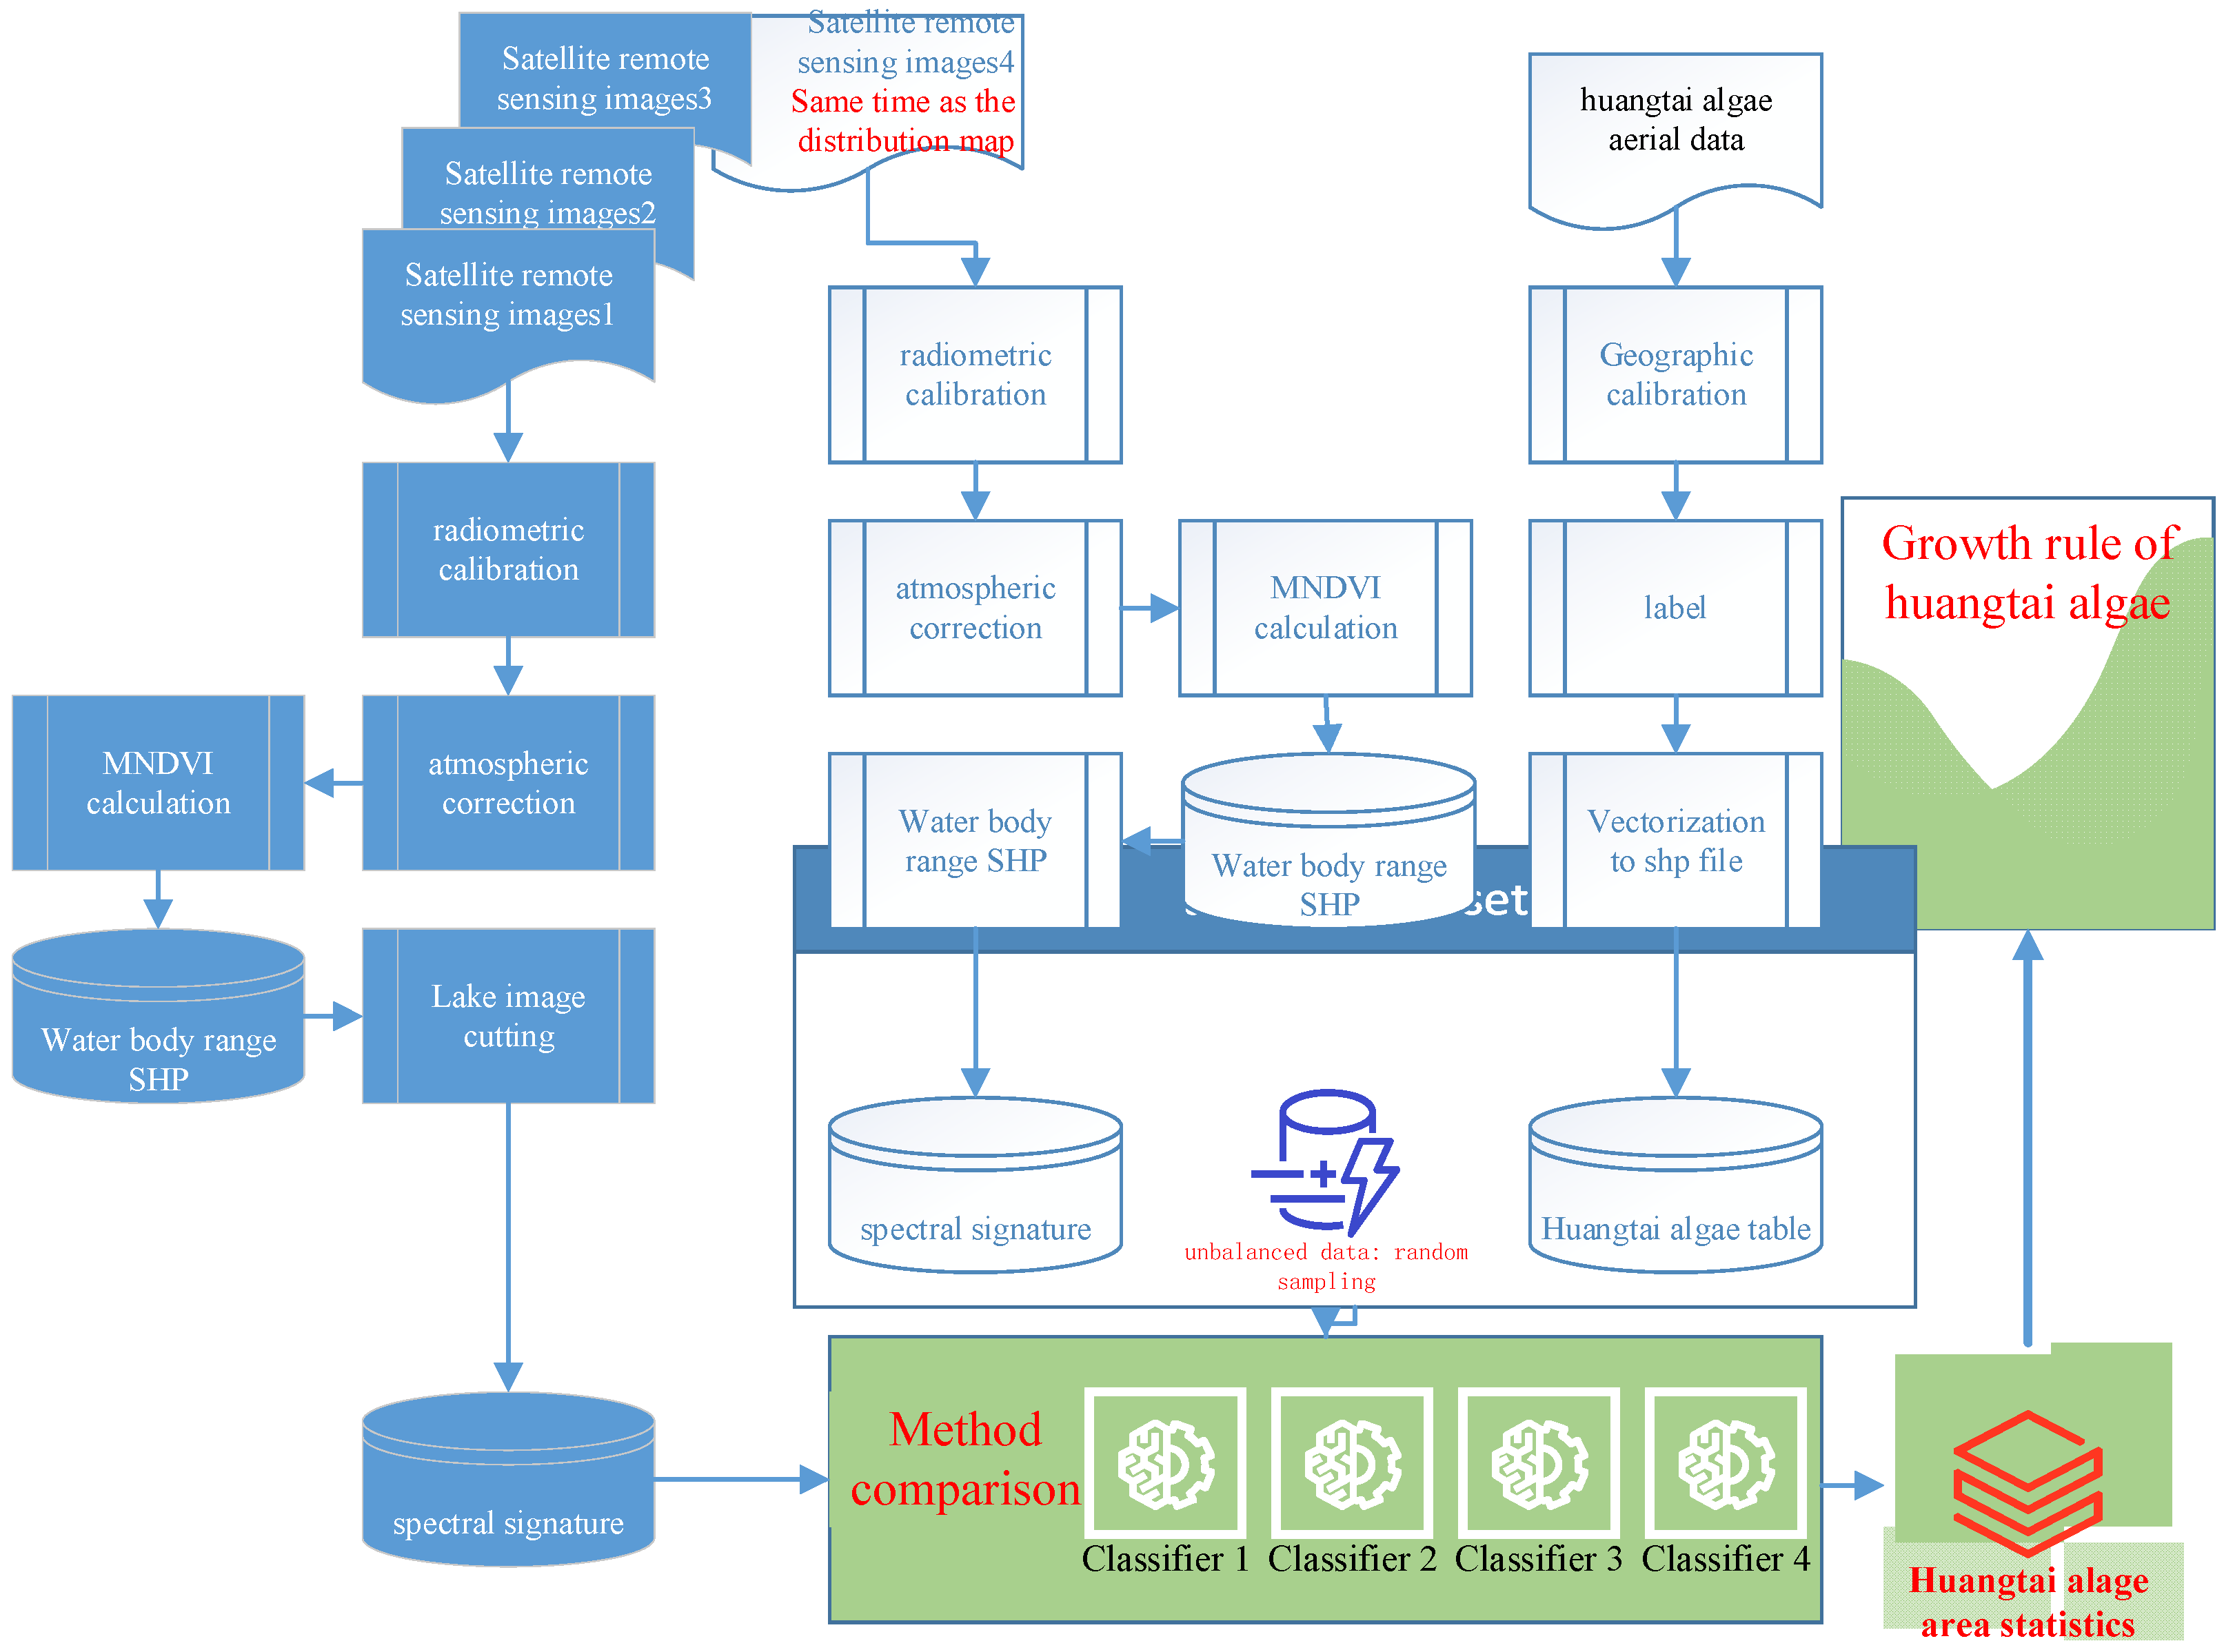
2.3.1. Workflow
2.3.2. Preprocessing of Remote Sensing Data
- (1)
- Radiometric calibration
- (2)
- Atmospheric correction
- (3)
- MNDWI was used to separate water from land and extract water bodies
- (4)
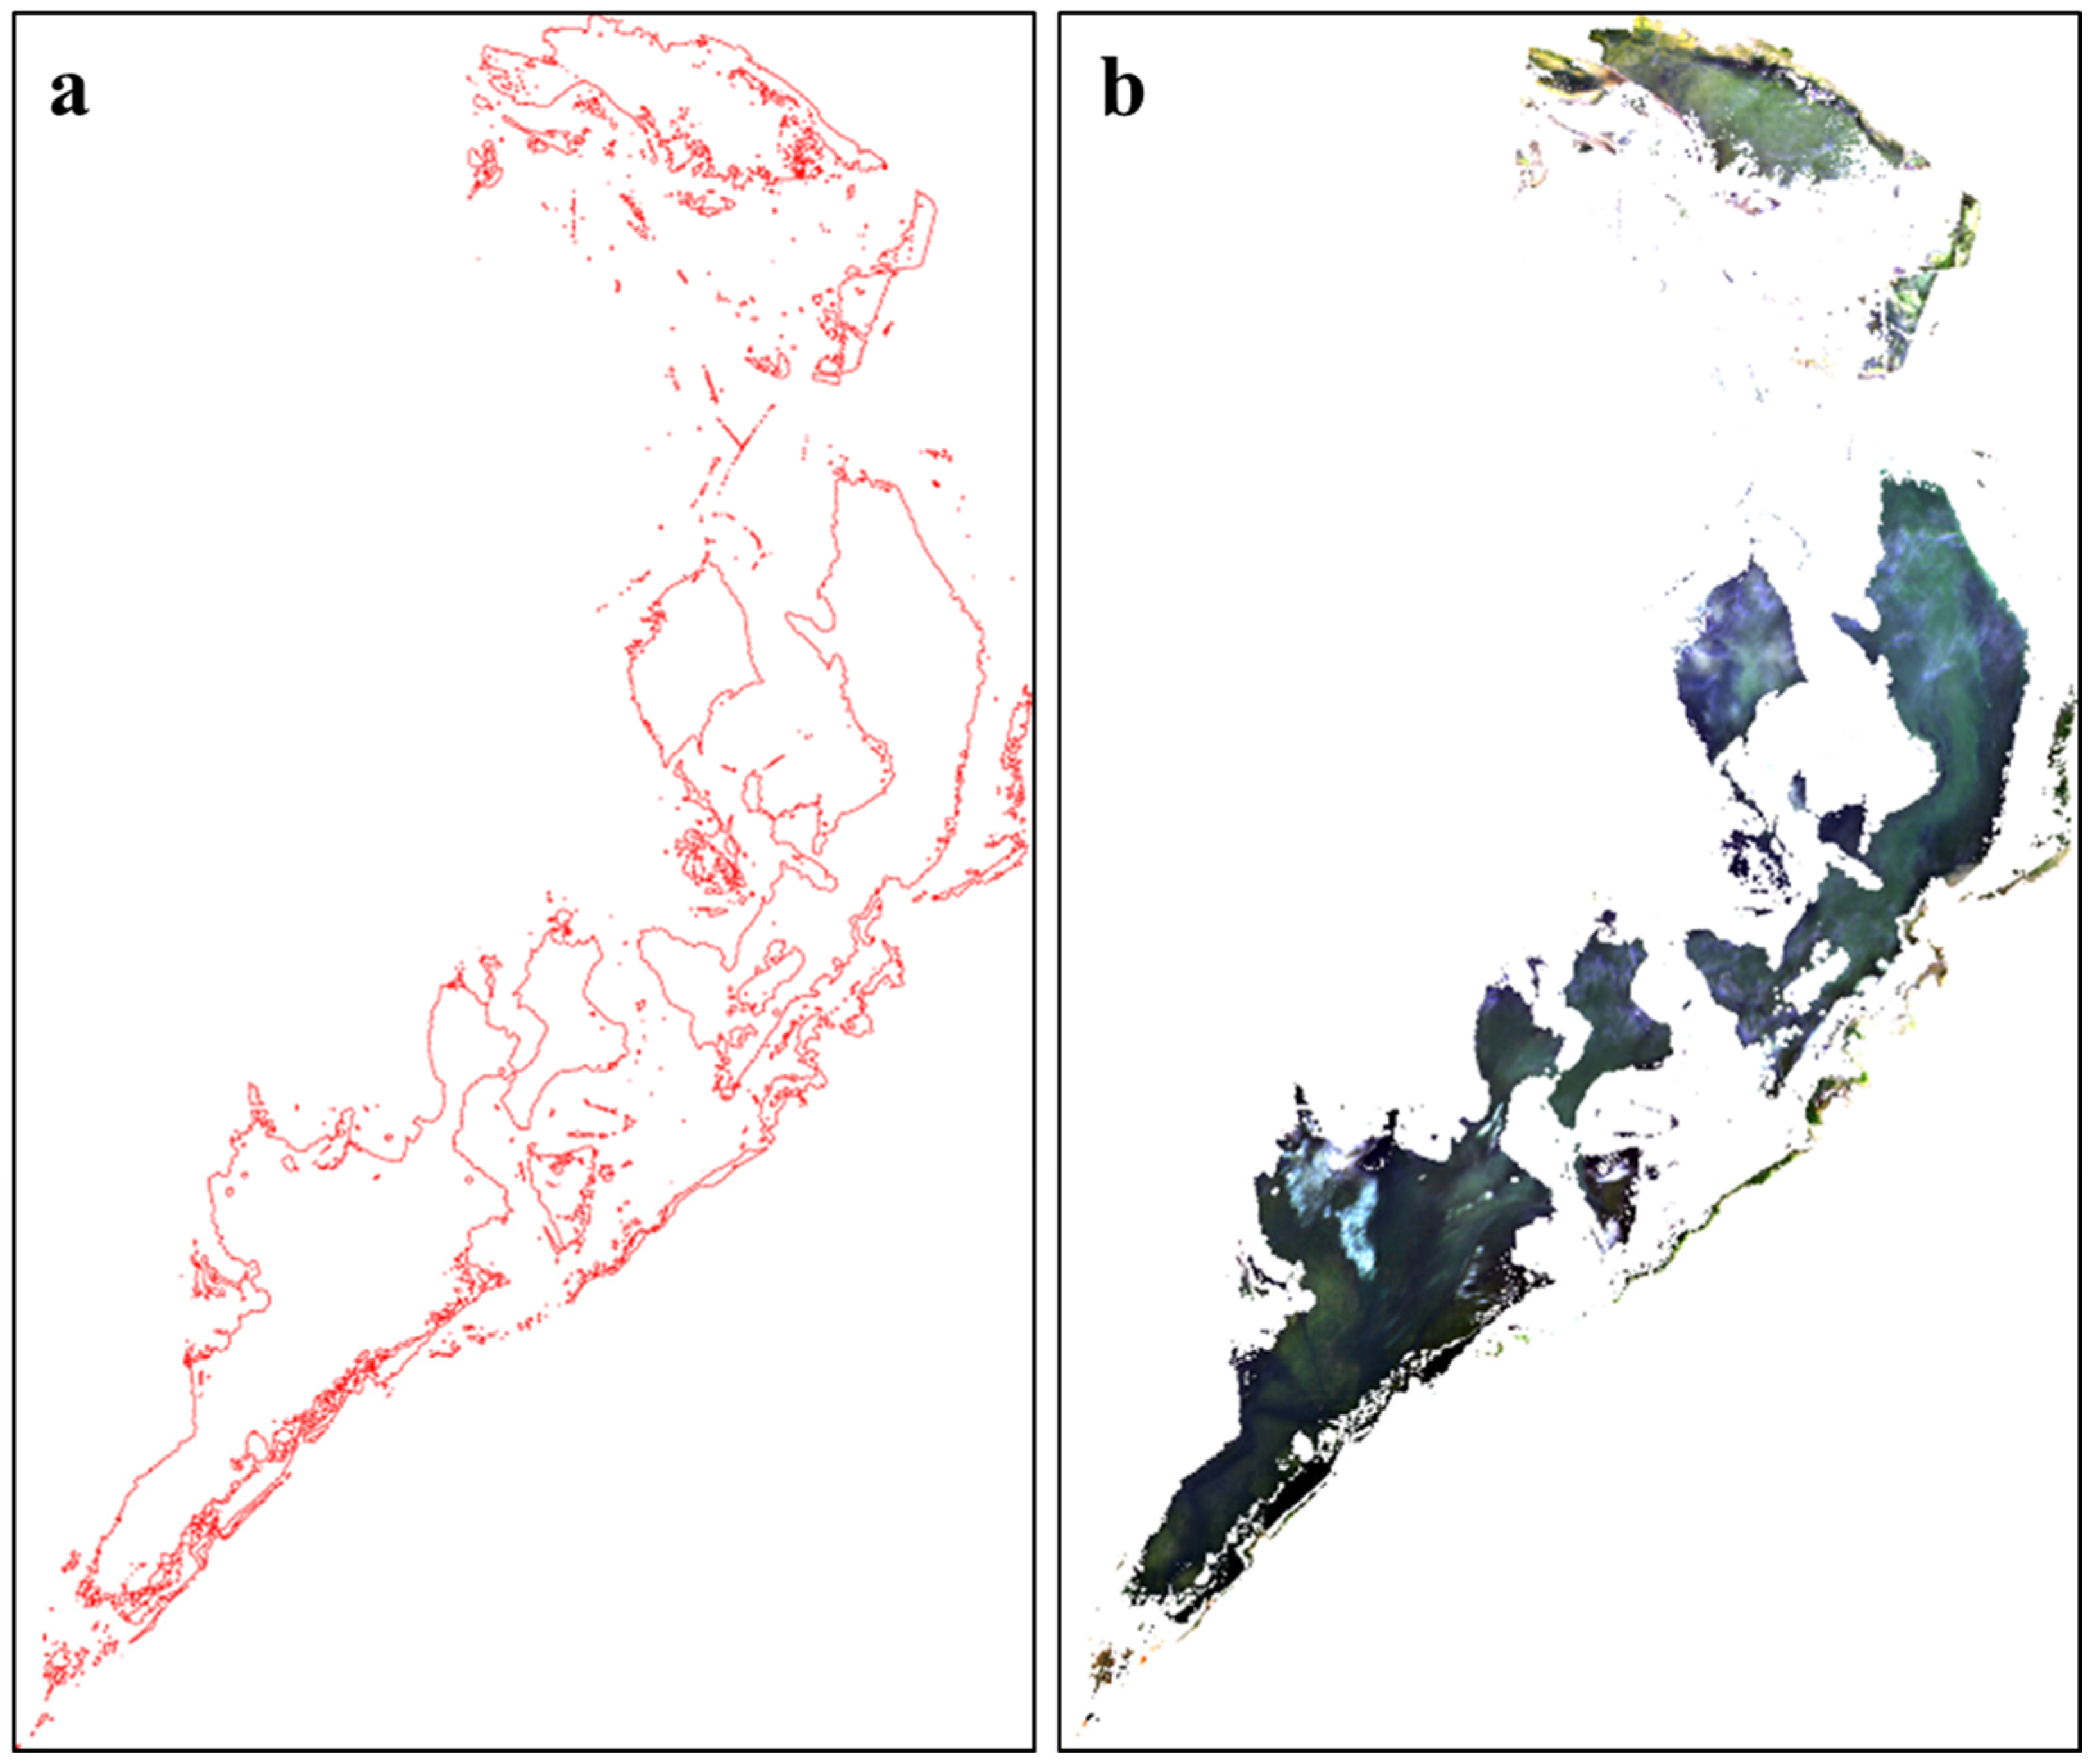
- UAV monitoring image registration
- (5)
- Huangtai algae vectorization
2.3.3. Research Methods
- (1)
- Random forest
- (2)
- Decision tree model
- (3)
- K Nearest Neighbor
- (4)
- Support vector machine
- (5)
- Naive Bayes
- (6)
- Linear discriminant analysis
3. Result and Discussion
3.1. Prediction Accuracy and Model Selection
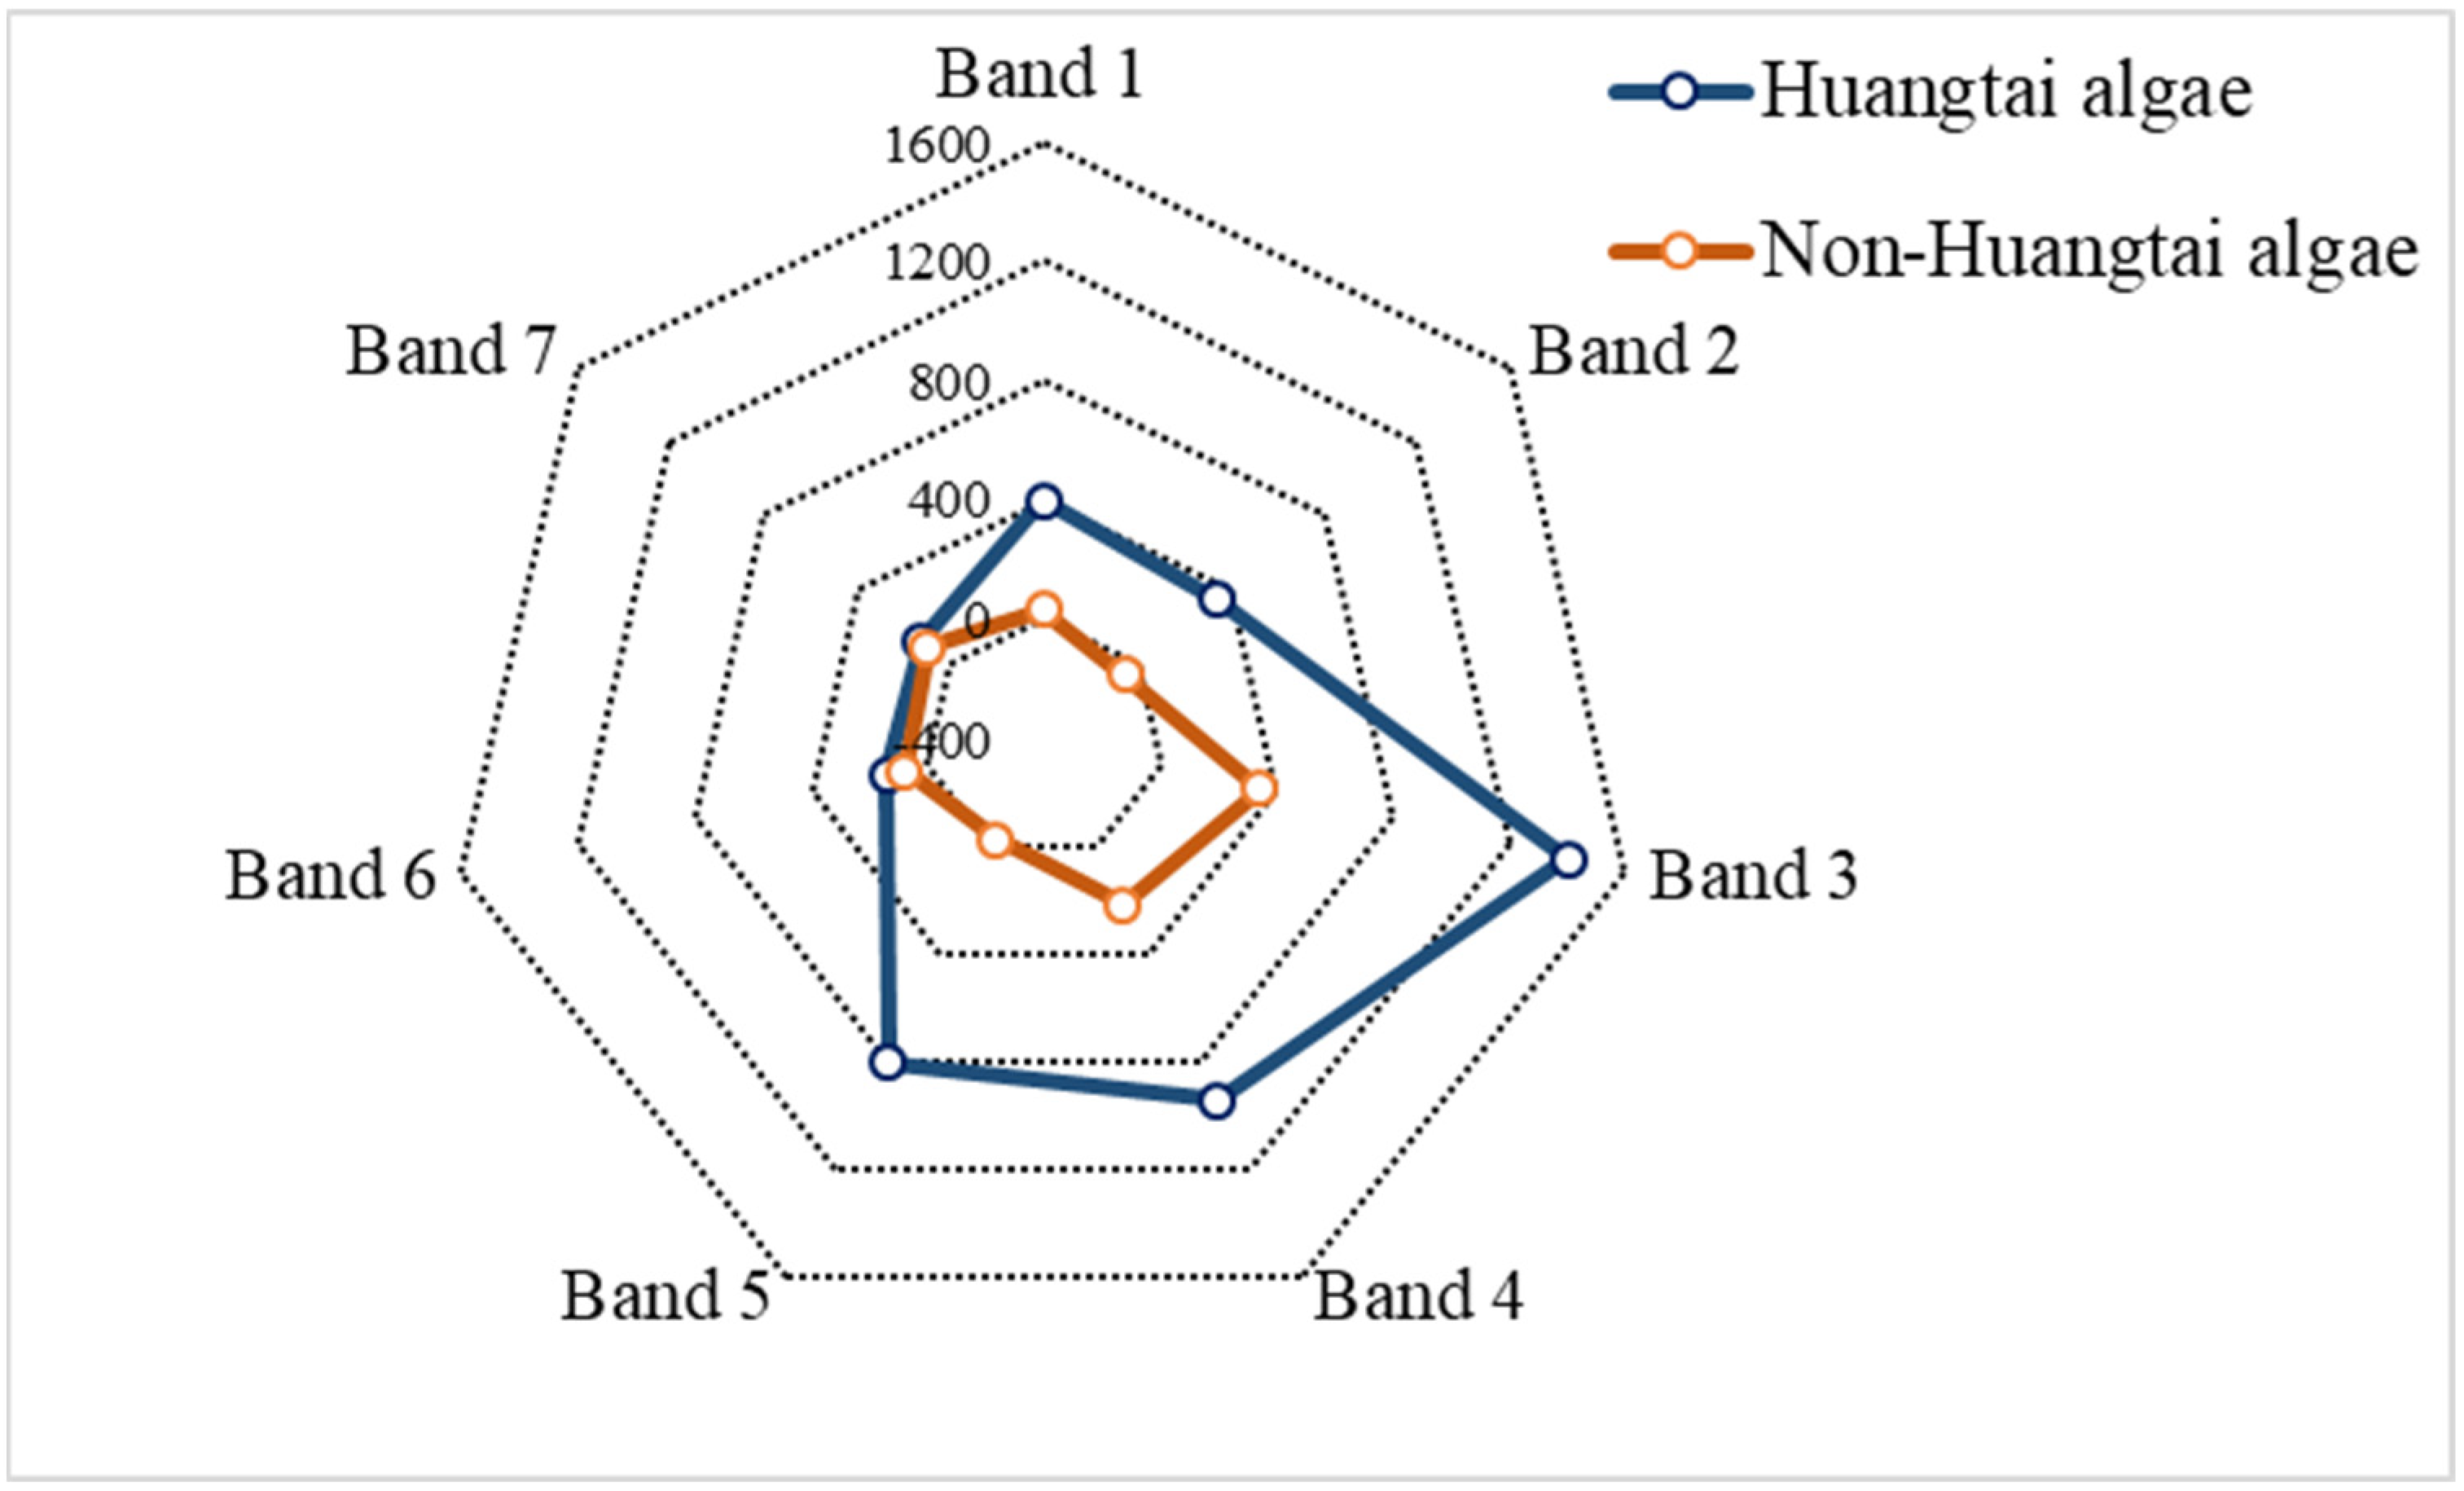
3.2. Feature Importance Analysis
3.3. Classification
3.3.1. Verification of the Open Water Area
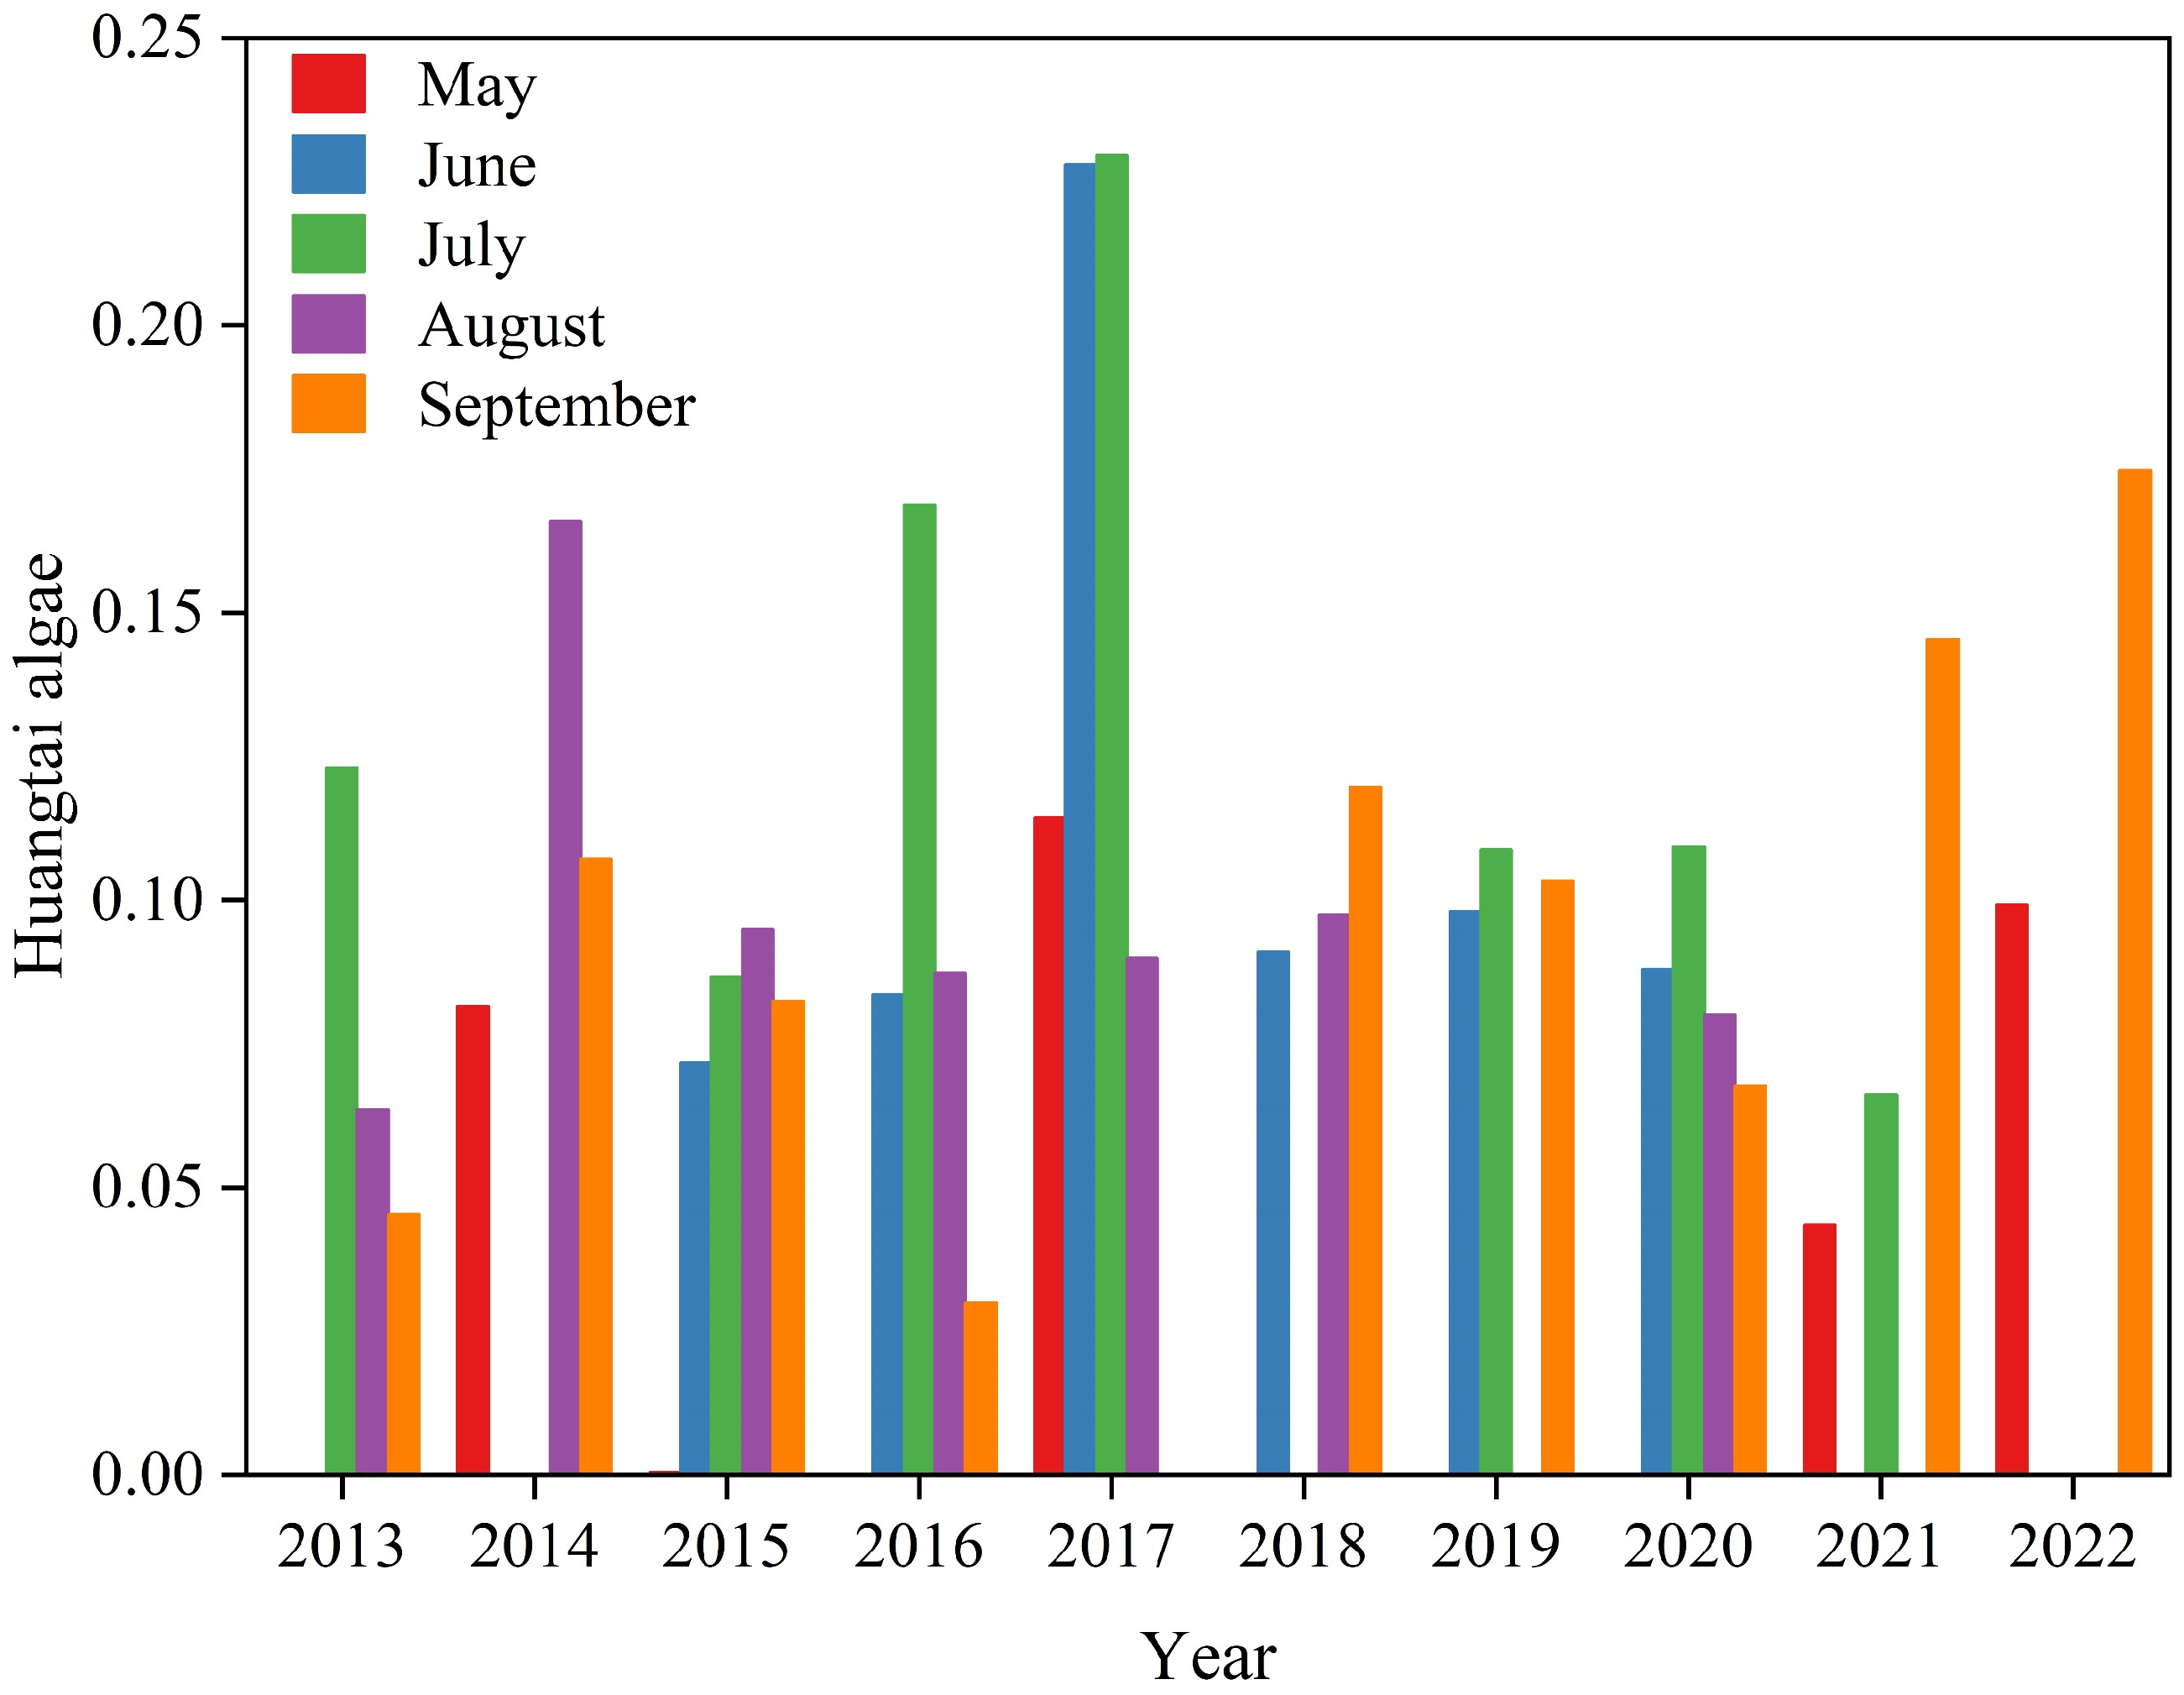
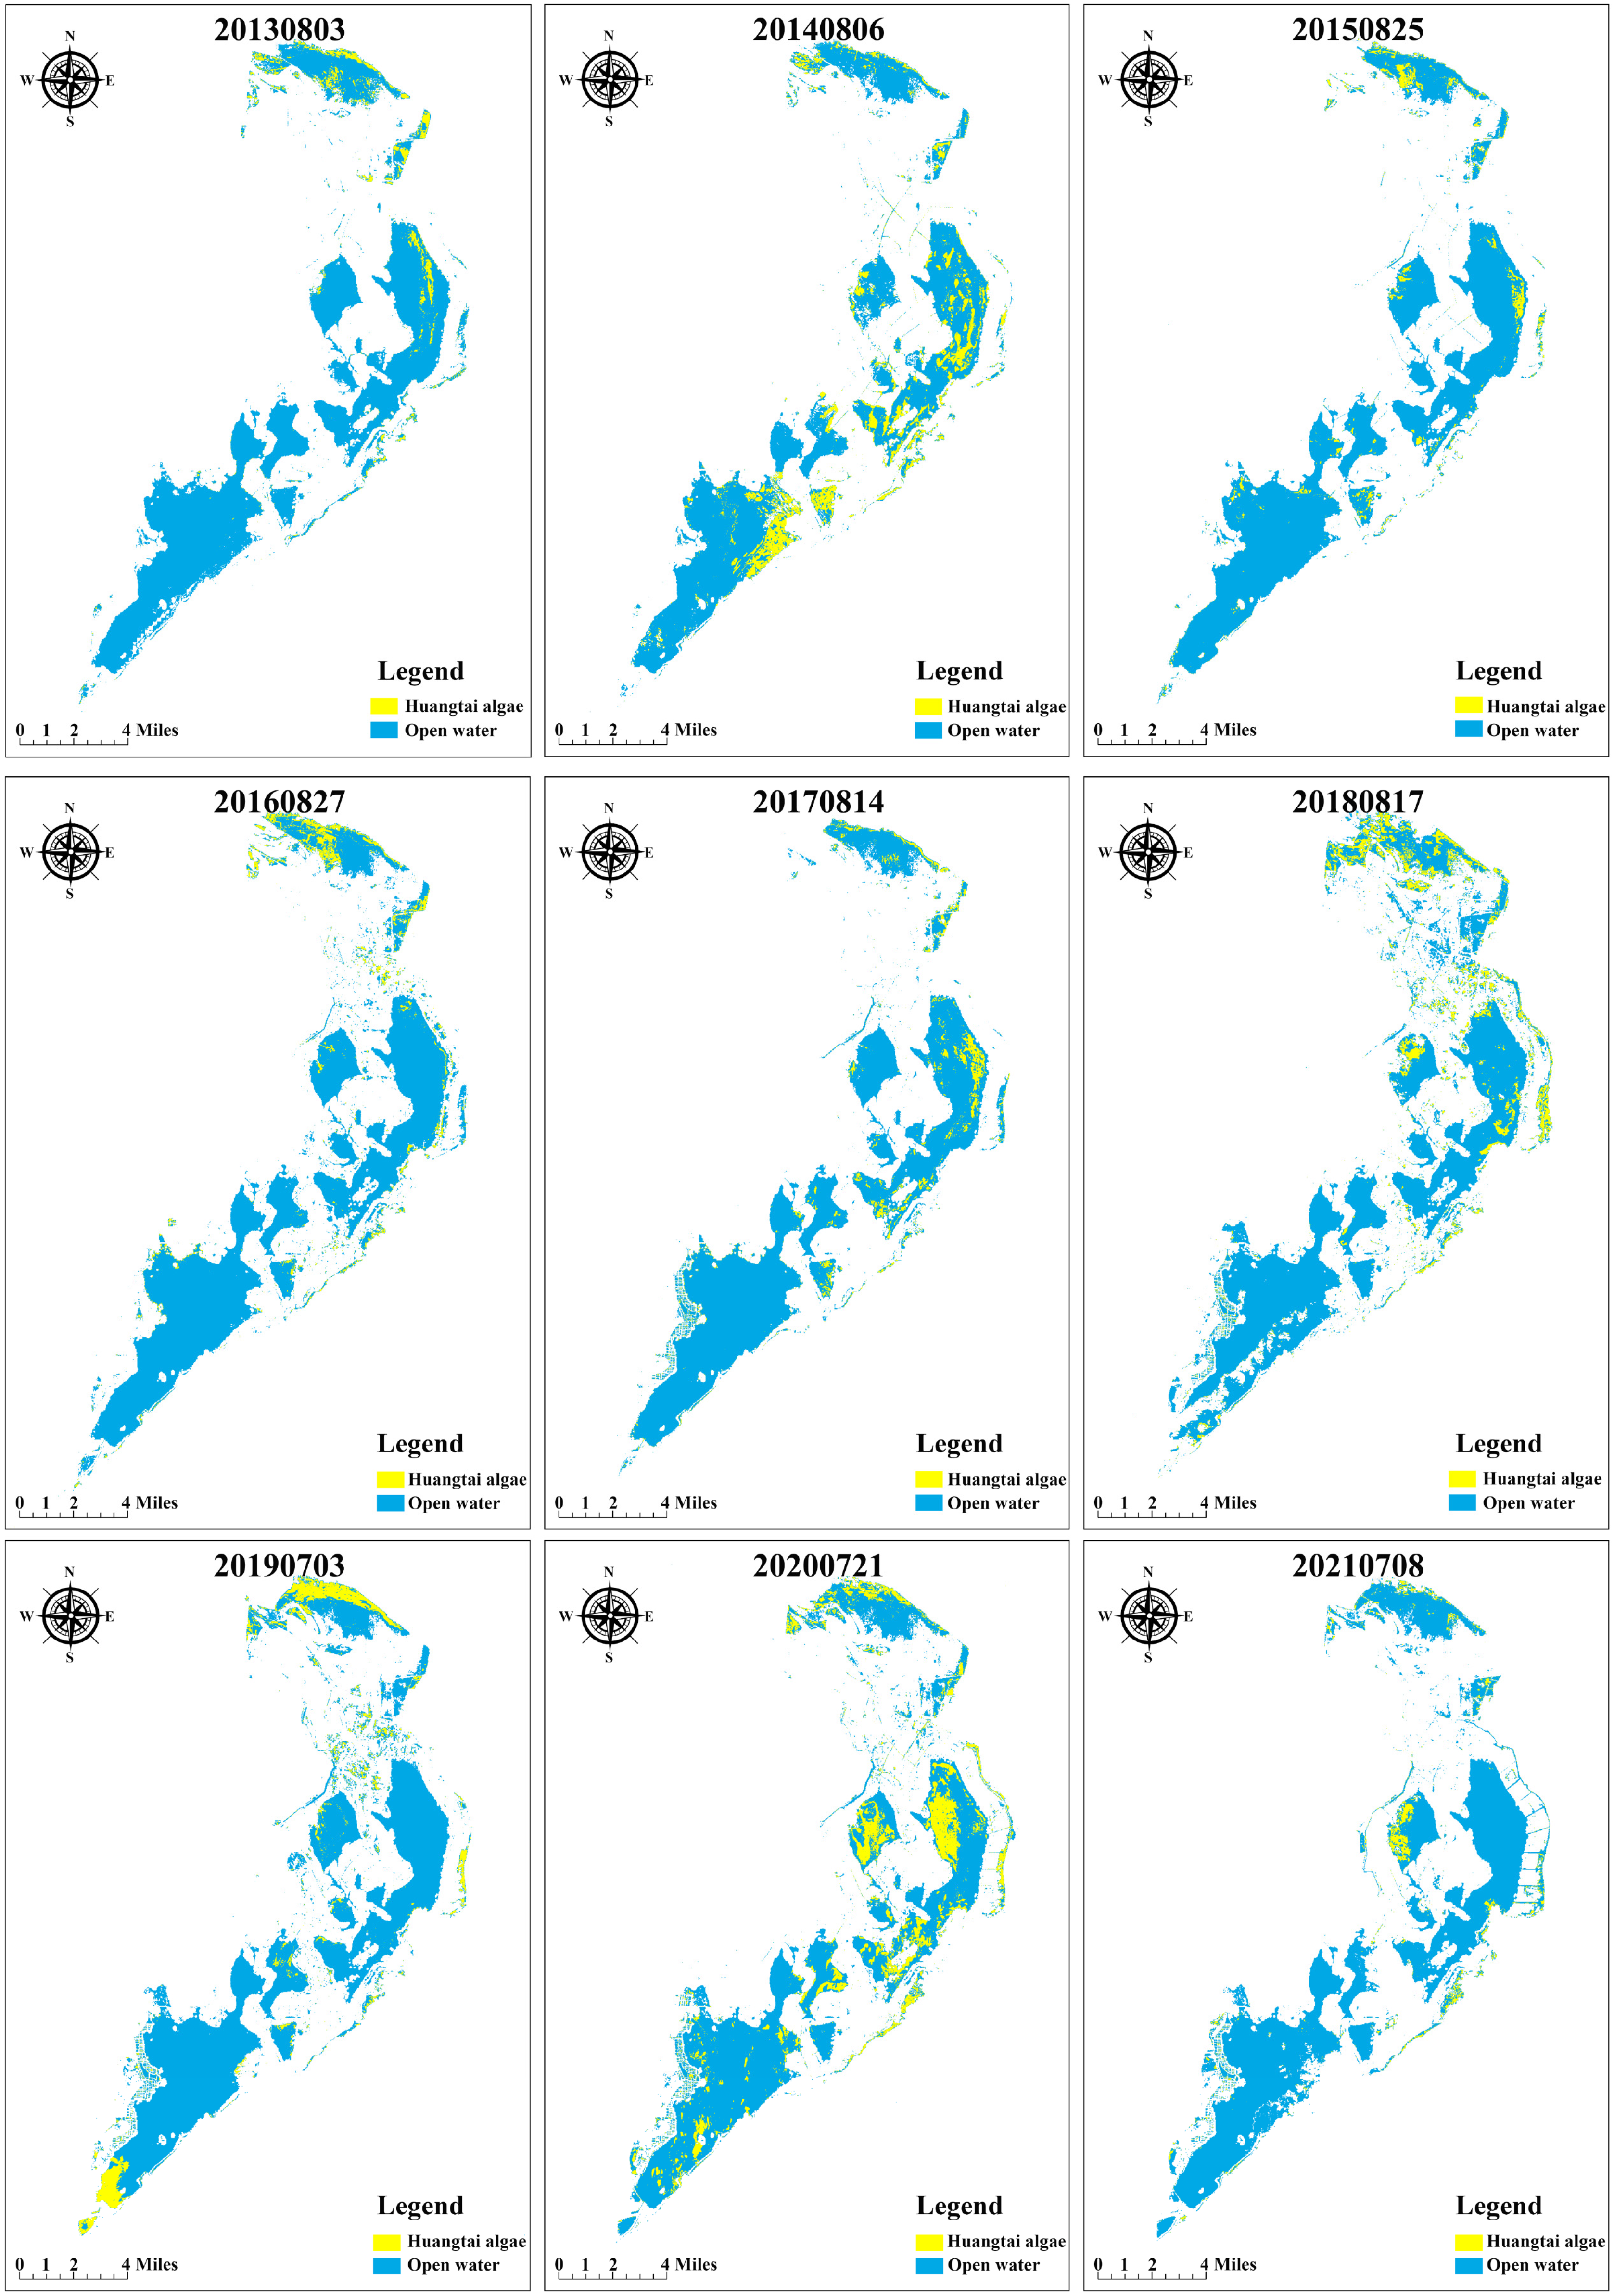
3.3.2. Spatial and Temporal Distribution of Huangtai Algae
4. Conclusions
- Landsat 8 is very suitable for identifying aquatic plants because of its band characteristics. Before performing remote sensing image recognition, the MNDVI was used to dynamically identify the water boundaries, which can effectively reduce classification errors.
- Machine learning models can effectively classify water bodies and metaphytic blooms. Among the several commonly used machine learning models, random forest exhibited good performance for both the training and validation sets. However, due to differences in the number of categories, processing data imbalances should be performed during model construction to improve the accuracy of the classification model.
- Areas of metaphytic blooms show certain spatial and temporal distribution characteristics. The identification of metaphytic blooms in the remote sensing images of Ulansuhai Lake can effectively assist in the ecological supervision of Ulansuhai Lake.
Author Contributions
Funding
Data Availability Statement
Conflicts of Interest
References
- Ahn, Y.-H.; Shanmugam, P. Detecting the red tide algal blooms from satellite ocean color observations in optically complex Northeast-Asia Coastal waters. Remote Sens. Environ. 2006, 103, 419–437. [Google Scholar] [CrossRef]
- Beck, R.; Zhan, S.; Liu, H.; Tong, S.; Yang, B.; Xu, M.; Ye, Z.; Huang, Y.; Shu, S.; Wu, Q.; et al. Comparison of satellite reflectance algorithms for estimating chlorophyll-a in a temperate reservoir using coincident hyperspectral aircraft imagery and dense coincident surface observations. Remote Sens. Environ. 2016, 178, 15–30. [Google Scholar] [CrossRef]
- Ho, J.C.; Michalak, A.M.; Pahlevan, N. Widespread global increase in intense lake phytoplankton blooms since the 1980s. Nature 2019, 574, 667–670. [Google Scholar] [CrossRef]
- Legleiter, C.J.; King, T.V.; Carpenter, K.D.; Hall, N.C.; Mumford, A.C.; Slonecker, T.; Graham, J.L.; Stengel, V.G.; Simon, N.; Rosen, B.H. Spectral mixture analysis for surveillance of harmful algal blooms (SMASH): A field-, laboratory-, and satellite-based approach to identifying cyanobacteria genera from remotely sensed data. Remote Sens. Environ. 2022, 279, 113089. [Google Scholar] [CrossRef]
- Wang, Z.; Mei, B. Current Status and Challenges of the Ecological Environment of Wuliangsuhai Basin in China. IOP Conf. Ser. Earth Environ. Sci. 2021, 829, 012012. [Google Scholar] [CrossRef]
- Smayda, T.J. Harmful algal blooms: Their ecophysiology and general relevance to phytoplankton blooms in the sea. Limnol. Oceanogr. 1997, 42, 1137–1153. [Google Scholar] [CrossRef]
- Yu, H.; Shi, X.; Zhao, S.; Sun, B.; Liu, Y.; Arvola, L.; Li, G.; Wang, Y.; Pan, X.; Wu, R.; et al. Primary productivity of phytoplankton and its influencing factors in cold and arid regions: A case study of Wuliangsuhai Lake, China. Ecol. Indic. 2022, 144, 109545. [Google Scholar] [CrossRef]
- Sun, L.; Zhang, Z.; Li, Y.; Zhang, L.; Chen, Q.; Yu, R.; Hao, Y.; Lu, C. A new method based on additive vegetation index for mapping Huangtai algae coverage in Lake Ulansuhai. Environ. Sci. Pollut. Res. 2023, 30, 24590–24605. [Google Scholar] [CrossRef] [PubMed]
- Du, C.; Cui, J.; Wang, D.; Li, G.; Lu, H.; Tian, Z.; Zhao, C.; Li, M.; Zhang, L. Prediction of aquatic vegetation growth under ecological recharge based on machine learning and remote sensing. J. Clean. Prod. 2024, 452, 142054. [Google Scholar] [CrossRef]
- Barale, V.; Jaquet, J.-M.; Ndiaye, M. Algal blooming patterns and anomalies in the Mediterranean Sea as derived from the SeaWiFS data set (1998–2003). Remote Sens. Environ. 2008, 112, 3300–3313. [Google Scholar] [CrossRef]
- Wei, G.; Tang, D.; Wang, S. Distribution of chlorophyll and harmful algal blooms (HABs): A review on space based studies in the coastal environments of Chinese marginal seas. Adv. Space Res. 2008, 41, 12–19. [Google Scholar] [CrossRef]
- Kudela, R.M.; Palacios, S.L.; Austerberry, D.C.; Accorsi, E.K.; Guild, L.S.; Torres-Perez, J. Application of hyperspectral remote sensing to cyanobacterial blooms in inland waters. Remote Sens. Environ. 2015, 167, 196–205. [Google Scholar] [CrossRef]
- Luo, J.; Ni, G.; Zhang, Y.; Wang, K.; Shen, M.; Cao, Z.; Qi, T.; Xiao, Q.; Qiu, Y.; Cai, Y.; et al. A new technique for quantifying algal bloom, floating/emergent and submerged vegetation in eutrophic shallow lakes using Landsat imagery. Remote Sens. Environ. 2023, 287, 113480. [Google Scholar] [CrossRef]
- Dogan, O.K.; Akyurek, Z.; Beklioglu, M. Identification and mapping of submerged plants in a shallow lake using quickbird satellite data. J. Environ. Manag. 2009, 90, 2138–2143. [Google Scholar] [CrossRef] [PubMed]
- Shi, K.; Li, Y.; Li, L.; Lu, H.; Song, K.; Liu, Z.; Xu, Y.; Li, Z. Remote chlorophyll-a estimates for inland waters based on a cluster-based classification. Sci. Total Environ. 2013, 444, 1–15. [Google Scholar] [CrossRef] [PubMed]
- Zhang, F.; Li, J.; Shen, Q.; Zhang, B.; Wu, C.; Wu, Y.; Wang, G.; Wang, S.; Lu, Z. Algorithms and Schemes for Chlorophyll a Estimation by Remote Sensing and Optical Classification for Turbid Lake Taihu, China. IEEE J. Sel. Top. Appl. Earth Obs. Remote Sens. 2015, 8, 350–364. [Google Scholar] [CrossRef]
- Wei, Y.; Luo, X.; Hu, L.; Peng, Y.; Feng, J. An improved unsupervised representation learning generative adversarial network for remote sensing image scene classification. Remote Sens. Lett. 2020, 11, 598–607. [Google Scholar] [CrossRef]
- Bolpagni, R.; Bresciani, M.; Laini, A.; Pinardi, M.; Matta, E.; Ampe, E.M.; Giardino, C.; Viaroli, P.; Bartoli, M. Remote sensing of phytoplankton-macrophyte coexistence in shallow hypereutrophic fluvial lakes. Hydrobiologia 2014, 737, 67–76. [Google Scholar] [CrossRef]
- Hao, P.; Wang, L.; Zhan, Y.; Wang, C.; Niu, Z.; Wu, M. Crop classification using crop knowledge of the previous-year: Case study in Southwest Kansas, USA. Eur. J. Remote Sens. 2016, 49, 1061–1077. [Google Scholar] [CrossRef]
- Zhang, Y.; Cai, X.; Song, X.; Suo, J.; Wang, Z.; Li, E.; Wang, X. Remote sensing information extraction of hydrophyte in Honghu Lake based on decision tree. Wetl. Sci. 2018, 16, 213–222. [Google Scholar] [CrossRef]
- Bareuther, M.; Klinge, M.; Buerkert, A. Spatio-Temporal Dynamics of Algae and Macrophyte Cover in Urban Lakes: A Remote Sensing Analysis of Bellandur and Varthur Wetlands in Bengaluru, India. Remote Sens. 2020, 12, 3843. [Google Scholar] [CrossRef]
- Liu, S.; Glamore, W.; Tamburic, B.; Morrow, A.; Johnson, F. Remote sensing to detect harmful algal blooms in inland waterbodies. Sci. Total Environ. 2022, 851, 158096. [Google Scholar] [CrossRef] [PubMed]
- Sun, C.; Li, J.; Liu, Y.; Zhao, S.; Zheng, J.; Zhang, S. Tracking annual changes in the distribution and composition of saltmarsh vegetation on the Jiangsu coast of China using Landsat time series–based phenological parameters. Remote Sens. Environ. 2023, 284, 113370. [Google Scholar] [CrossRef]
- Xu, H. Modification of normalised difference water index (NDWI) to enhance open water features in remotely sensed imagery. Int. J. Remote Sens. 2006, 27, 3025–3033. [Google Scholar] [CrossRef]
- Wang, Q.; Liu, D.; Yang, H.; Yin, J.; Bin, Z.; Zhu, S.; Zhang, Y. Comparative study on the water index of MNDWI and NDWI for water boundary extraction in eutrophic lakes. Adv. Geosci 2017, 7, 732–738. [Google Scholar] [CrossRef]
- Haibo, Y.; Zongmin, W.; Hongling, Z.; Yu, G. Water Body Extraction Methods Study Based on RS and GIS. Procedia Environ. Sci. 2011, 10, 2619–2624. [Google Scholar] [CrossRef]
- Feng, L.; Dai, Y.; Hou, X.; Xu, Y.; Liu, J.; Zheng, C. Concerns about phytoplankton bloom trends in global lakes. Nature 2021, 590, E35–E47. [Google Scholar] [CrossRef] [PubMed]
- Lai, L.; Zhang, Y.; Cao, Z.; Liu, Z.; Yang, Q. Algal biomass mapping of eutrophic lakes using a machine learning approach with MODIS images. Sci. Total Environ. 2023, 880, 163357. [Google Scholar] [CrossRef] [PubMed]
- Ghatkar, J.G.; Singh, R.K.; Shanmugam, P. Classification of algal bloom species from remote sensing data using an extreme gradient boosted decision tree model. Int. J. Remote Sens. 2019, 40, 9412–9438. [Google Scholar] [CrossRef]
- Yang, C.; Tan, Z.; Li, Y.; Shen, M.; Duan, H. A Comparative Analysis of Machine Learning Methods for Algal Bloom Detection Using Remote Sensing Images. IEEE J. Sel. Top. Appl. Earth Obs. Remote Sens. 2023, 16, 7953–7967. [Google Scholar] [CrossRef]
- Ali, S.; Smith, K.A. On learning algorithm selection for classification. Appl. Soft Comput. 2006, 6, 119–138. [Google Scholar] [CrossRef]
- Raczko, E.; Zagajewski, B. Comparison of support vector machine, random forest and neural network classifiers for tree species classification on airborne hyperspectral APEX images. Eur. J. Remote Sens. 2017, 50, 144–154. [Google Scholar] [CrossRef]
- Qing, S.; A, R.; Shun, B.; Zhao, W.; Bao, Y.; Hao, Y. Distinguishing and mapping of aquatic vegetations and yellow algae bloom with Landsat satellite data in a complex shallow Lake, China during 1986–2018. Ecol. Indic. 2020, 112, 106073. [Google Scholar] [CrossRef]


| Latitude (° N) | Jan. | March | May | July | Sept. | Nov. |
|---|---|---|---|---|---|---|
| 40 | SAS | SAS | SAS | MLS | MLS | SAS |
| Method | Dataset | Group 1 | Group 2 | Group 3 | Group 4 | Group 5 | Group 6 | Group 7 | Group 8 | Group 9 | Group10 | Mean |
|---|---|---|---|---|---|---|---|---|---|---|---|---|
| Random Forest | Training | 0.999 | 1.000 | 1.000 | 0.999 | 0.999 | 1.000 | 1.000 | 1.000 | 1.000 | 0.999 | 0.999 |
| Validation | 0.927 | 0.926 | 0.929 | 0.925 | 0.928 | 0.930 | 0.930 | 0.930 | 0.928 | 0.925 | 0.928 | |
| Decision Tree | Training | 1.000 | 1.000 | 1.000 | 1.000 | 1.000 | 1.000 | 1.000 | 1.000 | 1.000 | 1.000 | 1.000 |
| Validation | 0.894 | 0.896 | 0.896 | 0.897 | 0.888 | 0.892 | 0.899 | 0.895 | 0.896 | 0.891 | 0.894 | |
| KNN | Training | 0.942 | 0.941 | 0.941 | 0.941 | 0.941 | 0.942 | 0.942 | 0.941 | 0.940 | 0.940 | 0.941 |
| Validation | 0.917 | 0.913 | 0.917 | 0.916 | 0.915 | 0.919 | 0.919 | 0.919 | 0.917 | 0.913 | 0.916 | |
| SVM | Training | 0.884 | 0.885 | 0.885 | 0.884 | 0.884 | 0.885 | 0.884 | 0.883 | 0.883 | 0.884 | 0.884 |
| Validation | 0.877 | 0.877 | 0.877 | 0.877 | 0.880 | 0.879 | 0.882 | 0.879 | 0.876 | 0.874 | 0.878 | |
| Bayes | Training | 0.783 | 0.772 | 0.777 | 0.779 | 0.780 | 0.777 | 0.778 | 0.775 | 0.776 | 0.781 | 0.778 |
| Validation | 0.776 | 0.761 | 0.765 | 0.767 | 0.769 | 0.772 | 0.772 | 0.771 | 0.774 | 0.768 | 0.769 | |
| LDA | Training | 0.795 | 0.797 | 0.796 | 0.796 | 0.795 | 0.800 | 0.798 | 0.799 | 0.798 | 0.797 | 0.797 |
| Validation | 0.790 | 0.788 | 0.785 | 0.789 | 0.789 | 0.792 | 0.791 | 0.793 | 0.791 | 0.788 | 0.790 |
| Band | B1 | B2 | B3 | B4 | B5 | B6 | B7 |
|---|---|---|---|---|---|---|---|
| Importance | 0.0841201 | 0.1250335 | 0.1660145 | 0.227836 | 0.155908 | 0.1448167 | 0.0962712 |
Disclaimer/Publisher’s Note: The statements, opinions and data contained in all publications are solely those of the individual author(s) and contributor(s) and not of MDPI and/or the editor(s). MDPI and/or the editor(s) disclaim responsibility for any injury to people or property resulting from any ideas, methods, instructions or products referred to in the content. |
© 2024 by the authors. Licensee MDPI, Basel, Switzerland. This article is an open access article distributed under the terms and conditions of the Creative Commons Attribution (CC BY) license (https://creativecommons.org/licenses/by/4.0/).
Share and Cite
Cui, J.; Zhang, X.; Du, C.; Li, G. Remote Sensing Identification of Harmful Algae in Ulansuhai Lake with Machine Learning. Water 2025, 17, 50. https://doi.org/10.3390/w17010050
Cui J, Zhang X, Du C, Li G. Remote Sensing Identification of Harmful Algae in Ulansuhai Lake with Machine Learning. Water. 2025; 17(1):50. https://doi.org/10.3390/w17010050
Chicago/Turabian StyleCui, Jianglong, Xiaodie Zhang, Caili Du, and Guowen Li. 2025. "Remote Sensing Identification of Harmful Algae in Ulansuhai Lake with Machine Learning" Water 17, no. 1: 50. https://doi.org/10.3390/w17010050
APA StyleCui, J., Zhang, X., Du, C., & Li, G. (2025). Remote Sensing Identification of Harmful Algae in Ulansuhai Lake with Machine Learning. Water, 17(1), 50. https://doi.org/10.3390/w17010050