
The Response of Small Watershed Storm Floods to Climate Change

Abstract
1. Introduction
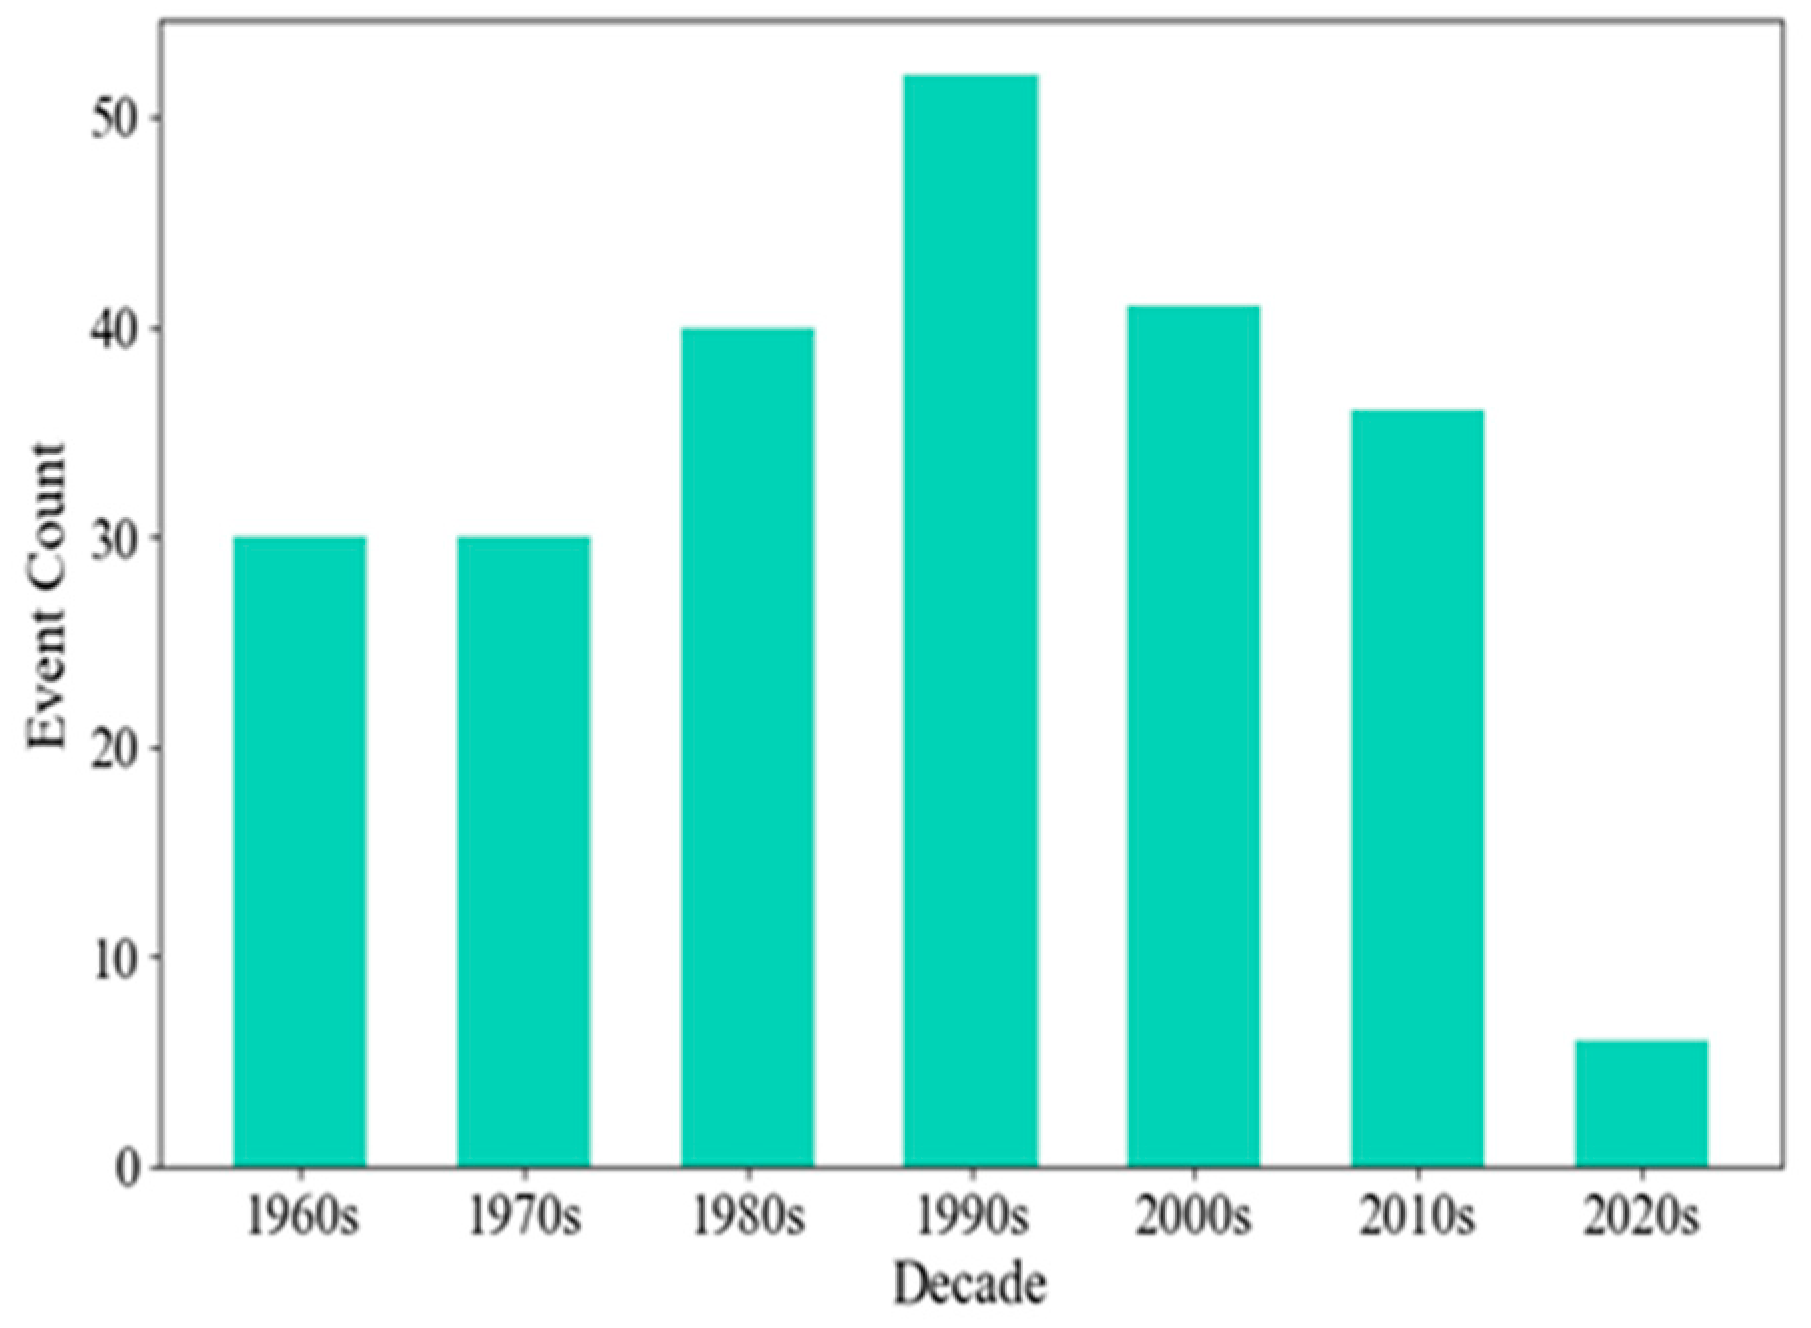
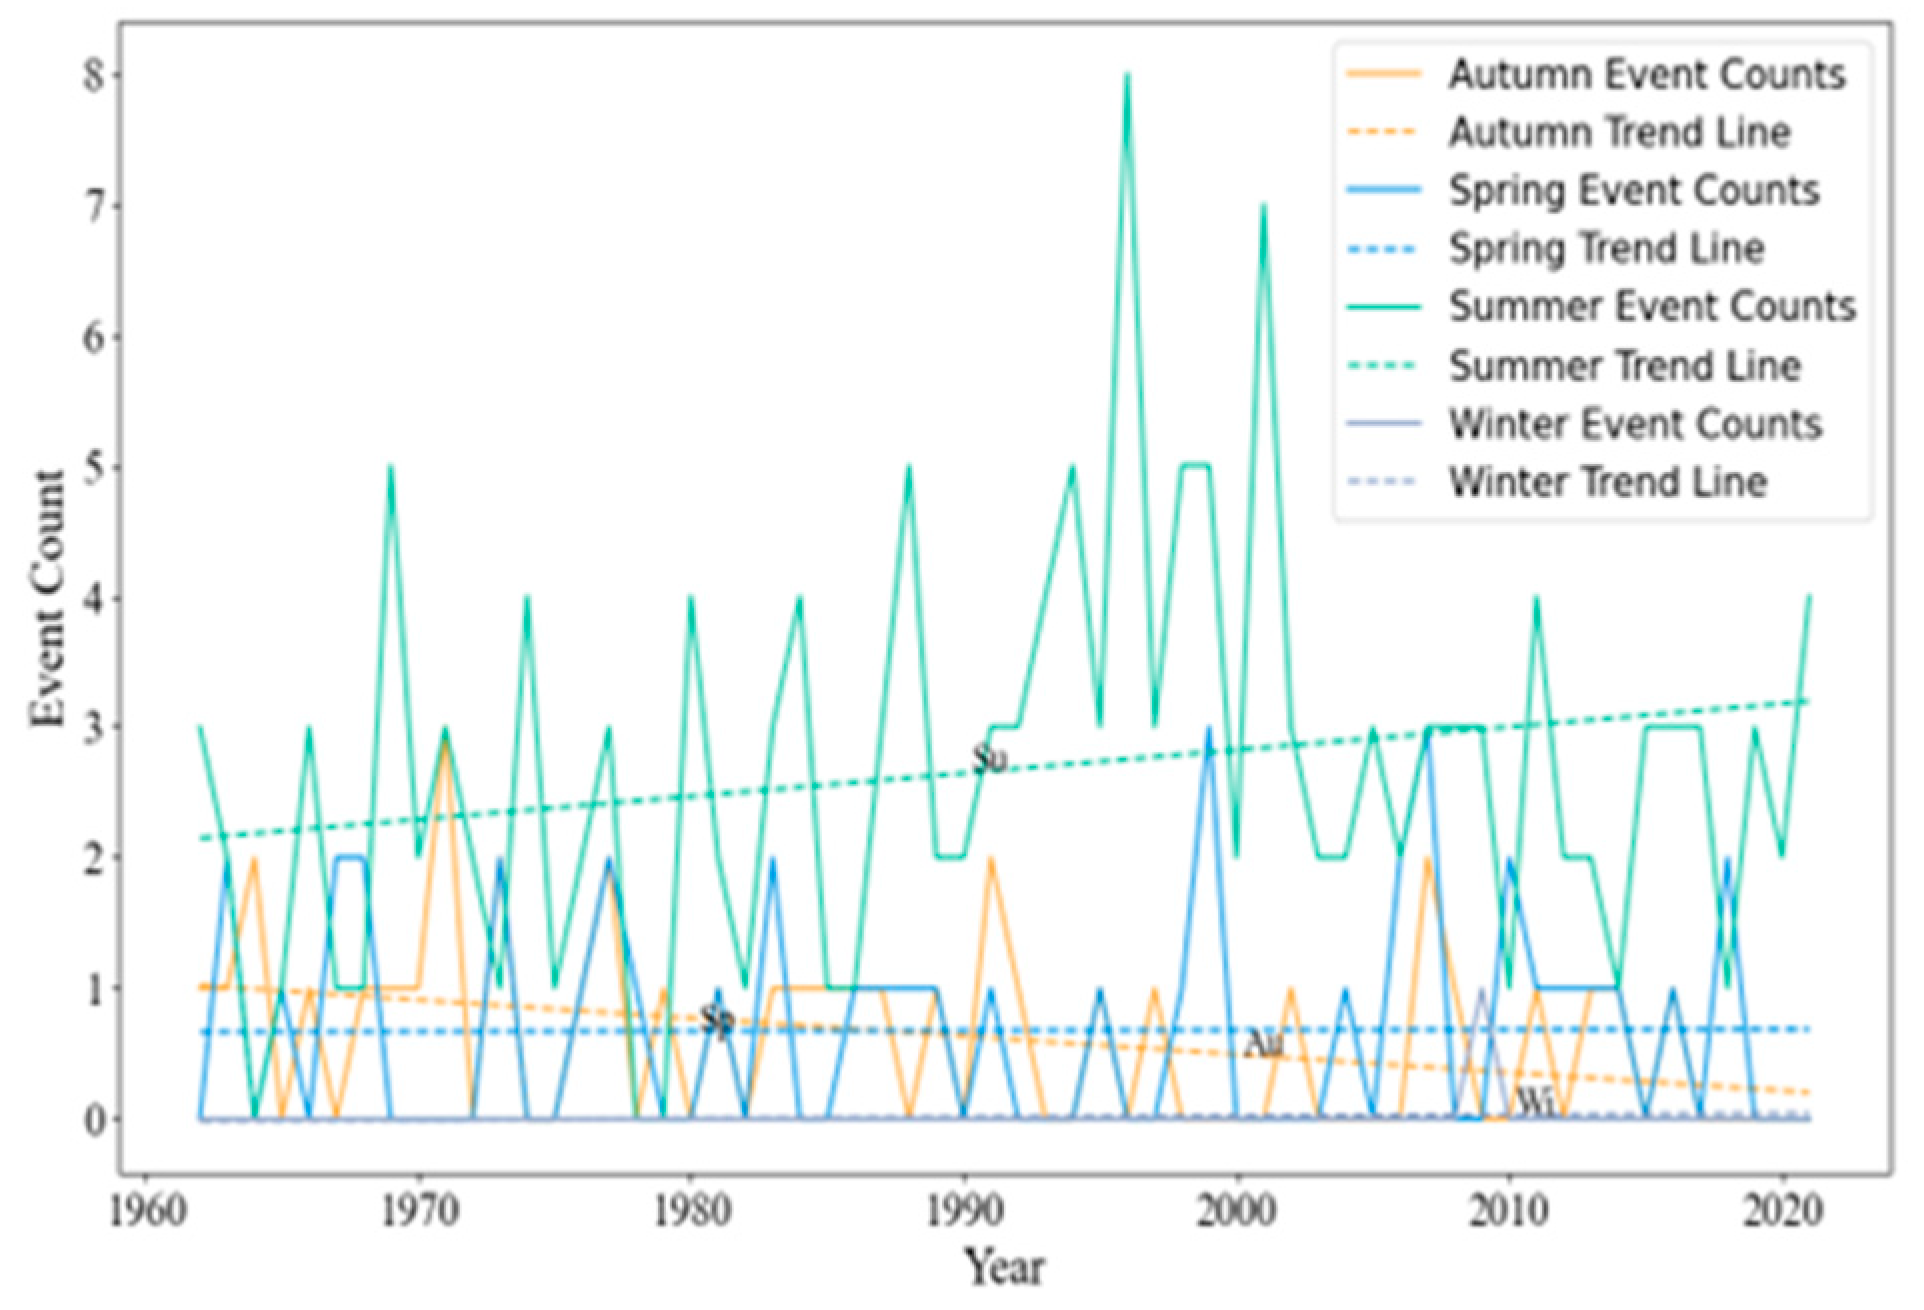
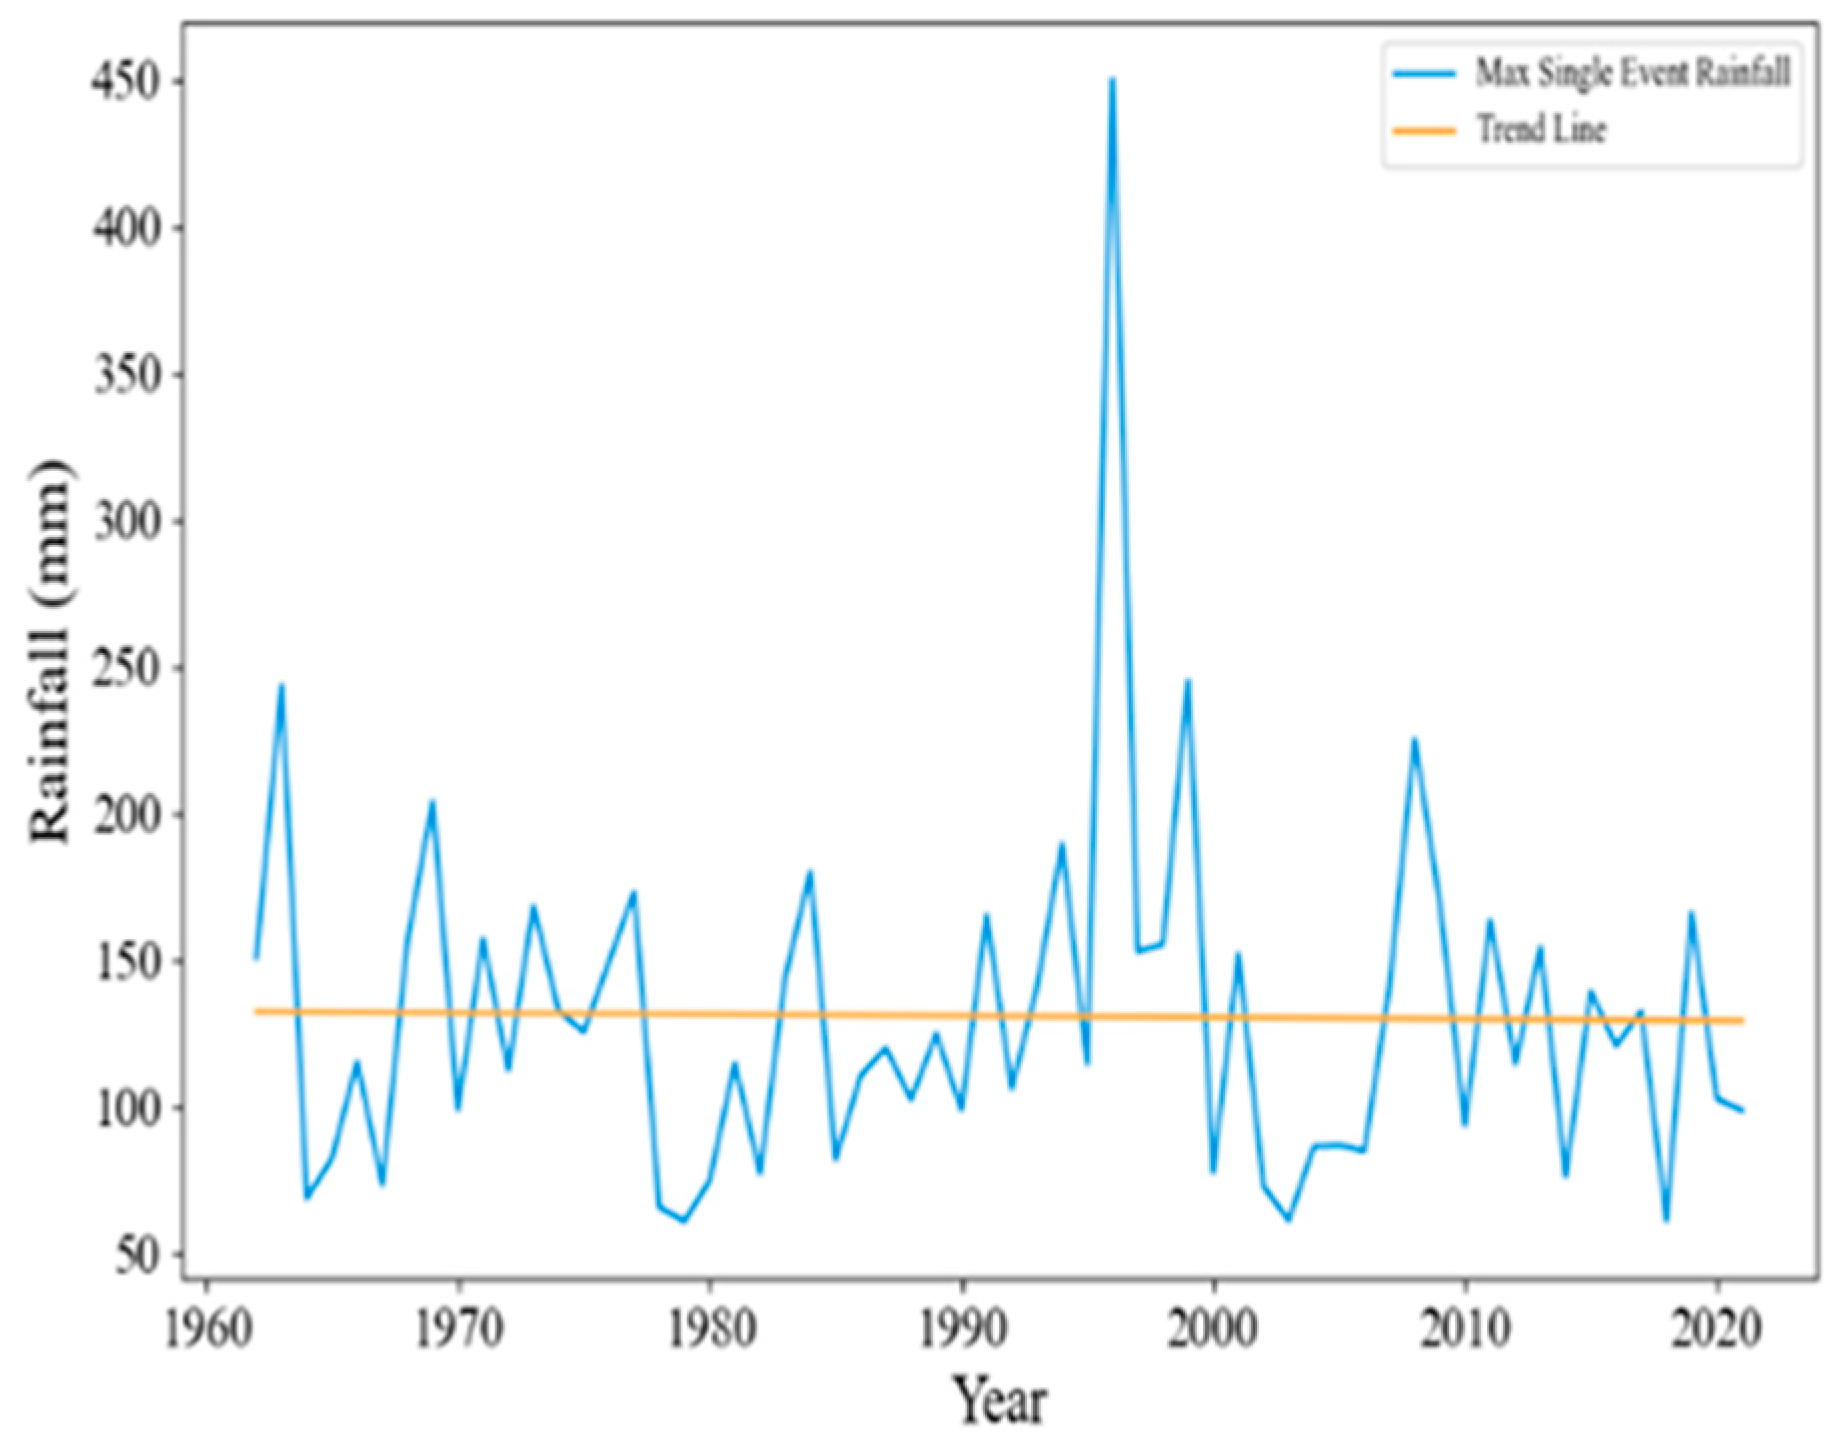
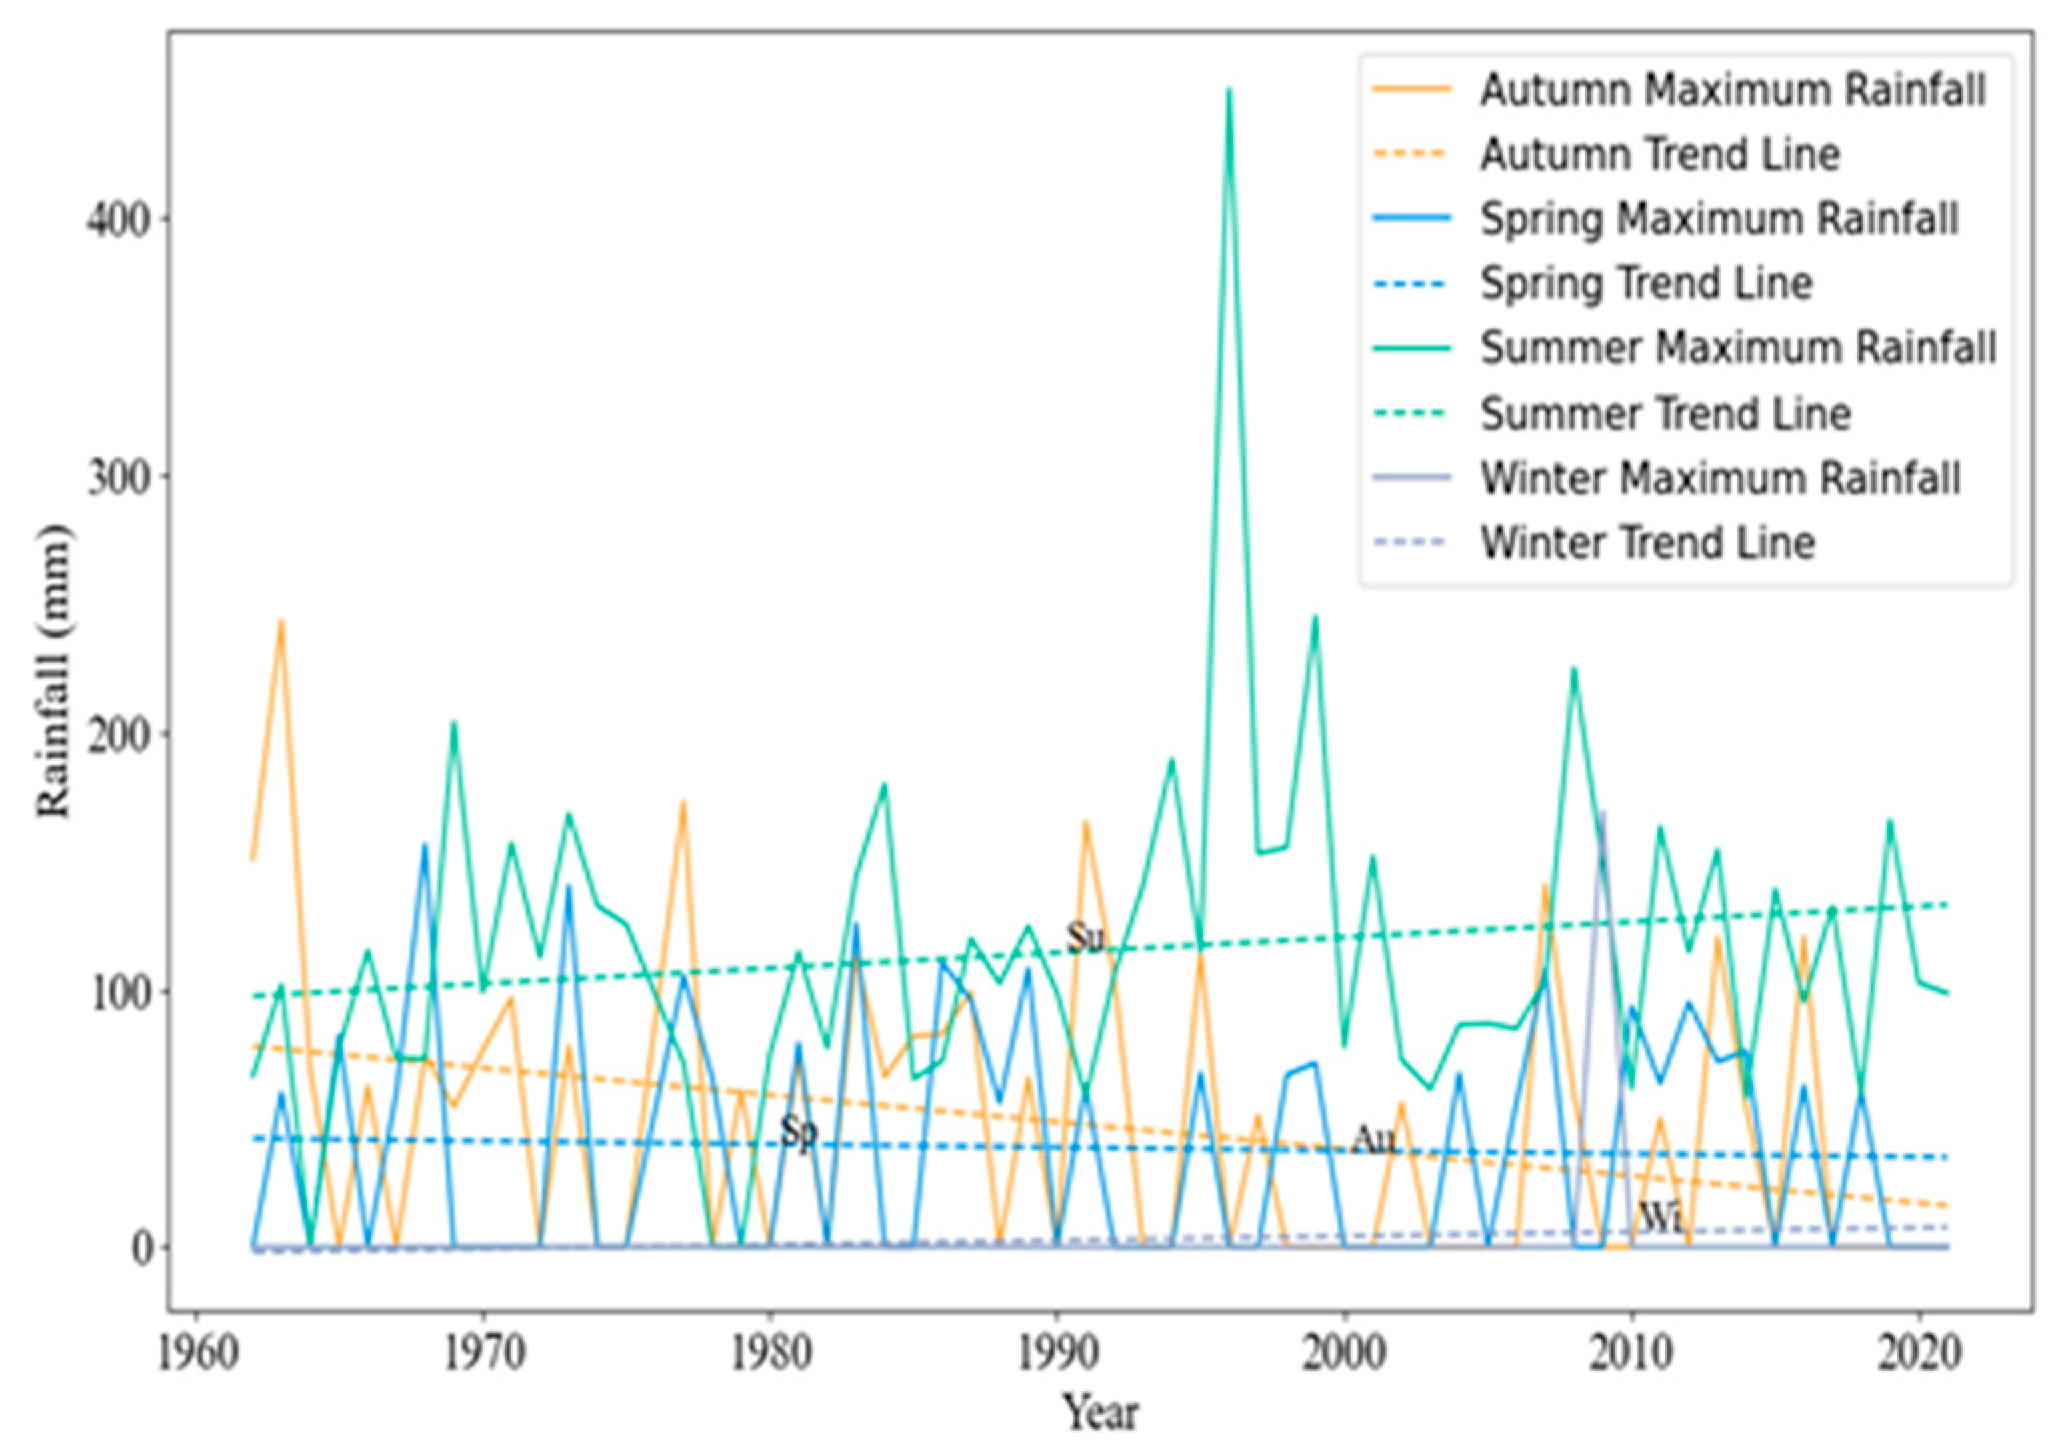
- Characterize extreme rainfall events: Analyze their frequency, intensity, duration, maximum rainfall intensity, and temporal distribution trends based on historical data from 1962 to 2021.
- Assess flood responses: Evaluate how short-duration high-intensity rainstorms and long-duration low-intensity rainfall influence flood characteristics, including peak discharge, timing, and duration.
- Investigate climate change impacts: Quantify how changes in extreme rainfall patterns due to climate change affect flood formation and dynamics in minimally disturbed small watersheds.
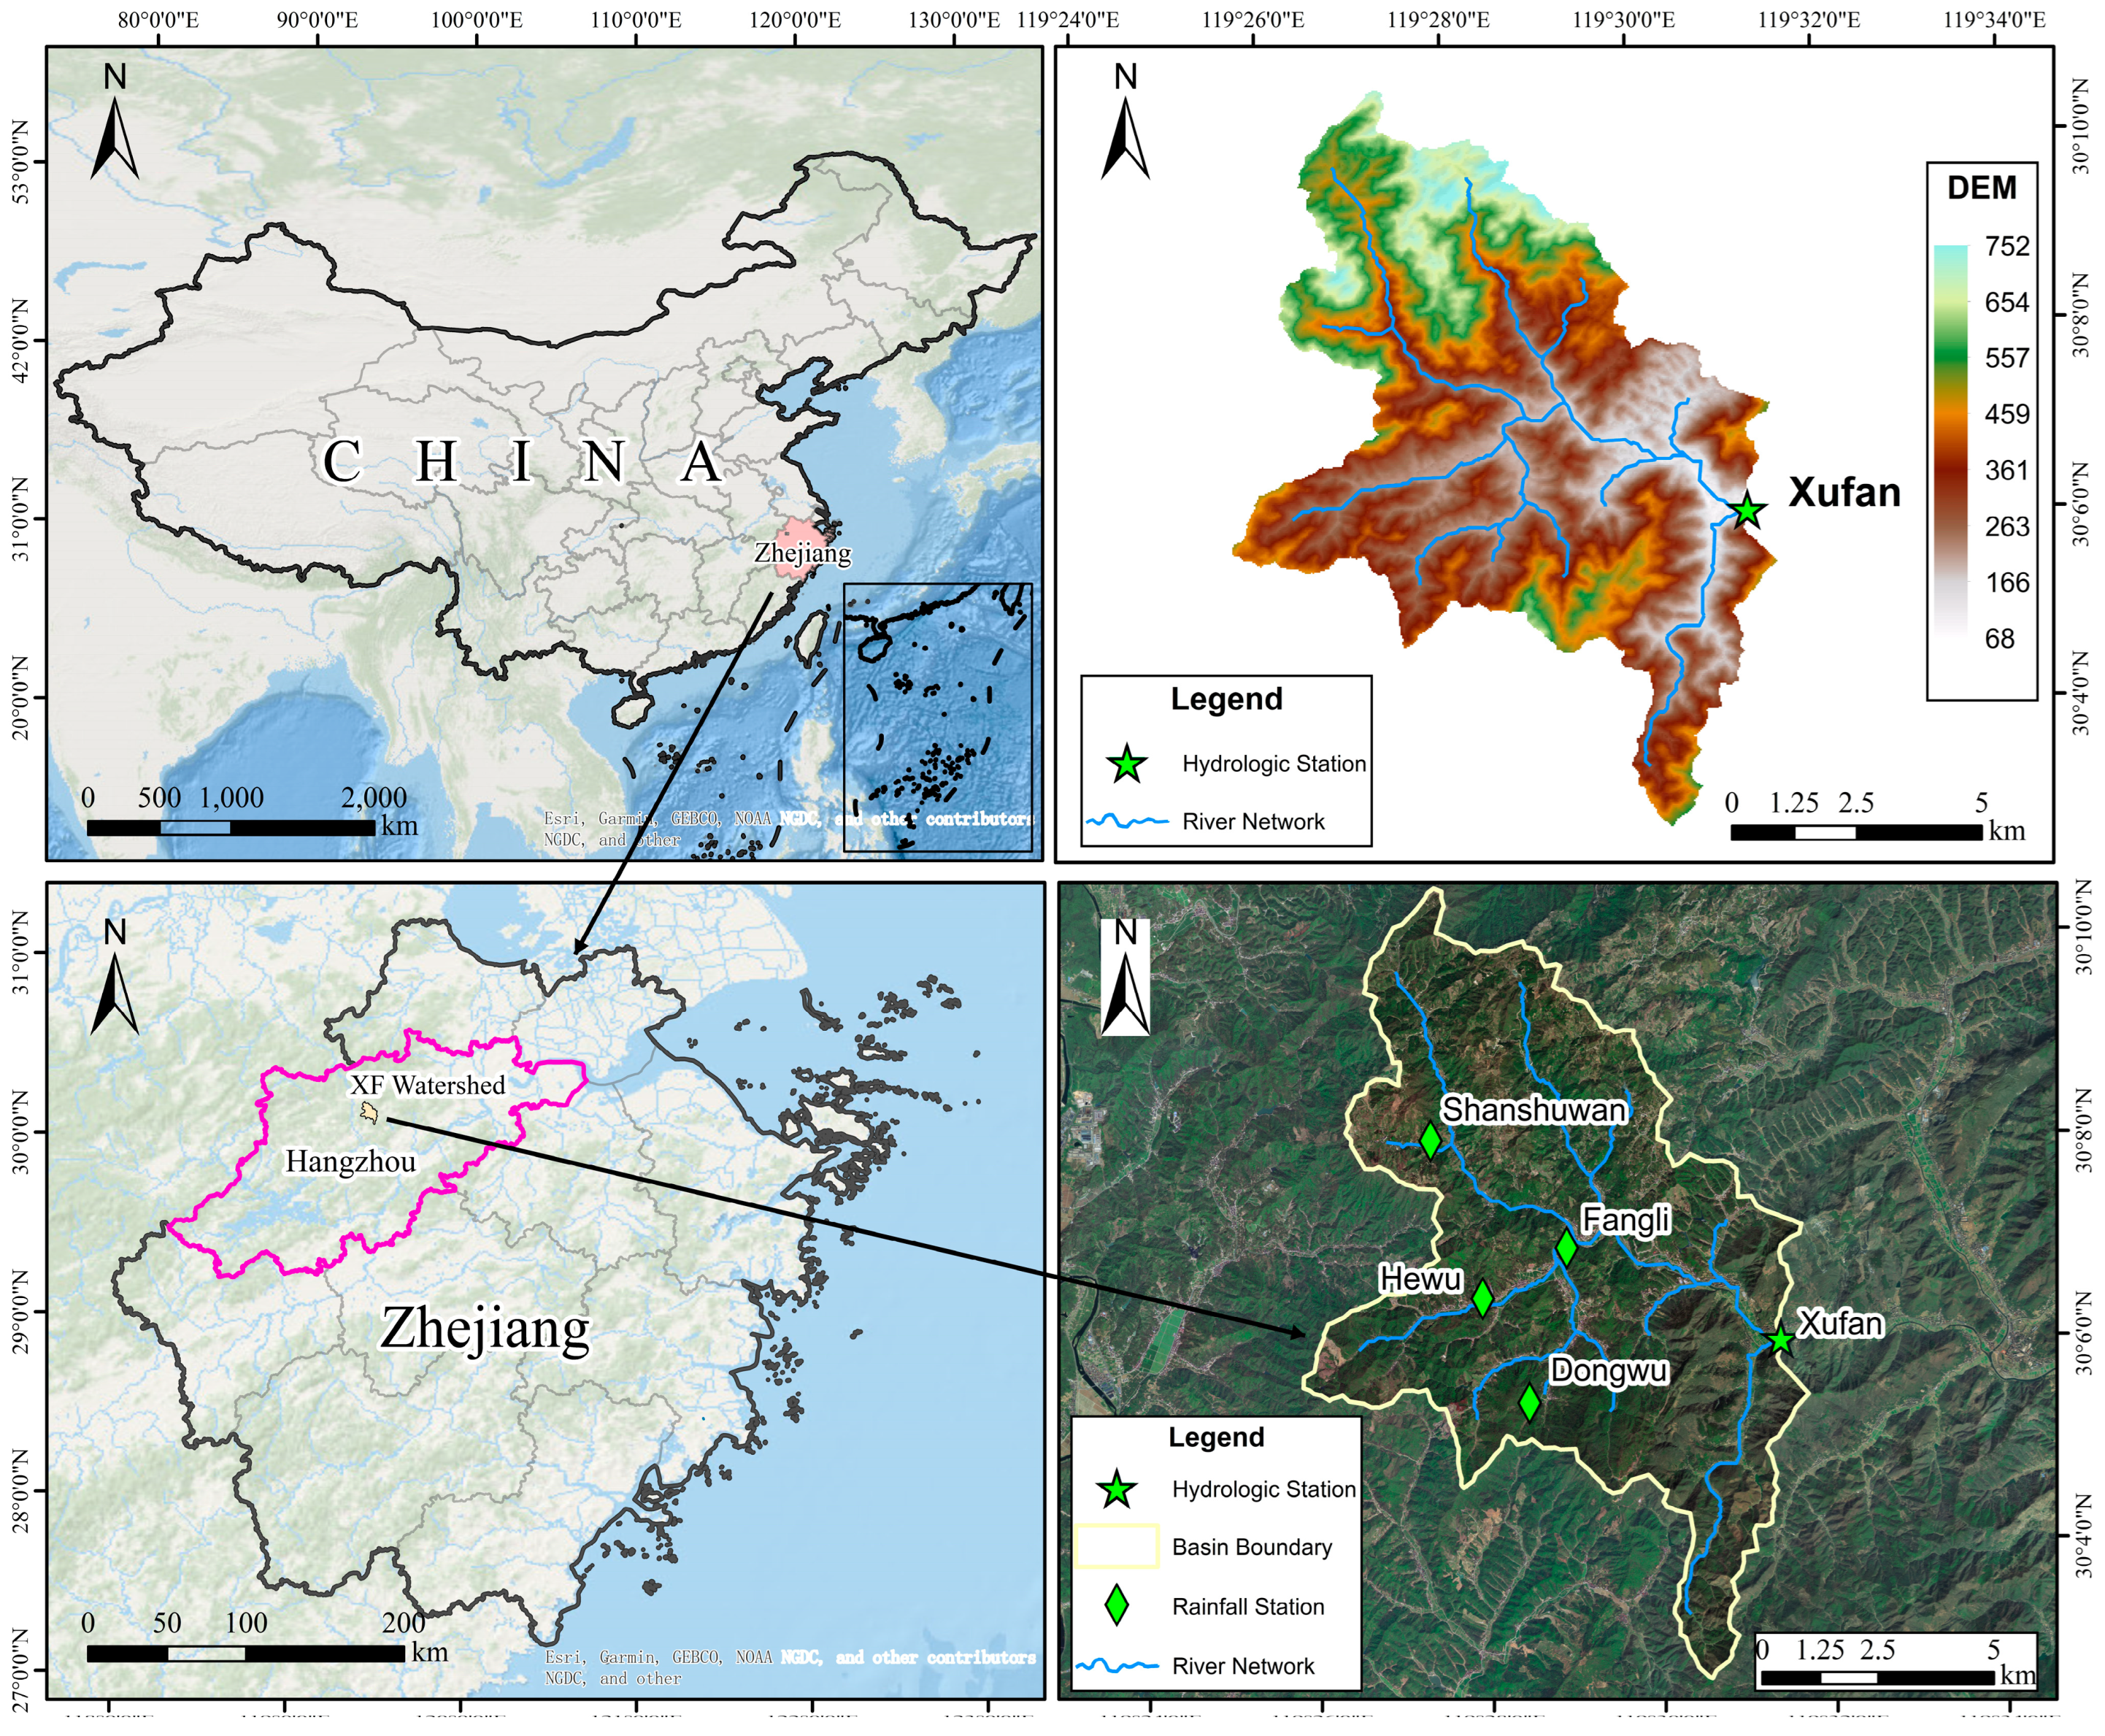
2. Overview of Study Area
3. Methodology
3.1. Extreme Rainfall Events
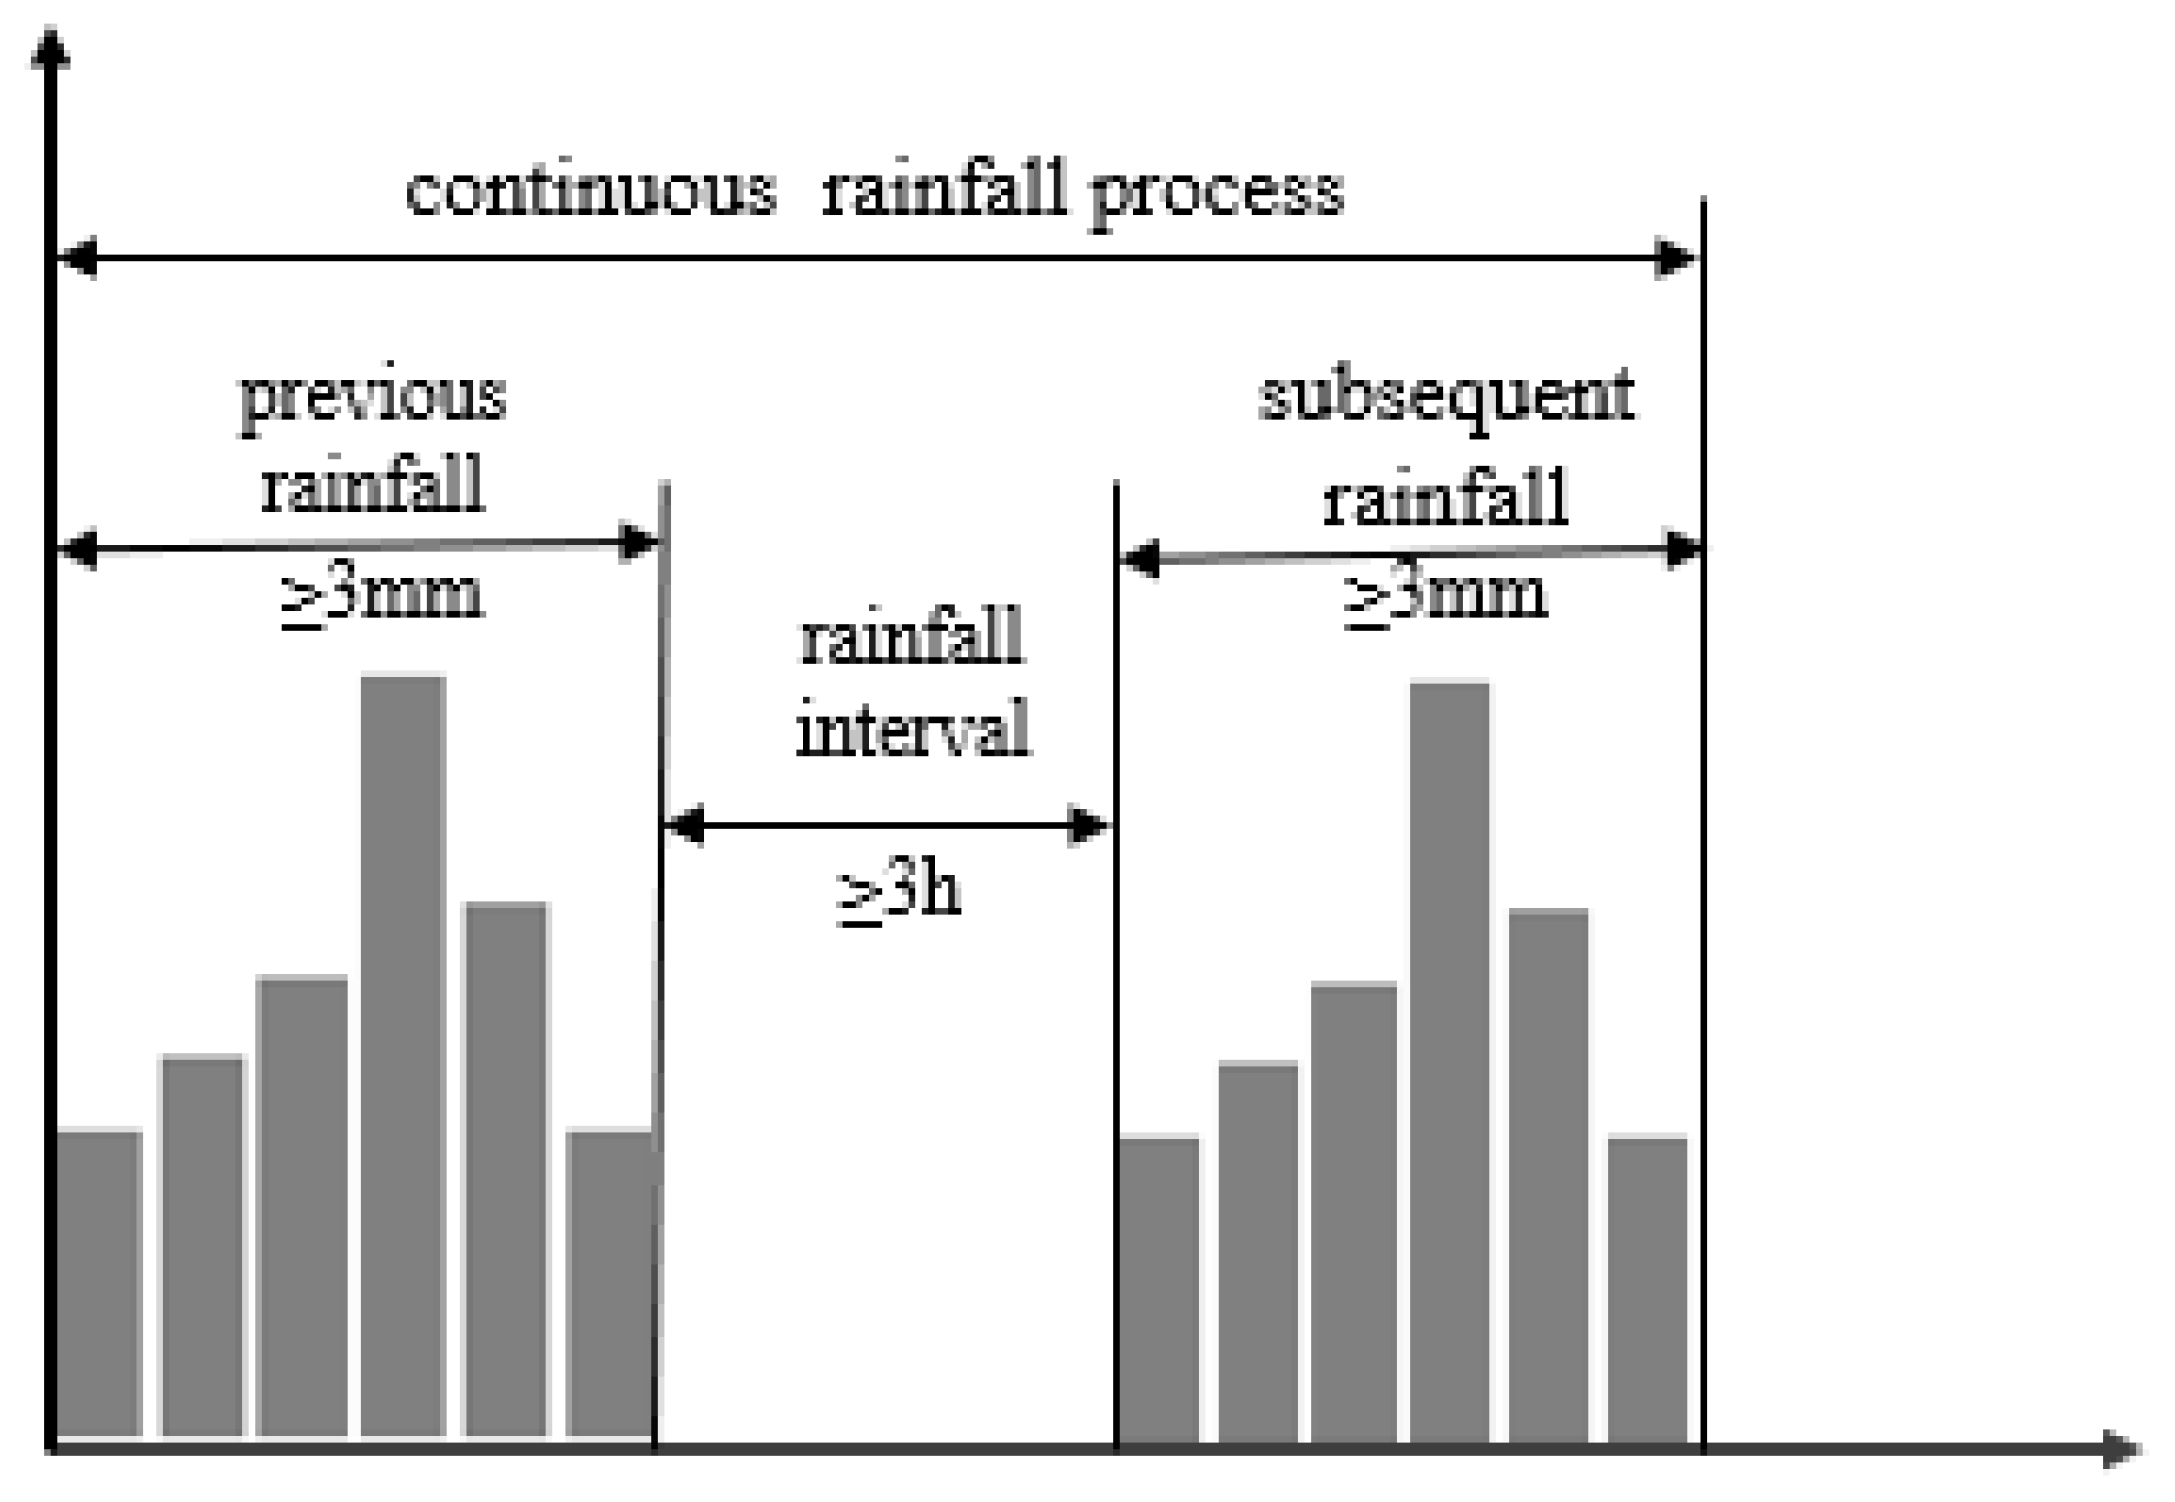
3.1.1. Definition of Extreme Rainfall Events
3.1.2. Extreme Rainfall Indicators
- Number of extreme rainfall events
- 2.
- Accumulated extreme rainfall series
3.1.3. Method for Classifying Extreme Rainfall Events
- Define the feature vector.
- 2.
- Initialization
- 3.
- Assignment
- 4.
- Updating the cluster centers
- 5.
- Iteration
3.2. Flood Analysis in Small Watersheds
3.2.1. Flood Characteristics
3.2.2. Analysis of Key Rainfall Factors Affecting Flood Characteristics Based on the Random Forest Algorithm
- Random Forest Model
- 2.
- Feature Importance Calculation
- 3.
- Feature Importance Ranking and Analysis
4. Results and Discussion
4.1. Analysis of Extreme Rainfall Characteristics
4.1.1. Characteristics Analysis of Extreme Rainfall Events
- Light rain: 1147 events, accounting for 41.48%Moderate rain: 924 events, accounting for 33.41%Heavy rain: 459 events, accounting for 16.60%Rainstorm: 192 events, accounting for 6.94%Severe rainstorm: 43 events, accounting for 1.55%
4.1.2. Classification of Extreme Rainfall Events
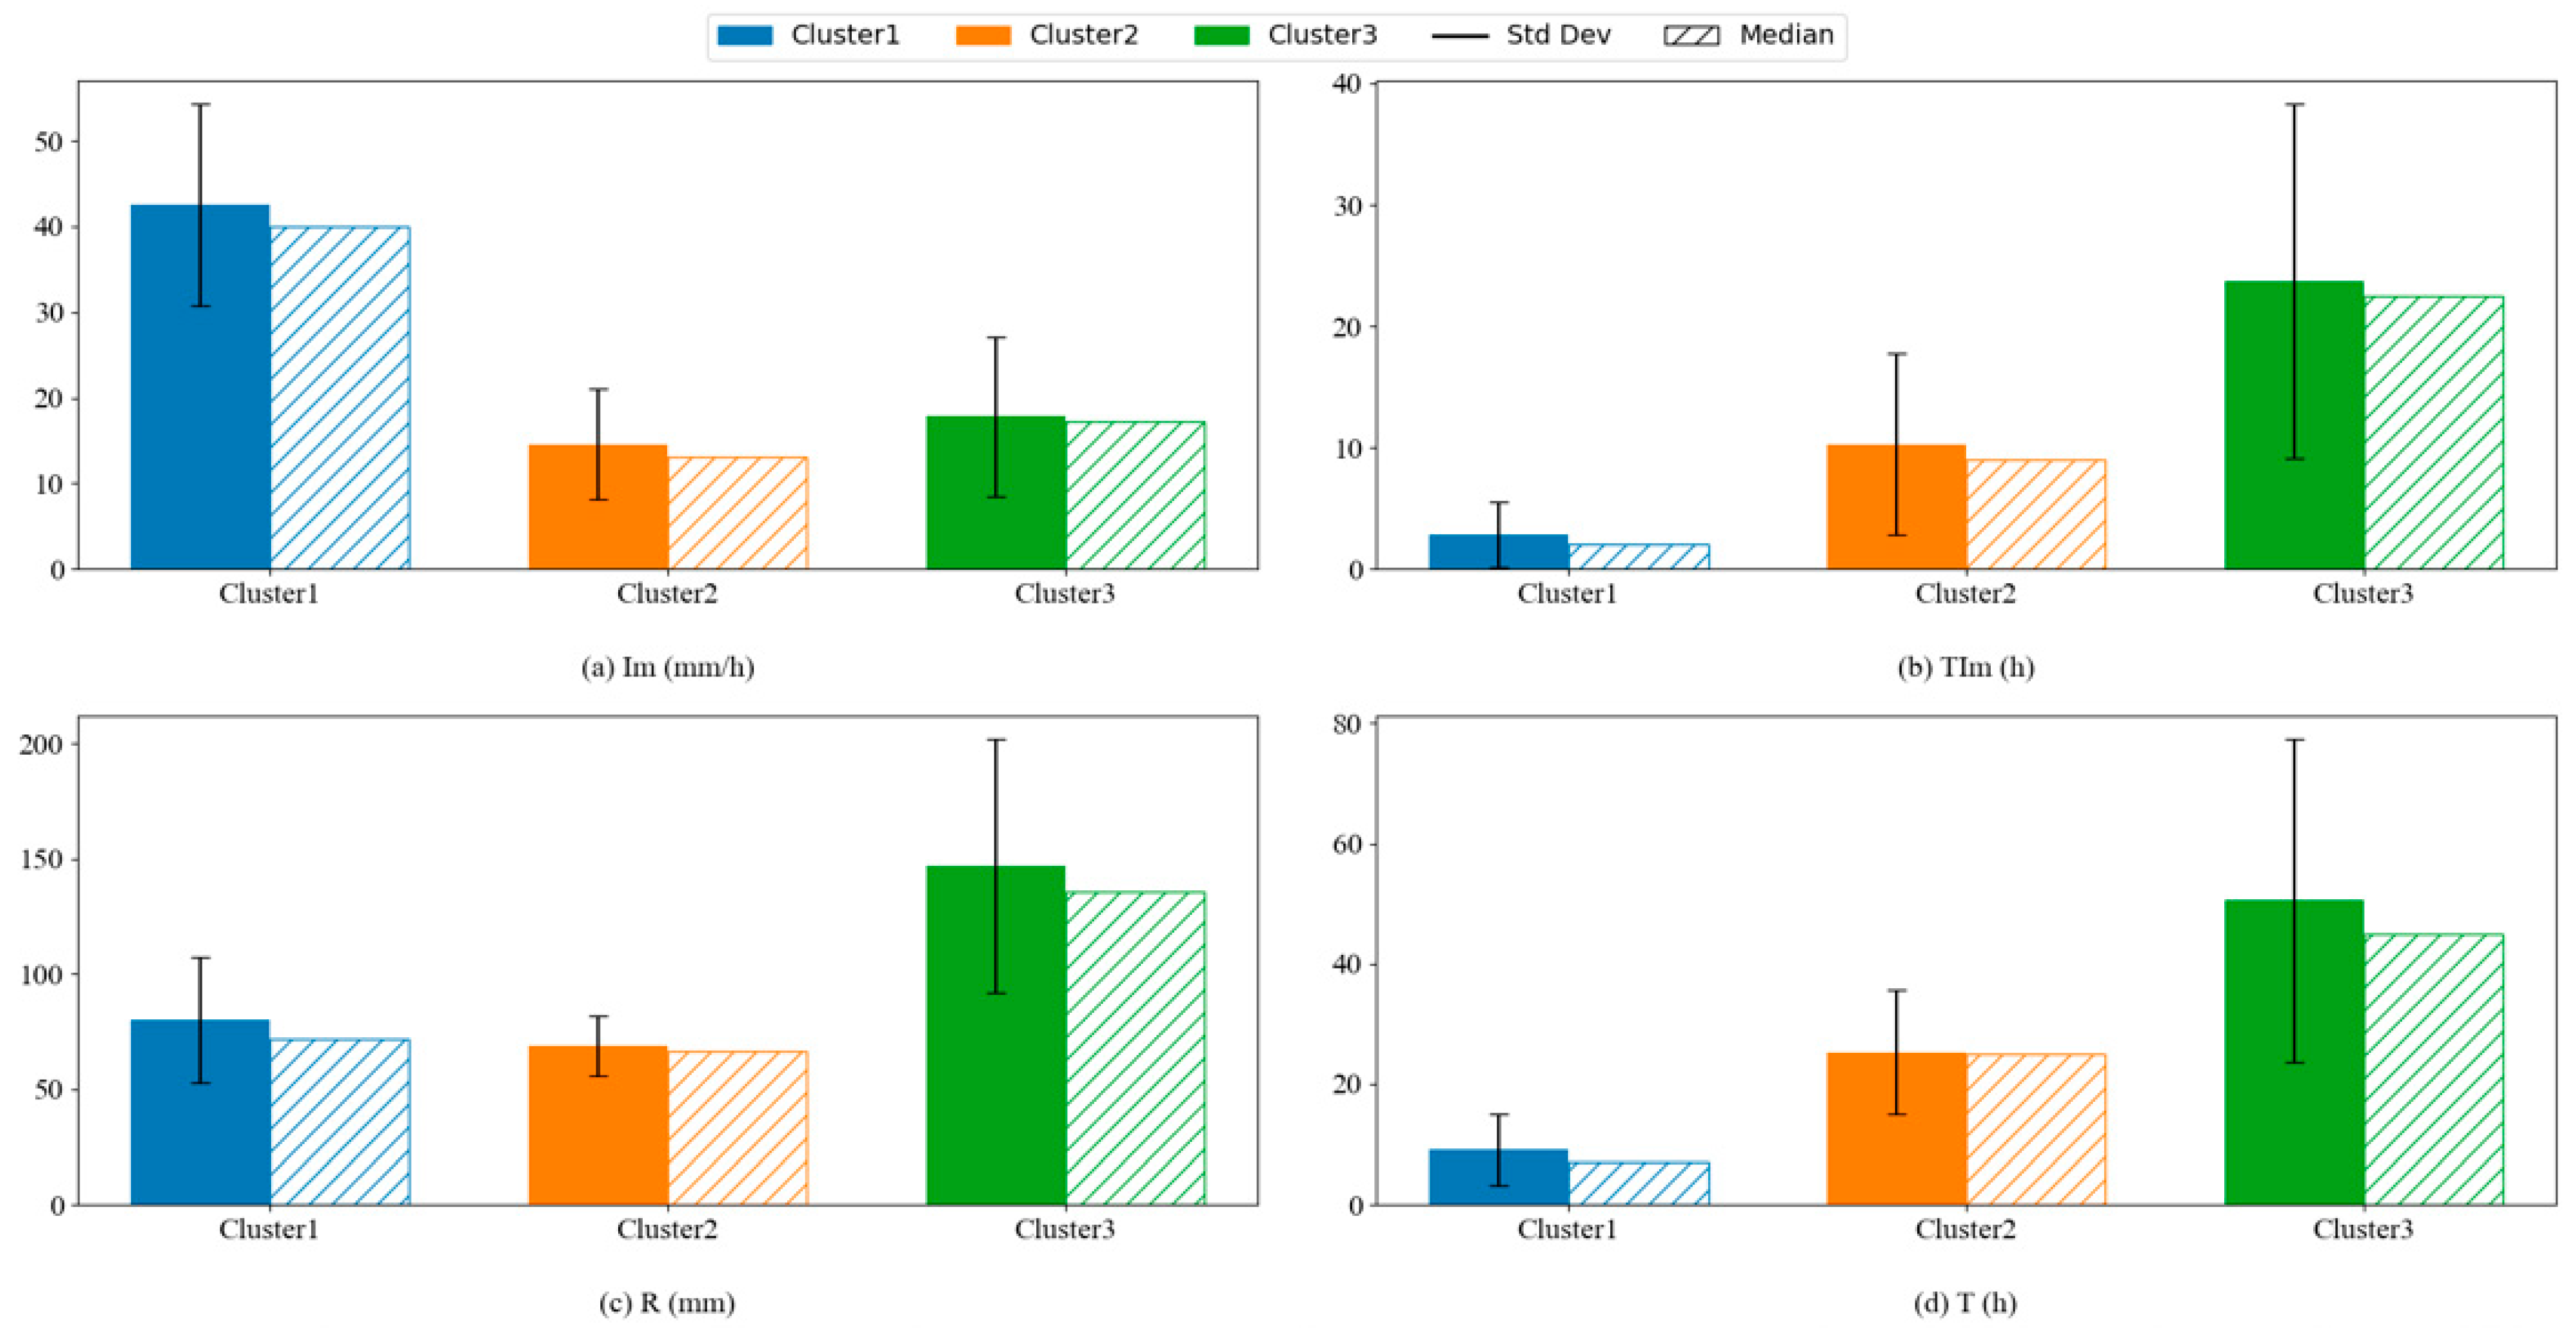
- Cluster 1: Short-Duration, High-Intensity Rainfall
- Cluster 2: Sustained, Moderate-Intensity Rainfall
- Cluster 3: Persistent, Moderate-High Intensity Rainfall
4.1.3. Response of Classified Extreme Rainfall Characteristics to Climate Change
- Cluster 1: Short-Duration, High-Intensity Rainfall
- Cluster 2: Sustained, Moderate-Intensity Rainfall
- Cluster 3: Persistent, Moderate-High Intensity Rainfall
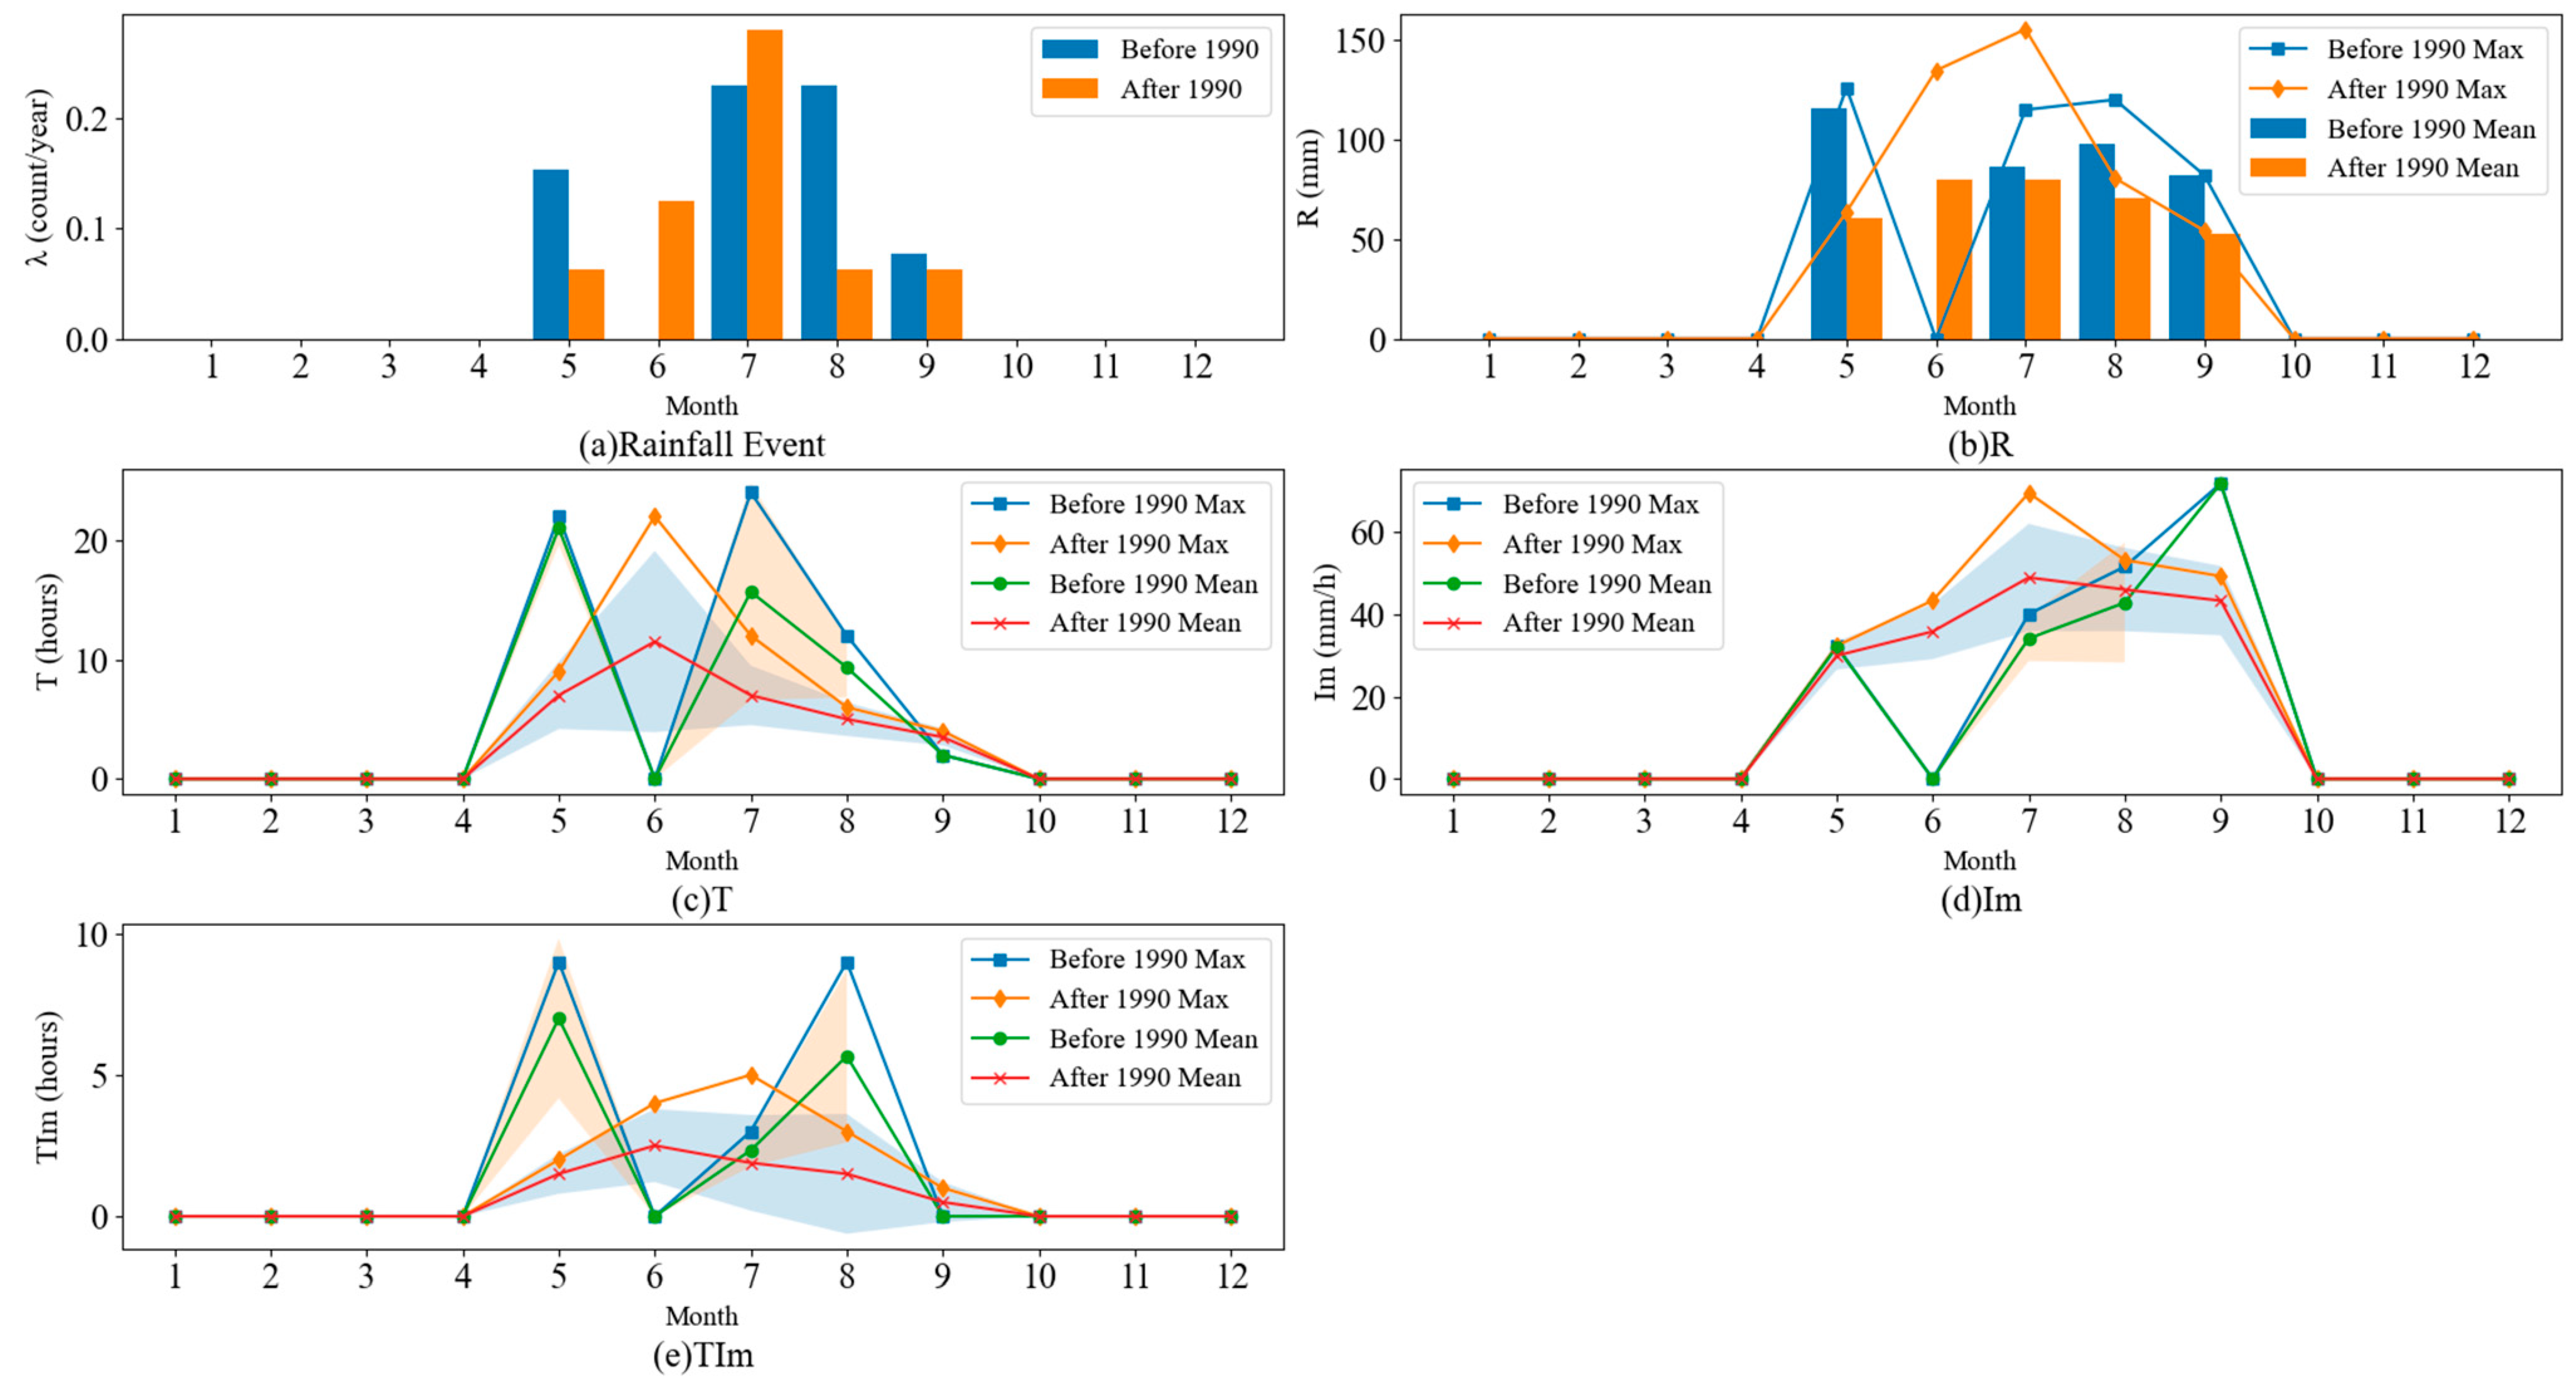
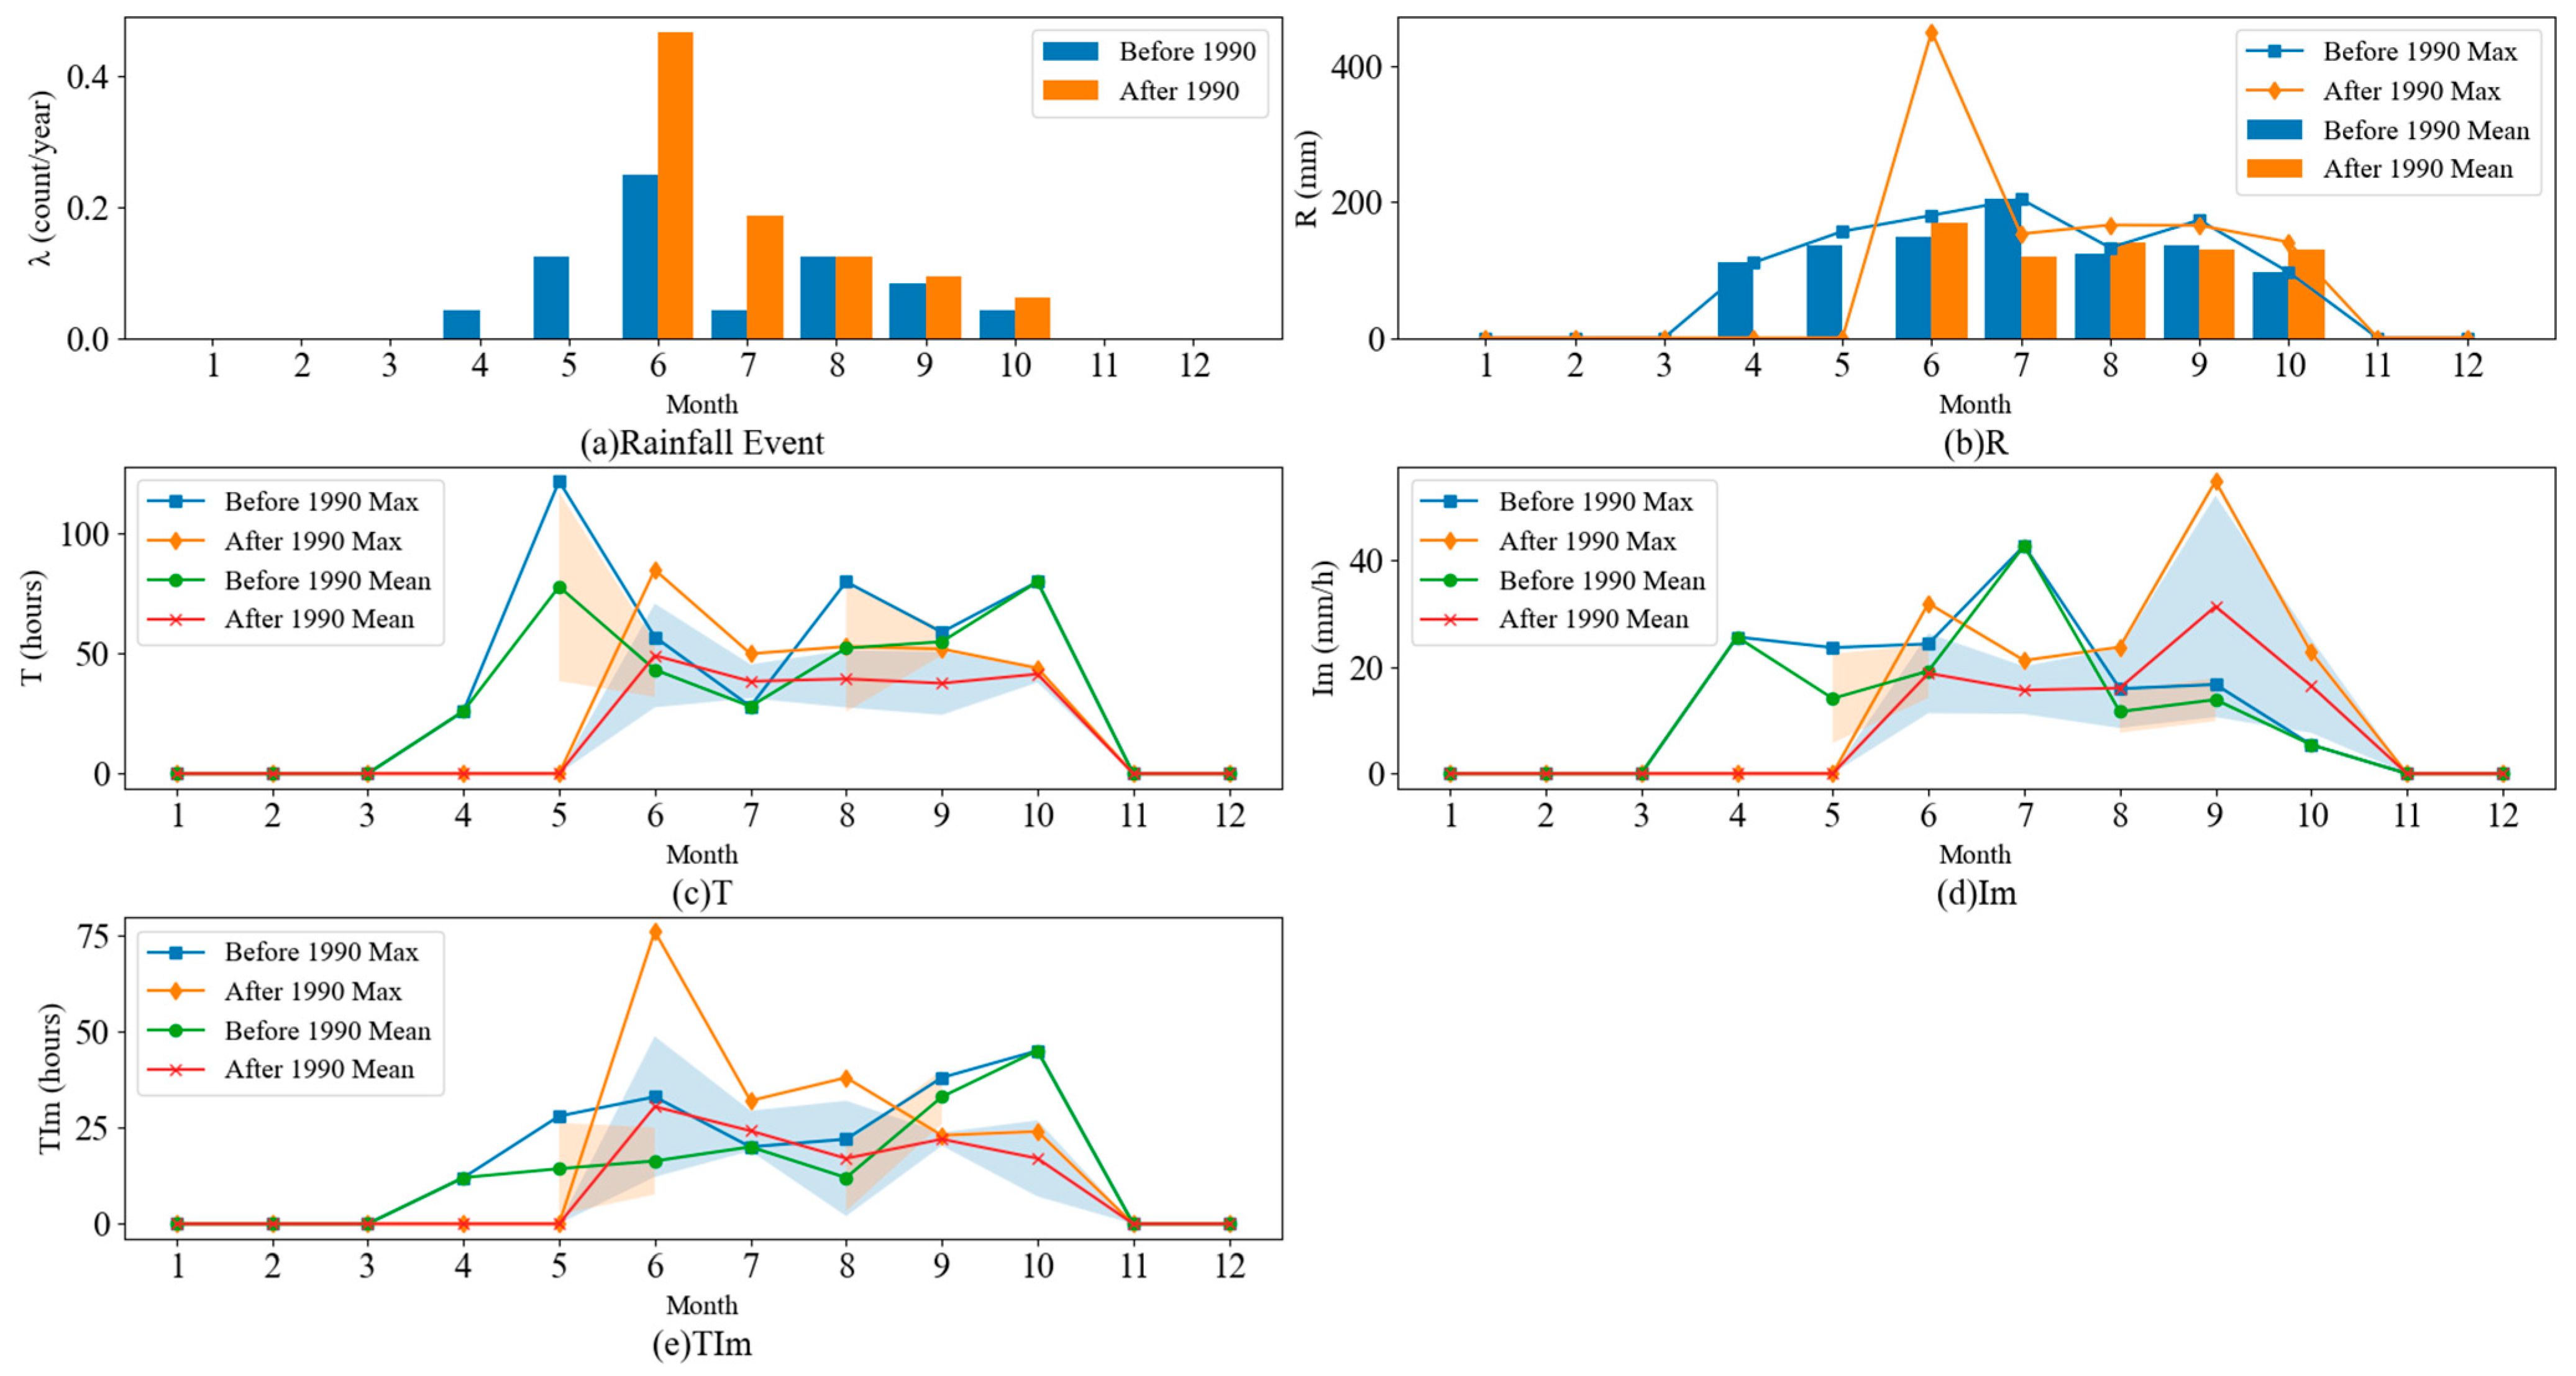
- (a)
- λ (count/year) displays the monthly frequency of rainfall events before and after 1990. Blue bar chart represents the average frequency of rainfall events before 1990. Orange bar chart represents the average frequency of rainfall events after 1990.
- (b)
- R (mm) shows the average total monthly rainfall and the maximum monthly rainfall before and after 1990. Blue bar chart represents the average monthly rainfall before 1990, Orange bar chart represents the average monthly rainfall after 1990, Blue line represents the maximum monthly rainfall before 1990, Orange line represents the maximum monthly rainfall after 1990.
- (c)
- T (hours) compares the changes in rainfall duration across months before and after 1990. Blue line represents the maximum monthly rainfall duration before 1990, Orange line represents the maximum monthly rainfall duration after 1990, Blue shaded area represents the standard deviation range of the average monthly rainfall duration before 1990, Orange shaded area represents the standard deviation range of the average monthly rainfall duration after 1990.
- (d)
- Im (mm/h) displays the changes in maximum monthly rainfall intensity before and after 1990. Blue line represents the maximum monthly rainfall intensity before 1990, Orange line represents the maximum monthly rainfall intensity after 1990, Blue shaded area represents the standard deviation range of the average monthly rainfall intensity before 1990, Orange shaded area represents the standard deviation range of the average monthly rainfall intensity after 1990.
- (e)
- TIm (hour) shows the changes in the duration of maximum rainfall intensity before and after 1990. Blue line represents the maximum duration of monthly maximum rainfall intensity before 1990, Orange line represents the maximum duration of monthly maximum rainfall intensity after 1990, Blue shaded area represents the standard deviation range of the average duration of maximum rainfall intensity before 1990, Orange shaded area represents the standard deviation range of the average duration of maximum rainfall intensity after 1990. In Figure 15, the figure illustrates the average changes in extreme rainfall characteristics before and after 1990.
4.2. Flood Response Analysis
4.2.1. Characteristics of Clustered Floods
- Cluster 1 Extreme Rainfall Floods
- Cluster 2 Extreme Rainfall Floods
- Cluster 3 Extreme Rainfall Floods
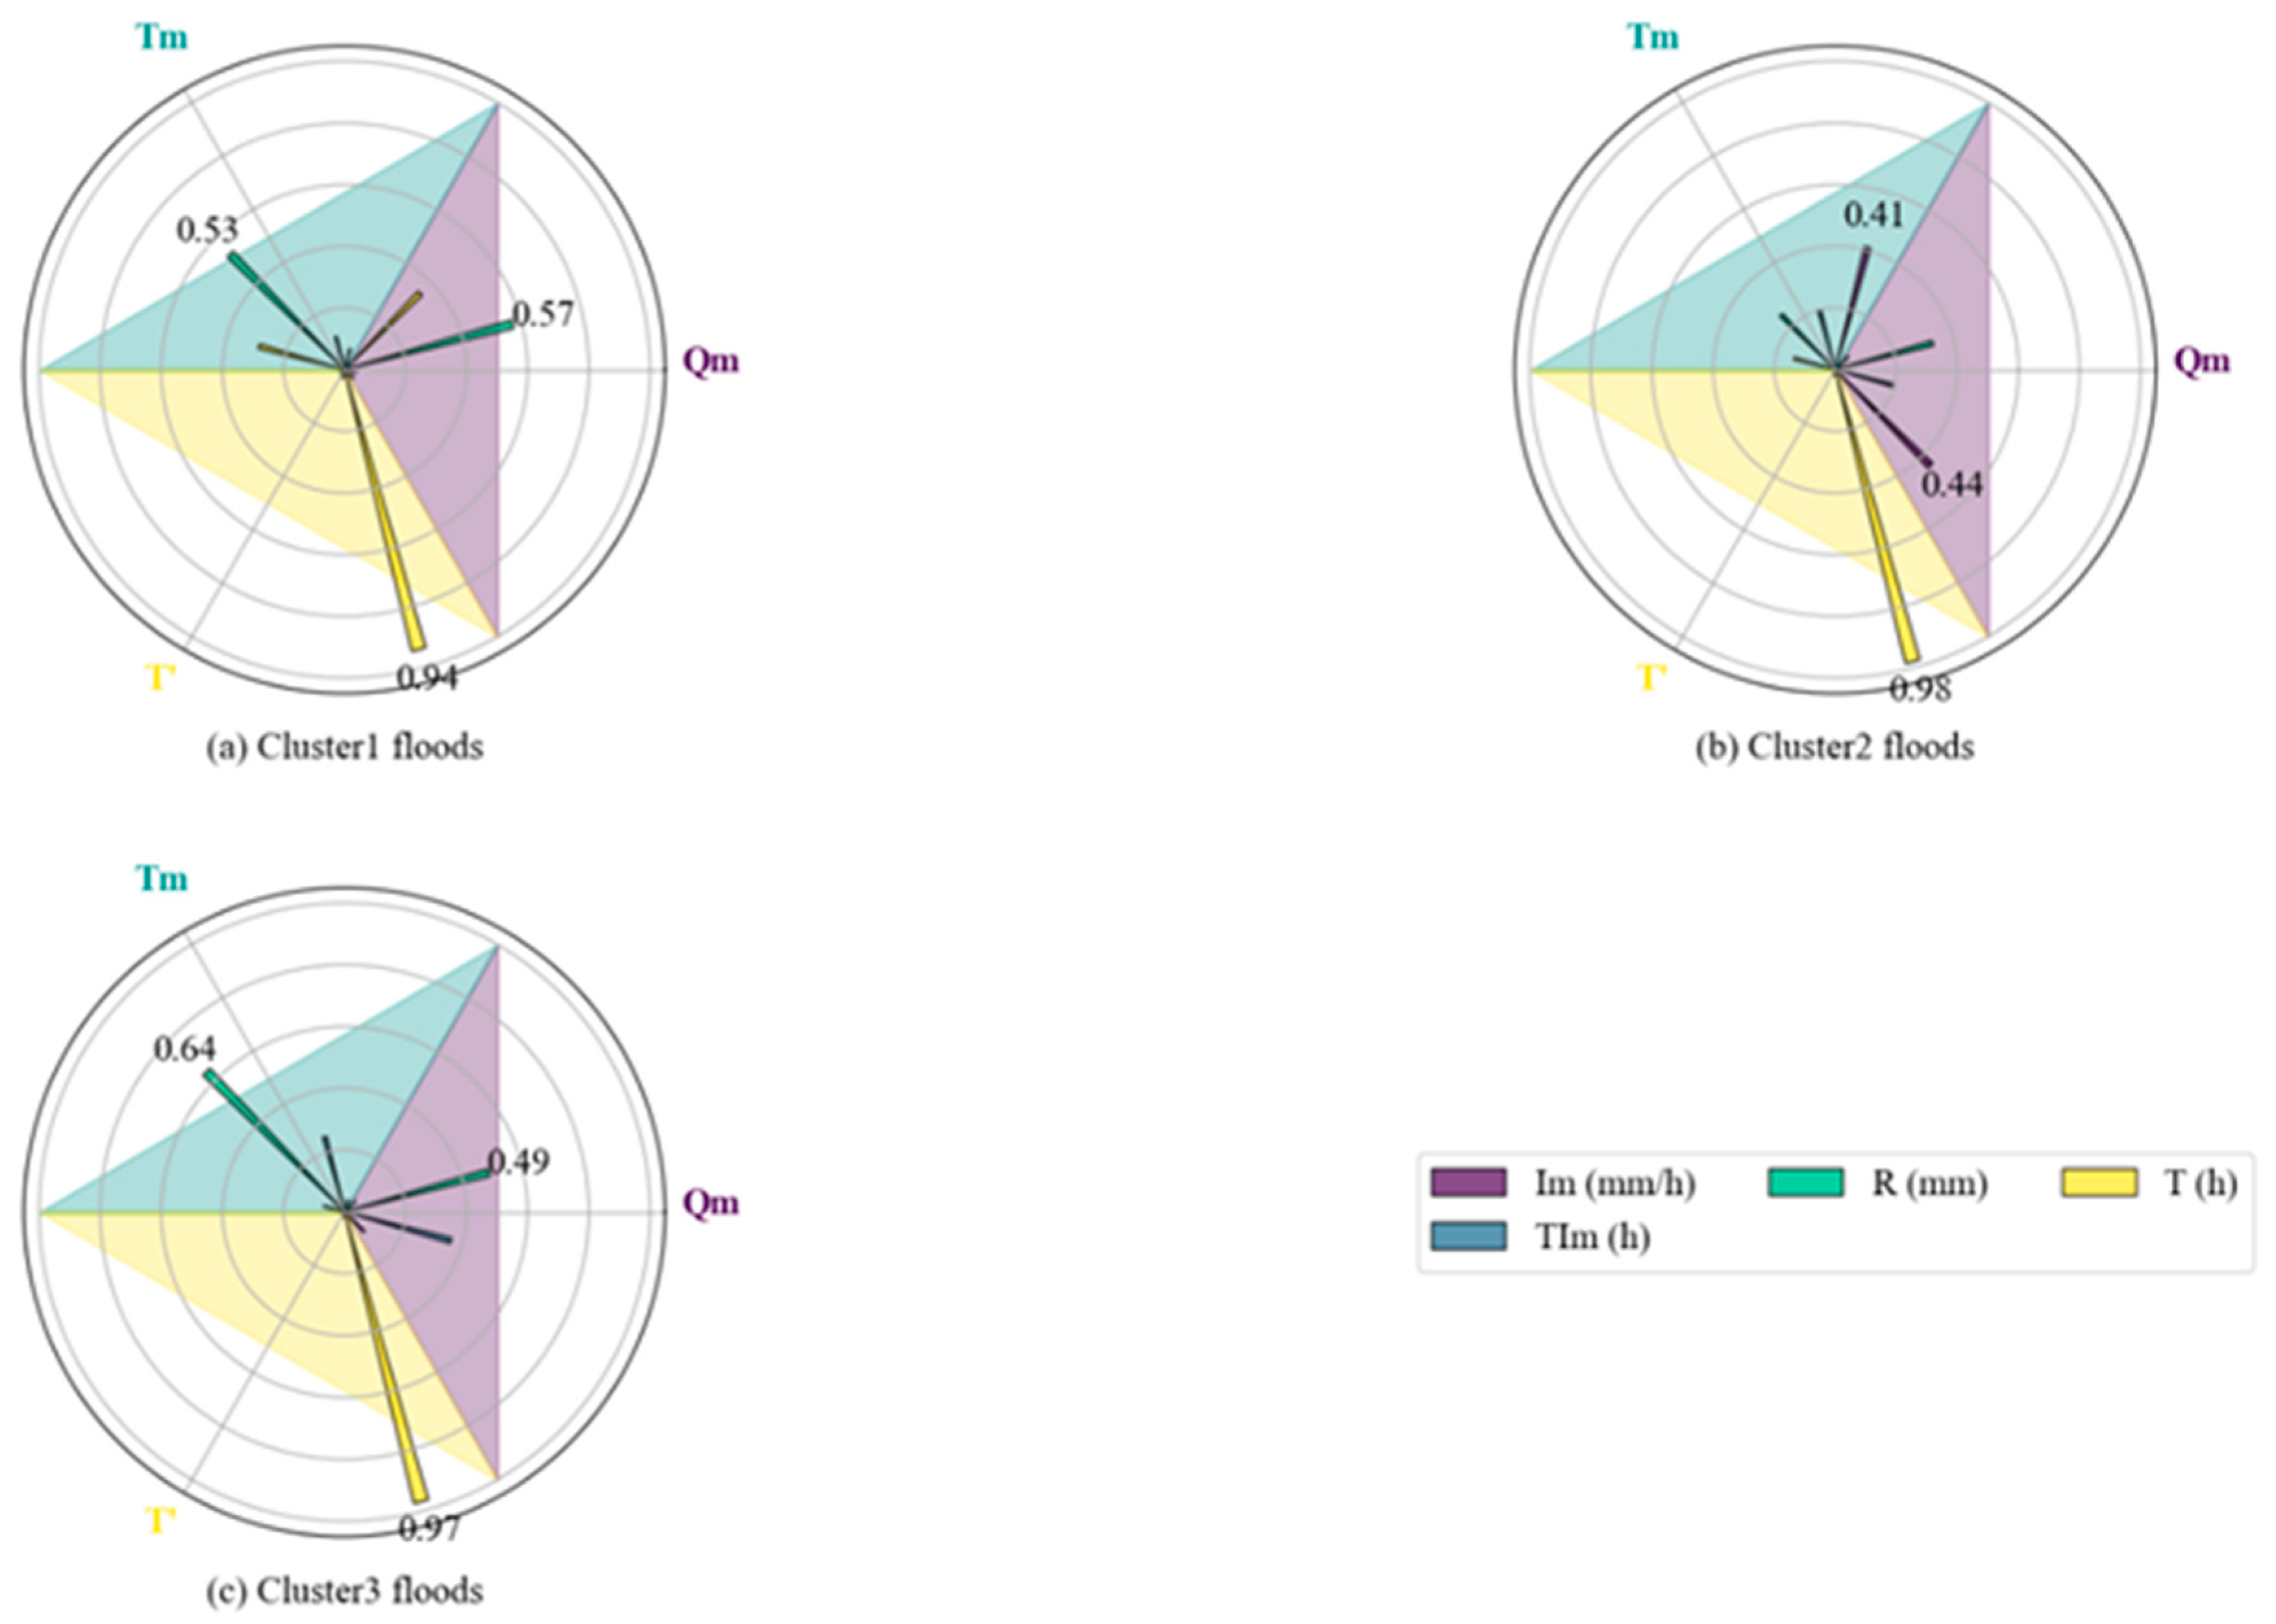
4.2.2. Analysis of Rainfall Influencing Factors on Clustered Floods
- Flood Peak Discharge:
- Flood Peak Discharge Factors:
5. Conclusions
- Climate change will lead to long-term changes in rainfall intensity and distribution patterns, increasing the frequency and intensity of extreme rainfall events. Although short-duration heavy rainfall may reduce peak discharge, frequent extreme rainfall events will exacerbate the suddenness and unpredictability of floods, posing greater challenges for flood management in small watersheds.
- Floods from sustained moderate-intensity rainfall tend to have longer durations and more gradual rainfall processes. In the long term, climate change may enhance rainfall intensity and shorten the rainfall duration, leading to increased peak discharge. Therefore, future flood control facility designs, and emergency response systems must be capable of adapting to more frequent sustained moderate-intensity rainfall events.
- With the intensification of climate change, increased rainfall intensity and shortened rainfall duration have become significant features of hydrological changes in small watersheds. Due to their steep slopes and small catchment areas, small watersheds respond rapidly to rainfall. The increase in rainfall intensity and shortening of rainfall duration result in rapid accumulation of surface runoff, which will have a significant impact on the geological disaster risk in small watersheds, particularly landslides and debris flows.
Author Contributions
Funding
Data Availability Statement
Conflicts of Interest
Correction Statement
References
- Blöschl, G.; Hall, J.; Parajka, J.; Perdigão, R.A.P.; Merz, B.; Arheimer, B.; Aronica, G.T.; Bilibashi, A.; Bonacci, O.; Borga, M.; et al. Changing climate shifts timing of European floods. Science 2017, 357, 588–590. [Google Scholar] [CrossRef] [PubMed]
- Zhou, G.; Wei, X.; Wu, Y.; Liu, S.; Huang, Y.; Yan, J.; Zhang, D.; Zhang, Q.; Liu, J.; Meng, Z.; et al. Quantifying the hydrological responses to climate change in an intact forested small watershed in Southern China. Glob. Change Biol. 2011, 17, 3736–3746. [Google Scholar] [CrossRef]
- Máca, P.; Torfs, P. The influence of temporal rainfall distribution in the flood runoff modelling. Soil Water Res. 2009, 4, S102–S110. [Google Scholar] [CrossRef]
- Sun, W.; Li, J.; Yu, R.; Li, N.; Zhang, Y. Exploring changes of precipitation extremes under climate change through global variable-resolution modeling. Sci. Bull. 2024, 69, 237–247. [Google Scholar] [CrossRef]
- Singh, N.K.; Emanuel, R.E.; McGlynn, B.L.; Miniat, C.F. Impact of climate variability on hydrological responses in headwater catchments. Water Resour. Res. 2021, 57, e2020WR028827. [Google Scholar] [CrossRef]
- Blöschl, G.; Ardoin-Bardin, S.; Bonell, M.; Dorninger, M.; Goodrich, D.; Gutknecht, D.; Matamoros, D.; Merz, B.; Shand, P.; Szolgay, J. At what scales do climate variability and land cover change impact on flooding and low flows? Hydrol. Process. 2007, 21, 1241–1247. [Google Scholar] [CrossRef]
- Sun, Q.; Zhang, X.; Zwiers, F.; Westra, S.; Alexander, L. A global, continental, and regional analysis of changes in extreme precipitation. J. Clim. 2021, 34, 243–258. [Google Scholar] [CrossRef]
- van der Wiel, K.; Bintanja, R. Contribution of climatic changes in mean and variability to monthly temperature and precipitation extremes. Commun. Earth Environ. 2021, 2, 1. [Google Scholar] [CrossRef]
- Donat, M.G.; Angélil, O.; Ukkola, A.M. Intensification of precipitation extremes in the world’s humid and water-limited regions. Environ. Res. Lett. 2019, 14, 065003. [Google Scholar] [CrossRef]
- Li, S.; Chen, Y.; Wei, W.; Fang, G.; Duan, W. The increase in extreme precipitation and its proportion over global land. J. Hydrol. 2024, 628, 130456. [Google Scholar] [CrossRef]
- Allan, R.P.; Soden, B.J. Atmospheric warming and the amplification of precipitation extremes. Science 2008, 321, 1481–1484. [Google Scholar] [CrossRef] [PubMed]
- Gao, T.; Wang, H.J.; Zhou, T. Changes of extreme precipitation and nonlinear influence of climate variables over monsoon region in China. Atmos. Res. 2017, 197, 379–389. [Google Scholar] [CrossRef]
- Llasat, M.C.; Marcos, R.; Llasat-Botija, M.; Gilabert, J.; Turco, M.; Quintana-Seguí, P. Flash flood evolution in North-Western Mediterranean. Atmos. Res. 2014, 149, 230–243. [Google Scholar] [CrossRef]
- Wu, Y.; Fang, H.; He, G.; Huang, L.; Wang, J. Climate-driven changes in hydrological and hydrodynamic responses in the Yarlung Tsangpo River. J. Hydrol. 2021, 598, 126267. [Google Scholar] [CrossRef]
- Sun, L.; Zhu, X.; Li, W.; Ai, W.; Chen, X.; Jiang, Y.; Wang, L.; Zou, X.; Zhao, S.; Zeng, H.; et al. State of China’s climate in 2023. Atmos. Ocean. Sci. Lett. 2024, 17, 100519. [Google Scholar] [CrossRef]
- Zhai, P.; Sun, A.; Ren, F.; Liu, X.; Gao, B.; Zhang, Q. Changes of climate extremes in China. Clim. Chang. 1999, 42, 203–218. [Google Scholar] [CrossRef]
- Ren, X.; Sha, Y.; Shi, Z.; Liu, X. Response of summer extreme precipitation over East Asia during the mid-Holocene versus future global warming. Glob. Planet. Chang. 2021, 197, 103398. [Google Scholar] [CrossRef]
- National Climate Center. China Climate Change Blue Book (2024); China Meteorological Administration: Beijing, China, 2024.
- Merz, B.; Aerts, J.; Arnbjerg-Nielsen, K.; Baldi, M.; Becker, A.; Bichet, A.; Blöschl, G.; Bouwer, L.M.; Brauer, A.; Cioffi, F.; et al. Floods and climate: Emerging perspectives for flood risk assessment and management. Nat. Hazards Earth Syst. Sci. 2014, 14, 1921–1942. [Google Scholar] [CrossRef]
- Blöschl, G.; Gaál, L.; Hall, J.; Kiss, A.; Komma, J.; Nester, T.; Parajka, J.; Perdigão, R.A.P.; Plavcová, L.; Rogger, M.; et al. Increasing river floods: Fiction or reality? WIREs Water 2015, 2, 329–344. [Google Scholar] [CrossRef]
- Donat, M.G.; Lowry, A.; Alexander, L.; O’Gorman, P.; Maher, N. More extreme precipitation in the world’s wet and dry regions. Nat. Clim. Chang. 2013, 3, 14–20. [Google Scholar] [CrossRef]
- Kuksina, L.; Belyakova, P.; Golosov, V.; Zhdanova, E.; Ivanov, M.; Tsyplenkov, A.; Gurinov, A. Flash floods on the northern coast of the Black Sea: Formation and characteristics. Int. J. Sediment Res. 2024; in press. [Google Scholar] [CrossRef]
- Nicótina, L.; Alessi Celegon, E.; Rinaldo, A.; Marani, M. On the impact of rainfall patterns on the hydrologic response. Water Resour. Res. 2008, 44, W12401. [Google Scholar] [CrossRef]
- Jamshadali, V.H.; Reji, M.J.K.; Varikoden, H.; Vishnu, R. Spatial variability of South Asian summer monsoon extreme rainfall events and their association with global climate indices. J. Atmos. Sol.-Terr. Phys. 2021, 221, 105708. [Google Scholar] [CrossRef]
- Wang, G.-T.; Singh, V.P.; Yu, F.X. A rainfall-runoff model for small watersheds. J. Hydrol. 1992, 138, 97–117. [Google Scholar] [CrossRef]
- Liu, W.; Feng, Q.; Engel, B.A.; Yu, T.; Zhang, X.; Qian, Y. A probabilistic assessment of urban flood risk and impacts of future climate change. J. Hydrol. 2023, 618, 129267. [Google Scholar] [CrossRef]
- Sillmann, J.; Thorarinsdottir, T.; Keenlyside, N.; Schaller, N.; Alexander, L.V.; Hegerl, G.; Seneviratne, S.I.; Vautard, R.; Zhang, X.; Zwiers, F.W. Understanding, modeling and predicting weather and climate extremes: Challenges and opportunities. Weather Clim. Extrem. 2017, 18, 65–74. [Google Scholar] [CrossRef]
- Poff, N.L.; Richter, B.D.; Arthington, A.H.; Bunn, S.E.; Naiman, R.J.; Kendy, E.; Acreman, M.; Apse, C.; Bledsoe, B.P.; Freeman, M.C.; et al. The ecological limits of hydrologic alteration (ELOHA): A new framework for developing regional environmental flow standards. Freshw. Biol. 2010, 55, 147–170. [Google Scholar] [CrossRef]
- Wu, Y.; Yin, X.; Zhou, G.; Bruijnzeel, L.A.; Dai, A.; Wang, F.; Gentine, P.; Zhang, G.; Song, Y.; Zhou, D. Rising rainfall intensity induces spatially divergent hydrological changes within a large river basin. Nat. Commun. 2024, 15, 823. [Google Scholar] [CrossRef]
- Oyebode, O.; Stretch, D. Neural network modeling of hydrological systems: A review of implementation techniques. Nat. Resour. Model. 2019, 32, e12189. [Google Scholar] [CrossRef]
- Zhu, H.; Leandro, J.; Lin, Q. Optimization of Artificial Neural Network (ANN) for Maximum Flood Inundation Forecasts. Water 2021, 13, 2252. [Google Scholar] [CrossRef]
- Yaseen, Z.M.; El-shafie, A.; Jaafar, O.; Afan, H.A.; Sayl, K.N. Artificial intelligence based models for stream-flow forecasting: 2000–2015. J. Hydrol. 2015, 530, 829–844. [Google Scholar] [CrossRef]
- Mosavi, A.; Ozturk, P.; Chau, K.W. Flood prediction using machine learning models: Literature review. Water 2018, 10, 1536. [Google Scholar] [CrossRef]
- Nayak, M.; Das, S.; Senapati, M.R. Improving Flood Prediction with Deep Learning Methods. J. Inst. Eng. India Ser. B 2022, 103, 1189–1205. [Google Scholar] [CrossRef]
- Wright, M.N.; Ziegler, A.; König, I.R. Do little interactions get lost in dark random forests? BMC Bioinform. 2016, 17, 145. [Google Scholar] [CrossRef]
- Wang, Z.; Lai, C.; Chen, X.; Yang, B.; Zhao, S.; Bai, X. Flood hazard risk assessment model based on random forest. J. Hydrol. 2015, 527, 1130–1141. [Google Scholar] [CrossRef]
- Philander, S.G. (Ed.) El Niño, La Niña, and the Southern Oscillation; International Geophysics; Geophysical Fluid Dynamics Laboratory/NOAA, Princeton University: Princeton, NJ, USA, 1990; Volume 46, pp. 1–289.
- Loo, Y.Y.; Billa, L.; Singh, A. Effect of climate change on seasonal monsoon in Asia and its impact on the variability of monsoon rainfall in Southeast Asia. Geosci. Front. 2015, 6, 817–823. [Google Scholar] [CrossRef]
- Yu, Y.; You, Q.; Zuo, Z.; Zhang, Y.; Cai, Z.; Li, W.; Jiang, Z.; Ullah, S.; Tang, X.; Zhang, R.; et al. Compound climate extremes in China: Trends, causes, and projections. Atmos. Res. 2023, 286, 106675. [Google Scholar] [CrossRef]


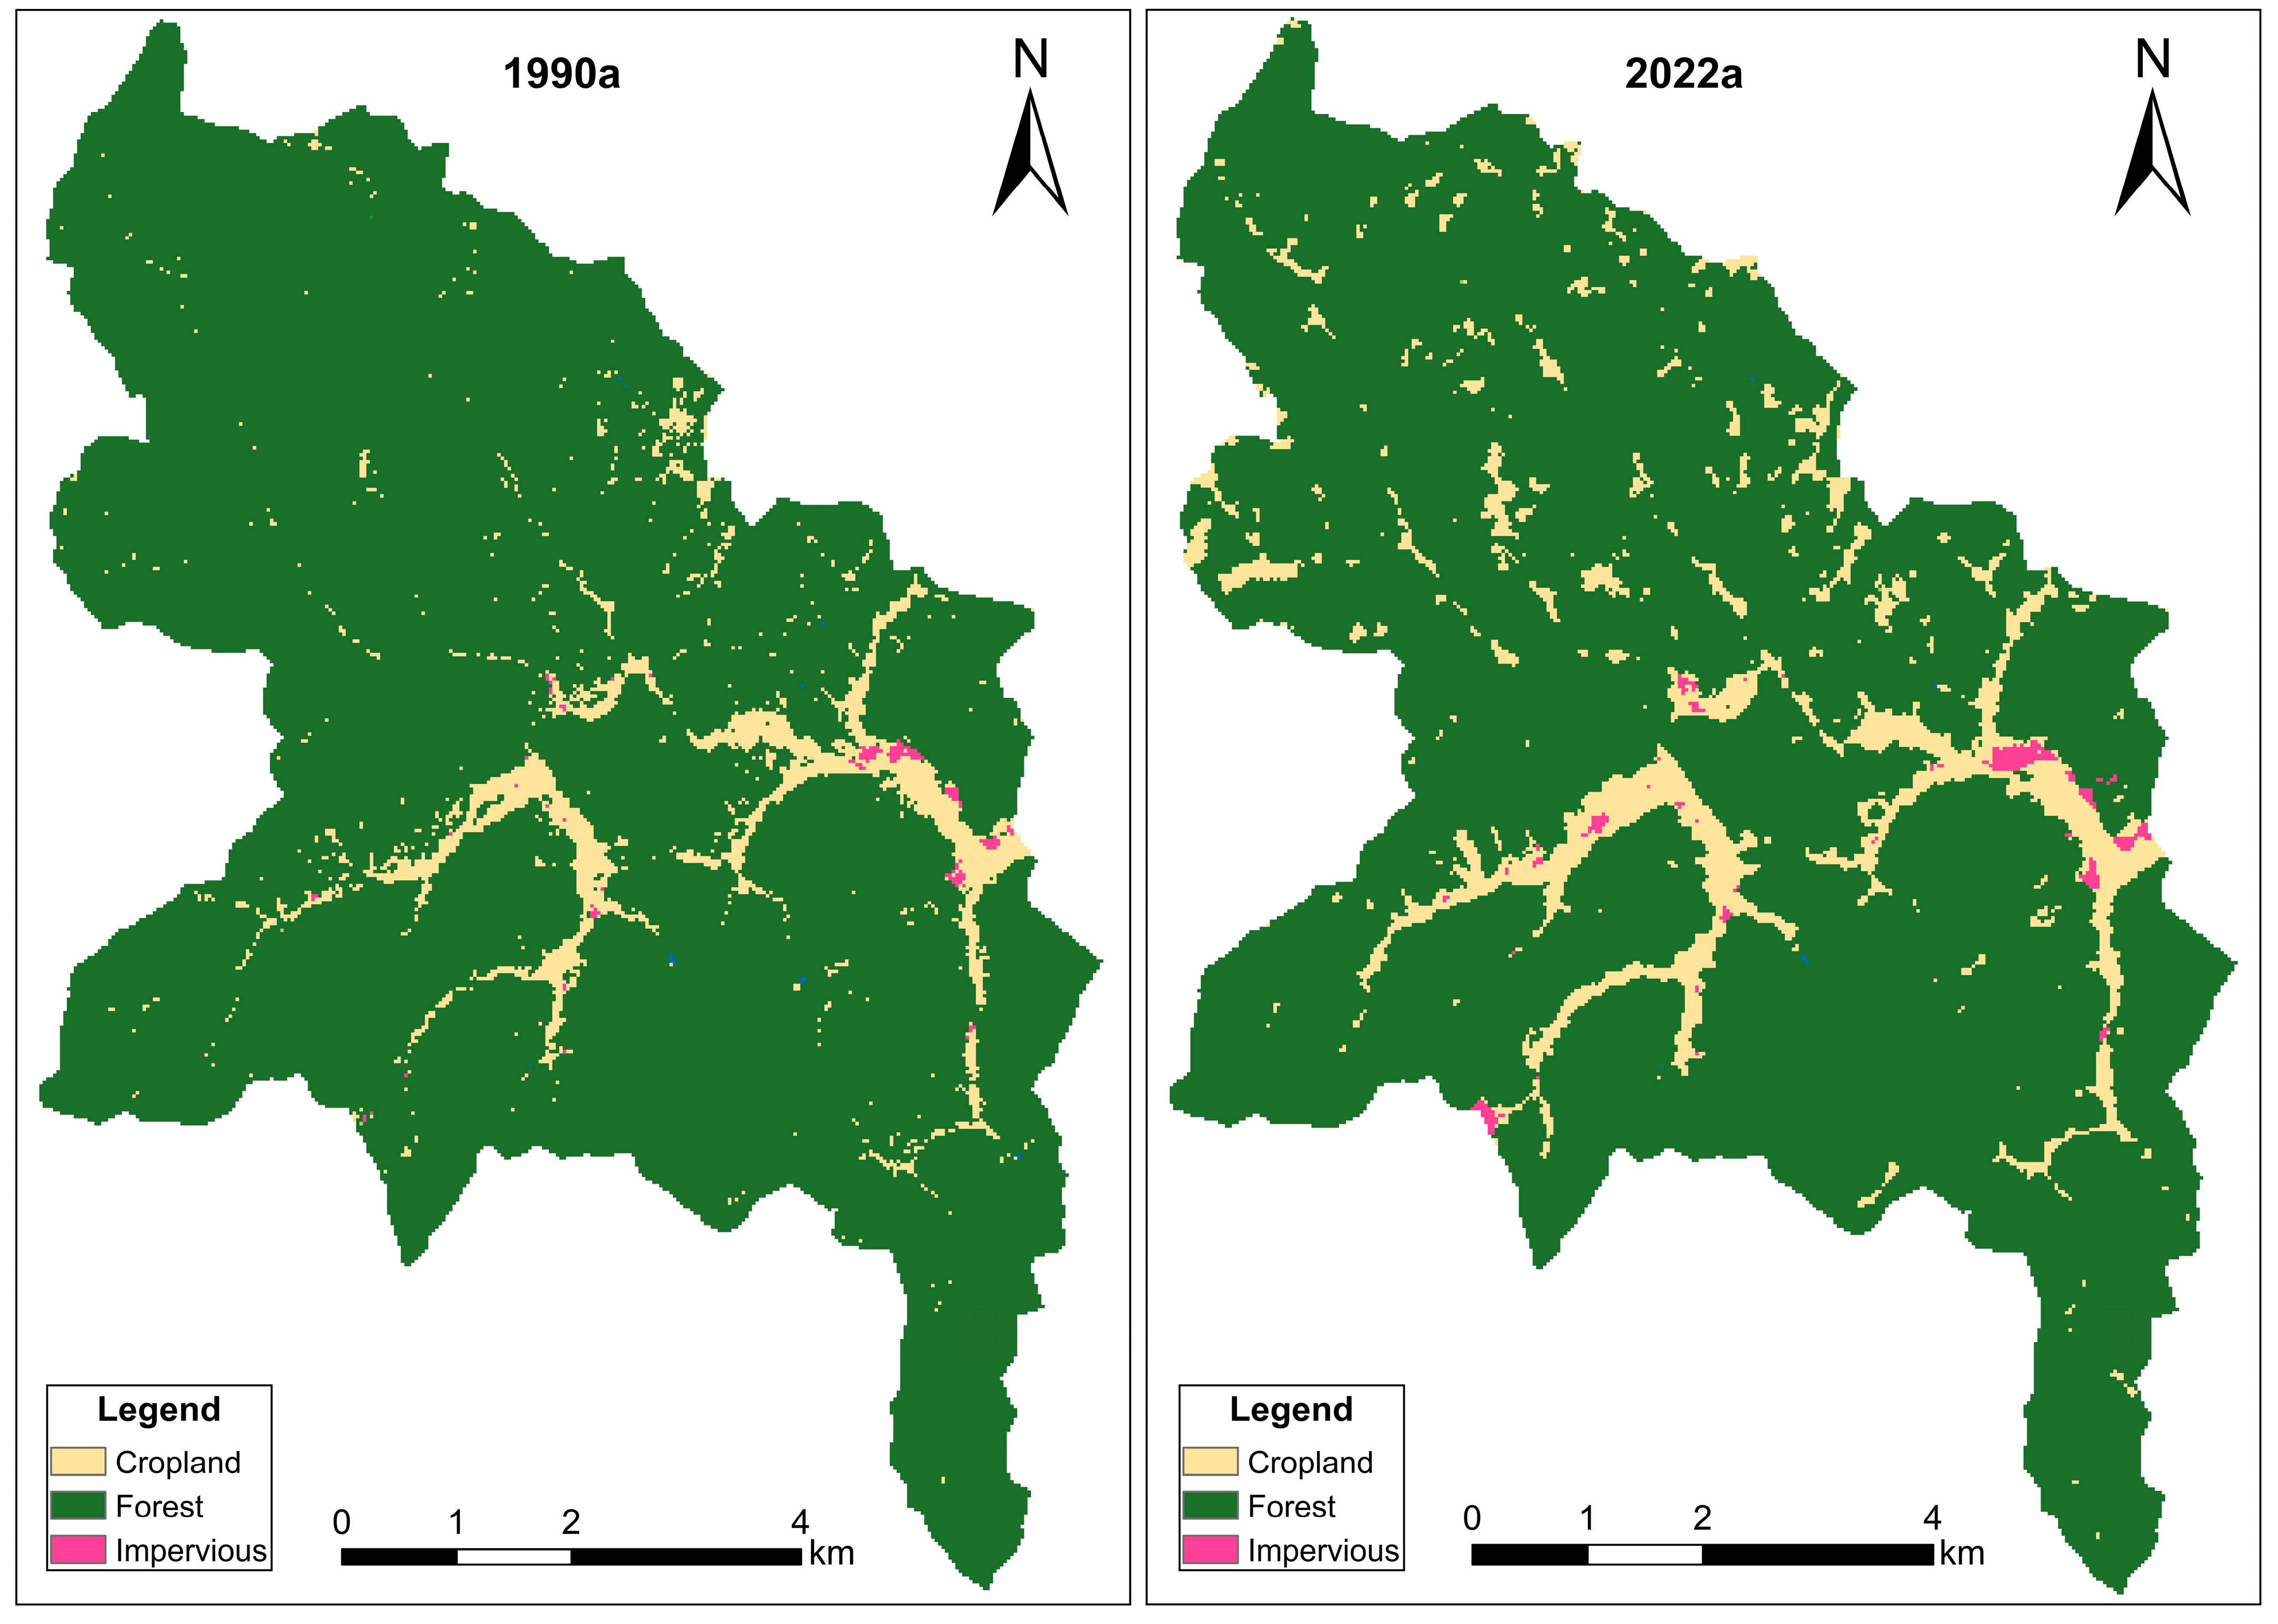
| Year | Cropland (km2) | Forest (km2) | Impervious (km2) | Total Area (km2) |
|---|---|---|---|---|
| 1990 | 3.3 | 60.0 | 0.1 | 63.5 |
| 2022 | 5.6 | 57.5 | 0.3 | 63.5 |
| Indicator | Formula | |
|---|---|---|
| flood characteristics | flood peak discharge Qm (m3/s) | Qm = max (Qt) |
| peak occurrence time Tm (h) | Tm = T (Qm) | |
| flood duration T’ (h) | T’ = Te − Ts + 1 |
| Cluster | Indicator | Median | Mean | Standard Deviation |
|---|---|---|---|---|
| Cluster 1 extreme rainfall | Im (mm/h) | 40.0 | 42.5 | 11.8 |
| TIm (h) | 2.0 | 2.8 | 2.7 | |
| R (mm) | 71.4 | 79.9 | 27.2 | |
| T (h) | 7.0 | 9.1 | 5.9 | |
| Cluster 2 extreme rainfall | Im (mm/h) | 13.1 | 14.6 | 6.5 |
| TIm (h) | 9.0 | 10.3 | 7.5 | |
| R (mm) | 66.4 | 68.6 | 13.0 | |
| T (h) | 25.0 | 25.3 | 10.3 | |
| Cluster 3 extreme rainfall | Im (mm/h) | 17.3 | 17.8 | 9.3 |
| TIm (h) | 22.5 | 23.7 | 14.6 | |
| R (mm) | 135.8 | 146.9 | 55.0 | |
| T (h) | 45.0 | 50.5 | 26.9 |
| Indicator | Cluster 1 | Cluster 2 | Cluster 3 | ||||||
|---|---|---|---|---|---|---|---|---|---|
| Before 1990 | After 1990 | Change Rate (%) | Before 1990 | After 1990 | Change Rate (%) | Before 1990 | After 1990 | Change Rate (%) | |
| (event/decade) | 4.0 | 7.0 | 75.0 | 25.0 | 24.0 | −4.0 | 7.0 | 11.0 | 57.1 |
| Im (mm/h) | 40.7 | 43.2 | 6.2 | 14.3 | 15.3 | 7.6 | 17.3 | 18.9 | 9.4 |
| TIm (h) | 4.2 | 1.8 | −57.6 | 12.2 | 9.3 | −23.8 | 25.7 | 18.8 | −26.8 |
| R (mm) | 96.1 | 74.0 | −23.0 | 69.1 | 69.6 | 0.7 | 138.5 | 150.1 | 8.4 |
| T (h) | 13.2 | 7.4 | −44.3 | 26.9 | 22.6 | −15.7 | 52.6 | 44.1 | −16.2 |
| Characteristics | Median | Mean | Standard Deviation | |
|---|---|---|---|---|
| Cluster1 flood | (m3/s) | 63.3 | 73.4 | 47.2 |
| Tm (h) | 4.0 | 5.9 | 4.4 | |
| (h) | 7.5 | 10.3 | 6.2 | |
| Cluster2 flood | (m3/s) | 52.3 | 52.7 | 25.2 |
| Tm (h) | 15.0 | 15.5 | 9.3 | |
| (h) | 25.0 | 25.8 | 9.8 | |
| Cluster3 flood | (m3/s) | 108.0 | 124.3 | 78.8 |
| Tm (h) | 28.0 | 31.4 | 15.5 | |
| (h) | 45.0 | 48.2 | 20.3 |
| Rainfall Features | Qm (m3/s) | Tm (h) | Tꞌ | |
|---|---|---|---|---|
| Cluster1 flood | Im (mm/h) | 0.04 | 0.07 | 0.01 |
| TIm (h) | 0.04 | 0.11 | 0.02 | |
| R (mm) | 0.57 | 0.53 | 0.03 | |
| T (h) | 0.35 | 0.29 | 0.94 | |
| Cluster2 flood | Im (mm/h) | 0.44 | 0.41 | 0.00 |
| TIm (h) | 0.20 | 0.20 | 0.00 | |
| R (mm) | 0.33 | 0.25 | 0.02 | |
| T (h) | 0.06 | 0.14 | 0.98 | |
| Cluster3 flood | Im (mm/h) | 0.09 | 0.04 | 0.01 |
| TIm (h) | 0.36 | 0.25 | 0.00 | |
| R (mm) | 0.49 | 0.64 | 0.02 | |
| T (h) | 0.05 | 0.07 | 0.97 |
| Indicator | Cluster 1 Flood | Cluster 2 Flood | Cluster 3 Flood | ||||||
|---|---|---|---|---|---|---|---|---|---|
| Before 1990 | After 1990 | Change Rate (%) | Before 1990 | After 1990 | Change Rate (%) | Before 1990 | After 1990 | Change Rate (%) | |
| Qm (m3/s) | 93.1 | 64.0 | −31.3 | 48.0 | 57.8 | 20.3 | 138.5 | 116.3 | −16.0 |
| Tm (h) | 8.4 | 4.6 | −45.2 | 18.4 | 12.4 | −32.4 | 35.2 | 29.3 | −16.8 |
| Tꞌ | 14.2 | 8.4 | −41.2 | 27.8 | 23.5 | −15.6 | 53.6 | 45.1 | −15.9 |
Disclaimer/Publisher’s Note: The statements, opinions and data contained in all publications are solely those of the individual author(s) and contributor(s) and not of MDPI and/or the editor(s). MDPI and/or the editor(s) disclaim responsibility for any injury to people or property resulting from any ideas, methods, instructions or products referred to in the content. |
© 2024 by the authors. Licensee MDPI, Basel, Switzerland. This article is an open access article distributed under the terms and conditions of the Creative Commons Attribution (CC BY) license (https://creativecommons.org/licenses/by/4.0/).
Share and Cite
Qian, J.-L.; Wu, Y.-X.; Zhang, Q.-T. The Response of Small Watershed Storm Floods to Climate Change. Water 2025, 17, 33. https://doi.org/10.3390/w17010033
Qian J-L, Wu Y-X, Zhang Q-T. The Response of Small Watershed Storm Floods to Climate Change. Water. 2025; 17(1):33. https://doi.org/10.3390/w17010033
Chicago/Turabian StyleQian, Jing-Lin, Yun-Xin Wu, and Qi-Ting Zhang. 2025. "The Response of Small Watershed Storm Floods to Climate Change" Water 17, no. 1: 33. https://doi.org/10.3390/w17010033
APA StyleQian, J.-L., Wu, Y.-X., & Zhang, Q.-T. (2025). The Response of Small Watershed Storm Floods to Climate Change. Water, 17(1), 33. https://doi.org/10.3390/w17010033