Article

Allelopathic Suppression of Cyanobacterial Blooms by the Aquatic Plant Vallisneria natans Enhanced by Red and Blue LED Light Supplementation

1
College of Life and Environmental Sciences, Wenzhou University, Wenzhou 325035, China
2
Guangxi Key Laboratory of Aquatic Biotechnology and Modern Ecological Aquaculture, Guangxi Academy of Marine Sciences, Guangxi Academy of Sciences, Nanning 530007, China
3
Sanyang Wetland Ecological Environment Research Institute, Wenzhou University, Wenzhou 325000, China
*
Authors to whom correspondence should be addressed.
Water 2025, 17(1), 131; https://doi.org/10.3390/w17010131
Submission received: 24 October 2024 / Revised: 8 December 2024 / Accepted: 31 December 2024 / Published: 6 January 2025

Abstract

:
Using allelochemicals produced by submerged plants to inhibit algal growth is an environmentally friendly approach to controlling harmful algal blooms in eutrophic lakes. This study aimed to evaluate the inhibition of cyanobacterial growth by allelochemicals accumulated by the aquatic plant Vallisneria natans, with enhancement through blue and red light-emitting diode (LED) supplementation. We conducted a laboratory experiment to assess the fluorescence parameters, enzyme activities, and phycocyanin contents of cyanobacteria Microcystis aeruginosa grown in different V. natans cultivation media. The fluorescence parameters in the BG-11 medium remained stable, but sharply decreased in both LED treatments, with nearly 100% inhibition observed after 12 h of incubation. Superoxide dismutase (SOD) and peroxidase activities were stable in the BG-11 treatment, but enhanced in both LED treatments, reaching maximum values within 48 h. Higher SOD activities were observed with blue LED compared with red LED, suggesting better performance with blue light. A constant high phycocyanin fluorescence intensity was observed in the BG-11 treatment, while both LED treatments showed lower intensities. These results provided strong evidence that LED supplementation enhances the inhibitory effects of V. natans on M. aeruginosa growth. The combination of aquatic plant growth with underwater LED light supplementation offers a promising approach to controlling cyanobacterial blooms.

1. Introduction

Anthropogenic eutrophication-induced cyanobacterial blooms in freshwater lakes are urgent global ecological issues [1,2]. In China, the cyanobacterial blooms of Microcystis aeruginosa are the primary type of harmful algal bloom (HAB) in many eutrophic lakes, such as Lake Taihu and Lake Chaohu [3,4]. M. aeruginosa releases cyanotoxins into water bodies, and these adversely affect the lake environment and human health [5]. Managing eutrophic waters dominated by M. aeruginosa has become an important research topic and is of public concern. Traditional algal removal methods can be categorized as physical, chemical, and biological approaches. Plant allelopathy, a concept introduced by Dr Hans Molisch in 1937, describes biochemical interactions among plants and microorganisms [6,7]. The mechanism underlying allelopathic algal inhibition by submerged plants is shown in Figure S1. These inhibitory effects involve the suppression of photosynthesis, disruption of cell membranes [8], and alteration of enzymatic activity [9]. Allelopathy can be considered as an environmentally friendly way to control HABs [10]. Given the current state of water environments, there has been a shift toward using the allelopathy of submerged plants to inhibit HABs [11].
The allelochemicals (natural plant toxins) produced by the submerged plants can be obtained through different methods, such as direct extraction from plant tissues, culture media of submerged plants, and co-cultivation of plants and phytoplankton [12]. Submerged plants such as Ceratophyllum demersum, Potamogeton malaianus, Myriophyllum verticillatum, and Vallisneria natans release allelochemicals that inhibit the cell growth of cyanobacteria such as M. aeruginosa [13,14]. A previous study detected algal inhibitory components in the culture media from aquatic plants, including polyols (e.g., propylene glycol), fatty acids (e.g., butyric acid), phenolic acids (e.g., isoferulic acid), and hydroxy acids (e.g., 7-hydroxyheptanoic acid) [15]. The allelochemical compound N-phenyl-2-naphthylamine isolated from leaf extracts has been found to influence the cell density and chlorophyll contents of three algal species (Chlorella vulgaris, Scenedesmus obliquus, and Scenedesmus quadricauda), revealing that this compound effectively inhibits algal growth [16]. Vallisneria, in particular, contains various allelochemical components, such as organic acids (e.g., pentanoic acid; hexanoic acid; sorbic acid; benzenecarboxylic acid; 3-pyridinecarboxylic acid; trans-cinnamic acid; 3-hydroxy-4-methoxybenzoic acid; azelaic acid; and N-hexadecanoic acid), alcohols and phenols (e.g., glycerin; benzyl alcohol; cyclic octaatomic sulfur), and ketone and ester (e.g., benzoic acid, 4-hydroxy; pentadecanoic acid, 14-methyl-, methyl ester; and 10-octadecenoic acid, methyl ester) [17]. As the submerged plant Vallisneria can adapt to a wide range of temperatures and has high nutrient uptake capability, it has been employed in the restoration of eutrophic lakes [18].
Light is essential for photosynthesis in aquatic plants. Light-emitting diodes (LEDs) are a novel light source, are both energy-efficient and durable [3], and LED supplementation is widely used to improve plant growth. A previous study used a flow tool prepared with oxidation carriers and LEDs to improve water quality in eutrophic lakes, and found a shift in the phytoplankton community from being dominated by cyanobacteria to domination by diatoms and green algae [19]. A previous study has determined the impact of LED light on the decolorization of dye wastewater by the aquatic plant C. demersum and showed that supplementary LEDs promoted the purification ability of this species and enhanced its resistance to stress [20]. Different light colors affect various physiological indicators of plants differently, and wavelengths of red and blue light are considered the most effective for plant growth; vegetable factories use both to enhance production [21,22]. Therefore, artificial light may enhance the growth of submerged plants and can be applied in aquatic ecosystem restoration, including the inhibition of HABs because of their ability to accumulate allelochemicals.
Differences in the photosynthesis of algal cells can reflect their stress status to some extent [23]. Chlorophyll fluorescence parameters such as Yield, α, ETRmax, and IK are important indicators for assessing photosynthetic efficiency [24,25]. The inhibition of algal growth involves damaging photosystem II (PS II) and reducing photosynthetic electron transport, consequently influencing algal photosynthesis [25]. The Yield represents the actual photochemical quantum yield, reflecting the efficiency of light energy conversion in algal cells [25]; α represents light energy utilization efficiency [24]; ETRmax represents the maximum photosynthetic electron transport rate, reflecting the overall capacity for photosynthesis [25]; and IK represents the half-saturation light intensity, reflecting the tolerance of algal cells to light conditions [24]. By determining these fluorescence parameters, we can efficiently evaluate the potential impact of allelochemicals in the water surrounding V. natans on the PS II photosynthetic efficiency of cyanobacteria. Low values of these parameters indicate a weak ability of cyanobacteria to utilize light energy for photosynthesis.
In addition, superoxide dismutase (SOD) is an important antioxidant enzyme in algal cells and a key component of their antioxidant systems. Antioxidant enzymes can remove reactive oxygen species (ROS) and free radicals, which can damage cells [26]. SOD activity has been found to decrease after allelochemical gramine (N,N-dimethyl-3-amino-methylindole) exposure [10]. Peroxidase (POD) is similar to SOD, and is a key enzyme in the antioxidant system of algal cells [27]. It also helps to maintain the balance between the production and consumption of ROS within algal cells. Furthermore, phycocyanin is a water-soluble accent pigment in cyanobacterial cells and has fluorescent properties. Phycocyanin is a specific protein marker for cyanobacterial blooms and an indicator of healthy cyanobacterial biomass in water bodies [28,29].
In this study, we investigated the allelopathic effects of different culture media of V. natans growth under various light color supplementation on the physiological responses of M. aeruginosa. The aim was to assess whether the application of artificial light could enhance the allelopathic inhibition of cyanobacterial growth by submerged plants. This study provides valuable insights into the potential applications of artificial light to improve the allelopathic inhibition efficacy of submerged plants against HABs, ultimately offering a sustainable approach to managing water quality in eutrophic lakes.

2. Materials and Methods

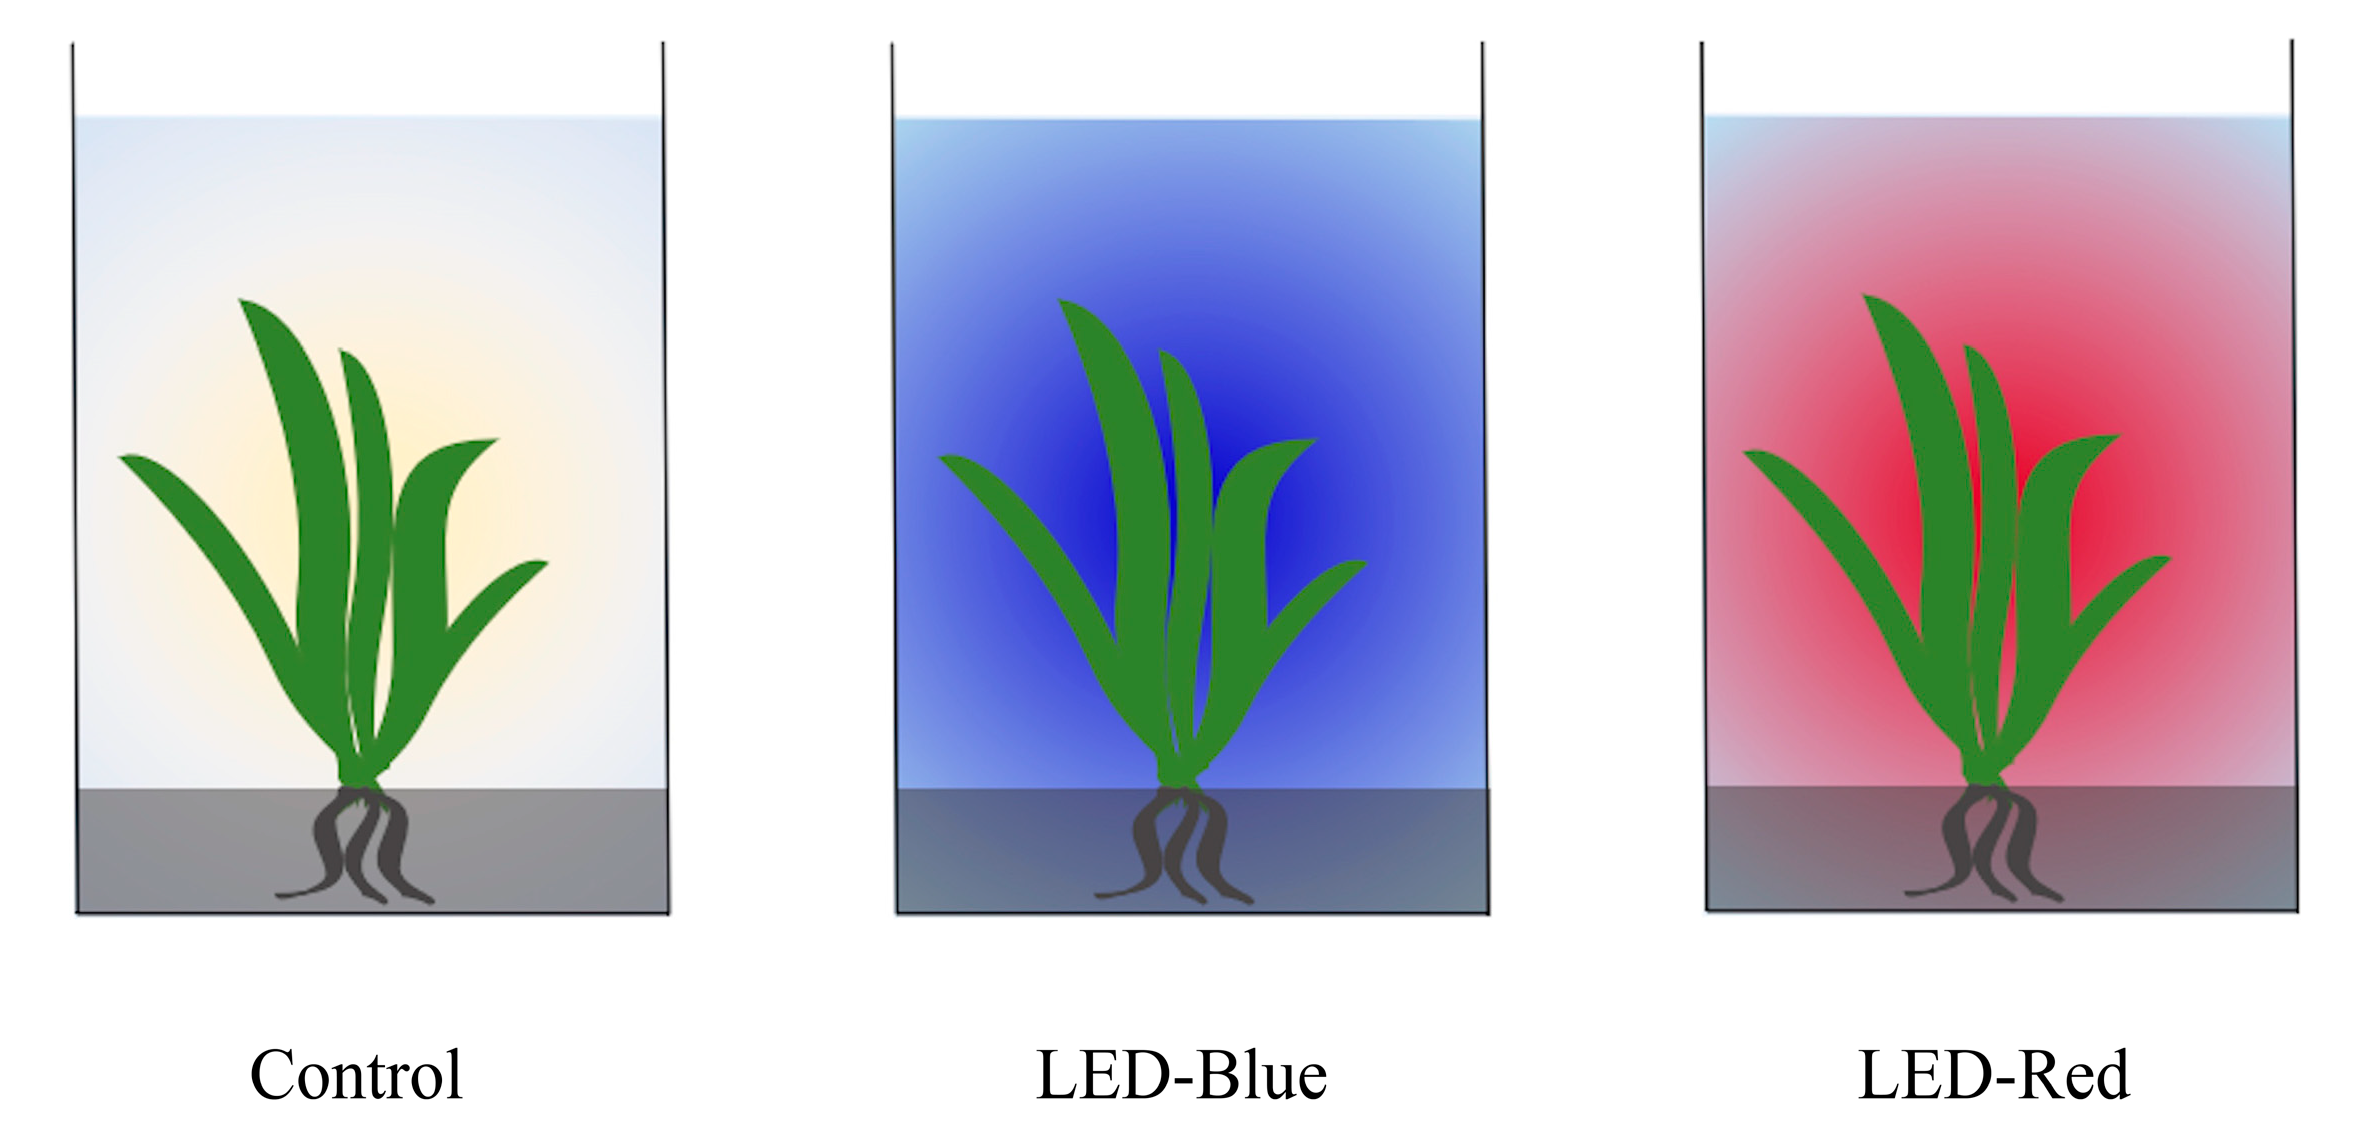
2.1. Acquisition of V. natans Culture Media for LED Light Supplementation

We purchased V. natans plants from Shuide Base, Guangdong Province, China, and placed each in a plastic container (30 × 30 × 50 cm) filled with tap water (45 L) in sunlight. The plants were then acclimated at a room temperature of 25 °C for 1 week. Healthy plants of similar heights were selected for the experiments. The culture media preparation setup is illustrated in Figure 1. Before the experiments, the plants were cleaned three to four times using ultrapure water (pH = 7.0, conductivity: 0.05 μS/cm, resistivity: 18.2 MΩ·cm) (UPT-I-20T, ULUPURE, Chengdu, China). Each 125 g wet weight of V. natans was planted in sterilized quartz sand (20034160, Shanghai National Pharmaceutical Group Chemical Reagent, Shanghai, China) in a sterilized 500 mL beaker, with three replicates. Each 500 mL beaker was then placed in an individual 3 L beaker filled with distilled water to submerge the plants. Each plant setup was placed in an incubator (RDN-1000C, Ningbo Yanghui Instrument, Ningbo, China) at 25 ± 1 °C.
In order to introduce a novel approach for the artificial control of harmful algal blooms in nature environments, we prepared V. natans cultures under three different light conditions: (1) fluorescent light with blue LED supplementation (LED-Blue); (2) fluorescent light with red LED supplementation (LED-Red); (3) fluorescent light as the control (Control). Both the blue and the red LED light intensities were set to 2000 lux, and the fluorescent light intensity was set to 3000 lux. The light–dark cycle was maintained at 12:12 h. These conditions were specifically chosen to simulate natural lighting scenarios, both with and without LED supplementation, in order to clarify the effects of allelochemicals released from submerged aquatic plants under fluorescent light combined with different color LED light supplementation on inhibiting cyanobacterial growth. After 7 days of incubation, the culture solution was filtered through a 0.45 μm microporous membrane filter (Q/YY8-1-88, Shanghai Xinya purification device factory, Shanghai, China) to remove microorganisms and other particulate materials that might potentially influence cyanobacterial growth. The filtered culture solutions were stored at 4 °C for subsequent use.

2.2. Stock Culture of M. aeruginosa and Experimental Treatments

Stock cultures of M. aeruginosa (FACHB-315, Institute of Hydrobiology, Chinese Academy of Sciences, Beijing, China) were maintained using the BG-11 medium (Tables S1 and S2) in 250 mL Erlenmeyer flasks (1101-250, Jiangsu Huaou Glass Instrument, Yancheng, Jiangsu, China). The flasks were placed in an incubator (RDN-1000C, Ningbo Yanghui Instrument, Ningbo, China) at 25 °C, with a fluorescent light intensity of 3000 lux and a 12:12 h light–dark light cycle. M. aeruginosa cultures were inoculated every five days, and maintained at a cell density of >106 cells/mL.
In the algal cultivation experiments, we performed the following four culture media treatments: (1) LED-Blue (the culture media of V. natans exposed to fluorescent light with blue LED supplementation), (2) LED-Red (the culture media of V. natans exposed to fluorescent light with red LED supplementation), (3) Control treatment (the culture media of V. natans exposed to fluorescent light), and (4) BG-11 treatment (the BG-11 medium). Treatments (1)–(3) were designed to evaluate the allelopathic effects of culture media from submerged plants exposed to different light conditions on the physiological responses of cyanobacteria, while treatment (4) aimed to assess the physiological responses of heathy cyanobacteria cells and compare them with the responses in other inhibition treatments. Each algal culture was maintained using 500 mL Erlenmeyer flasks (1101-500, Jiangsu Huagou Glass Instrument, Yancheng, China). The initial algal volume was set at 300 mL and the cell density was 2 × 10⁶ cells/mL. All algal groups in the three replicates were maintained at the same temperature and light cycle conditions as the stock culture.

2.3. Algal Conditions and Biochemical Parameters

2.3.1. Cell Density and Fluorescence Parameters

In each experimental treatment, the cell numbers of M. aeruginosa were counted under a microscope at a magnification of approximately 40× (SZX10, Olympus, Tokyo, Japan) in each observation, to calculate the cell density. To determine fluorescence parameters (i.e., Yield, α, ETRmax, and IK), 3 mL of the M. aeruginosa sample was placed in a 10 mL centrifuge tube (110403044, Changde Bukman Biotechnology, Changde, China) and kept in the dark for 20 min. The fluorescence parameters were then measured using a Phyto-PAM analyzer following the procedure provided by the manufacturer (Phyto-PAM, Effeltrich, Germany). These parameters were measured at time intervals of 6–24 h until the end of the experiment.

2.3.2. Antioxidant Enzyme Activity and Phycocyanin Content

We collected a 10 mL M. aeruginosa sample from each experimental treatment for each observation. The algal sample was centrifuged at 10,000 rpm for 10 min at 4 °C, using a high-velocity refrigerated centrifuge (H1650R, CENCE, Changsha, China), to collect the precipitated algal cells. The supernatant was removed, and phosphate buffer (0.1 mol/L, pH 7.0–7.4) (I010-1-1, Nanjing Jiancheng Technology, Nanjing, China) was introduced into the precipitated cells and fully mixed using a low-temperature homogenizer (BSH-C2, Lifereal, Hangzhou, China) for later use. The SOD and POD activities of M. aeruginosa cells were measured using a reagent kit (SOD: A001-3-2, POD: A084-3-1, Nanjing Jiancheng Bioengineering Research Institute, Nanjing, China) in accordance with the manufacturer’s instructions. For the phycocyanin content, 5 mL of the algal sample was placed in a 15 mL centrifuge tube, and the phycocyanin content was measured using a three-dimensional fluorescence spectrometer (HORIBA-Aqualog, Palaiseau, France). Both the emission and absorption wavelength ranges were set at 500–700 nm [17]. These parameters were measured at time intervals of 6–24 h.

2.4. Data Calculation and Statistical Analysis

The inhibition rate (IR) of each fluorescence parameter in M. aeruginosa in V. natans culture water was calculated using Equation (1):
I R  ( % ) = 1 N i N 0 × 100
where Ni is the fluorescence parameter in each tested group i, and N0 is the fluorescence parameter in the BG-11 group.
The differences in each parameter among the different treatments were tested using the Kruskal–Wallis test. Post hoc Tukey–Kramer tests were performed when the Kruskal–Wallis test indicated a significant difference. The statistical differences for SOD and POD were tested during the most active period (6–72 h). All statistical tests were performed by SPSS software (version 27) [30], and the significance level was set at p < 0.05.

3. Results

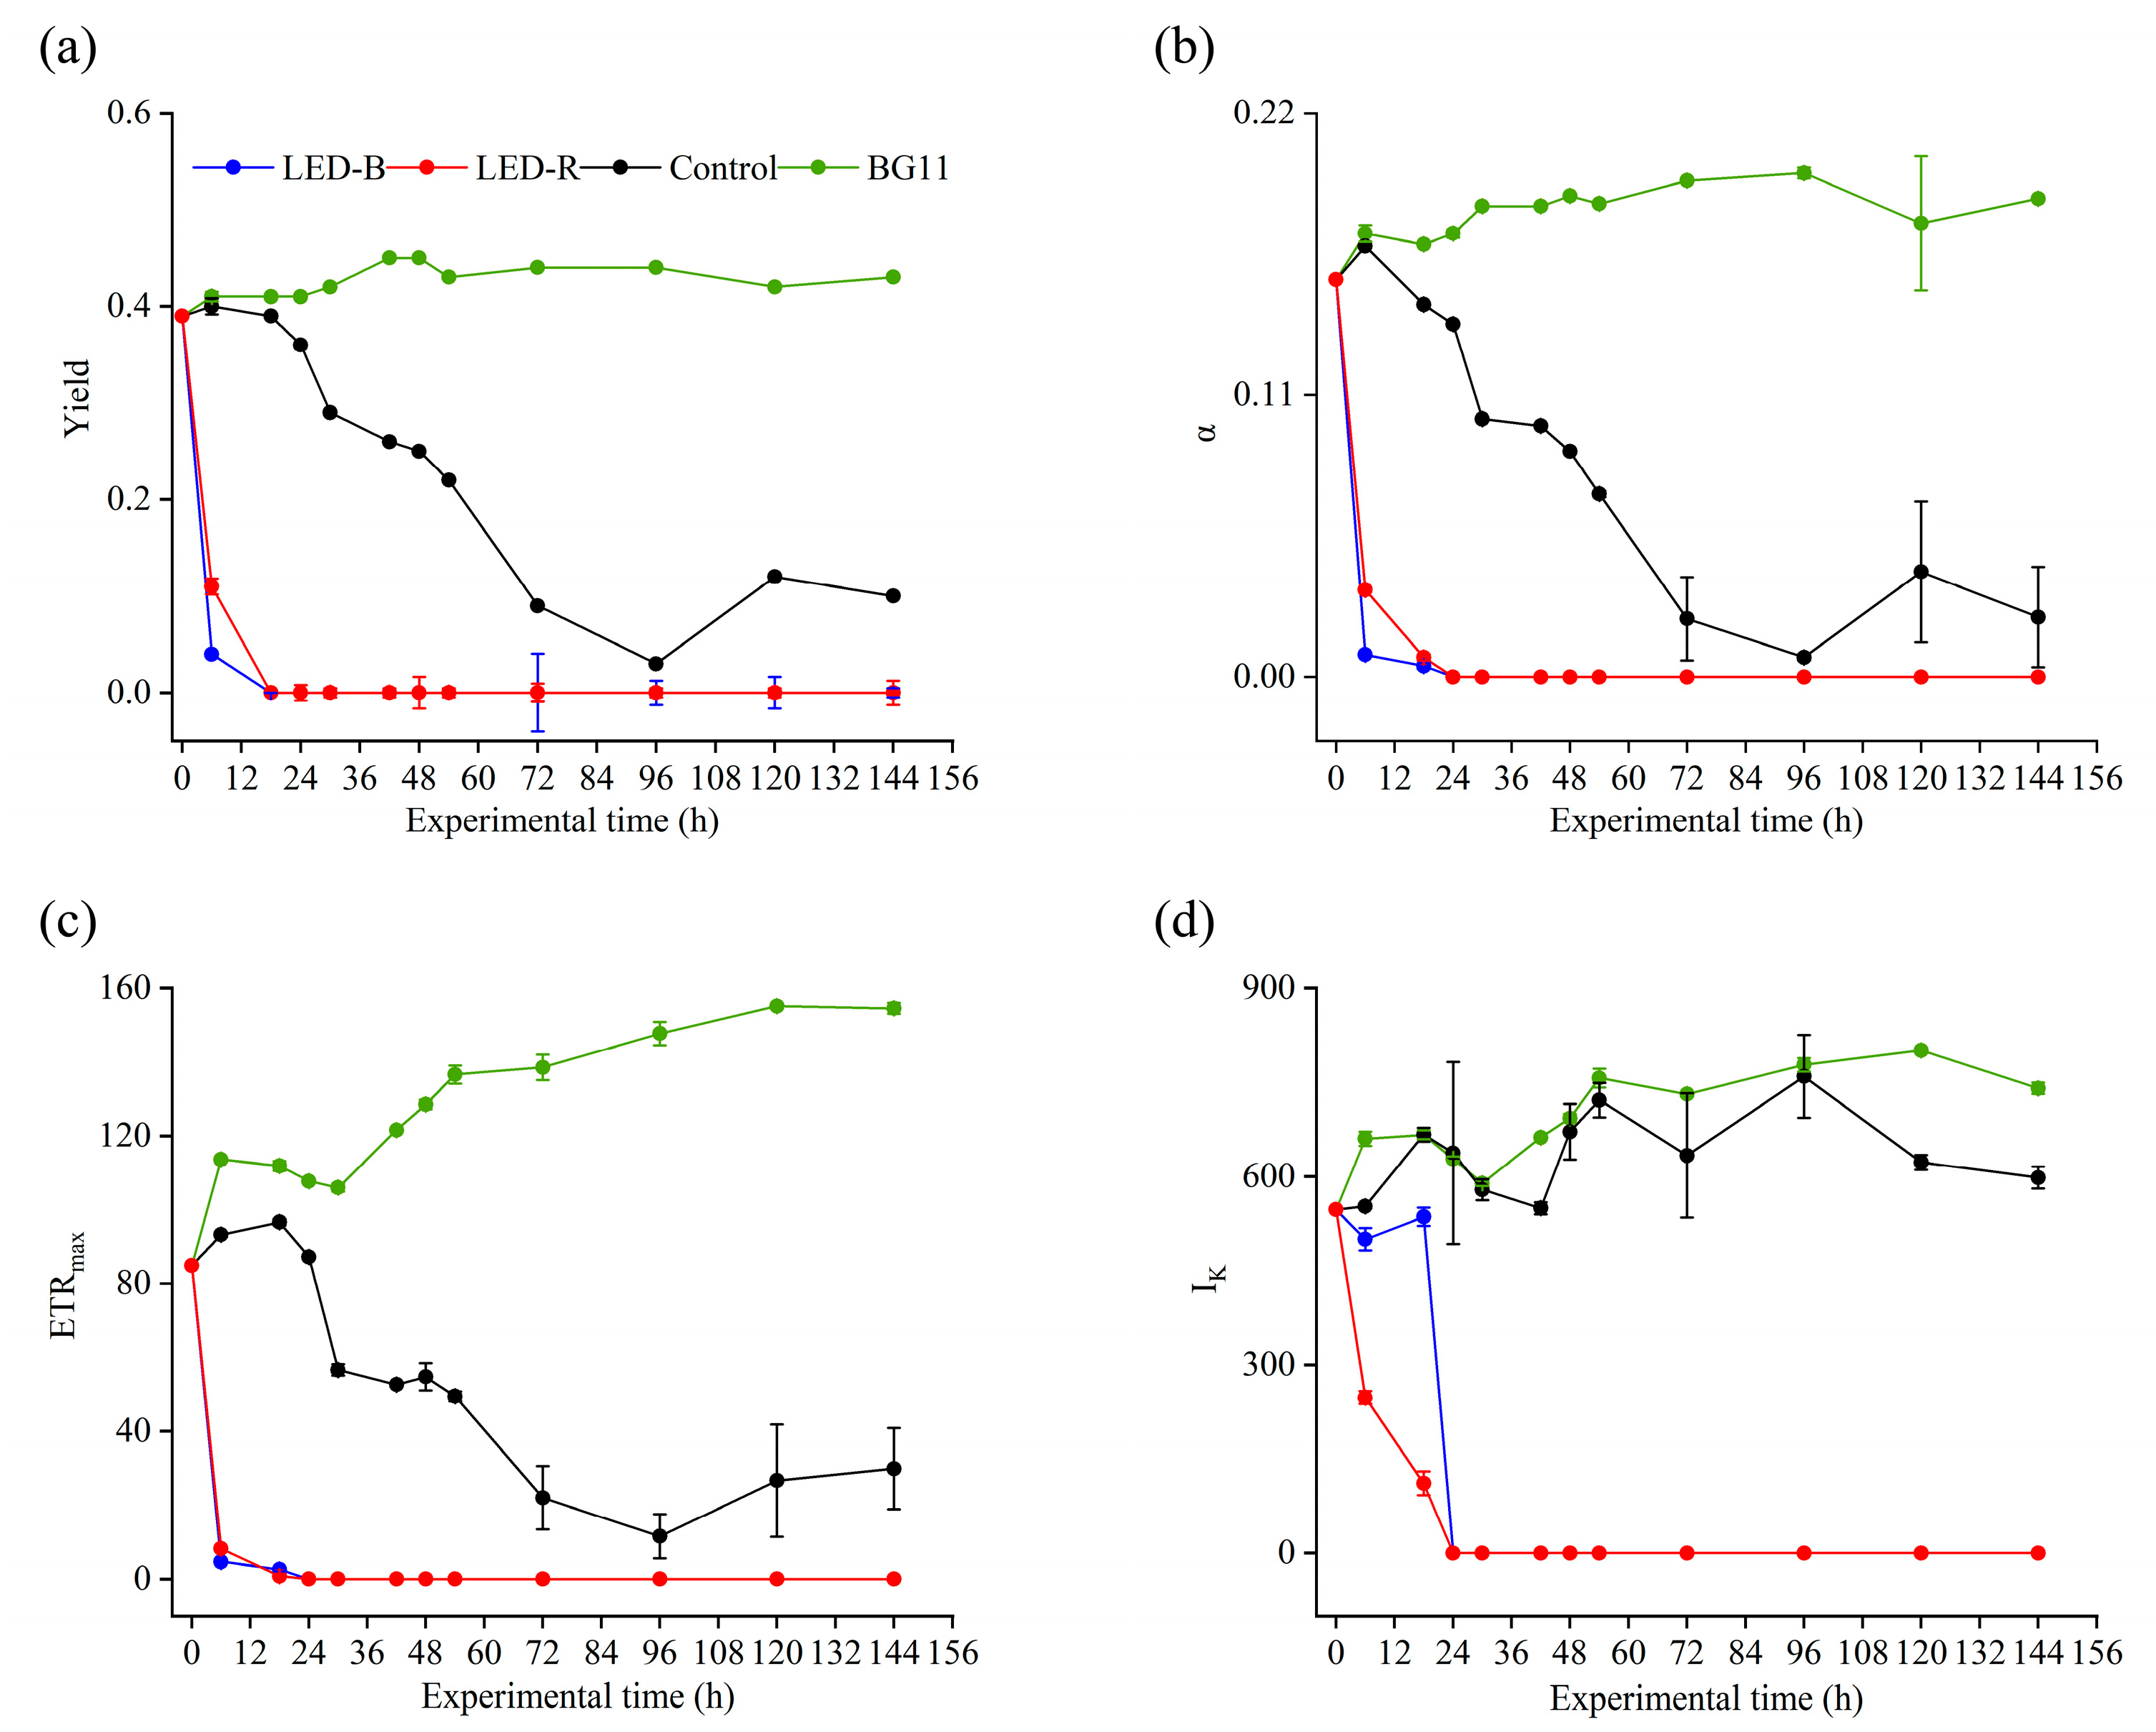
3.1. Cell Conditions and Fluorescence Parameters

In each V. natans culture media treatment, the algal color gradually turned from green to yellow from day 1 to day 6, whereas the algae retained a green color in the BG-11 treatment (Figure S2). In the BG-11 treatment, the cell density of M. aeruginosa increased exponentially up to 12.5 × 10⁶ cells/mL until the end of the experiment (Figure S3). The cell density of M. aeruginosa showed a declining trend in all three V. natans water media until the end of the experiment (Figure S3).
In the BG-11 treatment, the four fluorescence parameters in M. aeruginosa cells (Yield, α, ETRmax, and IK) mainly maintained a steady state until the end of the experiment, varying by 0.39–0.45, 0.16–0.20, 84.9–155.1, and 547.0–800.6, respectively, during the experimental period (Figure 2). All the fluorescence parameters in both the LED-Blue and LED-Red treatments, however, suddenly decreased to nearly zero within 6–12 h (Figure 2). In the Control treatment, the Yield, α, and ETRmax values showed downward trends from the start of the experiment until the end. However, IK exhibited similar values in the Control treatment (547.0–759.1) compared with those in the BG-11 treatment (Figure 2d).
In both LED-Blue and LED-Red treatments, nearly 100% inhibition rates of all fluorescence parameters were observed after 12 h (Figure 3). In the Control treatment, the inhibition rate of the Yield, α, and ETRmax gradually increased, reaching approximately 80% at the end of the experiment (Figure 3a–c). The IK parameter, however, exhibited a low inhibition rate compared with the other three fluorescence parameters, being <25% during the experimental period (Figure 3d). The Kruskal–Wallis test indicated significant differences (df = 2 for all, H = 18.6, 17.3, 18.8, and 19.8 for Yield, α, ETRmax, and IK, respectively, p < 0.05 for all) in fluorescence parameters among the different groups. The post hoc Tukey–Kramer tests showed significantly lower fluorescence parameters in the Control group (p < 0.05 for all) compared with those in both the LED-Blue and LED-Red groups, and no significant differences (p > 0.05 for all) between the LED-Blue and LED-Red groups.

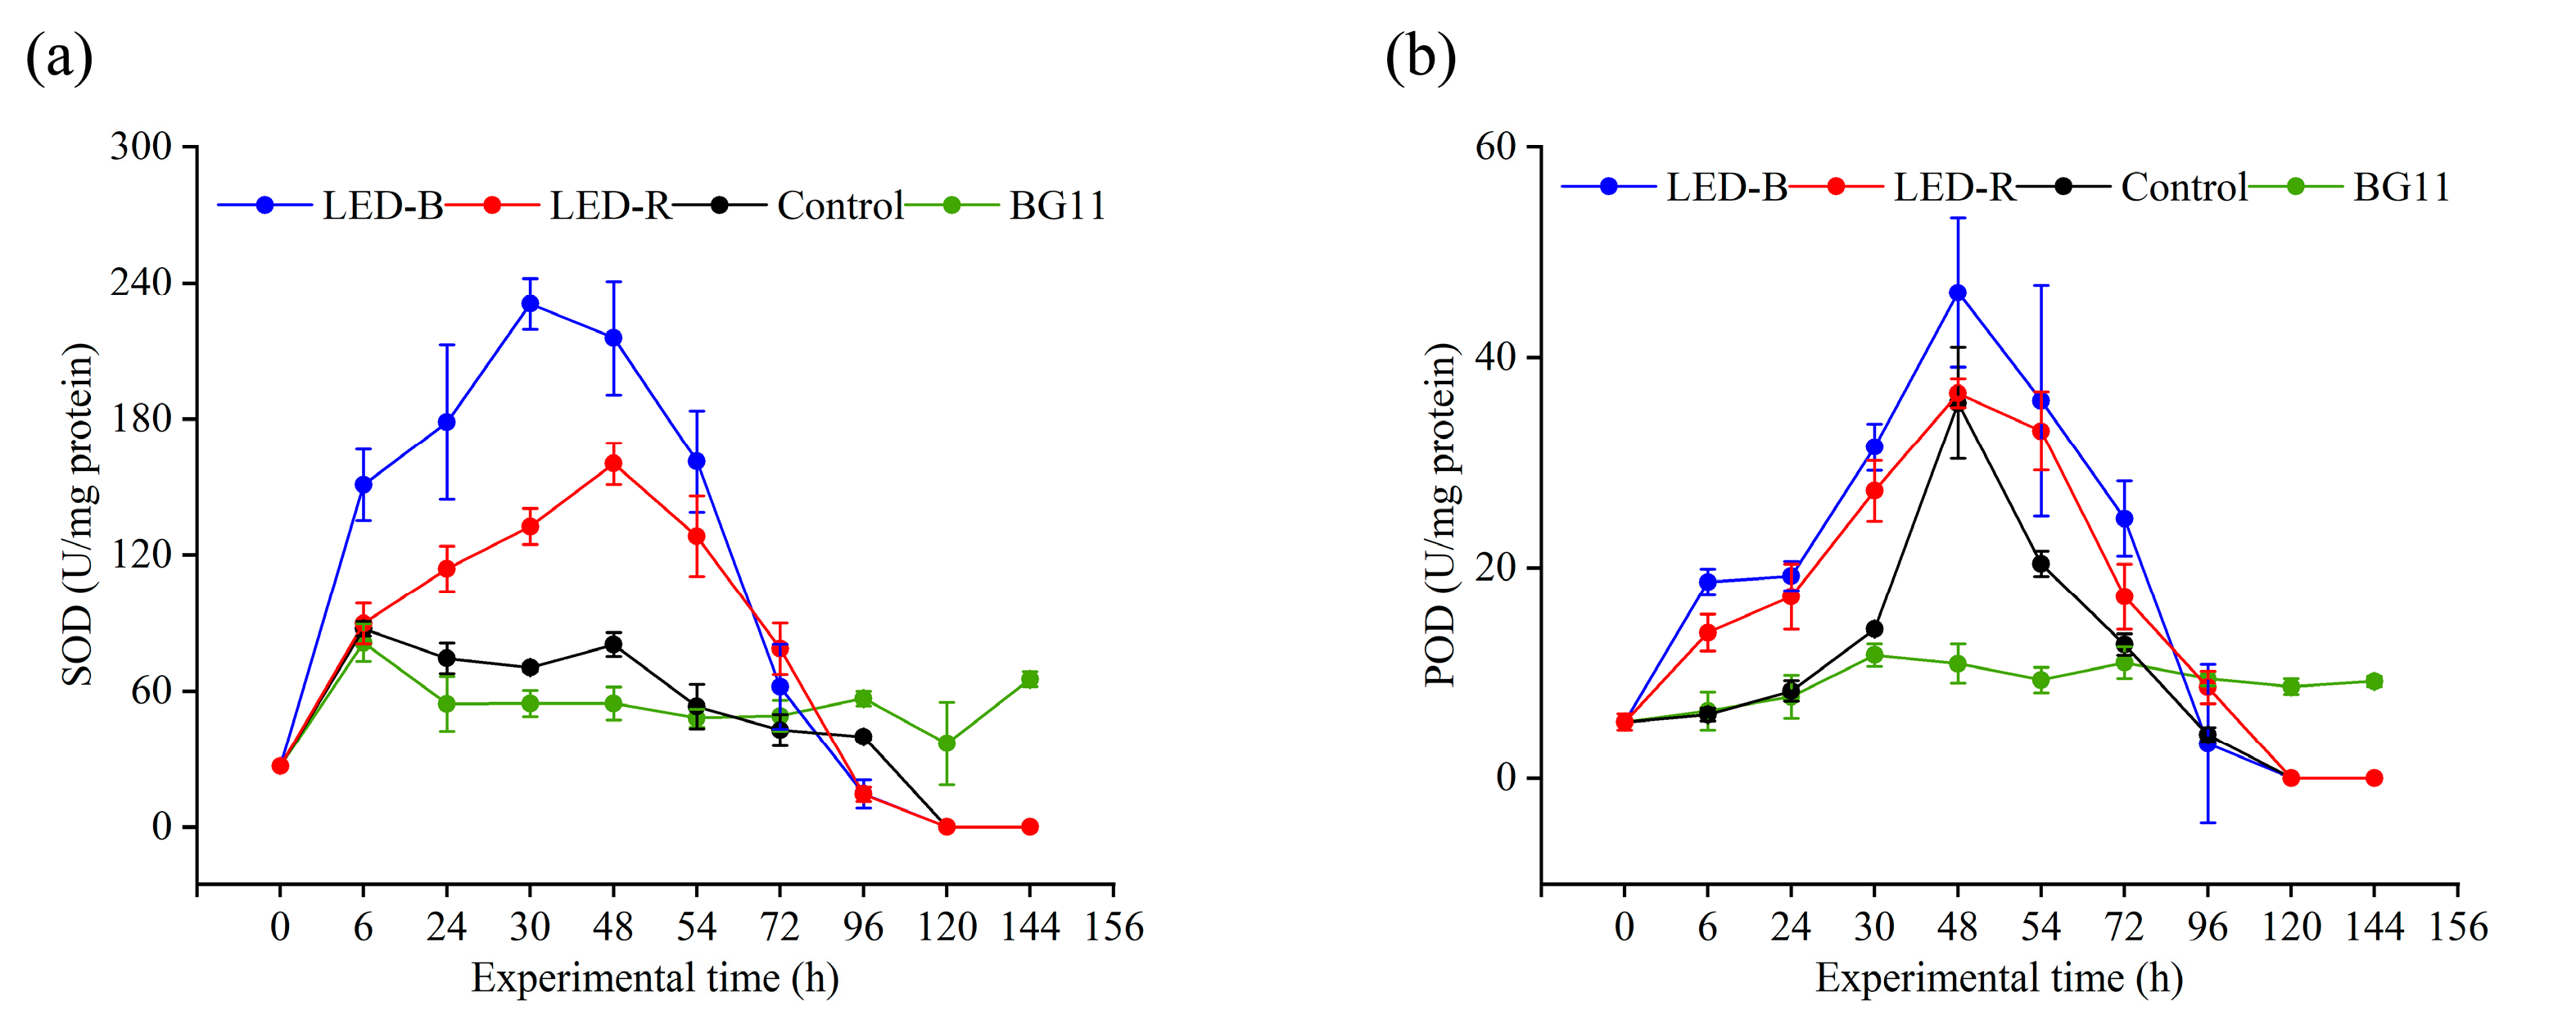
3.2. SOD and POD Activity

In the BG-11 treatment, the SOD activity remained stable at approximately 50 U/mg protein throughout the experiment (Figure 4a). In the Control treatment, SOD activity showed slightly higher values (80.4–87.4) from 6 h to 48 h, decreasing during the following period (Figure 4a). In contrast, the SOD activity dramatically increased in both the LED-Blue and LED-Red treatments, reaching a maximum of 230.7 and 160.2 at 30 h and 48 h, respectively, followed by a sharp decline (Figure 4a). The Kruskal–Wallis test showed significantly different (df = 3, H = 14.6, p < 0.05) SOD activity among different treatments. Both the LED-Blue and LED-Red conditions exhibited significantly higher SOD activity compared with the BG-11 treatment (post hoc Tukey–Kramer test, p < 0.05 for both). SOD activity was relatively higher in the LED-Blue treatment compared with LED-Red, although the difference was not statistically significant (post hoc Tukey–Kramer test, p > 0.05).
Similar to the SOD activity, POD activity also remained stable at approximately 10 U/mg protein throughout the experiment in the BG-11 treatment (Figure 4b). In the other three treatments, POD activity showed an increasing trend from the start of the experiment, peaked (35.7–46.2) at 48 h, and decreased until the end of the experiment (Figure 4b). The results of the Kruskal–Wallis test also indicated significantly different (df = 3, H = 12.8, p < 0.05) POD activity among different treatments. Both the LED-Blue and LED-Red conditions exhibited significantly higher POD activity compared with the BG-11 treatment (post hoc Tukey–Kramer test, p < 0.05 for both). The POD activity was significantly higher (post hoc Tukey–Kramer test, p < 0.05) in the LED-Blue treatment compared with the Control treatment, but was not significantly different (post hoc Tukey–Kramer test, p = 0.165) between the Control and LED-Red treatments.

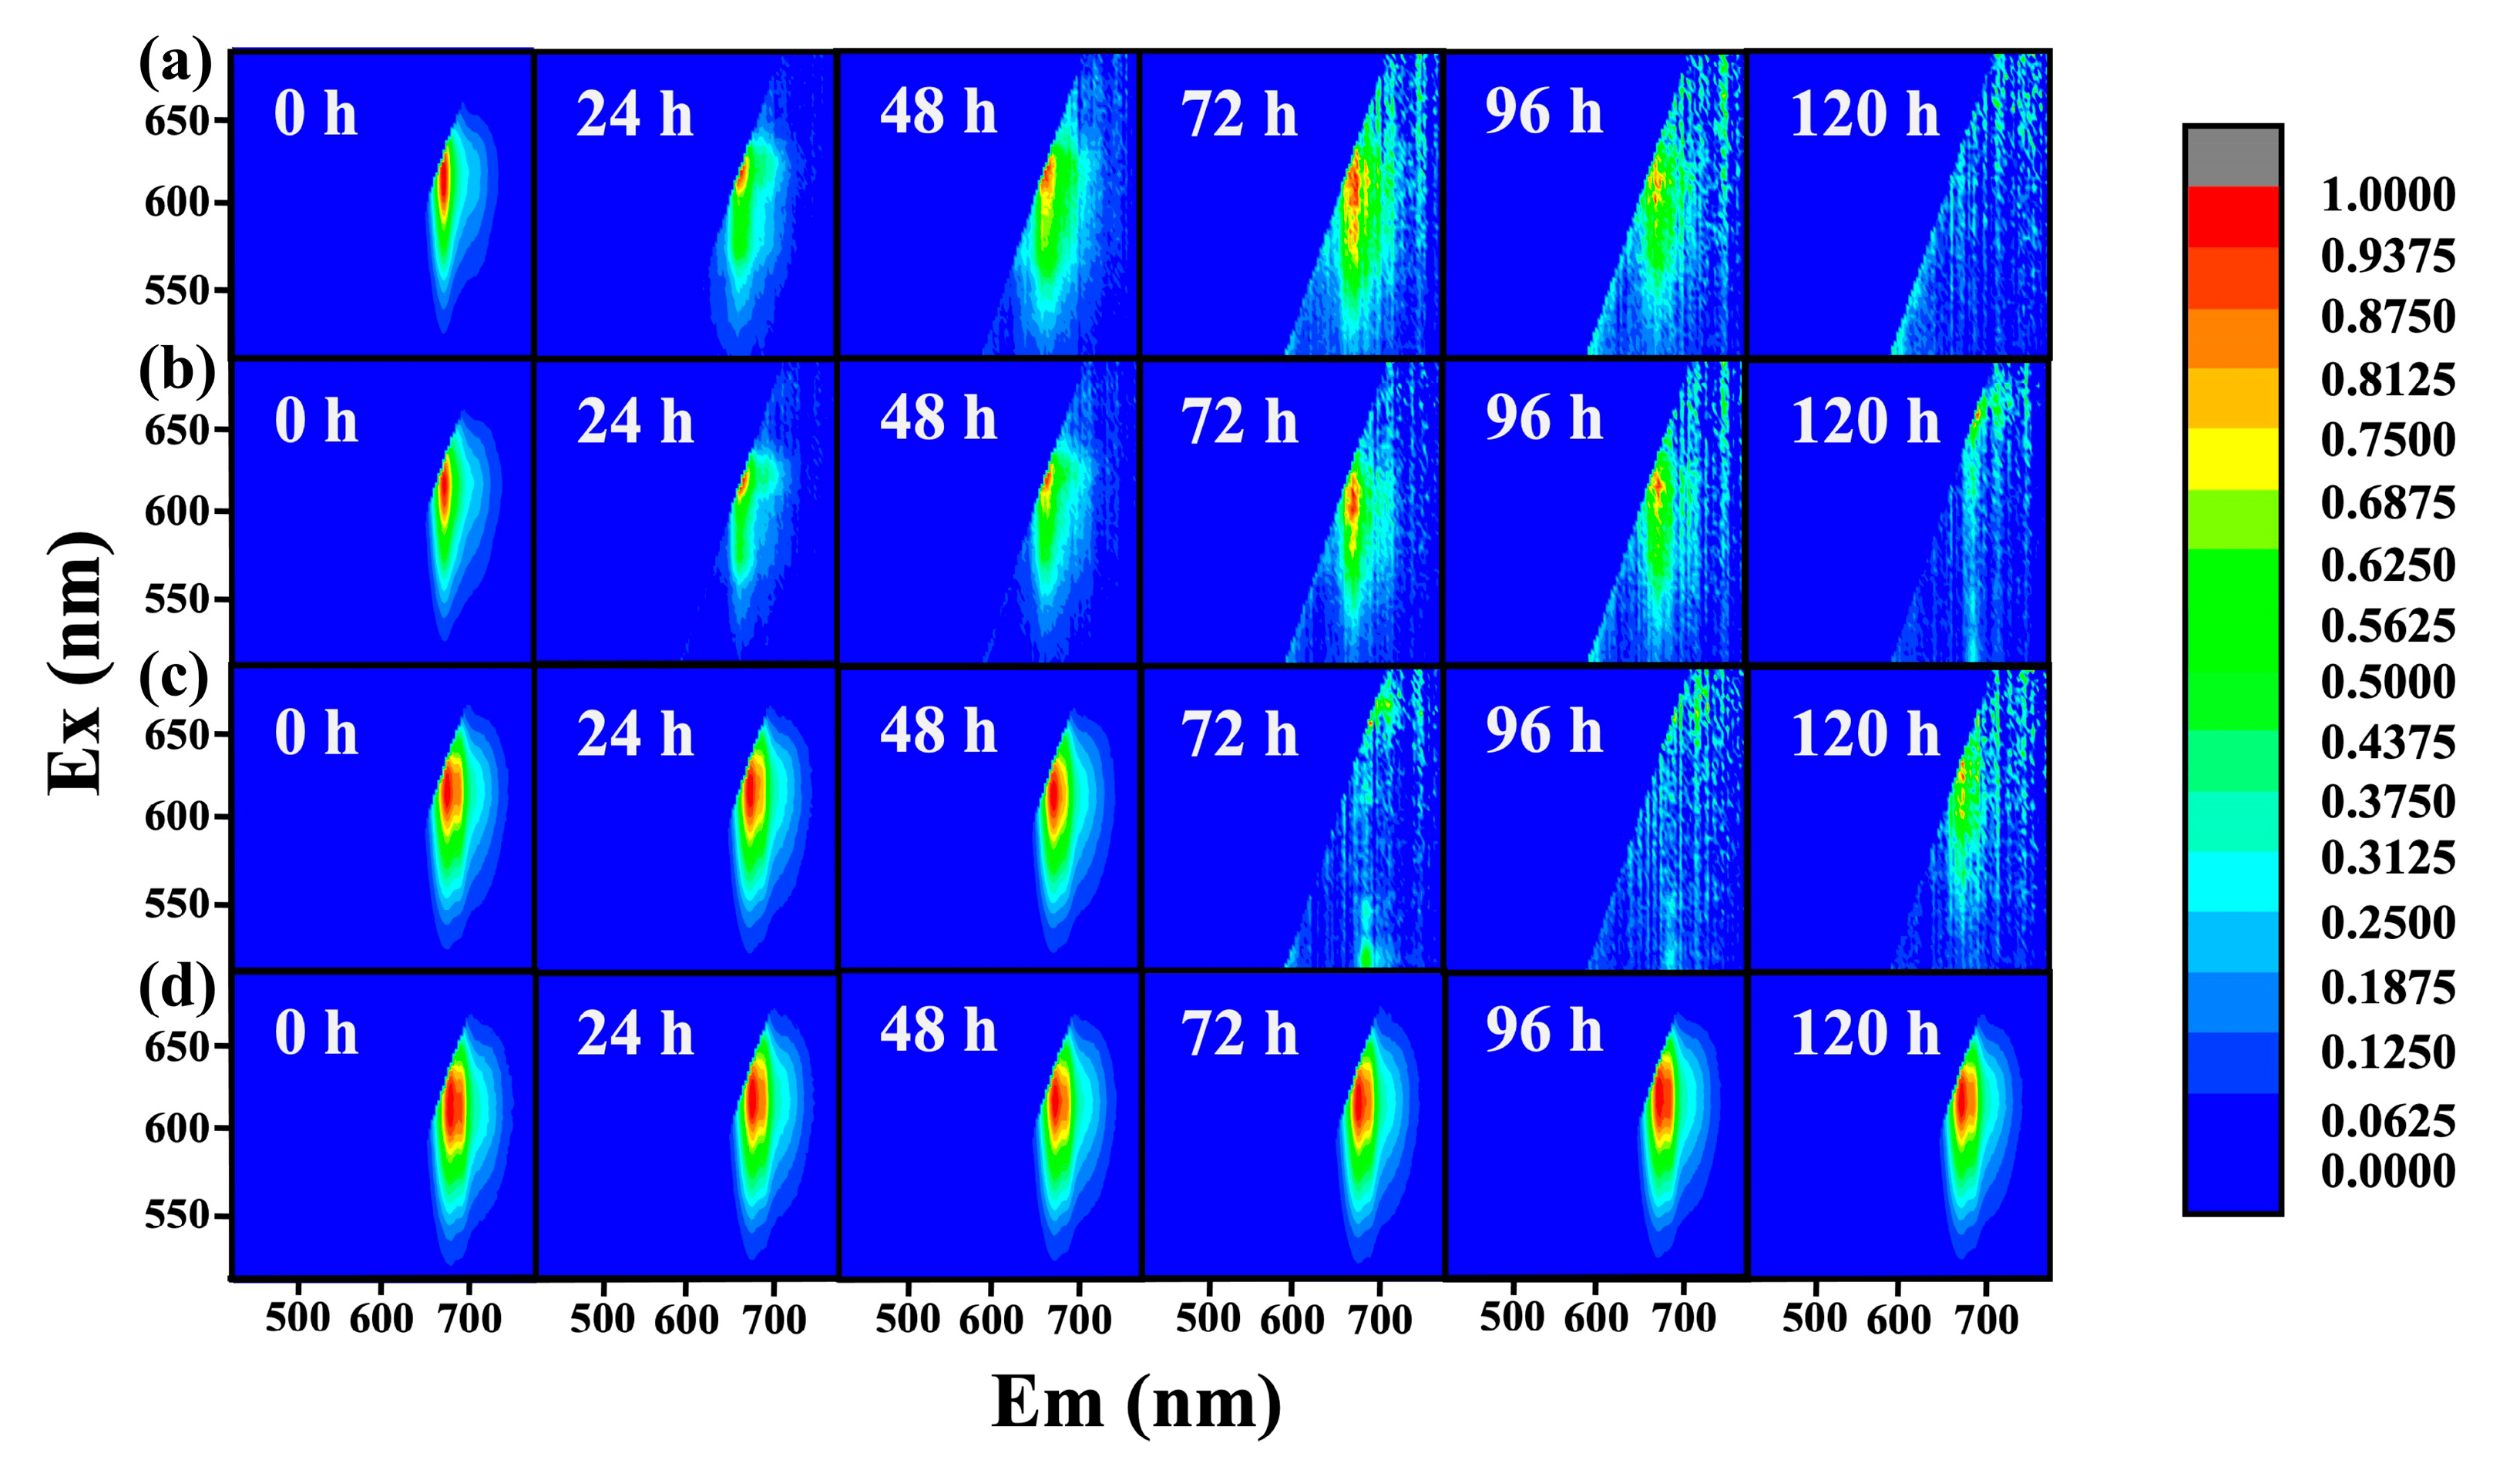
3.3. Fluorescence Intensity of Phycocyanin

The fluorescence intensity of phycocyanin in both the LED-Blue and LED-Red treatments exhibited lower values from the start of the experiment compared with both the Control and BG-11 treatments, and its status was inactive until the end of the experiment (Figure 5a,b). In the Control treatment, the intensity showed a high value until 48 h, and it drastically decreased from 72 h until the end of the experiment (Figure 5c). In contrast, the fluorescence intensity of phycocyanin in the BG-11 group exhibited a high value over time (Figure 5d). These results supported the inhibitory effects of the culture media of V. natans on M. aeruginosa growth, and the LED groups exhibited an early inhibition effect.

4. Discussion

4.1. Inhibition of Cell Activities and Photosynthesis

The cell decolorization and density decrease in M. aeruginosa in the culture media of V. natans, including both the Control and LED supplementation treatments, can be considered a result of allelochemical-induced cell inactivity. A study on the effects of five aquatic plants (Acorus calamus, Hydrilla verticillata, V. natans, M. verticillatum, and Ipomoea aquatica) on M. aeruginosa physiology showed that 50 g/L of V. natans and I. aquatica biomass exerted a strong inhibitory effect on M. aeruginosa cell activity after 2 days of cultivation [31]. In this LED supplementation study, because we used the same V. natans biomass ratio to water volume (50 g/L), the inhibition results were confirmed within 1 day, indicating a greater inhibitory effect. A previous study has confirmed a significant dose–response relationship between the allelochemicals of submerged plant extracts and algal cell growth [17]. Water hyacinth (Eichhornia crassipes) extracts inhibited algal production by the released allelochemicals and affected the diversity of biochemical and physiological attributes, leading to membrane injury in M. aeruginosa cells [32]. Water dropwort (Oenanthe javanica) synthesizes approximately 18 species of phenolic acids in its leaves, and the roots release 33 species of allelochemicals, inhibiting M. aeruginosa growth [33]. It is known that the root system is the primary pathway for releasing allelochemicals in water lettuce (Pistia stratiotes) [34]. Ethyl 2-methylacetoacetate (EMA) [35] and N,N-dimethyl-3-amino-methylindole [10] have been proved to have a highly inhibitory effect on M. aeruginosa.
Chlorophyll fluorescence parameters are important indicators for assessing photosynthetic efficiency. Damage to the internal photosynthetic system caused by the stress of allelochemicals can induce a decrease in fluorescence parameters [36]. The chlorophyll fluorescence parameters (Yield, α, and ETRmax) of M. aeruginosa grown in V. natans cultivation water were lower than those in the BG-11 group, indicating that the allelochemicals released from V. natans may effectively affect the photosynthetic efficiency of PS II through reducing photosynthetic electron transport [25,37]. In contrast, there was no obvious inhibitory effect on IK of M. aeruginosa in the Control treatment, as was found in the BG-11 treatment. This may be because M. aeruginosa can maintain a constant IK under relatively low allelochemical conditions. Cyanobacteria can increase their IK values under stress conditions to meet the needs of photosynthesis [38,39]. Destroying the PS II of cyanobacteria, reducing photosynthetic electron transport, and inhibiting photosynthesis are all known to result in algal inhibition [25]. In both the LED-Red and LED-Blue conditions, the inhibition rate of M. aeruginosa fluorescence parameters reached 100% within 24 h, and this can be considered a sensitivity response of M. aeruginosa to conditions of high allelochemical loads. We also confirmed similar inhibition efficiencies in the fluorescence parameters when comparing both blue and red LED supplementation. This suggests that both red and blue light supplementation are effective in influencing the photosynthesis process of M. aeruginosa. The Control treatment also demonstrated an inhibitory effect on photosynthesis, although its inhibition rate was limited to a maximum of 80%. These findings indicate that supplementation with blue and red LEDs may enhance the accumulation of allelochemicals in aquatic plants, which, in turn, further inhibit cyanobacterial growth, increasing the overall inhibition efficiency by at least 20% compared with fluorescent light. The mechanism behind this enhanced inhibition appears to involve interference with the photosynthetic pathways, making LED supplementation a potentially powerful method for controlling cyanobacterial blooms.

4.2. Inhibition of Antioxidant Enzyme Activity

A rapid increase in antioxidant enzyme activity indicates that algal cells are in stressed conditions. In this study, both SOD and POD activities in M. aeruginosa were confirmed to be a constant trend in the BG-11 treatment, indicating no allelochemical stress. In contrast, an increase in the SOD and POD of M. aeruginosa in both LED and Control treatments indicated that the algae cells were under stress conditions because they displayed an active defense mechanism owing to the existence of enhanced allelochemicals. Extended antioxidant enzyme interest can protect cells from the ROS and the free radicals that cause damage [26]. Phytoplankton generally produce antioxidant enzymes, including SOD and POD, to scavenge the continuous accumulation of ROS and so extend senescence and delay death [24]. Algal cells initially enhance their antioxidant system to defend against allelochemicals, increasing SOD and POD levels during early oxidative stress. Prolonged exposure leads to cell rupture, the leakage of intracellular substances, and the eventual inactivation of SOD and POD [32]. In this study, a peak SOD value appeared after 30 h cultivation in the blue LED treatment, indicating that the defense allelochemicals in M. aeruginosa cells reached their maximum in a shorter period compared with previous studies. For example, the highest SOD activity of M. aeruginosa was observed at 48 h incubation in aquatic plant filtrates, including those of V. natans [31]. Chen et al. [40] studied the effects of different amounts of V. spiralis mass on the antioxidant enzyme of M. aeruginosa, demonstrating that the maximum SOD was observed at 72 h cultivation. Water hyacinth (E. crassipes) extracts increased the activity of SOD in treated M. aeruginosa cells and peaked at 96 h cultivation [32]. Since the inhibition rates of the chlorophyll fluorescence parameters in M. aeruginosa reached their maximum after 24 h cultivation using V. natans planting water, and the SOD peak was roughly consistent with those high inhibition rates, these results are consistent with the LED supplementation promoting allelochemical production in V. natans, consequently enhancing its efficiency in inhibiting cyanobacterial growth. Nonetheless, both the SOD and POD activities of M. aeruginosa decreased sharply after reaching their maximum at approximately 48 h, indicating a tolerance period due to cell death. The antioxidant enzyme activity in algal cells declined rapidly to near-inactivity, which is expected to impose stress tolerance on algal cells [10].
The SOD activity in the LED-Blue treatment was slightly higher than that in the LED-Red treatment. This may be because blue light was more beneficial to the accumulation of allelochemicals due to the enhanced photosynthesis and growth of V. natans. Pan [41] showed that plant pigment content was the highest under blue light, followed by red light, and that blue light is the main light absorption areas of chlorophyll a. Strengthening blue light is more beneficial for promoting a plant’s photosynthetic efficiency [42]. It is known that POD is the main antioxidant enzyme for H2O2 scavenging in algal cells [43], and that SOD can catalyze the excess O2 produced by algal cells under stress, converting it into H2O2, which has relatively low cytotoxicity [44]. The finding that POD activity in the Control treatment was different from that of SOD might be attributed to the dysfunction of H2O2 clearance in algal cells under the allelochemical-stressed conditions.

4.3. Phycocyanin Dynamics

Phycocyanin is a water-soluble accent pigment in cyanobacteria and has fluorescent properties. It is a specific protein marker for cyanobacterial blooms and an indicator of cyanobacterial biomass [28,29]. In the BG-11 treatment, high phycocyanin content was observed throughout the experiment, indicating the active photosynthesis and cell growth of M. aeruginosa, whereas it was inactivated in the three other V. natans culture media treatments because of the stimulation of allelochemicals. These results are consistent with the V. natans culture media exerting a negative effect on M. aeruginosa cell conditions, disrupting their photosynthetic activity, especially under blue and red LED treatments. Low amounts of V. natans allelochemicals may accumulate under fluorescent light conditions, and we observed similar phycocyanin contents in the Control as in the BG-11 treatment until 48 h, although they decreased thereafter. This suggests that M. aeruginosa can tolerate relatively low amounts of allelochemicals for a brief period, but that prolonged exposure impedes its photosynthetic activity. Previous studies showed that the presence of the aquatic plants E. crassipes and C. demersum significantly reduce the phycocyanin content of M. aeruginosa [45,46]. Li et al. [17] demonstrated that, under the stress of high dose-sensitive substances, the phycocyanin content of M. aeruginosa was inhibited by V. natans due to the limited photosynthesis. Water lettuce (P. stratiotes) can reduce the phycocyanin content in M. aeruginosa due to its allelopathic effects [34]. We observed low phycocyanin contents in LED-treated groups from the start of the experiments, showing evidence of the inactive growth of M. aeruginosa in environments in which allelochemicals had accumulated. These findings underscore the importance of monitoring phycocyanin levels as a key indicator for assessing the impact of aquatic plants on cyanobacterial populations and their ecological dynamics.

5. Conclusions

By enhancing the allelopathic effects of V. natans with both blue and red LED light, this study confirmed a marked reduction in cell activity, alongside a decrease in fluorescence parameters and phycocyanin content in cyanobacteria M. aeruginosa, all of which are key indicators of cyanobacterial growth and health. The blue LED light exhibited greater inhibitory performance than the red LED light, suggesting that different wavelengths of light may vary in their effectiveness in suppressing cyanobacterial blooms through aquatic plants. Underwater LED light supplementation, in combination with allelopathic aquatic plants such as V. natans, emerges as a promising and efficient approach to mitigating harmful cyanobacterial blooms in eutrophic waters, providing a sustainable alternative to the chemical and mechanical methods traditionally used for HAB control. Evaluating allelochemical species, their threshold concentrations in relation to light intensity, and the broader diversity of the cyanobacteria and plant species involved in trophic interactions could provide deeper insights into how these entities interact within a more comprehensive ecological context.

Supplementary Materials

The following supporting information can be downloaded at: https://www.mdpi.com/article/10.3390/w17010131/s1, Figure S1: Schematic diagram of the allelopathic inhibition of algae by submerged plants; Figure S2: Visual changes in Microcystis aeruginosa cultures during the experiments. Left to right in flasks: LED-Red, LED-Blue, Control, and BG-11 treatments, respectively; Figure S3: Cell density of Microcystis aeruginosa in different treatments. Error bars indicate standard deviations; Table S1: Composition of BG-11* culture medium (Blue-Green Medium); Table S2: Composition of A5* solution (trace metal solution).

Author Contributions

Writing—review and editing, Funding acquisition, Supervision, A.H.; Data curation, Visualization, Formal analysis, Writing—original draft, Z.S.; Data curation, Formal analysis, Writing—original draft, X.S.; Formal analysis, Writing—original draft, X.L.; Writing—review and editing, D.X.; Conceptualization, Methodology, Supervision, Y.I. All authors have read and agreed to the published version of the manuscript.

Funding

This work was funded by the Institute for Eco-environmental Research of Sanyang Wetland, Wenzhou University (No. SY2022ZD-1001-10).

Institutional Review Board Statement

Not applicable.

Informed Consent Statement

Not applicable.

Data Availability Statement

Data can be obtained from the author upon reasonable request.

Acknowledgments

We thank the staff in the hydrosphere research group of the School of Life and Environmental Sciences, Wenzhou University, China, for their assistance during this study.

Conflicts of Interest

The authors declare no conflicts of interest.

References

  1. Gong, Y.; Hu, X. Research status and prospect of lake eutrophication prevention and control. Beijing Water 2005, 6, 4–5. [Google Scholar]
  2. Qin, B.; Yang, G.; Ma, J.; Deng, J.; Li, M.; Wu, T.; Liu, L.; Gao, G.; Zhu, G.; Zhang, Y. Dynamics of variability and mechanism of harmful cyanobacteria bloom in Lake Taihu, China. Chin. Sci. Bull. 2016, 61, 759–770. [Google Scholar]
  3. Hao, A.; Yu, H.; Kobayashi, S.; Xia, D.; Zhao, M.; Iseri, Y. Effects of light-emitting diode illumination on sediment surface biological activities and releases of nutrients and metals to overlying water in eutrophic Lake Microcosms. Water 2022, 14, 1839. [Google Scholar] [CrossRef]
  4. Zhu, C.; Sun, X.; Yang, X.; Tang, X.; Hu, Y.; Zhang, M. Factors in Chaohu Lake study on the seasonal succession of phytoplankton community and its driving. Environ. Monit. China 2024, 40, 129–142. [Google Scholar]
  5. Tang, Z.; Chong, Y.; Wu, Q.; Li, L.; Zhu, W. Allelopathic effects of three submerged macrophytes on five eutrophic algae. J. S. China Agric. Univ. 2007, 28, 42–46. [Google Scholar]
  6. Narwal, S.S.; Jain, S.K. Hans Molisch (1856–1937): The father of allelopathy. Allelopath. J. 1994, 1, 1–5. [Google Scholar]
  7. Qian, K.; Ma, Z.; Li, R.; Chen, B.; Wang, M.; Zhu, S.; Rong, M.; Qin, W. Progress in the study of allelopathy in plants: A case study of inhibiting Microcystis aerugingosa growth. Biotechnol. Bull. 2021, 37, 177–193. [Google Scholar]
  8. Tang, P.; Yu, L.; Peng, Z.; Fan, P.; Li, Y.; Ren, K. Research progresses on algae inhibition by allelopathy of aquatic plants. J. Biol. 2021, 38, 104–108. [Google Scholar]
  9. Gross, E.M. Allelopathy of aquatic autotrophs. Crit. Rev. Plant Sci. 2003, 22, 313–339. [Google Scholar] [CrossRef]
  10. Hong, Y.; Hu, H.; Xie, X.; Sakoda, A.; Sagehashi, M.; Li, F. Gramine-induced growth inhibition, oxidative damage and antioxidant responses in freshwater cyanobacterium Microcystis aeruginosa. Aquat. Toxicol. 2009, 91, 262–269. [Google Scholar] [CrossRef]
  11. Bian, G.; Zhao, W.; Da, L. Thea research and application of the allelopathic effects of submerged plants inhibit the growth of algae. Environ. Dev. 2012, 24, 59–64. [Google Scholar]
  12. Zhu, L.; Sun, D.; Lin, X.; Huang, J.; Li, G.; Xu, J. Research progress on allelopathic algae-inhibiting effects and action modes of submerged macrophytes. Appl. Chem. Ind. 2022, 51, 2337–2343. [Google Scholar]
  13. Men, Y.; Hu, H. Effects of allelochemical EMA from reed on the production and release of cyanotoxins in Microcystis aeruginosa. Environ. Sci. 2007, 28, 2058–2062. [Google Scholar]
  14. Li, X.; Pan, H.; Xu, J.; Xian, Q.; Zou, H. Allelopathic effects of Ceratophyllum demersum and Microcystis aeruginosa in co-cultivation. Acta Sci. Circumstantiae 2008, 28, 2243–2249. [Google Scholar]
  15. Huang, X.; Chong, Y.; Tang, Z.; Wu, Q. Analysis on antialgal allelochemicals in culture solutions of three submerged macrophytes. J. S. China Agric. Univ. 2010, 31, 19–23. [Google Scholar]
  16. Ji, H.; Xie, D.; Zhou, H.; An, S. Influences of chemical components of water extracts from submerged macrophyte leaves on the growth of three common epiphytic algae. Chin. J. Ecol. 2015, 34, 445–453. [Google Scholar]
  17. Li, X.J.; Zhao, W.J.; Chen, J.Q.; Wang, F. Dosage impact of submerged plants extracts on Microcystis aeruginosa growth: From hormesis to inhibition. Ecotoxicol. Environ. Saf. 2023, 268, 115703. [Google Scholar] [CrossRef]
  18. Hao, A.; Kobayashi, S.; Huang, H.; Mi, Q.; Iseri, Y. Effects of substrate and water depth of a eutrophic pond on the physiological status of a submerged plant, Vallisneria natans. PeerJ 2020, 8, e10273. [Google Scholar] [CrossRef]
  19. Hao, A.; Kobayashi, S.; Yan, N.; Xia, D.; Zhao, M.; Iseri, Y. Improvement of water quality using a circulation device equipped with oxidation carriers and light emitting diodes in eutrophic pond mesocosms. J. Environ. Chem. Eng. 2021, 9, 105075. [Google Scholar] [CrossRef]
  20. Zhang, X.; Yuan, Z.; Du, M.; Zhang, Y.; Wang, G. Impact of artificial lights on submerged plants’ decolorization and enzyme activity. Environ. Eng. 2015, 33, 7–11. [Google Scholar]
  21. Sung, I.K.; Takano, T. Effects of supplemental blue- and red-lights in the morning twilight on the growth and physiological responses of cucumber seedlings. Environ. Control Biol. 1997, 35, 261–265. [Google Scholar] [CrossRef]
  22. Liu, W.; Zhang, Y.; Zha, L. Effect of LED red and blue continuous lighting before harvest on growth and nutrient absorption of hydroponic lettuce cultivated under different nitrogen forms and light qualities. Spectrosc. Spectr. Anal. 2020, 40, 2215–2221. [Google Scholar]
  23. Wang, J.; Ni, L.; Jiang, Z.; Du, C.; Fang, Y. Effects of salinity on growth and chlorophyll fluorescence of Microcystis aeruginosa under artemisinin stress. Environ. Eng. 2023, 41, 35–41. [Google Scholar]
  24. Han, L.; Yang, G.; Liu, Y.; Qin, B.; Zhong, C.; Yang, H. Effect of disturbance intensity on the growth and chlorophyll fluorescence of Microcystis flos-aquae colony in Lake Taihu. Res. Environ. Sci. 2018, 31, 265–272. [Google Scholar]
  25. Xu, S.; Song, F.; Jia, F. Growth inhibitory mechanism of quercetin on the Anabena flos-aquae. Adv. Environ. Prot. 2018, 8, 238–248. [Google Scholar] [CrossRef]
  26. Clarke, J.E.; Johnson, G.N. In vivo temperature dependence of cyclic and pseudocyclic electron transport in barley. Planta 2001, 212, 808–816. [Google Scholar] [CrossRef]
  27. Tang, X.; Li, Y. A preliminary study on toxicity mechanism of monocrotophos on marine microalgae III. changes of activity of superoxide dismutase and peroxidase. Acta Sci. Circumstantiae 1998, 18, 94–97. [Google Scholar]
  28. Beutler, M.; Wiltshire, K.H.; Meyer, B.; Moldaenke, C.; Luering, C.; Meyerhoefer, M.; Hansen, U.P.; Dau, H. A fluorometric method for the differentiation of algal populations in vivo and in situ. Photosynth. Res. 2002, 72, 39–53. [Google Scholar] [CrossRef]
  29. Zhang, X.; Yin, G.; Zhao, N.; Qin, Z.; Liu, W. Research on fluorescence spectral characteristics of phycocyanin under different habitat conditions. Spectrosc. Spectr. Anal. 2017, 37, 1145–1151. [Google Scholar]
  30. IBM. IBM SPSS Statistics (Predictive Analytics Software and Solutions), version 27.0.0.0. 64-bit ed. IBM: Armonk, NY, USA, 2020.
  31. Jia, H.; Chen, Y.; Chen, M.; Du, L.; Han, L.; Liu, J. Allelopathic effect of five aquatic plants on Microcystis aeruginosa. Res. Agric. Mod. 2019, 40, 1056–1064. [Google Scholar]
  32. Wu, X.; Zhang, Z.; Jin, Y. Physiological mechanism of Eichhornia crassipes in inhibiting the growth of Microcystis aeruginosa. Russ. J. Plant Physiol. 2019, 66, 433–439. [Google Scholar] [CrossRef]
  33. Liu, J.; Chang, Y.; Sun, L.; Du, F. Abundant allelochemicals and the inhibitory mechanism of the phenolic acids in water dropwort for the control of Microcystis aeruginosa blooms. Plants 2021, 10, 2653. [Google Scholar] [CrossRef] [PubMed]
  34. Li, J.; Liu, Y.; Zhang, P.; Zeng, G.; Cai, X.; Liu, S.; Yin, Y.; Hu, X.; Hu, X.; Tan, X. Growth inhibition and oxidative damage of Microcystis aeruginosa induced by crude extract of Sagittaria trifolia tubers. J. Environ. Sci. 2016, 43, 40–47. [Google Scholar] [CrossRef] [PubMed]
  35. Hong, Y.; Hu, H.; Li, F. Physiological and biochemical effects of allelochemical ethyl 2-methyl acetoacetate (EMA) on cyanobacterium Microcystis aeruginosa. Ecotoxicol. Environ. Saf. 2008, 71, 527–534. [Google Scholar] [CrossRef]
  36. Huang, S.; Zhu, J.; Zhang, L.; Peng, X.; Zhang, X.; Ge, F.; Liu, B.; Wu, Z. Combined effects of allelopathic polyphenols on Microcystis aeruginosa and response of different chlorophyll fluorescence parameters. Front. Microbiol. 2020, 11, 614570. [Google Scholar] [CrossRef]
  37. Gao, Y.; Liu, B.; Wang, J.; He, F.; Liang, W.; Xu, D.; Zhang, L.; Wu, Z. Allelopathic effects of phenolic compounds released by Vallisneria spiralis on Microcystis aeruginosa. J. Lake Sci. 2011, 23, 761–766. [Google Scholar]
  38. Fu, F.; Bell, P.R.F. Growth N2 fixation and photosynthesis in a cyanobacterium Trichodesmium sp. under Fe stress. Biotechnol. Lett. 2003, 25, 645–649. [Google Scholar] [CrossRef]
  39. Lv, X.; Zhang, X.; Kang, R.; Hu, H.; Cong, W.; Tan, T. Effects of Fe3+ on growth and photosynthesis of Microcystis aeruginosa. J. Beijing Univ. Chem. Technol. 2006, 33, 27–30. [Google Scholar]
  40. Chen, G.; Li, Q.; Huang, Q.; Zhu, M. Effects of different concentrations of Vallisneria spiralis Linn. on growth and antioxidant system of Microcystis aeruginosa. Chin. J. Environ. Eng. 2012, 6, 4107–4112. [Google Scholar]
  41. Pan, G. Effect of Underwater Light Quality on Growth of Potamageton crispus and Vallisneria natans. Master’s Thesis, Nanjing Normal University, Nanjing, China, 2008; pp. 1–41. [Google Scholar]
  42. Xu, M.; Li, Y. The studied on culture spirulina platensis in the photobioreactor with LED illuminant panel. Mar. Sci. 2001, 25, 42–46. [Google Scholar]
  43. Zhen, B. The Study on Inhibition Mechanism of Cyanobacteria Growth by Irradiation Treatment. Ph.D. Thesis, Nanjing University, Nanjing, China, 2012; pp. 1–121. [Google Scholar]
  44. Wang, Z. Study on the Allelopathic Effects of Four Aquatic Plants Extracts on Microcystis flosaquae. Master’s Thesis, Shanxi University, Taiyuan, China, 2013; pp. 1–50. [Google Scholar]
  45. Liu, H. Investigation on the Inhibition Mechanism of Ceratophyllum demersum and Spirogyra on Microcystis aeruginosa. Ph.D. Thesis, Hunan Agricultural University, Changsha, China, 2014; pp. 1–78. [Google Scholar]
  46. Wu, X.; Wu, H.; Ye, J.; Zhong, B. Study on the release routes of allelochemicals from Pistia stratiotes Linn., and its anti-cyanobacteria mechanisms on Microcystis aeruginosa. Environ. Sci. Pollut. Res. 2015, 22, 18994–19001. [Google Scholar] [CrossRef] [PubMed]
Figure 1. Schematic diagram of the Vallisneria natans cultivation apparatus with fluorescent light (Control), blue LED (LED-Blue), and red LED (LED-Red) supplementation.
Water 17 00131 g001
Figure 2. Fluorescence parameters: (a) Yield, (b) α, (c) ETRmax, and (d) IK of Microcystis aeruginosa in different experimental treatments. Error bars indicate standard deviations.
Water 17 00131 g002
Figure 3. Inhibition rate (%) of (a) Yield, (b) α, (c) ETRmax, and (d) IK of Microcystis aeruginosa in different experimental treatments.
Water 17 00131 g003
Figure 4. Superoxide dismutase (SOD) (a) and peroxidase (POD) (b) activity of Microcystis aeruginosa cells in different experimental treatments. Error bars indicate standard deviations.
Water 17 00131 g004
Figure 5. Fluorescence excitation–emission matrix spectra for phycocyanin in Microcystis aeruginosa cells in different experimental treatments: (a) LED-Blue, (b) LED-Red, (c) Control, (d) BG-11.
Water 17 00131 g005
Disclaimer/Publisher’s Note: The statements, opinions and data contained in all publications are solely those of the individual author(s) and contributor(s) and not of MDPI and/or the editor(s). MDPI and/or the editor(s) disclaim responsibility for any injury to people or property resulting from any ideas, methods, instructions or products referred to in the content.

