Article

Comparative Analysis of Volumetric Mass Transfer Coefficients for Oxygen Uptake and Desorption with Nanobubbles

1
Escuela de Ingeniería Química, Pontificia Universidad Católica de Valparaíso, Av. Brasil 2162, Valparaíso 2340025, Chile
2
Escuela de Ingeniería Bioquímica, Pontificia Universidad Católica de Valparaíso, Av. Brasil 2085, Valparaíso 2340025, Chile
*
Author to whom correspondence should be addressed.
Water 2025, 17(1), 130; https://doi.org/10.3390/w17010130
Submission received: 11 December 2024 / Revised: 3 January 2025 / Accepted: 4 January 2025 / Published: 6 January 2025

Abstract

:
The volumetric mass transfer coefficients (kLa) of oxygen during sorption and desorption were analyzed using nanobubbles (NBs) of air and pure oxygen under various experimental conditions. The results showed that oxygen NBs achieved an increase in dissolved oxygen (DO) levels during absorption, reaching peaks of 30–34 mg∙L−1 and stabilizing at 31.3 ± 0.2 mg∙L−1, with a volumetric mass transfer coefficient of 0.105 ± 0.002 min−1. In comparison, air NBs showed a lower efficiency, with peak DOs of 8∙10 mg∙L−1 and kLa of 0.048 ± 0.001 min−1. In desorption studies, oxygen NBs had higher DO retention, reducing from 30.0 mg∙L−1 to 15.0 mg∙L−1 in 300 min, with a kLa of 0.042 ± 0.003 min−1, while air NBs decreased more rapidly, with a kLa of 0.028 ± 0.002 min−1. When oxygen was used, kLa outperformed air in both absorption and desorption, with a higher kLa during absorption, a lower kLa during desorption, and higher stability. In addition, the results show that the residence time has an important impact on the performance of NBs, showing that the direct influence of the flow dynamics and surface/to/volume ratio influences the value of kLa. The results highlight the superior performance of oxygen NBs versus air NBs in terms of mass transfer efficiency and stability and highlight the effect of residence time and NB composition in applications requiring efficient oxygen transfer, given the promising prospects for the development of advanced aeration technologies in industrial and environmental contexts.

1. Introduction

Nanobubbles (NBs) have emerged as a promising technology because they offer increased efficiency in various applications owing to their unique properties, such as high surface area and stability. These properties enable the nanobubbles to improve several processes. For example, aeration with nanobubbles improves the reduction of organic matter in domestic wastewater, with a reported decrease in chemical oxygen demand (COD) of 84.73% [1]. In addition, improvements in nanobubble-assisted flotation have been reported to enhance the removal of microplastics smaller than 10 µm from wastewater, increasing the removal rate by up to 12% compared with traditional methods [2]. Their use has been reported to eliminate bacteria, such as Escherichia coli, thereby achieving total sanitation of contaminated water [3]. On the other hand, in membrane distillation, micro-nanobubbles help delay scale formation and reduce fouling by creating an air cushion and turbulence that limit the deposition of solid particles on membrane surfaces, thereby improving the performance and reducing the flux drop during desalination [4]. Table 1 summarizes examples of different applications of nanobubbles at the industrial level.
The volumetric mass transfer coefficient is one of the most important parameters in processes involving gas–liquid mass transfer [18]. This parameter indicates the effectiveness with which certain species are transferred between the gas and liquid phase [19]. Nanobubbles are gas-filled cavities with diameters typically less than 200 nm and have emerged as a promising technology for improving gas–liquid mass transfer [20]. Their unique properties, such as high stability, large specific surface area, and ability to remain suspended in liquids for prolonged periods, have made them particularly useful for facilitating gas transfer [21]. For example, the use of NBs has been shown to improve gas dissolution rates, thereby increasing the efficiency of processes that rely on elevated levels of dissolved oxygen (DO) [7]. Recent studies have reported that oxygen NBs can improve kLa compared with conventional aeration methods [22]. This improvement is attributed to the larger surface area provided by the NBs, which allows for more efficient gas exchange [23]. Studies have found that the size of the nanopore and the surface charge of the nanobubbles influence their formation, achieving a kLa 3–4 times higher than that of microbubbles [24]. Doubled increases in kLa have been reported when NBs are used from 0.07 to 0.13 min−1 compared to conventional bubbles, improving the oxygen transfer efficiency in organic matter biodegradation applications [25]. In other cases, kLa increased to 2.6 × 10⁻² min−1 compared to 2.7 × 10⁻⁴ min−1 for macrobubbles in hydrogen peroxide electrogeneration [17]. Other studies have demonstrated the effectiveness of combined aeration systems with micro-nanobubbles (MNBs), where the presence of surfactants reduces kLa due to their accumulation at the gas–liquid interface and the decrease in bubble mobility [26]. In addition, the stability of NBs means that they remain in suspension for longer than larger bubbles, thus maintaining high DO levels for extended periods [27]. However, the type of gas in NBs can influence both solubility and reactivity [28].
Despite advances in the use of NBs to enhance gas–liquid mass transfer, there remains a gap in the understanding of how various variables affect adsorption and desorption processes. Factors such as gas type, bubble size, pH of the medium, and interaction with external agents, such as surfactants or ultrasound, influence these processes [29]. For example, the pH-dependent surface charge and interaction of NBs with ultrasonic cavitation can enhance adsorption on surfaces, such as activated carbon, and facilitate desorption by altering the interfacial conditions [30]. Additionally, physicochemical variables, such as temperature and solute concentration, can modify the properties of NBs, affecting their stability, size, and mass exchange capacity [31]. In liquid systems, NBs can generate turbulent flow and shear forces that reduce ion accumulation and minimize temperature and concentration polarization effects, thereby inhibiting desorption. Simultaneously, the electrostatic interactions between NBs and counterions function as selective adsorption mechanisms, regulating the availability of chemical species [32]. This highlights how the intrinsic properties of NBs, combined with experimental variables, can differentially influence adsorption and desorption processes.
In general, mass transfer processes occur via different absorption and desorption mechanisms, which are not always completely equivalent, even under the same experimental conditions [33]. These differences are attributed to factors such as the stability of the dissolved gas, the interaction between the gas and liquid phases, and the physicochemical properties of the system [34]. For example, gas absorption is usually more efficient because of steeper concentration gradients, whereas the stability of the gas in the liquid medium limits desorption [35]. Although the ability of NBs to improve the absorption of gases, such as oxygen, compared with traditional methods has been documented, the literature is limited with respect to their performance during desorption [36]. NBs have unique characteristics that can differentially influence both processes [37]. However, the comparative dynamics of absorption and desorption using NBs of different gases, such as oxygen and air, in controlled systems have not been explored in depth. Therefore, the aim of this study is to perform a comparative analysis of the volumetric mass transfer coefficients during the absorption and desorption processes in water using oxygen and air NBs.

2. Materials and Methods

2.1. Experimental System

This study was conducted in open tanks with oxygen and air NBs. Two experimental setups were conducted: one for absorption with a 100 L tank and one for desorption with 100 and 30 L tanks. The NBs were produced using a Kran K25 nanobubble generator (Kran-nanobubble, Puerto Varas, Chile) based on hydrodynamic cavitation. The operating conditions were a fixed pressure drop of 1.5 bar and a gas flow rate of 0.6 L∙min−1. The experiments were conducted at atmospheric pressure and sea level. Figure 1 shows the schematic of the experimental setup. This system starts with a gas source connected to a flowmeter (FI) and a pressure controller (P), which regulates the flow rate and pressure of the gas entering the Kran K25 nanobubble generator. The treated water circulated through a pump (P1), which maintained a continuous flow to the storage tank (T1). This tank measures the DO concentration (AI) and temperature (TI). Control valves allow for the adjustment of the water and gas flow rates. In addition, a recirculation circuit is included that re-enters the water into the generator to improve the generation of nanobubbles.
High-purity (99.5%) gaseous oxygen (provided by Linde) was supplied through a calibrated pump to maintain constant flow during the experiments, while air was filtered to eliminate impurities. A portable multiparameter meter (AI), model AZ, capable of measuring DO concentrations in the range of 0–50 mg∙L−1 (accuracy of ±1 mg∙L−1) and temperatures (TI) between 0 and 60 °C (accuracy of ±0.5 °C), was used.
DO reduction in water was performed by the addition of sodium sulfite (Na2SO3) in 40% excess as a deoxygenating agent (Equation (1)).
2 N a 2 S O 3 + O 2 2 N a 2 S O 4
Cobalt sulfate (CoSO4) was used as a catalyst to accelerate the reaction of deoxygenation. In this process, sodium sulfite reacts with dissolved oxygen to form sodium sulfate (Na2SO4), thus removing oxygen from water. Cobalt sulfate facilitates this reaction by providing cobalt ions (Co2+), which catalyze electron transfer and increase the sulfite oxidation rate [38].

2.2. KLa Determination

Using the integral method, kLa was determined using a dynamic model based on the differential mass transfer equation for nonstationary systems [39,40].
d C d t = k L a C α * C
L n C * C t C * C o = K L a t
where d C d t is the oxygen transfer rate, kLa is the volumetric mass transfer coefficient, C * is the saturated DO concentration, C is the DO concentration, and C o is the initial DO concentration.
The obtained coefficient was adjusted to the standard temperature (20 °C) using Equation (4) [20].
k L a 20 = k L a θ T 20 ° C
where T is the water temperature, θ is the correction factor (1.024), and kLa and kLa20 are the kLa with water temperature and the standardized volumetric coefficient at 20 °C, respectively.

2.3. Data Analysis

The obtained data were analyzed using a linear regression model, and the experimental values were adjusted to the mass transfer model using the coefficient of determination (R2). Analysis of variance (ANOVA) was performed to evaluate statistical significance, with p-values less than 0.05. The volumetric mass transfer coefficients were compared with their normalized values at 20 °C, and percentage differences were calculated to identify variations due to temperature. Finally, comparisons were made between the experimental conditions, including the gas type (oxygen and air), tank volumes (30 L and 100 L), and the use of the deoxygenating reagent.

3. Results

3.1. Absorption of Air and Oxygen by NBs

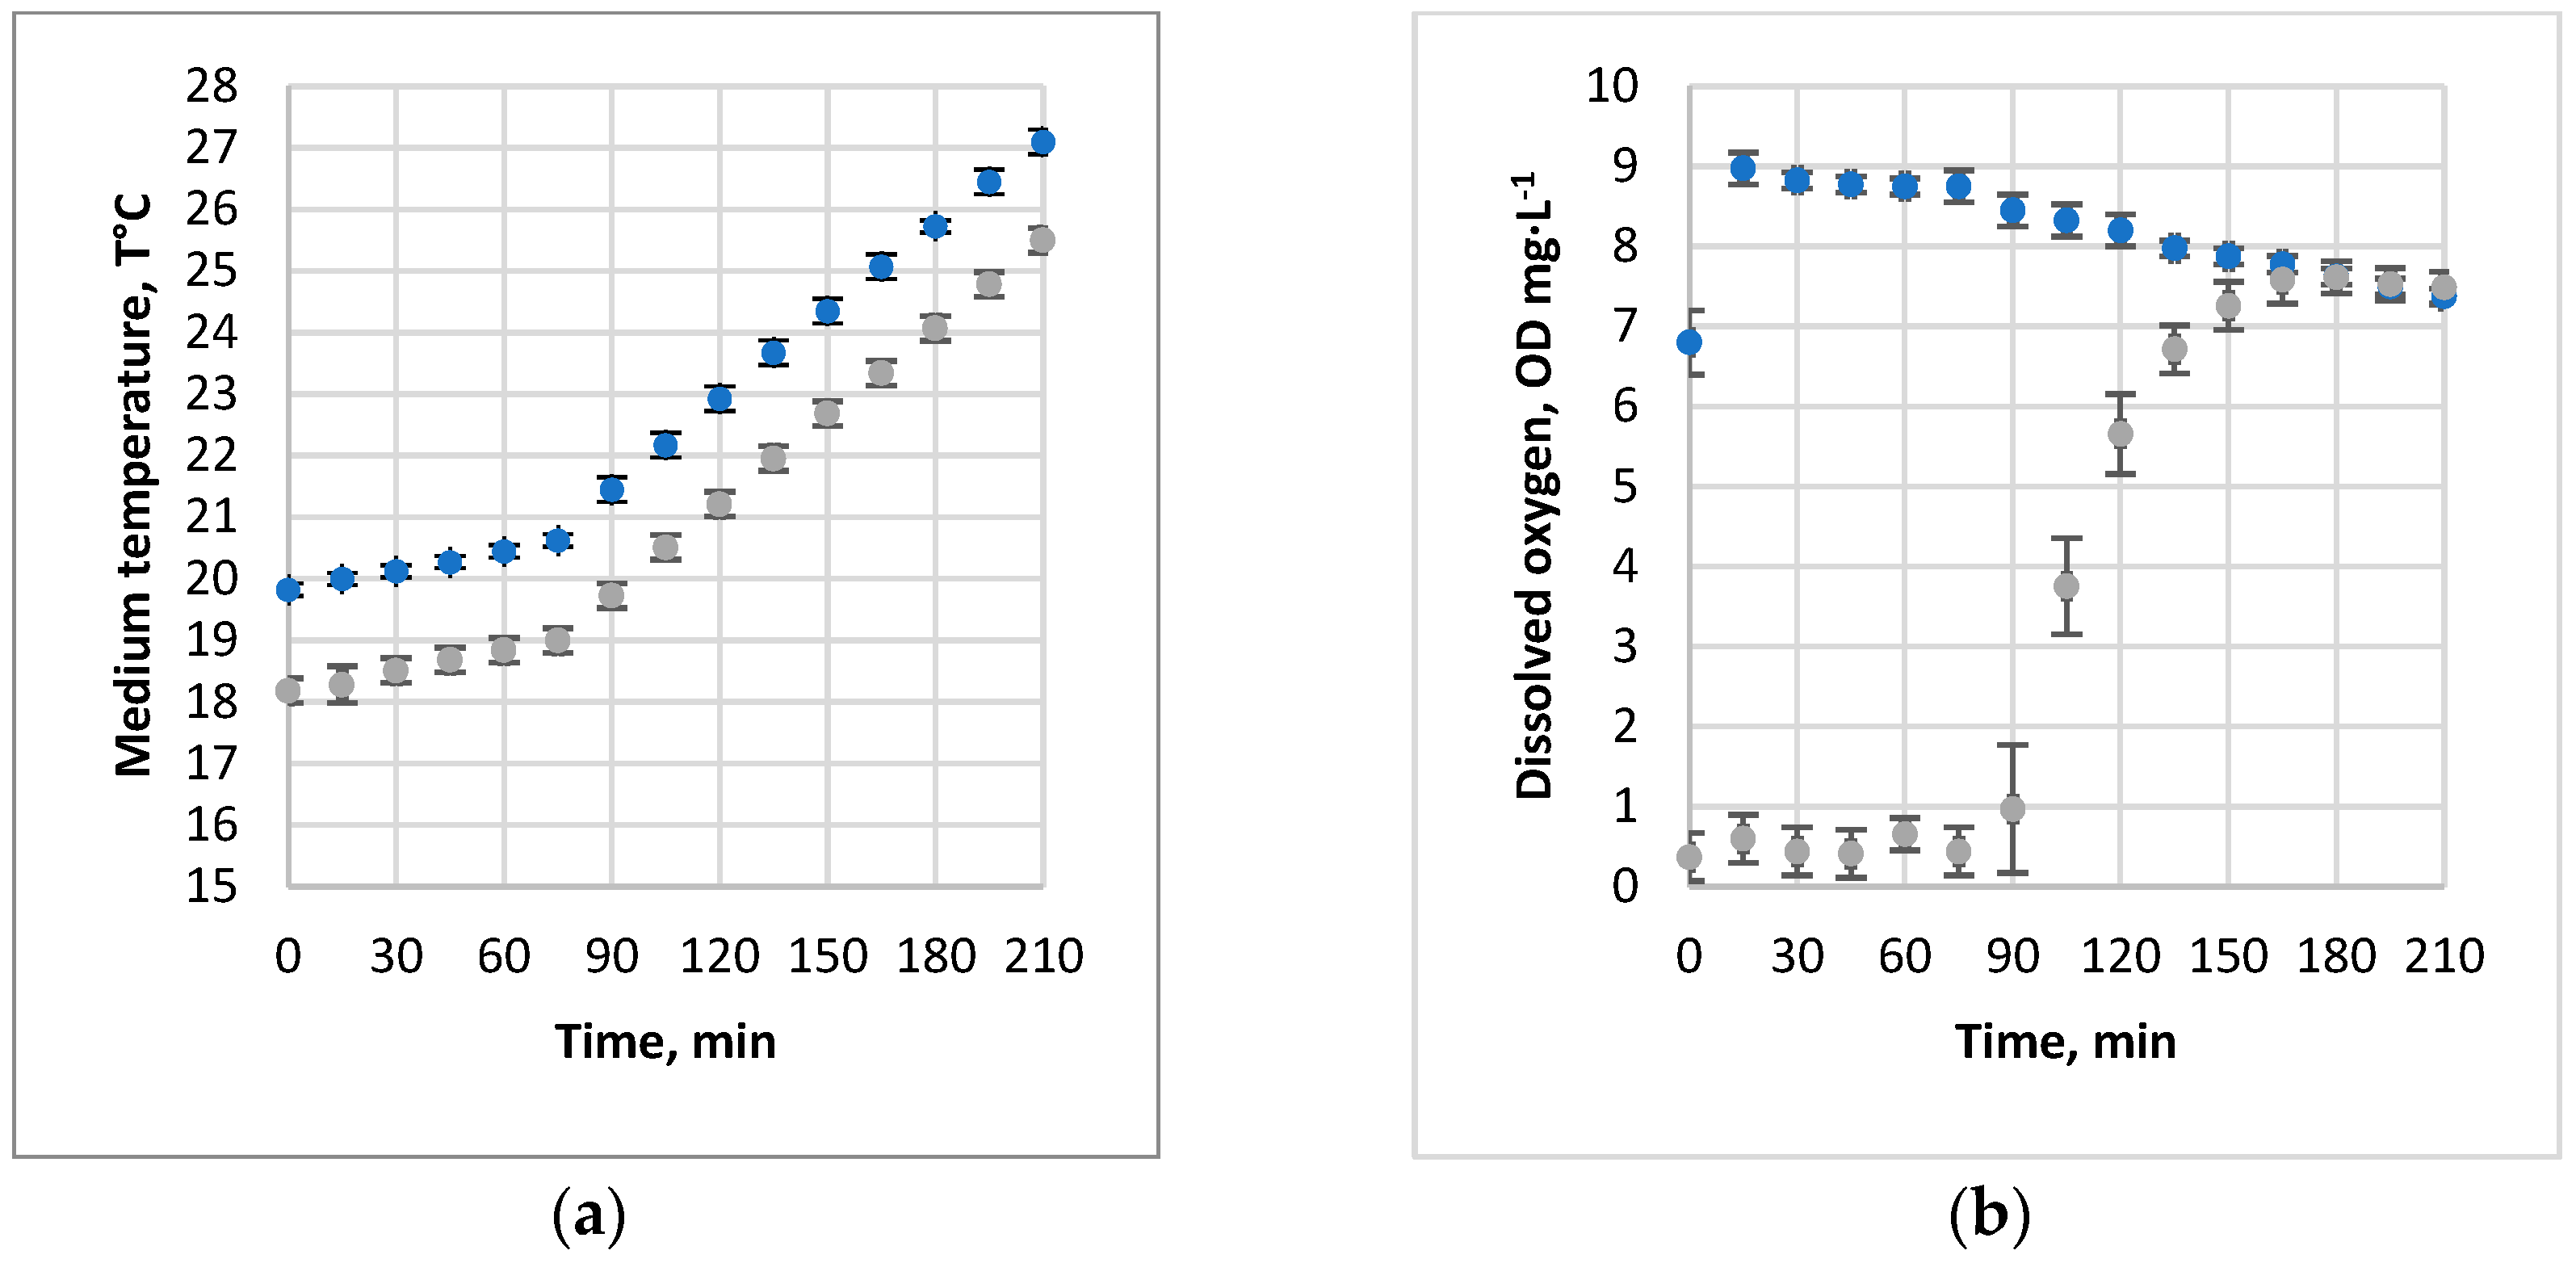
Figure 2 shows the behavior of the system temperature and DO concentrations during the operation time with air NBs with and without the use of a prior deoxygenating agent to reduce the initial DO in the water.
As shown in Figure 2a, the water temperature remained constant during the first 75 min of operation and then began to increase linearly, reaching a total increase of approximately 6 °C in both cases. This increase in temperature was due to the operation of the NB-generating equipment. Although temperature differences were observed between the two evaluated conditions, they did not exceed 2 °C throughout the experiment. Despite this increase, the solubility of oxygen in pure water remained above 40.0 mg∙L−1 [41], suggesting that temperature variations do not represent a relevant barrier to oxygen uptake.
On the other hand, Figure 2b shows that the DO concentration exhibits a different behavior owing to the use of the deoxygenating agent. In the absence of the deoxygenating agent, DO increased rapidly from 6.8 to 8.9 mg∙L−1 during the first 15 min of the experiment and then gradually decreased and stabilized at 7.4 mg∙L−1. This pattern reflects a different dynamic in the absorption process when the deoxygenating agents are not used, indicating that there is no relevant increase in DO in this case. At temperatures between 20 °C and 27 °C, the maximum solubility of oxygen in water was between 40.0 and 45.0 mg∙L−1 [42]. However, the observed gradual decrease in DO can be attributed to the fact that the agitation generated by the reinjection of water and gas accelerated the desorption rate, exceeding the absorption rate under these conditions. On the other hand, when the deoxygenating agent was used, the DO concentration remained below 1.0 mg∙L−1 for the first 90 min, after which it rapidly increased to 7.3 mg∙L−1 and stabilized around 7.4 mg∙L−1 until 210 min. This initial delay can be explained by the time required for the excess residual sodium sulfite in the water to be consumed, allowing oxygen absorption through DO to begin to be observed.
In both cases, the DO concentration equalized after 165 min and remained constant for the remainder of the experiment. Under these operating conditions, the saturation reached was 7.4 mg∙L−1, which is less than 20% of the maximum oxygen solubility capacity at the highest temperature recorded in the experiments.
In general, in this case, the differences could be attributed to air solubility limitations and initial water conditions, where the absence of residual sodium sulfite facilitated more direct and rapid uptake. In contrast, with deoxygenating agents, an initial delay was observed because of the time required to remove excess sulfite before effective absorption began.
Figure 3 shows the results obtained in the absorption experiments using oxygen NBs under the same conditions as in the previous experiment.
As shown in Figure 3a, as in the previous case, the water temperature remained constant during the first 75 min of operation and, after that point, began to increase linearly, reaching a total increase of approximately 6 °C in both cases. Although there were differences between the temperatures measured under the two experimental conditions, they did not exceed 2 °C throughout the experiment.
As shown in Figure 3b, the DO concentration exhibited similar behavior under both experimental conditions. Without a deoxygenating agent, DO gradually increases from 6.9 to 31.5 mg∙L−1 in the first two hours and stabilizes at 31.3 mg∙L−1 towards the end of the experiment. On the other hand, when deoxygenating agents were used, DO remained below 1.0 mg∙L−1 for the first 15 min, quickly increased to 31.1 mg∙L−1 at 105 min, and stabilized at 32.4 mg∙L−1 at 210 min. This initial delay is attributed to the time required to remove excess residual sodium sulfite, which allows the system to initiate the oxygen absorption process. This effect showed that the use of pure oxygen accelerated the absorption, reducing the operating time without appreciable DO by approximately six times.
In both cases, the DO concentration equalized after 105 min and remained constant during the rest of the experiment. Under these operating conditions, the oxygen saturation reached 32.4 mg∙L−1, which was approximately 80% of the maximum oxygen saturation at the highest temperature recorded in the experiments. Comparing this saturation point with that of air, it is observed that the saturation achieved with pure oxygen is four times higher and is reached in 30% less time.
In general, the temperature followed a similar pattern to that observed in Figure 2a, with no relevant differences between the conditions. Figure 3b reveals a much greater increase in DO levels when pure oxygen was used. This behavior reflects the advantages of pure oxygen, whose higher solubility and partial pressure allow for more efficient mass transport, making this gas more effective for rapid oxygenation applications.

3.2. Oxygen Desorption Dynamics

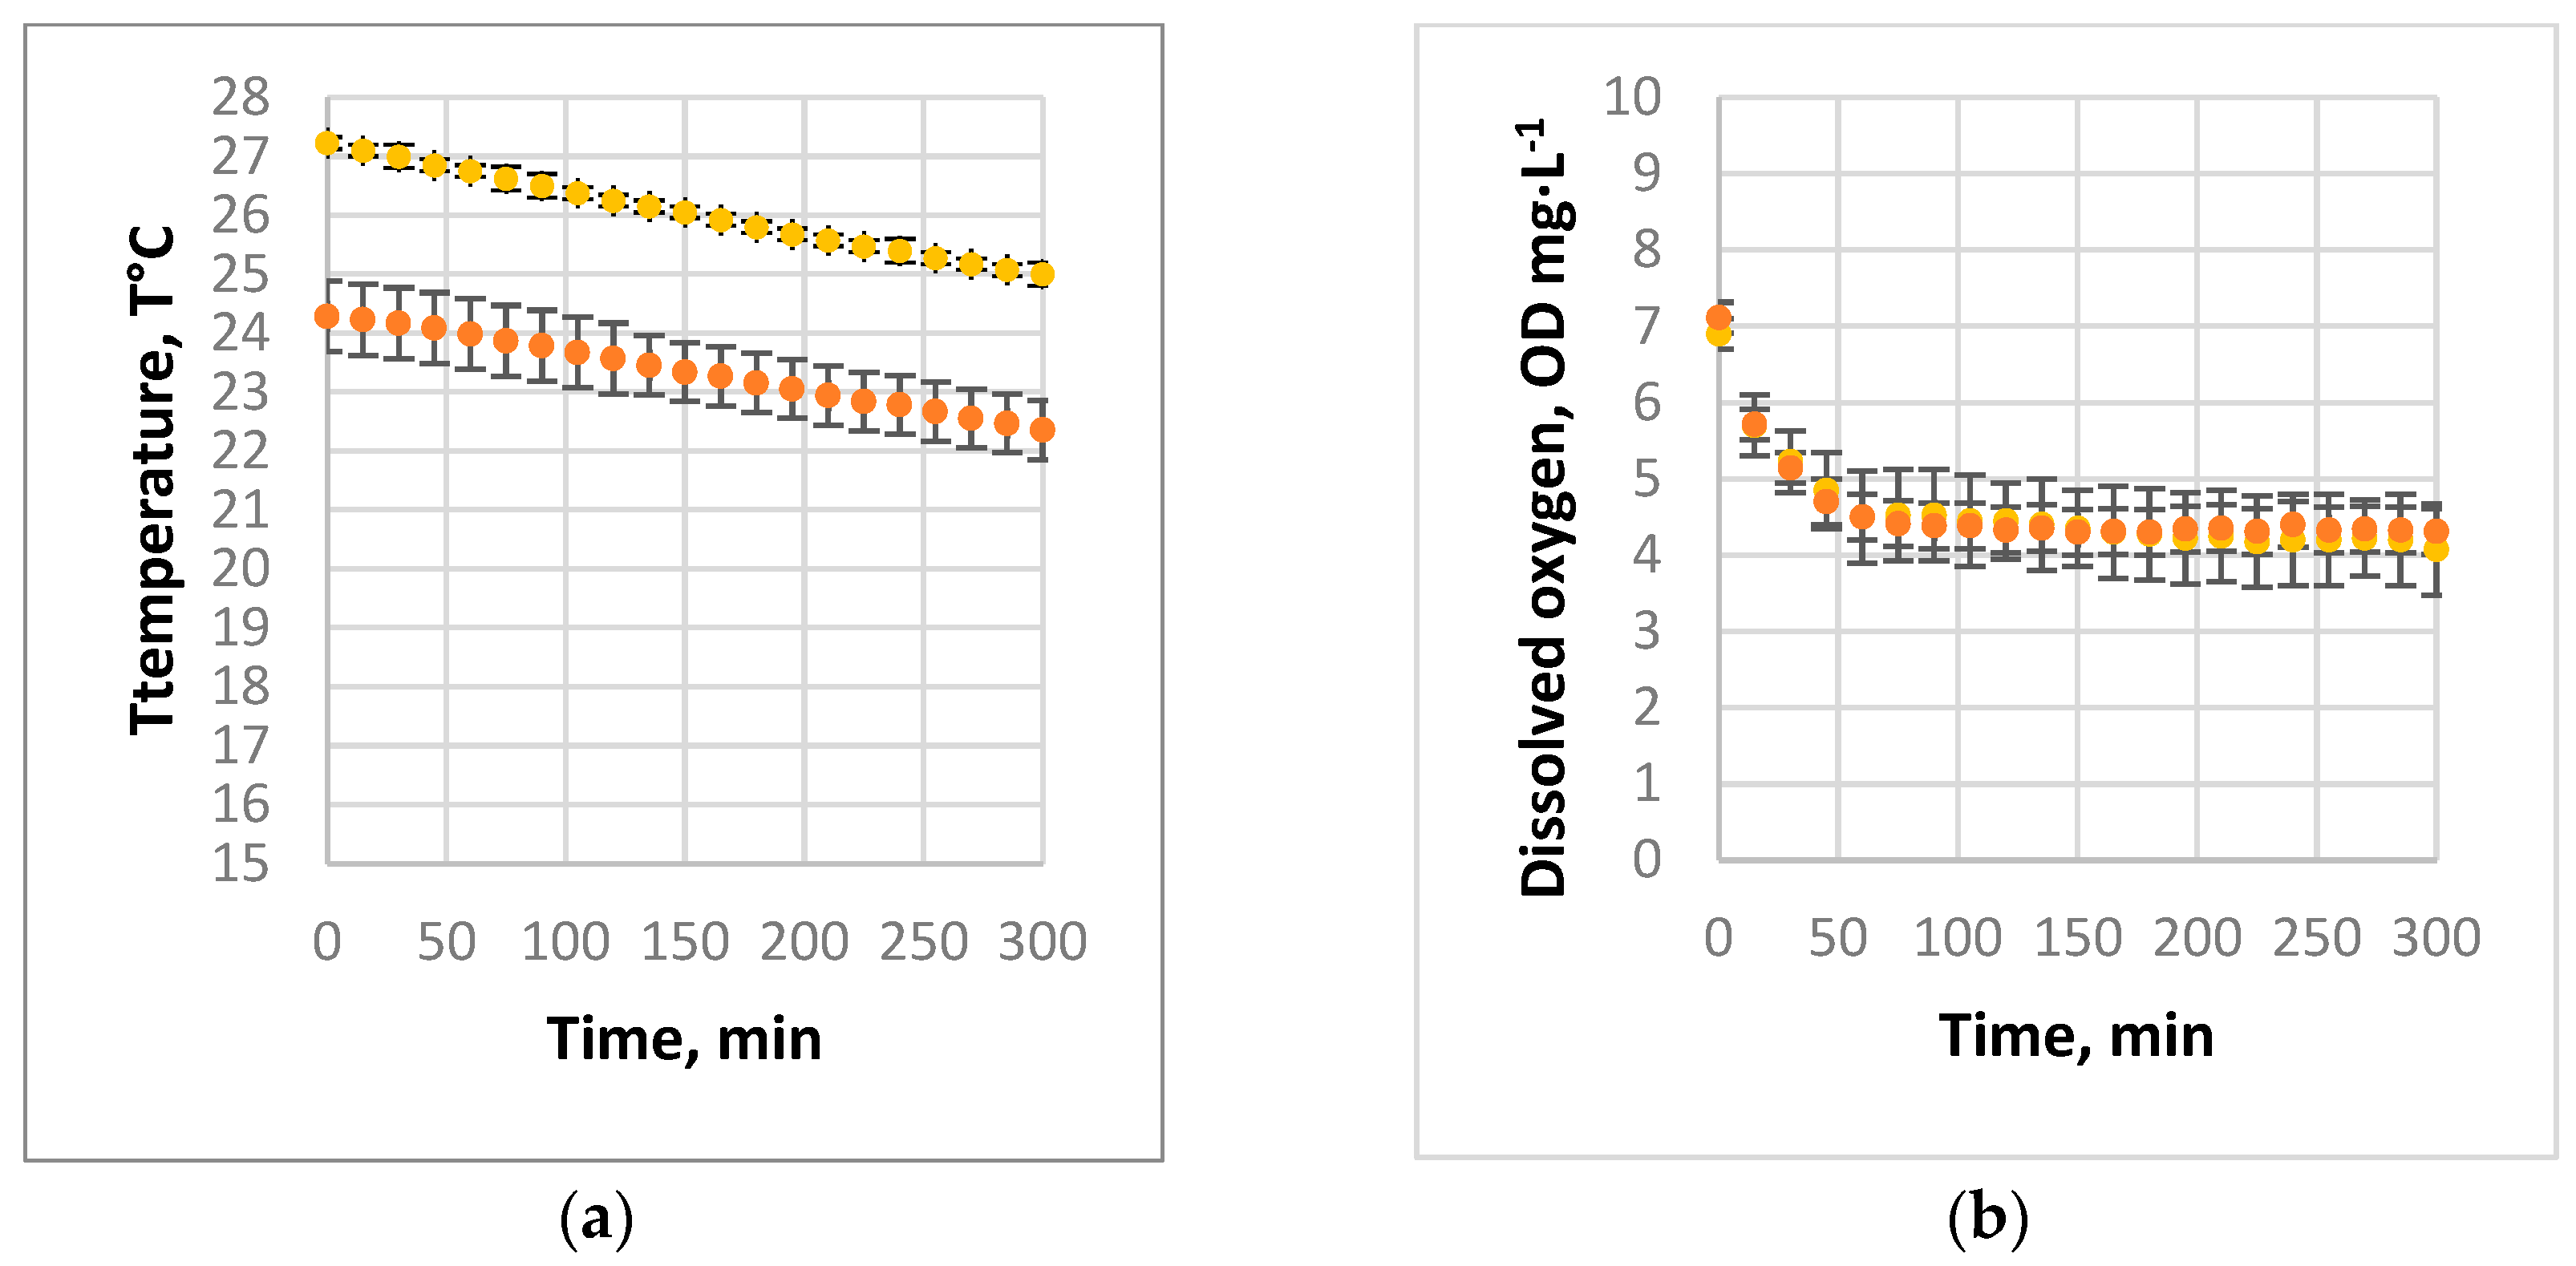
Figure 4 presents the results obtained in the oxygen desorption experiments when NB air was previously injected into a 100 L tank, showing the temperature profiles and DO concentrations over time considering the use and non-use of the deoxygenating agent.
As shown in Figure 4a, the water temperature decreased gradually in both cases, registering a decrease of approximately 2 °C during 300 min of the experiment. Although differences were identified between the temperatures recorded under the two experimental conditions, these variations did not exceed 3 °C over the entire observation period.
The DO concentration shows a similar behavior in both cases, decreasing from 7.1 mg∙L−1 to 4.5 mg∙L−1 during the first 60 min of the experiment. Subsequently, the DO concentration remained constant, reaching 4.3 mg∙L−1 after 5 h. This change is a decrease of approximately 40% in the oxygen initially dissolved in the system, which reflects the desorption dynamics under the conditions evaluated.
This result highlights the limited oxygen retention in water when using air nanobubbles, attributable to their composition and lower stability than oxygen nanobubbles.
Figure 5 shows the results of the same experiments but with the injection of NB oxygen.
As shown in Figure 5a, the water temperature gradually decreased in both cases, with an approximate decrease of 2 °C during the 300 min of the experiment, a behavior similar to that observed in the previous section. Although the temperatures differed slightly between the evaluated conditions, they did not exceed three °C throughout the experiment.
On the other hand, the DO concentration follows an almost identical pattern in both cases, decreasing from 30.0 mg∙L−1 to 17.8 mg∙L−1 during the first 60 min and stabilizing around 15.0 mg∙L−1 after 5 h. This change was a reduction of approximately 45% in the initial dissolved oxygen.
This result highlights the superior stability of oxygen nanobubbles and their increased resistance to desorption, making them ideal for applications where prolonged oxygen retention is required.
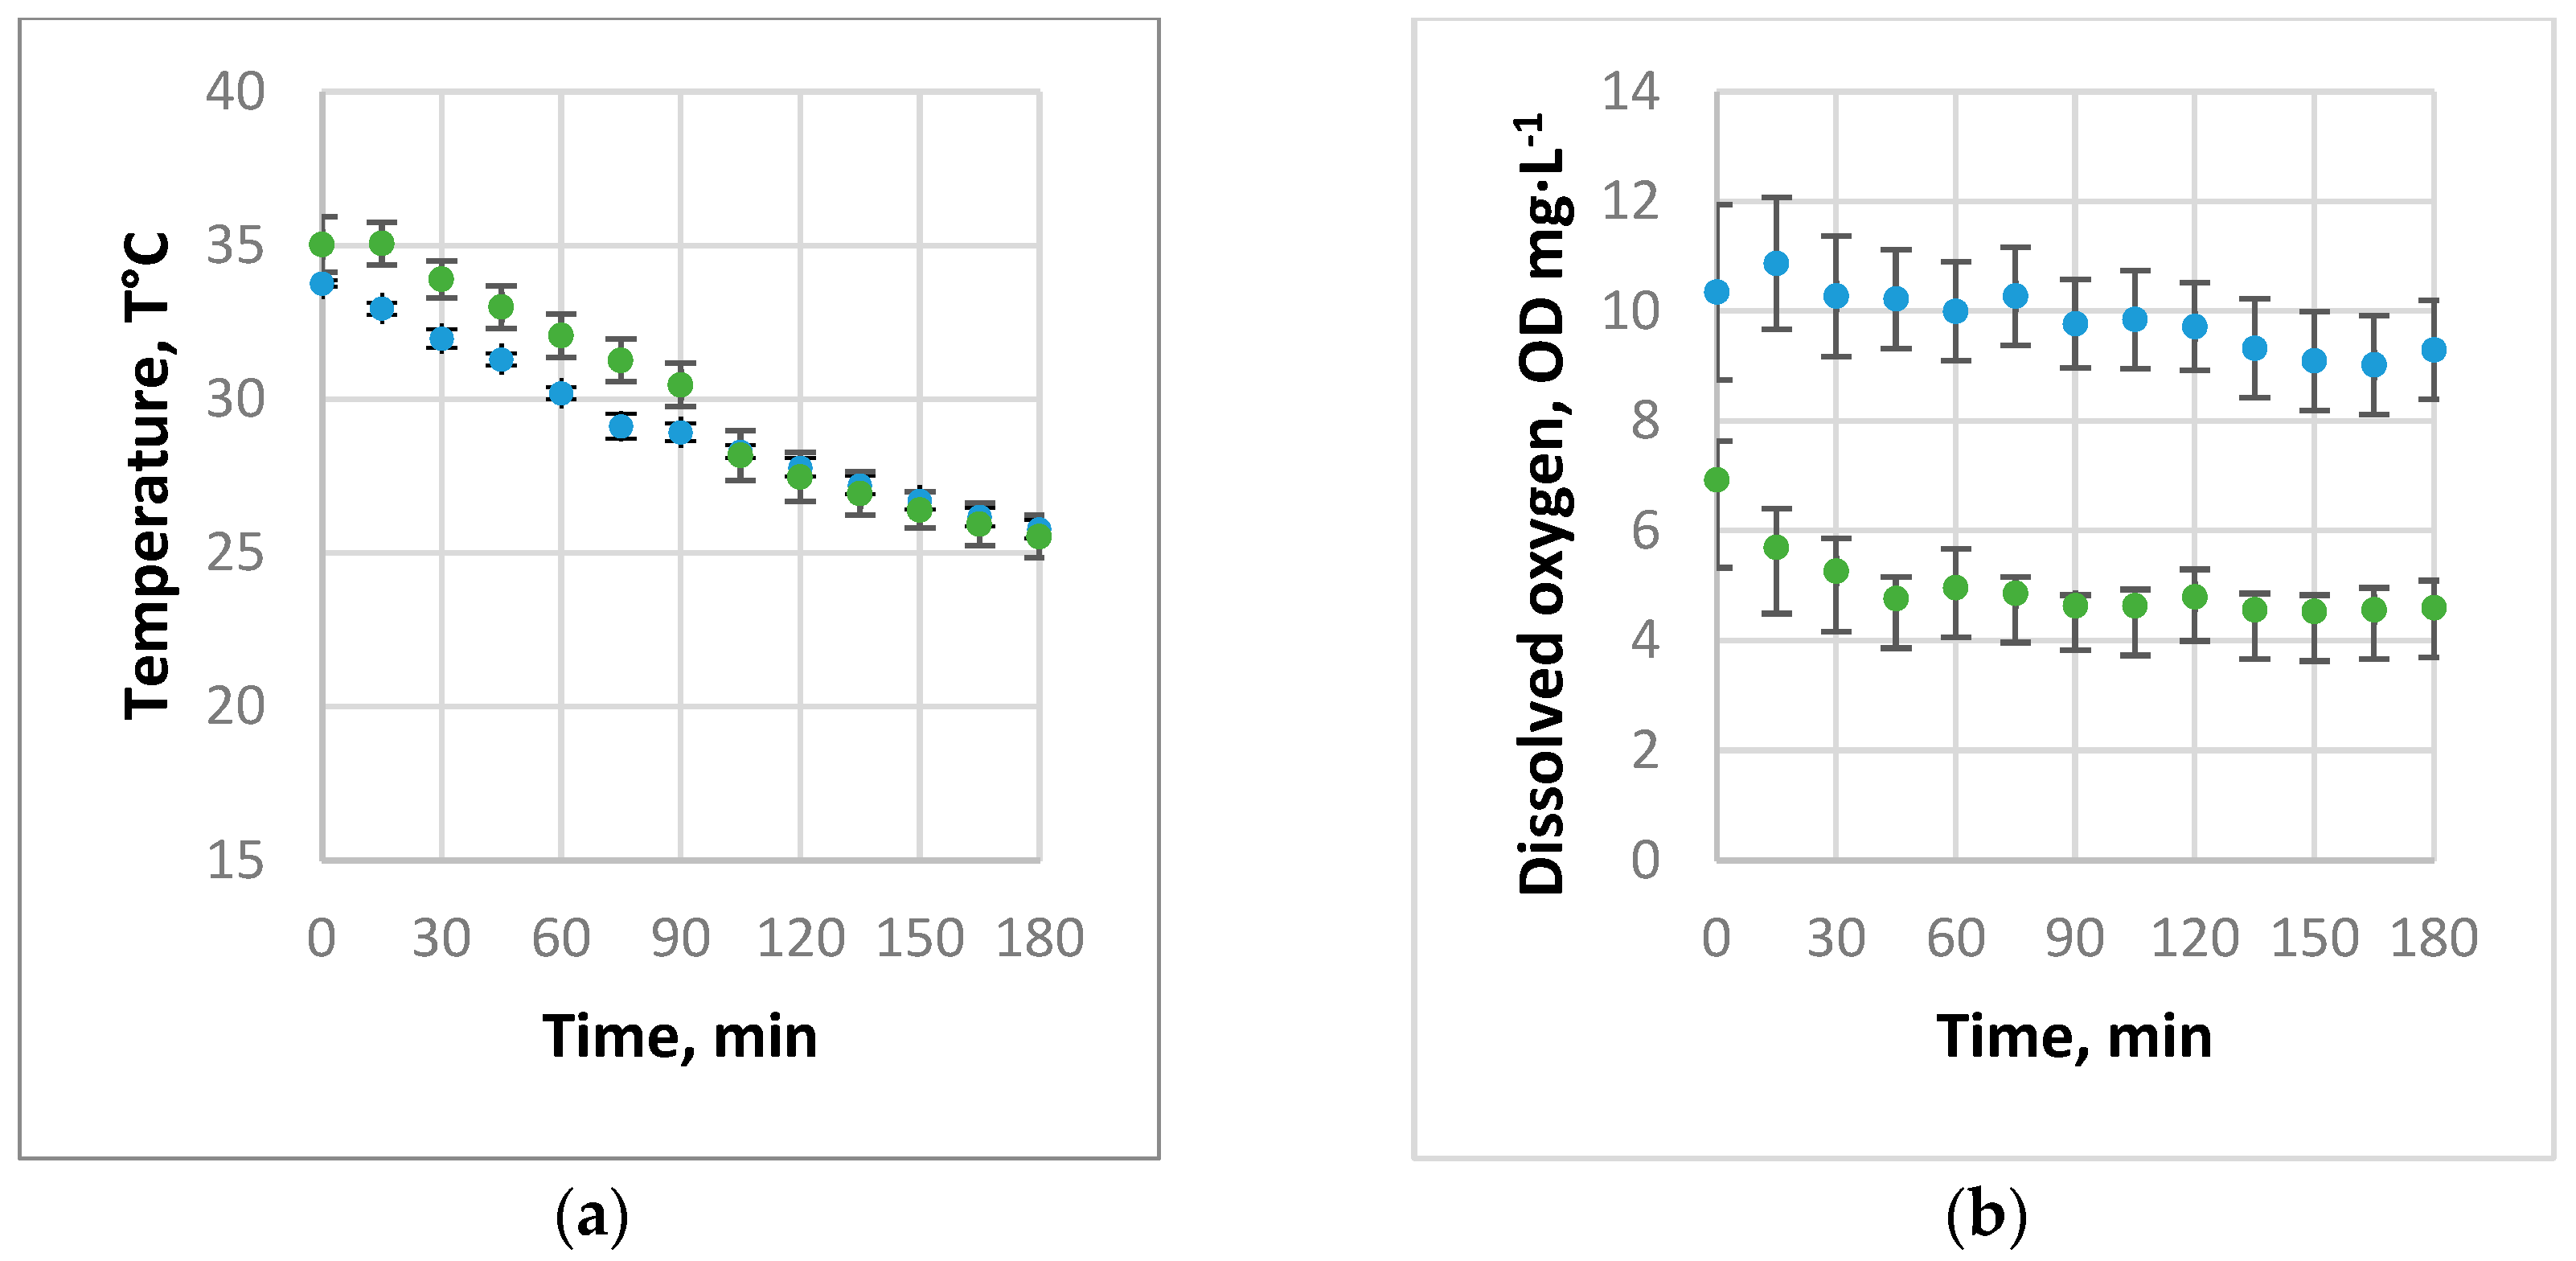
Figure 6 presents the results obtained in the oxygen desorption experiments conducted in a 30 L vessel showing the temperature profiles and DO concentrations over time when comparing the use of air and oxygen NBs.
As shown in Figure 6a, the water temperature gradually decreased in both cases. In the case of air, the temperature drops from 33.8 °C, while for oxygen, it starts at 35.0 °C, with both conditions reaching the same temperature of 28.1 °C in 105 min. From that point on, cooling continued slowly, recording a final temperature of 25.5 °C after 180 min of measurement.
The DO concentration is consistently lower when air is used as the pre-injection gas, with values between 3.3 and 5.3 mg∙L1 below those recorded when using oxygen NBs. In addition, the decrease in DO concentration was more pronounced in the air, decreasing from 6.9 mg∙L1 to 5.0 mg∙L1 in the first 60 min with a 28.4% reduction. In contrast, when pure oxygen was used, DO dropped from 10.3 mg∙L1 to 10.0 mg∙L1 during the same period, equivalent to a decrease of 2.6%. These results indicate that in addition to dissolving greater amounts of oxygen, the system with pure oxygen presents greater stability in DO, managing to desorb more than 10% of the initial oxygen after 150 min of operation.
This behavior reflects the superiority of oxygen nanobubbles in terms of stability and mass transfer efficiency, even in smaller-volume systems.

3.3. Evaluation of kLa

To evaluate kLa, the time interval corresponding to the phase of maximum transfer in each experiment was selected. The kLa values were calculated and normalized to 20 °C using Equation (4). Table 2 presents the results. As can be seen, in all cases, except for the absorption curve with air without the use of a deoxygenating reagent, the model used adequately is the mass transfer phenomenon, with very low p-values.
In the comparison between the adjusted kLa values, no significant changes were observed in most cases, with differences of less than 10%. These discrepancies were mainly observed in experiments performed at temperatures above 24 °C.
When comparing the results under the same gas conditions, vessel volume, and use of deoxygenating reagents, the temperature profiles were consistent, allowing direct comparison. The differences between the standardized kLa values were mostly less than 10%. However, when pure oxygen was evaluated with deoxygenating agents, the desorption coefficient was approximately 40% lower than the corresponding absorption coefficient.
When comparing different gases, the most significant differences were observed when the deoxygenating agents were used. In these cases, the normalized absorption coefficient for pure oxygen was approximately 39% higher than that of air, whereas, in desorption, the coefficient was 17% lower, supporting the higher efficiency of pure oxygen in absorption and its relative stability in desorption.
Differences in the size of the aeration tank were accentuated. The normalized mass transfer coefficient for pure oxygen was 83% lower than that for air when larger tanks were used.
It is worth mentioning that the comparisons with and without standardization showed no significant differences under the conditions under which the experiments were conducted. This suggests that the stability observed in oxygen NBs favors higher oxygen retention after aeration, an effect that does not seem to be exclusively related to dissolved electrolytes, as was also evidenced in an experiment without the use of deoxygenators.

4. Discussion

The results obtained in this study show the better performance of oxygen NBs compared to air NBs in both the absorption and desorption processes. In terms of absorption, oxygen NBs achieved higher dissolved oxygen levels, reaching up to 32.4 mg∙L−1, in contrast to the 7.4 mg∙L−1 obtained with air NBs. This behavior is reflected in the higher kLa for oxygen NBs (0.105 min−1 versus 0.048 min−1 for air). In addition, absorption with oxygen NBs was more efficient, reducing the time needed to reach stable DO levels by approximately 30% compared with air. In desorption, oxygen NBs also showed greater stability, with a reduction in DO from 30.0 mg∙L−1 to 15.0 mg∙L−1 in 300 min compared to the rapid decrease observed with air, from 8.9 mg∙L−1 to 2.0 mg∙L−1 in 200 min. This behavior was corroborated by the kLa values, which were 0.042 min−1 for oxygen and 0.028 min−1 for air, highlighting the ability of oxygen NBs to maintain elevated DO levels for prolonged periods. These results can be explained by the intrinsic properties of oxygen-containing NBs. These characteristics increase the interfacial gas–liquid interaction, enhancing the dissolution during absorption and decreasing the desorption rates. Furthermore, the observed stability does not depend exclusively on the electrolytes present in water, as equivalent results were replicated in experiments without the use of deoxygenators.
Differences in the desorption dynamics between oxygen and air nanobubbles can be explained by variations in the gas solubility and bubble stability. Oxygen has higher solubility in water than nitrogen, which makes up most of the air. This higher solubility allows oxygen nanobubbles to dissolve more slowly in the liquid medium during the desorption process, maintaining higher levels of dissolved oxygen for a longer period. In contrast, air nanobubbles, which contain a lower proportion of oxygen and exhibit lower overall solubility, experienced faster desorption rates, resulting in a steeper drop in DO.
The observed differences in the kLa values and adsorption and desorption dynamics under different experimental conditions in this study can be attributed to specific factors controlled during the experiments. For example, the type of gas used (pure oxygen or air) had a significant impact on mass transfer, with oxygen nanobubbles achieving higher kLa during adsorption and higher stability during desorption. This can be explained by the higher solubility and partial pressure of oxygen compared with air, which facilitates higher DO retention in water.
Another factor is the use of deoxygenating reagents, which affects the initial DO conditions in the experiments. When deoxygenating agents were used, the onset times for adsorption were longer, reflecting the time required to remove excess residual sodium sulfite. This results in more efficient absorption dynamics when the system reaches equilibrium conditions.
In addition, the tank volume (100 L vs. 30 L) influenced the residence times and mass transfer rates. In the smaller-volume tanks, kLa was higher due to conditions that favored better gas–liquid interaction, while in the larger tanks, although greater homogeneity was achieved, long residence times reduced the mass transfer efficiency.
However, the stability of the nanobubbles also plays a relevant role in the observed differences. Oxygen nanobubbles tended to be more stable. This decreases the probability of bubble collapse and abrupt gas release, which slows the desorption. In the case of air nanobubbles, the heterogeneous composition of gases inside the bubble reduces their stability, which facilitates their collapse and faster gas release. In addition, the higher partial pressure of pure oxygen within the oxygen nanobubbles also contributed to slower desorption compared to air nanobubbles.
The results also show the impact of tank size on NB performance. In larger volume tanks (100 L), kLa for oxygen NBs was 83% lower than that for the 30 L tanks, indicating that the flow dynamics and surface-to-volume ratio directly influenced the results. With respect to residence times, particularly when comparing the 100 L and 30 L tanks, as expected, in larger tanks, the gas residence time is longer and there is a lower surface-to-volume ratio referring to the surface in contact with the atmosphere, which reduces the interfacial contact between the gas and liquid phases. Conversely, in smaller tanks, the shorter residence time was compensated by a higher surface-to-volume ratio and higher gas–liquid interaction efficiency, resulting in a higher kLa. These results suggest that to maximize the mass transfer efficiency, NBs are most effective in smaller-scale systems, where flow dynamics and contact conditions are more favorable. Previous studies have demonstrated the potential of NBs to improve gas transfer efficiency in aquaculture, wastewater treatment, and biotechnological processes [15]. The literature supports that the high stability and surface area of NBs are determining factors for their superior performance [16]. In addition, investigations of the behavior of micro- and NBs have highlighted their ability to maintain high gas concentrations and resist rapid dissolution, which agrees with the results obtained in this study [17]. However, the scope of the results is limited by the controlled experimental conditions used in this study.
The scalability of NB-based systems faces technical challenges, such as the need to properly define the optimal number of bubbles to achieve adequate levels of oxygenation at adequate costs [42]. In addition, environmental factors that may affect NB generation such as oxygen quality, ambient temperature, and pressure, must be considered [43,44]. Therefore, future research should focus on the development of more efficient and sustainable generation technologies, as well as on evaluating the energy balance and environmental effects of large-scale NB systems, allowing their viability from both economic and ecological perspectives [45].
In addition to the limitations associated with controlled experimental conditions, it is important to consider how variations in water chemistry, such as salinity and pH, can affect sorption and desorption processes in nanobubble systems. For example, an increase in salinity can change the surface tension of water and affect the stability of nanobubbles, reducing their lifetime and altering their mass transfer rates [46]. Similarly, the pH of the medium directly influences the surface charge of the nanobubbles, which can alter the interfacial interactions and affect both adsorption efficiency and gas retention during desorption [47]. These factors not only impact the kLa values but may also influence the effectiveness of nanobubbles for specific applications, such as saline water treatment or acidity control in industrial processes. Therefore, future studies should include a more detailed analysis of these variables to better understand their impact on mass transfer dynamics and to improve the adaptability of nanobubbles in real environments.

5. Conclusions

Oxygen NBs improved the volumetric mass transfer coefficient during absorption and desorption compared to air NBs. During desorption, oxygen NBs exhibited slower DO decay rates and higher kLa values than air NBs, highlighting their improved stability and prolonged oxygen retention.
These results suggest the potential of oxygen NBs to improve aeration processes because of their ability to maintain higher DO levels and stability. At a practical level, these results are consistent with those of previous studies, highlighting the potential of NBs for various applications. However, it is important to note the limitations of this study, which was conducted under controlled conditions. Variables such as temperature, pressure, and medium composition can influence the behavior of NBs in real environments.
It is shown that oxygen NBs not only outperform air NBs in mass transfer efficiency but also offer advantages in terms of stability and oxygen retention. The results also suggest that smaller-scale systems should be used to maximize mass transfer efficiency, where flow dynamics and contact conditions are more favorable. These results offer some insight into the possibilities of optimizing oxygenation-dependent processes, although future research should focus on exploring the impact of environmental factors and validating the scalability of this technology in industrial and environmental applications.

Author Contributions

Conceptualization, J.S. and R.O.; methodology, L.A.-T.; software, R.O.; validation, C.C. and G.A.; formal analysis, J.S., R.O., C.C. and G.A.; investigation, L.A.-T.; resources, J.S.; data curation, R.O.; writing—original draft preparation, J.S., L.A.-T. and R.O.; writing—review and editing, J.S.; visualization, J.S. and R.O.; supervision, J.S.; project administration, J.S.; funding acquisition, J.S. All authors have read and agreed to the published version of the manuscript.

Funding

This research received no external funding.

Data Availability Statement

No new data were created or analyzed in this study. Data sharing is not applicable to this article.

Conflicts of Interest

The authors declare no conflicts of interest.

References

  1. Thom, P.T.; Hai, L.D.; Khoi, N.T. Application of Nano Bubble Aeration Technology in Domestic Wastewater Treatment: Optimization of Gas Flow and Reaction Time. J. Glob. Ecol. Environ. 2024, 20, 146–154. [Google Scholar] [CrossRef]
  2. Jia, M.; Farid, M.U.; Ho, Y.-W.; Ma, X.; Wong, P.W.; Nah, T.; He, Y.; Boey, M.W.; Lu, G.; Fang, J.K.-H.; et al. Advanced Nanobubble Flotation for Enhanced Removal of Sub-10 Μm Microplastics from Wastewater. Nat. Commun. 2024, 15, 9079. [Google Scholar] [CrossRef]
  3. Guerra, J.; Lechón, J.; Mosquera, L.; Ferie, J.; Ormeño-Mejía, E.; Lechón, V. Nanobubbles Generation System for Bacteria Removal in Water through Hydrodynamic Cavitation. In Proceedings of the 2024 IEEE Eighth Ecuador Technical Chapters Meeting (ETCM), Cuenca, Ecuador, 15–18 October 2024; IEEE: Piscataway, NJ, USA, 2024; pp. 1–5. [Google Scholar]
  4. Radadiya, N.L.; Kumar, A.; Kalla, S. Micro-nanobubbles Assisted Fouling Reduction in Membrane Distillation for Desalination. Can. J. Chem. Eng. 2024. early review. [Google Scholar] [CrossRef]
  5. Zhu, N.; Li, M.; Shibata, K. The Development of a High-Concentration Oxygenated Water Generator Based on Nanobubbles and Its Application. Eng. Proc. 2023, 55, 23. [Google Scholar] [CrossRef]
  6. Yaparatne, S.; Morón-López, J.; Bouchard, D.; Garcia-Segura, S.; Apul, O.G. Nanobubble Applications in Aquaculture Industry for Improving Harvest Yield, Wastewater Treatment, and Disease Control. Sci. Total Environ. 2024, 931, 172687. [Google Scholar] [CrossRef] [PubMed]
  7. Foudas, A.W.; Kosheleva, R.I.; Favvas, E.P.; Kostoglou, M.; Mitropoulos, A.C.; Kyzas, G.Z. Fundamentals and Applications of Nanobubbles: A Review. Chem. Eng. Res. Des. 2023, 189, 64–86. [Google Scholar] [CrossRef]
  8. Patel, A.K.; Singhania, R.R.; Chen, C.-W.; Tseng, Y.-S.; Kuo, C.-H.; Wu, C.-H.; Dong, C. Di Advances in Micro- and Nano Bubbles Technology for Application in Biochemical Processes. Env. Technol. Innov. 2021, 23, 101729. [Google Scholar] [CrossRef]
  9. Thangadurai, D.; Shettar, A.K.; Sangeetha, J.; Adetunji, C.O.; Islam, S.; Al-Tawaha, A.R.M.S. Nanobubble Technology for Remediation of Metal-Contaminated Soil. In Nanomaterials for Soil Remediation; Elsevier: Amsterdam, The Netherlands, 2021; pp. 427–441. [Google Scholar]
  10. Zhang, Y.; Song, Z.; Sugita, K.; Xue, S.; Zhang, W. Impacts of Nanobubbles in Pore Water on Heavy Metal Pollutant Release from Contaminated Soil Columns. Nanomaterials 2023, 13, 1671. [Google Scholar] [CrossRef] [PubMed]
  11. DeBoer, E.J.; Richardson, M.D.; Gentimis, T.; McCalla, J.H. Analysis of Nanobubble-Oxygenated Water for Horticultural Applications. Horttechnology 2024, 34, 769–773. [Google Scholar] [CrossRef]
  12. Arablousabet, Y.; Povilaitis, A. The Impact of Nanobubble Gases in Enhancing Soil Moisture, Nutrient Uptake Efficiency and Plant Growth: A Review. Water 2024, 16, 3074. [Google Scholar] [CrossRef]
  13. Lee, Y.-G.; Han, J.-G.; Choi, J.-H.; Kim, D.-C.; You, S.-K.; Hong, K. Effect of Nano-Bubble on Removal of Complex Heavy Metals. J. Korean Geosynth. Soc. 2015, 14, 139–146. [Google Scholar] [CrossRef]
  14. Lee, J.H.; Lee, S.H.; Suh, D.H. Using Nanobubblized Carbon Dioxide for Effective Microextraction of Heavy Metals. J. CO2 Util. 2020, 39, 101163. [Google Scholar] [CrossRef]
  15. Alkan, P.E.; Güneş, M.E.; Sabanci, A.Ü. Can Nanobubble Ozone Liposomes Be a New Agent in the Fight Against Foodborne Infections? Recent. Pat. Nanotechnol. 2024, 18, 17–21. [Google Scholar] [CrossRef]
  16. Shiroodi, S.; Schwarz, M.H.; Nitin, N.; Ovissipour, R. Efficacy of Nanobubbles Alone or in Combination with Neutral Electrolyzed Water in Removing Escherichia Coli O157:H7, Vibrio Parahaemolyticus, and Listeria Innocua Biofilms. Food Bioprocess Technol. 2021, 14, 287–297. [Google Scholar] [CrossRef]
  17. Magdaleno, A.L.; Cerrón-Calle, G.A.; dos Santos, A.J.; Lanza, M.R.V.; Apul, O.G.; Garcia-Segura, S. Unlocking the Potential of Nanobubbles: Achieving Exceptional Gas Efficiency in Electrogeneration of Hydrogen Peroxide (Small 3/2024). Small 2024, 20, 2470021. [Google Scholar] [CrossRef]
  18. Ho, D.; Kim, K.; Earmme, T.; Kim, C. Enhancing Gas–Liquid Volumetric Mass Transfer Coefficient. J. Ind. Eng. Chem. 2020, 87, 1–17. [Google Scholar] [CrossRef]
  19. Mast, Y.; Wild, M.; Takors, R. Optimizing Mass Transfer in Multiphase Fermentation: The Role of Drag Models and Physical Conditions. Processes 2023, 12, 45. [Google Scholar] [CrossRef]
  20. Sharma, H.; Nirmalkar, N. Enhanced Gas-Liquid Mass Transfer Coefficient by Bulk Nanobubbles in Water. Mater. Today Proc. 2022, 57, 1838–1841. [Google Scholar] [CrossRef]
  21. Wang, T.; Yang, C.; Sun, P.; Wang, M.; Lin, F.; Fiallos, M.; Khu, S.-T. Generation Mechanism of Hydroxyl Free Radicals in Micro–Nanobubbles Water and Its Prospect in Drinking Water. Processes 2024, 12, 683. [Google Scholar] [CrossRef]
  22. Nguyen, H.-H.T.; Jeong, Y.-H.; Choi, Y.-H.; Kwak, D.-H. Effect of Bubble Sizes on Oxygen Transfer Efficiency of Nano- and Micro-Sized Bubble Clouds for Improving Aquatic Environments. Int. J. Environ. Sci. Technol. 2024. [Google Scholar] [CrossRef]
  23. Kadier, A.; Akkaya, G.K.; Singh, R.; Niza, N.M.; Parkash, A.; Achagri, G.; Bhagawati, P.B.; Asaithambi, P.; Al-Qodah, Z.; Almanaseer, N.; et al. Micro and Nano-Sized Bubbles for Sanitation and Water Reuse: From Fundamentals to Application. Front. Env. Sci. Eng. 2024, 18, 147. [Google Scholar] [CrossRef]
  24. Sharma, H.; Nirmalkar, N.; Zhang, W. Nanobubbles Produced by Nanopores to Probe Gas-Liquid Mass Transfer Characteristics. J. Colloid. Interface Sci. 2024, 665, 274–285. [Google Scholar] [CrossRef] [PubMed]
  25. Temesgen, T.; Han, M. Advancing Aerobic Digestion Efficiency Using Ultrafine Bubbles in Wastewater Treatment. J. Water Process Eng. 2023, 55, 104072. [Google Scholar] [CrossRef]
  26. Bai, M.; Liu, Z.; Liu, Z.; He, C.; Fan, Z.; Yuan, M. Effect of Surfactant Frequently Used in Soil Flushing on Oxygen Mass Transfer in Micro-Nano-Bubble Aeration System. Chin. J. Chem. Eng. 2024, 67, 174–181. [Google Scholar] [CrossRef]
  27. Koshoridze, S.I. On factors affecting the stability of nanobubbles. Nanosci. Technol. Int. J. 2025, 16, 79–85. [Google Scholar] [CrossRef]
  28. Zhou, L.; Wang, S.; Zhang, L.; Hu, J. Generation and Stability of Bulk Nanobubbles: A Review and Perspective. Curr. Opin. Colloid Interface Sci. 2021, 53, 101439. [Google Scholar] [CrossRef]
  29. Lasek, L.; Krzywanski, J.; Skrobek, D.; Zylka, A.; Nowak, W. Review of Micro- and Nanobubble Technologies: Advancements in Theory and Applications and Perspectives on Adsorption Cooling and Desalination Systems. Energies 2023, 16, 8078. [Google Scholar] [CrossRef]
  30. Yasuda, K. Characteristics of Ultrafine Bubbles (Bulk Nanobubbles) and Their Application to Particle-Related Technology. KONA Powder Part. J. 2024, 41, 2024004. [Google Scholar] [CrossRef]
  31. Montazeri, S.M.; Kalogerakis, N.; Kolliopoulos, G. Effect of Chemical Species and Temperature on the Stability of Air Nanobubbles. Sci. Rep. 2023, 13, 16716. [Google Scholar] [CrossRef] [PubMed]
  32. Farid, M.U.; Kharraz, J.A.; Lee, C.-H.; Fang, J.K.-H.; St-Hilaire, S.; An, A.K. Nanobubble-Assisted Scaling Inhibition in Membrane Distillation for the Treatment of High-Salinity Brine. Water Res. 2022, 209, 117954. [Google Scholar] [CrossRef]
  33. Jiang, P.; Stenstrom, M.K. Oxygen Transfer Parameter Estimation: Impact of Methodology. J. Environ. Eng. 2012, 138, 137–142. [Google Scholar] [CrossRef]
  34. Mines, R.O. Oxygen Transfer Parameters and Oxygen Uptake Rates Revisited. J. Environ. Sci. Health Part A 2020, 55, 345–353. [Google Scholar] [CrossRef] [PubMed]
  35. Rochoux, M.; Guo, Y.; Schuurman, Y.; Farrusseng, D. Determination of Oxygen Adsorption–Desorption Rates and Diffusion Rate Coefficients in Perovskites at Different Oxygen Partial Pressures by a Microkinetic Approach. Phys. Chem. Chem. Phys. 2015, 17, 1469–1481. [Google Scholar] [CrossRef]
  36. Ding, S.; Xing, Y.; Zheng, X.; Zhang, Y.; Cao, Y.; Gui, X. New Insights into the Role of Surface Nanobubbles in Bubble-Particle Detachment. Langmuir 2020, 36, 4339–4346. [Google Scholar] [CrossRef] [PubMed]
  37. Michailidi, E.D.; Bomis, G.; Varoutoglou, A.; Kyzas, G.Z.; Mitrikas, G.; Mitropoulos, A.C.; Efthimiadou, E.K.; Favvas, E.P. Bulk Nanobubbles: Production and Investigation of Their Formation/Stability Mechanism. J. Colloid Interface Sci. 2020, 564, 371–380. [Google Scholar] [CrossRef] [PubMed]
  38. Linek, V.; Vacek, V. Chemical engineering use of catalyzed sulfite oxidation kinetics for the determination of mass transfer characteristics of gas—Liquid contactor. Chem. Eng. Sci. 1981, 36, 1747–1768. [Google Scholar] [CrossRef]
  39. Hoffstadt, K.; Cheenakula, D.; Nikolausz, M.; Krafft, S.; Harms, H.; Kuperjans, I. Design and Construction of a New Reactor for Flexible Biomethanation of Hydrogen. Fermentation 2023, 9, 774. [Google Scholar] [CrossRef]
  40. Garcia-Ochoa, F.; Gomez, E. Bioreactor Scale-up and Oxygen Transfer Rate in Microbial Processes: An Overview. Biotechnol. Adv. 2009, 27, 153–176. [Google Scholar] [CrossRef] [PubMed]
  41. Xing, W.; Yin, M.; Lv, Q.; Hu, Y.; Liu, C.; Zhang, J. Oxygen Solubility, Diffusion Coefficient, and Solution Viscosity. In Rotating Electrode Methods and Oxygen Reduction Electrocatalysts; Elsevier: Amsterdam, The Netherlands, 2014; pp. 1–31. [Google Scholar]
  42. Li, T.; Cui, Z.; Sun, J.; Jiang, C.; Li, G. Generation of Bulk Nanobubbles by Self-Developed Venturi-Type Circulation Hydrodynamic Cavitation Device. Langmuir 2021, 37, 12952–12960. [Google Scholar] [CrossRef]
  43. Achour, S.H.; Sheng, K.; Lawal, T.; Okuno, R. Thermodynamic Modeling of Aqueous Nanobubble Dispersion. In Proceedings of the SPE Annual Technical Conference and Exhibition, The Woodlands, TX, USA, 31 January–2 February 2023; SPE: Kuala Lumpur, Malaysia, 2023. [Google Scholar]
  44. Li, M.; Gao, Y.; Ma, X.; Chen, C.; Wang, B.; Sun, C. How Bulk Nanobubbles Respond to Elevated External Pressures. Phys. Fluids 2024, 36, 092003. [Google Scholar] [CrossRef]
  45. Akshit, F.N.U.; Mao, T.; Mohan, M.S. Future Perspective of Nanobubble Technology in Dairy Processing Applications. Trends Food Sci. Technol. 2024, 147, 104420. [Google Scholar] [CrossRef]
  46. Sjogreen, C.A.; Landínez Téllez, D.A.; Rosas Pérez, J.E.; Plazas Hurtado, P.C.; Roa-Rojas, J. Experimental Study of Nanobubbles in Salt Solutions. Rev. Acad. Colomb. Cienc. Exactas Fis. Nat. 2018, 42, 41. [Google Scholar] [CrossRef]
  47. Prakash, R.; Lee, J.; Moon, Y.; Pradhan, D.; Kim, S.-H.; Lee, H.-Y.; Lee, J. Experimental Investigation of Cavitation Bulk Nanobubbles Characteristics: Effects of PH and Surface-Active Agents. Langmuir 2023, 39, 1968–1986. [Google Scholar] [CrossRef] [PubMed]
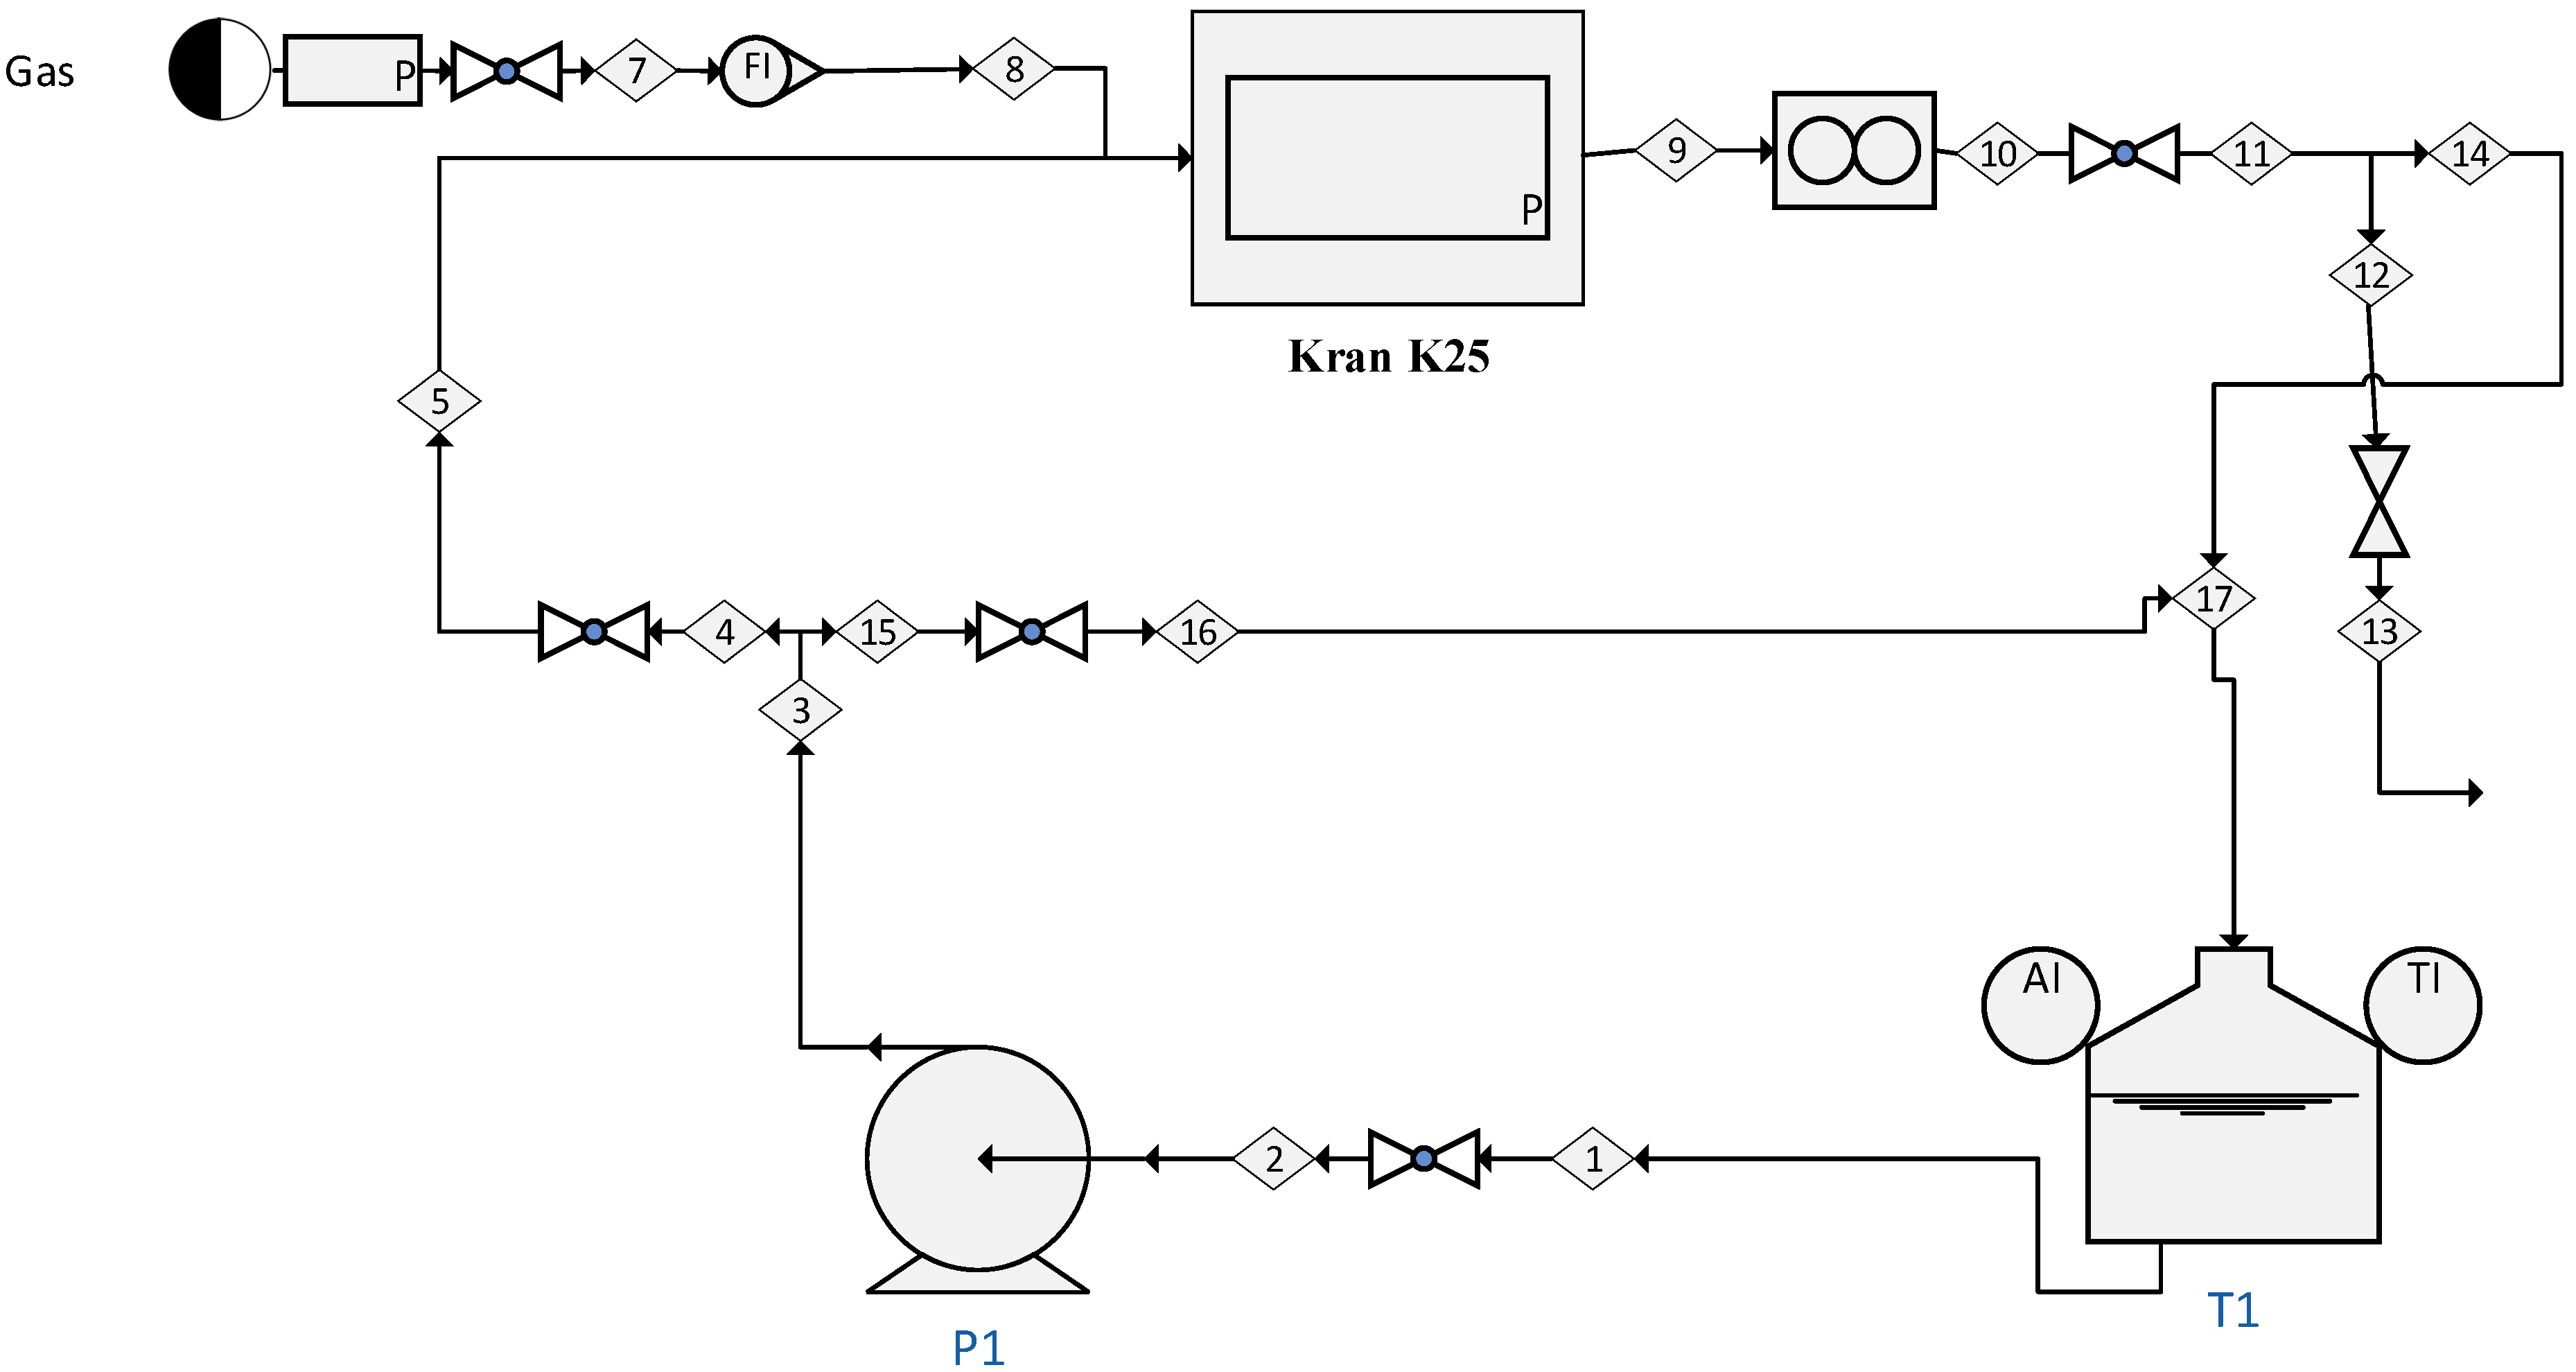
Figure 1. General diagram of the NB generation system. Pump (P1), NB generator (Kran K25), storage vessel (T1), DO analyzer (AI).
Water 17 00130 g001
Figure 2. Temperature and DO profiles for air injection experiments. (a) Temperature profile and (b) DO profile. In both cases, () is the data when deoxygenating agents are not used and () represents data when using deoxygenating agents.
Water 17 00130 g002
Figure 3. Temperature and DO profiles for absorption experiments with oxygen injection. (a) Temperature profile and (b) DO profile. In both cases, () is the data when deoxygenating agents are not used and () represents data when using deoxygenating agents.
Water 17 00130 g003
Figure 4. Temperature and DO profiles for desorption experiments by injecting air. (a) Temperature profile and (b) DO profile. In both cases, () represents data when deoxygenating agents are not used and () represents data when using deoxygenating agents.
Water 17 00130 g004
Figure 5. Temperature and DO profiles for desorption experiments with oxygen injection. (a) Temperature profile and (b) DO profile. In both cases, () is the data when deoxygenating agents are not used and () represents data when using deoxygenating agents.
Water 17 00130 g005
Figure 6. Temperature and DO profiles for desorption experiments in a 30 L vessel. (a) Temperature profile and (b) DO profile. In both cases, () represents data when air was injected and () represents data when oxygen was injected.
Water 17 00130 g006
Table 1. Resume of some applications of nanobubbles.
IndustryApplicationKey BenefitsProperties InvolvedReferences
Water treatmentElimination of organic matter, removal of microplastics, and disinfection of bacteria.Increase in COD removal by up to 85%, elimination of microplastics (<10 µm), and total disinfection of E. coli.High stability, increased DO, antimicrobial.[1,2,3]
AquacultureOxygenation in tanks and ponds.Improves dissolved oxygen levels, optimizing fish health and growth.High surface area-volume ratio, long-term stability.[5,6]
BiotechnologyImprovement in bioreactors and fermentation.Increase in kLa, optimizing the production processes of biomolecules and secondary metabolites.Increased DO, resistance to coalescence.[7,8]
Environmental remediationDetoxification of contaminated soils.Improving the efficiency of soil washing processes, reducing heavy metal contamination.Electrostatic interactions, ph-dependent charge.[9,10]
Membrane distillationReduction in membrane fouling.Decreased fouling, reduced drop flow by 63%, and increased operating time.Negative surface charge, induced turbulence.[4]
AgricultureIncreasing irrigation efficiency.Improves the oxygenation of irrigation water, promoting the absorption of nutrients by plants.Prolonged suspension, unique interfacial properties.[11,12]
Industrial wastewater treatmentHeavy metal removal.Increase in the adsorption of heavy metals, improvement in flotation processes.High surface area, adsorption on activated carbon.[13,14]
Food industryWashing and disinfection of fruits and vegetables.Elimination of microorganisms and pesticides, preserving the quality of the final product.Antimicrobial properties, long-term stability.[15,16]
Chemical productionH2O2 electrogeneration.Increased gas transfer efficiency, improving H2O2 yield by up to 84%.Higher kLa, high gas transfer efficiency.[17]
Table 2. Regression and variance analyses for experiments.
Injected
Gas
Vessel Volume, LCurve TypeReagent PresenceTime Period, min kLa,
min−1
Determination Coefficient, R2p-ValuekLa20,
min−1
Air100AbsorptionNoNDNDNDNDND
Air100AbsorptionYes90–1350.040199.35%6.34·10−90.0393
Oxygen100AbsorptionNo60–1200.032295.34%8.47·10−70.0311
Oxygen100AbsorptionYes75–1200.054797.70%7.68·10−70.0546
Air100DesorptionNo0–600.031292.40%4.37·10−120.0265
Air100DesorptionYes0–600.043699.73%6.11·10−260.0395
Oxygen100DesorptionNo0–1200.032595.45%3.32·10−140.0276
Oxygen100DesorptionYes0–1200.036298.02%1.20·10−170.0330
Air30DesorptionNo0–450.042495.94%5.32·10−90.0333
Oxygen30DesorptionNo15–600.006775.14%2.89·10−50.0055
Disclaimer/Publisher’s Note: The statements, opinions and data contained in all publications are solely those of the individual author(s) and contributor(s) and not of MDPI and/or the editor(s). MDPI and/or the editor(s) disclaim responsibility for any injury to people or property resulting from any ideas, methods, instructions or products referred to in the content.