Article

A Comparative Analysis on the Vibrational Behavior of Two Low-Head Francis Turbine Units with Similar Design

1
Department of Energy and Power Engineering, Tsinghua University, Beijing 100084, China
2
Xinhua Hydropower Co., Ltd., Beijing 100704, China
*
Author to whom correspondence should be addressed.
Water 2025, 17(1), 113; https://doi.org/10.3390/w17010113
Submission received: 20 October 2024 / Revised: 9 December 2024 / Accepted: 24 December 2024 / Published: 3 January 2025
(This article belongs to the Special Issue Hydrodynamic Science Experiments and Simulations)

Abstract

:
With the requirement of flexible operation of hydraulic turbine units, Francis turbine units have to adjust their output into extended operating ranges in order to match the demand of the power grid, which leads to more off-design conditions. In off-design conditions, hydraulic excitation causes excessive stress, pressure pulsation, and vibration on the machines. Different designs of Francis turbines cause different hydraulic excitations and vibrational behaviors. To conduct better condition monitoring and fault prognosis, it is of paramount importance to understand the vibrational behavior of a machine. In order to reveal the influence factors of the vibration behavior of Francie turbine units, field tests have been conducted on two similar-designed Francis turbine units and vibration features have been compared in this research. The vibrational behavior of two Francis turbine units installed in the same power station is compared under extended operating condition. Field tests have been performed on the two researched units and the vibration has been compared using the spectrum analysis method. The vibration indicators are extracted from the test data and the variation rules have been compared. By comparing the vibration behavior of the two machines, the design and installation difference of the two machines have been analyzed. This research reveals the effects of different designs and installations of Francis turbines on the vibration performance of the prototype units. The obtained results give guidance to the designers and operators of Francis turbine units.

1. Introduction

According to the World Energy Outlook, in 2023, the global average surface temperature was already around 1.2 °C above pre-industrial levels, and greenhouse gas emissions have not yet peaked [1]. To deal with this scenario, efforts are being made worldwide to develop clean energy. Investment in clean energy has risen by 40% from 2020 to 2023. Most of this rise has been contributed by the solar photovoltaic and wind energy, which are more intermittent compared to traditional energy sources such as coal and nuclear power [2]. The intermittent nature of clean energy causes more instability in the power grid, which is detrimental to energy safety [3]. Among all types of energies, hydropower is still the largest power that can be adjusted in real time [4]. To deal with the higher fluctuation in power supply introduced by clean energy, hydro power plants must operate under a wider range of loads. In recent years, more hydraulic turbine units have been designed to be able to run in a full range instead of a 40–100% rated load [5]. However, for hydraulic turbine runners with a fixed rotational speed, the discharge can inevitably influence its operation stability because of the hydraulic phenomenon in the off-design conditions. The most common hydraulic phenomena are rotor-stator interaction [6,7], cavitation [8,9,10,11], blade vortex [12,13], vortex rope [14,15], etc. These phenomena introduce hydraulic excitations to the machine. Strong hydraulic excitation causes excessive vibration and stress [16]. Such vibrations not only affect the performance and lifespan of the machinery but can also cause mechanical failures and damages, which will induce significant economic losses to the power plant [17,18]. The vibration of hydropower units directly affects the safe operation, load distribution, and power supply quality of the units. Without sufficient control, this vibration will cause serious accidents.
Apart from hydraulic origin excitation, the other main sources of excitation of hydraulic turbines are mechanical origin and electromagnetic origin [19]. Francis turbine units contain hydraulic turbine, generator, shaft, runner, and auxiliary components, most of which are rotation machinery. The unbalance mass in rotation machinery causes vibrations, the frequency of which are related to rotation speed [20]. In addition to the vibration caused by mechanical sources or hydraulic sources, it is also necessary to consider the electromagnetic force acting on the generator part and the influence of the fluid dynamic pressure acting on the flow part of the turbine on the vibration of the system and other components [21]. The frequencies of mechanical and electromagnetic origin vibration are all related to the rotation speed of the shaft, while the frequencies of hydraulic excitations often have wide bands. This is because of the vortices induced by the hydraulic phenomena. When the natural frequencies are coordinated with the frequency bands, the vibration amplitude will increase significantly because of resonance [22]. When the unit is in operation, the three parts (fluid, machinery, and electromagnetic) influence each other [23]. For example, when the water flow excites the vibration of the rotating part of the unit, the air gap between the rotor and the stator of the generator will be asymmetric [24], and the magnetic pull generated will also aggravate or dampen the vibration of the rotating part of the unit. Conversely, certain changes in the motion state of the rotating part will inevitably affect the water flow field of the turbine and the magnetic field of the generator [25]. Therefore, the vibration of hydro-turbine units is coupled with the vibration of the electrical, mechanical, and fluid parts. It is complicated to study the vibration of the system completely due to the coupled relationship of these three factors. Given the complexity of the problem, it is currently difficult to establish a mathematical model that can be used for analysis and calculation, and it is also not easy to consider the mutual influence of the above three factors in the experiment at the same time. Therefore, it is necessary to understand the vibration behavior by means of field test and to reveal the factors that influence the behavior of the machine.
In the actual operation of the hydropower station turbine unit, the cause of vibration is often difficult to determine. Most of the time, vibrations and pressure pulsations from different resources are mixed together, which also adds difficulty to the work of tracing the cause, which is important for fault diagnosis of machines. For a long time, due to the lack of understanding of the vibration characteristics as well as the backward of detection and analysis methods, hydropower plants must conduct regular maintenance on the unit to ensure normal operation. This time-planned maintenance method brings unnecessary losses and waste to the power plants. With deeper understanding of stability and fault characteristics, as well as the development of sensors and signal detection and processing technology, it is possible to monitor the stability of the turbine and identify the fault characteristics. With the help of advanced testing and analysis technology, it is easier to determine the operating status of the unit and facilitate early diagnosis of the fault. This condition monitoring maintenance method, based on relevant information such as the unit condition and signs of abnormality, can correctly monitor the operation of the unit, prevent accidents in the incipient stage, and facilitate the creation of reasonable maintenance plans, thereby greatly improving the utilization rate of the unit. Gökhan Kahraman and Osman Özdemir discussed the causes of vibrations depending on unbalanced hydraulic forces in rotating and non-rotating components in hydraulic plants and created a new non-linear proportional order mathematical model for the fault diagnosis and prediction in hydropower plants [26]. Casanova has reported the fracture of the draft tube connecting bolts in a 95-MW Francis turbine at partial loads and performed stress measurements and fracture surface analysis [27]. Alexandre Presas tried to estimate the stress level of the runner and the remaining useful life of the key components by means of strain and vibration measurement [28,29]. Lei Zhu et al. researched the effective of different strategies on the suppression of pressure vibration in Francis turbine draft tube by means of computational fluid dynamics [30]. A. Agarwal and L. Mthembu investigated the application of the finite element method on the vibration analysis of Francis turbine units [31]. The previous work has revealed the relation between the excitation, structural response, and vibration of the structure. However, the vibration behavior of a prototype unit is still unclear. The installation influence on the vibration behavior of Francis turbine units needs to be researched further.
The influence of structural response and excitations on the behavior of the structure has been deeply examined in the previous studies. However, the structural response of prototype machines is influenced by the installation, which has not been researched in detail. In this research, the vibration behavior of two low-head Francis turbine units with similar design from the same power plant is analyzed and compared. In Section 2, field tests are conducted on the two machines and the vibration indicators are extracted from the measured signals. In Section 3, the vibration indicators are mapped in the whole operation range to form vibration behavior hill charts. The vibration characteristics of the two machines are compared. In Section 4, the main results are summarized and a discussion on the vibration behavior is presented. The main conclusions are presented in the last section. This research analyses the effect of design on the vibration characteristics of low-head Francis turbine units. The conclusions give guidance for the monitoring and diagnostics of hydraulic turbine units.

2. Field Test Design

2.1. Researched Turbine Units

The two researched low-head Francis turbine units are installed in the same power plant, so the main parameters of the two units are the same. The basic parameters of the two units are listed in Table 1. From the table, it can be seen that the rated head, number of blades and guide vanes, and rotating speed are exactly the same between the two researched units. The main difference between these two units lies in the design of the spiral casing and the process of the center hole of the shaft: Unit A has no special processing on the center hole of the shaft, while an extension tube is mounted on the center hole of the shaft of Unit B. The extension tube has the same diameter as the center hole of the runner. The thickness of the extension tube is 8 mm and the length of the tube is 2 m. Small holes have been drilled on the extension tube in order to uniformize the air injection from the extension tube to the draft tube. A sketch of the extension tube is shown in Figure 1. To reveal the effect of the different designs on the vibration behavior of the machine, field tests are conducted on both units.

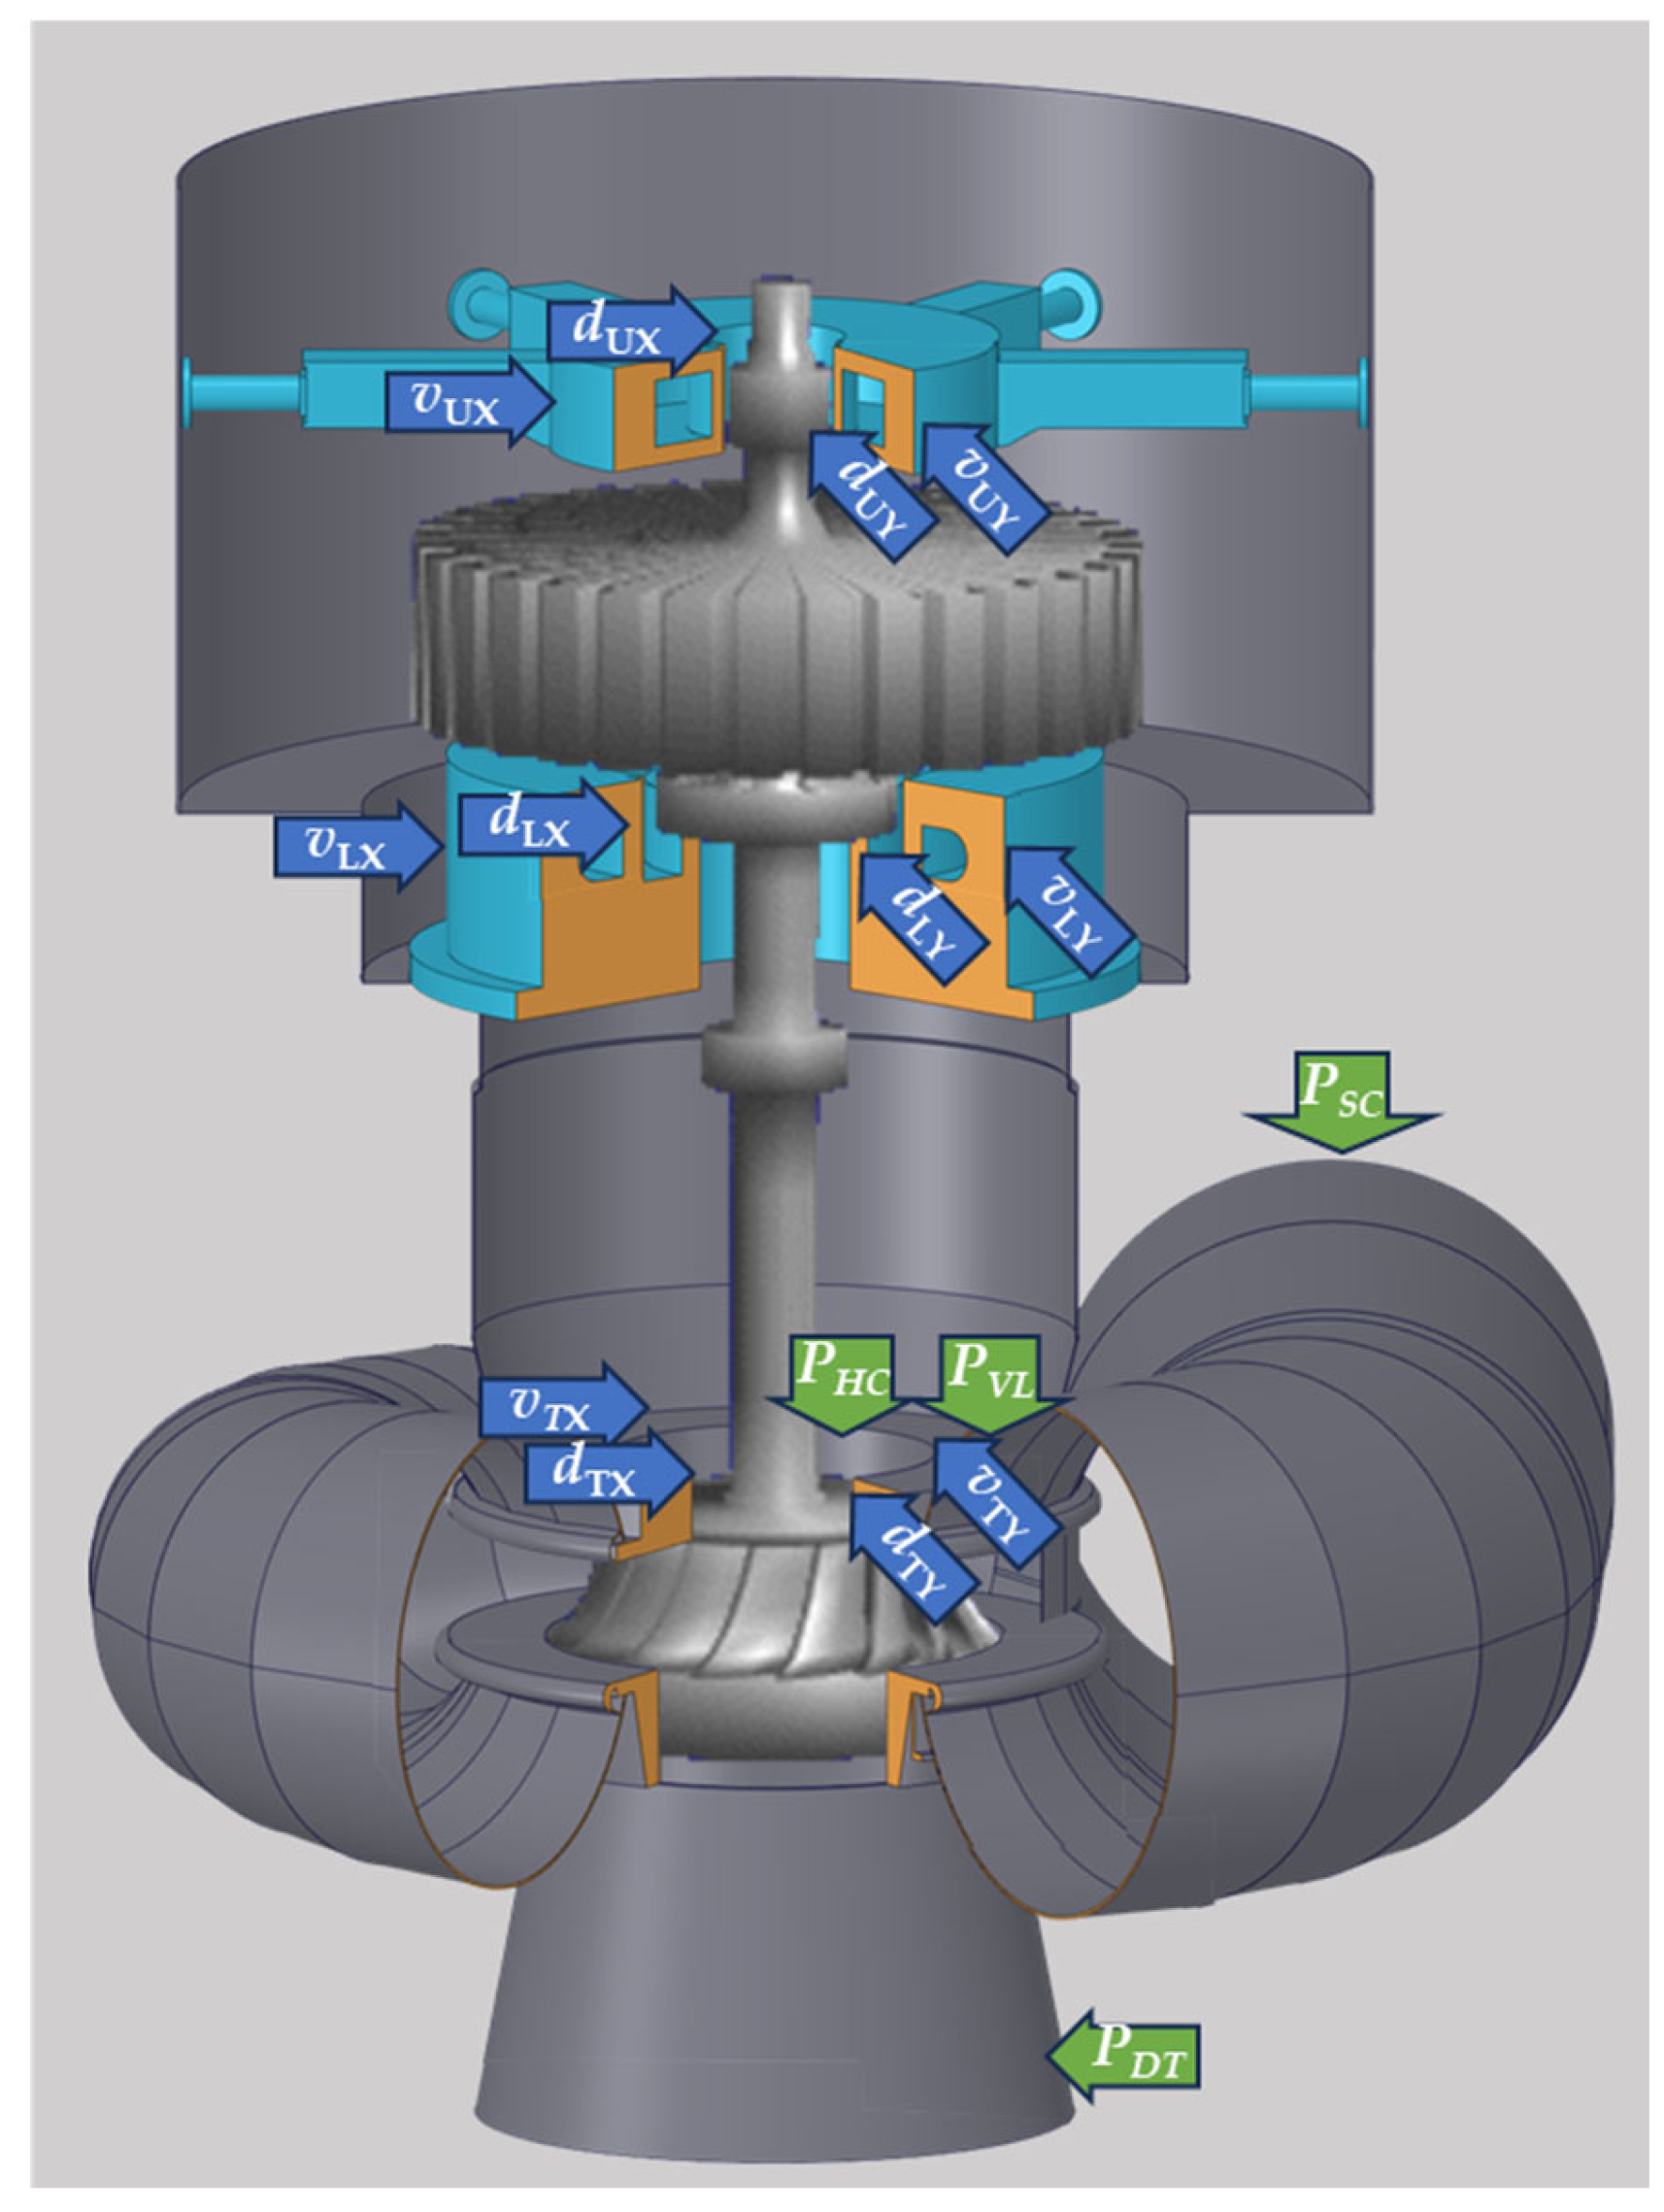
2.2. Measurement Setup

As shown in Figure 2, vibration sensors, proximity probes, and pressure transducers are used in the comparative test. The vibration sensors (marked by “v”) are installed in X and Y directions of upper (marked by “U”) and lower brackets (marked by “L”) and head cover (marked by “T”) to measure the absolute vibration of the stationary components. The proximity probes (marked by “d”) are installed on the upper generator bearing (marked by “U”), lower generator bearing (marked by “L”), and turbine bearing (marked by “T”) to measure the relative vibration between the stationary components and the shaft. The pressure sensors (marked by “p”) are installed on the spiral casing inlet, vaneless region (marked by “VL”), and draft tube inlet (marked by “DT”) of the unit. The sensors are connected to an A/D converter and the vibration and pressure data are saved in the computer. The sampling frequency is 4096 Hz. The two machines are tested under different outputs, ranging from speed-no-load condition (0 MW) to overload condition (49 MW). Measurement conditions (Figure 3) of ten outputs are selected between speed-no-load condition and overload condition. The tests are carried out under two different heads (55.8 m and 57.0 m). The output of the machines is decreased and then increased during the test to increase the measurement accuracy.

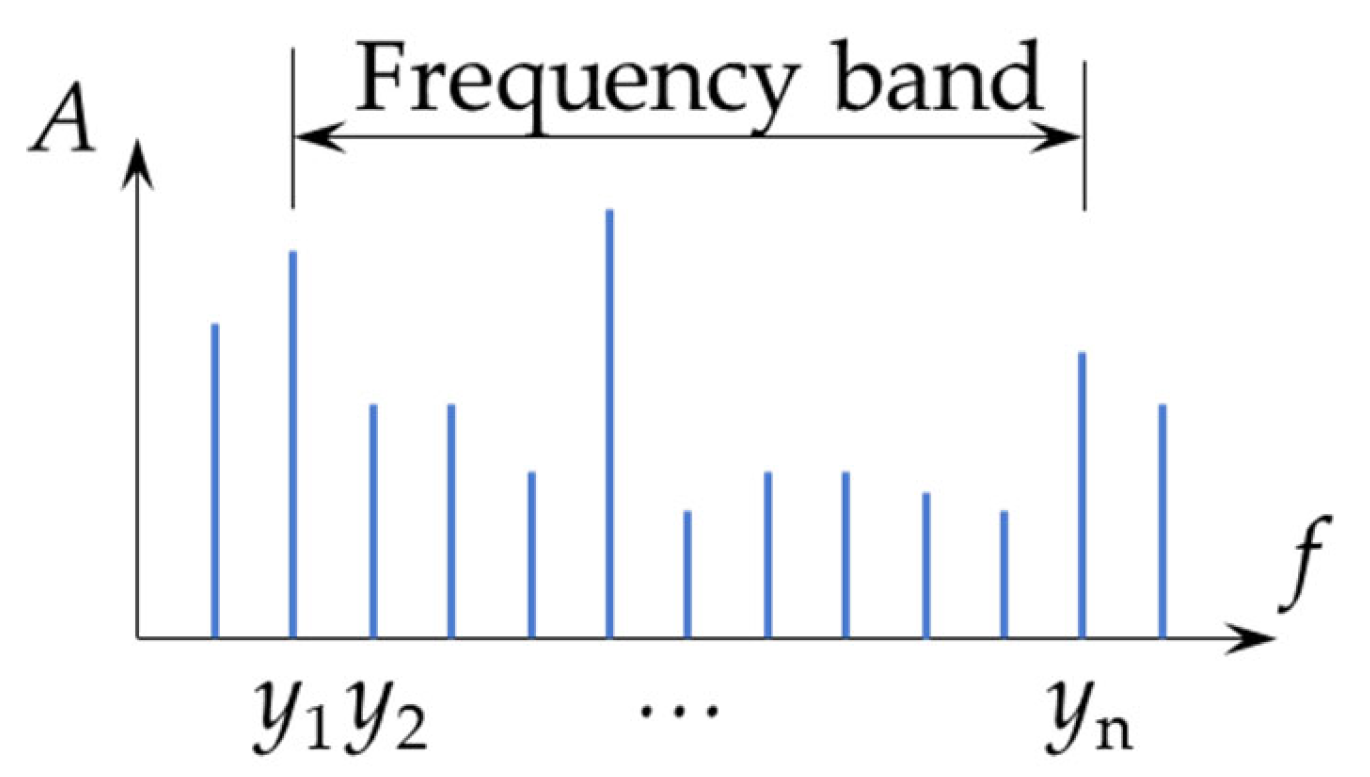
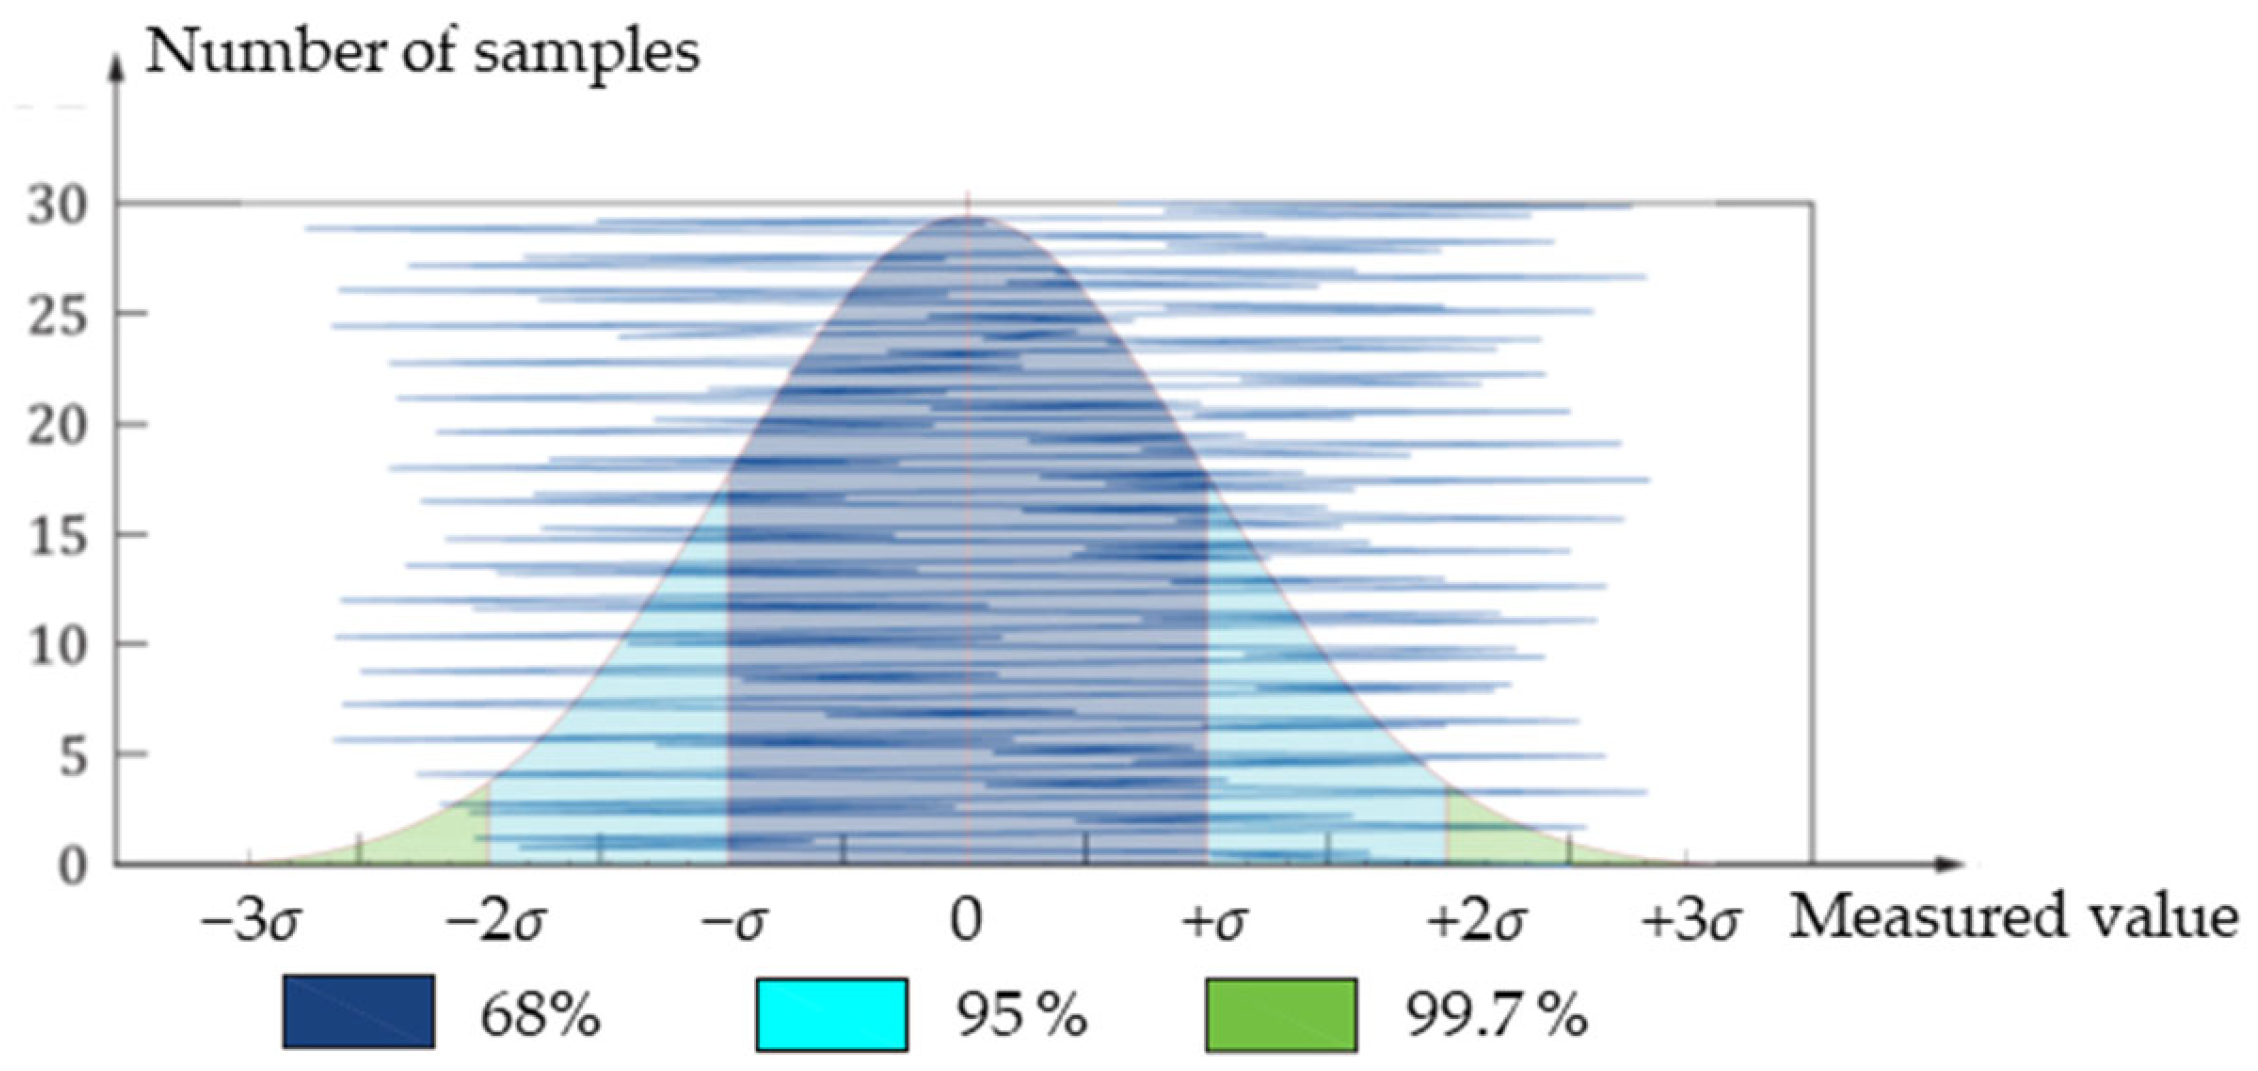
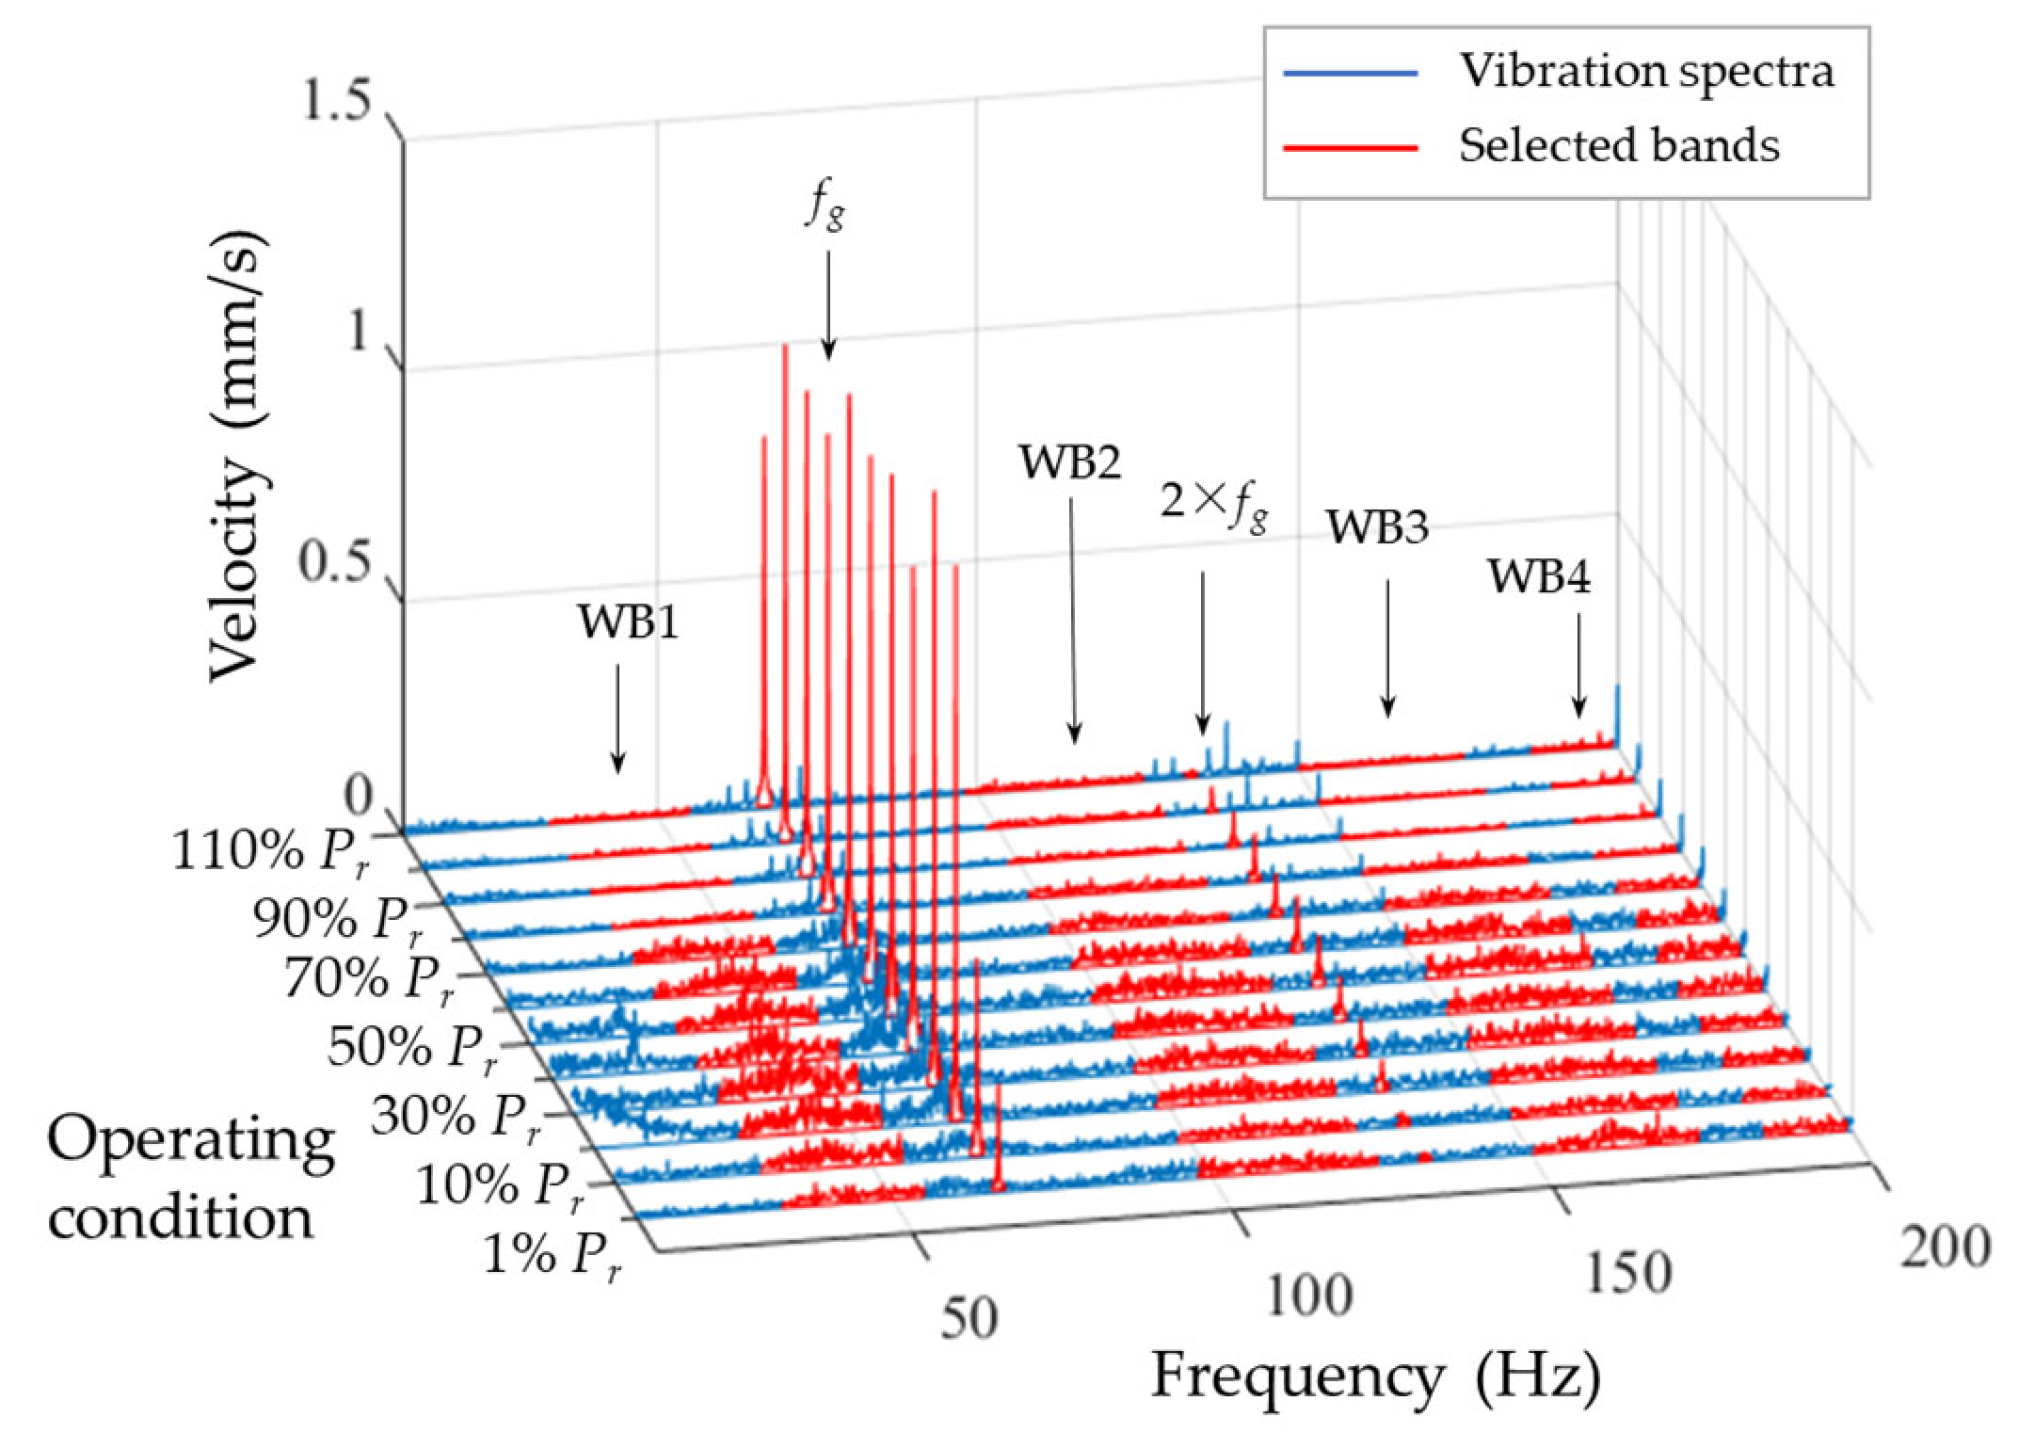
2.3. Signal Processing Methodology

Root-mean-square (RMS) value of frequency band level or peak-to-peak level are extracted as the vibration or pressure indicator depends on the type of signal. For the vibration signal, the RMS values of certain frequency bands are calculated. For displacement and pressure signals, the peak-to-peak level is calculated. The frequency band of vibration is selected between 1/3 rotation frequency (ff) and 3 times of blade passing frequency. For the researched turbine units, the rotation frequency is 2.78 Hz, so the frequency band range is 0.93 Hz to 108.36 Hz. The vibration signal wave is transferred to frequency domain. The band values between 0.93 Hz and 108.36 Hz are calculated by Equation (1):
V = 1 2 y i 2
where yi is the amplitudes of the lines in the range of the frequency band as shown in Figure 4. The obtained value represents the power of the calculated frequency band.
The peak-to-peak level of the displacement data measured by proximity probes and pressure data measured by pressure sensor are extracted as the shaft relative displacement dp-p and pressure pulsation Pp-p indicators, respectively. To reduce the impact of the extreme random values, a 95% confidence interval is used in the peak-to-peak value calculation. As shown in Figure 5, the 95% confidence interval is dependent on the standard deviation multiplying factor of ±2 σ, which is the standard deviation of the recorded signal. dX and dY represent the range of the shaft axis displacement on X and Y directions, respectively. Pp-p represents the amplitude of the pressure pulsation.

3. Machine Behavior Comparison

3.1. Pressure and Pressure Pulsation Comparison

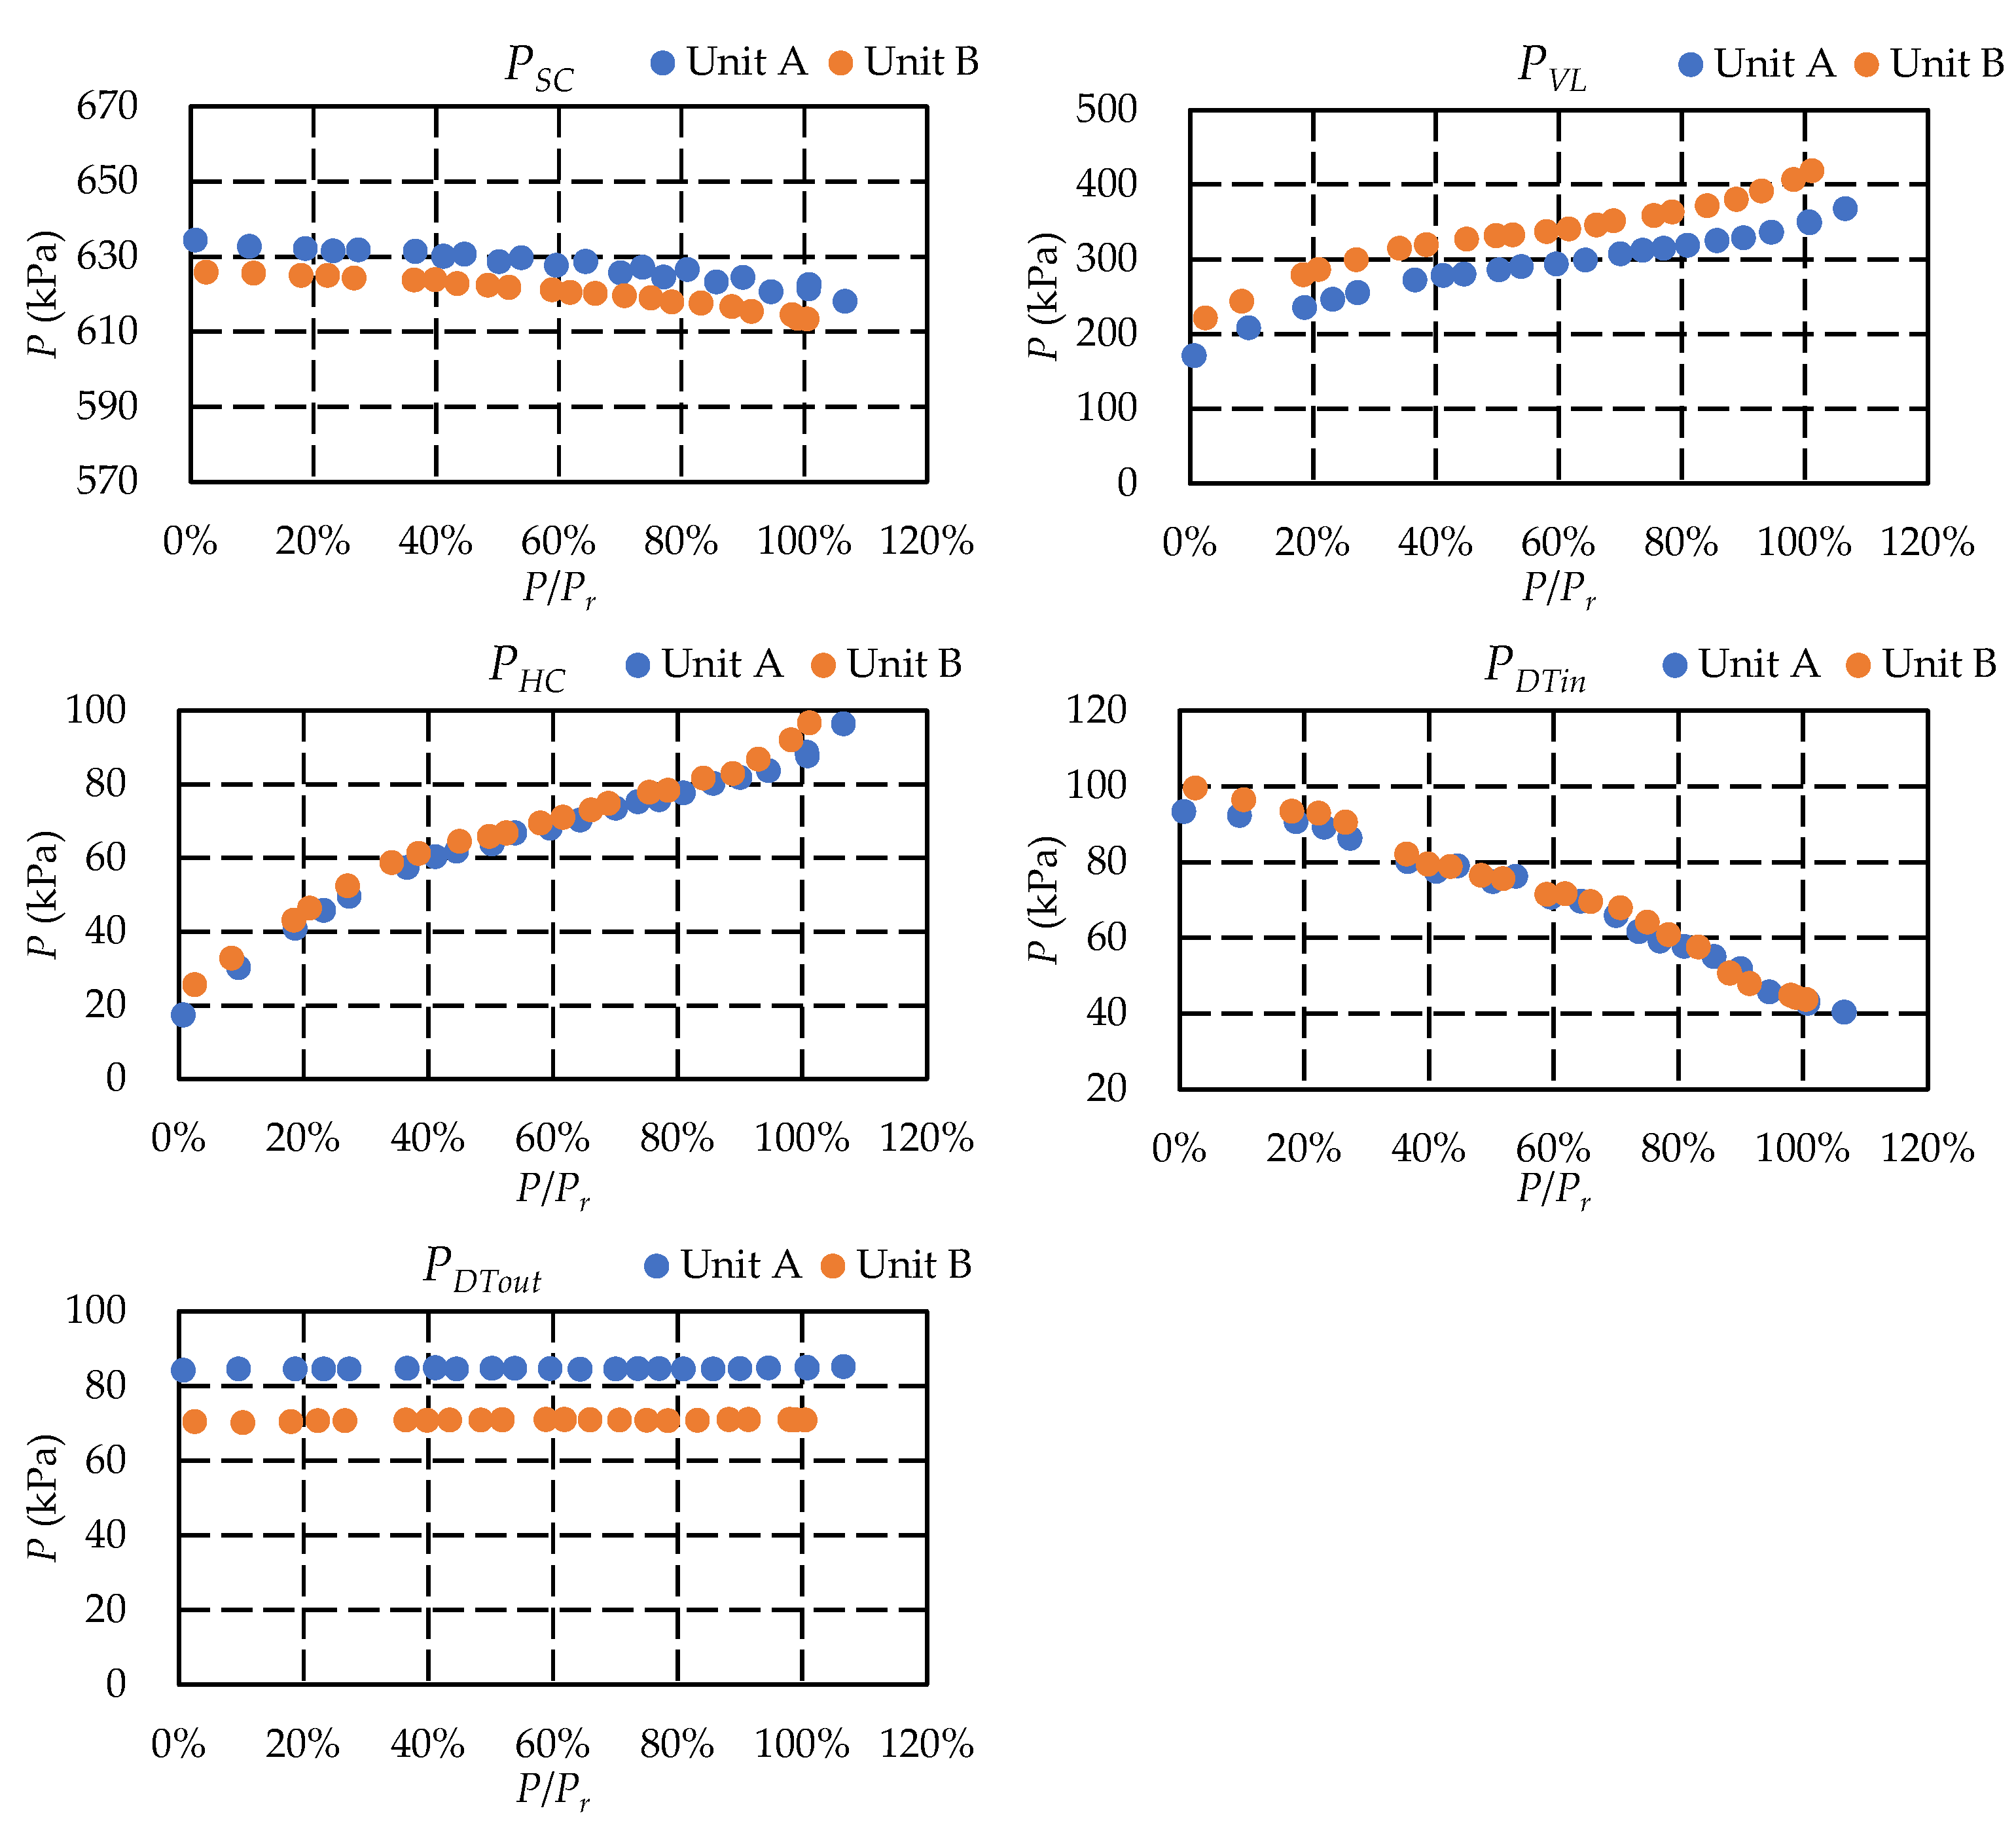
3.1.1. Pressure Comparison

The pressure has been measured on the end point of spiral casing, vaneless region, head cover, and entrance of the draft tube. The variation of the pressure with different loads in Unit A and Unit B is displayed in Figure 6 and Figure 7. Figure 6 mainly shows the comparison among different measurement points while Figure 7 compares the difference between Unit A and Unit B. From Figure 6, it can be seen that the variation trends of the pressures are the same between the two units. The space distribution of the pressure level within the machine is determined according to the location of the measurement points: the pressure decreases from upstream to downstream. The pressure at the end point of the spiral casing almost equals the elevation difference between the upper reservoir and the measurement point and it changes little with the variation of discharge. The vaneless region is the location most sensitive to the load: the pressure in this location increases from 200 kPa to more than 400 kPa with the increase of output. The measurement points of head cover and draft tube are located in a low-pressure region, in which the pressure levels are much lower.
For all the figures in Figure 7, the range of the vertical coordinate axis has been set to 100 kPa (except the vaneless region, which has a much larger range) to compare the variation trend between different measurement points. Because Unit A and Unit B are tested separately, the level of upper reservoir of Unit A is 0.4 m higher than Unit B during the test. This difference causes higher pressure of Unit A in the end point of the spiral casing. It is worth noting that although the pressure of Unit A is higher than Unit B in the spiral casing, the pressure in the vaneless region is lower in Unit A. This is mainly caused by the different design of the spiral casing. The pressure level and variation trend of the head cover are the same between the two units. The location of the head cover pressure measurement point is between the gap and upper clearance seal. The pressure has been greatly decreased by the gap. For the pressure in the draft tube inlet, the pressure has been decreased by the runner. Both of the pressures in these two locations are in a low level. The pressure in the outlet of the draft tube equals the elevation difference between the lower reservoir and the measurement point. Similar than the PSC, the PDTout of Unit A is 12 kPa higher than Unit B. The same elevation difference has ensured the same head between these two units.

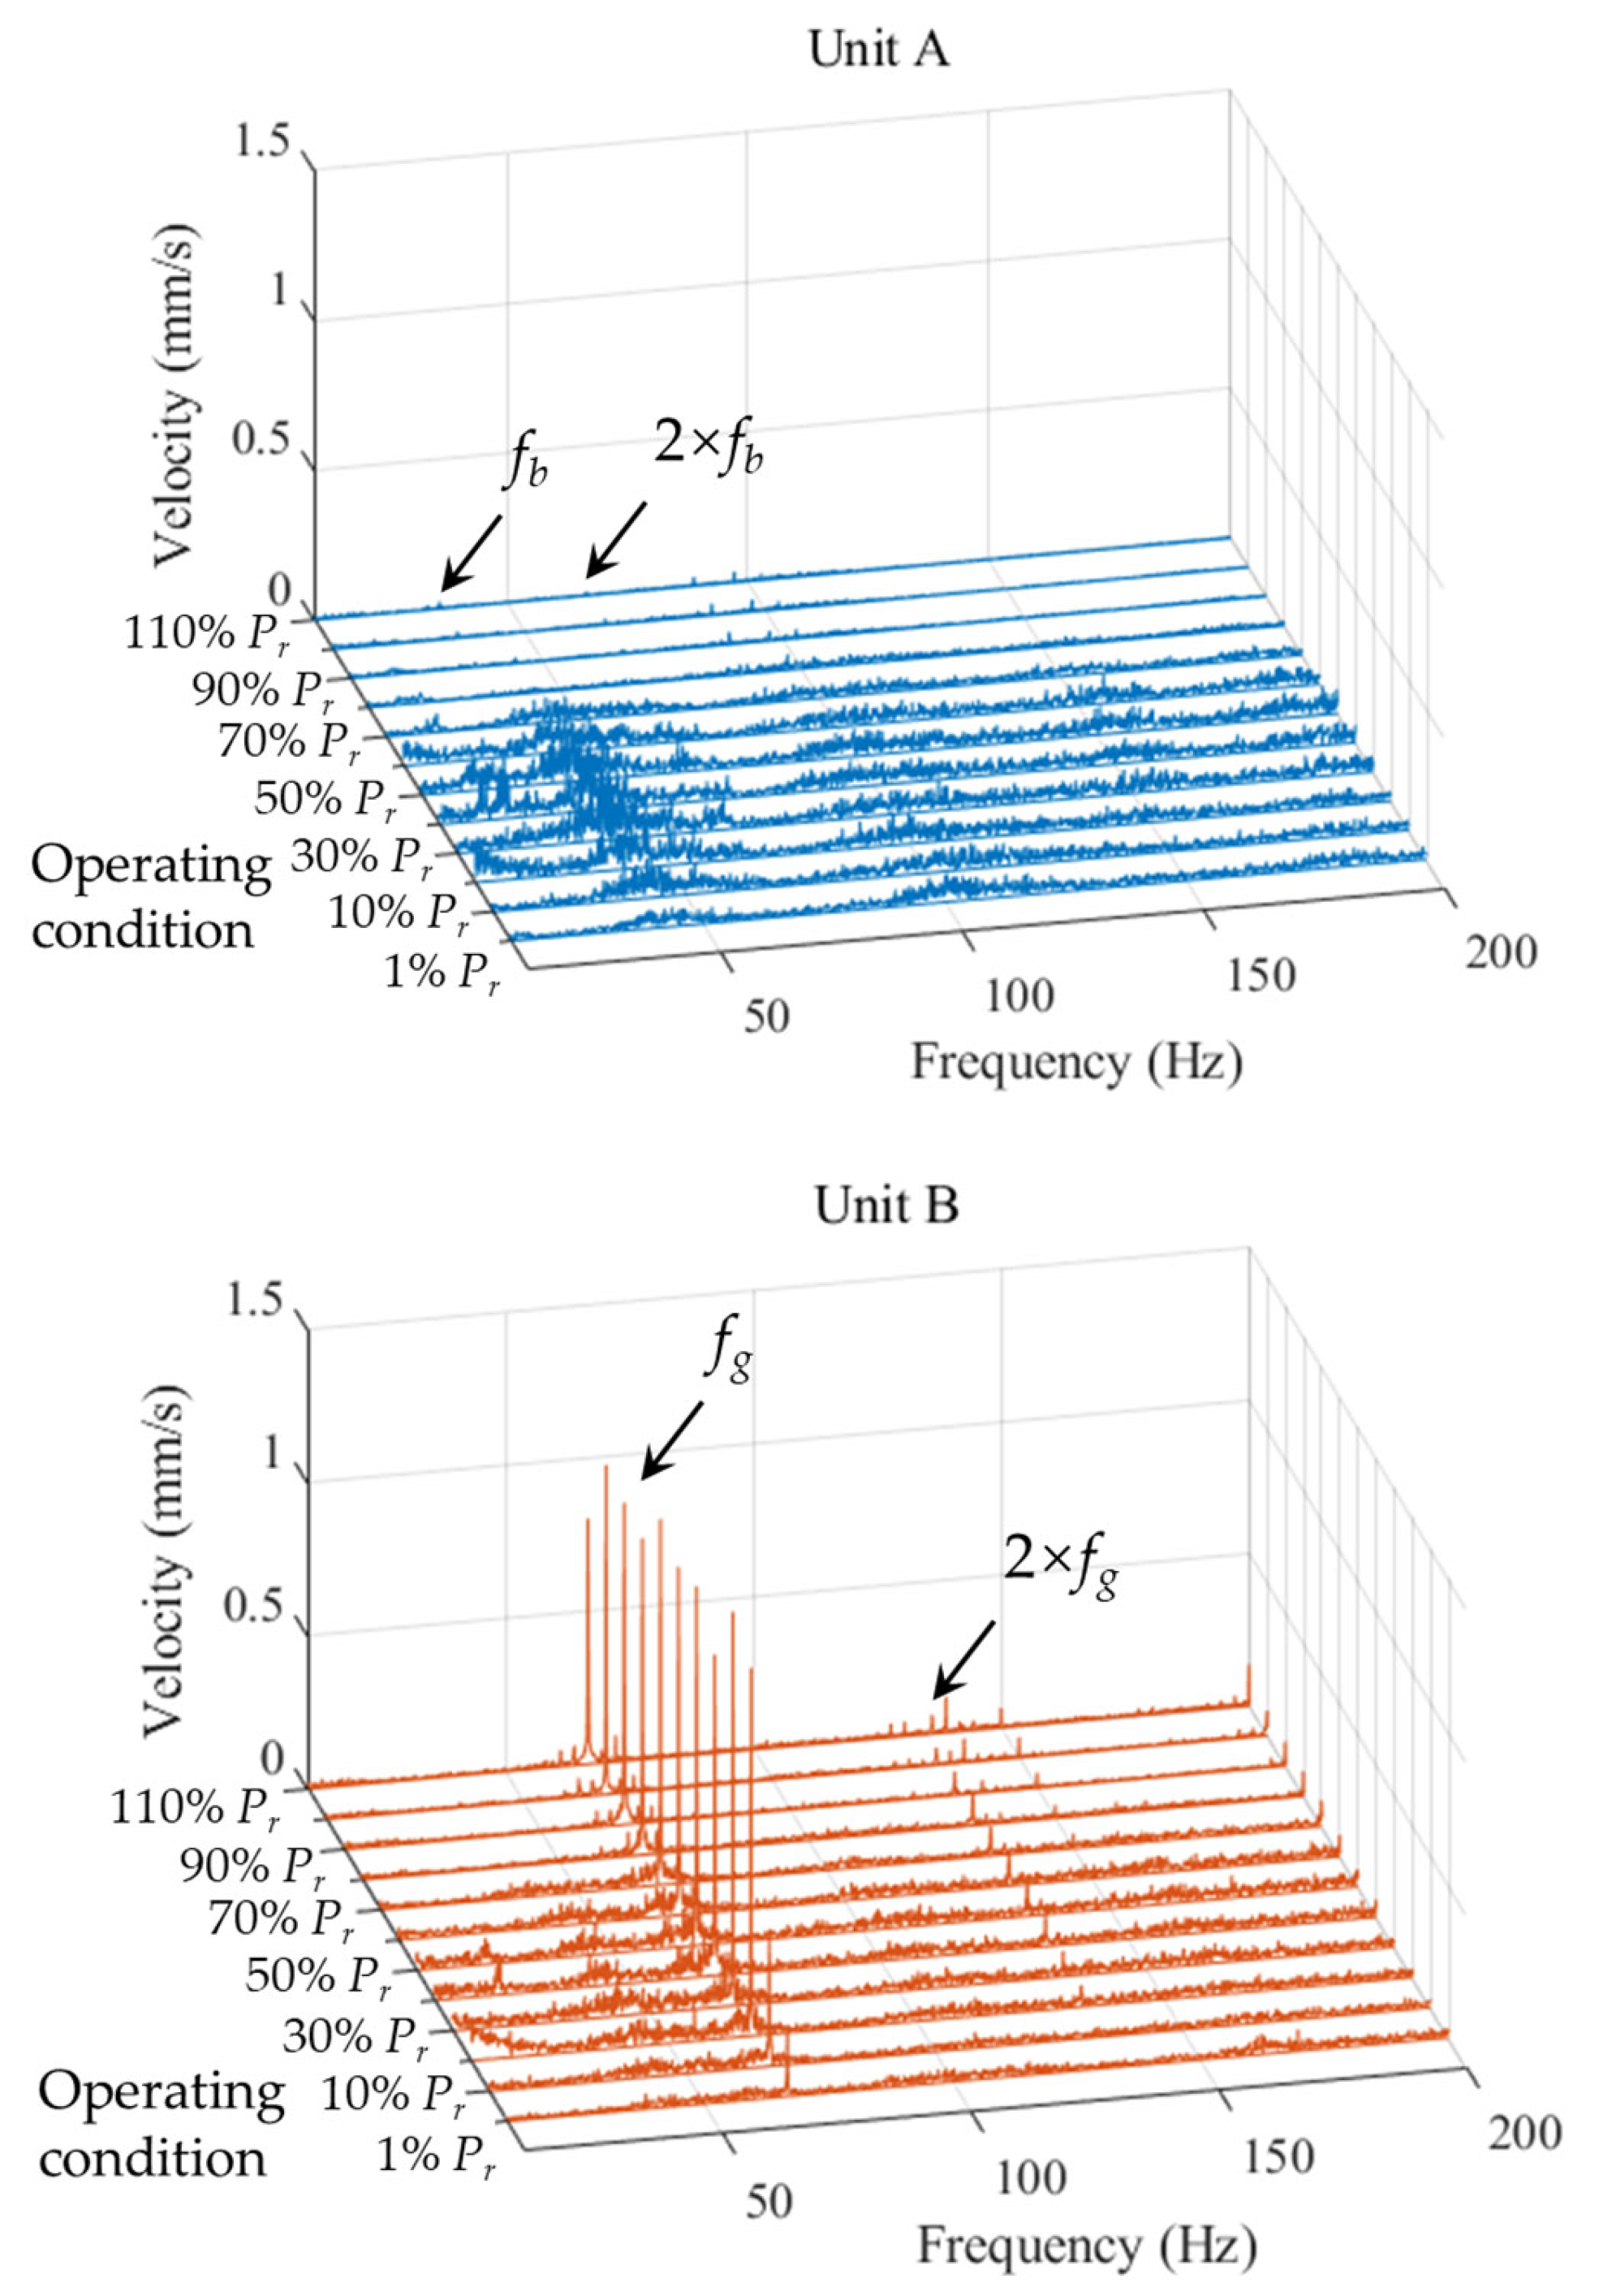
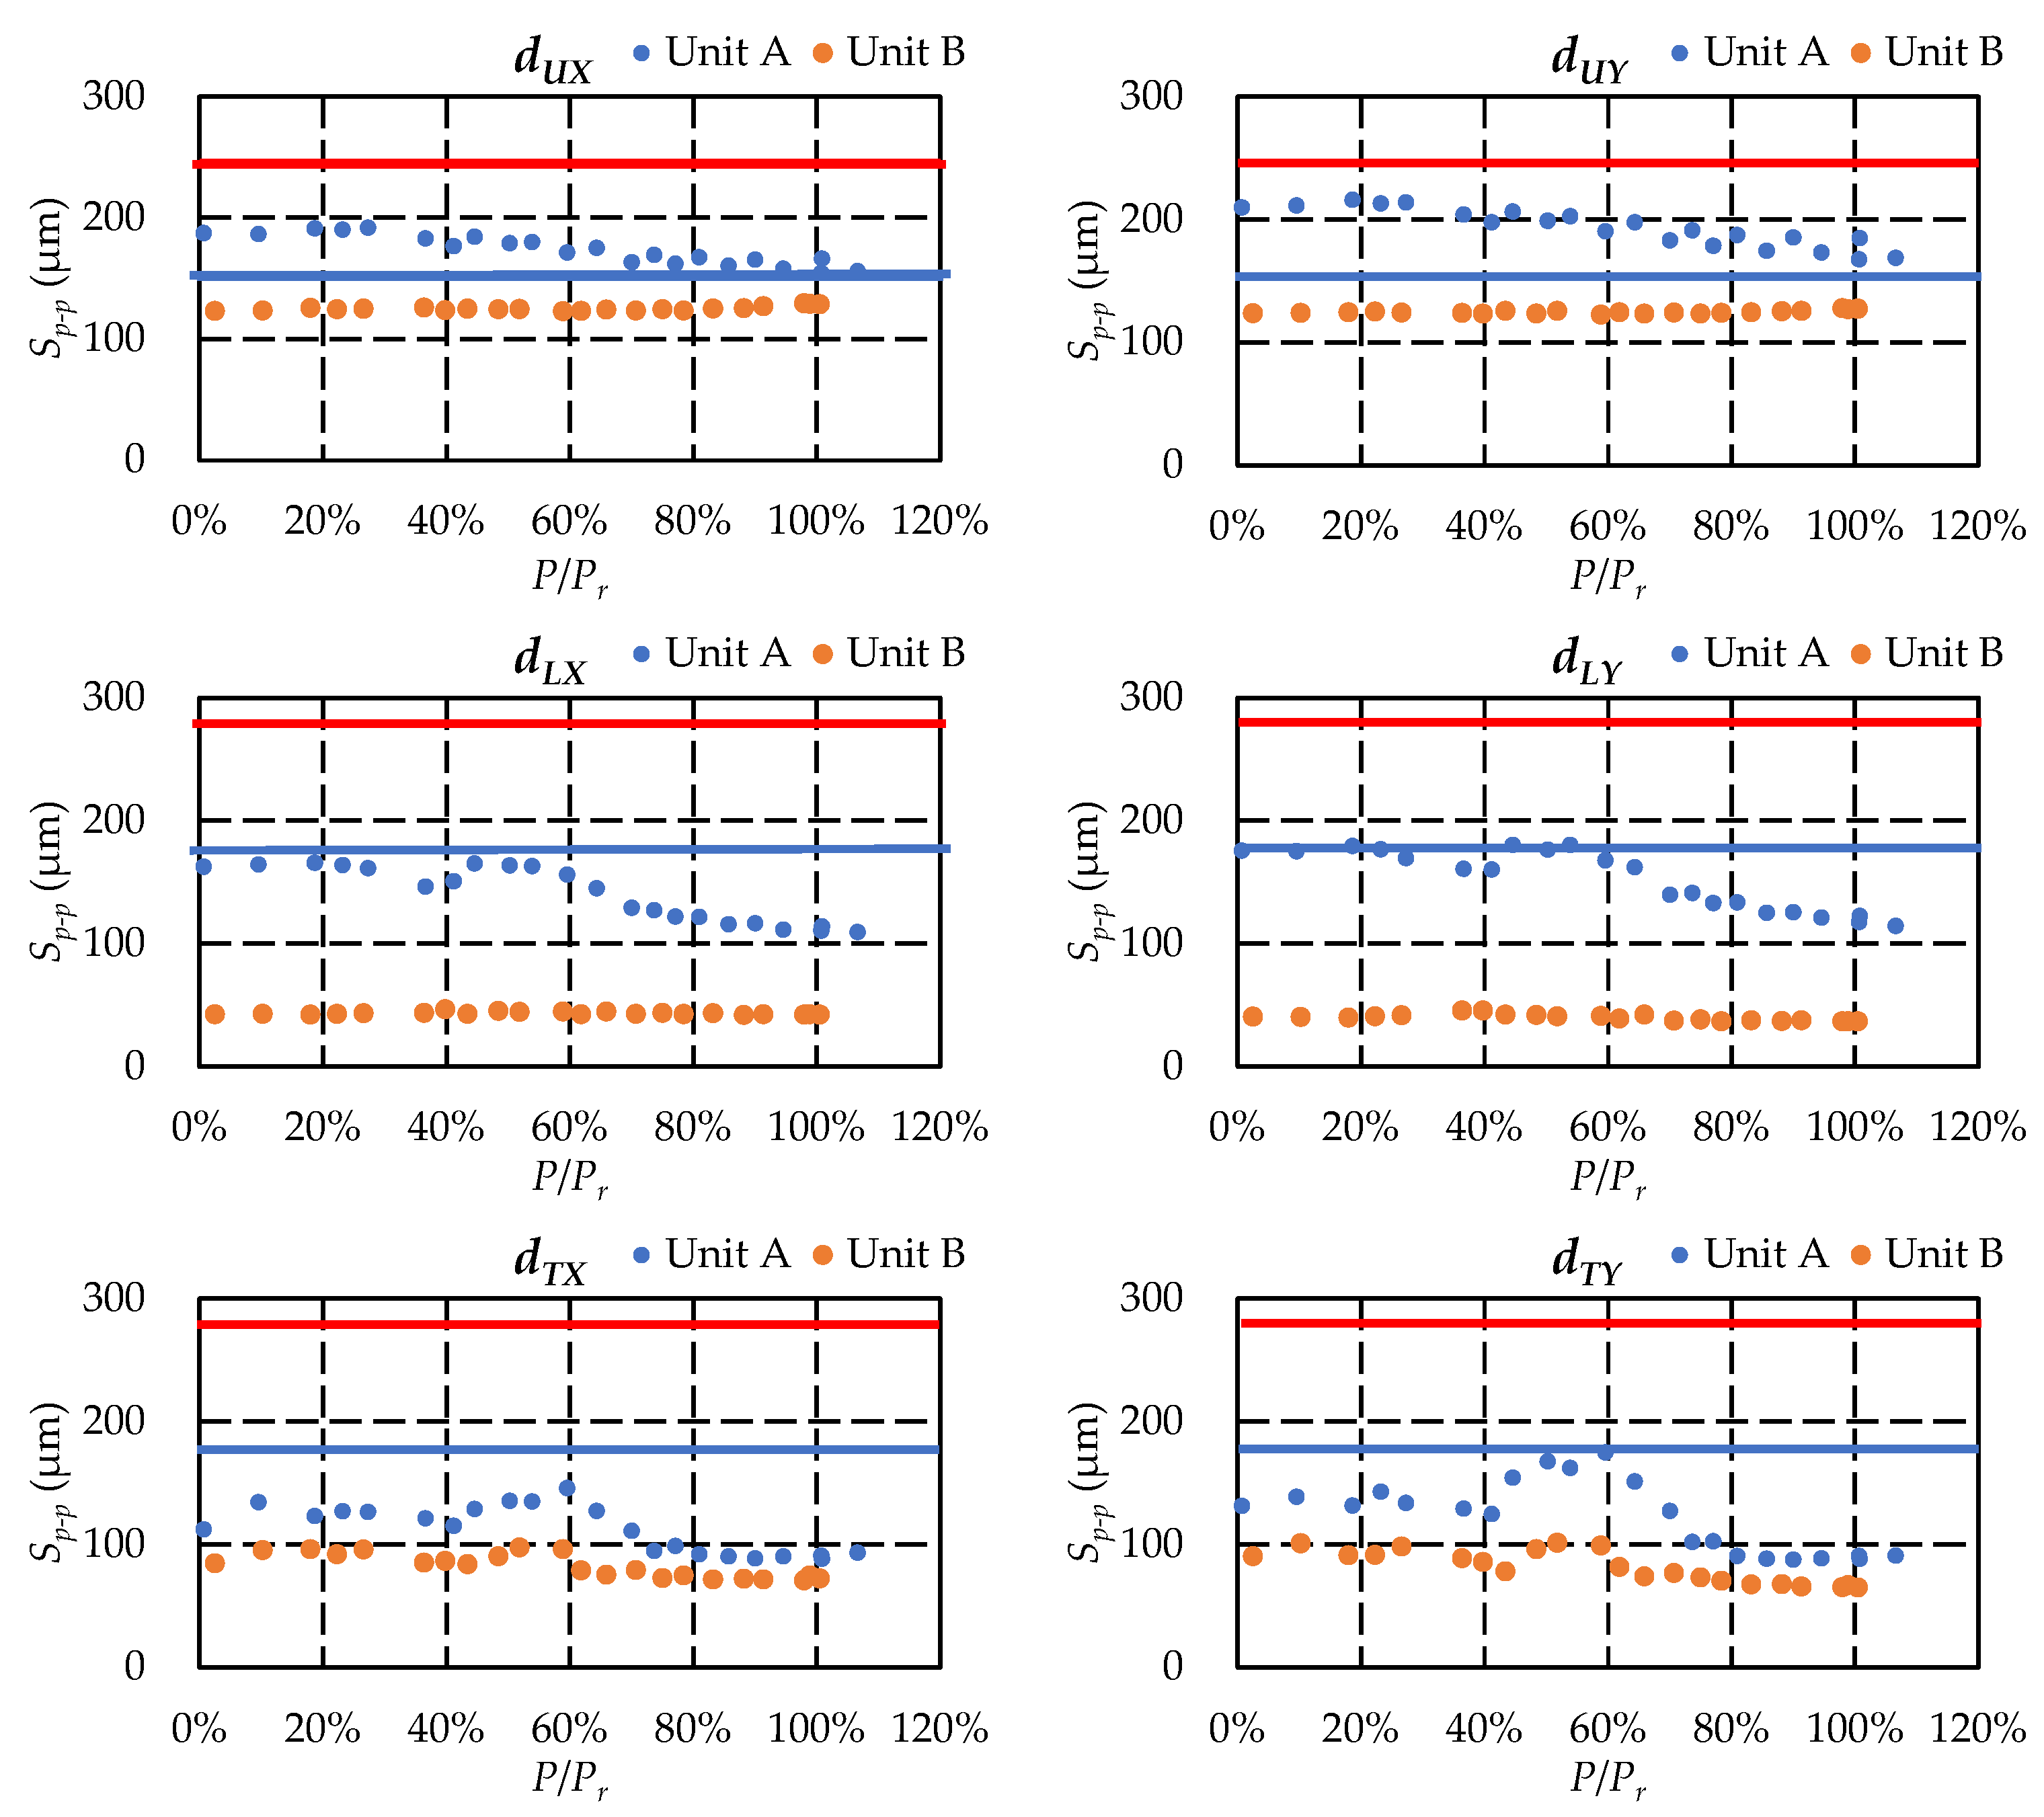
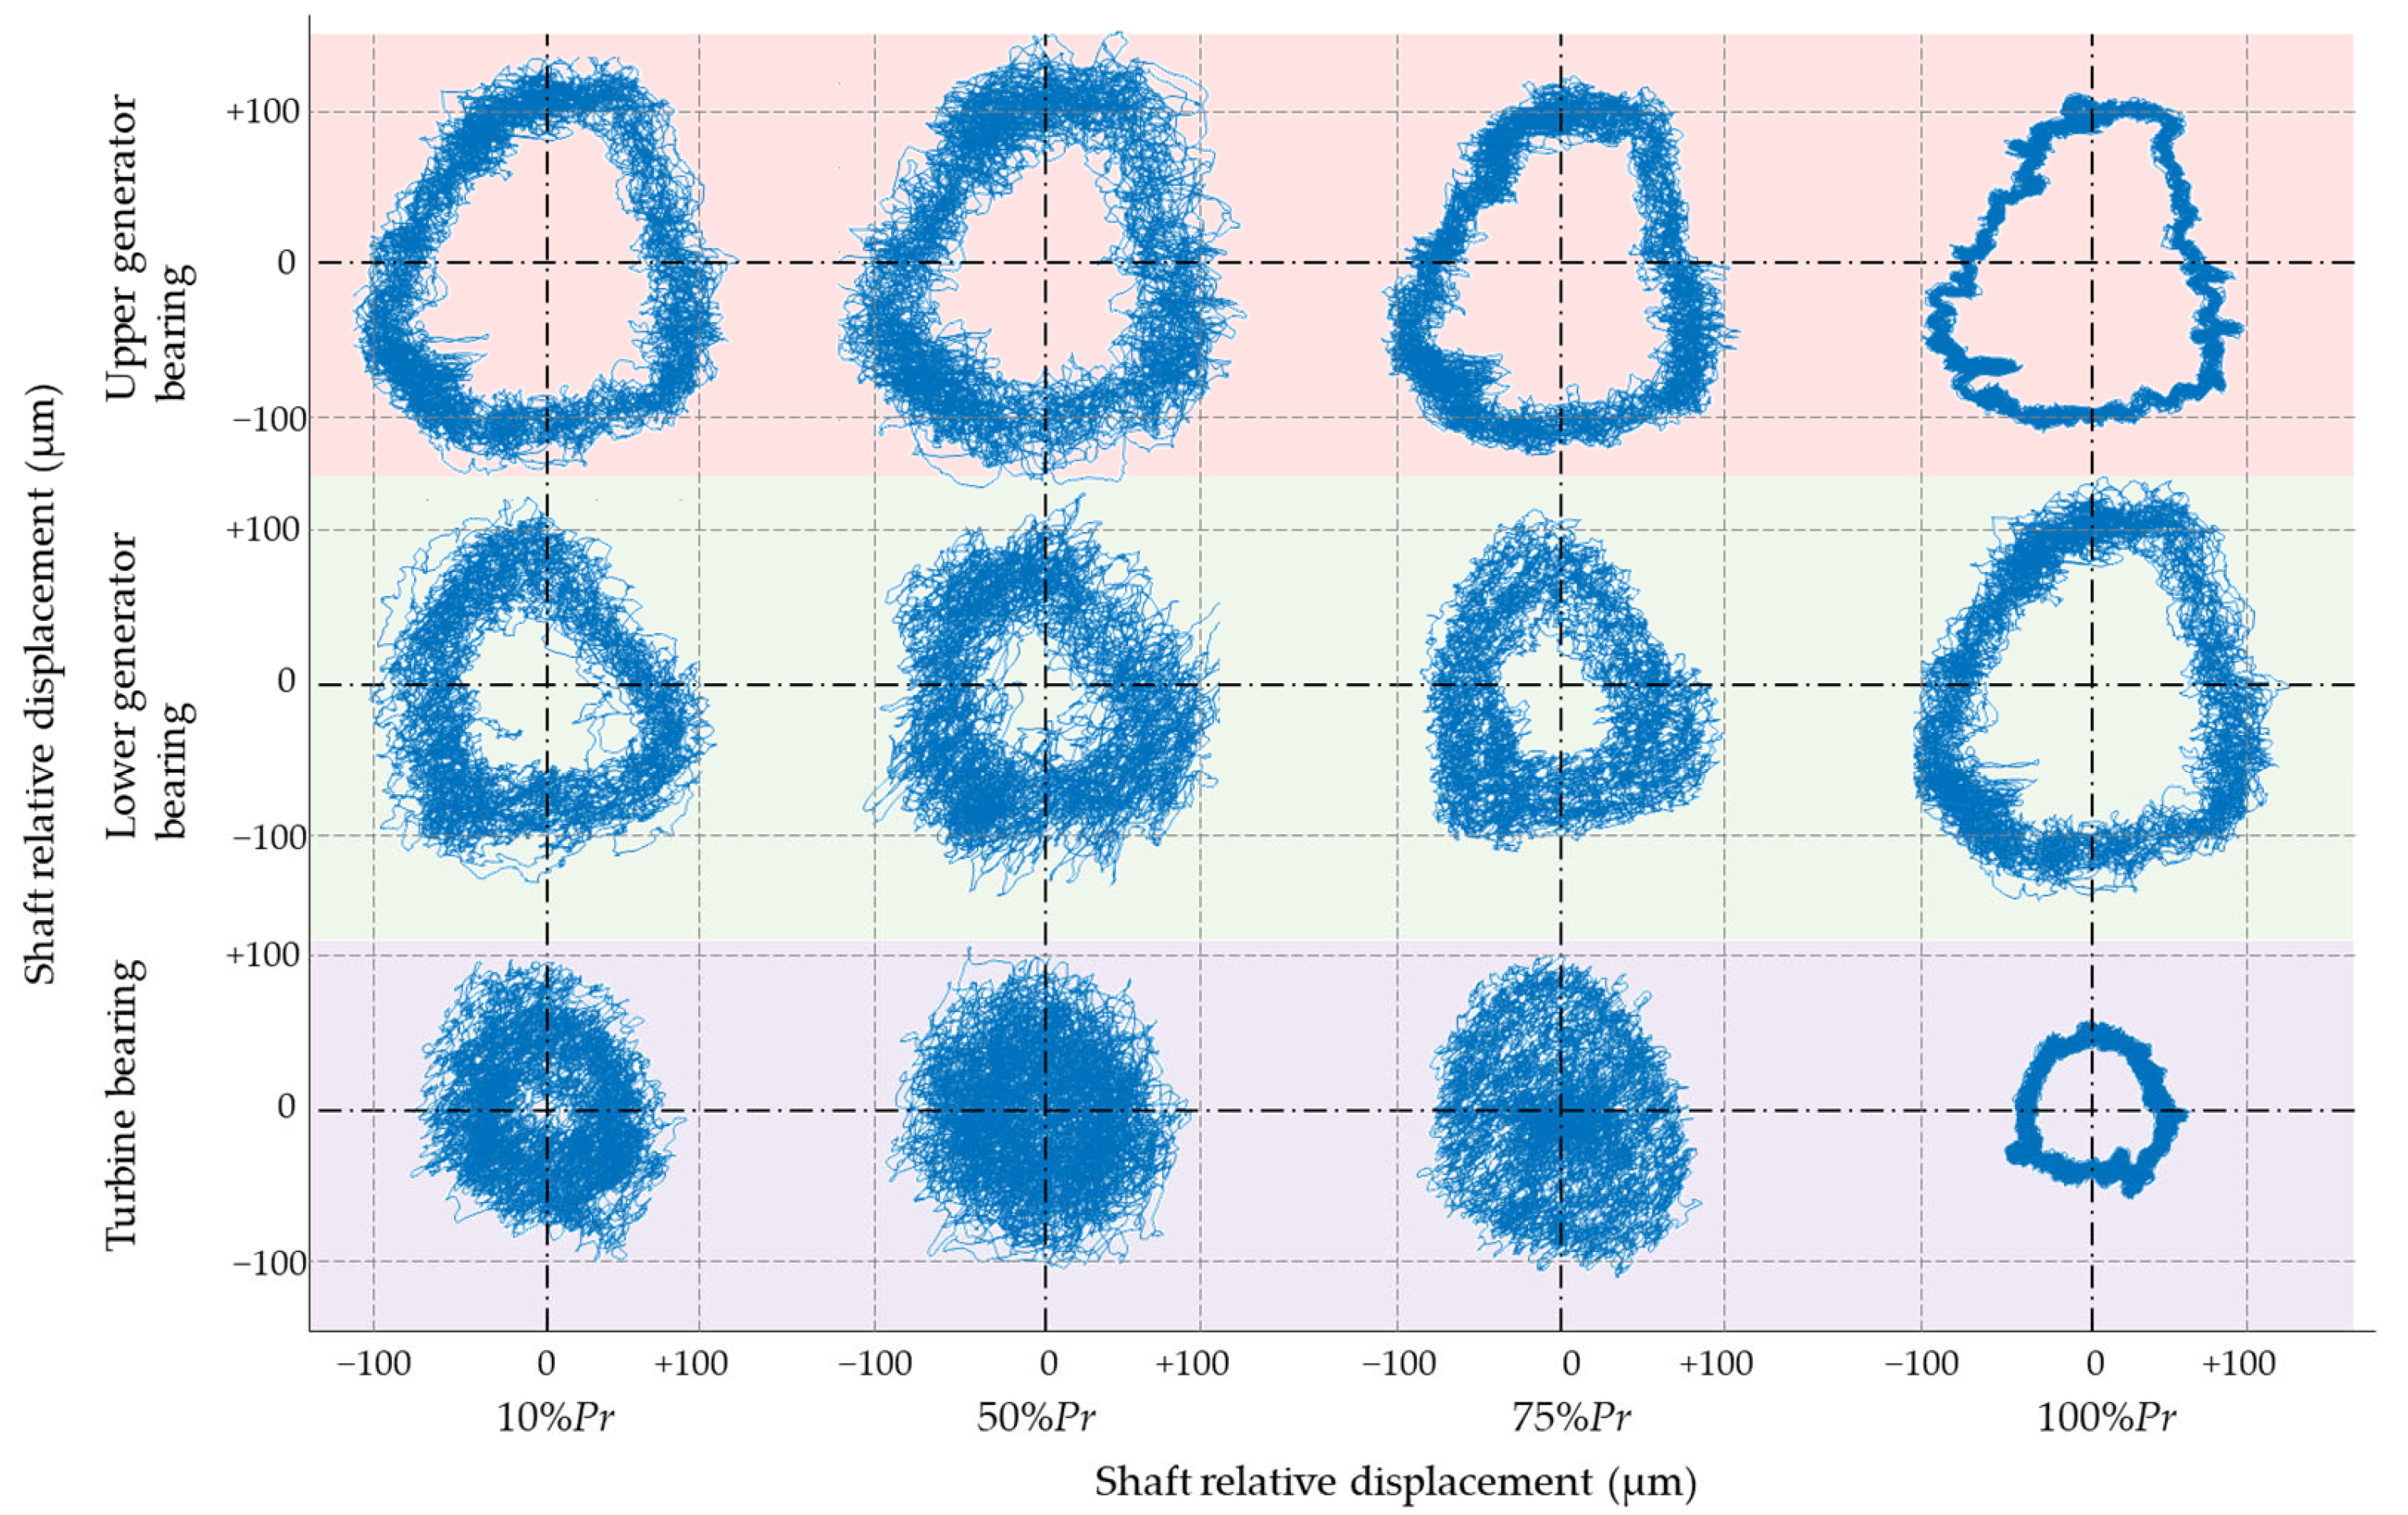
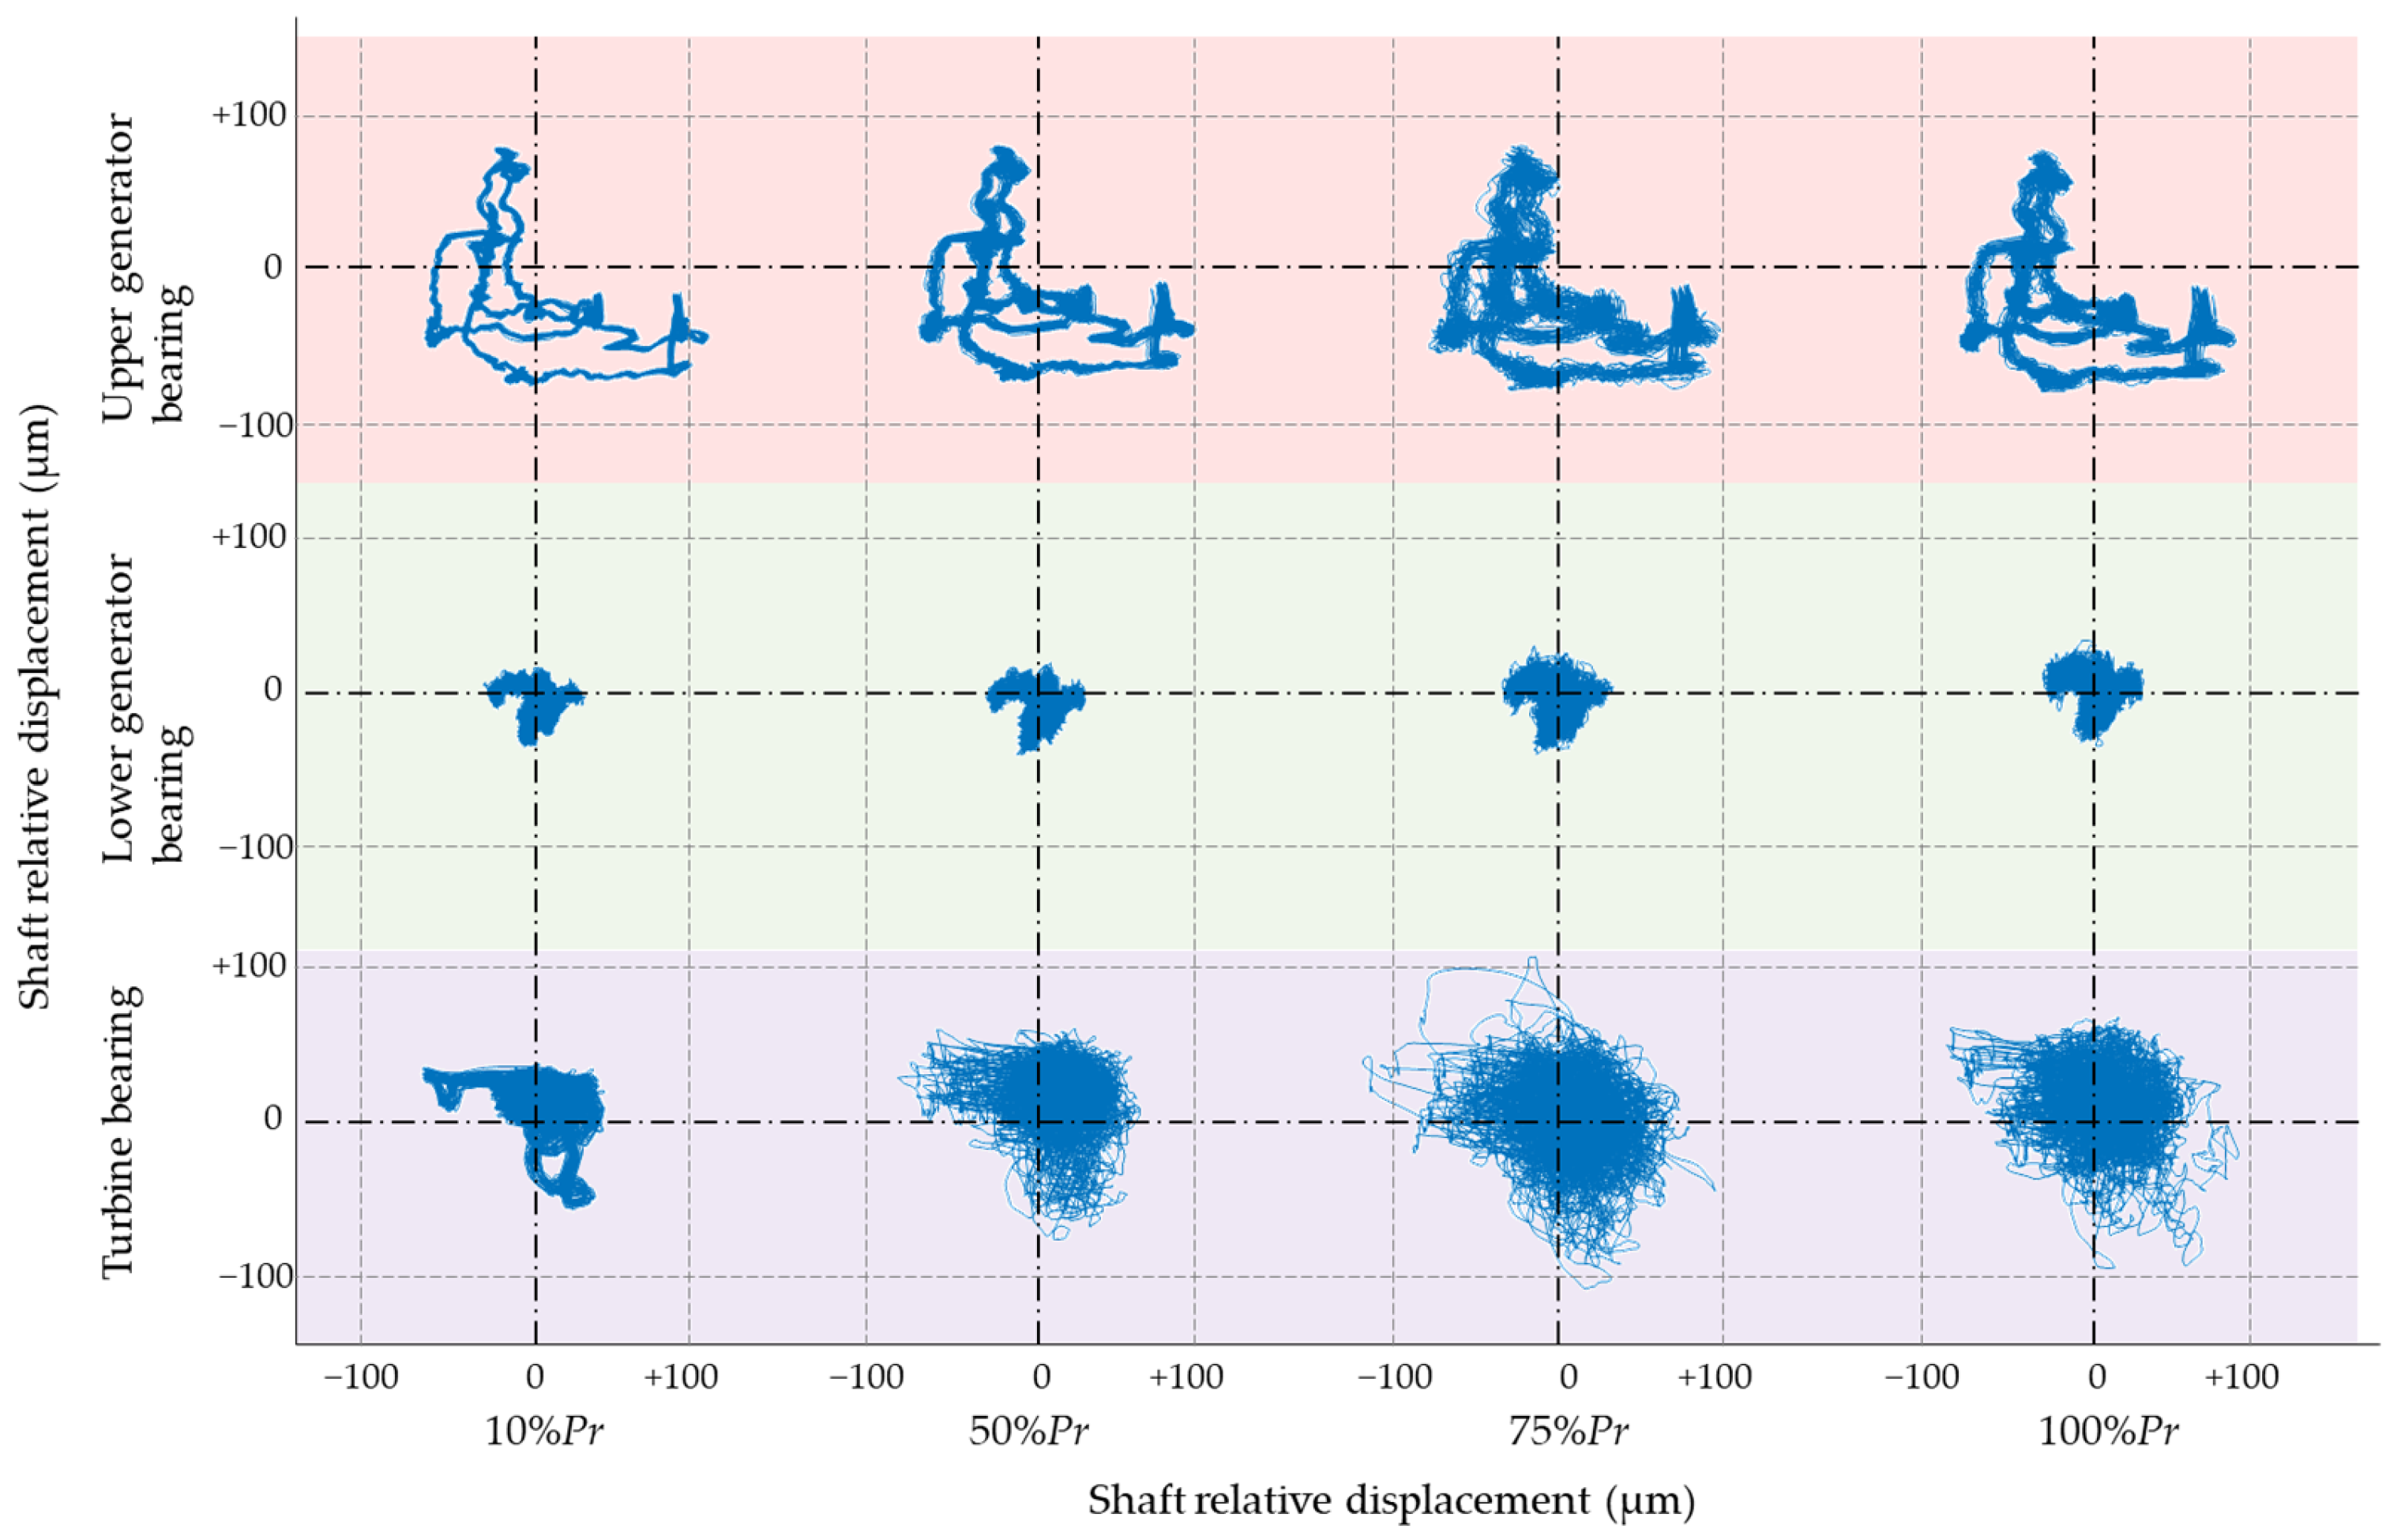
3.1.2. Vibration Behavior Comparison

Figure 8 shows the variation of vibration behavior of the upper generator bearing, lower generator bearing, and headcover of Units A and B, where the vibration of X direction is shown on the left and the vibration of the Y direction on the right. The red and blue lines represent the limitation values of TRIP and ALARM level, respectively, defined by the ISO standard. From the figures, it can be seen that variation of the vibration level shows the same trend on both units. The vibration level increases to its highest level at around 30% rated output. Then the vibration decreases until the machine is operating at the best efficiency point. The absolute vibration level increases again when the machine increases its output. In the range of low load, the absolute vibration levels of the head cover are almost the same between the two machines on all the measurement points. The highest vibration level of the two machines is 1.1 mm/s, which is measured from the head cover. From 50% load to overload, the vibration of the head cover shows different absolute values between the two units, despite the same trend. The vibration level of Unit A decreases to almost zero when the output increases to rated load, while the vibration level of Unit B shows a smaller decrease with the increase of load. Under the rated load, the vibration velocities of Unit A and Unit B are 0.7 mm/s and 0.1 mm/s, respectively.
To determine the reason that causes the vibration difference on the head cover (vTX and vTY), the vibration spectra under different loads (10%, 50%, 75%, 100%) are calculated and compared. The waterfall figure of the spectra of the selected loads are displayed in Figure 9. From each figure on both left and right, the wide band vibration exists in both machines. However, the wide band vibration almost disappears under rated load. This implies the high level of the vibration under partial load conditions is caused by turbulence or vortices, which cause a wide-frequency hydraulic excitation. Comparing the wide band vibration between Unit A and Unit B, the level of wide band vibration of Unit A is higher than Unit B. From the spectra of Unit B, the peaks at 66.7 Hz and 133.2 Hz, which equal 24 and 48 times of rotating frequency of the runner (fg = Zg × ff and 2fg = 2Zg × ff), respectively, can be found. These peaks, with one and two times of guide vane passing frequency, are caused by the rotor-stator interaction (RSI). Comparing the partial load spectra between Unit A and B, the amplitude of RSI in Unit B has much higher level than Unit A. Under low load conditions, the high level of RSI in Unit B compensates the high level brought by wide band vibration in Unit A, which causes similar overall level (vrms) between the two units.
In order to compare the influence of fg frequency and the wide band frequency on the vibration level of the units, the coordinate bands are selected and the band levels are calculated. As shown in Figure 10, the band of fg and 2 × fg with a band width of 2 Hz are selected to represent the amplitude of fg and 2 × fg, respectively. The wide bands 1 to 4 (WB1, WB2, WB3, and WB4) are selected according to the common high-amplitude band from the waterfalls of Unit A and Unit B. The ranges of the bands are listed in Table 2. The band values of the selected six bands are calculated according to Equation (1). The calculated band values are shown in Figure 11. The highest level of Unit A is WB1 (between 30 and 50 Hz), while the highest level of Unit B is fg. When the load increases from zero to full-load, the wide band vibration level decreases in Unit A, which causes the decrease of the overall vibration level of Unit A. For Unit B, the amplitude of fg is low under deep part load. This is because the distance between the guide vanes and the runner blades is far. When the output of Unit B increases to 25%, the amplitude of fg increases from 0.20 mm/s to 0.94 mm/s. Under this load, the fg band level of Unit A is only 0.10 mm/s. The band value of fg in Unit B is nearly 10 times that in Unit A. From 25% rated load to rated load, the level of fg has a slight decreasing trend but maintains a high level. This causes the difference in the overall vibration level under higher loads between Unit A and Unit B. It can be inferred that the high level of fg on Unit B is caused by the uneven guide vanes, which result in uneven pressure in the circumferential direction.
Figure 12 shows the variation of shaft axis deviation on the location of upper generator bearing, lower generator bearing, and headcover of Units A and B, where the displacement of the X direction is shown on the left and the vibration of the Y direction on the right. This displacement means the relative displacement of the shaft with respect to the bearing housing. From the figures, it can be seen that the variation of the displacement level shows different trends on the two units. The displacement shows a decrease trend in Unit A while remains almost constant on Unit B. Only the displacements on turbine bearing show similar trend on both units. On turbine bearing, the displacement level increases to its highest level at around 60% rated output. Then it decreases monotonically until overload. The displacement level of Unit A is always higher than Unit B, which implies that the stability of Unit B is better than Unit A. For Unit A, the lowest displacement appears on turbine bearing. For Unit B, the lowest displacement appears on lower generator bearing. Generally, turbine bearing withstands the highest hydraulic force on radial direction. It is normal to have higher displacement on turbine bearing. Therefore, it is not common to have the case of Unit A with lowest displacement on turbine bearing. For Unit A, the highest displacement occurs on the Y direction of the upper generator bearing. The level is 216 μm, which surpasses the ALARM level. The highest displacement level of Unit B occurs in the upper generator bearing. The level is 128.38 μm, which is within the ALARM level.
The shaft orbit is one of the most important indicators in the diagnosis of hydraulic turbines. It contains more information than the displacement of the shaft on the X and Y directions. In this research, the shaft orbits of the two machines under different loads are compared. The shaft orbits are measured by proximity probes installed on the X and Y directions of the upper generator bearing, lower generator bearing, and turbine bearing. Four loads are compared, which are 10%, 50%, 75%, and 100% rated output. Ten rotation cycles were conducted in the shaft orbit. As shown in Figure 13 and Figure 14, each row in the figure represents the shaft orbits in the same position, while each column represents the shaft orbits in different positions under the same load. From Figure 13, it can be seen that the orbits of Unit A are all circular-shaped under different loads. However, the sizes of the circles show different variation trends in different positions. Under low load, the radius of the shaft orbit increases from the turbine bearing to the upper generator bearing. Under rated output, the shaft orbit of the lower generator bearing shows the largest size. The deviation size of the turbine bearing is always the smallest in the whole output range. Under low load conditions, the shaft axis significantly vibrates along the shaft orbit. Under rated output conditions, the shaft axis keeps close to the orbit, which shows the stronger regularity of the shaft axis. The shaft orbit of Unit B in Figure 14 shows a greater difference from the ones of Unit A. The orbits show non-circular shapes under the whole operating range. The part with the smallest deviation is the lower generator bearing. The orbit with the best regulation appears under 10% load rather than the rated load. The shaft orbit and its changing rule are totally different between the two units.

3.2. Discussion and Outlook

3.2.1. Discussion

It is well known that the vibration behavior of a structure depends on the excitation force and its dynamic response (eigen frequency, modal shapes, damping, etc.). The variations in the design of hydraulic turbine units cause different excitation forces, which result in different vibration behavior. However, the impact of installation has not been analyzed in detail. The installation will influence the vibration behavior by changing the following factors:
Excitation force: installation error, such as shaft misalignment, angular deviation, and so on, might cause unbalanced hydraulic forces, discharge unevenness of spiral casings, etc. These hydraulic phenomena might contribute significantly to the excitation forces applied on the machine.
Structural response: the installation determines the stiffness of the structure, which influences the natural frequency of the machine. When the main frequency is close to one of the natural frequencies, there is resonance, which causes serious vibration.

3.2.2. Outlook

In this research, Unit A and Unit B have similar designs. The pressure characteristics and overall vibration levels are close to each other. However, the vibration spectra and short orbit have great difference between these two units. The results obtained by this research imply that the installation error has great influence on the vibration behavior of hydraulic turbine units. The operators need to notice that significant differences in vibration behavior might hide behind similar overall vibration levels.

4. Conclusions

In this study, the vibrational behavior under the whole range of operating conditions of two Francis turbine units with similar designs has been compared. Field testing has been performed on the researched units. The vibration indicators are extracted from the tested signal. By comparing the vibration curves of the two machines, the vibration behavior differences of the two machines have been analyzed. The main conclusions of this research are:
(1)
The design of the spiral casing has a great influence on the pressure in the runner inlet, which is significant for the performance of the machine.
(2)
The amplitude of pressure pulsation is lower at deep-low load conditions and rated operating conditions, and is higher at part load condition. The pressure pulsation directly causes the variation of vibration.
(3)
The intensity of vibration caused by RSI difference can reach 10 times difference between two similar hydraulic turbine units with different designs. Greater attention should be given to the design of the inlet of the runner and the guide vanes.
(4)
Even with similar designs, installation error can result in significant differences in vibration behavior hidden behind the same overall vibration levels.
This research reveals the effects of different designs and installations of Francis turbines on the vibration behavior of the prototype of the units. The obtained results give guidance to the designers and operators of Francis turbine units. More attention needs to be paid to the installation of the prototype units since even machines with similar designs can have distinct vibration behavior.

Author Contributions

Conceptualization, Z.W. and W.Z.; methodology, W.Z.; software, M.X.; validation, J.D., Z.J. and G.W.; formal analysis, W.Z.; investigation, M.X.; resources, J.D.; data curation, M.X.; writing—original draft preparation, W.Z.; writing—review and editing, Z.W.; visualization, W.Z.; supervision, Z.W.; project administration, G.W.; funding acquisition, Z.W. All authors have read and agreed to the published version of the manuscript.

Funding

This research was funded by Xinhua Hydro Power Company Limited.

Data Availability Statement

Data are contained within the article.

Acknowledgments

The authors would like to thank Bin Jin, who has provided the essential data acquisition equipment and made great effort on the field test.

Conflicts of Interest

Authors Jianhua Deng, Zhiqiang Jin and Gang Wang were employed by the company Xinhua Hydropower Co., Ltd. The remaining authors declare that the research was conducted in the absence of any commercial or financial relationships that could be construed as a potential conflict of interest. The authors declare that this study received funding from Xinhua Hydro Power Company Limited. The funder was not involved in the study design, collection, analysis, interpretation of data, the writing of this article, or the decision to submit it for publication.

References

  1. International Energy Agency. World Energy Outlook 2023; International Energy Agency: Paris, France, 2023. [Google Scholar]
  2. Li, J.; Chen, S.; Wu, Y.; Wang, Q.; Liu, X.; Qi, L.; Lu, X.; Gao, L. How to Make Better Use of Intermittent and Variable Energy? A Review of Wind and Photovoltaic Power Consumption in China. Renew. Sustain. Energy Rev. 2021, 137, 110626. [Google Scholar] [CrossRef]
  3. Pommeret, A.; Schubert, K. Optimal Energy Transition with Variable and Intermittent Renewable Electricity Generation. J. Econ. Dyn. Control 2022, 134, 104273. [Google Scholar] [CrossRef]
  4. Jing, Z.; Wang, Y.; Chang, J.; Wang, X.; Zhou, Y.; Li, L.; Tian, Y. Benefit Compensation of Hydropower-Wind-Photovoltaic Complementary Operation in the Large Clean Energy Base. Appl. Energy 2024, 354, 122040. [Google Scholar] [CrossRef]
  5. Pereira, J.G., Jr.; Vagnoni, E.; Favrel, A.; Landry, C.; Alligné, S.; Nicolet, C.; Avellan, F. Prediction of Unstable Full Load Conditions in a Francis Turbine Prototype. Mech. Syst. Signal Process. 2022, 169, 108666. [Google Scholar] [CrossRef]
  6. Zobeiri, A.; Kueny, J.-L.; Farhat, M.; Avellan, F. Pump-Turbine Rotor-Stator Interactions in Generating Mode: Pressure Fluctuation in Distributor Channel. In Proceedings of the 23rd IAHR Symposium on Hydraulic Machinery and Systems, Yokohama, Japan, 18–21 October 2006. [Google Scholar]
  7. Rodriguez, C.G.; Mateos-Prieto, B.; Egusquiza, E. Monitoring of Rotor-Stator Interaction in Pump-Turbine Using Vibrations Measured with on-Board Sensors Rotating with Shaft. Shock Vib. 2014, 2014, 276796. [Google Scholar] [CrossRef]
  8. Linlin, G. Numerical Investigation and Modelling of the Unsteady Behavior and Erosion Power of Cloud Cavitation. Ph.D. Thesis, Universitat Politècnica de Catalunya, Barcelona, Spain, 2021. [Google Scholar]
  9. Kumar, P.; Saini, R.P. Study of Cavitation in Hydro Turbines—A Review. Renew. Sustain. Energy Rev. 2010, 14, 374–383. [Google Scholar] [CrossRef]
  10. Gohil, P.P.; Saini, R.P. Investigation into Cavitation Damage Potentiality Using Pressure Pulsation Phenomena in a Low Head Francis Turbine for Small Hydropower Schemes. Ocean Eng. 2022, 263, 112230. [Google Scholar] [CrossRef]
  11. Abu-Nab, A.K.; Hakami, A.M.; Abu-Bakr, A.F. Charged Cavitation Multibubbles Dynamics Model: Growth Process. Mathematics 2024, 12, 569. [Google Scholar] [CrossRef]
  12. Favrel, A.; Müller, A.; Landry, C.; Yamamoto, K.; Avellan, F. Study of the Vortex-Induced Pressure Excitation Source in a Francis Turbine Draft Tube by Particle Image Velocimetry. Exp. Fluids 2015, 56, 215. [Google Scholar] [CrossRef]
  13. Maika, N.; Lin, W.; Khatamifar, M. A Review of Gravitational Water Vortex Hydro Turbine Systems for Hydropower Generation. Energies 2023, 16, 5394. [Google Scholar] [CrossRef]
  14. Favrel, A.; Müller, A.; Landry, C.; Gomes, J.; Yamamoto, K.; Avellan, F. Dynamics of the Precessing Vortex Rope and Its Interaction with the System at Francis Turbines Part Load Operating Conditions. In Proceedings of the Journal of Physics: Conference Series; IOP Publishing: Bristol, UK, 2017; Volume 813, p. 12023. [Google Scholar]
  15. Müller, A.; Bullani, A.; Dreyer, M.; Roth, S.; Favrel, A.; Landry, C.; Avellan, F. Interaction of a Pulsating Vortex Rope with the Local Velocity Field in a Francis Turbine Draft Tube. In Proceedings of the IOP Conference Series: Earth and Environmental Science; IOP Publishing: Bristol, UK, 2012; Volume 15, p. 32040. [Google Scholar]
  16. Moraga, G.; Egusquiza, M.; Valentín, D.; Valero, C.; Presas, A. Analysis of the Mode Shapes of Kaplan Runners. Appl. Sci. 2022, 12, 6708. [Google Scholar] [CrossRef]
  17. Zhao, Q.; Luo, Y.; Zhai, L.; Cao, J.; Cao, J.; Xu, Y.; Zhao, Y. Failure Analysis on the Bolt Connecting the Head-Cover and Stay Ring in Pumped Storage Unit: Part I—Experimental Study. Eng. Fail. Anal. 2023, 153, 107557. [Google Scholar] [CrossRef]
  18. Valentín, D.; Valero, C.; Egusquiza, M.; Presas, A. Failure Investigation of a Solar Tracker Due to Wind-Induced Torsional Galloping. Eng. Fail. Anal. 2022, 135, 106137. [Google Scholar] [CrossRef]
  19. Valero, C.; Egusquiza, M.; Egusquiza, E.; Presas, A.; Valentin, D.; Bossio, M. Extension of Operating Range in Pump-Turbines. Influence of Head and Load. Energies 2017, 10, 2178. [Google Scholar] [CrossRef]
  20. Egusquiza, E.; Valero, C.; Estévez, A.; Guardo, A.; Coussirat, M. Failures Due to Ingested Bodies in Hydraulic Turbines. Eng. Fail. Anal. 2011, 18, 464–473. [Google Scholar] [CrossRef]
  21. Xu, Y.; Li, Z. Computational Model for Investigating the Influence of Unbalanced Magnetic Pull on the Radial Vibration of Large Hydro-Turbine Generators. ASME. J. Vib. Acoust. 2012, 134, 051013. [Google Scholar] [CrossRef]
  22. Presas, A.; Valentin, D.; Deering, J.; Kampschulte, M.; Yu, B.; Grandfield, K.; Mele, E.; Biehl, C.; Krombach, G.A.; Heiss, C. Resonance Vibration Interventions in the Femur: Experimental-Numerical Modelling Approaches. J. Mech. Behav. Biomed. Mater. 2021, 124, 104850. [Google Scholar] [CrossRef]
  23. Zhao, W.; Egusquiza, E.; Valero, C.; Egusquiza, M.; Valentín, D.; Presas, A. A Novel Condition Monitoring Methodology Based on Neural Network of Pump-Turbines with Extended Operating Range. In Proceedings of the 16th IMEKO TC10 Conference, Berlin, Germany, 3–4 September 2019; p. 4. [Google Scholar]
  24. Zhao, W.; Huang, X.; Yang, M.; Yang, H.; Bi, H.; He, Q.; Wang, Z. Flow-Induced Dynamic Behavior of Head-Cover Bolts in a Prototype Pump-Turbine during Load Rejection. Machines 2022, 10, 1130. [Google Scholar] [CrossRef]
  25. Trivedi, C. A Review on Fluid Structure Interaction in Hydraulic Turbines: A Focus on Hydrodynamic Damping. Eng. Fail. Anal. 2017, 77, 1–22. [Google Scholar] [CrossRef]
  26. Kahraman, G.; Özdemir, O. Mathematical Modeling of Vibration Failure Caused by Balancing Effect in Hydraulic Turbines. Mech. Based Des. Struct. Mach. 2023, 51, 1489–1500. [Google Scholar] [CrossRef]
  27. Casanova, F. Failure Analysis of the Draft Tube Connecting Bolts of a Francis-Type Hydroelectric Power Plant. Eng. Fail. Anal. 2009, 16, 2202–2208. [Google Scholar] [CrossRef]
  28. Presas, A.; Egusquiza, E.; Valero, C.; Valentin, D.; Seidel, U. Feasibility of Using PZT Actuators to Study the Dynamic Behavior of a Rotating Disk Due to Rotor-Stator Interaction. Sensors 2014, 14, 11919–11942. [Google Scholar] [CrossRef] [PubMed]
  29. Presas, A.; Valentin, D.; Egusquiza Montagut, M.; Bossio, M.; Egusquiza, E.; Valero, C. Optimized Use of Sensors to Detect Critical Full Load Instability in Large Hydraulic Turbines. Proceedings 2017, 1, 822. [Google Scholar] [CrossRef]
  30. Zhu, L.; Zhang, R.; Yu, A.; Lu, L.; Luo, X. Suppression of Vortex Rope Oscillation and Pressure Vibrations in Francis Turbine Draft Tube Using Various Strategies. J. Hydrodyn. 2021, 33, 534–545. [Google Scholar] [CrossRef]
  31. Agarwal, A.; Mthembu, L. Finite Element Investigation of the Vibration Characteristics of Francis Turbine Vanes. In Emerging Trends in Mechanical and Industrial Engineering: Select Proceedings of ICETMIE 2022; Springer: Berlin/Heidelberg, Germany, 2023; pp. 945–960. [Google Scholar]
Figure 1. The sketch of the researched units A and B and the extension tube mounted in Unit B.
Water 17 00113 g001
Figure 2. Design of field measurement positions.
Water 17 00113 g002
Figure 3. Operating conditions for measurement.
Water 17 00113 g003
Figure 4. Frequency band.
Water 17 00113 g004
Figure 5. Peak-to-peak value calculation by different confidence intervals.
Water 17 00113 g005
Figure 6. Pressure variation of different measurement points in Unit A and Unit B.
Water 17 00113 g006
Figure 7. Pressure variation under different loads.
Water 17 00113 g007
Figure 8. Vibration overall level curve comparison between the two units on different measurement points.
Water 17 00113 g008
Figure 9. Spectra waterfall of the head cover vibration under different loads of Unit A (in blue) and Unit B (in orange).
Water 17 00113 g009
Figure 10. Definition of the vibration frequency bands.
Water 17 00113 g010
Figure 11. Highest amplitude of the spectra of the head cover vibration under different loads of Unit A and Unit B.
Water 17 00113 g011
Figure 12. Shaft axis displacement curve comparison between the two units on different measurement points.
Water 17 00113 g012
Figure 13. Shaft orbit of Unit A.
Water 17 00113 g013
Figure 14. Shaft orbit of Unit B.
Water 17 00113 g014
Table 1. Basic structure parameters of the researched Francis turbine units.
Structure ParameterValue
Runner diameter3.5 m
Number of blades Zb13
Number of guide vanes Zg24
Rated head Hr54.5 m
Rated speed n166.7 rpm
Rated rotating frequency ff2.78 Hz
Rated output Pr44.6 MW
Blade passing frequency fb36.11 Hz
Best efficiency94.14%
Table 2. Band ranges of the selected bands.
Band nameCenter FrequencyBand Width
fgfg±1.00 Hz
2 × fg2 × fg±1.00 Hz
WB141.55 Hz8.75 Hz
WB2100.30 Hz13.90 Hz
WB3153.50 Hz8.60 Hz
WB4190.45 Hz9.55 Hz
Disclaimer/Publisher’s Note: The statements, opinions and data contained in all publications are solely those of the individual author(s) and contributor(s) and not of MDPI and/or the editor(s). MDPI and/or the editor(s) disclaim responsibility for any injury to people or property resulting from any ideas, methods, instructions or products referred to in the content.

