Article

Mercury Bioconcentration and Translocation in Rooted Macrophytes (Paspalum repens Berg.) from Floodplain Lakes in the Araguaia River Watershed, Brazilian Savanna

by
Lucas Cabrera Monteiro
1,*,
Ludgero Cardoso Galli Vieira
2,
José Vicente Elias Bernardi
3,
Ygor Oliveira Sarmento Rodrigues
4,
Lígia Pereira Borges de Mesquita
5,
João Pedro Rudrigues de Souza
6,
Guilherme Sena
7,
Iuri Aparecida da Silva Oliveira
8,9,
Cássio da Silva Cabral
8,9,
José Francisco Gonçalves Júnior
7,
Jurandir Rodrigues de Souza
6 and
Wanderley Rodrigues Bastos
9
1
Programa de Pós-Graduação em Ecologia, Instituto de Ciências Biológicas, Universidade de Brasília, Brasília 70910-900, DF, Brazil
2
Núcleo de Estudos e Pesquisas Ambientais e Limnológicas, Faculdade UnB Planaltina, Universidade de Brasília, Planaltina 73345-010, DF, Brazil
3
Laboratório de Geoestatística e Geodésia, Faculdade UnB Planaltina, Universidade de Brasília, Planaltina 73345-010, DF, Brazil
4
Programa de Pós-Graduação em Ciências Ambientais, Faculdade UnB Planaltina, Universidade de Brasília, Planaltina 73345-010, DF, Brazil
5
Programa de Pós-Graduação em Ecologia e Evolução, Instituto de Ciências Biológicas, Universidade Federal de Goiás, Goiânia 74690-900, GO, Brazil
6
Laboratório de Química Analítica e Ambiental, Instituto de Química, Universidade de Brasília, Brasília 70910-900, DF, Brazil
7
AquaRiparia/Laboratório de Limnologia, Departamento de Ecologia, Instituto de Ciências Biológicas, Universidade de Brasília, Brasília 70910-900, DF, Brazil
8
Programa de Pós-Graduação em Desenvolvimento Regional e Meio Ambiente, Universidade Federal de Rondônia, Porto Velho 76801-059, RO, Brazil
9
Laboratório de Biogeoquímica Ambiental, Universidade Federal de Rondônia, Porto Velho 76800-500, RO, Brazil
*
Author to whom correspondence should be addressed.
Water 2024, 16(9), 1199; https://doi.org/10.3390/w16091199
Submission received: 29 March 2024 / Revised: 18 April 2024 / Accepted: 19 April 2024 / Published: 23 April 2024

Abstract

:
Macrophytes are fundamental photosynthetic organisms for functioning freshwater ecosystems, identified as potential bioindicators of mercury (Hg) in the environment. We quantified the concentrations of total Hg (THg) in water and macrophytes (Paspalum repens Berg.) from 17 lakes on the Araguaia River floodplain, aiming to compare the bioconcentration factor (BCF) in the aerial tissues and roots; evaluate the translocation factor (TF) between plant tissues; and assess the influence of environmental factors and land use on THg concentrations in water and macrophytes. The BCF was significantly higher in roots (1.29 ± 0.32) than in aerial tissues (0.41 ± 0.34), with low TF between plant tissues (0.14 ± 0.06). The highest concentrations of THg in water were determined in lakes with higher land use intensity and a pH close to neutral, indicating the transport of particulate-bound Hg and the immobilization in the water column. In contrast, wetlands were priority areas for the bioconcentration of THg in macrophytes, associated with sulfate, dissolved oxygen, and oxidation–reduction potential in the water. Thus, although P. repens is not a suitable bioindicator of Hg mobilization by anthropogenic land use in our study area, our results suggest the potential of macrophytes as bioindicators of sites that are favorable to Hg methylation.

1. Introduction

Macrophytes are fundamental photosynthetic organisms for functioning freshwater ecosystems and providing ecosystem services. In lacustrine ecosystems, macrophytes form the basis of the trophic chain [1], contributing to primary productivity [2,3] and nutrient cycling, especially nitrogen and phosphorus [4,5]. Additionally, macrophyte banks act on physical processes in lakes, controlling the sedimentation process [6] and creating favorable environments for the colonization of microorganisms (periphyton) and shelter for macroinvertebrates and fish [7,8]. Therefore, considering their importance in the cycling of matter and energy in aquatic ecosystems, macrophytes are widely used as bioindicators of pollution by potentially toxic chemical elements [9].
Mercury (Hg) stands out as a global pollutant among the potentially toxic chemical elements. The biogeochemical cycle of Hg in aquatic ecosystems is controlled by oxidation–reduction and methylation–demethylation processes, influenced by local environmental conditions (e.g., physicochemical water parameters) and microbiological activity [10]. Macrophytes accumulate organic and inorganic Hg in their cells through passive diffusion, allowing for intracellular reduction, methylation, or demethylation of Hg [11]. In addition, the roots of macrophytes act as traps for suspended particulate matter, increasing the adsorption of Hg in their tissues [12]. Consequently, the accumulation of Hg in primary producers, including macrophytes and associated periphyton, is the primary source of exposure for the aquatic trophic chain [10].
Along these lines, determining the concentrations and identifying the factors that influence the accumulation of Hg in macrophytes is fundamental to understanding the biogeochemical cycle of Hg in aquatic ecosystems. Thus, indices developed to assess the relationship between pollutants and aquatic biota have been applied to measure the potential for Hg accumulation in macrophytes related to the surrounding environment [13,14], as well as to assess its translocation process between plant tissues [15,16]. By calculating these indices, geostatistical methods can be applied to identify priority areas for the bioconcentration and translocation of Hg in macrophytes at local and regional scales. Among geostatistical methods, kriging is the main algorithm for spatial interpolation, providing accurate predictions for environmental management and decision-making [17]. The kriging method is extensively used to assess the spatial distribution of potentially toxic chemical elements, including Hg, in terrestrial [18,19] and aquatic abiotic compartments [20,21,22]. In contrast, there is a scarcity of kriging applications with biological samples. As far as we know, no study has evaluated the spatial distribution of Hg or other chemical elements in macrophytes using geostatistical methods. Therefore, the spatial distribution of Hg in biotic compartments needs attention, especially in ecosystems that are undergoing major environmental changes as a response to anthropogenic impacts.
The Cerrado biome (Brazilian Savanna) is a biodiversity conservation hotspot due to the high endemic species richness and the increasing loss of habitat since the 1970s [23]. The Araguaia River, mainly inserted in the Cerrado biome, is one of the few large Brazilian rivers with free flow. However, large-scale deforestation in its watershed has resulted in significant changes in geomorphological and hydrological processes [24,25], which can affect the natural distribution of Hg in aquatic ecosystems. Indeed, the conversion of native vegetation to pasture has affected the Hg accumulation patterns in lacustrine bottom sediments [22] and ichthyofauna [26] from the Araguaia River floodplain. In addition, a recent study indicated a significant potential for bioaccumulation related to bottom sediments in the macrophytes Paspalum repens Berg. and Salvinia auriculata Aubl. [27]. The P. repens macrophytes stand out for being rooted and perennial, exposed to environmental conditions throughout the seasonal hydrological cycle. In addition, individuals of P. repens develop roots between the stem nodes to absorb water and chemical elements [28], providing sites for Hg accumulation through the water column (dissolved and particulate fractions). However, more information is needed on bioconcentration and the translocation of Hg between aerial tissues and roots in macrophytes from the Cerrado biome.
The objective of our study is to quantify the concentrations of total mercury (THg) in water and macrophytes of the species P. repens (aerial tissues and roots) from 17 lakes on the Araguaia River floodplain (Cerrado biome) to answer the following questions: (i) Do the different macrophyte tissues accumulate significant THg concentrations concerning the environment (water)? (ii) Is there a difference in bioconcentration potential between aerial and root tissues? (iii) How are environmental factors (physicochemical parameters of the water, land use, and land cover) associated with THg concentrations in the water and macrophytes? (iv) What is the spatial distribution of THg concentrations in the water and THg bioconcentration and translocation in the macrophytes? These questions will provide information on the potential of P. repens as a bioindicator of Hg mobilization by anthropogenic activities and elucidate the factors influencing THg concentrations in water and macrophytes in floodplains.

2. Materials and Methods

2.1. Study Area

The Araguaia River is located in Central Brazil, flowing from south to north between four states: Goiás, Mato Grosso, Tocantins, and Pará (Figure 1). According to the Köppen classification, the tropical climate with dry winters prevails in the Araguaia River basin [29]. This climate is typical of the Cerrado biome, characterized by two well-defined seasonal periods throughout the year: a dry and rainy season, accounting for approximately 90% of the average annual precipitation [30]. The Middle Araguaia is the largest river segment (1160 km), comprising the main tributaries of the watershed, such as the Claro, Vermelho, Peixe, and Crixás rivers on the right bank and the Cristalino, Mortes, and Tapirapé rivers on the left bank [31].
The Araguaia River floodplain is formed by active sedimentation and erosion processes in morpho-sedimentary geological units [32], resulting in the transportation of high loads of sandy sediments [33]. The flooding dynamics favor the creation of macrohabitats with different hydrological and botanical characteristics, such as permanently aquatic areas (rivers and lakes), aquatic–terrestrial transition areas, swampy areas, and permanently terrestrial areas [34]. The municipalities in the study area have a low degree of urbanization, with deforestation for livestock and agriculture being the main anthropogenic impact in the region [22,26].

2.2. Sample Collection and Processing

Samples were collected from 17 lakes in the Araguaia River floodplain in January 2022 (rainy season). The sampling sites were distributed along a stretch of approximately 450 km of the floodplain (15°7′ to 11°4′ S and 51°7′ to 50°4′ W), including lakes associated with the Araguaia River (n = 10) and four tributaries: Vermelho River (n = 2), Peixe River (n = 1), Crixás River (n = 1), and Mortes River (n = 3) (Figure 1). Surface water samples (~15 cm) were collected using 500 mL polyethylene terephthalate (PET) bottles and acidified with concentrated HNO3. Macrophyte samples were manually collected and washed in the field to remove adhered coarse material. All samples were stored in thermal boxes with ice until arrival at the laboratory.
In the laboratory, macrophyte samples were separated into aerial tissues (stem and leaves) and roots using stainless steel scissors, washed with abundant distilled water, and cleaned with soft-bristled brushes. The roots were transferred to Falcon tubes and centrifuged at 2500 rpm for 5 min [35]. After centrifugation, the roots were rewashed with distilled water, transferred to Falcon tubes, and subjected to an ultrasound bath for three cycles of 30 min each to remove periphyton and fine sediments altogether. Macrophyte samples were dried in an oven at 50 °C until constant weight, ground in an electric grinder, and sieved at 125 µm for particle homogenization. Water samples were frozen until THg quantification.

2.3. Quantification of Total Mercury (THg) in Water and Macrophytes

The THg was quantified in unfiltered water samples by oxidizing Hg forms [36]. Approximately 20 g of each water sample was weighed into 40 mL vials, and we added 100 µL concentrated bromine monochloride (BrCl) (Brooks Rand®, Seattle, WA, USA) for Hg oxidation. After 40 min, the Hg was reduced with 100 µL of hydroxylamine hydrochloride (NH2OH.HCl) 30% (w/v) (Merck®, Darmstadt, Germany) and 100 µL of stannous chloride (SnCl2) 20% (w/v) (Merck®), with a 5-min interval between each reagent. Ten minutes after the addition of SnCl2, THg concentrations were quantified by atomic fluorescence spectrometry with cold vapor generation (CVAFS, MERX-T, Brooks Rand, Seattle, WA, USA), with a detection limit of 0.05 ng L−1. The analytical method’s accuracy was evaluated by quantifying THg in fortified samples (spikes), with a mean recovery of 107 ± 2% (n = 3). The glassware used for sample preparation and analysis was soaked in 5% (v/v) HNO3 for 24 h and rinsed with deionized water. The quantification of THg in blank samples (reagents only) was carried out to ensure glassware decontamination and the purity of the reagents.
THg concentrations in macrophytes were determined by thermal decomposition atomic absorption spectrometry (TDAAS) with Zeeman effect correction, using a direct analyzer (RA915+) coupled to a pyrolysis chamber (Pyro-915+) (Lumex Instruments, St. Petersburg, Russia). Samples of aerial tissues (0.1 g, dry weight) and roots (0.05 g, dry weight) were weighed into quartz boats and introduced into the pyrolysis chamber (Mode 1: 680–740 °C). All readings were performed in duplicate, with a detection limit of 0.028 ng and a maximum relative standard deviation of 10%. Quality control was achieved by quantifying THg in the empty quartz boats for 45 s (blank sample), defined as the average duration of the absorption peak. Accuracy was determined by quantifying THg in the standard reference material (SRM) NIST-1515 (apple leaves, National Institute of Standards and Technology, Gaithersburg, MD, USA), with a mean recovery of 105 ± 4% (n = 6).

2.4. THg Bioconcentration and Translocation in Macrophytes

We used the bioconcentration factor (BCF) to evaluate the direct absorption of THg in each macrophyte tissue (aerial tissues and roots) concerning water. The BCF was chosen based on the morphological characteristics of the P. repens species, especially the development of roots between the nodes of the stem, so that water represents a common source of Hg exposure for aerial tissues and roots. The BCF was calculated by the ratio of the THg concentrations determined in the macrophytes (ng g−1, dry weight) and the concentrations determined in the water (ng L−1) (Equation (1), [37]). The results were converted to a logarithmic scale (log10). BCF values greater than one (1) indicate the positive bioconcentration process of the macrophytes with the surrounding environment, while values less than one (1) indicate that the bioconcentration process is not significant.
B C F = [ T H g ] M a c r o p h y t e s   ( a e r i a l   t i s s u e s   o r   r o o t s ) [ T H g ] W a t e r
The translocation factor (TF) was used to evaluate the distribution of THg in the macrophyte tissues. The TF was calculated by the ratio between the THg concentrations determined in the aerial tissues (ng g−1, dry weight) and the concentrations determined in the roots (ng g−1, dry weight) (Equation (2), [38]). TF values lower than one (1) indicate that the macrophytes have a more significant potential to accumulate Hg in the roots. In comparison, TF values higher than one (1) indicate a greater potential for bioaccumulation in the aerial tissues.
T F = [ T H g ] A e r i a l   t i s s u e s [ T H g ] R o o t s

2.5. Characterization of Environmental Conditions and Land Use and Cover

Local environmental conditions were represented by the physicochemical parameters and the concentration of sulfate in the surface water. The physicochemical parameters such as pH, oxidation–reduction potential (ORP), transparency, turbidity, and dissolved oxygen (DO) were measured in situ with a multi-parameter probe (Model U-50, Horiba, Kyoto, Japan). Depth was measured with a Secchi disk. For the determination of sulfate in water, samples were collected at each sampling site and filtered with nylon syringe fil-ters with 25 mm diameter and 0.45 mm pore (Millipore, Burlington, NJ, USA), frozen at −4 °C, and transported to the laboratory in thermal boxes with gel ice bars, with continued addition of ice bars. Then, they were analyzed on a chromatograph (Metrohm, Herisau, Switzerland), using specific columns for sulfate. Sulfate determination was carried out on a MetroSep C4 250/4.0 mm column using 1.7 mM nitric acid/0.7 nM dipololinic acid as eluent with unsuppressed conductivity detection.
The land use and cover characterization was based on the raster data made available by Collection 8 of the MapBiomas Project, referring to 2022 (spatial resolution: 30 m; [39]). According to previous studies on the Araguaia River floodplain, we characterized land use in 10 km buffers from each sampling site [22,40]. The raw data provided by the MapBiomas Project was reclassified into six land use and cover classes: (1) Cerrado (forest, savanna, and grassland formations); (2) Wetlands; (3) Pasture and agriculture; (4) Urban infrastructure; (5) Sandbanks; (6) Water (Table S1). We assessed the land use intensity in each 10 km buffer using the land use index (LUI) (Equation (3); [41]). This index was adopted to avoid zero values in the database due to the absence of urban infrastructure around the lakes.
L U I = 4 % U r b a n   i n f r a s t r u c t u r e + 2 % P a s t u r e / A g r i c u l t u r e

2.6. Data Analysis

All variables were subjected to the Shapiro–Wilk test to assess the data distribution. Initially, we assessed the difference in THg concentrations in water and macrophytes between the Araguaia River and its tributaries using Student’s t-test or the Mann–Whitney test. There were no differences in THg concentrations in water and macrophytes between the river systems (p > 0.05). Therefore, the subsequent analyses included all the sampling sites (n = 17).
Principal component analysis (PCA) was applied to explore the association between THg concentrations, physicochemical water parameters, and land use and cover. Initially, we performed a PCA with all the variables. The Kaiser–Meyer–Olkin (KMO) criterion was applied to identify and remove the variables with the lowest KMO values. After the data pre-treatment, we carried out the PCA only with the concentrations of THg in the water and in the macrophytes (aerial tissues and roots), pH, ORP, OD, sulfate, percentage of wetlands, and land use intensity (LUI). The suitability of the data set for applying PCA was assessed using the Kaiser–Meyer–Olkin criterion and Bartlett’s test of sphericity. The non-parametric Wilcoxon test was applied to compare the bioconcentration potential between aerial tissues and roots (paired samples). All analyses were done using the R 4.3.3 software [42].

2.7. Geostatistical Analysis

Indicator kriging (IK) was used to assess the spatial distribution of THg concentrations in water, BCF (aerial tissues and roots), and TF. The indicator method is based on transforming the original data into binary indicators (0 or 1), which estimate the probability of a variable of interest occurring above a specific cut-off value [43]. We determined the following cut-off values: (i) THg concentrations in water: the average of the concentrations determined in the five sampling sites with the lowest degrees of land use intensity (1.2 ng L−1); (ii) BCF > 1, a value that indicates the positive process of bioconcentration; and (iii) TF: median of the TF values determined in the entire data set. After transforming the data into binary indicators, the experimental variograms were calculated according to Equation (4), where h is the lag, v c is the cut-off value and N is the number of pairs.
y i h ,   v c = 1 2 N h   i = 1 N k i x + h ,   v c i ( x , v c ) 2
The variogram allows the assessment of the spatial dispersion of regionalized variables by measuring the average dissimilarity between the sampling sites separated by a distance [44]. IK was carried out using the stable model, represented by Equation (5), where γ h is the semi-variance, C 0 is the nugget effect, C is the sill, h is the lag, and a is the interval between sampling sites (range). The ratio between the nugget and sill values was calculated to assess the spatial dependence of the models (Equation (6)). The nugget/sill ratio results are interpreted according to three classes of spatial dependence: strong (<25%), moderate (26–75%), and weak (>75%) [45].
γ h = C 0 + C   1 e x p   h a a   ,   0 < a 2  
S p a t i a l   d e p e n d e n c e = C O C 100
Buffers of 10 km from each river channel were defined to visualize the probability maps, considering the maximum width of the Middle Araguaia floodplain (2–10 km; [46]). Cross-validation was carried out using the jack-knifing method, assessing the mean error (ME) and the root-mean-square standardized error (RMSSE) between the observed and predicted values [47]. The parameters assessed in this study were the mean error (ME) and the root-mean-square standardized error (RMSSE). ME values close to zero (0) indicate that the models are not biased. The RMSSE represents the error variance from the ME, and values close to one (1) indicate a good fit between the observed and predicted values [48]. Geostatistical analyses were carried out using the Geostatistical Analyst extension of ArcMap 10.8 software (Esri, Redlands, CA, USA).

3. Results

3.1. THg Concentrations in Water and Environmental Characterization

The mean THg concentration in the unfiltered water was 1.68 ± 0.95 ng L−1 (0.5–4 ng L−1). The lakes on the Araguaia River floodplain had a slightly acidic to neutral pH (6.6 ± 0.5), positive oxidation–reduction potential (209.9 ± 42.9 mV), and relatively low dissolved oxygen concentrations (2.46 ± 0.61 mg L−1). The transparency (0.81 ± 0.40 m), depth (7.05 ± 2.11 m), turbidity (6.75 ± 6.49 NTU), and sulfate concentrations (0.0161 ± 0.165 mg L−1) varied considerably between the lakes (Table 1).
Our study area shows a gradient of land use and cover, with anthropogenic areas located in the southern section of the floodplain (upstream) and natural areas, including wetlands, in the northern section of the floodplain (downstream) (Figure 1). Regarding the natural areas, the mean proportions of Cerrado and wetlands were 50.5 ± 15.7% and 20.8 ± 21.4%, respectively (Table 1). The primary anthropogenic land use is pasture and agriculture (22.0 ± 16.7%), with only three lakes close to urban infrastructure (0.05 ± 0.12%). The LUI values reflect the gradient of anthropization, ranging from 9.0 to 131.5 (44.3 ± 33.4).

3.2. THg Bioconcentration and Translocation in Macrophytes

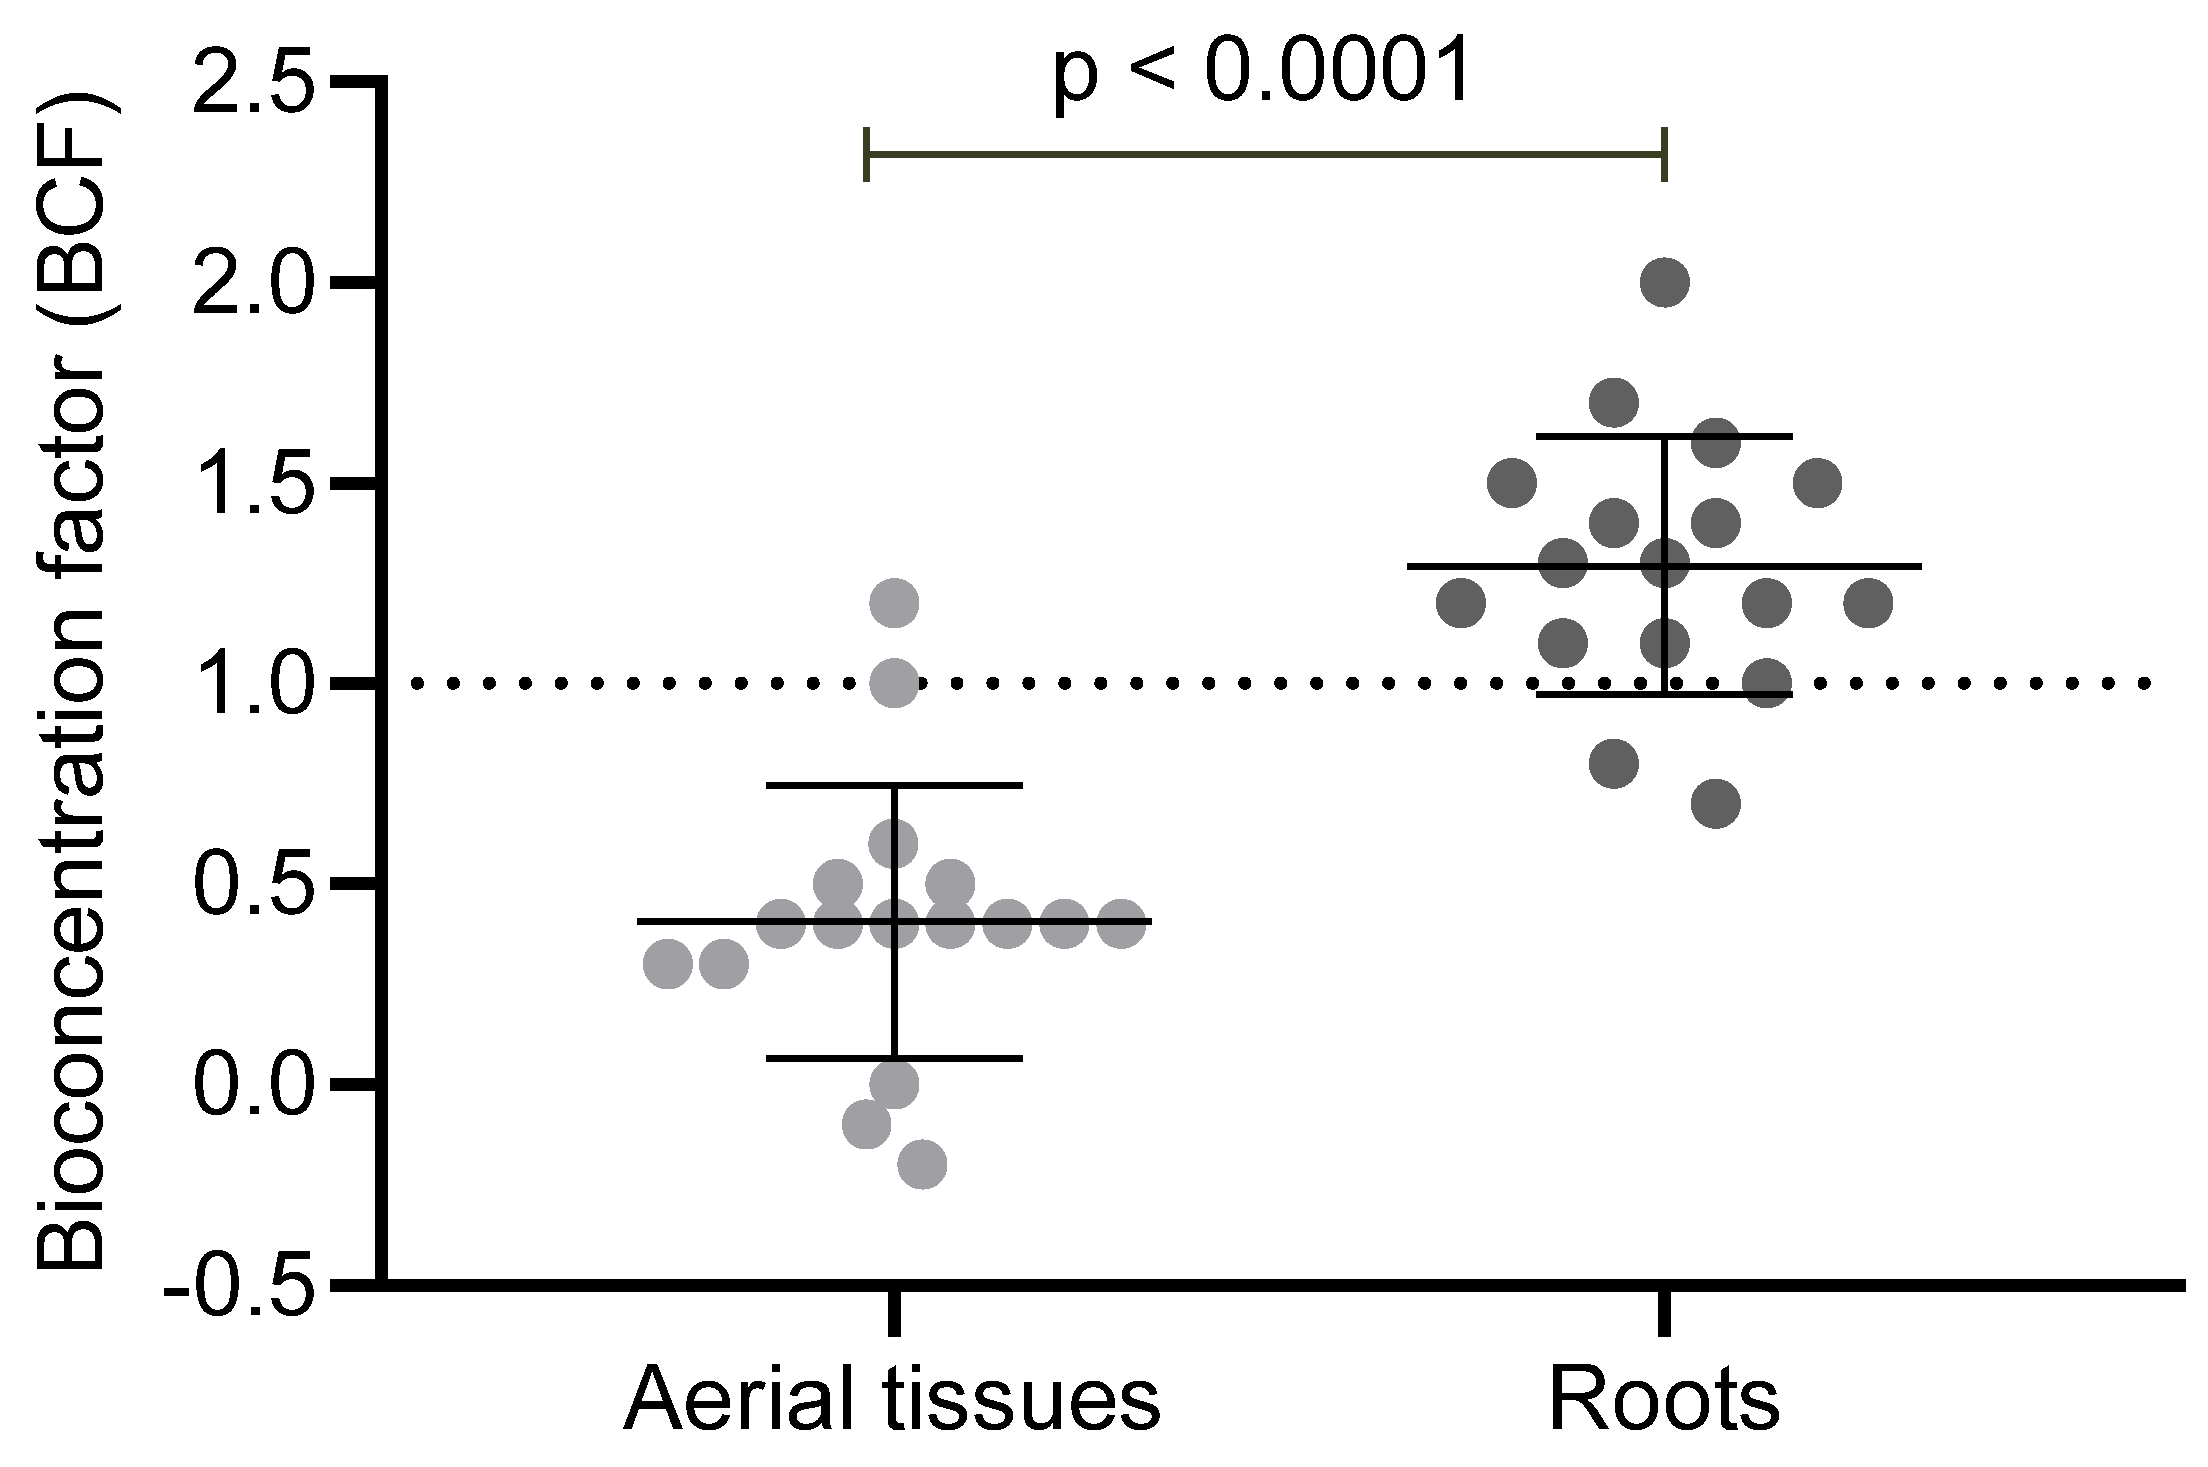
The mean THg concentrations in the aerial tissues were 4.2 ± 2.4 ng g−1 (2–11.9 ng g−1) and 30.3 ± 9.6 ng g−1 (17.7–49.2 ng g−1) in the roots. The bioconcentration factor (BCF) was significantly different between the macrophyte tissues (Wilcoxon: W = −153, p < 0.0001) (Figure 2). In the aerial tissues, the BCF was greater than one only in 12% of the samples (n = 2), ranging from −0.2 to 1.2 (0.41 ± 0.34). In contrast, the roots had a BCF greater than one in 88% of the samples (n = 15), ranging from 0.7 to 2.0 (1.29 ± 0.32). The translocation factor (TF) varied between 0.06 and 0.35 (0.14 ± 0.06), indicating limited translocation of Hg between roots and aerial tissues.

3.3. Association between THg Concentrations, Environmental Conditions, and Land Use and Cover

The first two axes of the PCA explained 65.14% of the variation in the data (Figure 3, Table S2). The main variables positively correlated with Axis 1 were THg concentrations in water, pH, and LUI. In contrast, the main variables correlated negatively with Axis 1 were DO and the percentage of wetlands. THg concentrations in both macrophyte tissues were also negatively correlated with Axis 1. In Axis 2, the main variables were sulfate concentrations in the water and THg concentrations in the aerial tissues and roots of the macrophytes (negative correlation). There was no clear distinction between the lakes associated with the Araguaia River and its tributaries. However, the highest concentrations of THg in the macrophytes’ roots were determined in a lake located in the vicinity of the urban area of the Luiz Alves municipality (Figure 1 and Figure 3). The Kaiser–Meyer–Olkin criterion (KMO = 0.669) and Bartlett’s test of sphericity (χ2(36) = 64.98, p = 0.002) confirmed the suitability of our dataset for the application of PCA.

3.4. Spatial Distribution of THg Concentrations in Water and Bioconcentration and Translocation Factors in Macrophytes

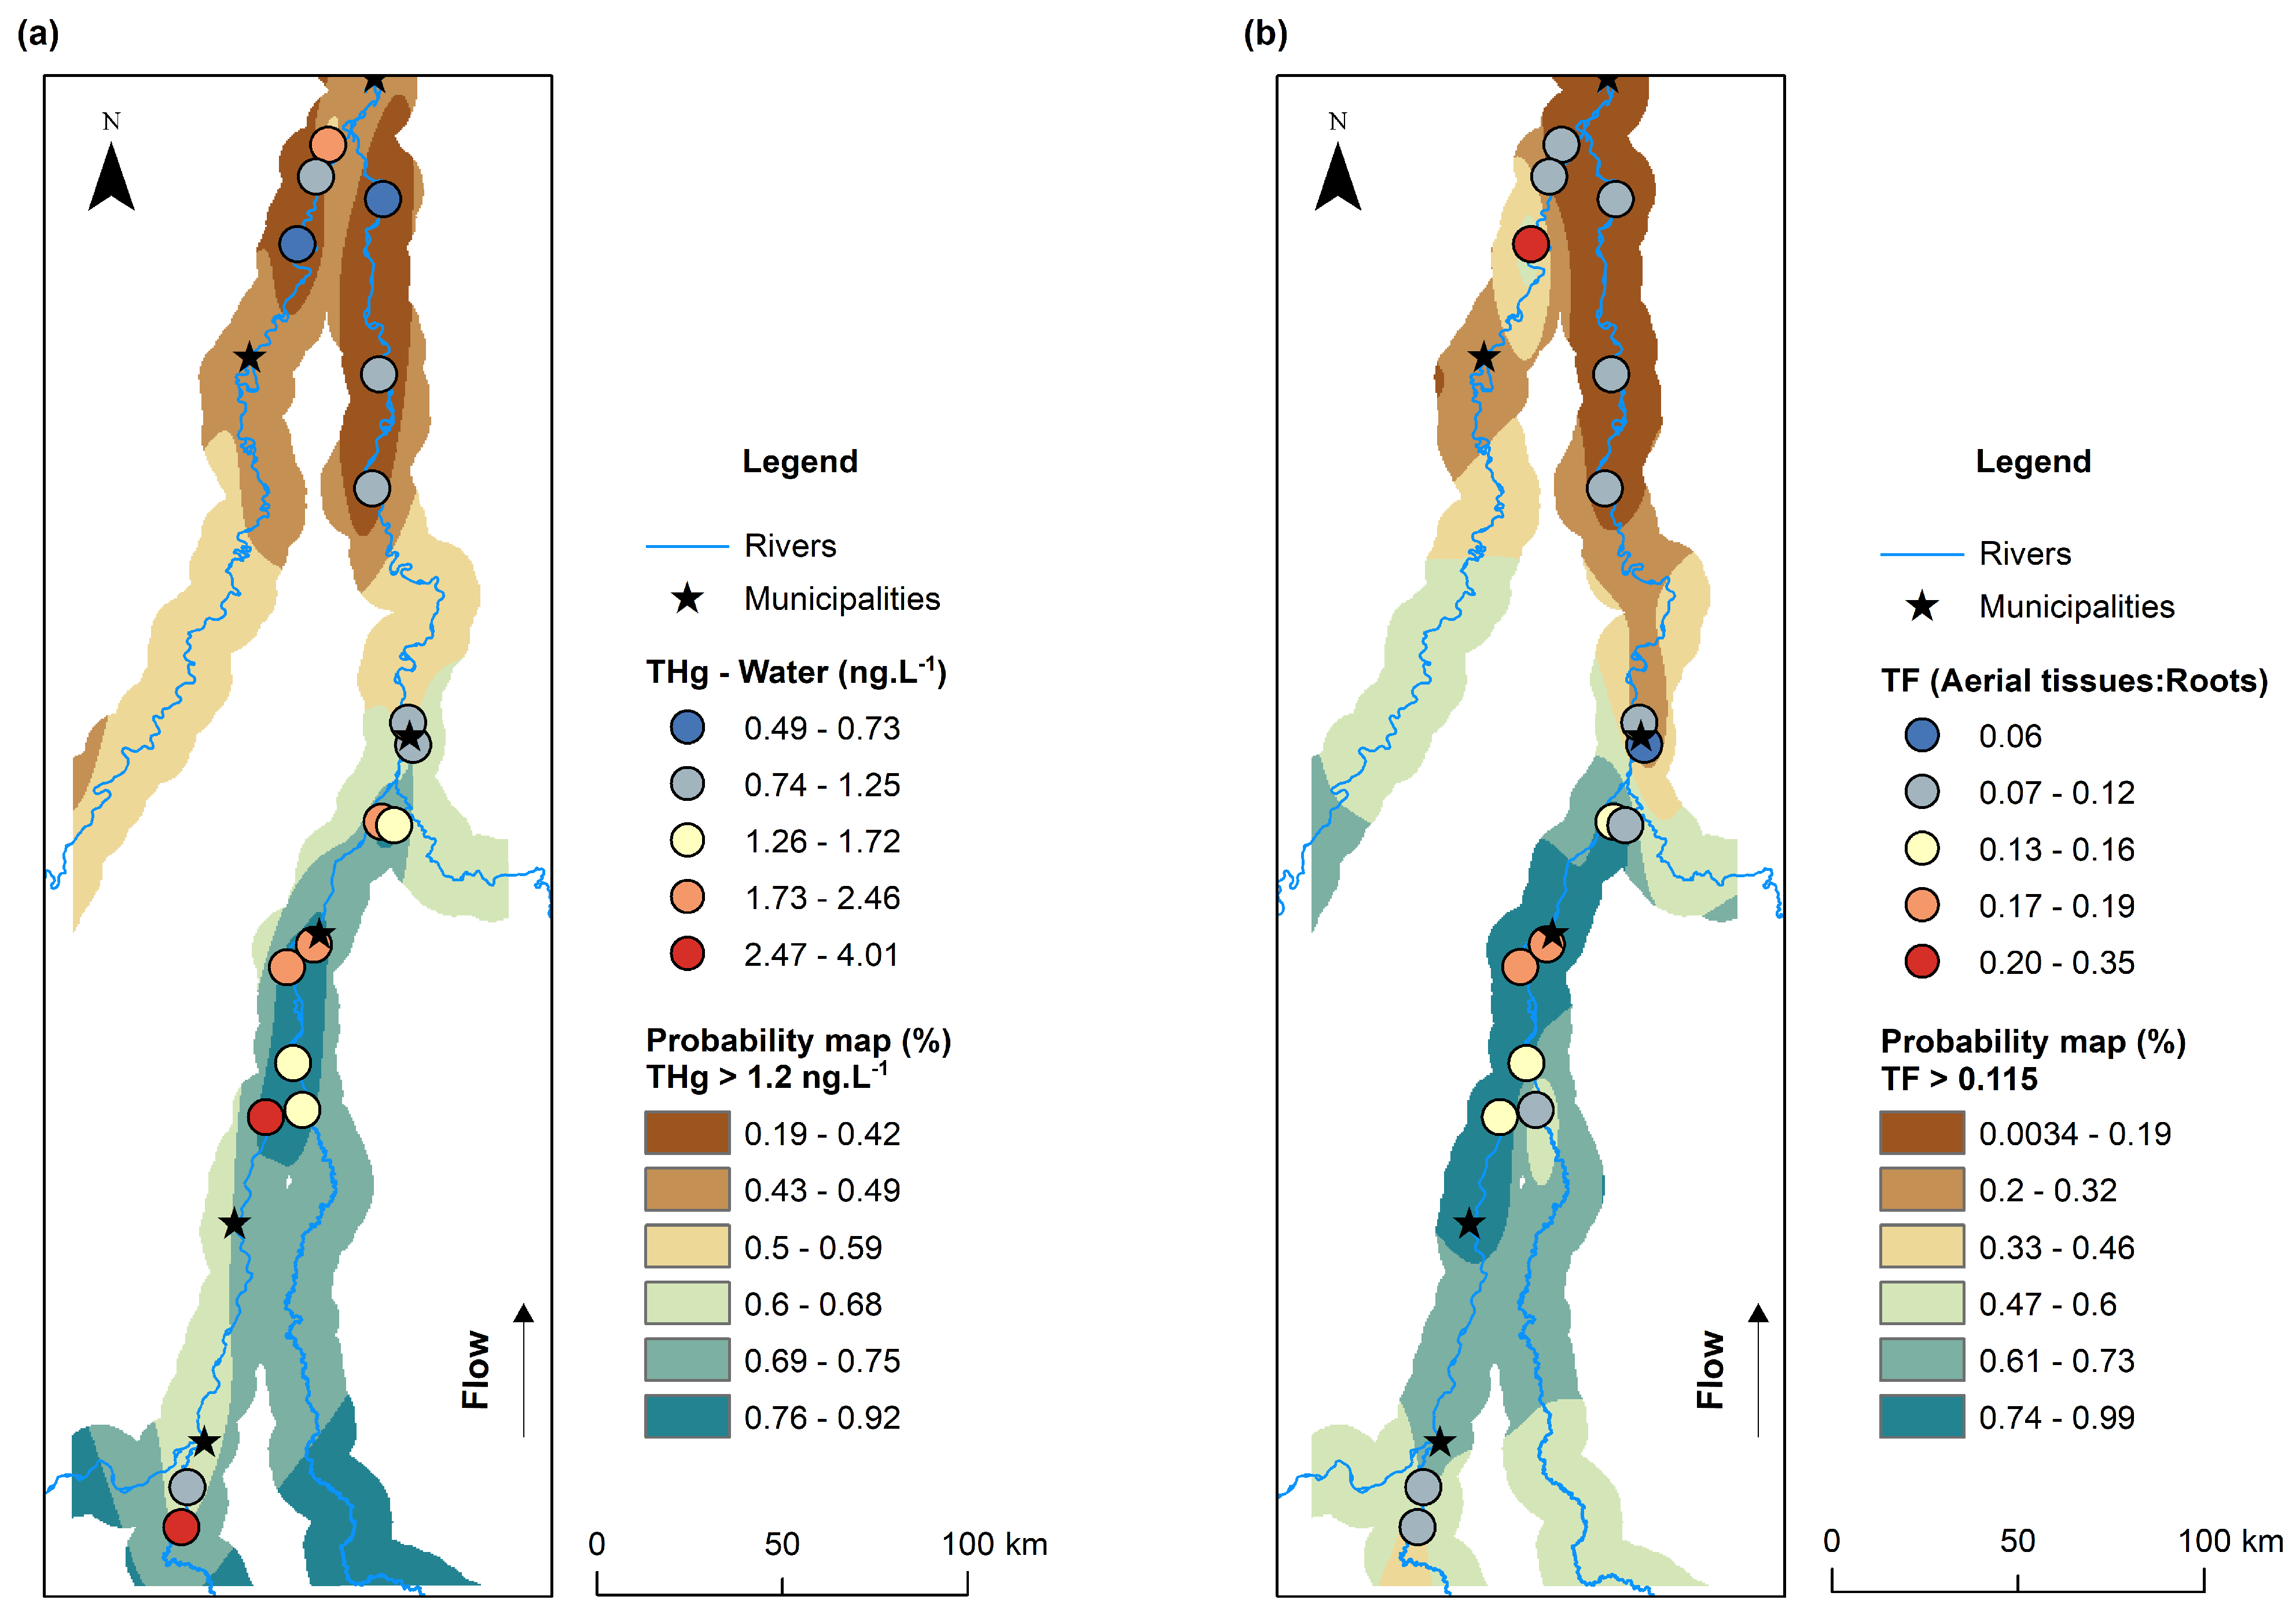
Indicator kriging (IK) showed that the sampling sites located in the southern section of the floodplain (upstream) have greater probabilities of THg concentrations in the water above the local background established from the lakes with less intense land use (>1.2 ng L−1, 69–92%) (Figure 4a). The lowest probabilities (19–49%) were identified in the northern section (downstream). THg concentrations in water reach long distances (~300 km), with a linear behavior, showing a rapid response from one point to another. THg in the water showed moderate spatial dependence (39%), indicating the influence of exogenous factors.
TF and BCF (aerial and root tissues) showed strong spatial dependence (<25%) and virtually zero randomness (nugget effect = 0). The highest probabilities of THg translocation between roots and aerial tissues were identified in the central section of our study area (61–99%), close to the municipalities of Aruanã, Cocalinho, and Bandeirantes (Figure 4b). TF showed hybrid behavior, varying over short and long distances, indicating the presence of structures varying at different scales. Thus, TF has a local and heterogeneous range (~80 km).
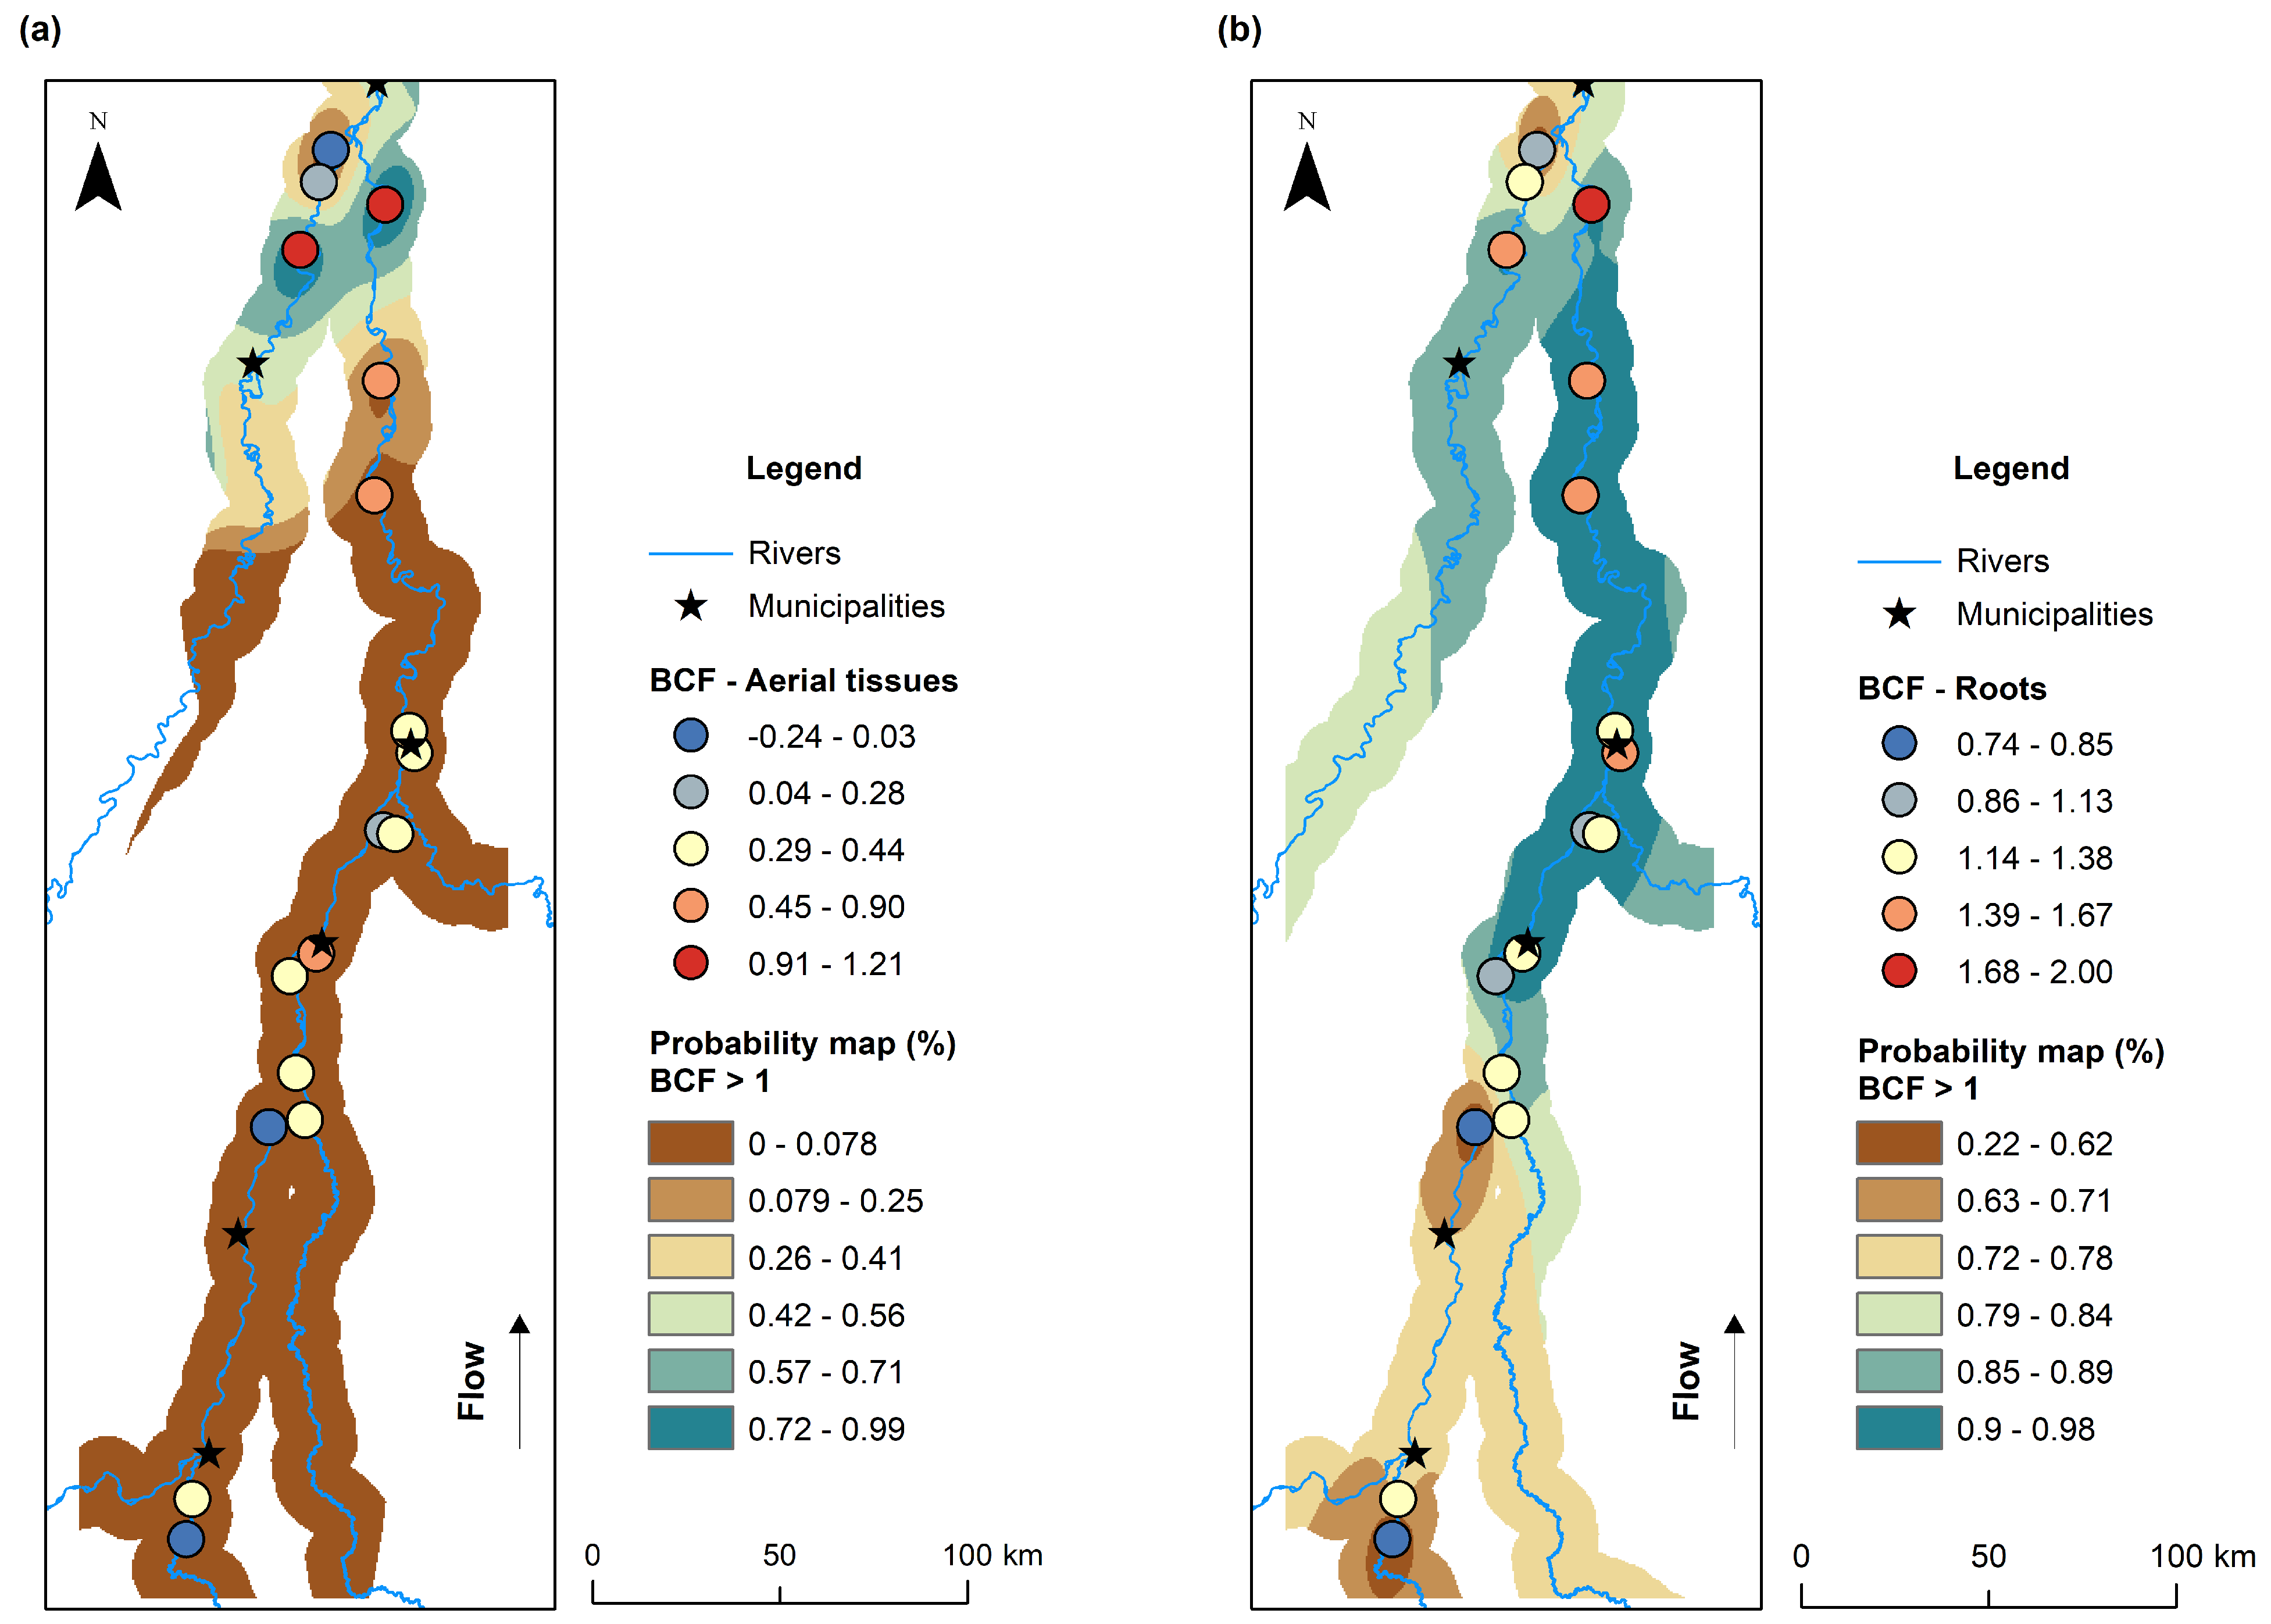
The BCF determined in aerial tissues showed a higher probability of positive bioconcentration (BCF > 1) downstream of our study area (57–99%) in lakes associated with the Araguaia and Mortes rivers (Figure 5a). The probabilities are practically zero upstream (0–8%). The BCF model for aerial tissues is far from the origin of the spatial amplitude, varying over distances up to 80 km.
The BCF determined in the roots also showed a higher probability of positive bioconcentration downstream (Figure 5b). However, high probabilities were also determined near the cities (Bandeirantes and Luiz Alves) and the confluence with the Peixe and Crixás rivers (85–98%). The lowest probabilities of BCF > 1 in the roots were found upstream, including the Vermelho River (22–78%). The BCF of the roots has a rapid response close to the origin but with the greatest amplitude among the variables (310 km). This pattern indicates that the BCF of the roots has greater regionality and homogeneity.
All the variables have a moderately positive correlation with anisotropy, with a greater spatial trend at an angle of 10° NE (the direction with the greatest spatial continuity), corresponding to the direction of the Araguaia River drainage. Cross-validation determined that all the IK models presented satisfactory results (unbiased), with RMSSE equal to one and ME close to zero. The parameters of the experimental variograms and the cross-validation results are available in the Supplementary Material (Table S3, Figure S1).

4. Discussion

4.1. Influence of Land Use and pH on THg Concentrations in Water

Our results indicated that THg concentrations in the water covaried positively with the land use intensity in the lakes’ vicinity and the water’s pH (Figure 3). The relationship between THg in the water and the land use intensity was confirmed by indicator kriging, with the highest concentrations determined in the southern section of the study area (upstream), characterized by the predominance of pasture and the occurrence of human settlements (Figure 4a). In addition, THg in the water showed moderate spatial dependence, reinforcing the influence of exogenous factors on its environmental distribution (e.g., land use). Thus, the concentration of THg in the water is a suitable indicator of anthropogenic changes in land use. Large-scale deforestation for cattle ranching and agricultural activities is the principal anthropogenic impact around our sampling sites, occupying proportions of up to 65% of the landscape within a 10 km radius from the lakes (Figure 1, Table 1). Deforestation directly affects the soil’s physical properties, intensifying laminar erosion and compaction [49,50]. Pasture areas contribute approximately half of the total water erosion caused by agricultural activities in Brazil [51]. Hence, soil erosion and compaction result in increased transport of Hg bound to particulate matter into aquatic ecosystems [52] and higher sedimentation rates in floodplain lakes [53].
Along these lines, a study conducted on the Araguaia River floodplain indicated a positive relationship between the land use intensity, the transport of particulate matter (turbidity), and THg concentrations in lacustrine bottom sediments [22]. Considering that the total Hg concentrations in water (dissolved and particulate) are controlled by the THg concentration of suspended particles [54,55], the association between THg in water and land use intensity should be amplified in the collection period of our study (high water). The Araguaia River has a high load of suspended sandy sediments, especially during high water [56]. Thus, the lateral flow of water promoted by the flood pulse favors the transport of Hg bound to particulate material between the main channel of the river and the connected lakes [57].
The degree of land use intensity can also indirectly affect THg concentrations in water through changes in pH. During the rainy season, soil erosion and rock weathering alter the concentrations of ions in the water column through surface runoff, raising the alkalinity of the water [52,58]. We observed a positive relationship between THg in water and pH. However, the pH values were relatively homogeneous between the sampling sites (6 to 7.4; CV = 7.4%). Increasing pH alters the number of ligands available in the aqueous medium through the adsorption of cations and the desorption of anions [59]; hence, greater pH values facilitate mercury adsorption on suspended particulate matter [60]. Therefore, the transport of Hg bound to particulate matter into the lakes and the pH of the water close to neutral might favor the immobilization of Hg in the water column in the lakes upstream of our study area.

4.2. Bioconcentration, Translocation, and the Influence of Environmental Conditions on THg Accumulation in Macrophytes

The Paspalum repens samples showed significantly higher THg bioconcentration levels in the roots compared to the aerial tissues (Figure 2). The limitation of translocation between plant tissues was confirmed by TF, with values substantially below one in all samples. Thus, P. repens individuals are not recommended for Hg phytoremediation in our study area. However, the preference for THg accumulation in the roots indicates the Hg phytostabilization potential of this species [61]. The strong spatial dependence of BCF and TF indicated by kriging suggests that endogenous factors control the spatial distribution of Hg in macrophytes, such as the different Hg uptake pathways intrinsic to the morphological and physiological characteristics of P. repens.
Macrophytes of the P. repens species are attached to the substrate through their roots and have submerged cylindrical and hollow stems up to 2 m long, allowing the leaves to float [62,63]. Thus, the aerial tissues absorb Hg mainly from the water column, while the roots are exposed to Hg through the water and the bottom sediment, increasing the uptake of this element. Since Hg has no physiological function in aquatic plants, its accumulation in the roots does not necessarily imply translocation to the aerial tissues [64]. Additionally, in floodplains, P. repens mats are subjected to rapid variations in water level between hydrological periods so that stem growth occurs continuously to allow for leaf fluctuation [65]. Thus, the continuous growth may imply the process of Hg biodilution, characterized by limiting the accumulation of chemical elements due to biomass growth [66,67].
Albeit limited, the indicator kriging showed that the most substantial translocation potential occurs upstream of our study area, where the highest degree of land use intensity and the highest THg concentrations in the water were determined (Figure 4). In contrast, the highest BCF values were determined in the wetlands downstream (Figure 5). This pattern was confirmed by PCA, indicating that the interaction between the physicochemical parameters of the water (sulfate, DO, and ORP) implies higher concentrations of Hg in the macrophytes collected from lakes with higher proportions of surrounding wetlands. Therefore, the macrophytes were not sensitive to the higher concentrations of THg in the water. This result is in accordance with a study carried out in floodplain lakes of the Orinoco River in the Venezuelan Amazon, where the species P. repens showed no significant difference in the accumulation of potentially toxic chemical elements between polluted and natural lakes [68]. However, it is important to note that the highest concentration of THg in the macrophytes’ roots was determined in the lake adjacent to the Luiz Alves municipality. Although, in general, the human settlements in our study area occupy small areas on a landscape scale (0–0.3%, Table 1), the lack of domestic wastewater treatment [27] and the atmospheric emissions by motor vehicle traffic [69] might represent a source of Hg on a local scale.
The interaction between the biogeochemical cycles of Hg and sulfur (S) is also a critical factor in the bioavailability of Hg in aquatic ecosystems. The PCA results indicated an association between THg concentrations in the macrophytes and sulfate concentrations in the water. THg concentrations in macrophytes were also positively associated, to a lesser extent, with DO and ORP and inversely ordered with pH (Figure 3), indicating two potential pathways for the availability of Hg to macrophytes. The association with DO and ORP may indicate the oxidation of sulfite to sulfate, intensifying the mineralization of organic matter and mobilizing Hg from the bottom sediments into the water column [70,71].
On the other hand, sulfate reduction is the main mechanism for methyl-Hg (MeHg) formation in aquatic ecosystems with higher sulfate concentrations [72]. The roots of P. repens macrophytes represent a critical substrate for the colonizing of periphytic communities in wetlands [35,73]. In addition to the high methylation rates in the associated periphyton [15,35,73], bacterial activity in the roots can increase THg concentrations in this compartment [74]. Therefore, depending on the environmental conditions, sulfate acts as an electron acceptor for anaerobic sulfate-reducing bacteria, so higher concentrations of sulfate result in higher rates of Hg methylation [13,75]. Indeed, macrophytes of the genus Paspalum showed high methylation rates compared to the bottom sediments of floodplain lakes [12]. In this context, despite the positive association with DO, DO concentrations were relatively low in our set of lakes, ranging from 1.0 to 3.3 mg L−1 (Table 1). This range of dissolved oxygen concentrations is consistent with those determined during the flooding period in the Amazon and Pantanal floodplains, identified as essential sources of MeHg for river basins [76,77,78]. The anoxic and reducing conditions created by the low concentrations of dissolved oxygen in the water column favor the methylation process by the complexation of the methyl group of decomposing organic matter with inorganic Hg (Hg2+) [79]. Thus, the relatively low dissolved oxygen concentrations can increase the availability of Hg for macrophytes.
The inverse relationship with pH can be explained by the input of allochthonous organic matter rich in humic and fulvic acids typical of flooded areas [80], increasing the acidity of the water [81] and the mobilization of Hg into the aquatic biota [82,83]. Accordingly, the inverse spatial distribution pattern between THg concentrations in water and macrophytes suggests the dissolution of Hg bound to particulate material and the uptake of dissolved Hg by aquatic plants [84]. The pH also affects the methylation process, so that acidic conditions increase the uptake of Hg2+ by the cells of methylating microorganisms, regardless of the concentrations of dissolved organic matter (direct effect) [85], in addition to reducing the complexation of Hg with dissolved organic matter, increasing its bioavailability to microbial methylators (indirect effect) [86]. In contrast, high pH values favor the demethylation of Hg [87]. Hence, a study conducted in the laboratory indicated that pH values between 6 and 7, as determined in our study area, stimulated Hg methylation in the floating macrophyte Eichhornia crassipes [88]. Therefore, the negative association with pH and the positive relationship with wetlands and sulfate concentrations in the water indicate the potential of macrophytes as indicators of sites that are favorable to Hg methylation.

5. Conclusions

The bioconcentration potential of THg in P. repens was significantly higher in the roots than in the aerial tissues, with low translocation potential between plant tissues. The preference for THg accumulation in the roots indicates the phytostabilization potential of this species. However, it was not a suitable species for phytoremediation. The principal component analysis, variogram analysis, and probability maps showed two patterns controlling the distribution of THg in the water and macrophytes of our study area. The highest concentrations of THg in the water were determined upstream of our study area, a region characterized by a higher degree of land use intensity and a pH close to neutral, indicating the transport of Hg bound to particulate matter into the lakes and the immobilization of Hg in the water column. In contrast, wetlands were priority points for the bioconcentration of THg in macrophytes.
Although P. repens is not a suitable bioindicator of Hg mobilization by anthropogenic land use in our study area, our results suggest the potential of macrophytes as bioindicators of priority sites for Hg methylation. To confirm this hypothesis, we recommend that future studies evaluate MeHg concentrations in the aquatic ecosystems of the Araguaia River floodplain. Additionally, considering that macrophytes present different ecological groups that reflect the degree of adaptation of the species to the aquatic environment, future studies should evaluate the distribution of THg and MeHg in different macrophyte species.

Supplementary Materials

The following supporting information can be downloaded at: https://www.mdpi.com/article/10.3390/w16091199/s1. Table S1. Proportions of land use and land cover classes around the lakes (%). Table S2. Loadings of axes 1 and 2 of the PCA. Table S3. Variogram parameters and cross-validation. The variogram parameters are represented in meters. Figure S1. Experimental variograms representing the models: (a) THg in water; (b) translocation factor in macrophytes; (c) bioconcentration in aerial tissues; and (d) bioconcentration in roots.

Author Contributions

Conceptualization: L.C.M., L.C.G.V. and J.V.E.B. Methodology: L.C.M., L.C.G.V., J.V.E.B. and Y.O.S.R. Formal analysis: L.C.M. and Y.O.S.R. Investigation, L.C.M., L.C.G.V., J.P.R.d.S., G.S., I.A.d.S.O. and C.d.S.C. Resources: L.C.G.V., J.V.E.B., J.F.G.J., J.R.d.S. and W.R.B. Writing—original draft preparation: L.C.M., Y.O.S.R., L.P.B.d.M. and G.S. Writing—review and editing: L.C.G.V., J.V.E.B., J.P.R.d.S., J.F.G.J., J.R.d.S. and W.R.B. Visualization: L.C.M. Supervision: L.C.G.V. and J.V.E.B. Project administration: L.C.G.V. and J.V.E.B. Funding acquisition: L.C.M., L.C.G.V., J.V.E.B. and J.F.G.J. All authors have read and agreed to the published version of the manuscript.

Funding

This study received financial support from the Fundação de Apoio à Pesquisa do Distrito Federal (FAPDF) (Edital 04/2021; Nº 00193-00001567/2021-80), Decanato de Pesquisa e Inovação (DPI) of the University of Brasília (UnB) (Edital UnB DPI/DPG N° 02/2021), Tropical Water Research Alliance (TWRA) and Fundação de Amparo à Pesquisa do Estado de Goiás (FAPEG) (Araguaia Vivo 2030, conv. P&D&I TWRA/FAPEG 03/2023, Nº 202210267000536), National Institute of Science and Technology (INCT) in Ecology, Evolution, and Biodiversity Conservation (CNPq Nº 465610/2014-5 and FAPEG Nº 201810267000023), and Fundo Brasileiro para a Biodiversidade (FUNBIO), Instituto Humanize, and Eurofins Foundation (Programa de Bolsas FUNBIO 2021; Nº 017/2022). LCM was supported by Coordenação de Aperfeiçoamento de Pessoal de Nível Superior (CAPES, Finance Code 001) master’s scholarship, and LCGV was supported by Conselho Nacional de Desenvolvimento Científico e Tecnológico (CNPq) research grant.

Data Availability Statement

The raw data supporting the conclusions of this article will be made available by the authors on request.

Acknowledgments

The authors thank the Tropical Water Research Alliance (TWRA) and the National Institute of Science and Technology in Ecology, Evolution, and Biodiversity Conservation (INCT EECBio) for financial and logistical support during sample collection. We also thank the “Araguaia Vivo 2022” team for collecting the macrophytes and Priscilla de Carvalho for macrophytes’ taxonomic identification.

Conflicts of Interest

The authors declare no conflicts of interest.

References

  1. Ziegler, J.P.; Solomon, C.T.; Finney, B.P.; Gregory-Eaves, I. Macrophyte biomass predicts food chain length in shallow lakes. Ecosphere 2015, 6, 1–16. [Google Scholar] [CrossRef]
  2. Nõges, T.; Luup, H.; Feldmann, T. Primary production of aquatic macrophytes and their epiphytes in two shallow lakes (Peipsi and Võrtsjärv) in Estonia. Aquat. Ecol. 2010, 44, 83–92. [Google Scholar] [CrossRef]
  3. Brothers, S.M.; Hilt, S.; Meyer, S.; Köhler, J. Plant community structure determines primary productivity in shallow, eutrophic lakes. Freshw. Biol. 2013, 58, 2264–2276. [Google Scholar] [CrossRef]
  4. Holmroos, H.; Horppila, J.; Niemistö, J.; Nurminen, L.; Hietanen, S. Dynamics of dissolved nutrients among different macrophyte stands in a shallow lake. Limnology 2015, 16, 31–39. [Google Scholar] [CrossRef]
  5. Lu, J.; Bunn, S.E.; Burford, M.A. Nutrient release and uptake by littoral macrophytes during water level fluctuations. Sci. Total Environ. 2018, 622, 29–40. [Google Scholar] [CrossRef] [PubMed]
  6. Madsen, J.D.; Chambers, P.A.; James, W.F.; Koch, E.W.; Westlake, D.F. The interaction between water movement, sediment dynamics and submersed macrophytes. Hydrobiologia 2001, 444, 71–84. [Google Scholar] [CrossRef]
  7. Lopes, T.M.; Cunha, E.R.; Silva, J.C.B.; Behrend, R.D.; Gomes, L.C. Dense macrophytes influence the horizontal distribution of fish in floodplain lakes. Environ. Biol. Fishes 2015, 98, 1741–1755. [Google Scholar] [CrossRef]
  8. Alvim, E.A.; Kisaka, T.B.; Nardoto, G.B.; de Mendonca-Galvao, L.; Fonseca, B.M.; Bustamante, M.M. Trophic relationships between primary producers and associated fauna in a pristine Cerrado pond. J. Limnol. 2019, 78, 310–322. [Google Scholar] [CrossRef]
  9. Polechońska, L.; Klink, A. Macrophytes as passive bioindicators of trace element pollution in the aquatic environment. Wiley Interdiscip. Rev. Water 2023, 10, e1630. [Google Scholar] [CrossRef]
  10. Branfireun, B.A.; Cosio, C.; Poulain, A.J.; Riise, G.; Bravo, A.G. Mercury cycling in freshwater systems—An updated conceptual model. Sci. Total Environ. 2020, 745, 140906. [Google Scholar] [CrossRef]
  11. Regier, N.; Larras, F.; Bravo, A.G.; Ungureanu, V.G.; Amouroux, D.; Cosio, C. Mercury bioaccumulation in the aquatic plant Elodea nuttallii in the field and in microcosm: Accumulation in shoots from the water might involve copper transporters. Chemosphere 2013, 90, 595–602. [Google Scholar] [CrossRef]
  12. Guimaraes, J.R.D.; Meili, M.; Hylander, L.D.; e Silva, E.D.C.; Roulet, M.; Mauro, J.B.N.; de Lemos, R.A. Mercury net methylation in five tropical flood plain regions of Brazil: High in the root zone of floating macrophyte mats but low in surface sediments and flooded soils. Sci. Total Environ. 2000, 261, 99–107. [Google Scholar] [CrossRef]
  13. Bravo, A.G.; Cosio, C.; Amouroux, D.; Zopfi, J.; Chevalley, P.A.; Spangenberg, J.E.; Ungureanu, V.G.; Dominik, J. Extremely elevated methyl mercury levels in water, sediment and organisms in a Romanian reservoir affected by release of mercury from a chlor-alkali plant. Water Res. 2014, 49, 391–405. [Google Scholar] [CrossRef]
  14. Gomez, F.H.; Collivignarelli, M.C.; Masoud, A.M.N.; Carnevale Miino, M.; Torres, K.C.; Quintero, J.A.; Sorlini, S.; Vaccari, M. Mercury Removal from Mining Wastewater by Phytoaccumulation in Autochthonous Aquatic Plant Species. Clean Technol. 2023, 5, 839–851. [Google Scholar] [CrossRef]
  15. Correia, R.R.S.; de Oliveira, D.C.M.; Guimarães, J.R.D. Total mercury distribution and volatilization in microcosms with and without the aquatic macrophyte Eichhornia crassipes. Aquat. Geochem. 2012, 18, 421–432. [Google Scholar] [CrossRef]
  16. Bonanno, G.; Vymazal, J.; Cirelli, G.L. Translocation, accumulation and bioindication of trace elements in wetland plants. Sci. Total Environ. 2018, 631, 252–261. [Google Scholar] [CrossRef]
  17. Cintrón, M.L.B.; Broomandi, P.; Cárdenas-Escudero, J.; Cáceres, J.O.; Galán-Madruga, D. Elucidating Best Geospatial Estimation Method Applied to Environmental Sciences. Bull. Environ. Contam. Toxicol. 2024, 112, 6. [Google Scholar] [CrossRef]
  18. Rodrigues, Y.O.S.; Dórea, J.G.; Landim, P.M.B.; Bernardi, J.V.E.; Monteiro, L.C.; Souza, J.P.R.; Pinto, L.C.M.; Fernandes, I.O.; Souza, J.V.V.; Sousa, A.R.; et al. Mercury spatiality and mobilization in roadside soils adjacent to a savannah ecological reserve. Environ. Res. 2022, 205, 112513. [Google Scholar] [CrossRef]
  19. Yevugah, L.L.; Osei Jnr, E.M.; Bak, J.L.; Nkansah, M.A.; Darko, G. Geospatial distribution of mercury in surface soils across Ghana. Chem. Afr. 2023, 6, 3119–3129. [Google Scholar] [CrossRef]
  20. Forsythe, K.W.; Marvin, C.H.; Valancius, C.J.; Watt, J.P.; Aversa, J.M.; Swales, S.J.; Jakubek, D.J.; Shaker, R.R. Geovisualization of Mercury Contamination in Lake St. Clair Sediments. J. Mar. Sci. Eng. 2016, 4, 19. [Google Scholar] [CrossRef]
  21. Kim, S.M.; Choi, Y.; Yi, H.; Park, H.D. Geostatistical prediction of heavy metal concentrations in stream sediments considering the stream networks. Environ. Earth Sci. 2017, 76, 72. [Google Scholar] [CrossRef]
  22. Monteiro, L.C.; Vieira, L.C.G.; Bernardi, J.V.E.; Moraes, L.C.; Rodrigues, Y.O.S.; de Souza, J.P.R.; Souza, J.R.; Bastos, W.R.; Passos, C.J.S.; Dórea, J.G. Ecological risk of mercury in bottom sediments and spatial correlation with land use in Neotropical savanna floodplain lakes, Araguaia River, Central Brazil. Environ. Res. 2023, 238, 117231. [Google Scholar] [CrossRef]
  23. Myers, N.; Mittermeier, R.A.; Mittermeier, C.G.; Fonseca, G.A.; Kent, J. Biodiversity hotspots for conservation priorities. Nature 2000, 403, 853–858. [Google Scholar] [CrossRef]
  24. Bayer, M.; Assis, P.C.; Suizu, T.M.; Gomes, M.C. Mudança no uso e cobertura da terra na bacia hidrográfica do rio Araguaia e seus reflexos nos recursos hídricos, o trecho médio do rio Araguaia em Goiás. Confins Rev. Fr.-Brésilienne Geogr. 2020, 48, 48. [Google Scholar] [CrossRef]
  25. Teixeira, A.S.; Vieira, L.C.G.; Souza, C.A.; Bernardi, J.V.E.; Monteiro, L.C. Evidence of water surface and flow reduction in the main hydrographic basin of the Brazilian savannah (Cerrado biome): The Araguaia river. Hydrobiologia 2024, 851, 2503–2518. [Google Scholar] [CrossRef]
  26. Monteiro, L.C.; Vieira, L.C.G.; Bernardi, J.V.E.; Bastos, W.R.; Souza, J.P.R.; Recktenvald, M.C.N.N.; Nery, A.F.C.; Oliveira, I.A.S.; Cabral, C.S.; Moraes, L.C.; et al. Local and landscape factors influencing mercury distribution in water, bottom sediment, and biota from lakes of the Araguaia River floodplain, Central Brazil. Sci. Total Environ. 2024, 908, 168336. [Google Scholar] [CrossRef]
  27. Alvares, C.A.; Stape, J.L.; Sentelhas, P.C.; Gonçalves, J.D.M.; Sparovek, G. Köppen’s climate classification map for Brazil. Meteorol. Z. 2013, 22, 711–728. [Google Scholar] [CrossRef]
  28. Gomes, E.P.; Blanco, C.J.C.; Pessoa, F.C.L. Identification of homogeneous precipitation regions via Fuzzy c-means in the hydrographic region of Tocantins–Araguaia of Brazilian Amazonia. Appl. Water Sci. 2019, 9, 6. [Google Scholar] [CrossRef]
  29. Junk, W.J.; Piedade, M.T.F.; Lourival, R.; Wittmann, F.; Kandus, P.; Lacerda, L.D.; Bozelli, R.L.; Esteves, F.A.; Nundes da Cunha, C.; Maltchik, L.; et al. Brazilian wetlands: Their definition, delineation, and classification for research, sustainable management, and protection. Aquat. Conserv. Mar. Freshw. Ecosyst 2014, 24, 5–22. [Google Scholar] [CrossRef]
  30. Aquino, S.; Latrubesse, E.M.; de Souza Filho, E.E. Caracterização hidrológica e geomorfológica dos afluentes da Bacia do Rio Araguaia. Rev. Bras. Geomorfol. 2009, 10, 43–54. [Google Scholar] [CrossRef]
  31. Irion, G.; Nunes, G.M.; Nunes da Cunha, C.; de Arruda, E.C.; Santos-Tambelini, M.; Dias, A.P.; Morais, J.O.; Junk, W.J. Araguaia river floodplain: Size, age, and mineral composition of a large tropical savanna wetland. Wetlands 2016, 36, 945–956. [Google Scholar] [CrossRef]
  32. Latrubesse, E.M.; Amsler, M.L.; de Morais, R.P.; Aquino, S. The geomorphologic response of a large pristine alluvial river to tremendous deforestation in the South American tropics: The case of the Araguaia River. Geomorphology 2009, 113, 239–252. [Google Scholar] [CrossRef]
  33. Arruda, E.C.; Nunes da Cunha, C.; Junk, W.J. Área Alagável do Rio Araguaia: Classificação dos Macrohabitat de uma Grande Área Úmida Savânica Tropical. Biodivers. Bras. 2023, 13, 1–24. [Google Scholar] [CrossRef]
  34. Moraes, L.; Bernardi, J.V.E.; de Souza, J.P.R.; Portela, J.F.; Vieira, L.C.G.; Sousa Passos, C.J.; de Souza, J.R.; Bastos, W.R.; Monteiro, L.C.; Rodrigues, Y.O.S.; et al. Sediment Mercury, Geomorphology and Land Use in the Middle Araguaia River Floodplain (Savanna Biome, Brazil). Soil Syst. 2023, 7, 97. [Google Scholar] [CrossRef]
  35. Coelho-Souza, S.A.; Guimarães, J.R.D.; Miranda, M.R.; Poirier, H.; Mauro, J.B.; Lucotte, M.; Mergler, D. Mercury and flooding cycles in the Tapajós river basin, Brazilian Amazon: The role of periphyton of a floating macrophyte (Paspalum repens). Sci. Total Environ. 2011, 409, 2746–2753. [Google Scholar] [CrossRef]
  36. U. S. EPA—Environment Protection Agency. Method 1631, Revision E: Mercury in Water by Oxidation, Purge and Trap, and Cold Vapor Atomic Fluorescence Spectrometry; U. S. EPA: Washington, DC, USA, 2002; 45p.
  37. Arnot, J.A.; Gobas, F.A. A review of bioconcentration factor (BCF) and bioaccumulation factor (BAF) assessments for organic chemicals in aquatic organisms. Environ. Rev. 2006, 14, 257–297. [Google Scholar] [CrossRef]
  38. Stoltz, E.; Greger, M. Accumulation properties of As, Cd, Cu, Pb and Zn by four wetland plant species growing on submerged mine tailings. Environ. Exp. Bot. 2002, 47, 271–280. [Google Scholar] [CrossRef]
  39. MapBiomas Project. Coleção 8 da Série Anual de Mapas de Cobertura e Uso da Terra do Brasil. 2023. Available online: https://plataforma.brasil.mapbiomas.org (accessed on 11 January 2024).
  40. Marcionilio, S.M.L.O.; Machado, K.B.; Carneiro, F.M.; Ferreira, M.E.; Carvalho, P.; Vieira, L.C.G.; Moraes, V.L.; Nabout, J.C. Environmental factors affecting chlorophyll-a concentration in tropical floodplain lakes, Central Brazil. Environ. Monit. Assess. 2016, 188, 611. [Google Scholar] [CrossRef]
  41. Ometto, J.P.H.; Martinelli, L.A.; Ballester, M.V.; Gessner, A.; Krusche, A.V.; Victoria, R.L.; Williams, M. Effects of land use on water chemistry and macroinvertebrates in two streams of the Piracicaba river basin, south-east Brazil. Freshw. Biol. 2001, 44, 327–337. [Google Scholar] [CrossRef]
  42. R Core Team. R: A Language and Environment for Statistical Computing. 2023. Available online: https://www.R-project.org (accessed on 11 January 2024).
  43. Bernardi, J.V.E.; Neira, M.P.; Manzatto, A.G.; De Holanda, I.B.B.; Almeida, R.; Bastos, W.R.; Dórea, J.G.; Landim, P.M.B.; Vieira, L.C.G. Aplicação da análise geoestatística para modelagem espacial do mercúrio e matéria orgânica em solos florestais na Amazônia Ocidental. Front. J. Soc. Technol. Environ. Res. 2015, 4, 31–46. [Google Scholar] [CrossRef]
  44. Goovaerts, P. Geostatistics for NATURAL Resources Evaluation; Oxford University Press: Oxford, UK, 1997; 496p, ISBN 01-9511-538-4. [Google Scholar]
  45. Cambardella, C.A.; Moorman, T.B.; Novak, J.M.; Parkin, T.B.; Karlen, D.L.; Turco, R.F.; Konopka, A.E. Field-scale variability of soil properties in central Iowa soils. Sci. Soc. Am. J. 1994, 58, 1501–1511. [Google Scholar] [CrossRef]
  46. Lininger, K.B.; Latrubesse, E.M. Flooding hydrology and peak discharge attenuation along the middle Araguaia River in central Brazil. Catena 2016, 143, 90–101. [Google Scholar] [CrossRef]
  47. Malvić, T.; Bastaić, B. Reducing variogram uncertainties using the ‘jack-knifing’ method, a case study of the Stari Gradac–Barcs-Nyugat field. Bull. Hung. Geol. Soc. 2008, 138, 165–174. [Google Scholar]
  48. Arétouyap, Z.; Njandjock Nouck, P.; Nouayou, R.; Ghomsi Kemgang, F.E.; Piépi Toko, A.D.; Asfahani, J. Lessening the adverse effect of the semivariogram model selection on an interpolative survey using kriging technique. SpringerPlus 2016, 5, 549. [Google Scholar] [CrossRef] [PubMed]
  49. Oliveira, E.R.D.; Silva, J.R.; Baumann, L.R.F.; Miziara, F.; Ferreira, L.G.; Merelles, L.R.D.O. Tecnologia e degradação de pastagens na pecuária no Cerrado brasileiro. Soc. Nat. 2022, 32, 585–596. [Google Scholar] [CrossRef]
  50. Lima, A.F.L.; Campos, M.C.C.; Enck, B.F.; Simões, W.S.; Araújo, R.M.; Santos, L.A.C.; Cunha, J.M. Physical soil attributes in areas under forest/pasture conversion in northern Rondônia, Brazil. Environ. Monit. Assess. 2022, 194, 34. [Google Scholar] [CrossRef] [PubMed]
  51. Merten, G.H.; Minella, J.P. The expansion of Brazilian agriculture: Soil erosion scenarios. Int. Soil Water Conserv. Res. 2013, 1, 37–48. [Google Scholar] [CrossRef]
  52. Lacerda, L.D.; Bastos, W.R.; Almeida, M.D. The impacts of land use changes in the mercury flux in the Madeira River, Western Amazon. An. Acad. Bras. Ciênc. 2012, 84, 69–78. [Google Scholar] [CrossRef] [PubMed]
  53. Godoy, J.M.; Padovani, C.R.; Guimarães, J.R.D.; Pereira, J.C.; Vieira, L.M.; Carvalho, Z.L.; Galdino, S. Evaluation of the siltation of River Taquari, Pantanal, Brazil, through 210Pb geochronology of floodplain lake sediments. J. Braz. Chem. Soc. 2002, 13, 71–77. [Google Scholar] [CrossRef]
  54. Roulet, M.; Lucotte, M.; Canuel, R.; Farella, N.; Goch, Y.G.F.; Peleja, J.R.P.; Guimarães, J.R.D.; Mergler, D.; Amorim, M. Spatio-temporal geochemistry of mercury in waters of the Tapajós and Amazon rivers, Brazil. Limnol. Oceanogr. 2001, 46, 1141–1157. [Google Scholar] [CrossRef]
  55. Lino, A.S.; Kasper, D.; Guida, Y.S.; Thomaz, J.R.; Malm, O. Total and methyl mercury distribution in water, sediment, plankton and fish along the Tapajós River basin in the Brazilian Amazon. Chemosphere 2019, 235, 690–700. [Google Scholar] [CrossRef] [PubMed]
  56. Aquino, S.; Latrubesse, E.; Bayer, M. Assessment of wash load transport in the Araguaia River (Aruana gauge station), Central Brazil. Lat. Am. J. Sedimentol. Basin Anal. 2009, 16, 119–128. [Google Scholar]
  57. Maia, P.D.; Maurice, L.; Tessier, E.; Amouroux, D.; Cossa, D.; Pérez, M.; Moreira-Turcq, P.; Rhéault, I. Mercury distribution and exchanges between the Amazon River and connected floodplain lakes. Sci. Total Environ. 2009, 407, 6073–6084. [Google Scholar] [CrossRef] [PubMed]
  58. Attua, E.M.; Ayamga, J.; Pabi, O. Relating land use and land cover to surface water quality in the Densu River basin, Ghana. Int. J. River Basin Manag. 2014, 12, 57–68. [Google Scholar] [CrossRef]
  59. Kocman, D.; Kanduč, T.; Ogrinc, N.; Horvat, M. Distribution and partitioning of mercury in a river catchment impacted by former mercury mining activity. Biogeochemistry 2011, 104, 183–201. [Google Scholar] [CrossRef]
  60. Córdoba-Tovar, L.; Marrugo-Negrete, J.; Barón, P.A.R.; Calao-Ramos, C.R.; Díez, S. Toxic metal (loids) levels in the aquatic environment and nuclear alterations in fish in a tropical river impacted by gold mining. Environ. Res. 2023, 224, 115517. [Google Scholar] [CrossRef]
  61. Lago-Vila, M.; Arenas-Lago, D.; Rodríguez-Seijo, A.; Andrade, M.L.; Vega, F.A. Ability of Cytisus scoparius for phytoremediation of soils from a Pb/Zn mine: Assessment of metal bioavailability and bioaccumulation. J. Environ. Manag. 2019, 235, 152–160. [Google Scholar] [CrossRef] [PubMed]
  62. Pott, V.J.; Pott, A. Plantas Aquáticas do Pantanal; Embrapa Comunicação para Transferência de Tecnologia: Brasília, Brazil, 2000; 404p, ISBN 85-7383-091-3. [Google Scholar]
  63. Amaral, M.C.E.; Bittrich, V.; Faria, A.D.; Anderson, L.O.; Aona, L.Y.S. Guia de Campo para Plantas Aquáticas e Palustres do Estado de São Paulo; Holos Editora: Ribeirão Preto, Brasil, 2008; 452p, ISBN 85-8669-964-0. [Google Scholar]
  64. Núñez, S.R.; Negrete, J.M.; Rios, J.A.; Hadad, H.R.; Maine, M.A. Hg, Cu, Pb, Cd, and Zn accumulation in macrophytes growing in tropical wetlands. Water Air Soil Pollut. 2011, 216, 361–373. [Google Scholar] [CrossRef]
  65. Colonnello, G. Biomass production of Eichhornia crassipes and Paspalum repens in two contrasting environment of the Orinoco River delta (Venezuela). Int. Ver. Theor. Angew. Limnol. Verhandlungen 1998, 26, 1827–1829. [Google Scholar] [CrossRef]
  66. Aula, I.; Braunschweiler, H.; Malin, I. The watershed flux of mercury examined with indicators in the Tucurui reservoir in Para, Brazil. Sci. Total Environ. 1995, 175, 97–107. [Google Scholar] [CrossRef]
  67. Polechońska, L.; Samecka-Cymerman, A.; Dambiec, M. Changes in growth rate and macroelement and trace element accumulation in Hydrocharis morsus-ranae L. during the growing season in relation to environmental contamination. Environ. Sci. Pollut. Res. 2017, 24, 5439–5451. [Google Scholar] [CrossRef] [PubMed]
  68. Narayan, A.; Mora, A.; Sánchez, L.; Rosales, J. Temporal and spatial variability of heavy metals in bottom sediments and the aquatic macrophyte Paspalum repens of the Orinoco River floodplain lagoons impacted by industrial activities. Environ. Sci. Pollut. Res. 2020, 27, 37074–37086. [Google Scholar] [CrossRef] [PubMed]
  69. Dórea, J.G.; Monteiro, L.C.; Bernardi, J.V.E.; Fernandes, I.O.; Oliveira, S.F.B.; de Souza, J.P.R.; Rodrigues, Y.O.S.; Vieira, L.C.G.; Souza, J.R. Land use impact on mercury in sediments and macrophytes from a natural lake in the Brazilian savanna. Environ. Pollut. 2023, 337, 122414. [Google Scholar] [CrossRef] [PubMed]
  70. Frohne, T.; Rinklebe, J.; Langer, U.; Du Laing, G.; Mothes, S.; Wennrich, R. Biogeochemical factors affecting mercury methylation rate in two contaminated floodplain soils. Biogeosciences 2012, 9, 493–507. [Google Scholar] [CrossRef]
  71. Myrbo, A.; Swain, E.B.; Johnson, N.W.; Engstrom, D.R.; Pastor, J.; Dewey, B.; Monson, P.; Brenner, J.; Shore, M.D.; Peters, E.B. Increase in nutrients, mercury, and methylmercury as a consequence of elevated sulfate reduction to sulfide in experimental wetland mesocosms. J. Geophys. Res. Biogeosciences 2017, 122, 2769–2785. [Google Scholar] [CrossRef]
  72. Yu, R.Q.; Reinfelder, J.R.; Hines, M.E.; Barkay, T. Syntrophic pathways for microbial mercury methylation. ISME J. 2018, 12, 1826–1835. [Google Scholar] [CrossRef]
  73. Mauro, J.; Guimaraes, J.; Hintelmann, H.; Watras, C.; Haack, E.; Coelho-Souza, S. Mercury methylation in macrophytes, periphyton, and water–comparative studies with stable and radio-mercury additions. Anal. Bioanal. Chem. 2002, 374, 983–989. [Google Scholar] [CrossRef] [PubMed]
  74. Souza, M.P.; Huang, C.P.A.; Chee, N.; Terry, N. Rhizosphere bacteria enhance the accumulation of selenium and mercury in wetland plants. Planta 1999, 209, 259–263. [Google Scholar] [CrossRef] [PubMed]
  75. Canredon, A.; Anschutz, P.; Buquet, D.; Charbonnier, C.; Amouroux, D.; Tessier, E.; Poirier, D.; Bujan, S.; Devaux, L.; Gouillieux, B.; et al. Lake sediment mercury biogeochemistry controlled by sulphate input from drainage basin. Appl. Geochem. 2019, 104, 135–145. [Google Scholar] [CrossRef]
  76. Lázaro, W.L.; Díez, S.; da Silva, C.J.; Ignácio, Á.R.; Guimarães, J.R. Waterscape determinants of net mercury methylation in a tropical wetland. Environ. Res. 2016, 150, 438–445. [Google Scholar] [CrossRef]
  77. Brito, B.C.; Forsberg, B.R.; Kasper, D.; Amaral, J.H.; Vasconcelos, M.R.; Sousa, O.P.; Cunha, F.A.G.; Bastos, W.R. The influence of inundation and lake morphometry on the dynamics of mercury in the water and plankton in an Amazon floodplain lake. Hydrobiologia 2017, 790, 35–48. [Google Scholar] [CrossRef]
  78. Kasper, D.; Forsberg, B.R.; Amaral, J.H.; Py-Daniel, S.S.; Bastos, W.R.; Malm, O. Methylmercury modulation in Amazon rivers linked to basin characteristics and seasonal flood-pulse. Environ. Sci. Technol. 2017, 51, 14182–14191. [Google Scholar] [CrossRef]
  79. Pestana, I.A.; Azevedo, L.S.; Bastos, W.R.; de Souza, C.M.M. The impact of hydroelectric dams on mercury dynamics in South America: A review. Chemosphere 2019, 219, 546–556. [Google Scholar] [CrossRef]
  80. Silva, G.S.D.; Bisinoti, M.C.; Fadini, P.S.; Magarelli, G.; Jardim, W.F.; Fostier, A.H. Major aspects of the mercury cycle in the Negro River Basin, Amazon. J. Braz. Chem. Soc. 2009, 20, 1127–1134. [Google Scholar] [CrossRef]
  81. Zhang, T.; Zhou, L.; Zhou, Y.; Zhang, Y.; Guo, J.; Han, Y.; Zhang, Y.; Hu, L.; Jang, K.S.; Spencer, R.G.M.; et al. Terrestrial dissolved organic matter inputs accompanied by dissolved oxygen depletion and declining pH exacerbate CO2 emissions from a major Chinese reservoir. Water Res. 2024, 251, 121155. [Google Scholar] [CrossRef]
  82. Wang, R.; Wong, M.H.; Wang, W.X. Mercury exposure in the freshwater tilapia Oreochromis niloticus. Environ. Pollut. 2010, 158, 2694–2701. [Google Scholar] [CrossRef] [PubMed]
  83. Jardine, T.D.; Kidd, K.A.; O’Driscoll, N. Food web analysis reveals effects of pH on mercury bioaccumulation at multiple trophic levels in streams. Aquat. Toxicol. 2013, 132, 46–52. [Google Scholar] [CrossRef]
  84. Wang, S.; Xing, D.; Jia, Y.; Li, B.; Wang, K. The distribution of total mercury and methyl mercury in a shallow hypereutrophic lake (Lake Taihu) in two seasons. Appl. Geochem. 2012, 27, 343–351. [Google Scholar] [CrossRef]
  85. Kelly, C.A.; Rudd, J.W.; Holoka, M.H. Effect of pH on mercury uptake by an aquatic bacterium: Implications for Hg cycling. Environ. Sci. Technol. 2003, 37, 2941–2946. [Google Scholar] [CrossRef] [PubMed]
  86. Ravichandran, M. Interactions between mercury and dissolved organic matter—A review. Chemosphere 2004, 55, 319–331. [Google Scholar] [CrossRef]
  87. Wang, S.; Zhang, M.; Li, B.; Xing, D.; Wang, X.; Wei, C.; Jia, Y. Comparison of mercury speciation and distribution in the water column and sediments between the algal type zone and the macrophytic type zone in a hypereutrophic lake (Dianchi Lake) in Southwestern China. Sci. Total Environ. 2012, 417, 204–213. [Google Scholar] [CrossRef] [PubMed]
  88. Mauro, J.B.; Guimarães, J.R.D.; Melamed, R. Mercury methylation in a tropical macrophyte: Influence of abiotic parameters. Appl. Organomet. Chem. 1999, 13, 631–636. [Google Scholar] [CrossRef]
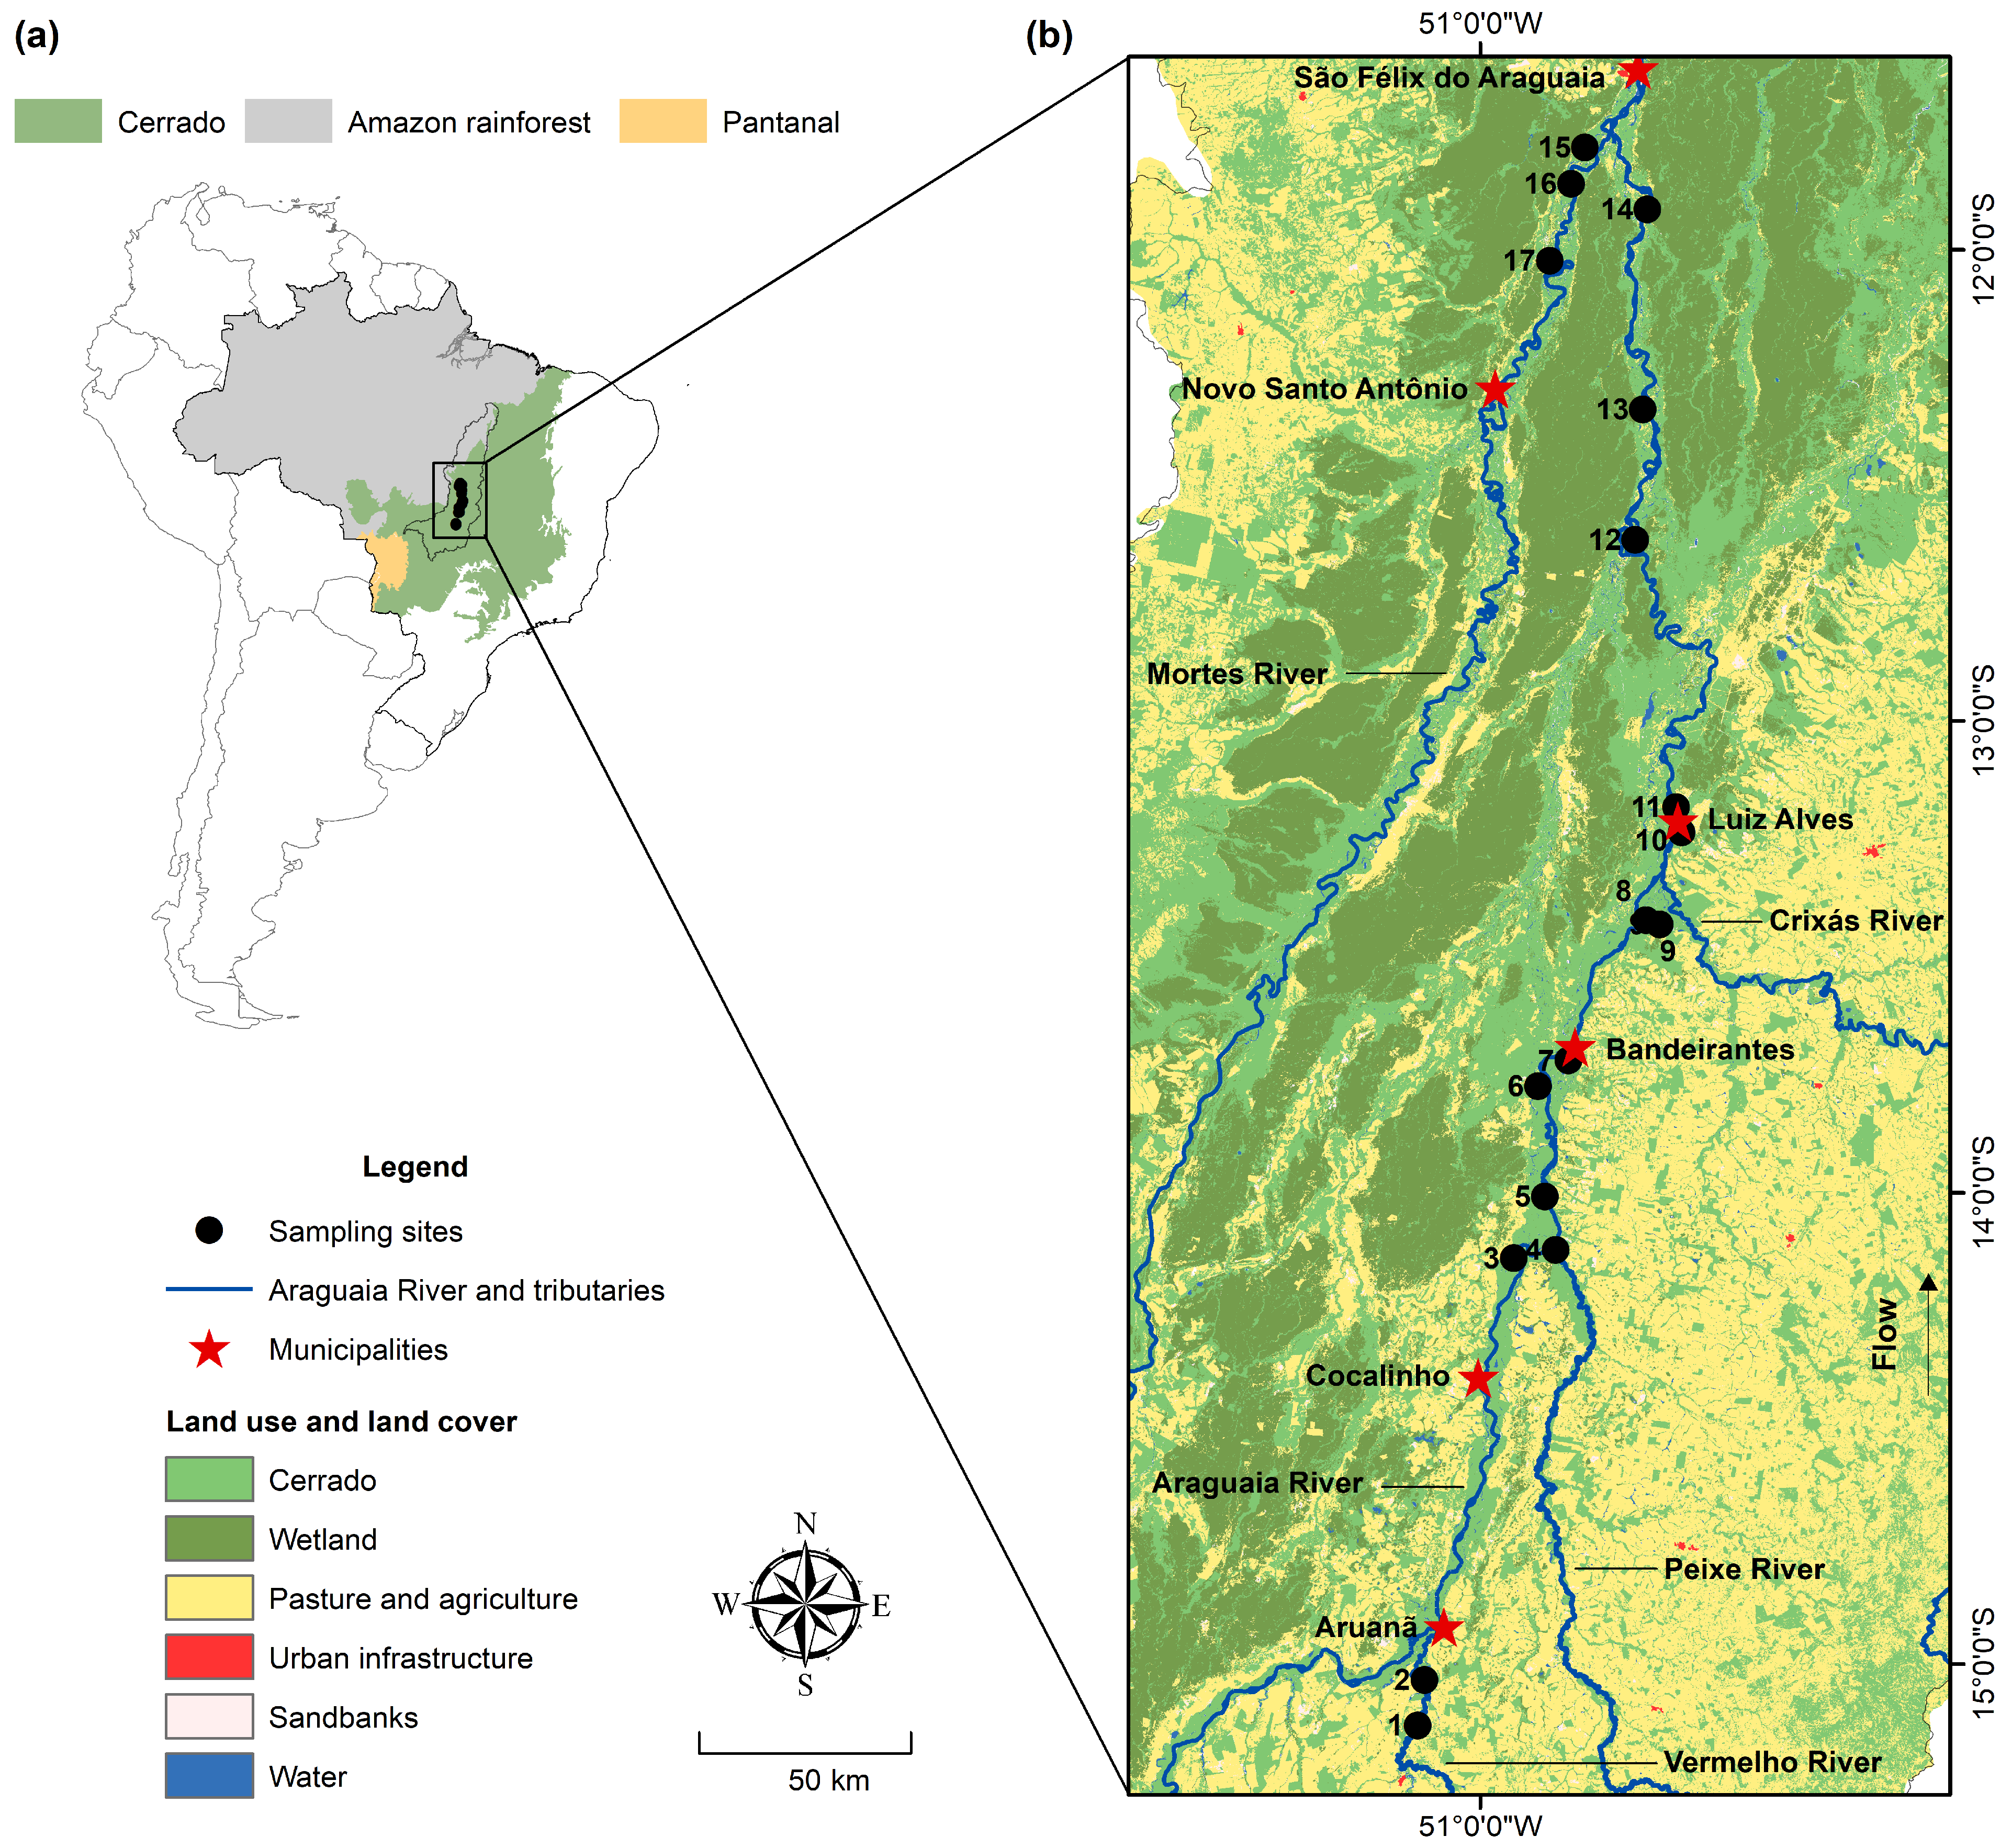
Figure 1. Location of the study area indicating (a) the location of the Araguaia River basin with emphasis on the Cerrado, Amazon rainforest and Pantanal biomes; and (b) an enlargement of the study area indicating the sampling sites, municipalities and land use and cover classes. Cerrado: natural forest, savanna, and grassland formations (except natural wetlands).
Water 16 01199 g001
Figure 2. Difference in the Hg bioconcentration factor between the aerial tissues (stem and leaves) and roots of P. repens (Wilcoxon: W = −153, p < 0.0001). The dashed line represents the cut-off value indicating the positive bioconcentration process.
Water 16 01199 g002
Figure 3. Bivariate plot showing the ordering of variables and sampling sites according to the PCA results (Axes 1 and 2).
Water 16 01199 g003
Figure 4. Probability map (indicator kriging) of (a) THg concentrations in water and (b) THg translocation factor in macrophytes.
Water 16 01199 g004
Figure 5. Probability map (indicator kriging) of THg bioconcentration factors in (a) aerial tissues and (b) roots.
Water 16 01199 g005
Table 1. Descriptive statistics of THg concentrations, physicochemical water parameters, and land use and cover (mean, standard deviation (SD), minimum (Min), maximum (Max), and coefficient of variation (CV)).
MeanSDMinMaxCV
[THg] Water (ng L−1)1.680.950.5457
Physicochemical water parameters
pH6.60.55.77.47
Oxidation–reduction potential (ORP, mV)209.942.915233720
Transparency (m)0.810.400.31.850
Depth (m)7.052.113.811.23
Turbidity (NTU)6.756.49021.496
Dissolved oxygen (OD, mg L−1)2.460.611.023.3325
Sulfate (mg L−1)0.01610.01650.0010.046102
Land use and cover (10 km)
Cerrado (%) *50.515.729.675.231.
Wetlands (%)20.821.41.756.1103
Pasture and agriculture (%)22.016.74.565.776
Urban infrastructure (%)0.050.100.3223
Land Use Index (LUI)44.333.49.0131.575
Note: * Cerrado: natural forest, savanna, and grassland formations (except natural wetlands).
Disclaimer/Publisher’s Note: The statements, opinions and data contained in all publications are solely those of the individual author(s) and contributor(s) and not of MDPI and/or the editor(s). MDPI and/or the editor(s) disclaim responsibility for any injury to people or property resulting from any ideas, methods, instructions or products referred to in the content.