Article

Impacts on Soil and Cowpea Plants Fertigated with Sanitary Sewage through Subsurface Drip Irrigation

by
Edcássio Dias Araújo
1,
Lucas Borges Ferreira
1,
Job Teixeira de Oliveira
2,
Alisson Carraro Borges
1 and
Fernando França da Cunha
1,*
1
Department of Agricultural Engineering (DEA), Federal University of Viçosa (UFV), Viçosa 36570-900, MG, Brazil
2
Campus of Chapadão do Sul (CPCS), Federal University of Mato Grosso do Sul (UFMS), Chapadão do Sul 79560-000, MS, Brazil
*
Author to whom correspondence should be addressed.
Water 2024, 16(9), 1194; https://doi.org/10.3390/w16091194
Submission received: 21 March 2024 / Revised: 17 April 2024 / Accepted: 19 April 2024 / Published: 23 April 2024

Abstract

:
The application of sanitary sewage using subsurface drip irrigation can mitigate current challenges related to water availability and food production. However, before implementing these techniques, it is crucial to conduct studies to assess their impacts on soil and plants. The objective of this study was to evaluate chemical changes in the soil and the development of cowpeas subjected to sanitary sewage applied by drippers with different flow rates and installation depths. Drippers were positioned at various depths (0 to 30 cm) and operated with flow rates of 1.6 and 3.8 L h−1. Cowpeas were cultivated in pots with clayey soil, using synthetic sanitary sewage based on the maximum limit of nitrogen fertilization. Irrigation management was controlled in terms of soil moisture, which was monitored using TDR probes. The results indicated that reducing the depth of the drippers positively affected grain production and the development of cowpeas. Fertigation with sanitary sewage at greater depths increased soil phosphorus concentrations and base saturation. Dripper depth also influenced soil concentrations of phosphorus, potassium, calcium, and magnesium, while sodium concentrations decreased with greater depth. It is concluded that dripper flow rates did not impact soil chemical parameters or the agronomic characteristics of cowpeas. However, despite nutrient supply at greater depths, the subsurface drip irrigation system proved unsuitable for cowpea production in clayey soil.

1. Introduction

The increasing scarcity of water for irrigation has become a critical issue globally, particularly in arid and semi-arid regions. The United Nations has predicted that global demand for food will increase by 70%, and agricultural water consumption will rise by 19% by 2050 [1,2]. Therefore, it is crucial to conserve water for agriculture to ensure food security.
The disposal of sanitary sewage in agriculture is a sustainable way to provide water and nutrients to plants while recycling nutrients in the soil [3]. However, this disposal of sanitary sewage into the soil must be carefully managed, as uncontrolled application can lead to soil salinization, clay dispersion [4,5], and contamination of plants, humans, and the environment, especially when applied through methods such as sprinkler irrigation.
Sprinkler irrigation methods typically increase crop yields by applying large quantities of water and fertilizers; however, they do not promote water conservation or the preservation of the soil’s ecological environment [6,7]. Nevertheless, water and fertilizer conservation are crucial for agricultural development. In this context, surface drip irrigation (SDI) and subsurface drip irrigation (SSDI) are more effective alternatives. SDI and SSDI systems fall under the category of localized irrigation methods. These systems uniformly apply water directly to the plant root zone through emitters at frequent intervals [8]. With these systems, it is possible to provide water and nutrients close to the plant root system, leading to water savings and increased crop yields [9,10].
Moreover, SDI and SSDI facilitate the use of lower-quality water [11,12] since these systems exhibit high irrigation efficiency, minimizing water losses due to drift. This characteristic is crucial for the disposal of sanitary sewage in agriculture as it reduces the dispersion of pathogens, odors, and animal and human contact. Advantages related to cultivation and cultural practices include increased growth, yield, and production quality due to higher irrigation frequency and the deposition of less mobile nutrients near the root zone [13].
An important aspect to consider in these irrigation systems is the depth of dripper installation, as improper installation can affect the transport and distribution of moisture in the soil [14,15]. In general, soil nutrients and the roots of major crops are distributed primarily in the 0–20 cm soil layer. Therefore, a lack of water at this depth can impact mineralization and nutrient availability in the soil [16], especially for phosphorus (P) and potassium (K), whose movements in the soil primarily occur through diffusion [17]. In this context, changes in soil moisture dynamics, temperature, pH, and nutrients serve as effective indicators of soil quality [18].
Considering the importance of the safe disposal of sanitary sewage through drip irrigation, it is interesting to associate its study with crops of economic and social significance, such as cowpeas (Vigna unguiculate), primarily produced in the Northeast region of Brazil. This legume constitutes one of the main sources of plant protein, plays a crucial role in human nutrition and contributes significantly to employment and income generation. Currently, due to supply and demand issues exacerbated by the COVID-19 pandemic, the cost of cowpeas is significantly high in the market [19]. Furthermore, cowpeas are a short-cycle crop with low water and soil fertility requirements [20], making them a suitable alternative for areas with sanitary sewage disposal.
Given the current challenges of water availability versus food production, the study of alternative and more sustainable agricultural production techniques becomes essential. One such approach is the disposal of sanitary sewage through drip irrigation installed at different depths in cowpea cultivation. Thus, the objective of the present study was to assess the soil chemical changes and the development of cowpeas, specifically the BRS Tumucumaque cultivar, fertigated with synthetic sanitary sewage through drippers with different flow rates and installed at varying depths.

2. Materials and Methods

2.1. Local Experiment Conditions

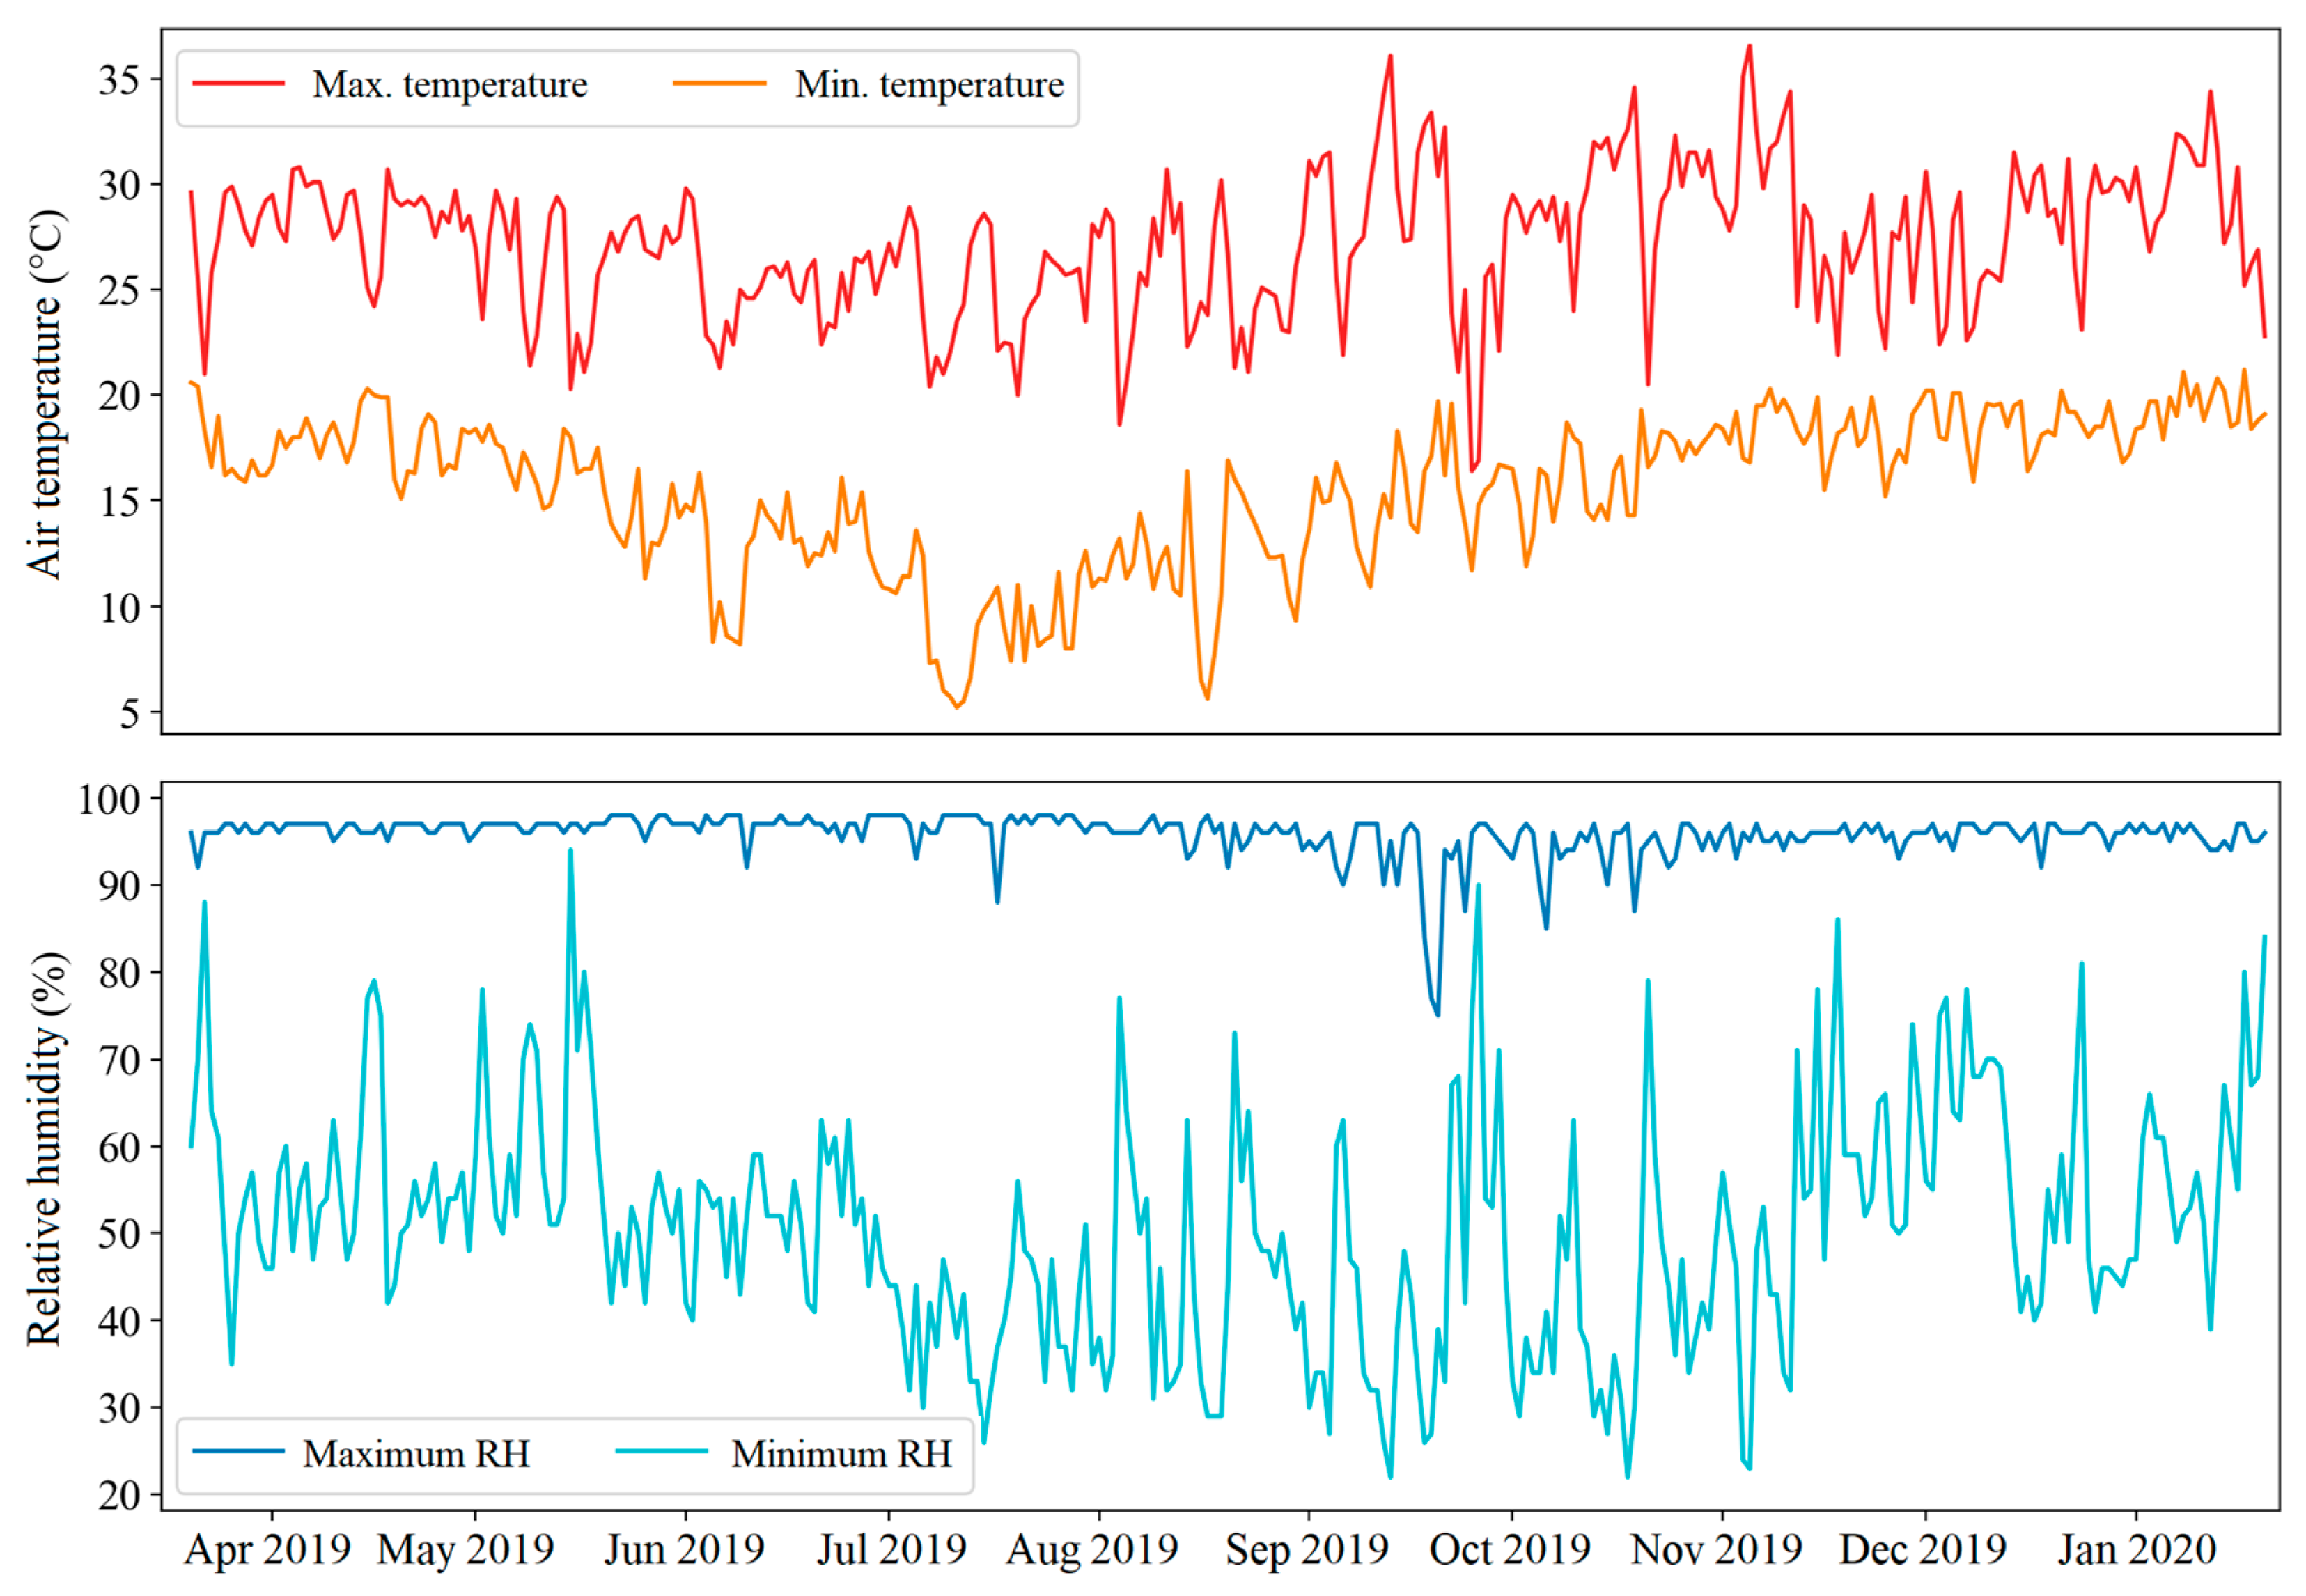
The experiment was conducted in a greenhouse located at the Laboratory of Hydraulic Engineering of the Department of Agricultural Engineering at the Federal University of Viçosa (UFV), situated in the municipality of Viçosa, MG, Brazil. The geographical coordinates are 20°46′18.97″ S, 42°52′28.19″ W, WGS-84 Datum, with an altitude of 651 m above sea level. The study period spanned from August 2019 to February 2020. Figure 1 depicts the variations in meteorological elements that occurred inside the greenhouse during the experimental period.

2.2. Treatments and Experimental Design

The experimental design was a randomized complete block design, with three replications, and the treatments were arranged in a split-plot scheme. The main plots consisted of emitters with different flow rates, and the subplots were composed of the depths of installation of the drip tubes.
The experimental plots consisted of emitters operating with flow rates of 1.6 L h−1 and 3.8 L h−1. The subplots were composed of the following depths of drip tube installation: 0 (surface drip irrigation), 5, 10, 15, 20, 25, and 30 cm (subsurface drip irrigation). The drippers used were the AmnonDrip PC AS model (self-compensating and anti-siphon) from the NaanDanJain® brand. The irrigation system was evaluated before the start of the experiments, and a Christiansen Uniformity Coefficient (CU) of 100% was found for both flow rates used [21].
The experimental units consisted of pots cultivated with cowpeas of the BRS Tumucumaque cultivar sown with uncertified commercial seeds of the first generation (S1). The pots had volumes of 65 L, with a height of 60.5 cm and bottom and top diameters of 30 and 44 cm, respectively. The pots were filled with soil to a height of 55 cm, leaving a 5.5 cm rim. The useful soil volume was 58.9 L, and the useful area at the soil level was 0.1434 m2.

2.3. Experimental Procedure

The soil used in the experiments was collected from the Experimental Area of Irrigation and Drainage of the Department of Agricultural Engineering at the Federal University of Viçosa (UFV). The soil was classified as dystrophic Red-Yellow Latosol [22], and its chemical and physico-hydric characteristics are presented in Table 1.
The collected soil was sieved through a 1-inch screen to prevent coarse materials from entering the pots, thereby minimizing the formation of preferential flow paths. Hoses were placed inside the pots, and they were filled with soil without altering the depth of the drip tube installation. Finally, before conducting the experiment with the disposal of sanitary sewage at different drip depths, other irrigation tests were conducted five months prior to the start of the experiment. This allowed the soil to settle in the pots, facilitating the initiation of the study by providing a well-structured soil environment.
To simulate sanitary sewage, a synthetic solution was used following the method described by Nopens et al. [23]. For the preparation of this solution, salts and ingredients were diluted in tap water. The compounds used for the preparation of synthetic sanitary sewage (SSS) are presented in Table 2.
The fertilization of cowpeas was calculated based on the results of the soil chemical analysis (Table 1). Initially, soil liming was performed with a dose of 100 g m−3 of limestone, equivalent to 320 kg ha−1 [24]. Soil fertility correction followed the recommendations of Melo et al. [25] to meet the nutritional demand of cowpeas: 6.7 g m−3 of N (20 kg ha−1), 20 g m−3 of P2O5 (60 kg ha−1), and 13.3 g m−3 of K2O (40 kg ha−1). All nitrogen and part of the potassium and phosphorus were applied via SSS, with nitrogen considered the limiting element [26]. The remaining phosphorus and potassium were applied during cowpea sowing (Table 3) in the form of single superphosphate and potassium chloride, respectively.
Sowing took place on 26 August 2019, with six cowpea seeds per pot planted at a depth of three centimeters. Later, only two plants per pot were retained. Applications of SSS began 24 days after sowing, with one application every 4 days, totaling 7 SSS applications or 8.26 L of SSS per pot (Table 3).
Irrigation management was carried out by considering the soil water balance. Daily monitoring of moisture was conducted by inserting time domain reflectometry (TDR) probes at five depths (7.5, 15, 22.5, 30, and 37.5 cm) on the sides of the pots. The surface drip irrigation treatment was used as a standard to calculate the water demand of the other treatments, thus standardizing the volume of water applied to all plots. The entire volume of applied SSS, calculated by the limiting element, was insufficient to meet the water demand throughout the cowpea cultivation cycle. Therefore, supplementation with good-quality water was carried out to replenish the water lost through evapotranspiration in the pots.

2.4. Experimental Evaluations

2.4.1. Productive Components and CO2 and Water Emissions

Net CO2 exchange rate soil (NCER) and water vapor flux assessments were conducted when all treatments were in the reproductive phase using an infrared gas analyzer (IRGA, model LC-Pro+, ADC BioScientific Ltd., Hoddesdon, UK). Measurements were taken directly in the soil with the help of a metal cylinder inserted into the soil profile, under natural temperature conditions and atmospheric CO2 concentration. The soil temperature was measured with a digital infrared thermometer.
For each experimental unit, grain production per plant was determined and corrected to 13% moisture content. After the end of the productive cycle, cowpea plants were collected, and the leaves and petioles were removed. This procedure was carried out because some treatments were more developed and had already lost part of the leaves (senescence). Subsequently, the stems were dried in an oven at a temperature of 70 ± 3 °C until the dry stem mass per plant (DM-stem) could be obtained. During the same period, the aboveground parts of weeds were removed from each treatment, and the dry mass (DM-weed) was also determined.

2.4.2. Soil Chemical Analyses

At the end of the experiment, the soil from each treatment was divided into 5 layers: 0–10; 10–20; 20–30; 30–40; and 40–55 cm. For each layer, a soil sample was taken, and chemical analysis was carried out. A summary of the analyzed variables and their respective quantification methods is presented in Table 4.

2.5. Statistical Analyses

The collected data underwent analysis of variance, and when the F-test was significant at a 5% probability, regression analysis was performed for the drip emitter installation depth factor. The choice of regression models was based on the significance of the regression parameters, verified using the t-test at a 5% probability, and the model’s ability to explain the behavior of the studied variable. To conduct an integrated analysis of the various measured variables, two multivariate analyses were employed: principal component analysis (PCA) and k-means clustering analysis. The choice of the number of k-means groups was made based on the Silhouette coefficient [27] and the behavior of treatments in the PCA. The k-means analysis was conducted with all variables under study, and the Euclidean distance measure was used.

3. Results

3.1. Productive Components and CO2 and Water Emissions

The cowpea crop was evaluated to understand the effects of subsurface drip irrigation when using sanitary sewage. The net CO2 exchange rate soil (NCER), water vapor flux (WFlux), and soil surface temperature (Ts) provide information on the water status of the soil; that is, they enable an assessment of whether the water distributed in depth was being absorbed by the roots of the crop. The quantification of the dry matter of weeds (DM-weed) provides an indication of whether the applied water reaches the soil surface. The other parameters were evaluated to determine if the crop was taking advantage of the nutrients from the application of synthetic sanitary sewage.
It can be seen in Table 5 that there was no effect in the interaction between dripper flow and the depth of drip emitter installation for any parameter evaluated. The simple effect of dripper flow rates was also not observed for any parameter. In relation to the simple effect of the installation depth of the drippers, the variables WFlux, Ts, DM-weed, grain production per plant (Prod.), and dry matter of the cowpea stem per plant (DM-stem) were significantly influenced. However, the NCER was not affected by the depth of drip emitter installation.
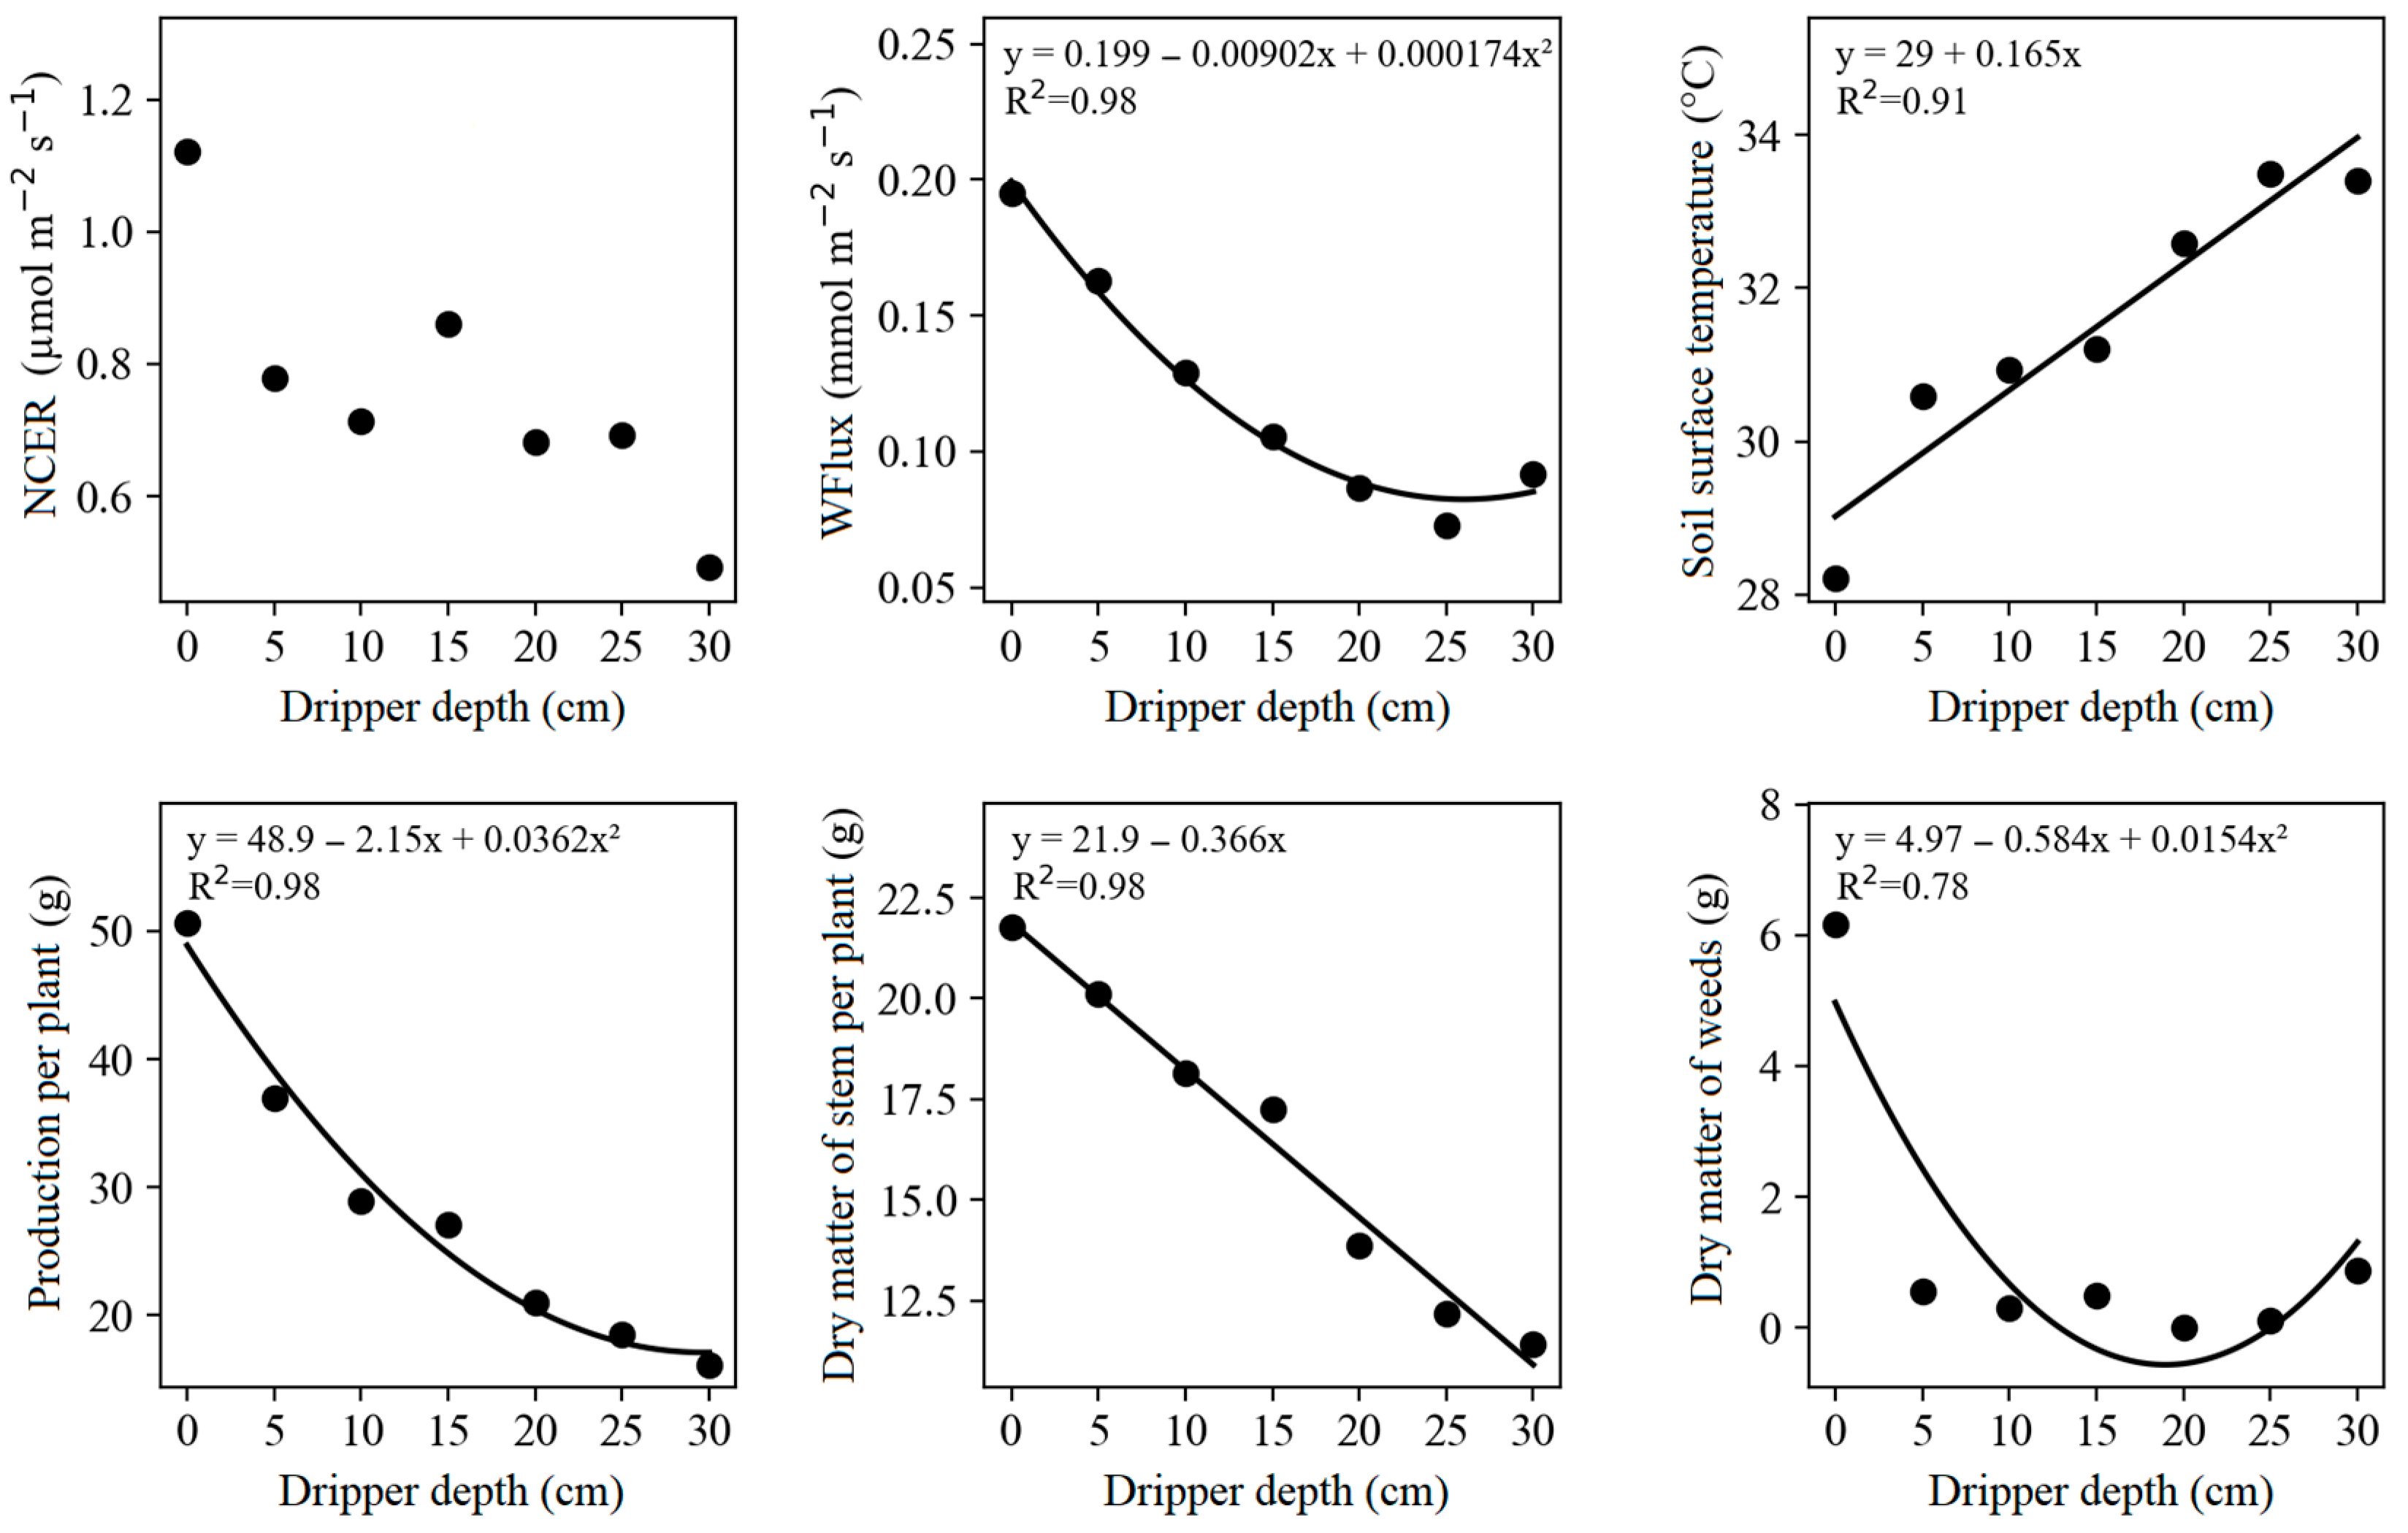
Water vapor flux, cowpea grain production, and the dry matter of weeds decreased with the increasing depth of drip emitter installation, with quadratic models being adjusted to explain the behavior of these variables. Cowpea stem dry matter decreased linearly, and soil surface temperature increased linearly with increasing drip emitter installation depth (Figure 2).
The water vapor flux was 0.199 mmol m−2 s−1 for surface drip irrigation (SDI) and decreased by 20.5% and 57.3% for drip emitter installation depths of 5 and 30 cm, respectively. As a result, the soil surface temperature was lower for the SDI treatment, measuring 28.2 °C (Figure 2).
Irrigation and fertigation with synthetic sewage through surface drip irrigation (SDI) provided a grain production per plant of 50.65 g. For drip emitter installations at 5 and 30 cm depths, grain production decreased by 18.6% and 56.1% compared to SDI, respectively. The dry matter of the cowpea stem was 21.90 g per plant for the SDI treatment, decreasing by 8.4% at the 5 cm depth and 50.1% at the 30 cm depth (Figure 2).
SDI favored the development of weeds, resulting in 6.18 g of dry matter of weeds per experimental plot. However, at a drip emitter installation depth of 5 cm, there was a 51% reduction in weed development (Figure 2).

3.2. Phosphorus, Potassium, and Sodium

To adequately evaluate fertigation with domestic sewage applied via subsurface drip, it is essential to carry out a comprehensive analysis of the different soil parameters. These parameters include an assessment of essential nutrients to ensure that plants receive adequate nutrition during the irrigation process. Furthermore, it is important to monitor soil quality to ensure an environment conducive to healthy plant growth. The analysis of these parameters allows a comprehensive understanding of the effects of fertigation with domestic sewage, assisting in decision making to optimize agricultural production and ensure the sustainability of irrigation systems.
The variable sodium concentration in the 0–10 cm soil layer (Na L0–10), supplied through fertigation with SSS, was significantly influenced by the interaction of different flow rates and drip emitter installation depths. After unfolding the interaction, it is observed that in treatments with drip emitters installed at 5 cm, Na L0–10 was higher for the flow rate of 1.6 L h−1 compared to the flow rate of 3.8 L h−1. However, for the drip emitter at a 15 cm depth, the concentration of Na L0–10 was higher for the flow rate of 3.8 L h−1 (Table 6).
The concentration of potassium in the 20–30 cm, 30–40 cm, and 40–55 cm soil layers (K L20–30, K L30–40, and K L40–55) received a unique effect from the drip emitter flow rates. The flow rate of 3.8 L h−1 promoted a higher potassium concentration compared to the flow rate of 1.6 L h−1 (Table 6). It can also be observed in this table that the concentration of phosphorus in the 0–10 and 30–40 cm layers, potassium in all layers, and sodium in the 0–40 cm layers were influenced by different drip emitter installation depths in terms of fertigation with SSS and mineral fertilization.
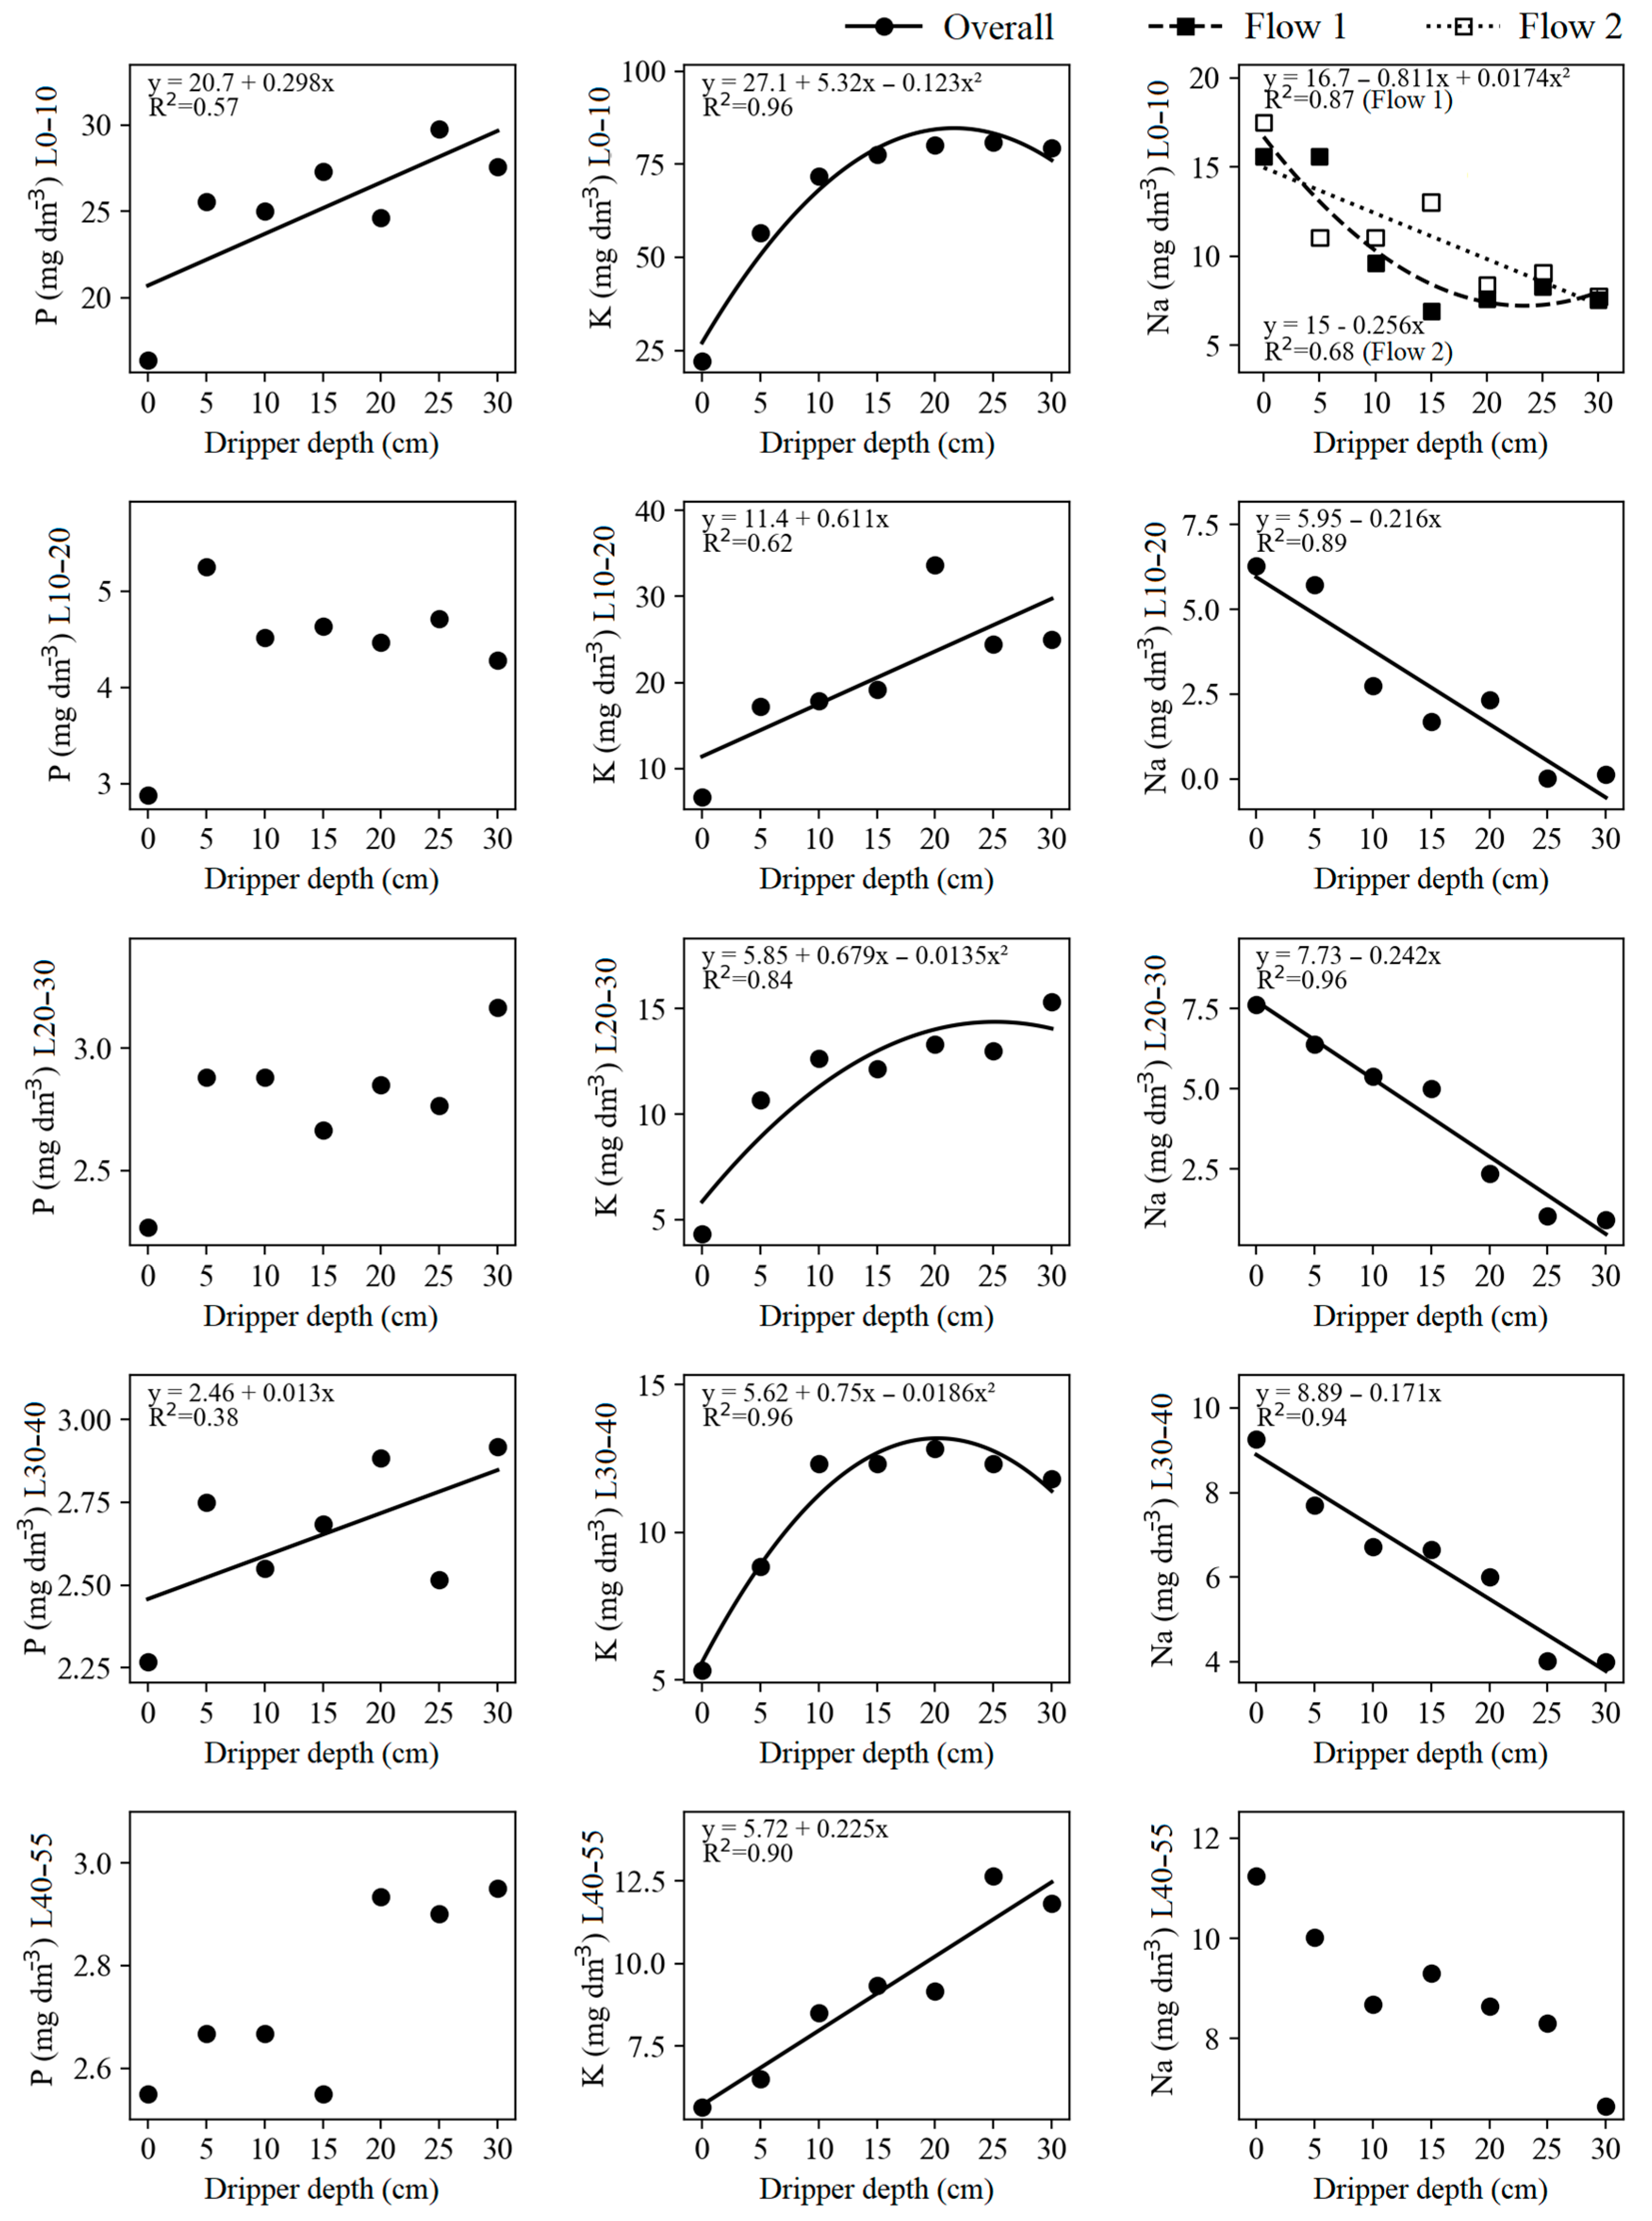
It can be observed in Figure 3 that the increase in drip emitter installation depth led to a linear increment in phosphorus concentration in the 0–10 and 30–40 cm layers. The concentration of P L0–10 at the end of the experiment was 16.37 mg dm−3 for SDI and 27.60 mg dm−3 for drip irrigation at a 30 cm depth. Considering the phosphorus inputs through mineral fertilization that the 0–10 cm layer received at sowing (Table 3), an expected increment in phosphorus concentration of 20.43 mg dm−3 was anticipated. In fertigation with SSS, the expected phosphorus increment was 5.96 mg dm−3. The increase in P L0–10 concentration in the treatment with drip irrigation at a 30 cm depth indicates low phosphorus extraction in the 0–10 cm soil layer, directly influencing grain production and vegetative development of the aboveground cowpea parts (Figure 2 and Figure 3).
The concentration of P L30–40 at the end of the experiment was 2.27 mg dm−3 for SDI and 2.92 mg dm−3 for drip irrigation at a 30 cm depth (Figure 3). Considering buried drip irrigation at 30 cm, the expected increment in P concentration in the 20–30 cm and 30–40 cm layers through fertigation with SSS was 2.98 mg dm−3 (Table 3). Therefore, it was observed that fertigation with SSS at a 30 cm depth promoted a higher final concentration of phosphorus in the 20–30 cm and 30–40 cm layers compared to fertigation at other depths (Figure 3).
Increasing the installation depth of the drip emitters led to a linear increment in potassium concentration in the 10–20 cm and 40–55 cm layers. For the potassium concentration in the 0–10 cm, 20–30 cm, and 30–40 cm layers, there is initially an increase in potassium concentration with the increase in the installation depths of the drip emitters, followed by stabilization and a slight decrease in potassium concentration for the greater depths of the drip emitters (Figure 3).
The lowest potassium concentration in all soil layers, after mineral fertilization and fertigation with SSS, occurred via the surface drip irrigation system, with values of 27.10, 11.40, 5.85, 5.62, and 5.72 mg dm−3 for the 0–10 cm, 10–20 cm, 20–30 cm, 30–40 cm, and 40–55 cm layers, respectively. According to the regression equations (Figure 3), the highest potassium concentrations in the 0–10 cm layer were 84.61 mg dm−3 for the emitter installed at a depth of 22 cm; in the 10–20 cm layer, it was 29.73 mg dm−3 for the emitter at a 30 cm depth; in the 20–30 cm layer, it was 14.39 mg dm−3 for the emitter at a 25 cm depth; in the 30–40 cm layer, it was 13.18 mg dm−3 with the emitter at a 20 cm depth; and in the 40–55 cm layer, it was 12.47 mg dm−3 with the emitter at a 30 cm depth.
The sodium concentration in the soil from the L0–10 to L30–40 layers decreased with increasing drip emitter depth (Figure 3). According to the regression equation, the highest sodium concentration in the 0–10 cm layer and the lowest flow rate (1.6 L h−1) was 16.70 mg dm−3 for SDI, and the lowest concentration was 7.25 mg dm−3 for drip irrigation installed at a depth of 23 cm. Considering the same soil layer, for the highest flow rate (3.8 L h−1), the highest sodium concentration was 15.00 mg dm−3 for SDI, and the lowest concentration was 7.32 mg dm−3 for drip irrigation at a depth of 30 cm (Figure 3).
The lowest sodium concentration in the soil layers between 10 and 40 cm after fertigation with SSS occurred via the subsurface drip irrigation system at a depth of 30 cm, with values of 0.13, 0.91, and 3.98 mg dm−3, respectively. The highest sodium concentration in the 10–20 cm, 20–30 cm, and 30–40 cm layers occurred with the SDI treatment, with values of 6.29, 7.62, and 9.26 mg dm−3, respectively (Figure 3).

3.3. Calcium, Magnesium, and Sodium Saturation Index

It can be seen in Table 7 that there was no effect of the interaction of dripper flow and depth of drip emitter installation for any parameter evaluated. However, isolated effects of dripper flow and depth of drip emitter installation were verified. The variables calcium (Ca) concentration in layers 0 to 40 cm, magnesium (Mg) concentration in layers 0 to 20 cm, and sodium saturation index (SSI) in layers 0 to 40 cm were significantly influenced by the installation depths of the drip emitters.
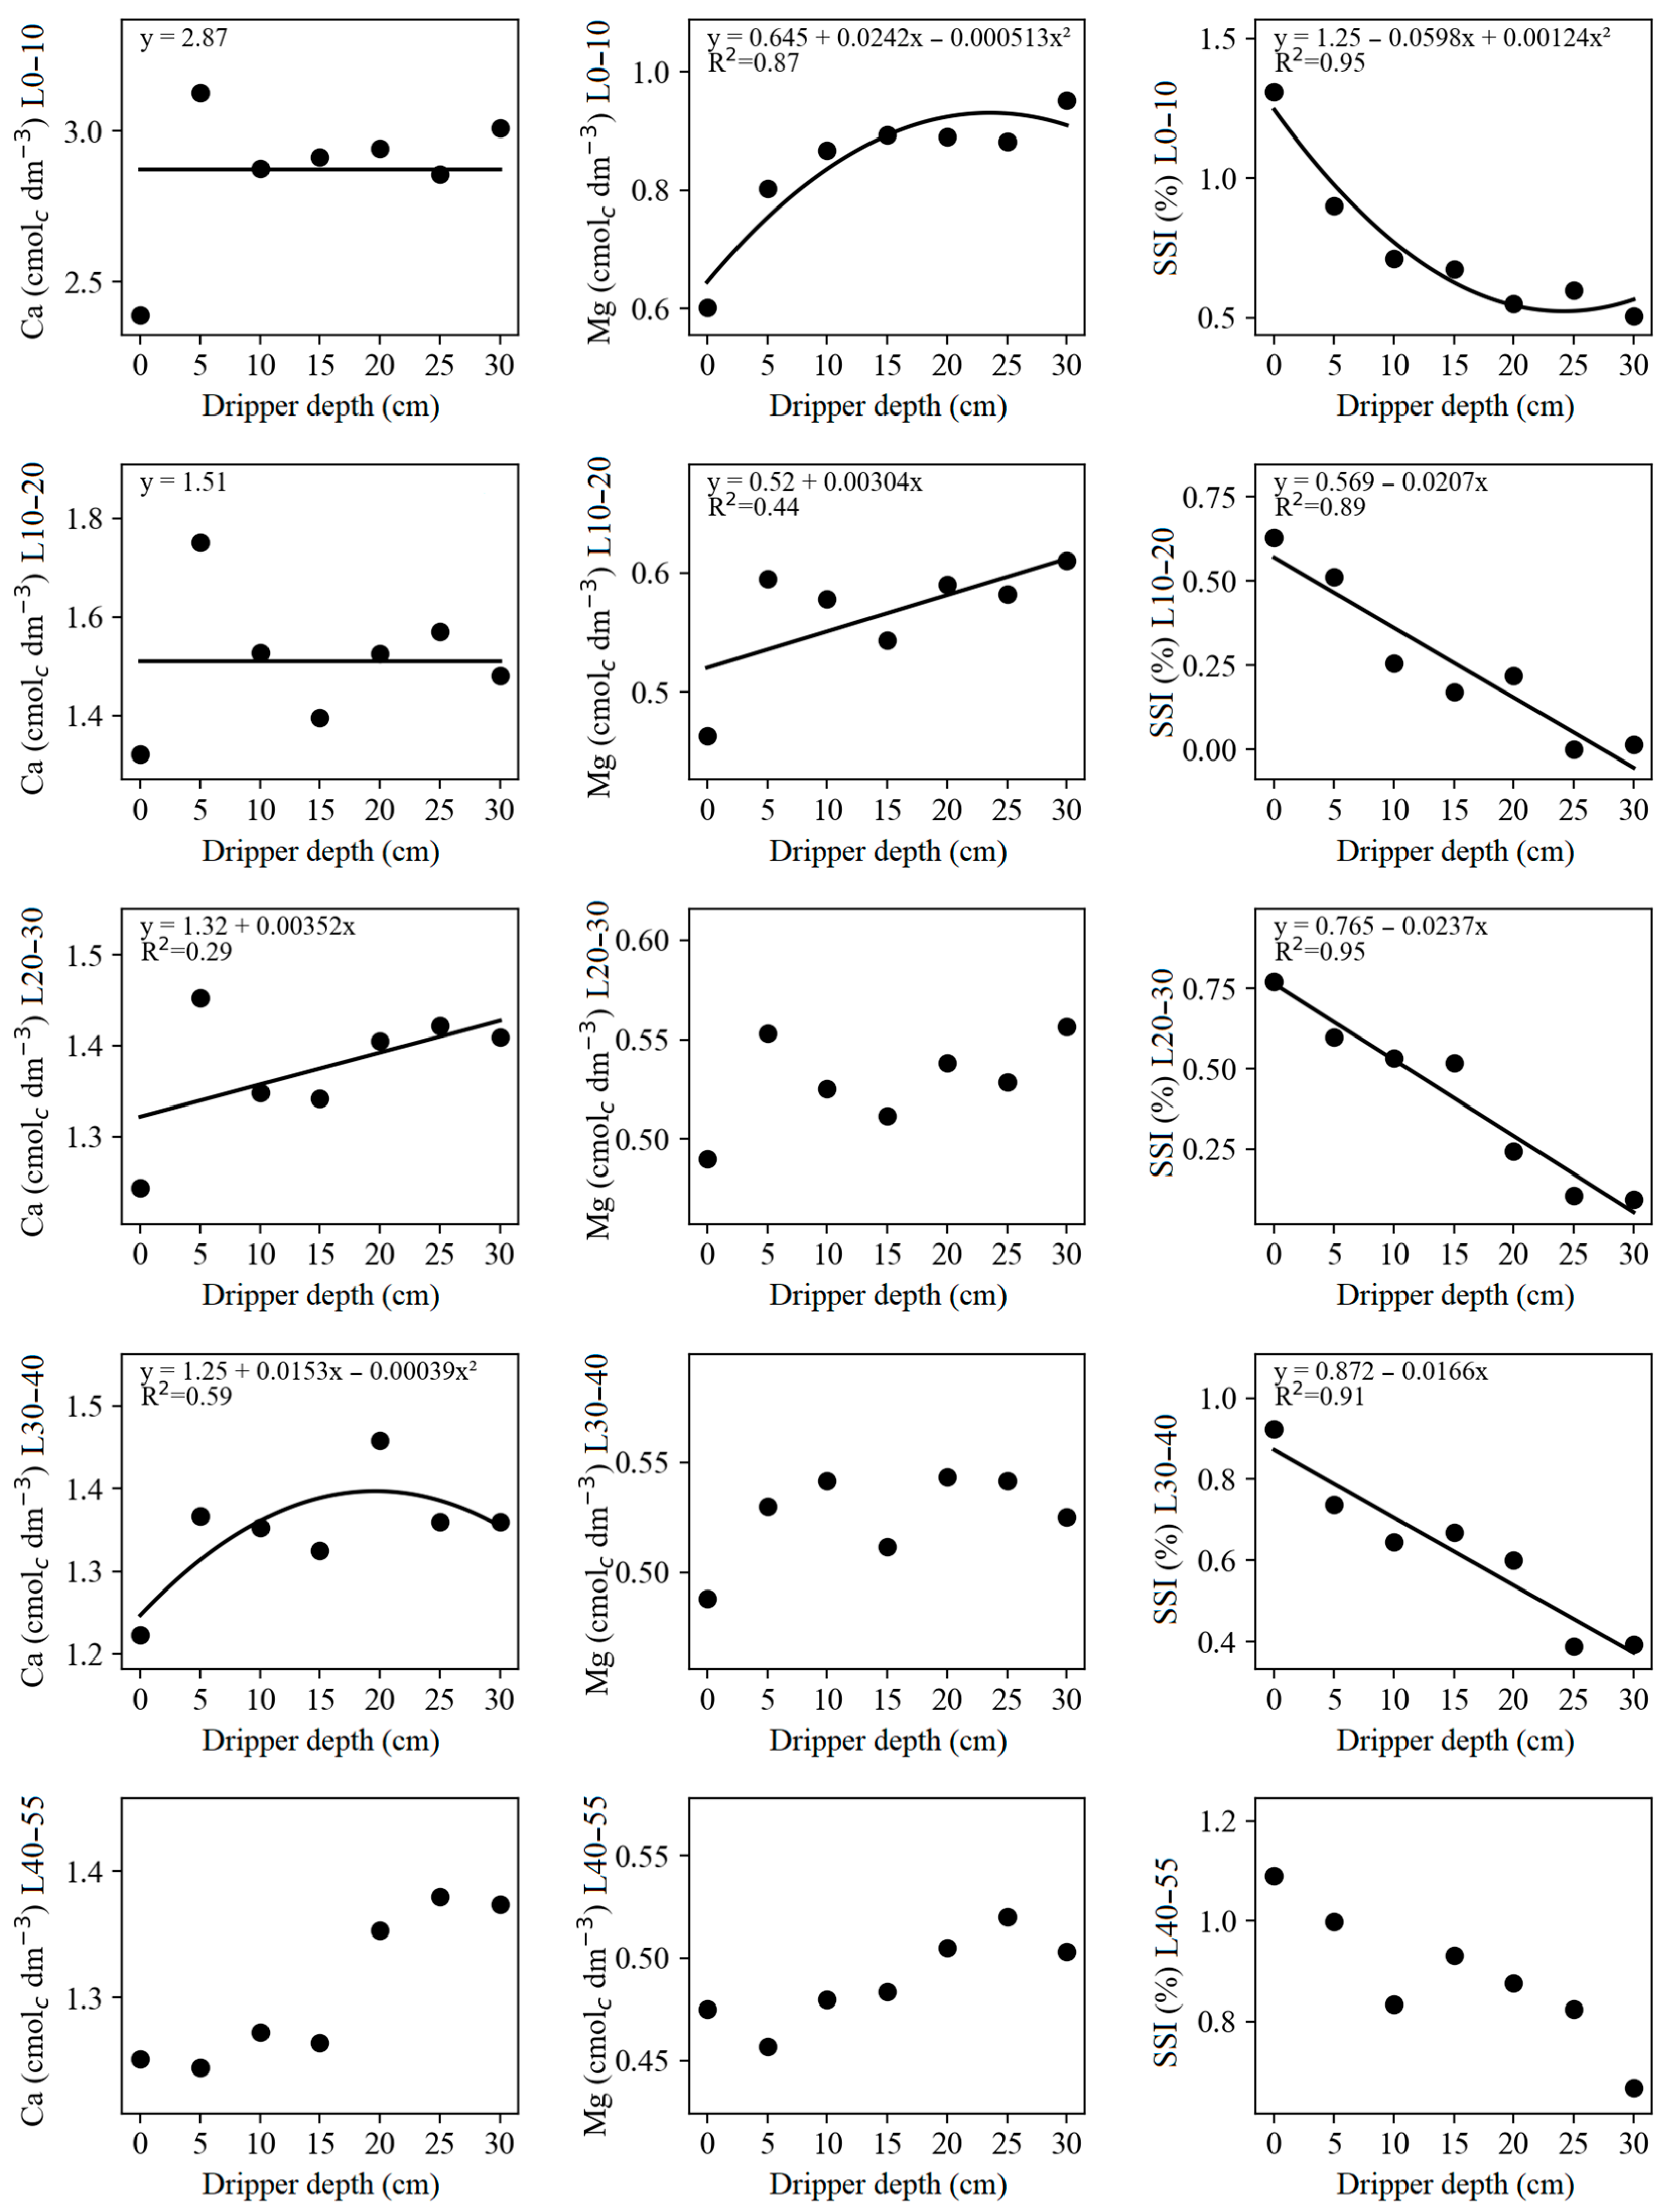
In Figure 4, it can be observed that the concentration of Ca in the 20–30 cm layer increased linearly with greater depths of drip emitter installation. The lowest concentration was 1.24 cmolc dm−3, which was found in the SDI system. In the 30–40 cm layer, the adjusted model was quadratic, with the lowest concentration of Ca being 1.22 cmolc dm−3 for the SDI treatment, and the highest concentration was 1.40 cmolc dm−3 with the emitter installed at 20 cm depth.
Analyzing the magnesium concentration in the first soil layer, a quadratic model was fitted as a function of the depths of the drip emitter installation. Considering this model, the lowest Mg concentration was 0.65 cmolc dm−3 for SDI, and the highest concentration was 0.93 cmolc dm−3 for drip irrigation at 24 cm depth (Figure 4).
In the 10–20 cm layer, the Mg concentration increased linearly with drip emitter depths. The lowest concentration was 0.46 cmolc dm−3 for SDI, and the highest concentration was 0.61 cmolc dm−3 for drip irrigation at a 30 cm depth (Figure 4).
The values of SSI in the 0 to 40 cm layers decreased with increasing drip emitter depth (Figure 4). According to the regression equations, the highest SSI in the 0–10 cm layer was 1.25% for SDI, and the lowest SSI was 0.53% for drip irrigation at 24 cm depth. The highest SSI values in the 10–20 cm, 20–30 cm, and 30–40 cm soil layers, after fertigation with synthetic sanitary sewage, occurred via the SDI system, resulting in 0.63%, 0.77%, and 0.92%, respectively. The lowest SSI values in the 10–20 cm, 20–30 cm, and 30–40 cm layers occurred with the treatment via subsurface drip irrigation at a 30 cm depth, with values of 0.01%, 0.09%, and 0.39%, respectively (Figure 4).

3.4. Hydrogenionic Potential, Electrical Conductivity, Potential Acidity, and Base Saturation

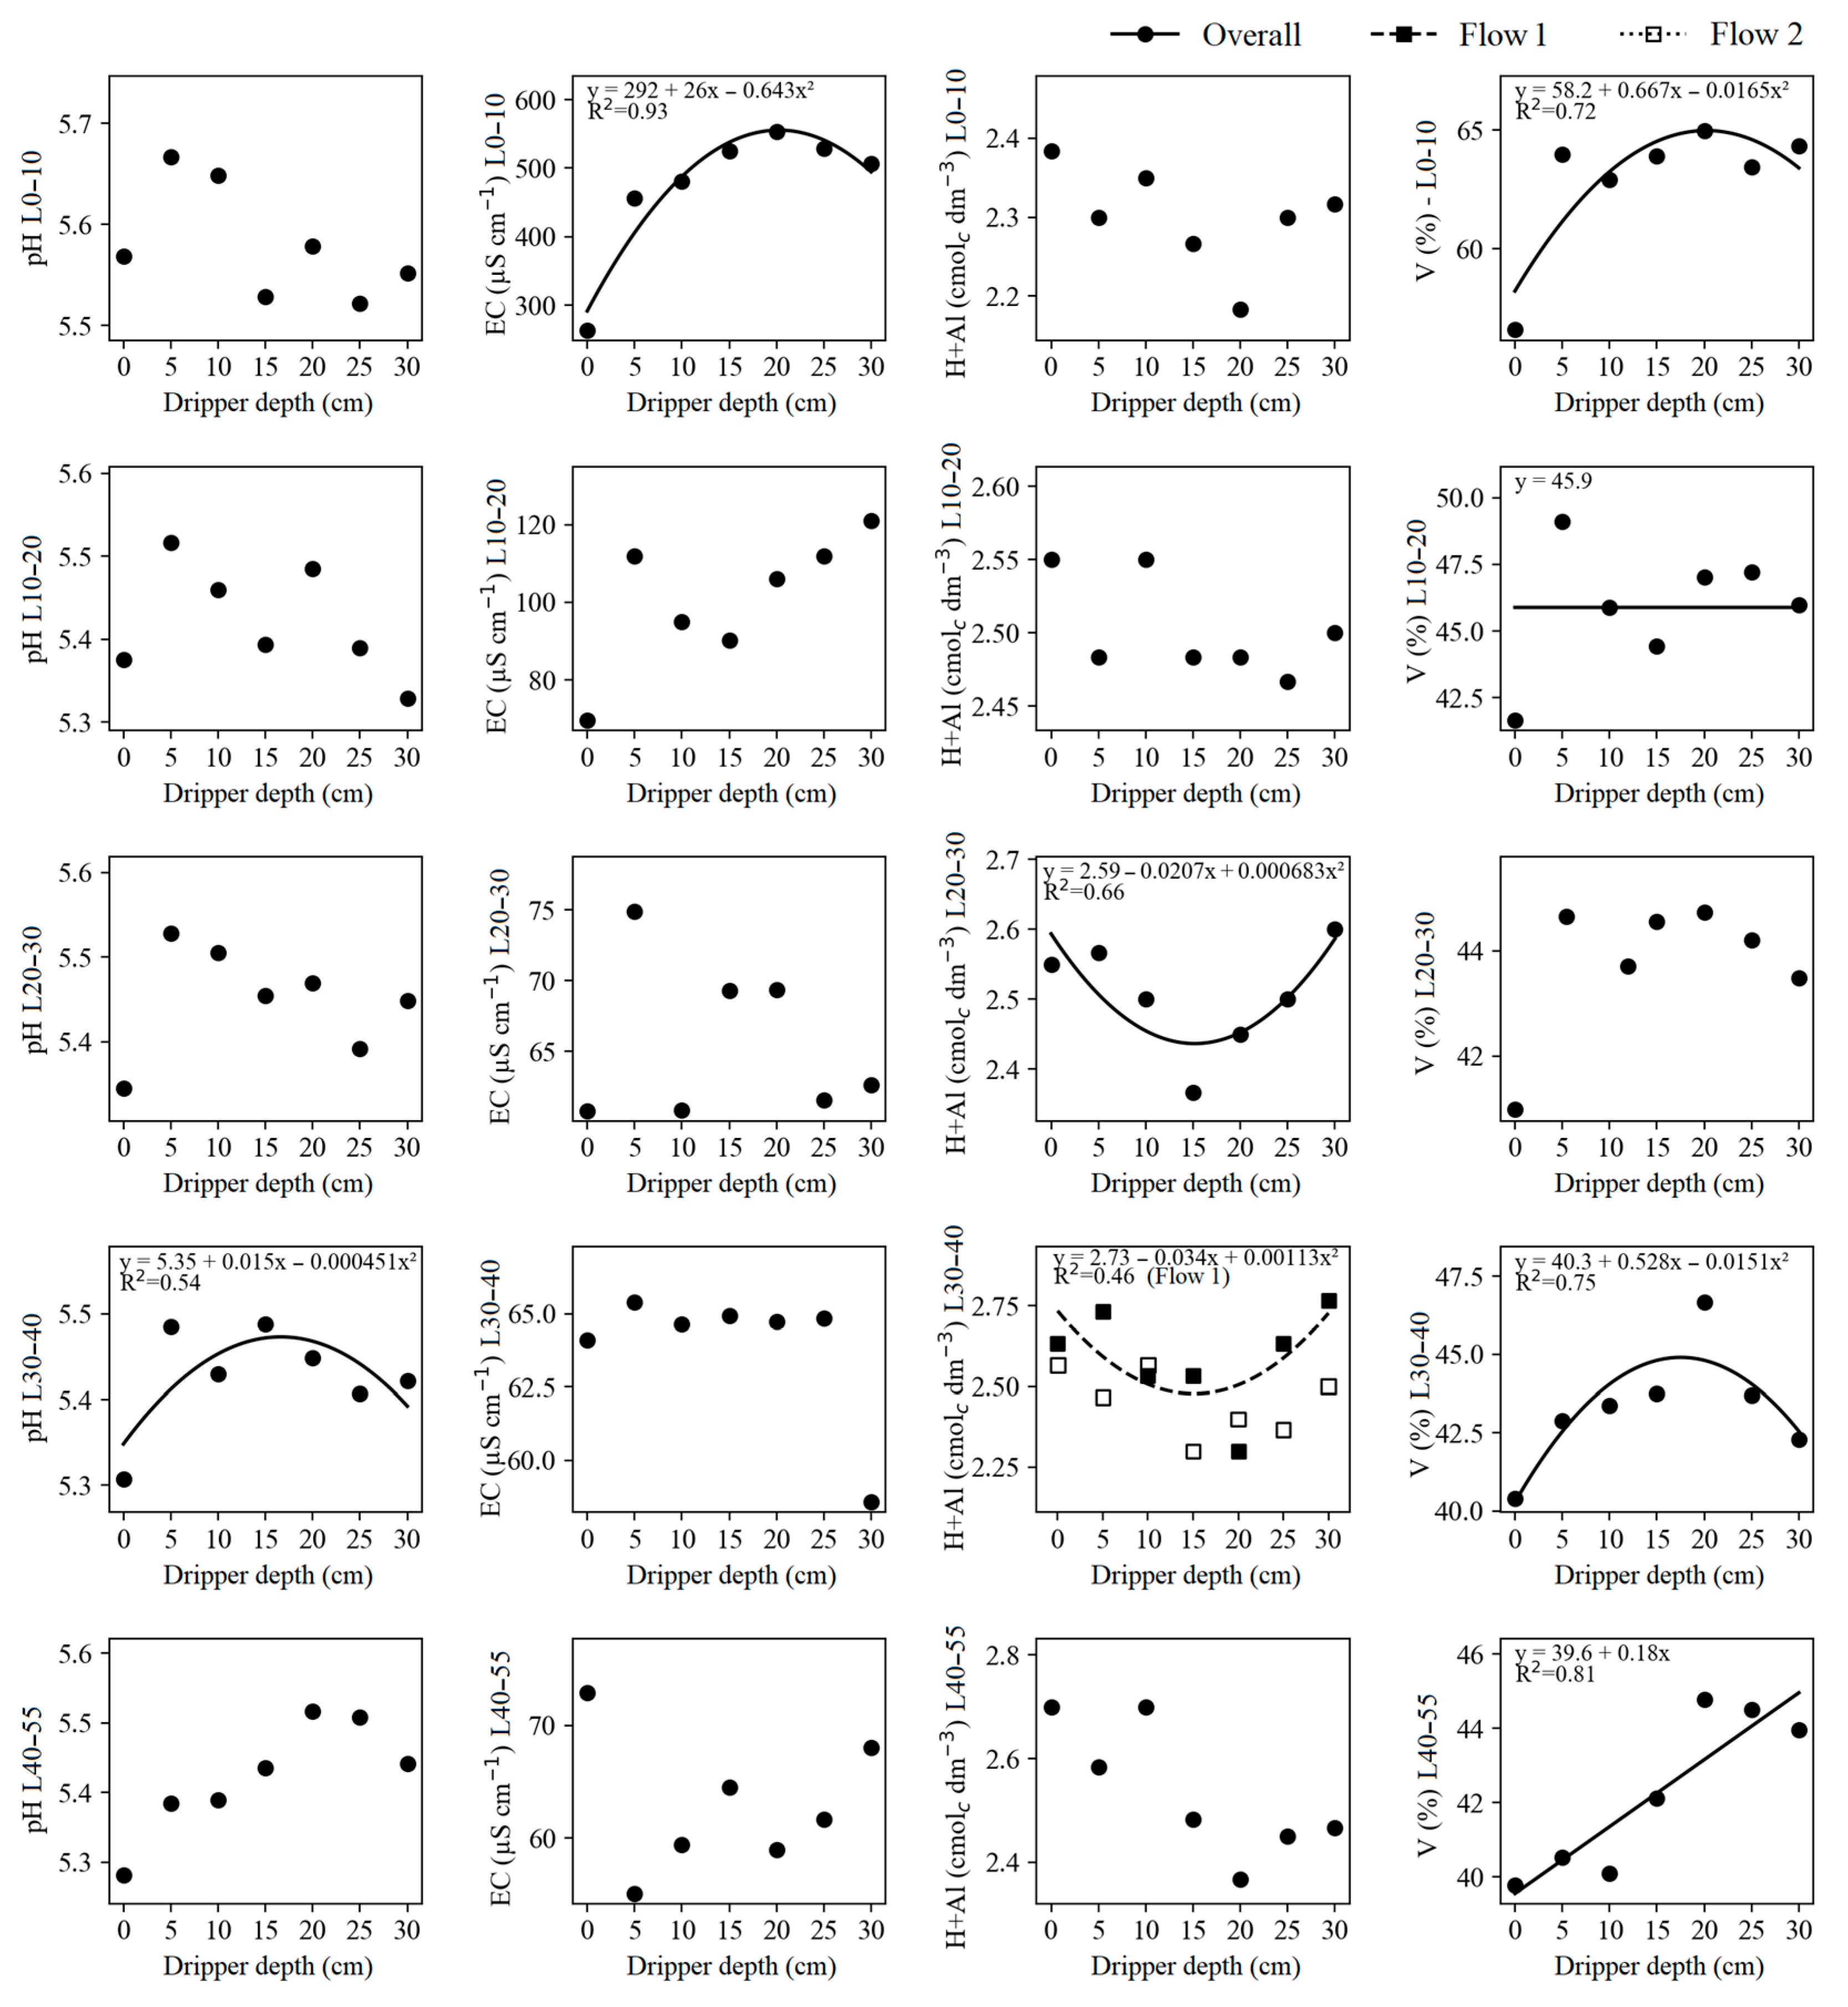
It can be seen in the summary table of the analysis of variance provided in Table 8, that only the potential acidity (H + Al) in the 30–40 cm soil layer was affected by the interaction between dripper flow and depth of drip emitter installation. In treatments with drip emitters installed at 5, 15, 25, and 30 cm, H + Al L30–40 was higher for the flow rate of 1.6 L h−1 compared to the flow rate of 3.8 L h−1.
The potential acidity (H + Al) in the 10–20 cm layer of the soil was the only parameter present in Table 8 that suffered an isolated effect from the different flow rates of the drippers. H + Al L10–20 for the flow rate of 1.6 L h−1 was 2.56 cmolc dm−3, and H + Al L10–20 for the flow rate of 3.8 L h−1 was 2.44 cmolc dm−3 (Table 8). It can also be observed from this table that the soil pH in the 30–40 cm layer, electrical conductivity (EC) in the 0–10 cm layer, potential acidity (H + Al) in the 20–30 cm and 30–40 cm layers, and base saturation (V) in the 0–10 cm, 10–20 cm, 30–40 cm, and 40–55 cm soil layers were significantly influenced by the depths of drip emitter installation.
Figure 5 shows that the soil pH in the 30–40 cm layer exhibited quadratic behavior as a function of the different depths of drip emitter installation. The lowest pH found was 5.31 for the treatment with SDI, and according to the regression equation, the highest pH was 5.47 for the drip emitter installed at a 17 cm depth.
The lowest concentrations of phosphorus, potassium, and magnesium in the 0–10 cm soil layer for the SDI system (Figure 3 and Figure 4) contributed to the lowest electrical conductivity (EC) for this system, which was 263 µS cm−1. The highest EC was 554.80 µS cm−1 for buried drip irrigation at a 20 cm depth (Figure 5). In the same figure and, according to the regression equation, it can be observed that the highest values of H + Al in the 20–30 cm and 30–40 cm soil layers were found in the surface drip system, at 2.59 and 2.73 cmolc dm−3, respectively. According to the regression equation, the lowest values of H + Al in the 20–30 cm and 30–40 cm layers occurred in treatments with drip emitters installed at 15 cm depth, being 2.43 and 2.47 cmolc dm−3, respectively (Figure 5).
Base saturation (V) is an indicator of the overall soil fertility conditions. Due to higher productivity and nutrient extraction in the 0–10 cm soil layer, the SDI system exhibited the lowest V value, which corresponded to 56.60%. The highest V in the 0–10 cm layer was 64.94% for the treatment with the drip emitter at 20 cm depth (Figure 5). For the 30–40 cm layer and considering the regression equation adjusted to the data, the lowest V was 40.3% for SDI, and the highest V was 44.91% for the system at a 17 cm depth. According to the regression equation, V in the 40–55 cm layer increased linearly with increasing depths of drip emitters, with the lowest V being 39.6% for SDI and the highest V being 45% for drip irrigation at 30 cm depth.

3.5. Principal Component Analysis and Cluster Analysis

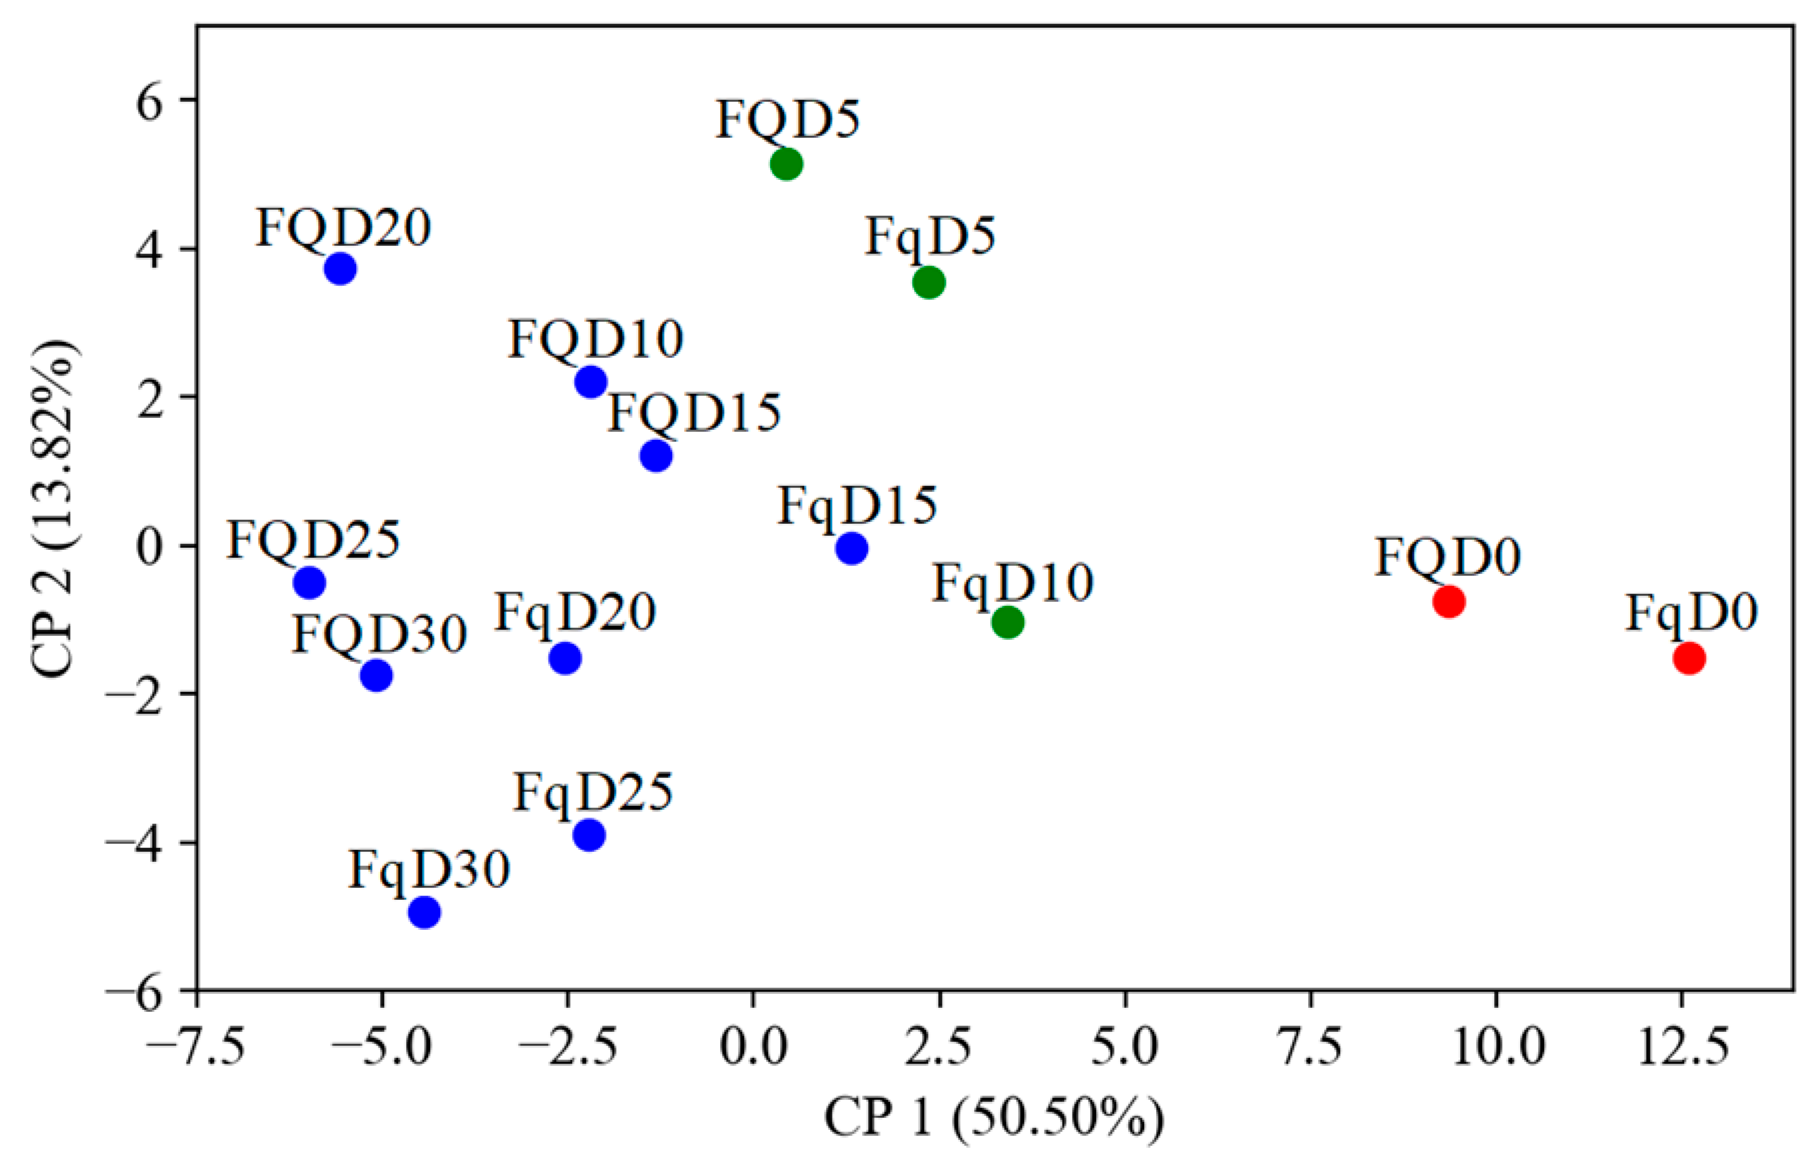
For a better understanding of the influence of drip emitter installation depths and emitter flow rates on the sets of variables studied, principal component analysis (PCA), along with k-means cluster analysis, was performed for all variables together (Figure 6).
Overall, it can be observed that the points corresponding to treatments with shallower depths are separated from points of greater depth. However, for flow rates, there was no well-defined pattern, corroborating with the previously presented results, which indicated the small influence of flow rate on the studied variables. Based on the clustering, it can be observed that, generally, the treatments with SDI were grouped together, while the other treatments, corresponding to the SSDI, were divided into two other groups.

4. Discussion

In the present study, it was observed that increasing the depth of drip emitter installation negatively influenced grain yield and vegetative development of cowpea BRS Tumucumaque (Figure 2). Deeper placement of drip emitters leads to reduced water availability in the soil layer of 0–20 cm. This occurs because subsurface drip irrigation (SSDI) exhibits different soil water dynamics compared to surface drip irrigation (SDI). This dynamic impacts soil water content [15,28] and possibly negatively interferes with the absorption of nutrients applied via surface, such as liming and planting fertilization.
The reduction in soil surface moisture with increasing depths of drip emitter installation is depicted in Figure 2, represented by the water vapor flux. The decrease in water vapor flux due to the increasing depth of drip emitter installation is attributed to the reduction in water content in the upper soil layers. The uniform distribution of soil moisture exerts a significant influence on environmental factors such as nutrient availability, pH, and the temperature of crop root zones [18], thus affecting root growth and crop productivity. Regarding subsurface drip irrigation systems, Lamm [16] reported that when the soil surface layer remains dry, nutrients applied at planting become unavailable to the crop, resulting in reduced yields.
Another important factor regarding soil surface moisture is thermal regulation (Figure 2). This condition is favorable for the germination and proper establishment of cowpea during the hottest periods of the year because water present on the surface mitigates soil temperature [29]. Lower soil temperature reduces hypocotyl constriction and minimizes other physicochemical damage to seedlings, negatively affecting their establishment. The optimal temperature range for cowpea is considered to be between 20 and 30 °C [30]. Considering this and analyzing Figure 2, it is observed that only the treatment with SDI falls within this range.
Surface wetting of the soil with surface drip irrigation also has its disadvantages [31]. One of them is the greater loss of water to the atmosphere via evaporation. Another disadvantage is the promotion of weed seed banks, thus contributing to their establishment and development (Figure 2). However, this condition was not sufficient to compromise cowpea production compared to the other treatments.
Wu et al. [17] found, in sandy soil, that the accumulation of maize dry matter was higher in treatments with surface drip irrigation compared to subsurface drip irrigation systems. In the same study, conducted in clayey soil, the authors observed that maize production in treatments with SDI and SSDI was superior to non-irrigated cultivation by 17% and 12%, respectively.
The main advantage of fertigation with synthetic sanitary sewage through SSDI is the availability of nutrients at the desired depth, especially of less mobile elements in the soil, such as phosphorus. It was observed in Figure 3 that there was an increase in phosphorus concentration in the 30–40 cm soil layer for the deepest drip emitter installation depths.
Wang et al. [18] found that in treatments with drip emitters installed at a depth of 20 cm, the total nitrogen and total phosphorus contents in tomato root were 1.18 and 1.47 times higher, respectively, compared to surface drip irrigation. Phosphorus is prone to fixation at the point of application; thus, fertigation application through drip emitters installed at 20 cm resulted in more assimilable phosphorus at depth compared to surface drip irrigation treatments [32].
The mineral fertilization applied at sowing and distributed on the soil surface (0–10 cm soil layer) accounted for 77.40% of the total phosphorus and 60.38% of the total potassium applied in the present study (Table 3). Considering that water is the primary means of nutrient transport to plants, it is noted that the extraction of these nutrients in the 0–10 cm soil layer decreased with increasing depths of drip emitter installation (Figure 3), inversely corroborating with the water vapor flux (Figure 2).
Wu et al. [17], studying the effect of fertigation by SDI and SSDI on maize cultivation, found that for clayey soil, the moisture content was lower in the SSDI treatment at a depth of 0–20 cm compared to SDI. Furthermore, the extraction of N, P, and K was higher under conditions with higher available moisture. These same authors also found that phosphorus and potassium extraction were greater in treatments with SDI compared to SSDI. Therefore, the low water availability in the 0–20 cm layer can affect soil mineralization and nutrient availability [16], especially for P and K, whose movements primarily occur through diffusion.
The potassium concentration in the 10–20 cm soil layer increased linearly with the increment of drip emitter installation depths. Considering the treatment averages, for drip irrigation installed at 20 cm depth, the potassium concentration was higher, indicating the ability of synthetic sanitary sewage to provide nutrients at desired soil depths (Figure 3). Araújo et al. [3] found that the agricultural use of sanitary sewage is an alternative to provide water and nutrients for plants and recycle nutrients for the soil.
The best model to explain the potassium concentration in the 20–30 cm and 30–40 cm soil layers is quadratic. Initially, there is an increase in K and a slight reduction in this nutrient at greater drip depths. This reduction in K represents the removal of this nutrient by cowpea in these layers (Figure 3).
The potassium concentration for the last soil layer increased linearly with the depths of the drip emitters. Considering the mobility of potassium, this increase possibly occurred due to leaching of this element. Since the drip emitter at 30 cm depth is closer to this soil layer, it is inferred that fertigation at 30 cm contributed more to the potassium concentration at a depth of 40–55 cm (Figure 3).
The highest concentration of exchangeable sodium (Na) in the 0–10 cm soil layer occurred with the surface drip irrigation treatment. This happened due to fertigation with synthetic sanitary sewage on the soil surface and decreased with increasing depth of the drip emitters. However, in the 10–20 cm, 20–30 cm, and 30–40 cm layers, the behavior was similar. Possibly, sodium in these layers was partially absorbed by cowpea in treatments with subsurface drip irrigation, as the Na/K ratio in these layers was higher compared to the 0–10 cm layer, which received 60.38% of potassium via mineral fertilization. This increased absorption of Na, due to greater drip depths, negatively influenced grain production and cowpea development (Figure 3).
The Ca in the 20–30 cm and 30–40 cm soil layers and the Mg in the 0–10 cm and 10–20 cm layers were lower for the SDI treatments compared to the SSDI (Figure 4), as well as P in the 0–10 cm and 30–40 cm layers, and potassium in all soil layers (Figure 3). Considering that cowpea in the SDI treatments exhibited greater vegetative development and higher grain yield (Figure 2), there was greater nutrient uptake and lower uptake of Na. Thus, the soil had a higher concentration of exchangeable Na, resulting in a higher sodium saturation index (SSI) (Figure 4).
The information regarding the sodium content available in the soil is insufficient to assess adverse effects on plant growth and development. It is also important to know the proportion concerning other soil cations, such as K+, Ca2+, and Mg2+ [33]. Soils with an SSI lower than 6% are considered non-sodic [34]. In the present study, the SSI values were less than 1.25%, indicating that the duration of this study with fertigation of synthetic sanitary sewage through different irrigation systems did not lead to changes that compromised the chemical quality of the soil.
The pH in the 30–40 cm soil layer was lower for the SDI and increased with the increasing depth of the drip emitters up to a depth of 16 cm (Figure 5). In all of the evaluated layers, the presence of Al3+ was equal to zero, indicating that the potential acidity was directly influenced by the presence of exchangeable H+ in the 20–30 cm and 30–40 cm soil layers (Figure 5).
The plant, to absorb a soil cation, releases a proton of H+, thereby contributing to soil pH reduction and increased potential acidity [35]. Indeed, there was a greater absorption of cations in the SDI treatments, resulting in lower pH and higher potential acidity. This was also observed for drip emitter depths of 25 and 30 cm, which experienced a reduction in the concentration of K (Figure 3) and Ca (Figure 4) in the 30–40 cm soil layer due to the extraction of these nutrients, consequently leading to higher potential acidity.
The electrical conductivity (EC) and base saturation (V) of the 0–10 cm soil layer were lower for the SDI system. This treatment received the highest nutrient input in the surface layer (Table 2). At the end of the experiment, the highest nutrient extractions by the SDI treatment were corroborated (Figure 5).
The quadratic behavior of EC coincided with that of K (Figure 3) and magnesium (Figure 4) for the 0–10 cm soil layer. This demonstrates the decrease in extraction of these nutrients with increasing depths of drip emitters and, ultimately, a lower contribution of drip emitters at greater depths for nutrient supply via fertigation with synthetic sewage for the 0–10 cm soil layer. The deeper placement of SSDI, particularly in sandy–clayey soils, possibly induces oxygen deficiency in the rhizosphere and reduces root volume, imposing a restriction on the plant’s ability to extract water and nutrients [14].
For adequate levels of germination and vigor, cowpea seeds can tolerate an EC of up to around 3.0 dS m−1 [30]. Considering that the highest EC found in the present study was 554.80 µS cm−1 (Figure 5), which is approximately 0.55 dS m−1, fertigation with synthetic sewage, supplemented with mineral fertilization, did not compromise the soil chemical condition for the studied period.
The increase in base saturation in the 30–40 cm and 40–55 cm soil layers coincides with the enhancement of fertility through synthetic sewage. However, in the 30–40 cm layer, the drippers at 25 and 30 cm depth showed a reduction in base saturation, indicating nutrient extraction (Figure 5). Similar to what was suggested for potassium leaching in the 40–55 cm layer (Figure 3), there was also an increase in base saturation at these greater depths of dripper installation in the 40–55 cm layer (Figure 5).
Finally, considering the effect of emitter flow rates, it is observed that they mainly influenced the potassium concentration in soil layers below 20 cm (Table 6). It was found that the final K concentration was higher in the treatment with a flow rate of 3.8 L h−1 compared to emitters with 1.6 L h−1. Lower flow rate emitters exhibit better water distribution, especially in sandy–clayey soils. Thus, in these layers, there was possibly better water distribution, resulting in a more even distribution of nutrients. This favored greater potassium absorption for treatments with emitters of 1.6 L h−1. Treatments with this same flow rate showed higher potential acidity in the 30–40 cm layer (Table 8) due to the release of H+ for potassium absorption [35].
When the emitter application intensity exceeds the soil water infiltration rate, the pressure load around the emitter becomes positive, generating a backpressure that reduces the hydraulic gradient between the interior of the emitter and the soil, consequently reducing the emitter flow rate. In fine-textured soils, the backpressure effect is more pronounced, resulting in a greater reduction in the emitter flow rate. This is one of the main disadvantages of the SSDI system, as it can affect irrigation performance. When water is applied in different quantities, non-uniformities occur in both time and space, consequently affecting the nutrient application rates as well [23].
With principal component and clustering analyses, it is possible to observe that, in general, SDI stands apart from the other depths of SSDI. However, three groups were formed, composed of SDI, intermediate depths of 5 and 10 cm, and greater installation depths of 15, 20, 25, and 30 cm (Figure 6).
An important decision in the use of SSDI for sewage disposal concerns the depth of emitter installation. The appropriate installation depth varies according to the crop, soil type, water source, climate, cultural practices, and irrigation designer preferences.
It was observed that fertigation with synthetic sewage through SDI enabled a higher grain yield of cowpea, which should be related to higher extraction of P, K, Ca, and Mg due to the lower final concentration of these elements in the soil in each studied layer. Therefore, SSDI was not suitable for cowpea production in sandy–clayey soil and in greenhouse conditions. However, it was effective in providing nutrients at depth via synthetic sewage. The responses to soil chemical alterations were not clear for the two studied flow rates. Generally, a slight advantage was observed for the flow rate of 1.6 L h−1 compared to the flow rate of 3.8 L h−1. Thus, further studies are needed to investigate the effect of different flow rates in SSDI systems. Studies should also be conducted using original domestic sewage to evaluate the microbiological contamination of soil, plants, and operators.

5. Conclusions

Reducing the depth of emitter installation positively influences grain production and vegetative development of cowpea cultivated in sandy–clayey soil and in greenhouse conditions.
Fertigation with synthetic sewage at depth increases the concentration of phosphorus in the soil.
Concentrations of phosphorus, potassium, calcium, and magnesium in the soil, at the end of the experiment, are higher for the subsurface drip irrigation system and increase with the depth of emitters.
Sodium concentration in the soil is lower for greater depths of emitter installation.
Application of synthetic sewage at different depths of emitter installation increases soil base saturation.
Soil chemical changes and cowpea responses were inconclusive for the two evaluated flow rates. Overall, a modest advantage was observed for the flow rate of 1.6 L h−1. However, further studies are needed to investigate the effect of different flow rates and depths of installation of subsurface drip irrigation systems.
It is recommended to apply sanitary sewage using the subsurface drip irrigation system to provide nutrients for cowpea.

Author Contributions

Conceptualization, E.D.A., A.C.B. and F.F.d.C.; methodology, E.D.A., A.C.B. and F.F.d.C.; validation, E.D.A., L.B.F., J.T.d.O., A.C.B. and F.F.d.C.; formal analysis, E.D.A. and L.B.F.; investigation, E.D.A.; resources, A.C.B. and F.F.d.C.; data curation, E.D.A. and L.B.F.; writing—original draft preparation, E.D.A., L.B.F. and F.F.d.C.; writing—review and editing, J.T.d.O. and F.F.d.C.; visualization, E.D.A., L.B.F., J.T.d.O., A.C.B. and F.F.d.C.; supervision, A.C.B. and F.F.d.C.; project administration, F.F.d.C.; funding acquisition, J.T.d.O. and F.F.d.C. All authors have read and agreed to the published version of the manuscript.

Funding

This research was funded by Coordination for the Improvement of Higher Education Personnel—Brazil (CAPES)—Finance Code 001 and the National Council for Scientific and Technological Development—Brazil (CNPq)—Process 308769/2022–8.

Data Availability Statement

Data are contained within the article.

Acknowledgments

We thank the Department of Agriculture Engineering (DEA) and Graduate Program in Agricultural Engineering (PPGEA) of the Federal University of Viçosa (UFV) for supporting the researchers.

Conflicts of Interest

The authors declare no conflicts of interest.

References

  1. Khondoker, M.; Mandal, S.; Gurav, R.; Hwang, S. Freshwater shortage, salinity increase, and global food production: A need for sustainable irrigation water desalination—A scoping review. Earth 2023, 4, 223–240. [Google Scholar] [CrossRef]
  2. Tian, X.; Engel, B.A.; Qian, H.; Hua, E.; Sun, S.; Wang, Y. Will reaching the maximum achievable yield potential meet future global food demand? J. Clean. Prod. 2021, 294, 126285. [Google Scholar] [CrossRef]
  3. Araújo, E.D.; Santos, S.R.; Alves, P.F.S.; Kondo, M.K.; Carvalho, A.J.; Feitosa, F.M. Agronomic performance of common bean crops fertigated with treated sewage and mineral fertilizer. Rev. Bras. Eng. Agric. Ambient. 2020, 24, 520–527. [Google Scholar] [CrossRef]
  4. Alves, P.F.S.; Santos, S.R.; Kondo, M.K.; Pegoraro, R.F.; Portugal, A.F. Soil chemical properties in banana crops fertigated with treated wastewater. Caatinga 2019, 32, 234–242. [Google Scholar] [CrossRef]
  5. Siuki, K.; Zohan, M.H.S.; Shahidi, A.; Etminan, S. Effect of application of wastewater treatment on soil chemical and physical properties under millet cultivation. Int. J. Environ. Sci. Technol. 2023, 20, 11851–11864. [Google Scholar] [CrossRef]
  6. Liang, Z.W.; Zou, T.; Liu, X.C.; Liu, G.Y.; Liu, Z. The collaborative operation and application influence of sprinkler drip irrigation: A systematic progress review. Int. J. Agric. Biol. Eng. 2023, 16, 12–27. [Google Scholar] [CrossRef]
  7. Yang, P.; Wu, L.; Cheng, M.; Fan, J.; Li, S.; Wang, H.; Qian, L. Review on drip irrigation: Impact on crop yield, quality, and water productivity in China. Water 2023, 15, 1733. [Google Scholar] [CrossRef]
  8. Soliman, A.I.E.; Morad, M.M.; Wasfy, K.I.; Moursy, M.A.M. Utilization of aquaculture drainage for enhancing onion crop yield under surface and subsurface drip irrigation systems. Agric. Water Manag. 2020, 239, 106244. [Google Scholar] [CrossRef]
  9. Çolak, Y.B.; Yazar, A.; Sesveren, S.; Çolak, İ. Evaluation of yield and leaf water potential (LWP) for eggplant under varying irrigation regimes using surface and subsurface drip systems. Sci. Hortic. 2017, 219, 10–21. [Google Scholar] [CrossRef]
  10. Silva, G.H.; Cunha, F.F.; Brito, L.F.A. Advance time to determine injection and flushing times in drip fertigation. Horticulturae 2022, 8, 1103. [Google Scholar] [CrossRef]
  11. Ait-Mouheb, N.; Mange, A.; Froment, G.; Lequette, K.; Bru-Adan, V.; Maihol, J.C.; Molle, B.; Wéry, N. Effect of untreated or reclaimed wastewater drip-irrigation for lettuces and leeks on yield, soil and fecal indicators. Res. Environ. Sustain. 2022, 8, 100053. [Google Scholar] [CrossRef]
  12. Singh, D.; Patel, N.; Tossou, A.G.; Patra, S.; Singh, N.; Singh, P.K. Incidence of Escherichia coli in vegetable crops and soil profile drip irrigated with primarily treated municipal wastewater in a semi-arid peri urban area. Agriculture 2020, 10, 291. [Google Scholar] [CrossRef]
  13. Wang, Z.; Li, J.; Hao, F.; Li, Y. Effects of Phosphorus Fertigation and Lateral Depths on Distribution of Olsen-P in Soil and Yield of Maize under Subsurface Drip Irrigation; ASABE Paper, No. 1701105; American Society of Agricultural and Biological Engineers: St. Joseph, MI, USA, 2017. [Google Scholar] [CrossRef]
  14. Bhattarai, S.P.; Midmore, D.J.; Pendergast, L. Yield, water-use efficiencies and root distribution of soybean, chickpea and pumpkin under different subsurface drip irrigation depths and oxygation treatments in vertisols. Irrig. Sci. 2008, 26, 439. [Google Scholar] [CrossRef]
  15. Rocha, M.O.; Miranda, A.G.S.; Silva, P.A.; Teixeira, A.S.; Cunha, F.F. Predicting the spatial distribution of water applied by subsurface drip in clay soil. Rev. Bras. Eng. Agric. Ambient. 2024, 28, e277102. [Google Scholar] [CrossRef]
  16. Lamm, F.R. Irrigation and Nitrogen Management for Subsurface Drip Irrigated Corn—25 Years of K-State’s Efforts; ASABE Paper, No. 141914980; American Society of Agricultural and Biological Engineers: St. Joseph, MI, USA, 2014. [Google Scholar] [CrossRef]
  17. Wu, D.; Xu, X.; Chen, Y.; Shao, H.; Sokolowski, E.; Mi, G. Effect of different drip fertigation methods on maize yield, nutrient and water productivity in two-soils in Northeast China. Agric. Water Manag. 2019, 213, 200–211. [Google Scholar] [CrossRef]
  18. Wang, J.; Niu, W.; Li, Y.; Lv, W. Subsurface drip irrigation enhances soil nitrogen and phosphorus metabolism in tomato root zones and promotes tomato growth. Appl. Soil Ecol. 2018, 124, 240–251. [Google Scholar] [CrossRef]
  19. Souza, P.H.G.; Silva, E.M.; Oliveira, A.M.; Jesus, J.S.; Barbosa, E.A.; Neves, J.M.G.; Oliveira, J.A.A.; Camelo, G.N. Rendimento econômico de consórcio irrigado de quiabo e feijão–caupi. Rev. Educ. Ciênc. Tecnol. 2023, 5, 29–43. [Google Scholar] [CrossRef]
  20. Farooq, M.; Rehman, A.; Al-Alawi, A.K.M.; Al-Busaidi, W.M.; Lee, D.J. Integrated use of seed priming and biochar improves salt tolerance in cowpea. Sci. Hortic. 2020, 272, 109507. [Google Scholar] [CrossRef]
  21. Bernardo, S.; Mantovani, E.C.; Silva, D.D.; Soares, A.A. Manual de Irrigação, 9th ed.; Editora UFV: Viçosa, Brazil, 2019; 545p. [Google Scholar]
  22. Santos, H.G.; Jacomine, P.K.T.; Anjos, L.H.C.; Oliveira, V.A.; Lumbreras, J.F.; Coelho, M.R.; Almeida, J.A.; Araújo Filho, J.C.; Oliveira, J.B.; Cunha, T.J.F. Sistema Brasileiro de Classificação de Solos, 5th ed.; Embrapa: Brasília, Brazil, 2018; 356p. [Google Scholar]
  23. Nopens, I.; Capalozza, C.; Vanrolleghem, P.A. Stability Analysis of a Synthetic Municipal Wastewater, 1st ed.; University of Gent: Gent, Belgium, 2001; 22p. [Google Scholar]
  24. Ribeiro, A.C.; Guimarães, P.T.G.; Alvarez, V.H. Recomendações Para o Uso de Corretivos e Fertilizantes em Minas Gerais, 5th ed.; Editora SBCS: Viçosa, Brazil, 1999; 359p. [Google Scholar]
  25. Melo, F.B.; Cardoso, M.J.; Salviano, A.A.C. Fertilidade do Solo e Adubação. In Feijão Caupi: Avanços Tecnológicos, 1st ed.; Freire Filho, F.R., Lima, J.A.A., Ribeiro, V.Q., Eds.; Embrapa: Brasília, Brazil, 2005; pp. 229–242. [Google Scholar]
  26. Matos, A.T.; Matos, M.P. Disposição de Águas Residuárias no solo e Em Sistemas Alagados Construídos, 1st ed.; Editora UFV: Viçosa, Brazil, 2017; 71p. [Google Scholar]
  27. Kodinariya, T.; Makwana, P.R. Review on determining number of Cluster in K-Means Clustering. Int. J. Adv. Res. Comput. Sci. Manag. Stud. 2013, 1, 90–95. [Google Scholar]
  28. Liu, Y.; Hu, C.; Li, B.; Ding, D.; Zhao, Z.; Fan, T.; Li, Z. Subsurface drip irrigation reduces cadmium accumulation of pepper (Capsicum annuum L.) plants in upland soil. Sci. Total Environ. 2021, 755, 142650. [Google Scholar] [CrossRef]
  29. Araújo, E.D.; Assis, M.O.; Guimarães, C.M.; Araújo, E.F.; Borges, A.C.; Cunha, F.F. Superabsorbent polymers and sanitary sewage change water availability during the cowpea emergence phase. Nativa 2024, 12, 37–48. [Google Scholar] [CrossRef]
  30. Nunes, L.R.L.; Pinheiro, P.R.; Pinheiro, C.L.; Lima, K.A.P.; Dutra, A.S. Germination and vigour in seeds of the cowpea in response to salt and heat stress. Caatinga 2019, 32, 143–151. [Google Scholar] [CrossRef]
  31. Nogueira, V.H.B.; Diotto, A.V.; Thebaldi, M.S.; Colombo, A.; Silva, Y.F.; Lima, E.M.C.; Resende, G.F.L. Variation in the flow rate of drip emitters in a subsurface irrigation system for different soil types. Agric. Water Manag. 2021, 243, 106485. [Google Scholar] [CrossRef]
  32. Hebbar, S.S.; Ramachandrappa, B.K.; Nanjappa, H.V.; Prabhakar, M. Studies on NPK drip fertigation in field grown tomato (Lycopersicon esculentum Mill.). Eur. J. Agron. 2004, 21, 117–127. [Google Scholar] [CrossRef]
  33. Wu, R.; Liu, B.; Xue, B.; Gao, R.; Ndzana, G.M.; Liu, R.; Huang, J.; An, H.; Du, L.; Kamran, M. Changes in soil organic carbon and nutrient pools in aggregate-sized fractions along a chronosequence of wolfberry (Lycium barbarum L.) plantations in arid areas of Northwest China. Soil Use Manag. 2023, 39, 1109–1124. [Google Scholar] [CrossRef]
  34. Nascimento, D.C.; Corrêa, G.R.; Gradella, F.S.; Campos, P.V.; Koch, V.A.; Vasconcelos, B.N.F. Solos de ambientes lacustres do Pantanal Sul-Mato-Grossense. Soc. Nat. 2023, 35, e67560. [Google Scholar] [CrossRef]
  35. Primavesi, A.C.; Primavesi, O.; Corrêa, L.A.; Cantarella, H.; Silva, A.G. Cations and anions uptake by coastcross grass fertilized with urea and ammonium nitrate. Pesqui. Agropecu. Bras. 2005, 40, 247–253. [Google Scholar] [CrossRef]
Figure 1. Environmental conditions during the experimental period.
Water 16 01194 g001
Figure 2. The figure shows the net CO2 exchange rate soil (NCER), water vapor flux (WFlux), soil surface temperature, grain production per plant, dry matter of cowpea stem per plant, and dry matter of weeds in fertigated treatments with synthetic sewage applied by drip emitter installed at different depths.
Water 16 01194 g002
Figure 3. The figure shows the phosphorus (P), potassium (K), and sodium in different soil layers, L0–10; L10–20; L20–30; L30–40; L40–55 cm, fertigated with synthetic sewage applied by drip emitters operating at different flow rates and installation depths.
Water 16 01194 g003
Figure 4. The figure shows the calcium (Ca), magnesium (Mg), and sodium saturation index (SSI) in different soil layers (L0–10, L10–20, L20–30, L30–40, and L40–55 cm) fertigated with synthetic sanitary sewage applied through drip emitters installed at different depths.
Water 16 01194 g004
Figure 5. The figure shows the hydrogenionic potential (pH), electrical conductivity (EC), potential acidity (H + Al), and base saturation (V) in different soil layers (L0–10, L10–20, L20–30, L30–40, and L40–55 cm) fertigated with synthetic sanitary sewage applied through drip emitters operating at different flow rates and installation depths.
Water 16 01194 g005
Figure 6. The figure shows the principal component analysis and cluster analysis of different emitter flow rates (Fq—1.6 L h−1 and FQ—3.8 L h−1) and for different drip emitter installation depths (D0 to D30). Points of the same color belong to the same group.
Water 16 01194 g006
Table 1. The table shows the chemical and physico-hydric attributes of the soil before the implementation of the experiments.
pH1 OM2 Ca2 Mg3 SB4 eCEC5 CEC6 H + Al
H2Og kg−1cmolc L−1
5.818.821.010.501.561.564.202.64
7 P7 K8 S7 Cu7 Fe7 Mn7 Zn9 Pres10 V
mg L−1 %
4.620.025.33.068.233.14.721.637.1
11 FC12 PWP13 SdSandSiltClayTextural Classification
m³ m³ g cm−3 g kg−1
0.3760.2541.17517122361Sand clay soil
Notes: 1 Organic matter, as determined by colorimetry; 2 extractant: KCl 1 M; 3 sum of bases; 4 effective cation exchange capacity; 5 cation exchange capacity at pH 7; 6 extractant: 0.5 mol L−1 calcium acetate—pH 7.0; 7 extractant: Mehlich-1; 8 extractant—Monocalcium phosphate in acetic acid; 9 residual phosphorus, as determined in equilibrium solution of P; 10 base saturation; 11 field capacity; 12 permanent wilting point; and 13 soil density.
Table 2. The table shows the theoretical composition and respective concentrations for the production of 1 L of synthetic sanitary sewage.
Salts1 Quantity2 CODNPK
mg L−1
Urea92234300
MAP130130
Sodium acetate *13279000
Peptone1717100
MgSO4200000
KH2PO4230057
KCl2500013
FeSO4·7H2O5.80000
Ingredients
Starch122122000
Powdered milk116116710
Yeast5252600
Soybean oil2929000
Total 43858920
Notes: 1 Mass quantity of salts and ingredients for the production of 1 L of synthetic sanitary sewage; * Hydrated sodium acetate. 2 Chemical oxygen demand.
Table 3. The table shows the total volume of synthetic sanitary sewage (SSS) applied in each experimental unit and nutrients supplied by SSS and mineral fertilization.
¹ Vol. of
SSS (L)
N (kg ha−1) P2O5 (kg ha−1)K2O (kg ha−1)
SSSSowingTotalSSSSowingTotalSSSSowingTotal
8.262002013.5646.446015.8524.1540
Note: 1 Volume of synthetic sanitary sewage applied throughout the experiment.
Table 4. The table shows analyzed soil chemical variables and their respective quantification methods.
Variable AnalyzedMethod
Phosphorus (P)Extractant Mehlich-1
Potassium (K)Extractant Mehlich-1
Sodium (Na)Extractant Mehlich-1
Calcium (Ca)Extractant: KCl—1 mol L−1
Magnesium (Mg)Extractant: KCl—1 mol L−1
Sodium saturation index (SSI)SSI = Na/CEC × 100
pHIn water, KCl, and CaCl—Ratio 1:2.5
Potential acidity (H + Al)Extractant: 0.5 mol L−1 calcium acetate—pH 7.0
Base saturation index (V)V = (K + Na + Ca + Mg)/CEC × 100
Notes: CEC—Cation exchange capacity at pH 7; P, K, Na in mg dm−3; Ca, Mg, and H + Al in cmolc dm−3; SSI and V in %.
Table 5. The table shows a summary of the analysis of variance for net CO2 exchange rate soil (NCER), water vapor flux (WFlux), and soil surface temperature (Ts), grain production per plant (Prod.), dry matter of the cowpea stem per plant (DM-stem), dry matter of weeds (DM-weed) in treatments fertigated with synthetic sewage applied by drip emitters operating at different flow rates (flow) and installation depths (depths).
VariablesSource of Variation
FlowDepthFlow × DepthCV (%)
NCER3.30 × 10−1 ns2.25 × 10−1 ns1.06 × 10−1 ns42.33
WFlux2.58 × 10−3 ns1.19 × 10−2 ***5.55 × 10⁻⁴ ns29.05
Ts2.54 × 10−1 ns2.09 × 101 ***2.59 × 100 ns5.25
Prod.1.53 × 101 ns8.73 × 102 ***2.31 × 101 ns15.37
DM-stem8.70 × 10−2 ns9.56 × 101 ***3.30 × 100 ns17.87
DM-weed1.06 × 101 ns2.92 × 101 *9.76 × 100 ns251.51
Notes: Mean squares followed by *** and * are significant at 0.1 and 5%, respectively, and ns indicates non-significance by the F-test.
Table 6. The table shows a summary of the analysis of variance for phosphorus (P), potassium (K), and sodium (Na) at different soil layers, L0–10; L10–20; L20–30; L30–40; L40–55 cm, and comparison of mean sodium and potassium supplied through fertigation with synthetic sewage applied by drip emitters with different flow rates (flow) and installation depths (depths).
VariablesSource of Variation
FlowDepthFlow × DepthCV (%)
P L0−107.28 × 10² ns1.09 × 102 *3.32 × 102 ns26.06
P L10−209.45 × 10⁻¹ ns3.21 × 100 ns2.73 × 100 ns27.15
P L20−308.60 × 10⁻² ns4.52 × 10−1 ns1.43 × 10−1 ns15.59
P L30−404.61 × 10⁻¹ ns3.11 × 10−1 **7.60 × 10⁻² ns9.70
P L40−555.71 × 10⁻¹ ns1.90 × 10−1 ns2.89 × 10−2 ns12.60
K L0−107.46 × 10² ns2.77 × 103 ***1.01 × 10² ns18.78
K L10−201.84 × 10² ns4.21 × 102 *1.36 × 102 ns52.85
K L20−308.86 × 101 *7.40 × 101 ***1.63 × 101 ns31.19
K L30−401.34 × 102 *4.60 × 101 **9.21 × 100 ns31.10
K L40−559.15 × 101 **3.92 × 101 **4.97 × 100 ns34.38
Na L0−109.47 × 100 ns6.22 × 101 ***1.47 × 101 *21.33
Na L10−208.98 × 10⁻¹ ns3.69 × 101 ***4.82 × 100 ns81.92
Na L20−301.79 × 100 ns4.27 × 101 ***1.67 × 100 ns35.54
Na L30−408.95 × 10⁻¹ ns2.16 × 101 ***1.68 × 100 ns28.73
Na L40−551.10 × 10⁻¹ ns1.23 × 101 ns6.53 × 10−1 ns28.26
VariablesFlow
(L h−1)
Drip emitter installation depth (cm)
051015202530
Na L0−101.615.58 a15.58 a9.64 a6.91 b7.58 a8.31 a7.57 a
3.817.50 a11.04 b11.04 a13.03 a8.41 a9.07 a7.73 a
Flow
(L h−1)
Variables
K L20−30 K L30–40 K L40–55
1.6 10.19 b 9.05 b 7.62 b
3.8 13.09 a 12.61 a 10.57 a
Notes: Mean squares followed by ***, **, and * are significant at 0.1, 1, and 5%, respectively, and ns indicates non-significance by the F-test. Within each drip emitter installation depth or soil layer, means followed by the same lowercase letter in the column do not differ from each other at 0.05 by the F-test.
Table 7. The table shows a summary of the analysis of variance for calcium (Ca), magnesium (Mg), and sodium saturation index (SSI) in different soil layers: L0–10, L10–20, L20–30, L30–40, and L40–55 cm, fertigated with synthetic sewage applied by drip emitters operating at different flow rates (flow) and installation depths (depths).
VariablesSource of Variation
FlowDepthFlow × DepthCV (%)
Ca L0–101.20 × 10⁴ ns3.25 × 10−1 *1.85 × 10−1 ns11.12
Ca L10–208.60 × 10⁻⁴ ns1.12 × 10−1 **3.02 × 10⁻² ns10.90
Ca L20–306.44 × 10⁻³ ns2.96 × 10−2 *6.49 × 10−3 ns6.66
Ca L30–407.47 × 10⁻³ ns2.89 × 10−2 *7.23 × 10−3 ns7.65
Ca L40–551.72 × 10⁻² ns2.17 × 10−2 ns1.22 × 10−2 ns9.25
Mg L0–101.04 × 10⁻² ns7.85 × 10−2 ***5.16 × 10⁻³ ns11.72
Mg L10–202.88 × 10⁻⁴ ns1.48 × 10−2 *5.70 × 10−3 ns11.58
Mg L20–302.75 × 10⁻³ ns3.28 × 10−3 ns1.85 × 10−3 ns7.59
Mg L30–401.27 × 10⁻² ns2.43 × 10−3 ns3.21 × 10−4 ns8.33
Mg L40–551.61 × 10⁻³ ns2.78 × 10−3 ns2.30 × 10−3 ns8.47
SSI L0–105.94 × 10⁻² ns4.65 × 10−1 ***4.06 × 10⁻² ns19.07
SSI L10–204.00 × 10⁻³ ns3.37 × 10−1 ***4.38 × 10⁻² ns81.24
SSI L20–302.83 × 10⁻² ns4.14 × 10−1 ***1.69 × 10⁻² ns35.17
SSI L30–409.75 × 10⁻³ ns2.13 × 10−1 ***1.59 × 10⁻² ns27.59
SSI L40–555.72 × 10⁻³ ns1.11 × 10−1 ns8.74 × 10−3 ns25.74
Notes: Mean squares followed by ***, **, and * are significant at 0.1, 1, and 5%, respectively, and ns indicates non-significance by the F-test.
Table 8. The table shows a summary of variance analysis of hydrogenionic potential (pH), electrical conductivity (EC), potential acidity (H + Al), base saturation (V) in different soil layers (L0–10, L10–20, L20–30, L30–40, and L40–55 cm), and comparison of mean potential acidity in layer L30–40, fertigated with synthetic sanitary sewage applied through drip emitters with different flow rates (flow) and installation depths (depths).
VariablesSource of Variation
FlowDepthFlow × DepthCV (%)
pH L0–109.52 × 10⁻⁴ ns1.92 × 10−2 ns3.80 × 10−2 ns2.78
pH L10–203.15 × 10⁻² ns2.72 × 10−2 ns1.35 × 10−2 ns2.03
pH L20–301.30 × 10⁻¹ ns2.40 × 10−2 ns1.62 × 10−2 ns2.03
pH L30–401.97 × 10⁻¹ ns2.25 × 10−2 **4.81 × 10⁻³ ns1.43
pH L40–551.72 × 10⁻¹ ns3.90 × 10−2 ns8.98 × 10−3 ns2.48
EC L0–103.28 × 10⁴ ns5.76 × 104 ***7.98 × 10³ ns17.72
EC L10–201.78 × 101 ns1.79 × 103 ns6.48 × 101 ns29.82
EC L20–301.23 × 101 ns1.85 × 102 ns1.12 × 102 ns18.17
EC L30–407.90 × 10⁻¹ ns3.36 × 101 ns4.83 × 101 ns12.21
EC L40–558.65 × 101 ns2.18 × 102 ns4.22 × 102 ns29.05
H + Al L0–102.14 × 10⁻¹ ns2.44 × 10−2 ns1.65 × 10−2 ns6.76
H + Al L10–201.48 × 10−1 *6.91 × 10−3 ns1.33 × 10−2 ns5.42
H + Al L20–302.38 × 10⁻² ns3.71 × 10−2 *2.10 × 10−2 ns4.77
H + Al L30–402.00 × 10⁻¹ ns6.65 × 10−2 **3.75 × 10−2 *4.61
H + Al L40–552.01 × 10⁻¹ ns9.97 × 10−2 ns1.30 × 10−2 ns8.36
V L0–104.08 × 101 ns4.85 × 101 ***9.91 × 100 ns4.54
V L10–202.36 × 101 ns3.34 × 101 **5.71 × 100 ns5.81
V L20–302.88 × 100 ns1.02 × 101 ns1.27 × 100 ns4.62
V L30–405.13 × 101 ns2.14 × 101 ***2.76 × 100 ns3.71
V L40–551.36 × 101 ns2.82 × 101 **3.46 × 100 ns5.86
VariablesFlow
(L h−1)
Drip emitter installation depth (cm)
051015202530
H + Al L30–401.62.63 a2.73 a2.53 a2.53 a2.30 a2.63 a2.77 a
3.82.57 a2.47 b2.57 a2.30 b2.40 a2.37 b2.50 b
Flow
(L h−1)
Variables
H + Al L10–20
1.62.56 a
3.82.44 b
Notes: Mean squares followed by ***, **, and * are significant at 0.1, 1, and 5%, respectively, and ns indicates non-significance by the F-test. Within each drip emitter installation depth or soil layer, means followed by the same lowercase letter in the column do not differ from each other at 0.05 by the F-test.
Disclaimer/Publisher’s Note: The statements, opinions and data contained in all publications are solely those of the individual author(s) and contributor(s) and not of MDPI and/or the editor(s). MDPI and/or the editor(s) disclaim responsibility for any injury to people or property resulting from any ideas, methods, instructions or products referred to in the content.