Article

Experimental Study of Water Vapor Adsorption on Bare Soil and Gravel Surfaces in an Arid Region of Ningxia, China

1
Guangdong Provincial Key Laboratory for Marine Civil Engineering, School of Civil Engineering, Zhuhai Campus, Sun Yat-sen University, Zhuhai 519082, China
2
State Key Laboratory for Tunnel Engineering, Zhuhai 519082, China
3
Guangdong Research Institute of Water Resource and Hydropower, Guangzhou 510630, China
*
Author to whom correspondence should be addressed.
Water 2024, 16(7), 984; https://doi.org/10.3390/w16070984
Submission received: 15 December 2023 / Revised: 26 January 2024 / Accepted: 8 March 2024 / Published: 28 March 2024
(This article belongs to the Section Soil and Water)

Abstract

:
Water vapor adsorption on soil, a crucial non-rainfall water resource in arid regions, warrants further experimental investigation, particularly on two typical land surfaces: bare soil and gravel. This study examined the formation characteristics and influencing factors of vapor adsorption in an arid region of Northwestern China. Observations and analyses were conducted on adsorption and evaporation measurements taken by two small weighing lysimeters (SLSs); soil temperature at a depth of 5 cm; surface temperature; relative humidity; and air temperature at a height of 30 cm above the ground from 2019 to 2020. The adsorbed water in this area was more abundant at night and less abundant during the day, with a stable nightly adsorption rate of 0.013 mm/h. Adsorption was more frequent in spring and winter (from January to June and November to December), accounting for about 90% of the total annual adsorption. In 2019 and 2020, the ratio values of adsorption to evaporation were 0.16 and 0.10 for bare soil, and 0.10 and 0.12 for gravel, respectively. Adsorption was more likely to occur when the soil moisture content was less than 13%; the highest adsorption frequency was close to 20% when the RH was between 75 and 95%; low soil temperatures were more conducive to the occurrence of adsorption. The effect of temperature differences (Ta−Ts) on adsorption was stronger than that of relative humidity. The adsorption frequency generally showed a bimodal change with increasing temperature difference, but the effect of temperature differences was less effective for gravel than bare soil. When the relative humidity was high and the temperature difference was weakly positive, the maximum adsorption intensity could reach 0.18 mm/h.

1. Introduction

In arid and semi-arid areas, natural precipitation is scarce, and non-rainfall water plays a vital role as a source of land surface moisture and is a crucial player in the water cycle [1,2,3]. Moreover, it is integral to the formation of certain desert biomes, soil crusts, and the dryland carbon cycle [4,5]. The correlation results from a previous study showed that non-rainfall water contributed to evapotranspiration, reaching a peak value of 18.4%, and compared to rainfall events, non-rainfall water occurred more frequently with stable amounts [6]. Non-rainfall water resources include fog, dew, and adsorbed water in the soil [7,8]. Fog formation is contingent upon the saturation of water vapor; dew occurs when the surface temperature is equal to or lower than the dew point temperature; vapor adsorption occurs when there is a moisture difference between the air and soil and the soil surface temperature is above the dew point [9,10,11]. Water vapor adsorption, a primary source of non-rainfall water, predominantly occurs at night, and its volume accounts for more than half of the total water accumulation [12]. Under natural conditions, water adsorption is a reversible interfacial phenomenon in which gaseous water molecules are physically adsorbed onto the surface of solid soil particles. From the perspective of soil moisture, the water obtained through the physical adsorption of soil particles is classified as bound water, that is, hygroscopic water (strongly bound water) and pellicular water (weakly bound water).
Unlike dew and fog water, which have been studied extensively, the formation mechanism and distribution pattern of adsorbed water are very complicated and less understood [13,14,15], and current studies often fail to distinguish between fog, dew, and adsorbed water [16,17,18]. The soil types present in arid regions are mainly bare soil, gravel, and biological soil crusts, and there are great differences in their adsorption characteristics due to their specific surface area [19,20,21,22]. In terms of a certain soil, the magnitude of adsorption is mainly influenced by soil water content and temperature. The adsorption depth is positively correlated with the fluctuation amplitude of the soil surface moisture [11,23]. The effect of temperature on adsorption is multifaceted: an increase in soil temperature decreases the viscosity and surface tension of water, thereby decreasing adsorption; concurrently, the increase in air temperature increases water vapor pressure, facilitating water vapor transport along the temperature gradient; the increase in temperature also intensifies soil evaporation, making it easier for water to escape from soil particles [24,25]. In addition to the soil’s inherent adsorption properties, sufficient water vapor is also pivotal to the formation of adsorbed water. As critical meteorological conditions affecting water vapor transport, near-surface temperature and humidity affect adsorbed water formation in soil [5,26].
The obstruction of water vapor transmission by stones has been demonstrated in several studies, which resulted in a diminished adsorption capacity in gravel compared to bare soil during the nighttime, accompanied by a reduction in the rate of water evaporation [8,16,27]. However, gravel cover also increases the soil temperature, which in turn makes it easier for water to escape from the soil grain [25,28,29]. Moreover, the interaction between the temperature gradient and moisture gradient has significant implications for adsorption [1,29,30]. Despite these observations, the mechanisms of the influence of hydrothermal and micrometeorological conditions on the formation of adsorbed water in different soil types are still insufficiently studied.
The purpose of this study was to investigate the variation characteristics of water vapor adsorption on bare soil and gravel cover, as well as to carry out a study on the quantitative regulation and formation mechanism of adsorbed water vapor in terms of micrometeorology and soil hydrothermal conditions, to assess the contribution of water vapor adsorption to surface water balance, and to enrich the theoretical study of water vapor adsorption.

2. Materials and Methods

2.1. Site Description

Two small experimental weighing lysimeters (SLSs) were installed at Yuquanying Farm, Yongning County, Ningxia Hui Autonomous Region, China (38.25° N, 106.02° E, 1140 m). The study site, nestled in the alluvial plain of the Yellow River and the alluvial fan of the Helan Mountains, resides in the mid-temperate arid climate zone and exhibits pronounced continental climate characteristics. The average annual temperature is 8.7 °C, and the average annual and daily variance is 31.5 °C and 13.6 °C, respectively. The average frost-free period spans 167 days. The annual sunshine hours amount to 2866.7 h, which are characterized by extended sunlight and significant temperature fluctuations http://www.nxyn.gov.cn/ (accessed on 23 January 2024). The average precipitation for many years is 198.19 mm and the average annual evapotranspiration is 1186.73 mm [31]. The predominant soil type in the research area is sandy loam, accounting for 47.81%. The soil bulk density is approximately 1.48 g/cm3. In terms of porosity characteristics, ventilated pores are the primary type, with fewer non-active pores. The field capacity of the soil is 14.26%, and the saturated water content is 24.26% [32].

2.2. Lysimeter Data

In this study, two automated SLSs (LYS40, Beijing Sinton Technology Co., Beijing, China) were utilized to measure the adsorbed water in the soil with a weighing column with a size of D = 40 cm and H = 50 cm. The weighing range was from 0 to 220 kg with an accuracy of 1 g and the resolution of evaporation (or adsorption) and seepage was 0.008 mm and 0.04 mm, respectively. The main bucket of the SLSs isolates the soil core from the surrounding soil. It is made of PVC material and exhibits excellent insulation properties.During soil collection, the lower opening of the SLS soil column was positioned downward toward the desired soil sampling location, while keeping the soil column vertical. After adjusting the edges of the soil column, it was inserted into the soil by cutting downward, ensuring that the depth of each excavation and adjustment was less than or equal to 5 cm. After multiple excavations, undisturbed soil cores were obtained. The upper opening of the SLS outer bucket was raised 3–5 cm above the ground. One SLS was designated as the bare soil surface (i.e., the original soil in the experimental area), while the other was uniformly covered with gravel on the top of the original soil surface. At the beginning, the experiment ensured that the soil type and the total mass of the original soil column were same for two SLSs. The layout is shown in Figure 1.
Data pertaining to the soil hydrothermal conditions and above-ground meteorological conditions were observed using a soil parameter monitoring system and an automatic weather station. The latter comprised infrared temperature sensors (Apogee S-411, USA), along with an air temperature and humidity sensor (Vaisala HMP155A-L, Finland). The weather station was installed at 30 cm above the SLSs. The air temperature range was −50 to 70 °C with a 0.1 °C resolution; the humidity range was 0 to 100% with a 0.1% resolution. Each SLS was equipped with three TDR-3 soil moisture sensors and a single soil temperature sensor, all positioned at a depth of 5 cm [16]. The sensors could measure 0 to 100% volumetric soil water content with a resolution of 0.1%, and a soil temperature range of −40 to 80 °C with a resolution of 0.1 °C.
The experiment station was outfitted with a GPRS data collector, enabling automated data storage and remote transmission. All instruments were set to measure at five-minute intervals, with data acquisition occurring every hour.

2.3. Adsorption Identification Process

We filled in missing values in the collection process through interpolation, with only a few isolated instances of data points missing over the nearly two-year period. The observations from the SLSs required preprocessing to mitigate the impact of extraneous factors, such as dust storms, on the determination of water variability components in the vaporimeter observations [33,34]. Initially, the data collected during evident non-adsorption events, including rainfall, snowfall, and dust storms, were excluded. Subsequently, anomalous and incorrect values in the original observations were discarded. Lastly, threshold filtering was applied to eliminate unreasonable data through visual inspection. Referring to the previous studies [33,35,36], the threshold value for water vapor adsorption in this study was set to 0.08 mm/h. To validate this threshold, observations in hourly increments ranging from 0.088 to 0.160 mm (above the threshold) were selected. Out of the 86 occurrences at this level, only 13 instances lacked corresponding weather station data for the day, suggesting the threshold was reasonably set. Ultimately, the screened and preprocessed data were used for subsequent analyses of adsorbed water.
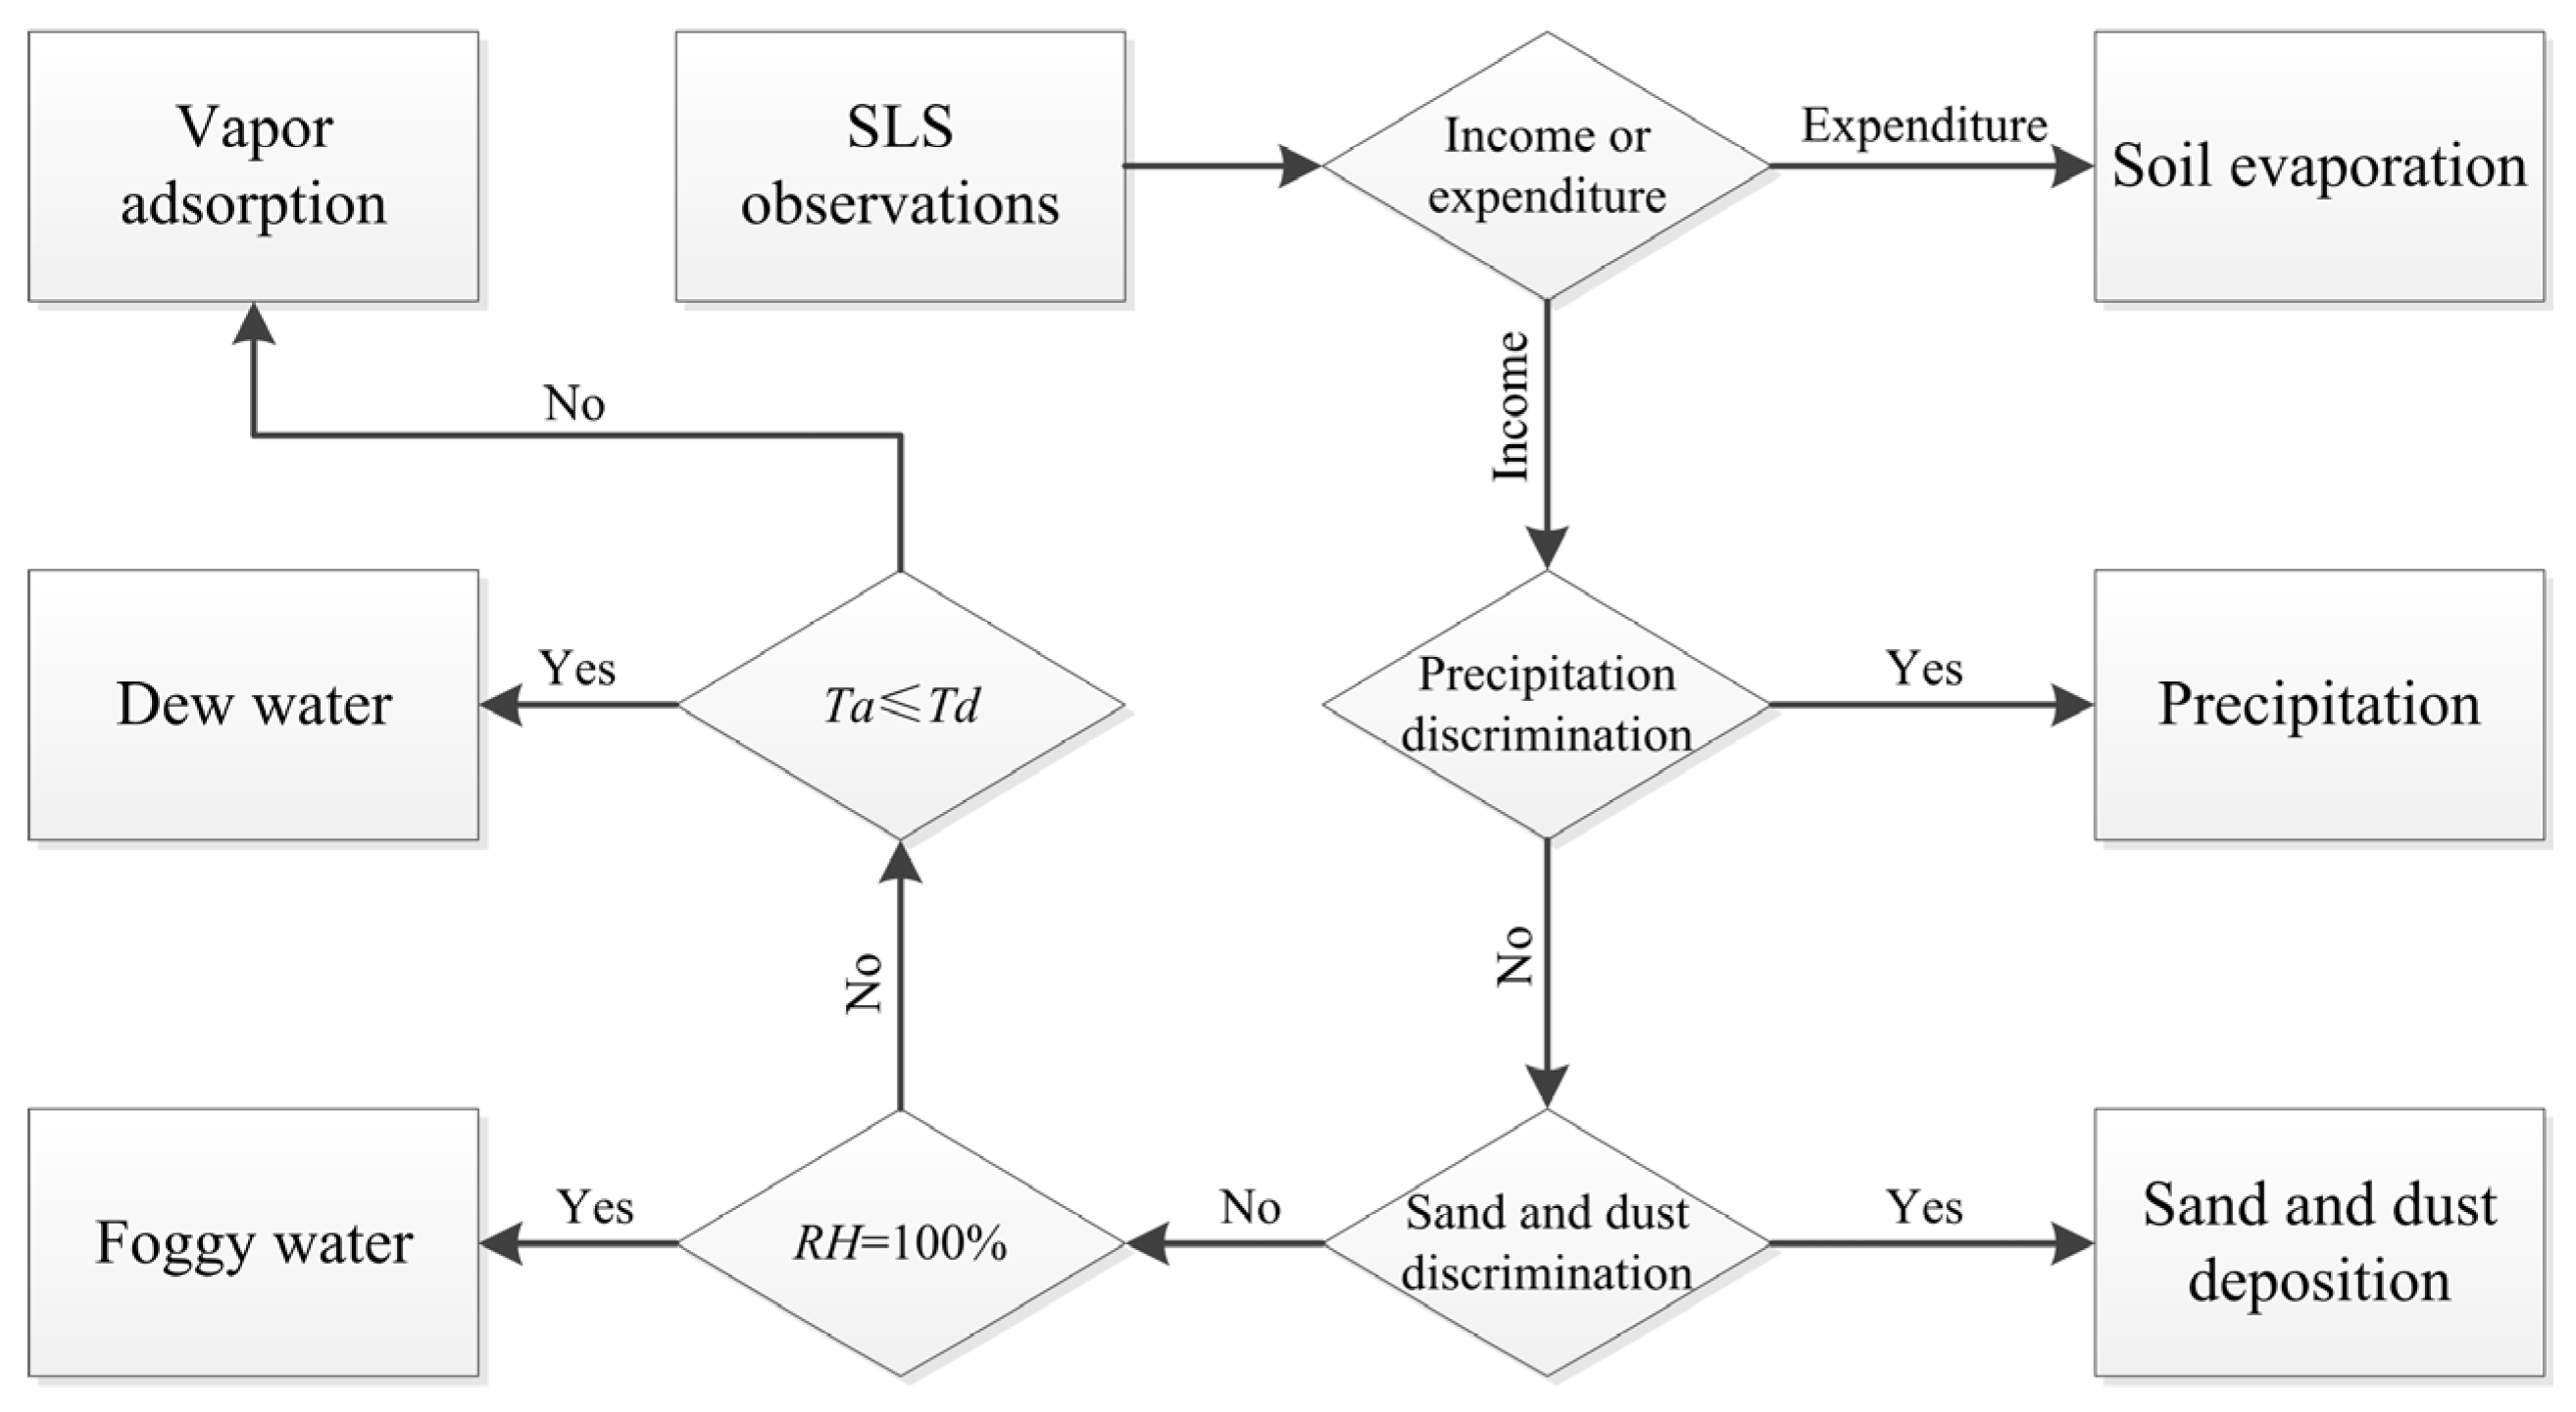
Upon securing reliable data from the SLSs, deemed as non-rainfall water, it was essential to discriminate among the fog, dew, and water vapor adsorption components to filter the water vapor adsorption data. The discrimination was made according to the process shown in Figure 2 [29]. During the experimental observations spanning from 2019 to 2020, instances where the near-surface air temperature reached the dew point were virtually non-existent, and dew occurrences were minimal throughout the observation period. The adsorption threshold was also used to exclude the impact of rarely occurring dew during periods of missing meteorological data; then the vapor adsorption data were obtained.

2.4. Statistical Analysis

The equation for calculating the amount of water adsorption by the soils is as follows:
T = 10 W S W S 1 A · ρ
where T is the amount of adsorbed water (or dew water) during a period, mm; A is the surface area of the SLS, which is 1256 cm2; Ws−1 and Ws are the total mass of the SLS at the moment of s−1 and s, respectively, measured in g; and ρ is the density of water, 1 g/cm3.
In this study, the formation duration and frequency of adsorbed water were explored. The annual average daily variation in the adsorption intensity and the adsorption frequency were calculated using the following equations:
I h j = i = 1 N d j T i , j N d j
I m k = i = 1 M k j = 1 24 T k , i , j M d k
f h j = N d j 365 × 100 %
f m k = M m k M k × 100 %
where Ih(j) denotes the average adsorption intensity rate at the jth hour of all days in the year, mm/h; Im(k) denotes the average adsorption intensity rate in the kth month of the year, mm/h; fh(j) denotes the average adsorption frequency at the jth hour of all days in the year; fm(k) denotes the average adsorption frequency in the kth month during the year; T(k, i, j) indicates the adsorption intensity rate at the jth hour of the ith day in the kth month, mm/h; Nd(j) denotes the amount of adsorbed water formed at the jth hour of all days in the year; Md(k) denotes the amount of adsorbed water formed in the kth month in the year, Nd(j) ≤ 365, Md(k) ≤ 24 ∗ 31; Mm(k) is the number of days that adsorption occurred in the kth month, Mm(k) ≤ 31; M(k) is the total number of days in the kth month, M(k) = {28, 29, 30, 31}; and k/i/j stands for month, day, and hour, respectively.
We summarized and analyzed all the obtained meteorological data in Excel. Simultaneously, we categorized the data from the SLSs into evaporation and soil adsorption based on the soil water adsorption determination process. Subsequently, we calculated the adsorption intensity and frequency at different time scales. Finally, the results were visualized using Origin 2018b (OriginLab Inc., Northampton, MA, USA) and MATLAB 2013b (MathWorks Inc., Natick, MA, USA).

3. Results

3.1. Water Vapor Adsorption Statistics

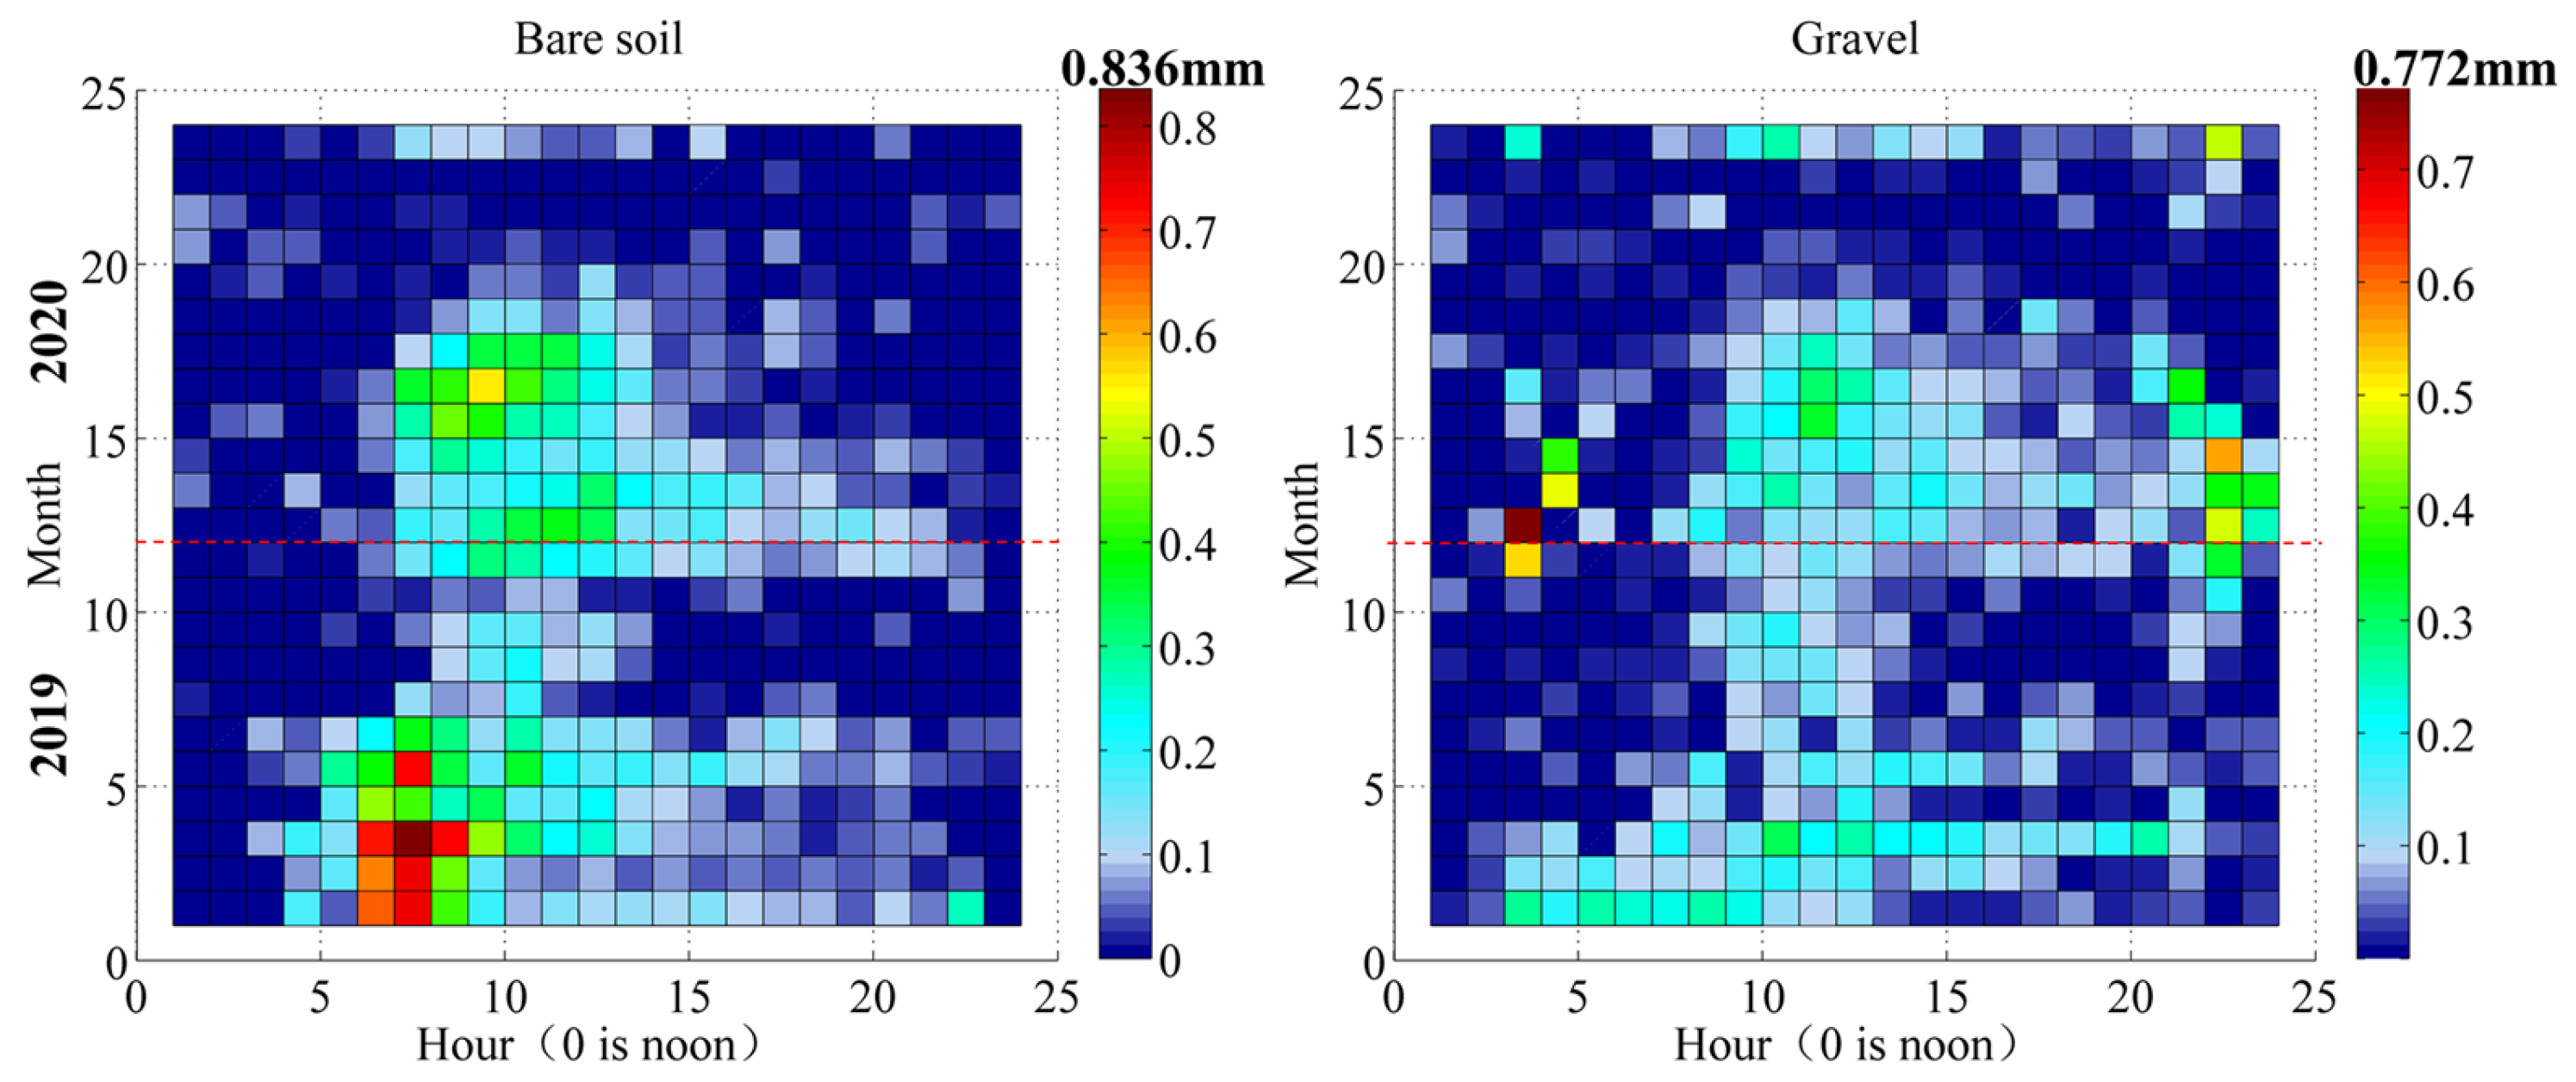
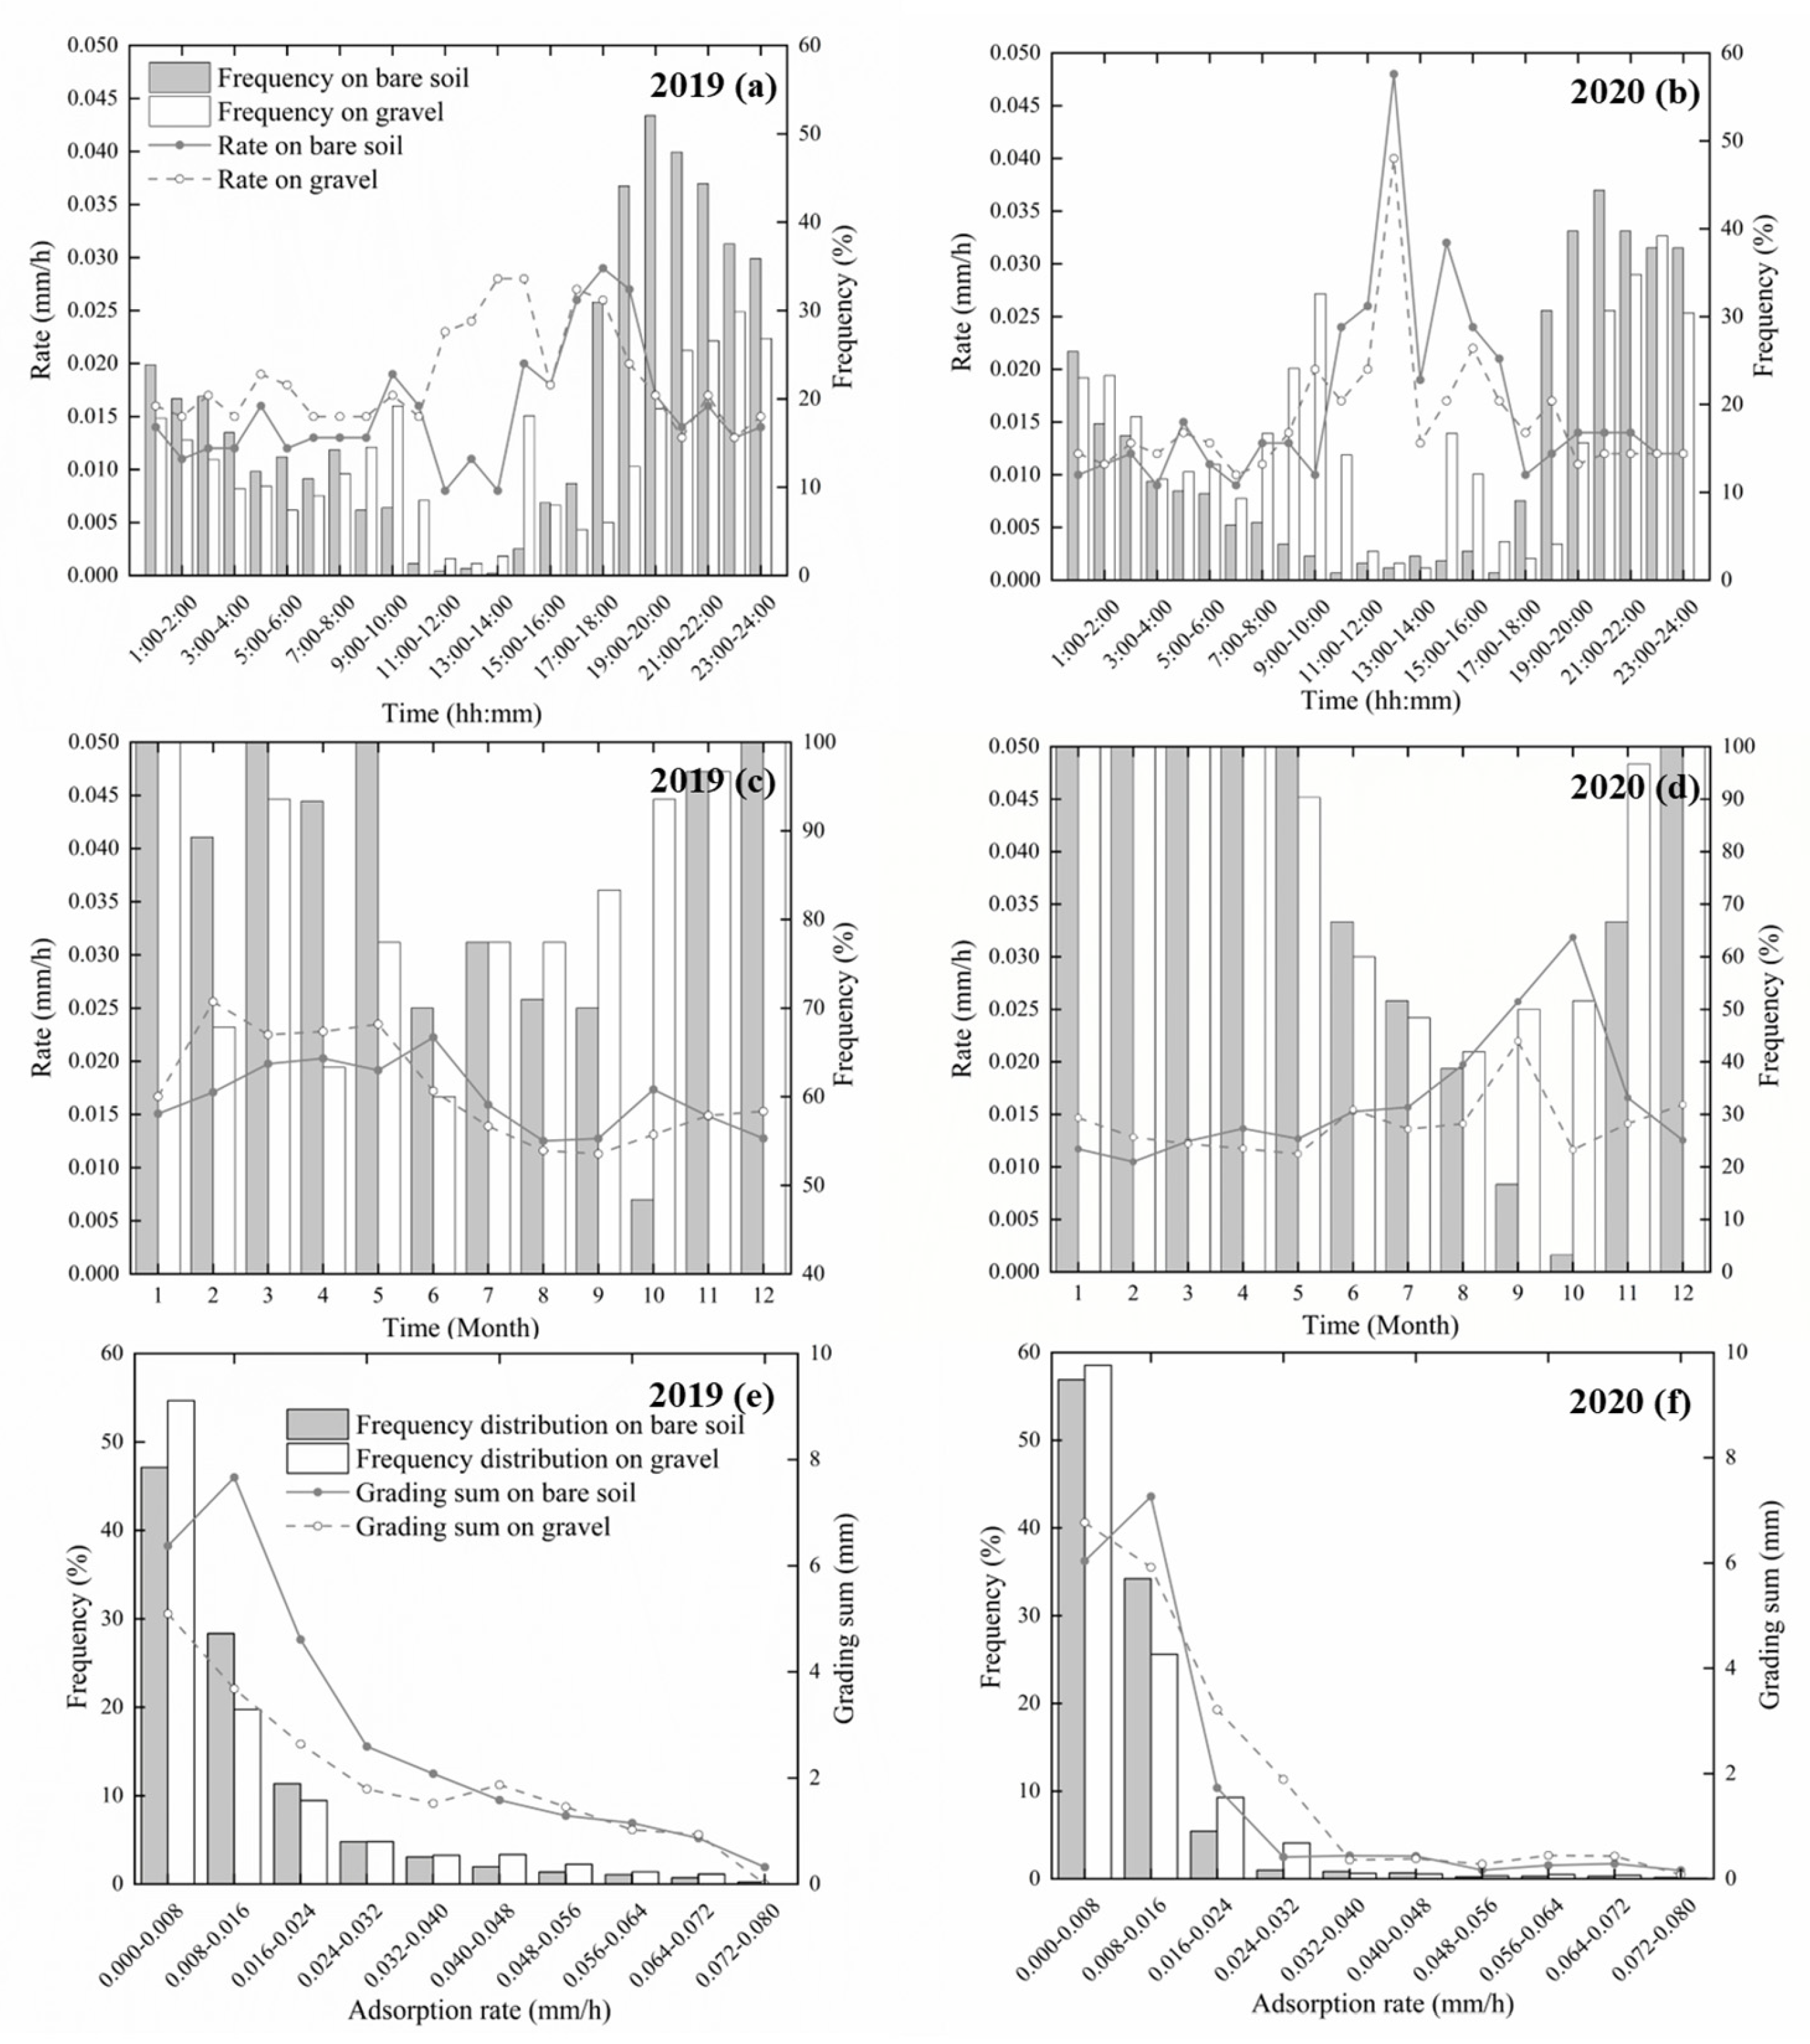
Considering that the significant variability in the formation of adsorbed water across different time scales, the adsorption characteristics were assessed in three dimensions (daily variation, monthly scale, and volume hierarchy) in terms of adsorption volume, intensity, and frequency, as illustrated in Figure 3 and Figure 4. In general, the sums of vapor adsorption on the bare soil and gravel were 28.39 and 19.79 mm in 2019, and 17.11 and 19.68 mm in 2020, respectively (Table 1). Intriguingly, lower annual rainfall seemed to enhance the production of adsorption. Adsorbed water was predominantly produced in spring and winter, with the majority of adsorption occurring from 17:00 to 9:00 during these seasons, resulting in an “adsorption cycle” as shown in Figure 3. Overall, the bare soil and gravel exhibited similar adsorption capacities. Looking at all the data from the two years, the bare soil produced a greater amount of adsorbed water compared to the gravel.
Regarding daily variation (Figure 4a,b), the frequency of vapor adsorption was high in the nighttime, peaking from 19:00 to 20:00. While the frequency of adsorption was less than 3%, the average adsorption intensity was notably high between 12:00 and 14:00, except for the bare soil in 2019. In addition, the bare soil produced adsorbed water more frequently than the gravel at night. The average adsorption intensity rate for the bare soil and gravel was 0.0155 mm/h and 0.0186 mm/h in 2019, and 0.0164 mm/h and 0.0152 mm/h in 2020, respectively. In 2019, although the average adsorption intensity of the gravel was 21% higher than that of the bare soil at night, and 3.5 times higher at midday, the total amount of adsorption was 43% less due to the significantly higher frequency on the bare soil.
On the monthly scale dimension (Figure 4c,d), adsorption was observed nearly every day from November 2019 to May 2020, with the rate of adsorption maintaining a steady fluctuation at 0.013 mm/h. From August to October in 2020, despite the less frequent occurrence of adsorbed water on the bare soil, the intensity of adsorption surpassed that of the gravel. Consequently, the adsorption on the gravel (1.49 mm) approximated that of the bare soil (1.38 mm), while the adsorption amounts on the gravel and bare soil were 18.19 mm and 15.73 mm during the other months of the year. During periods of high adsorption propensity (January to May and November to December in 2019), the average adsorption rate of the gravel was 18% higher than that of the bare soil, but due to the higher adsorption frequency of the bare soil, the total adsorption rate for the gravel was 7.48 mm lower than that of the bare soil. When adsorbed water formation was difficult, the gravel surface maintained a relatively higher frequency (>40%) and was more favorable for adsorption, but its rate was lower than that of the bare soil, which could be attributable to the distinct physical properties of the two surfaces.
To investigate the distribution of the adsorption rate, the hourly adsorption intensity was divided into 10 gradients, ranging from 0 to 0.08 mm/h (Figure 4e,f). It was evident that an increase in adsorption intensity corresponded to a more challenging adsorption occurrence. In addition, the adsorption intensity was primarily distributed within the 0–0.024 mm/h range, accounting for more than 90% of the total number of adsorption events. Specifically, for the bare soil, the maximum cumulative grading of adsorption was observed within the 0.008–0.016 mm/h range.

3.2. Combined Analysis of Evaporation and Adsorption

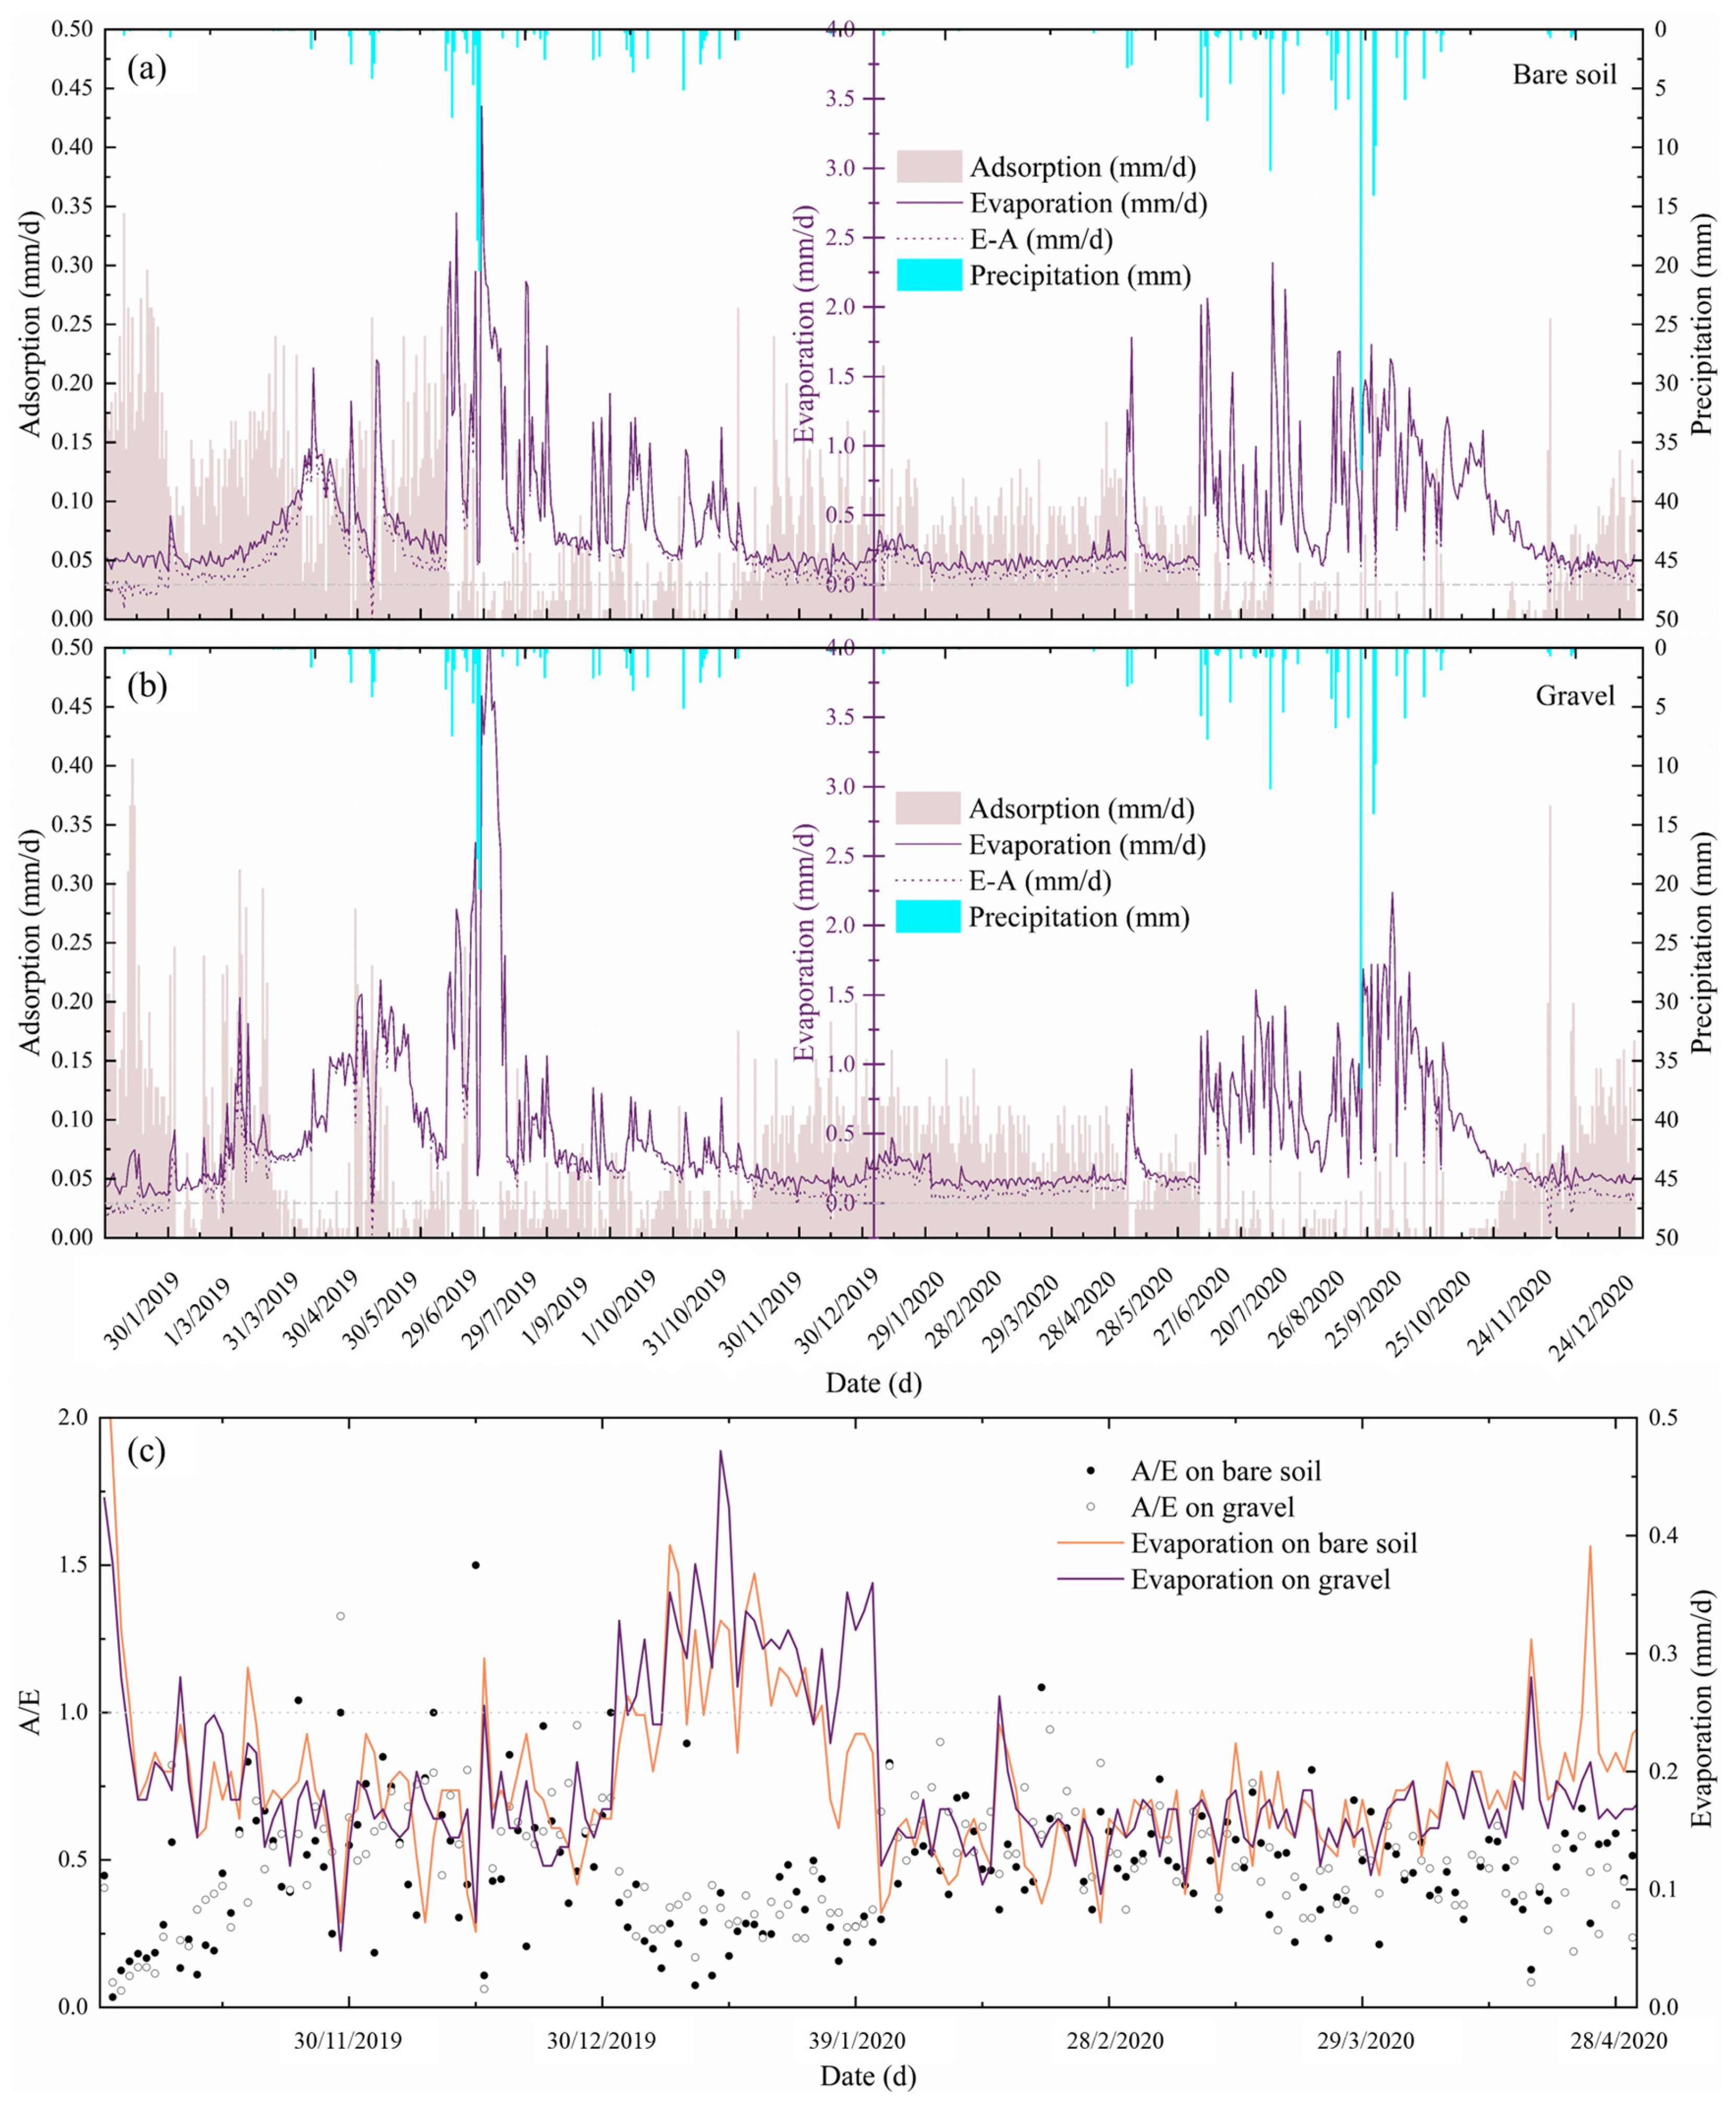
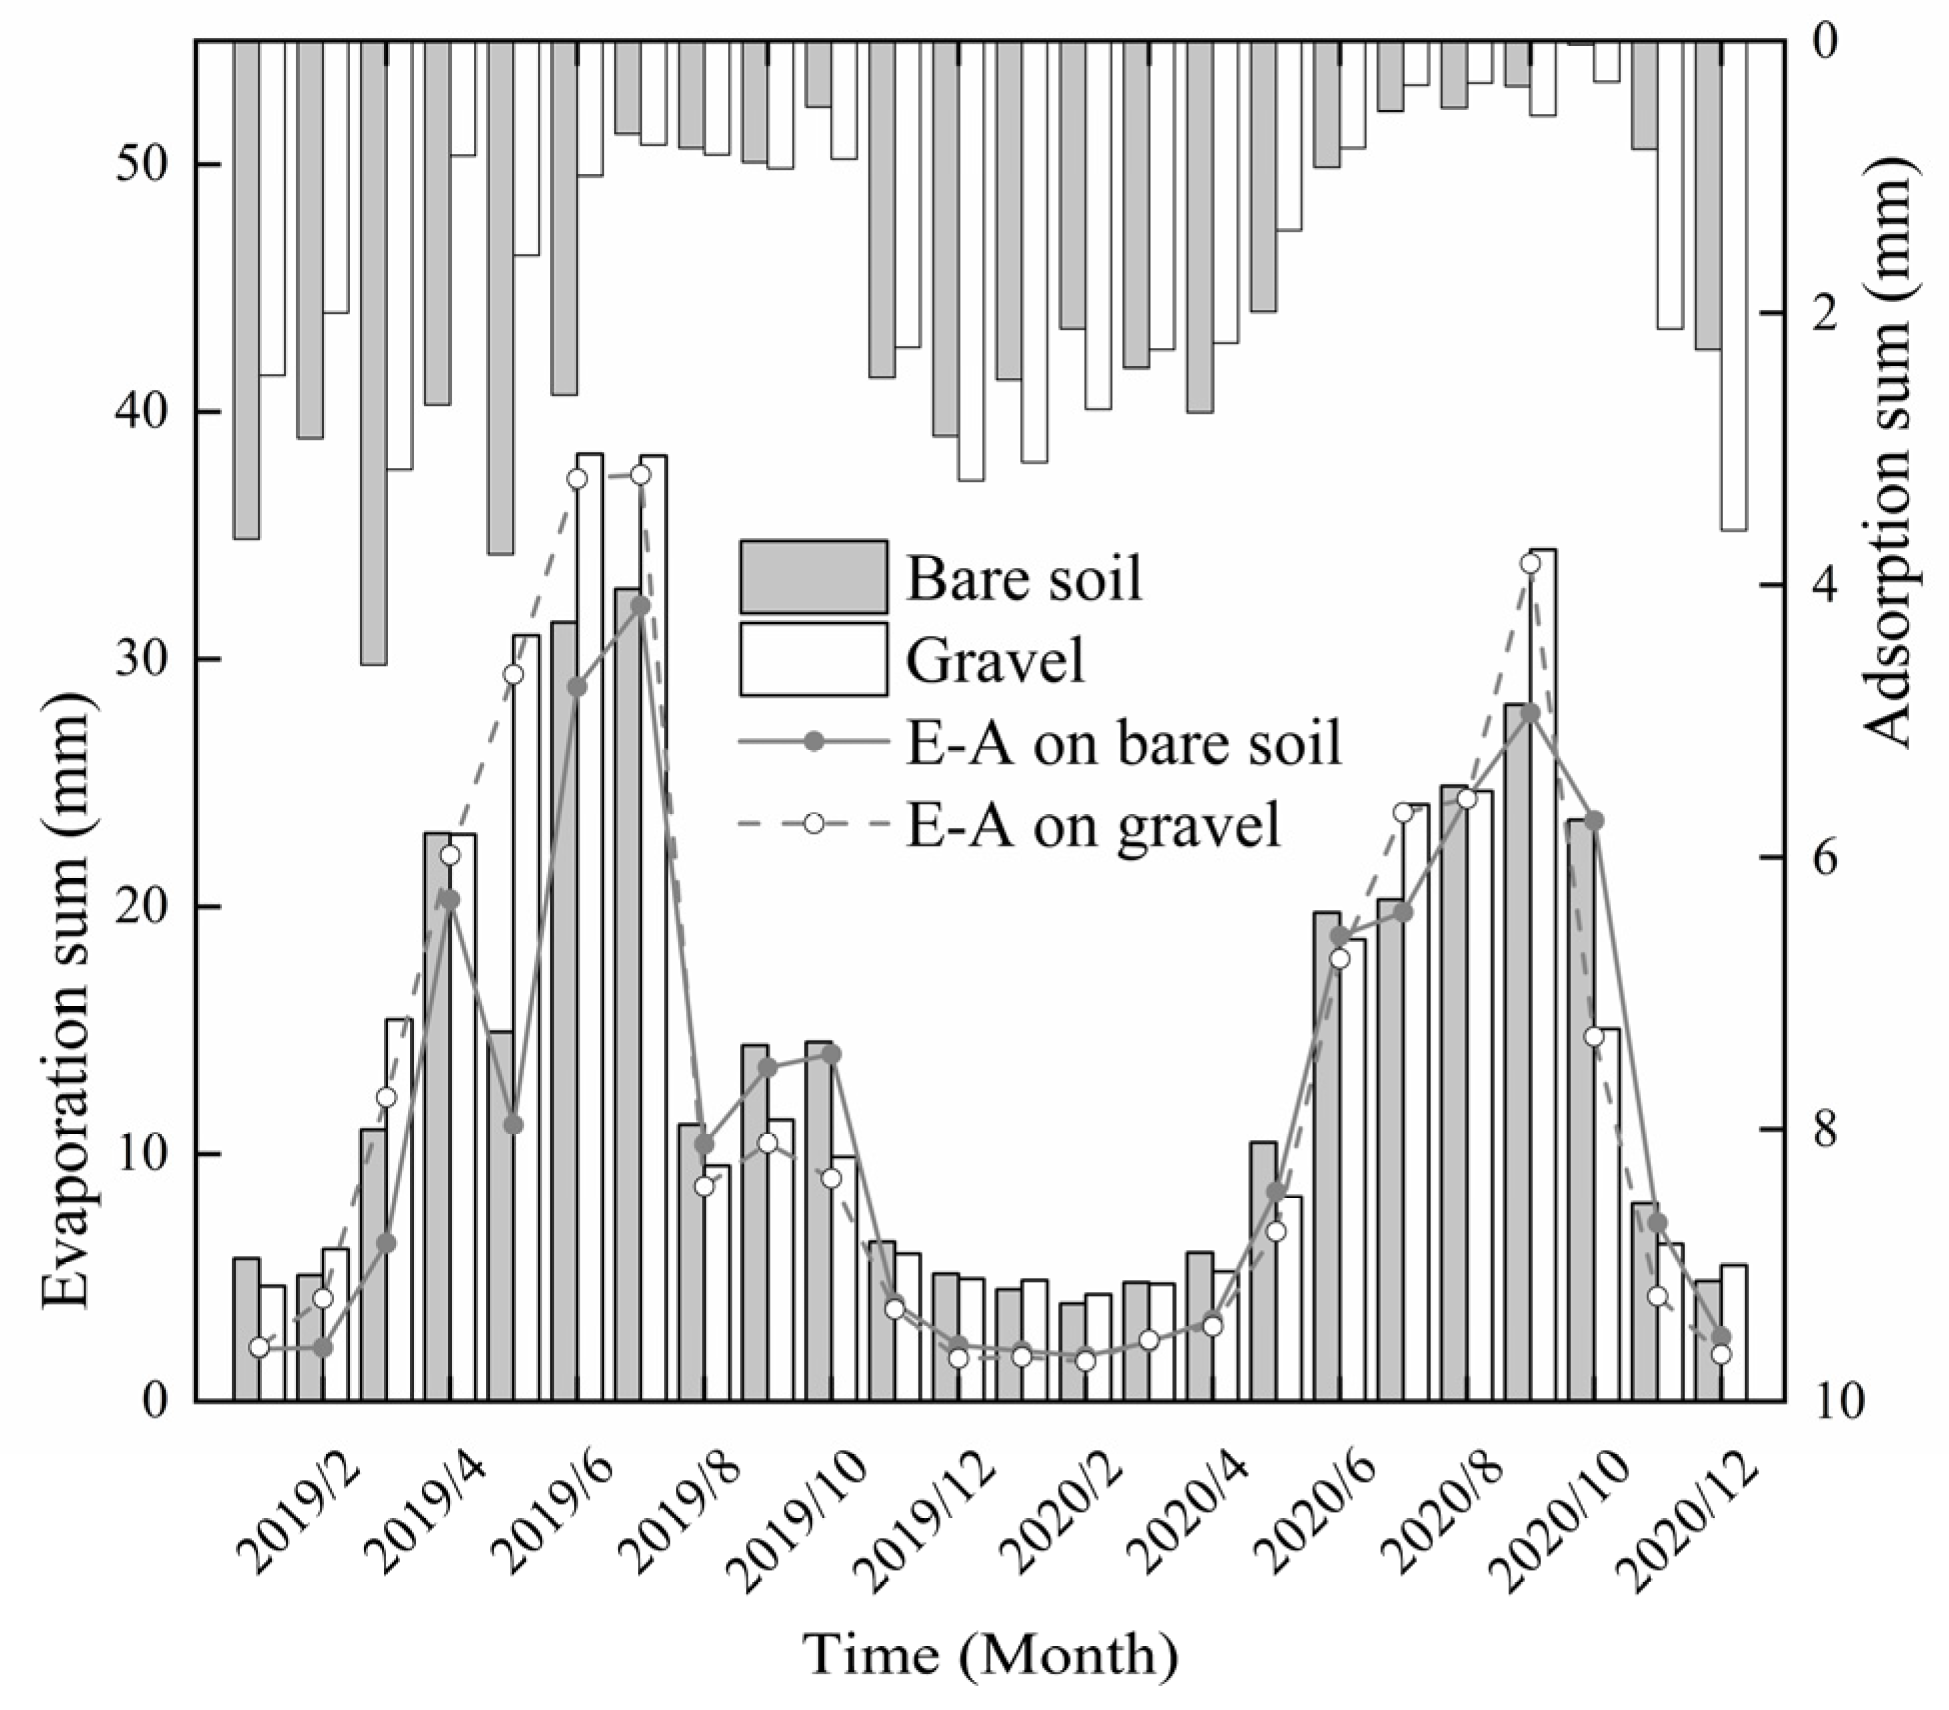
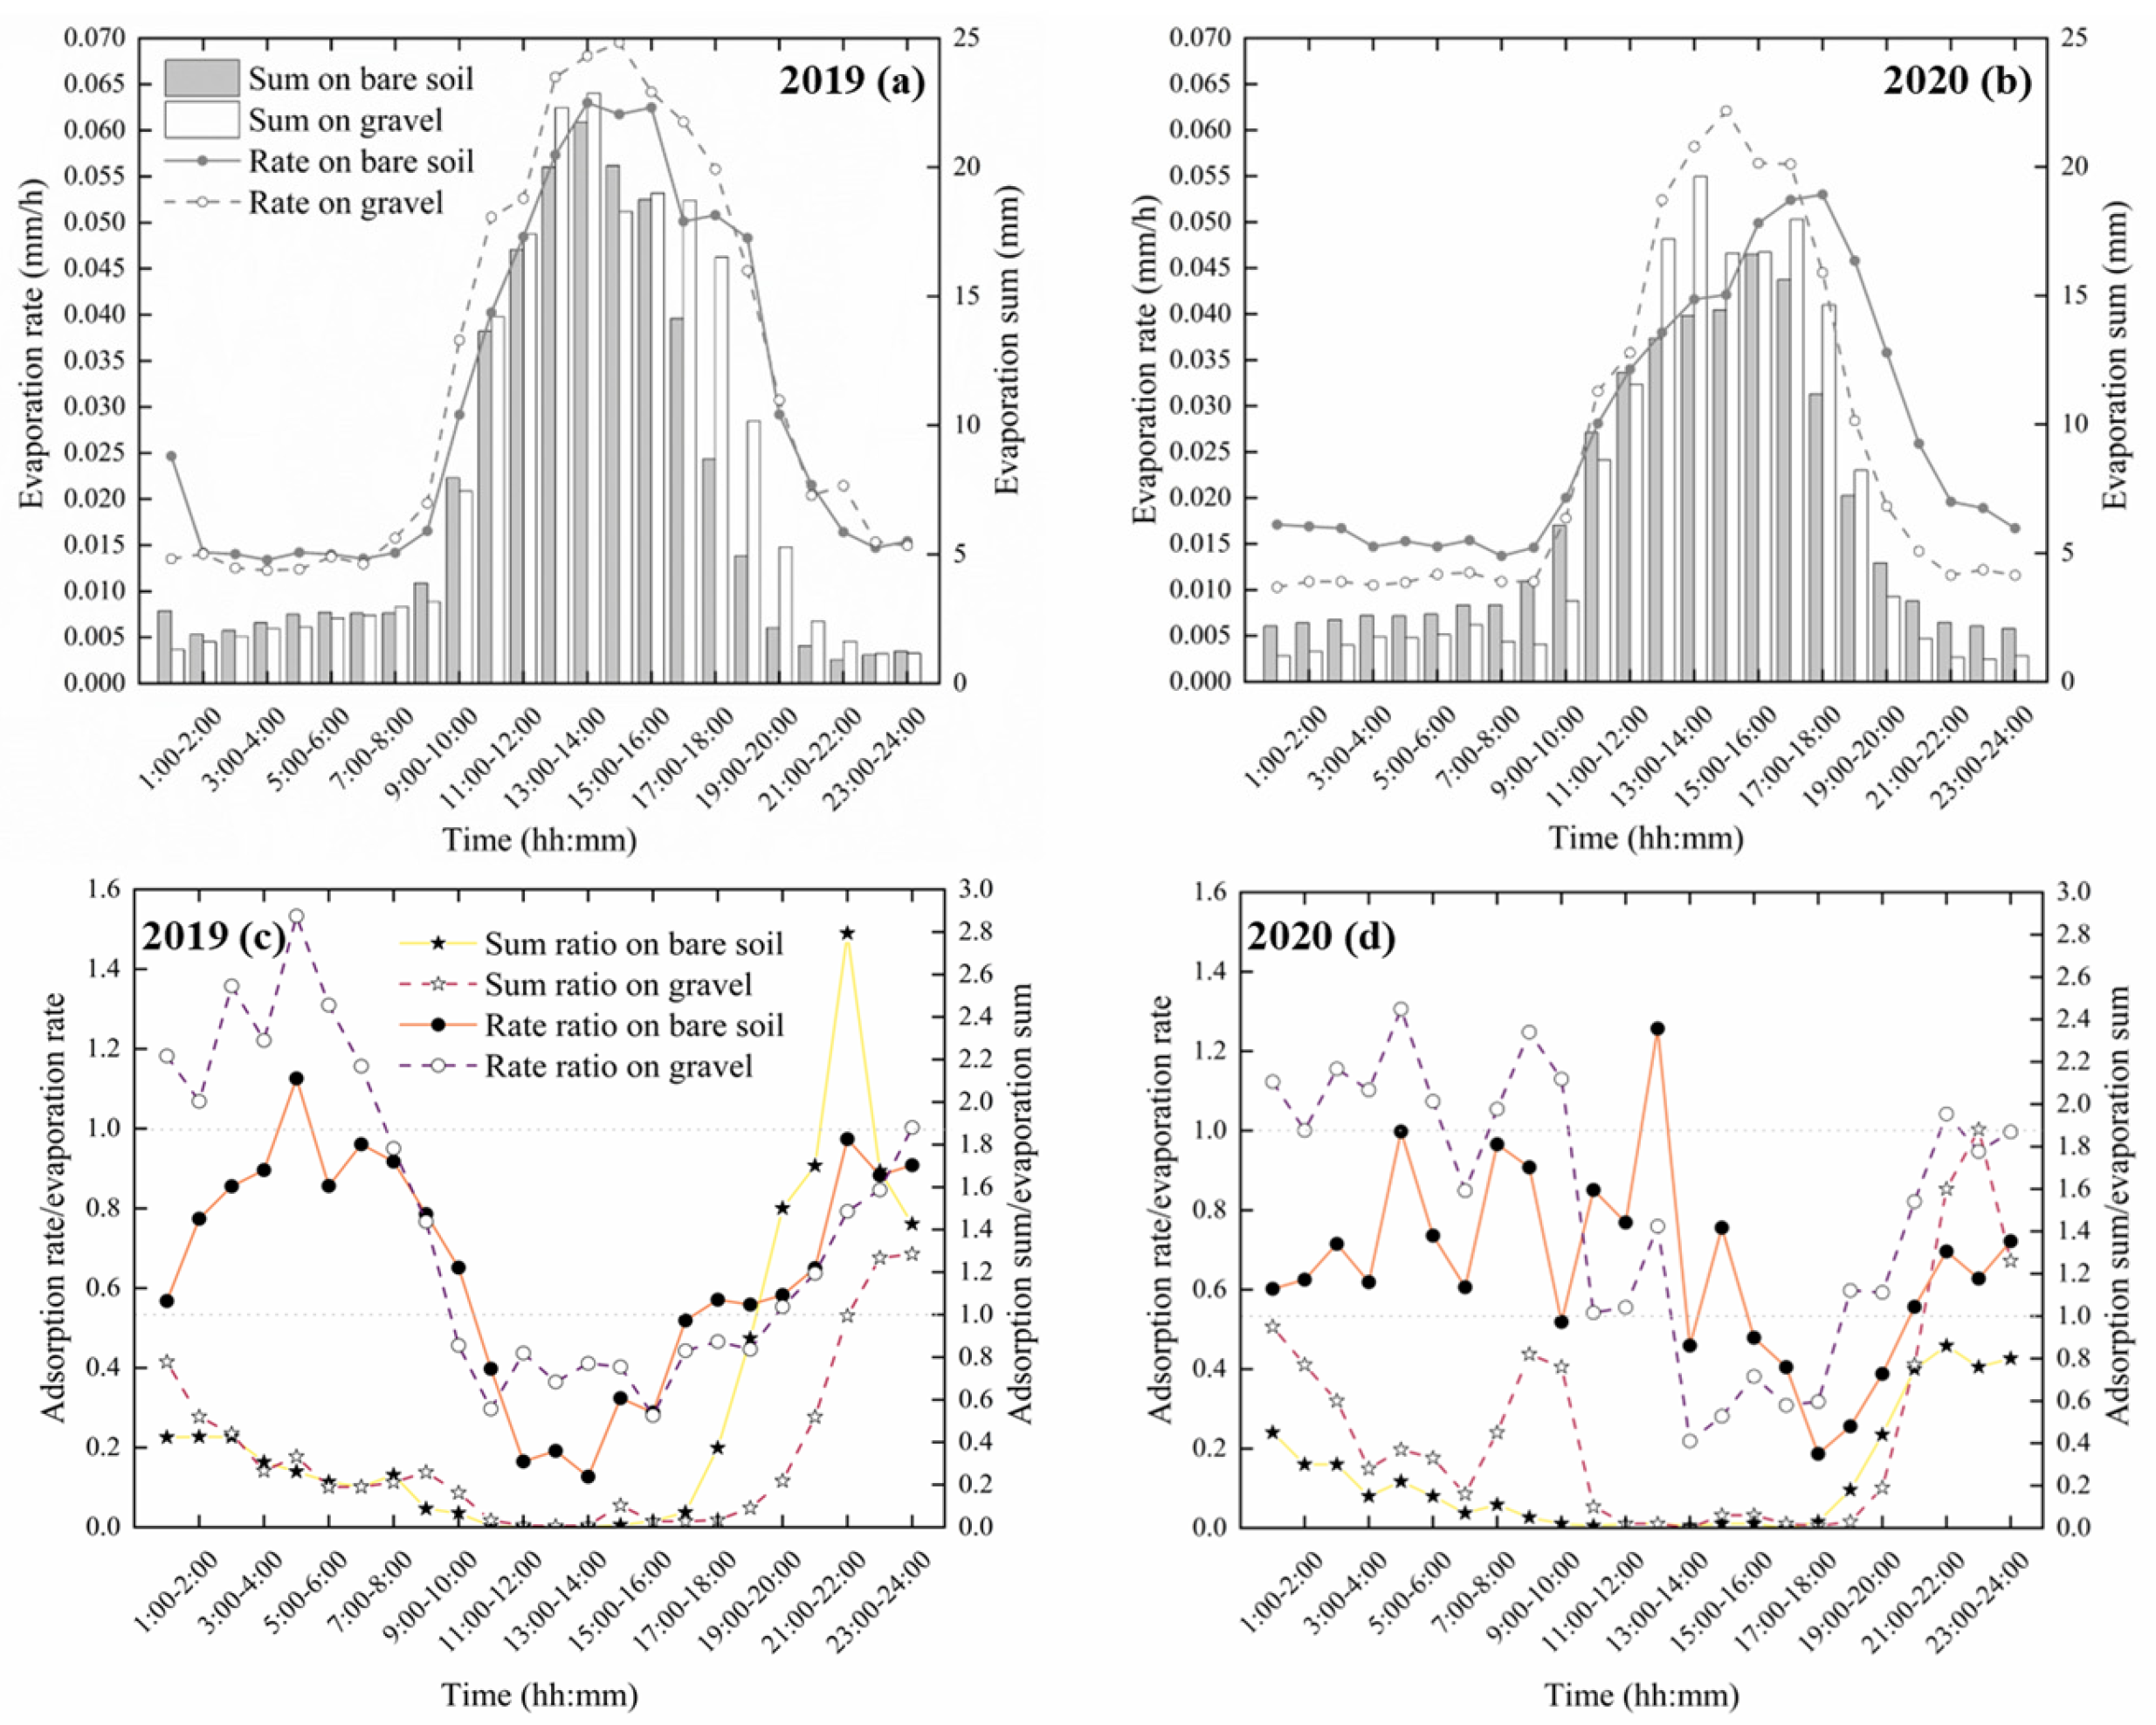
Figure 5a,b and Figure 6 show the evaporation, adsorption, and their difference (E-A) for the bare soil and gravel on daily and monthly scales over the two years. Evaporation and adsorption were obviously complementary in frequency and quantity. Rainfall significantly influenced evaporation, particularly from April to October. The E-A for the gravel was marginally less than that of the bare soil from August 2019 to June 2020, indicating a superior water retention capacity during this period. Yet, the E-A for the gravel was higher from spring to summer, primarily due to intensified evaporation during this period. In the long term, as evaporation was high in summer, the bare soil had 8% less total E-A than the gravel for the two years, with 295.52 mm for the bare soil and 320.90 mm for the gravel (Table 1). When vapor adsorption was extremely likely to occur, the gravel could effectively reduce evaporation through adsorption thereby exhibiting better water retention than the bare soil. Conversely, when it was difficult for adsorption to occur, the bare soil was better at water retention in summer. Over the long term, the bare soil maintained superior and sustained water retention. Likewise, the effect was even more pronounced when observing the hourly variations (Figure 7a,b).
To provide a more visual representation of adsorption and evaporation, the hourly variation in the ratio of adsorption rate/sum to evaporation rate/sum was calculated (Figure 7c,d), along with the daily variability during the adsorption-prone period (1 November 2019–1 May 2020) (Figure 5c). First of all, for the entire year (Table 1), the A/E values for the bare soil were 0.16 and 0.10 in 2019 and 2020, respectively, and 0.10 and 0.12 for the gravel. With increased rainfall in 2020, the adsorption on the bare soil decreased by about 40%, while the adsorption on the gravel remained relatively stable. Consequently, while rainfall suppressed soil evaporation, there was a significant decrease in the A/E value on the bare soil and an increase for the gravel due to the reduction in evaporation. The hourly variation patterns of A/E were similar for both surfaces (Figure 7c,d). The ratio of the rate on the gravel exceeded 1 between 0:00 and 6:00. Meanwhile, the evaporation sums significantly surpassed the adsorption sum. From 21:00 to 24:00, the adsorption sum exceeded the evaporation sum and the intensity ratio was close to 1. On the bare soil, the adsorption rate was typically less than the evaporation rate (Figure 7c,d). The sum ratio of the bare soil was less than 0.11 from 6:00 to 17:00, and the annual adsorption was 2.45 mm in 2020, with a frequency of only 3.49% (Figure 4a,b), whereas the annual evaporation was 123.09 mm over the same period (Figure 7a,b), with a frequency of 81.06%. On the contrary, the sum of adsorption on the gravel made a substantial contribution to evaporation. From 20:00 to 2:00 when adsorbed water occurred most frequently, the sum ratio of the gravel was above 0.5, with the evaporation rate and frequency being low and stable at about 0.012 mm/h and 22% on average over the two years. It was demonstrated that the differences between receipts and payments in soil moisture was mainly due to the high frequency of evaporation, which created a significant distinction in volume accumulation when the rates were both small. In Figure 5c, the evaporation from the gravel was slightly greater than that from the bare soil in January, with daily adsorption accounting for about 25% of the evaporation. For the remainder of the year, there was little difference in evaporation between the two surface types, and it stabilized at about 0.15 mm/d, with daily adsorption accounting for about half of the evaporation. Overall, although the A/E values for the bare soil were greater than 1 on a few days, the ratio for the gravel was greater than that of the bare soil on most days (especially in January when evaporation was higher), suggesting that gravel surfaces may have a stronger water retention effect when adsorption was likely to occur, which aligned with the results in Section 3.1 above.

3.3. Soil Water Content and Soil Temperature

3.3.1. Soil Water Content

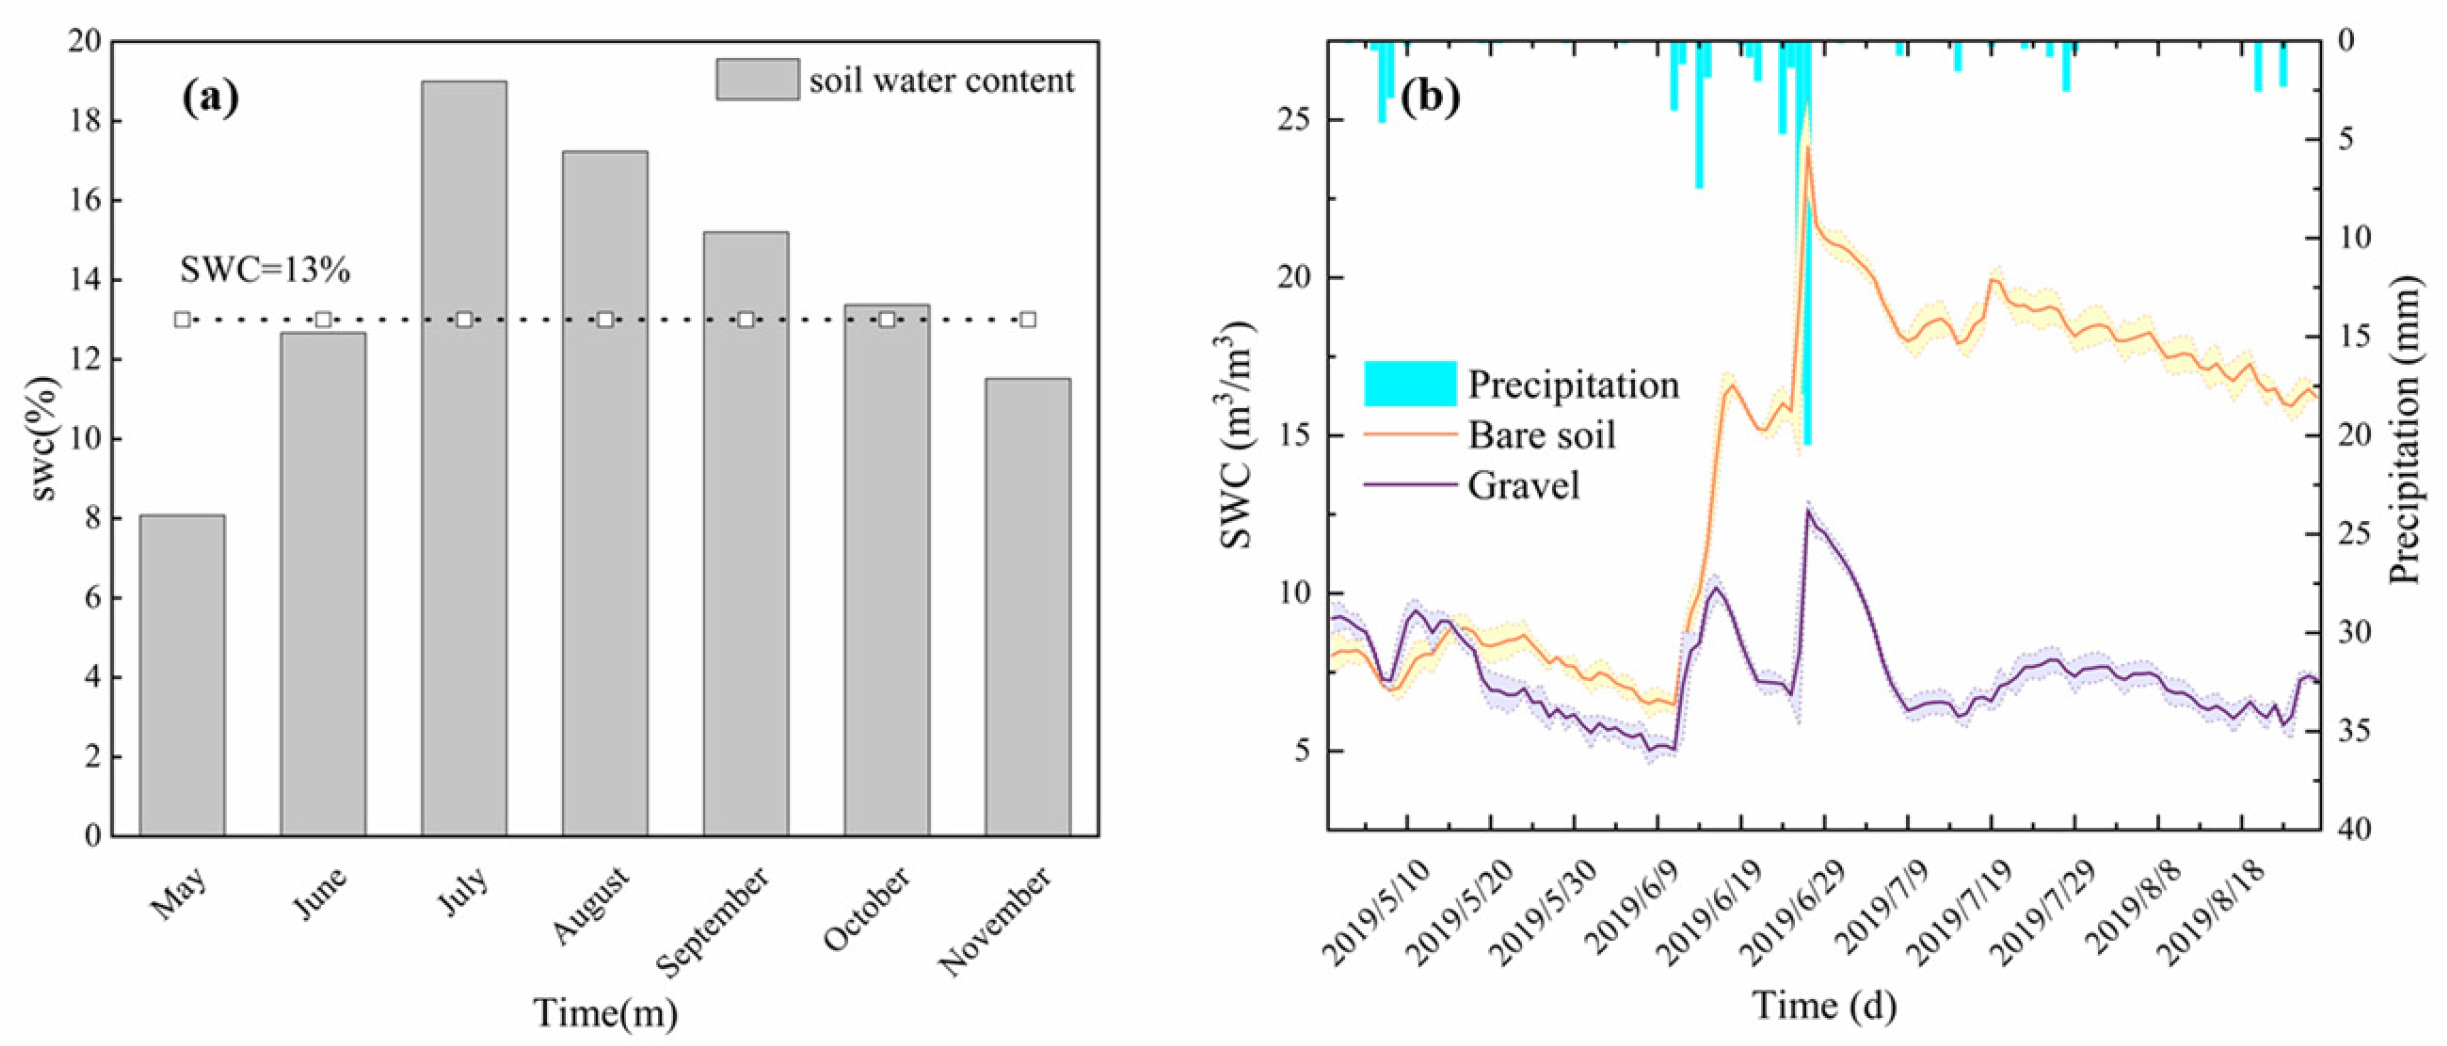
The soil water content (SWC) in the bare soil peaked in July (Figure 8a). The SWC of the bare soil was greater than 13% from July to October, during which, the sum of water vapor adsorption was 2.85 mm. However, water vapor adsorption occurred more frequently, totaling 8.85 mm from May to November in 2019. When the SWC was below 13%, adsorbed water was more likely to occur.
Compared to the bare soil, the soil water content for the gravel was lower with a smaller fluctuation range (Figure 8b). The jump in the SWC curve due to rainfall was more pronounced on the bare soil than on the gravel, which could be attributed to spatter effect of raindrops on the gravel surface. The annual maximum of SWC for the bare soil and gravel occurred on 27 June, which was caused by the heavy rainfall on that day. Noteworthily, the annual maximum value of SWC for the gravel was only 12.43%, which was already below the 13% threshold at which adsorbed water easily forms on bare soil. However, the gravel did not maintain a high amount of adsorption throughout the year, which indicated that although the gravel maintained a low SWC favorable for adsorption formation, there were still other factors that strongly influenced the occurrence of adsorbed water on the gravel, such as surface temperature, atmospheric conditions, etc.

3.3.2. Soil Temperature

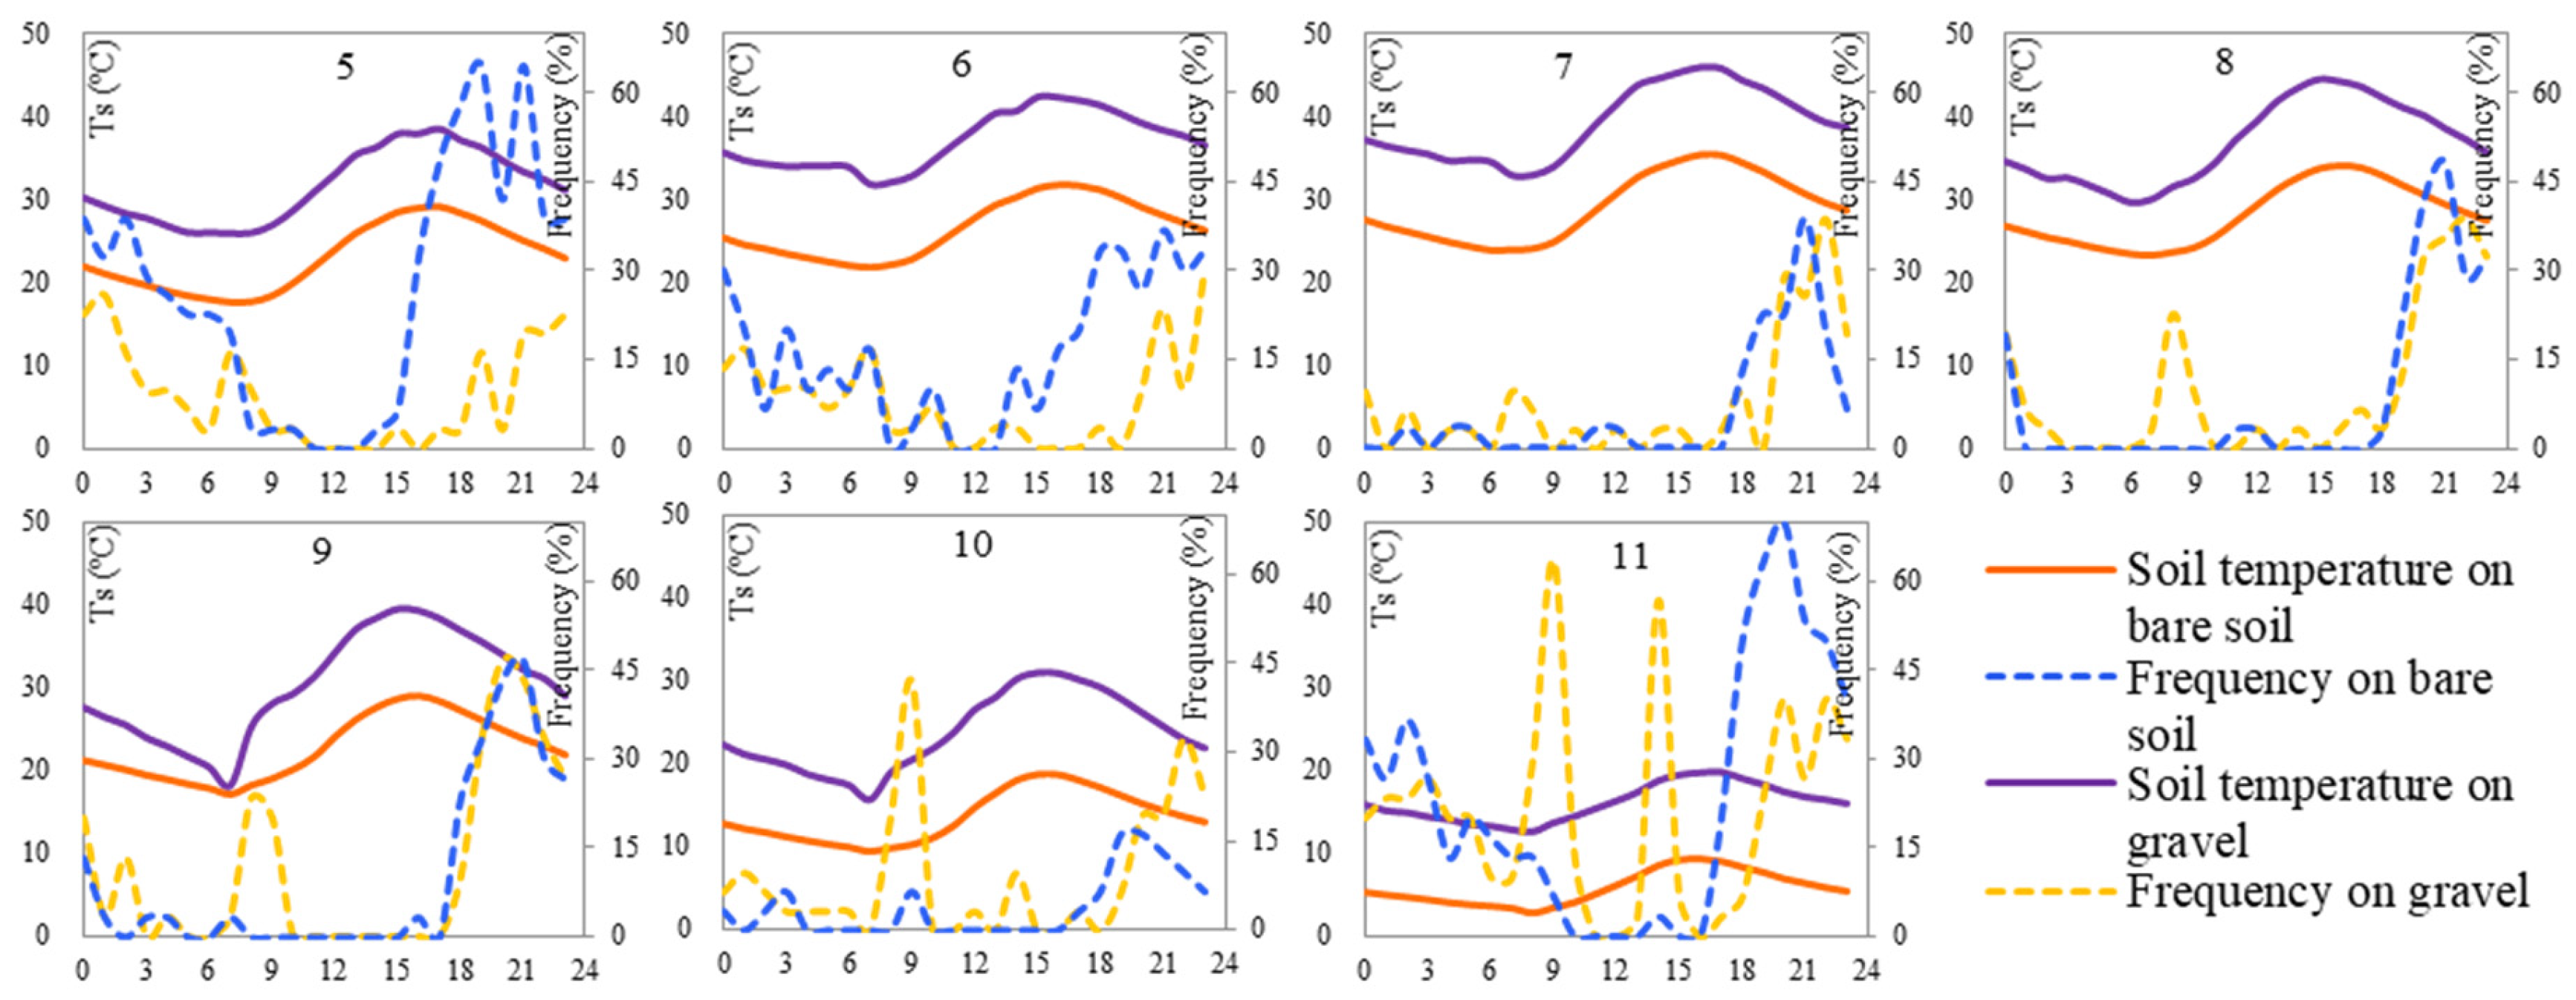
Despite significant differences in the quantity of adsorbed water across different months, the frequency of adsorption showed similar daily variations, which was the result of daily fluctuations in temperature (Figure 9). As the daily variation in soil temperature in each month started to decrease from the peak at 16:00 and 17:00, the frequency of adsorption started to increase significantly, reaching the highest frequency at 21:00. However, following the peak, the frequency of adsorption in tandem with the temperature until adsorption nearly ceased when the temperature reached its lowest point. The previous analysis concluded that the adsorption intensity was stable at approximately 0.013 mm/h during the main adsorption formation period. It was noteworthy that the occurrence of adsorbed water was at the stage when the soil temperature decreased. Moreover, the daily fluctuations in soil temperature resulted in variations in the frequency of adsorption at different times of the day, leading to differences in the amount of adsorption at different times. Similarly, the decrease in soil moisture was favorable for the occurrence of adsorbed water in the soil. The reduction in the temperature increased the adsorption capability of soil particles, and the soil at low temperatures mainly acted as a sink for water vapor. However, akin to temperature-induced changes, the adsorption frequency did not consistently increase with decreasing SWC because the formation of adsorbed water increased the soil moisture in the soil surface layer, which in turn reduced the attraction of soil particles to air moisture, leading to a decrease in the adsorption frequency and inhibiting the increase in soil moisture [16,23].

3.3.3. Gravel Cover

The daily soil temperature trend for the gravel in every month was similar to that of the bare soil, peaking at 16:00 and reaching a low at 8:00. However, the gravel was, on average, 10 °C warmer than the bare soil during the day, with a maximum temperature disparity of 12 °C (Figure 9). The average daily differences in soil temperature for the gravel were 12, 10, 13, 15, 22, 15, and 7 °C from May to November. The frequency of adsorption for the gravel generally increased starting from 18:00, peaked at either 21:00 or 22:00, and subsequently decreased (Figure 9). The overall trend of the frequency change for the gravel lagged by approximately one hour compared to the bare soil. Unlike the bare soil, the adsorption frequency for the gravel did not decline from its 21:00 peak to 8:00 the next day. Instead, there was a significant increase starting from 6:00, which then plummeted to zero at 10:00~11:00. Thus, from 7:00 to 10:00, the frequency and accumulation of adsorption on the gravel increased significantly compared to the bare soil due to the gravel surface’s rapid cooling.
The substantial temperature difference resulted in a significant difference in water evaporation for the two surfaces. From May to November, evaporation from the gravel exceeded that from the bare soil by 18.41 mm, while the gravel’s adsorption was only 19.79 mm for the year. Owing to the low SWC, the gravel demonstrated a superior water vapor adsorption capacity between July and October. However, the higher soil temperature for the gravel resulted in greater water evaporation than the bare soil and inhibited water vapor adsorption. Furthermore, the gravel surface delayed the onset of the peak water vapor adsorption.

3.4. Hydrothermal and Meteorological Analysis

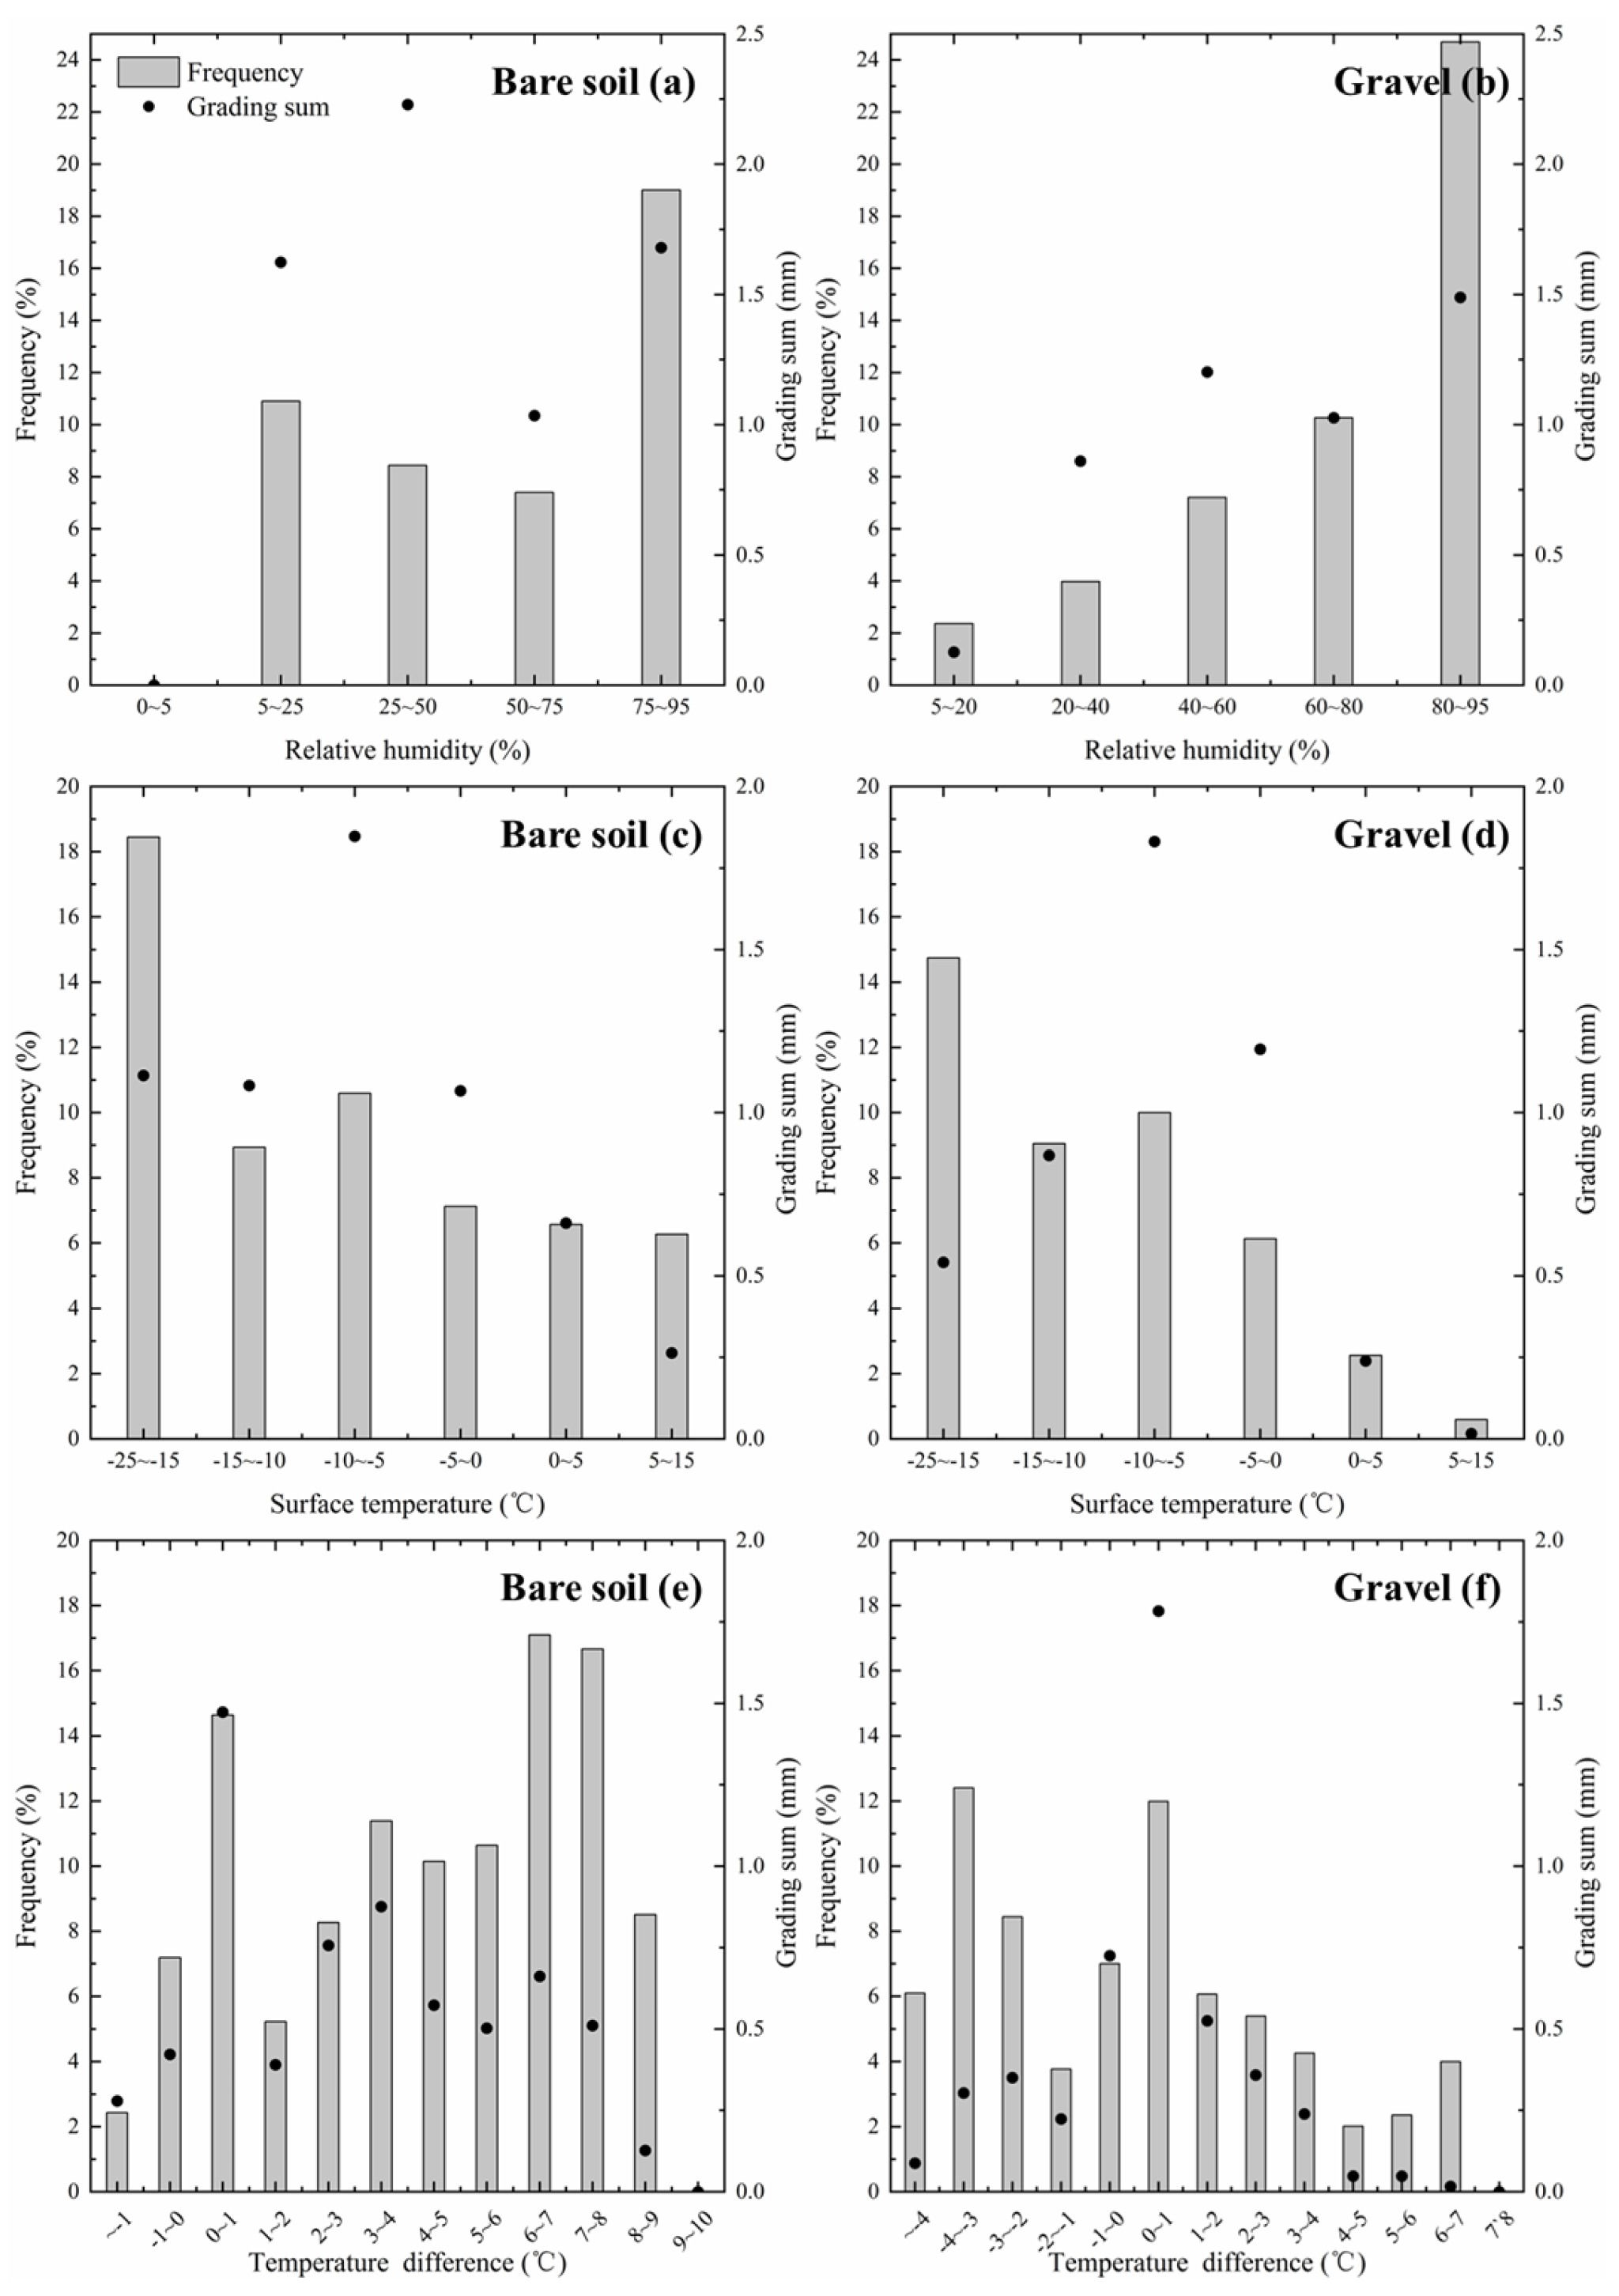
Air temperature (Ta), air relative humidity (RH), and surface temperature (Ts) primarily affected the occurrence frequency of water adsorption into the soil (Figure 10). For a more comprehensive analysis of adsorption, and considering both hydrothermal and meteorological factors, we selected the surface temperature for the gravel and bare soil, air temperature and humidity at 30 cm above the ground, and the temperature difference from November to February for statistical analyses.

3.4.1. Adsorption Occurrence Conditions

On the bare soil, the majority of water adsorption into the soil occurred in the RH range between 75% and 95%, and the frequency of adsorption reached 19.0%. When the RH ranged between 25% and 50%, the frequency of adsorption was approximately 8%, with the maximum adsorption amount reaching 2.25 mm; and when the RH was less than 5%, no water adsorption occurred (Figure 10a,b). For the gravel, the frequency of adsorption obviously increased with increasing RH. When RH was in the 80~95% range, the frequency of adsorption was up to 24.7%, and the maximum adsorption reached 1.5 mm at this level. When the RH ranged from 5 to 75%, the frequency of adsorption for the gravel was less than 10% (Figure 10a,b). The total volume of adsorbed water for the bare soil exceeded that of the gravel under identical humidity conditions because the gravel hindered the contact between the atmosphere and soil particles to a certain extent, thereby reducing adsorption occurrence.
Surface temperature was an important factor that affected the water balance on the ground. A high Ts promotes evaporation, and dry soils facilitate water vapor adsorption during cooling. In Figure 10c,d, both surfaces exhibited a similar situation, with a peak adsorption sum of 1.8 mm at Ts values ranging from −10 °C to −5 °C. Generally, the frequency of water adsorption decreased as the Ts increased. The bare soil was more conducive to adsorption under identical temperature conditions; the frequency of adsorption for the gravel diminished more rapidly than on bare soil as the Ts increased. On the bare soil, adsorbed water was generally more likely to occur between −25 °C and −15 °C, with an adsorption frequency of 18.1%. When the Ts was greater than zero, the frequency declined to approximately 6%. Throughout the observation period, no water vapor adsorption occurred when the Ts of the bare soil exceeded 15 °C. Compared to the bare soil, the gravel exhibited a lower frequency of water adsorption occurrence at different Ts gradients, with a much lower frequency of 14.7% between −25 °C and −15 °C. When the Ts was between 5 and 15 °C, the adsorption frequency for the gravel was less than 1%.
Water vapor transport was also influenced by the difference between Ta and Ts (ΔT = Ta − Ts). The overall frequency of water adsorption occurrence on both surfaces showed a bimodal variation with increasing ΔT. Interestingly, both surfaces had the highest level of adsorbed water at a ΔT of 0~1 °C (bare soil: 1.47 mm; gravel: 1.78 mm), when the frequency of adsorbed water also peaked (bare soil: 14.6%; gravel: 12.0%). The other peaks for the bare soil and gravel occurred at ΔT of 6~7 °C and −4~−3 °C, respectively. The gravel produced adsorbed water at both positive and negative ΔT values, whereas the bare soil required positive ΔT values to produce more adsorbed water. Furthermore, the overall effect of ΔT on adsorption frequency and volume were greater for the bare soil than the gravel. This also shows why the gravel and bare soil had high adsorption capacities during daytime and nighttime, respectively.

3.4.2. Meteorological Drivers of Adsorption

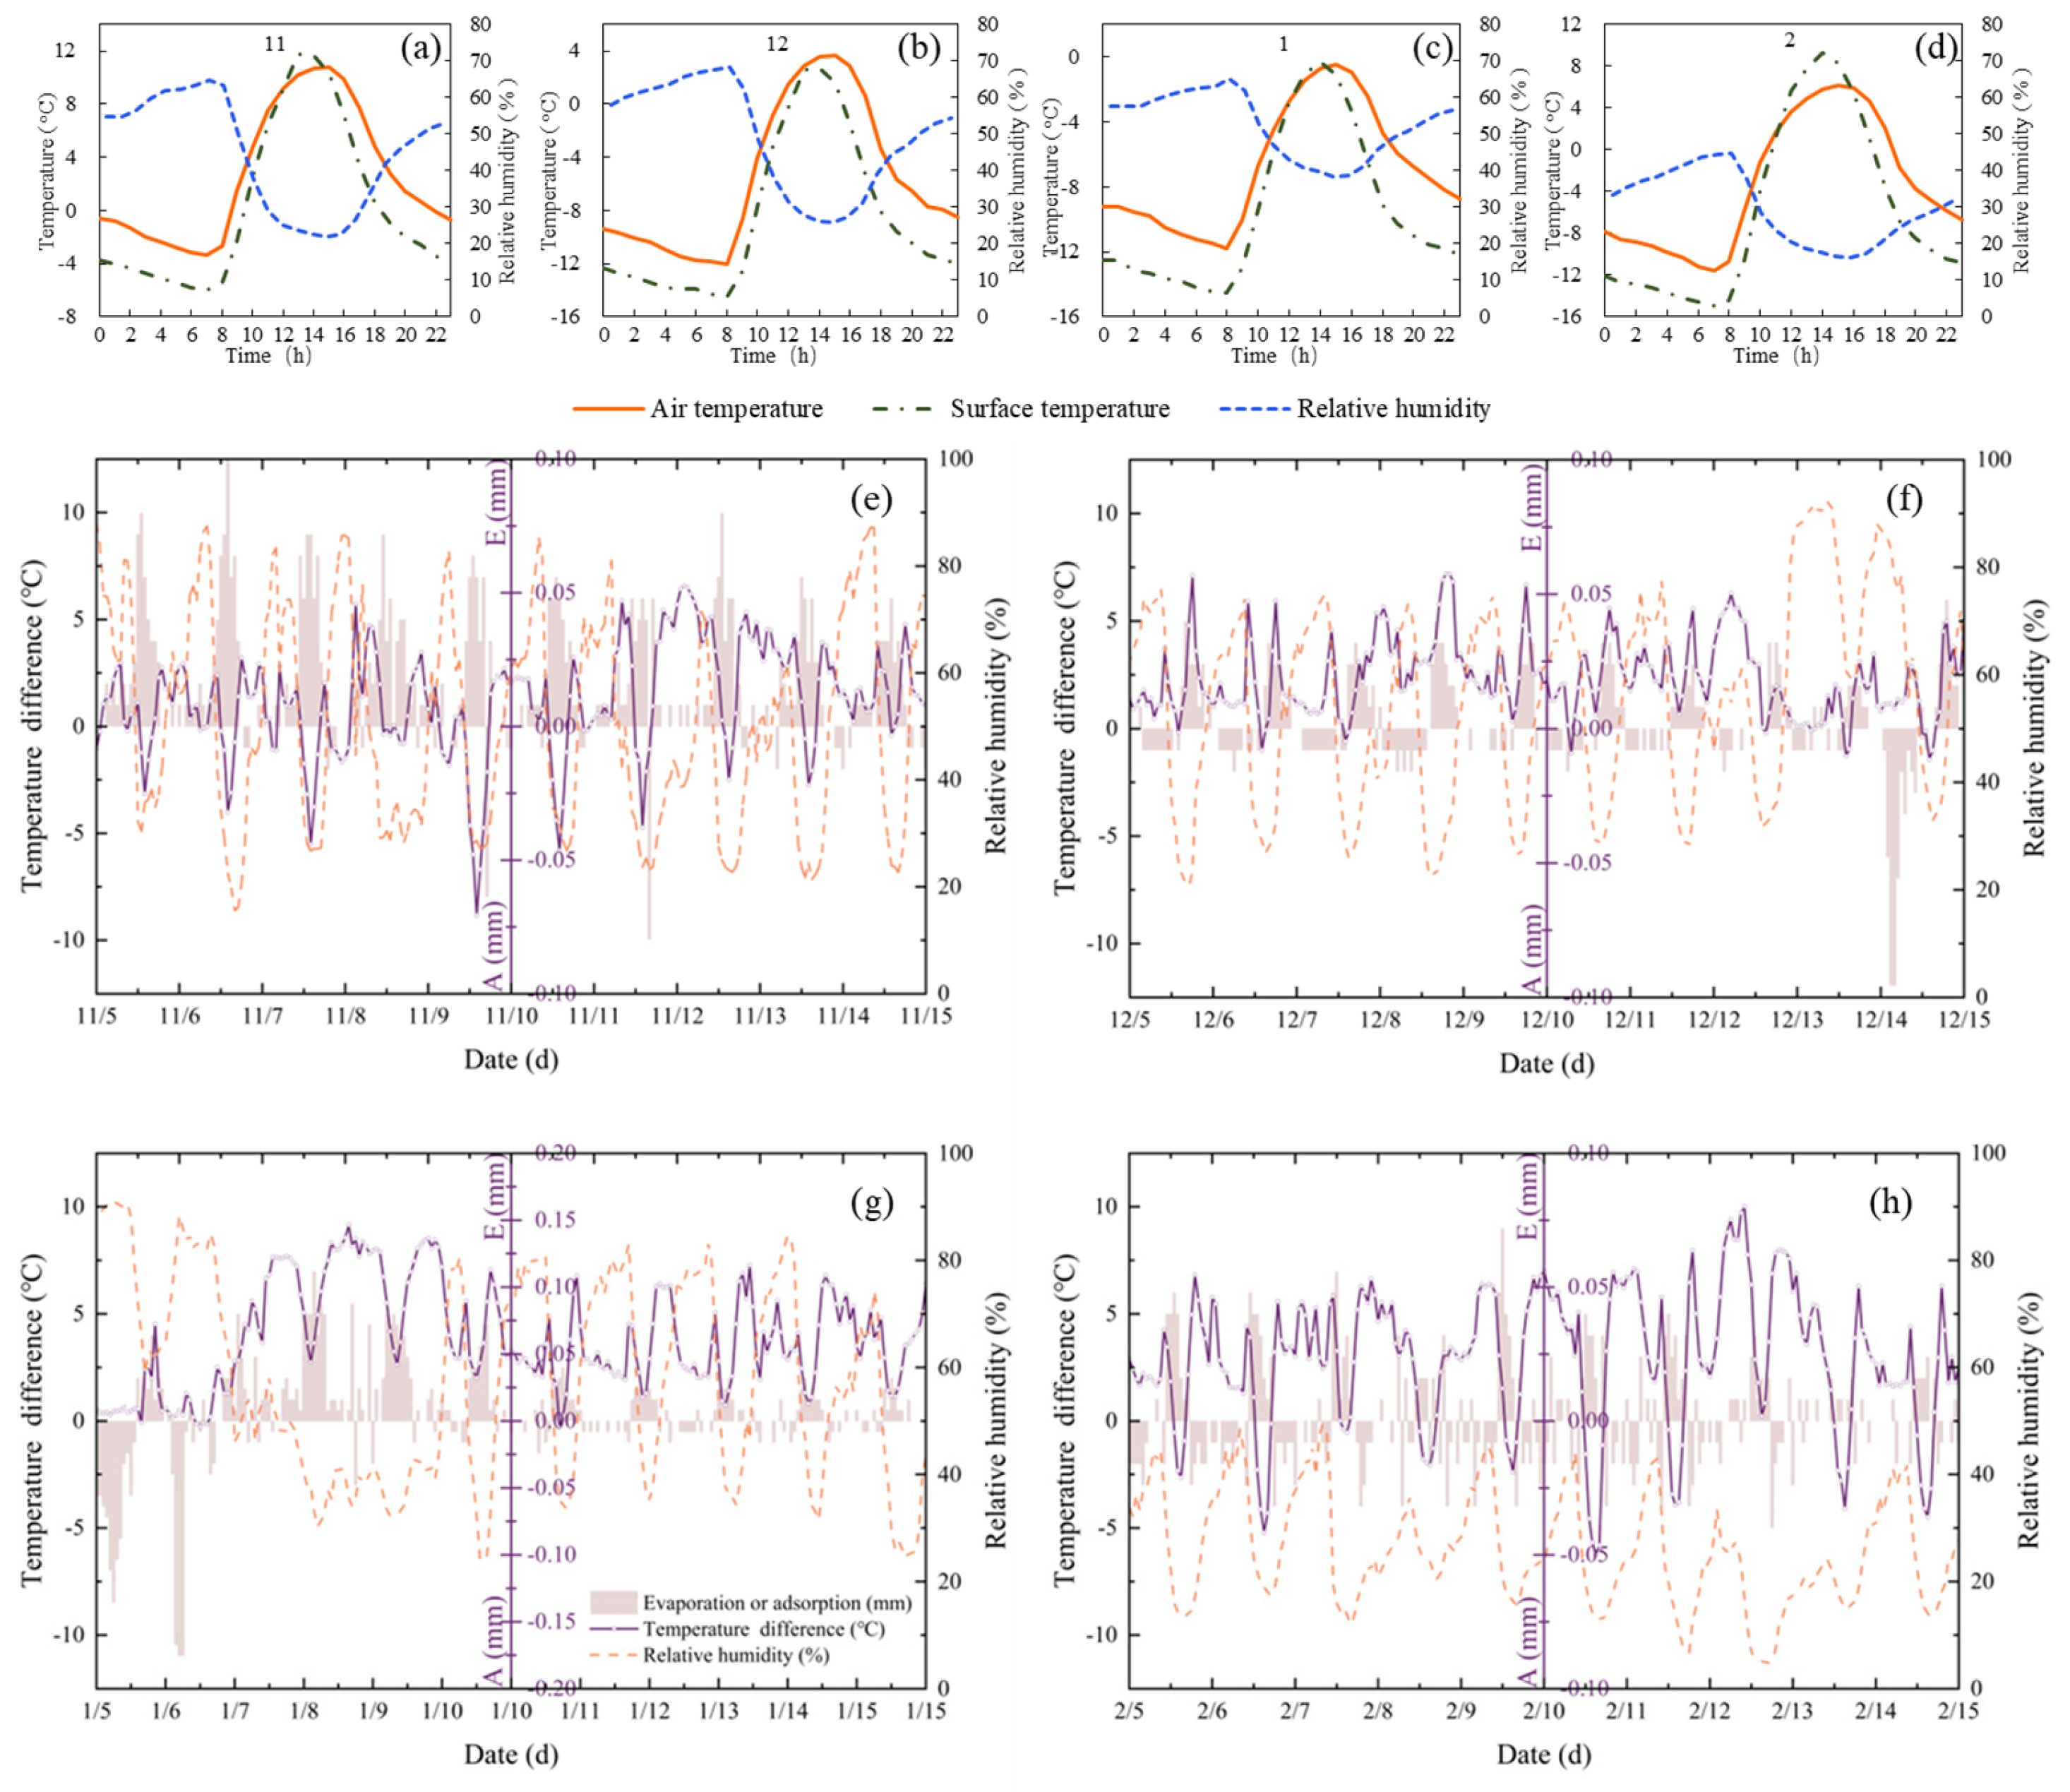
The Ts of the bare soil began to increase starting from 8:00, peaking at 14:00 (Figure 11a–d), before declining until 7:00 the following day. The peak of Ta lagged behind that of the Ts by one hour. The RH trend was inversely proportional to the Ta trend. The changes in the RH near the ground, due to temperature fluctuations, influenced the transportation of water vapor in the vicinity. Due to the alternating effects of Ts, Ta, and RH, the water adsorption on and evaporation from the bare soil also showed alternating processes at different times of the day (Figure 11e–h).
During four months, it was evident that the highest volume of adsorption coincided with the RH peak (Figure 11e–h). On 14 December and 5–6 January, when there was a weak positive ΔT value and a high RH, the bare soil adsorbed a huge volume of vapor with a maximum intensity of 0.18 mm/h, corroborating the findings of Section 3.4.1. It is worth noting that the effect of ΔT on adsorption frequency was more pronounced than that of the RH. From 5 February to 15 February, the maximum RH did not exceed 50%, but the ΔT was predominantly around 5~6 °C, resulting in an adsorption frequency of up to 41.7%. Yet, the water vapor supply was probably insufficient, leading to a lower average adsorption rate. In addition, on 5–7 November, despite a high RH, the adsorption frequency was below 5% because the ΔT was not in the peak levels (0~1 or 5~6 °C).

4. Discussion

This article investigated the formation characteristics and influencing factors of water vapor adsorption in the arid regions of Northwestern China. The study spanned two years, and we discussed the intriguing findings. For example, in winter, this arid region exhibited significant adsorption patterns, which are of significant importance for the efficient utilization of water resources in arid areas. Additionally, this study contributes to the theoretical research on water vapor adsorption. The distributions of the daily and monthly soil water balance showed significant differences under different meteorological and soil conditions. Our study found that adsorption primarily occurred between 20:00 and 8:00 the following day during spring and winter, which was consistent with the literature on the arid zone of Northwestern China [37,38,39]. A few studies have also found that peak adsorption condensation occurs at 14:00, with a trough at 21:00 [29]. This could be attributed to the evaporation process in the morning, resulting in water loss from soil particle surfaces and a subsequent weakening of evaporation, which inevitably leads to the dominance of adsorbed water starting in the afternoon with a higher frequency and sum of adsorption. Overall, the adsorption levels of the bare soil and gravel showed a high consistency across different time scales. From a long-term perspective, the bare soil has a greater total adsorbed water volume. According to a few authors, gravel cover significantly reduces nighttime adsorption compared to daytime evaporation rates by reducing the specific surface area and impeding water vapor transport [8,16,27]. Contrarily, we found that the gravel not only evaporated more intensely during the day compared to the bare soil, but it also had a higher adsorption frequency as a result. The overall evaporation intensity under the gravel cover was generally higher than that of the bare soil in 2019, mirroring the findings of a study conducted on the semi-arid Loess Plateau in Northwestern China [40]. In a 2006 experiment, the evapotranspiration of gravel-covered soils was higher than that of uncovered gravels when the gravel size was large. The experimental results indicated that the larger gravels with 2–6 cm grain sizes had a greater porosity; as the porosity increased, so did evapotranspiration [40]. This is consistent with the large gravel used in our study. Moreover, the surface temperature on the gravel was, on average, 10 °C higher than that of the bare soil, which greatly increased the rate of water diffusion and thus evaporation. Consequently, soil evaporation and soil adsorption were inextricably linked and were closely related to different soil conditions and meteorological conditions.
In general, condensate formation was influenced by aerodynamic and thermodynamic properties, particularly those related to near-surface meteorological parameters. In daily variation dynamics, the amount of adsorption is positively correlated with the near-surface humidity gradient and negatively correlated with the daily minimum RH [16]. Additionally, condensation occurrence has an optimal RH range, with the frequency of soil adsorption water increasing significantly when the RH is more than 75% [41]. A low Ts is also a crucial factor in condensation formation, and the adsorption rate had a significant negative linear correlation with Ts and Ta in the middle reaches of the Heihe Basin, China [20,42]. Our findings align with the results of these studies. We also found that the gravel had a high adsorption frequency at negative ΔT values, which could indicate that the Ts and SWC for the gravel were at a low level at this time.
Although we conducted some analysis on the hydrothermal and meteorological aspects, we did not incorporate the impact of wind in our study. Moderate wind not only facilitates the transport of water vapor, but it also prevents the rapid escape of water vapor. It has been shown that the adsorption frequency of bare soil peaks in the wind speed range of 3~5 m/s [29]. Furthermore, we excluded dew and fog, focusing solely on adsorbed water. The contributions and characteristics of these three types of moisture in non-rainfall water resources pose an intriguing question for future research.
In addition, despite our discussion on soil adsorption in arid regions, the specific mechanisms by which gravel influences adsorption have yet to be determined, especially the significant water absorption patterns in winter. Investigating the impact of gravel on soil adsorption and evaporation, particularly in winter, may be a topic worth exploring.

5. Conclusions

This paper discussed the less-studied water vapor adsorption in arid regions and enriches the theoretical research on water vapor adsorption using data collected over two years. The results indicated that water vapor adsorption played a significant role in the arid climate, accounting for 10–20% of the annual evaporation. The adsorption characteristics were primarily characterized by higher levels during the night and lower levels during the day; more adsorption in spring and winter; and less in summer and autumn. On the hourly scale, adsorption predominantly occurred from 17:00 to 9:00 the following day, maintaining a stable intensity of 0.013 mm/h, with the annual average adsorption frequency peaking at over 50%. On the monthly scale, adsorption was concentrated in January–June and November–December, accounting for about 90% of the total annual adsorption.
In addition, we discussed the soil and meteorological factors influencing water adsorption in arid regions. SWC, ΔT, and RH were the key factors affecting the occurrence of adsorption in soil. Adsorption was more likely to occur when the SWC was less than 13%. Adsorption did not occur when the air relative humidity was below 5%. A low Ts was more favorable for adsorption occurrence. Daily fluctuations in the frequency and amount of adsorption were driven by alternating effects of ΔT and RH, but the effect of ΔT was stronger than that of RH. When the RH was high and the ΔT was weakly positive, the maximum adsorption intensity could reach 0.18 mm/h.

Author Contributions

Conceptualization, Q.Z.; data curation, Q.Z. and H.X.; formal analysis, Q.Z., H.X., H.W. and Z.W.; methodology, Q.Z. and H.X.; writing—original draft, Q.Z., H.X., H.W. and Z.W.; writing—review and editing, H.W., T.C. and S.G. All authors have read and agreed to the published version of the manuscript.

Funding

This work was financially supported by the National Natural Science Foundation of China (31470707 and 31270748), the Hydrological Bureau of Guangdong Province (440001-2023-10716), and the Guangzhou Bureau of Hydrology project “Research on the mechanism of hydro-ecological dynamics in a typical river network area” (SWYS2023F050).

Data Availability Statement

Data are contained within the article.

Acknowledgments

We would like to express our gratitude to Rui Li, Yun Gao, and Gang Chen for their assistance during the writing of this article.

Conflicts of Interest

The authors declare no conflicts of interest.

References

  1. Jacobs, A.F.G.; Heusinkveld, B.G.; Berkowicz, S.M. Dew deposition and drying in a desert system: A simple simulation model. J. Arid Environ. 1999, 42, 211–222. [Google Scholar] [CrossRef]
  2. Agam, N.; Berliner, P.R. Dew formation and water vapor adsorption in semi-arid environments–A review. J. Arid Environ. 2006, 65, 572–590. [Google Scholar] [CrossRef]
  3. Hao, X.; Li, C.; Guo, B.; Ma, J.; Ayup, M.; Chen, Z. Dew formation and its long-term trend in a desert riparian forest ecosystem on the eastern edge of the Taklimakan Desert in China. J. Hydrol. 2012, 472, 90–98. [Google Scholar] [CrossRef]
  4. del Prado, R.; Sancho, L.G. Dew as a key factor for the distribution pattern of the lichen species Teloschistes lacunosus in the Tabernas Desert (Spain). Flora 2007, 202, 417–428. [Google Scholar] [CrossRef]
  5. McHugh, T.A.; Morrissey, E.M.; Reed, S.C.; Hungate, B.A.; Schwartz, E. Water from air: An overlooked source of moisture in arid and semiarid regions. Sci. Rep. 2015, 5, 13767. [Google Scholar] [CrossRef]
  6. Gao, Z.; Shi, W.; Wang, X.; Wang, Y.K. Non-rainfall water contributions to dryland jujube plantation evapotranspiration in the Hilly Loess Region of China. J. Hydrol. 2020, 583, 124604. [Google Scholar] [CrossRef]
  7. Kaseke, K.F.; Mills, A.J.; Brown, R.; Esler, K.J.; Henschel, J.R.; Seely, M.K. A method for direct assessment of the “Non-Rainfall” atmospheric water cycle: Input and evaporation from the soil. Pure Appl. Geophys. 2012, 169, 847–857. [Google Scholar] [CrossRef]
  8. Ucles, O.; Villagarcia, L.; Canton, Y.; Domingo, F. Partitioning of non-rainfall water input regulated by soil cover type. Catena 2016, 139, 265–270. [Google Scholar] [CrossRef]
  9. Kidron, G.J. Analysis of dew precipitation in three habitats within a small arid drainage basin, Negev Highlands, Israel. Atmos. Res. 2000, 55, 257–270. [Google Scholar] [CrossRef]
  10. Agam, N.; Berliner, P.R.; Zangvil, A.; Ben-Dor, E. Soil water evaporation during the dry season in an arid zone. J. Geophys. Res-Atmos. 2004, 109, D16103. [Google Scholar]
  11. Verhoef, A.; Diaz-Espejo, A.; Knight, J.R.; Villagarcia, L.; Fernandez, J.E. Adsorption of water vapor by bare soil in an olive grove in southern Spain. J. Hydrometeorol. 2006, 7, 1011–1027. [Google Scholar] [CrossRef]
  12. Kool, D.; Agra, E.; Drabkin, A.; Duncan, A.; Fendinat, P.P.; Leduc, S.; Lupovitch, G.; Nambwandja, A.N.; Ndilenga, N.S.; Nguyễn Thị, T.; et al. The overlooked non-rainfall water input sibling of fog and dew: Daily water vapor adsorption on a! Nara hummock in the Namib Sand Sea. J. Hydrol. 2021, 598, 126420. [Google Scholar] [CrossRef]
  13. Ziarani, M.R.; Bookhagen, B.; Schmidt, T.; Wickert, J.; de la Torre, A.; Hierro, R. Using convective available potential energy (CAPE) and dew-point temperature to characterize rainfall-extreme events in the South-Central Andes. Atmosphere 2019, 10, 379. [Google Scholar] [CrossRef]
  14. Baldauf, S.; Porada, P.; Raggio, J.; Maestre, F.T.; Tietjen, B. Relative humidity predominantly determines long-term biocrust-forming lichen cover in drylands under climate change. J. Hydrol. 2021, 109, 1370–1385. [Google Scholar] [CrossRef]
  15. Kohfahl, C.; Saaltink, M.W.; Ruiz Bermudo, F. Vapor flow control in dune sediments under dry bare soil conditions. Sci. Total Environ. 2021, 786, 147404. [Google Scholar] [CrossRef] [PubMed]
  16. Kosmas, C.; Marathianou, M.; Gerontidis, S.; Detsis, V.; Tsara, M.; Poesen, J. Parameters affecting water vapor adsorption by the soil under semi-arid climatic conditions. Agr. Water Manag. 2001, 48, 61–78. [Google Scholar] [CrossRef]
  17. Sharan, G.; Beysens, D.; Milimouk-Melnytchouk, I. A study of dew water yields on Galvanized iron roofs in Kothara (North-West India). J. Arid Environ. 2007, 69, 259–269. [Google Scholar] [CrossRef]
  18. Brown, R.; Mills, A.J.; Jack, C. Non-rainfall moisture inputs in the Knersvlakte: Methodology and preliminary findings. Water SA 2008, 34, 275–278. [Google Scholar] [CrossRef]
  19. Petersen, L.W.; Moldrup, P.; Jacobsen, O.H.; Rolston, D.E. Relations between specific surface area and soil physical and chemical properties. Soil Sci. 1996, 161, 9–21. [Google Scholar] [CrossRef]
  20. Li, X.Y. Effects of gravel and sand mulches on dew deposition in the semiarid region of China. J. Hydrol. 2002, 260, 151–160. [Google Scholar] [CrossRef]
  21. Liu, L.; Li, S.; Duan, Z.; Wang, T.; Zhang, Z.; Li, X. Effects of microbiotic crusts on dew deposition in the restored vegetation area at Shapotou, northwest China. J. Hydrol. 2006, 328, 331–337. [Google Scholar] [CrossRef]
  22. Maphangwa, K.W.; Musil, C.F.; Raitt, L.; Zedda, L. Differential interception and evaporation of fog, dew and water vapour and elemental accumulation by lichens explain their relative abundance in a coastal desert. J. Arid Environ. 2012, 82, 71–80. [Google Scholar] [CrossRef]
  23. Kosmas, C.; Danalatos, N.G.; Poesen, J.; Van Wesemael, B. The effect of water vapour adsorption on soil moisture content under Mediterranean climatic conditions. Agr. Water Manag. 1998, 36, 157–168. [Google Scholar] [CrossRef]
  24. Zhang, Q.T.; Ma, J.; Li, L.; Zhou, C.C.; He, C.Y.; Zhang, Z.; Zhang, Y. Water vapour adsorption under rice-straw and gravel mulch in lysimeters. J. Food Agric. Environ. 2012, 10, 949–955. [Google Scholar]
  25. Li, D.; Wang, J.; Wang, S.; Li, Z.; Shang, K.; Bi, J. Soil moisture characteristics and analysis on its moving mechanism in central Gansu, a part of the semi-arid Loess Plateau. J. Desert Res. 2014, 34, 140–147. [Google Scholar]
  26. Kharitonova, G.V.; Vityazev, V.G.; Lapekina, S.I. A mathematical model for the adsorption of water vapor by soils. Eurasian Soil Sci. 2010, 43, 177–186. [Google Scholar] [CrossRef]
  27. Danalatos, N.G.; Kosmas, C.S.; Moustakas, N.C.; Yassoglou, N. Rock fragments: II. Their impact on soil physical properties and biomass production under Mediterranean conditions. Soil Use Manag. 1995, 11, 121–126. [Google Scholar] [CrossRef]
  28. Zhang, J.; Zhang, Y.; Downing, A.; Cheng, J.; Zhou, X.B.; Zhang, B. The influence of biological soil crusts on dew deposition in Gurbantunggut Desert, Northwestern China. J. Hydrol. 2009, 379, 220–228. [Google Scholar] [CrossRef]
  29. Zhang, Q.; Wang, S.; Wang, S.; Zhao, Y.; Wen, X. Influence factors and variation characteristics of water vapor absorption by soil in semi-arid region. Sci. China Earth Sci. 2016, 59, 2240–2251. [Google Scholar] [CrossRef]
  30. Kidron, G.J. The effect of substrate properties, size, position, sheltering and shading on dew: An experimental approach in the Negev Desert. Atmos Res. 2010, 98, 378–386. [Google Scholar] [CrossRef]
  31. Jin, J.X.; Ding, Y.M.; Sun, Z.Y.; Zhu, L. Numerical simulation of spring wheat growth and yield in arid areas based on SWAP-IES. Trans. Chin. Soc. Agric. Eng. 2023, 39, 66–76. [Google Scholar]
  32. Wang, R. Relationship between Soil Quality with Grape Growth and Composition at the Eastern Foot of Helan Mountain Wine Production Regions. Ph.D. Thesis, Northwest A& F University, Xianyang, China, 2016. [Google Scholar]
  33. Hannes, M.; Wollschlaeger, U.; Schrader, F.; Durner, W.; Gebler, S.; Puetz, T.; Fank, J.; von Unold, G.; Vogel, H.J. A comprehensive filtering scheme for high-resolution estimation of the water balance components from high-precision lysimeters. Hydrol. Earth Syst. Sci. 2015, 19, 3405–3418. [Google Scholar] [CrossRef]
  34. Puetz, T.; Kiese, R.; Wollschlaeger, U.; Groh, J.; Rupp, H.; Zacharias, S.; Priesack, E.; Gerke, H.H.; Gasche, R.; Bens, O.; et al. TERENO-SOILCan: A lysimeter-network in Germany observing soil processes and plant diversity influenced by climate change. Environ. Earth Sci. 2016, 75, 1–14. [Google Scholar] [CrossRef]
  35. Kabela, E.D.; Hornbuckle, B.K.; Cosh, M.H.; Anderson, M.C.; Gleason, M.L. Dew frequency, duration, amount, and distribution in corn and soybean during SMEX05. Agr. Forest Meteorol. 2009, 149, 11–24. [Google Scholar] [CrossRef]
  36. Zhang, Q.; Wang, S.; Yue, P.; Wang, R. A measurement, quantitative identification and estimation method (QINRW) of non-rainfall water component by lysimeter. MethodsX 2019, 6, 2873–2881. [Google Scholar] [CrossRef] [PubMed]
  37. Guo, Z.; Han, S. Experimental study on the condensate water in arid areas of northwest China. Adv. Water Sci. 2002, 13, 623–628. [Google Scholar]
  38. Qian, L.; Li, H.; Wang, L. Comparison of moisture absorption and condensed water amount of three underlying soils in Mu Us sandy Land. J. Arid Land Res. Environ. 2009, 23, 122–125. [Google Scholar]
  39. Chen, R. Analysis on the source characteristics of condensed water vapor in the surface soil of the Gurbantunggut Desert. J. Desert Res. 2012, 32, 985–989. [Google Scholar]
  40. Xie, Z.; Wang, Y.; Cheng, G.; Malhi, S.S.; Vera, C.L.; Guo, Z.; Zhang, Y. Particle-size effects on soil temperature, evaporation, water use efficiency and watermelon yield in fields mulched with gravel and sand in semi-arid Loess Plateau of northwest China. Agr. Water Manag. 2010, 97, 917–923. [Google Scholar] [CrossRef]
  41. Guo, X.; Zha, T.; Jia, X.; Wu, B.; Feng, W.; Xie, J.; Gong, J.; Zhang, Y.; Peltola, H. Dynamics of dew in a cold desert-shrub ecosystem and its abiotic controls. Atmosphere 2016, 7, 32. [Google Scholar] [CrossRef]
  42. Fang, J.; Ding, Y. Relationship between condensation water of sandy soil and micrometeorological factors in arid desert area. J. Desert Res. 2015, 35, 1200–1205. [Google Scholar]
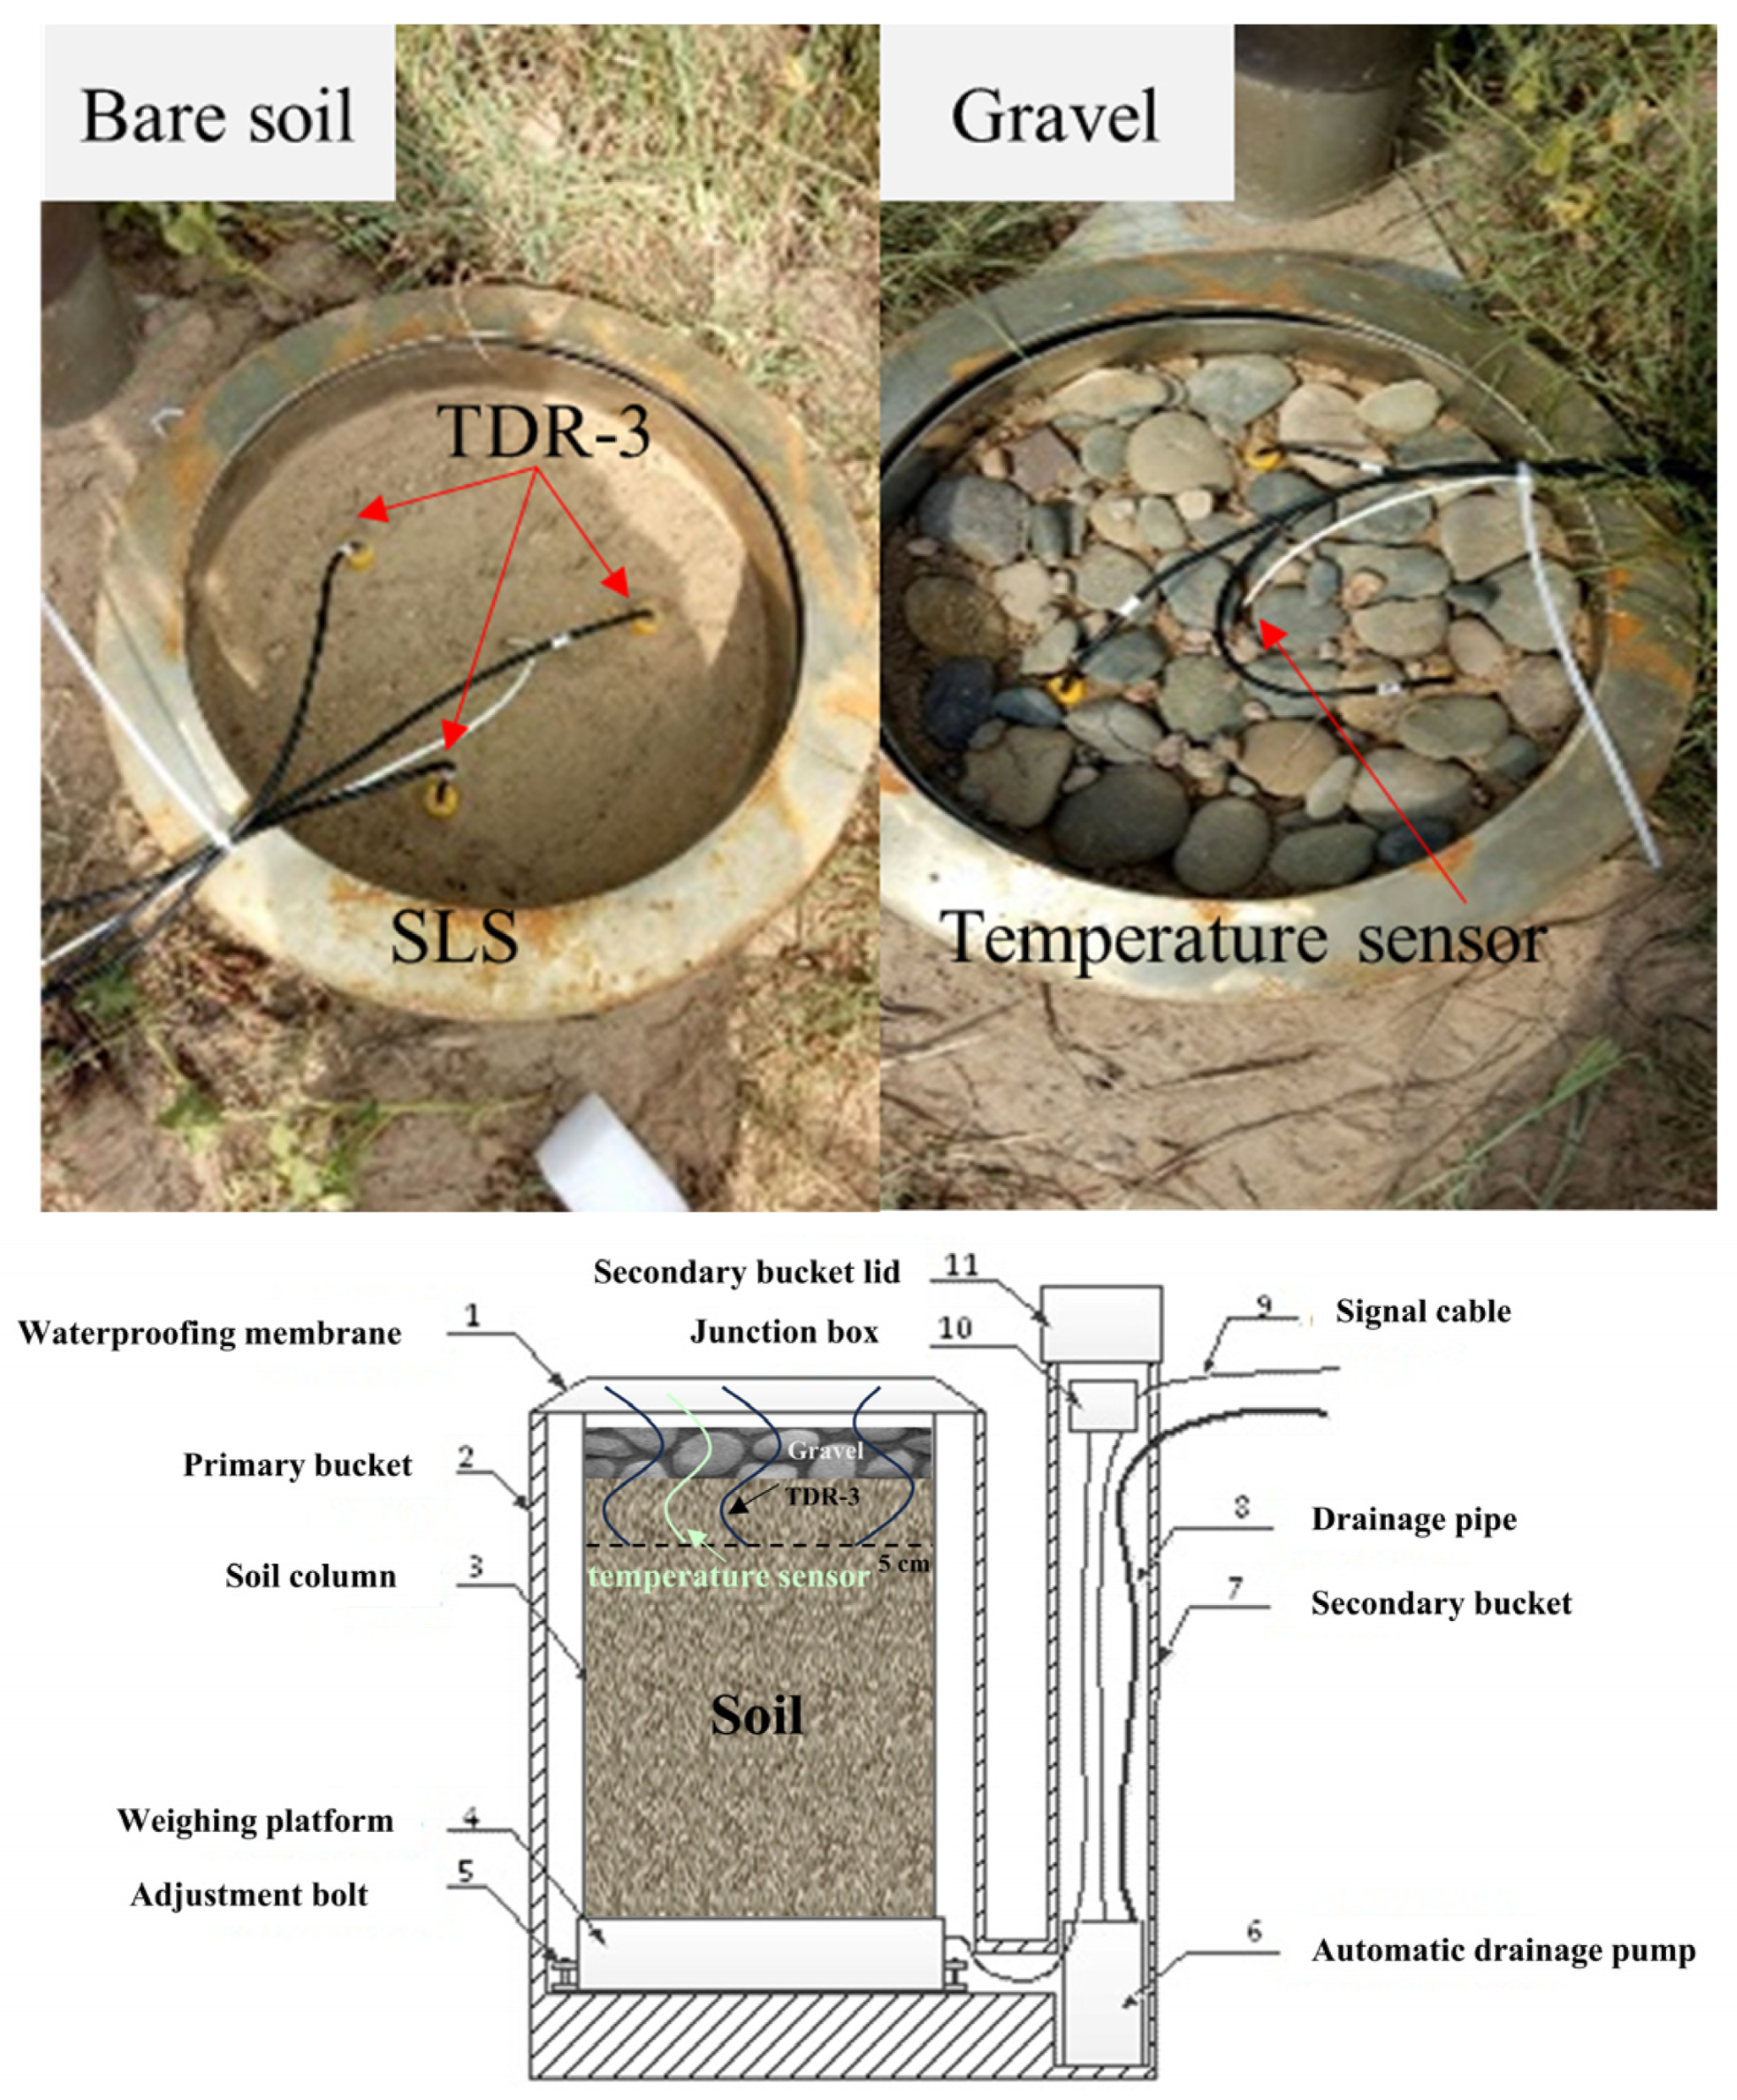
Figure 1. The arrangement and cross-sectional diagram of the SLSs (small-scale laboratory weighing lysimeters) on gravel surface in Ningxia, China.
Water 16 00984 g001
Figure 2. Water vapor adsorption discrimination process (Ta represents atmospheric temperature, Td represents dew point temperature, and RH represents atmospheric humidity).
Water 16 00984 g002
Figure 3. Vapor adsorption in Ningxia, China, by hour and month for 24 months from 2019 to 2020.
Water 16 00984 g003
Figure 4. Multi-dimensional statistical analysis of the average intensity rate and frequency of water vapor adsorption on the bare soil and gravel surface in Ningxia, China. (a,b) Hourly variation (frequency = fh; rate = Ih); (c,d) monthly variation (frequency = fm; rate = Im); (e,f) frequency and adsorption amount at different levels of water vapor adsorption.
Water 16 00984 g004
Figure 5. Comprehensive analysis of adsorption and evaporation in Ningxia, China. (a,b) Daily variation in adsorption (A), evaporation (E), and difference between evaporation and adsorption (E-A) with variation in precipitation (P). (c) The daily variation in evaporation, adsorption sum/evaporation sum (A/E) on bare soil and gravel from 1 November 2019 to 1 May 2020.
Water 16 00984 g005
Figure 6. The sum of monthly scale water vapor adsorption, evaporation, and the difference between evaporation and adsorption (E-A) in Ningxia, China, from 2019 to 2020.
Water 16 00984 g006
Figure 7. Hourly scale coordinated analysis of adsorption and evaporation in Ningxia, China. (ad) Average hourly variation of evaporation and the ratio of adsorption rate/sum to evaporation rate/sum on two surfaces.
Water 16 00984 g007
Figure 8. Monthly and daily soil water content in Ningxia, China. (a) Average monthly variation in soil water content (SWC) at a depth of 5 cm in bare soil in Ningxia, China, from May to November. (b) Daily soil water content (SWC) at a depth of 5 cm in bare soil and gravel surface under the influence of rainfall in Ningxia, China.
Water 16 00984 g008
Figure 9. The effect of soil temperature on the formation frequency of adsorbed water on two surfaces in Ningxia, China, from May to November in 2019.
Water 16 00984 g009
Figure 10. The influence of relative humidity, surface temperature, the temperature difference between air temperature at 30 cm and surface temperature on the frequency and total volume of adsorbed water in Ningxia, China.
Water 16 00984 g010
Figure 11. The impact of meteorological parameters on adsorption in Ningxia, China. (ad) Daily variation in surface temperature, air temperature, and relative humidity at 30 cm above the ground on bare soil from November to February the next year. (eh) Effects of temperature difference and relative humidity on adsorption on and evaporation from bare soil, showing the middle 10 days from November to February the next year. Note: Because the period was short, the generation of adsorption could be examined over time, so no threshold rejection was used.
Water 16 00984 g011
Table 1. Annual statistics on bare soil and gravel in Ningxia, China, in 2019 and 2020.
YearPrecipitation (P, mm)SurfaceAdsorption (A, mm)Evaporation (E, mm)E-A (mm)A/EOccurrences of ADays of A
2019124.83Bare soil28.39177.48149.090.161904320
Gravel19.79198.89179.100.101376313
2020150.98Bare soil17.11163.54146.430.101327256
Gravel19.68161.48141.800.121445286
Disclaimer/Publisher’s Note: The statements, opinions and data contained in all publications are solely those of the individual author(s) and contributor(s) and not of MDPI and/or the editor(s). MDPI and/or the editor(s) disclaim responsibility for any injury to people or property resulting from any ideas, methods, instructions or products referred to in the content.