
Extent and Sources of Heavy Metal Pollution from Discharging Rivers in the Bohai Region, China

 ,
,
Abstract
1. Introduction
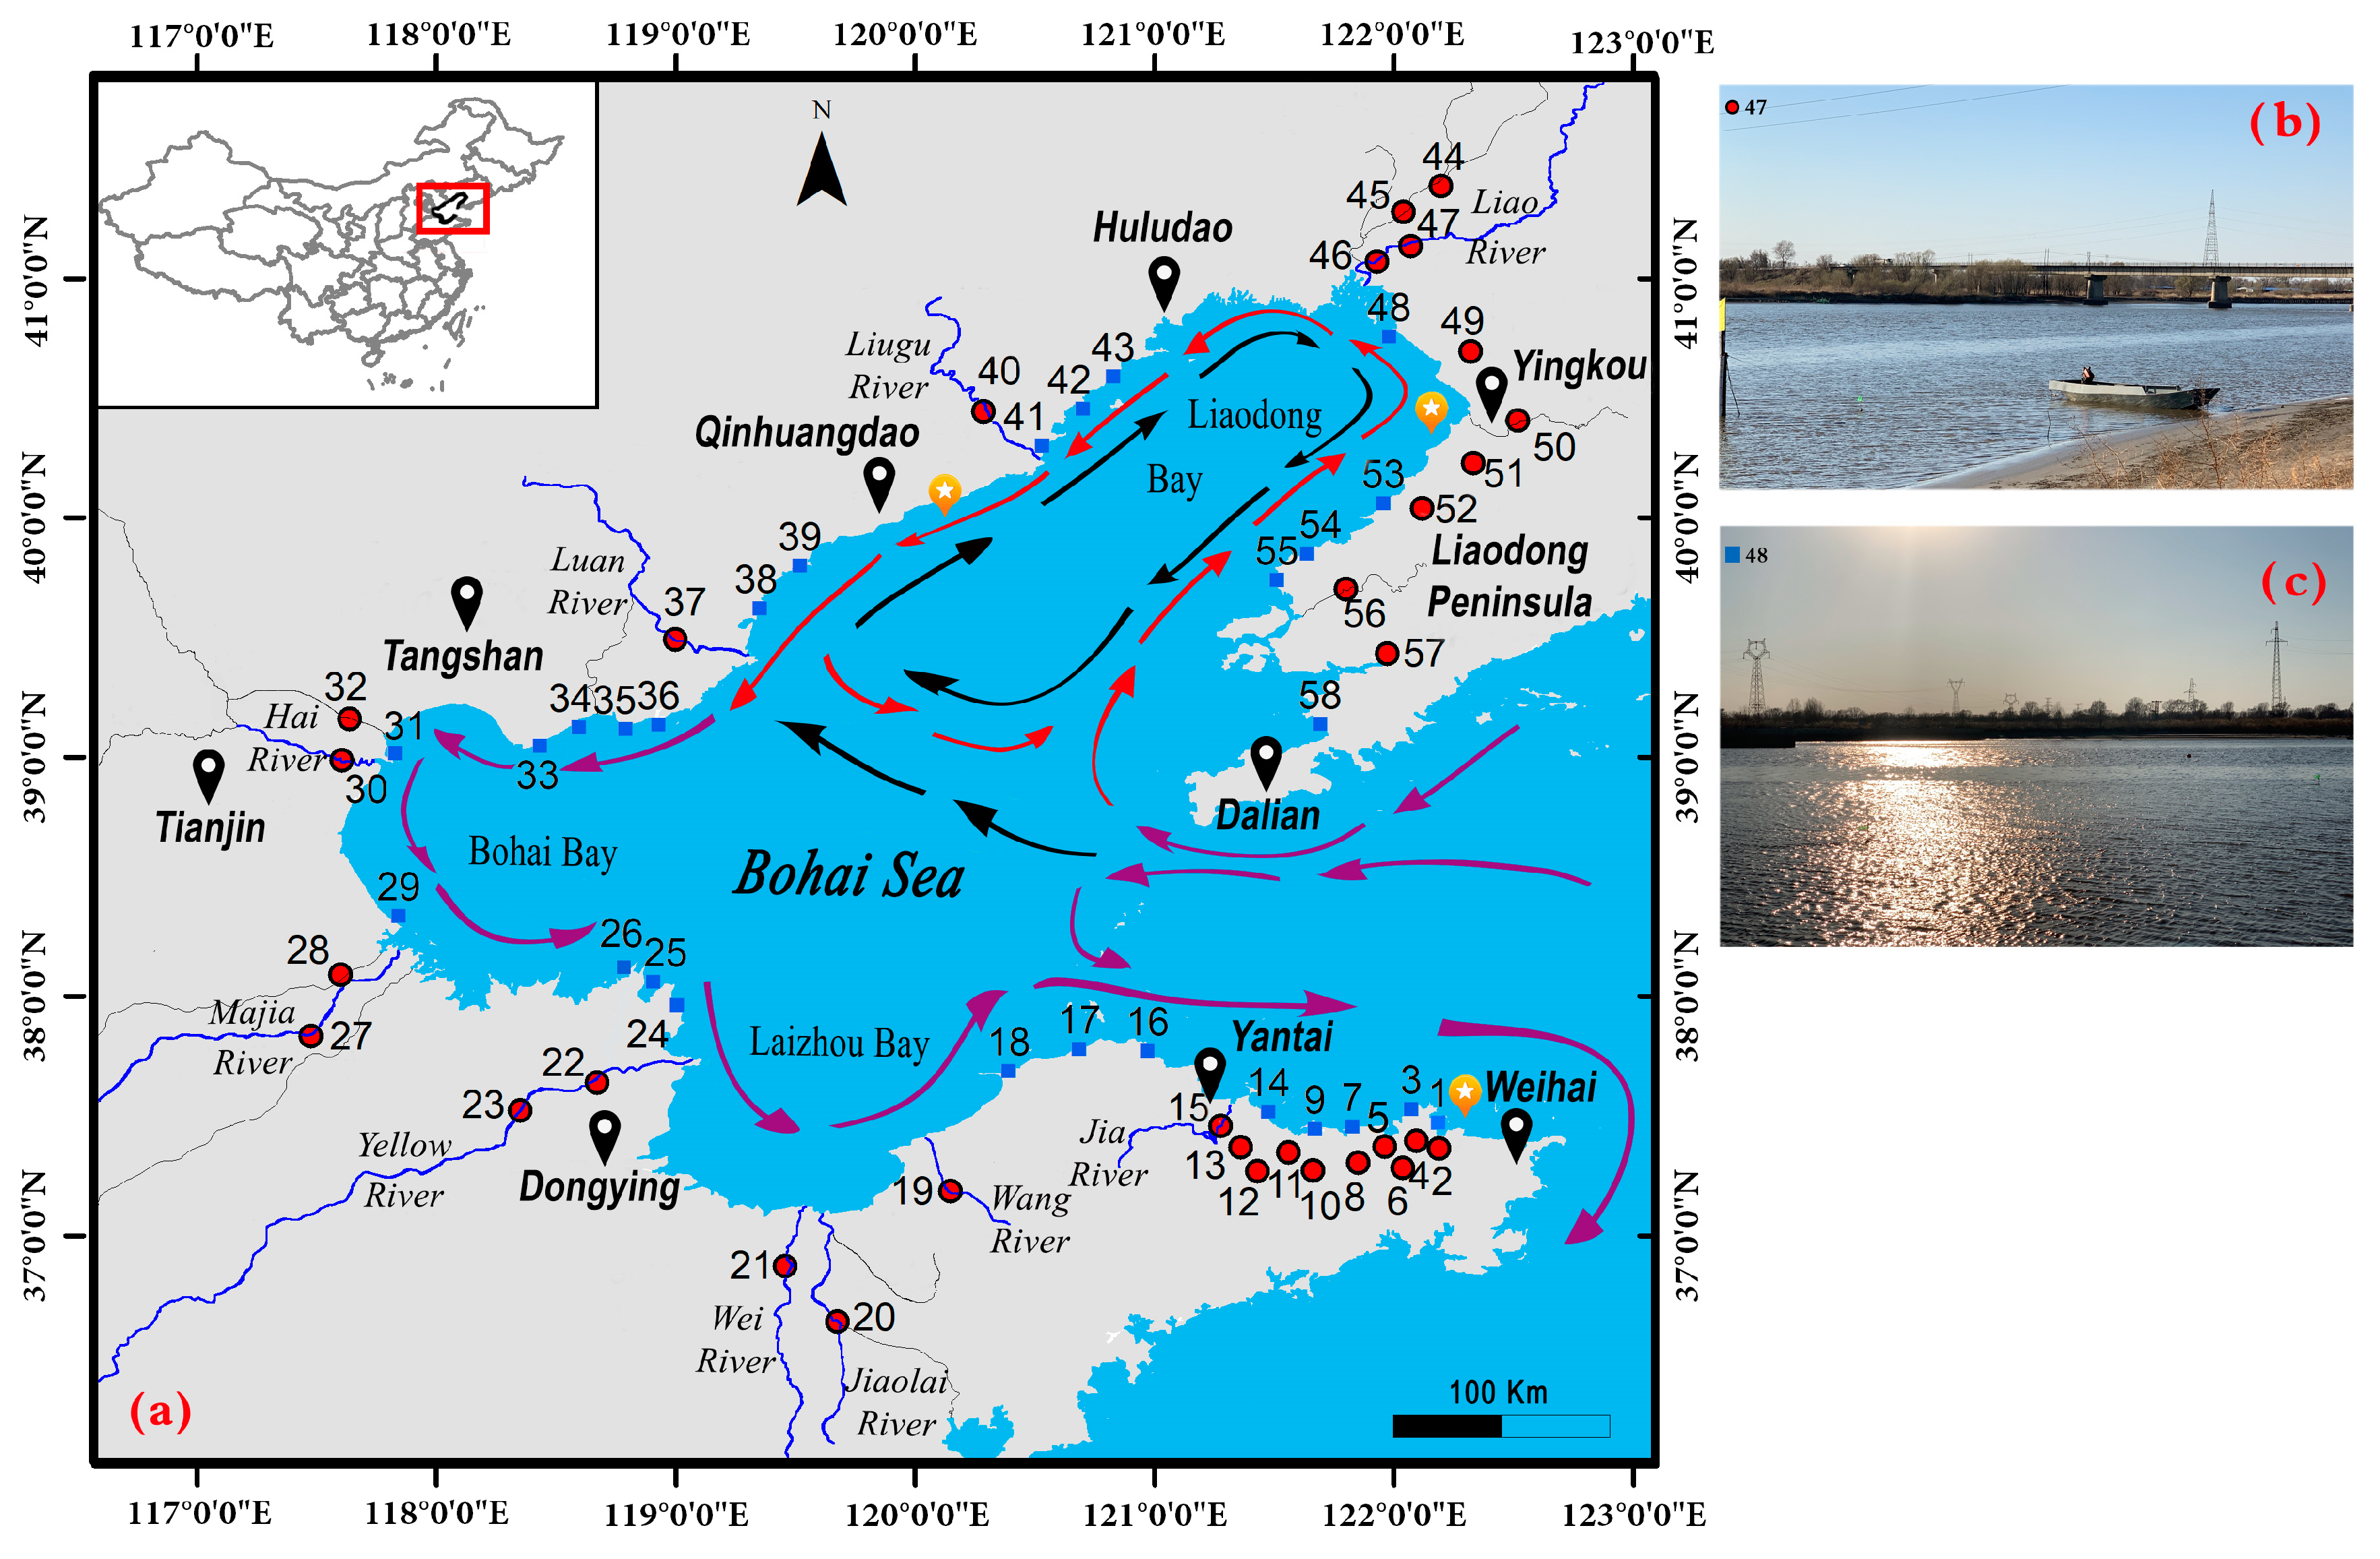
2. Study Area
3. Materials and Methods
3.1. Sample Collection and Preparation
3.2. Estimation of the Degree of Heavy Metal Pollution in Sediment Samples

| a: Guideline Values (mg/kg) for HM Concentrations in Fluvial Sediments | ||||||||
| 1 US-EPA | As | Cd | Cr | Cu | Ni | Pb | V | Zn |
| TEC | 9.79 | 0.99 | 43.4 | 31.6 | 22.7 | 35.8 | -- | 121 |
| b: Guideline Values (μg/L) for Dissolved HM Concentrations in Seawater | ||||||||
| 2 GB 3097-1997 | As | Cd | Cr | Cu | Ni | Pb | V | Zn |
| Grade 1 | 20 | 1 | 50 | 5 | 5 | 1 | 29 * | 20 |
| Grade 2 | 30 | 5 | 100 | 10 | 10 | 5 | -- | 50 |
| c: Guideline Values (μg/L) for Dissolved HM Concentrations in River Water | ||||||||
| 3 US-EPA | As | Cd | Cr | Cu | Ni | Pb | V | Zn |
| CCC | 150 | 0.25 | 11 | 9 | 52 | 2.5 | 15 | 120 |
| CMC | 340 | 2 | 16 | 13 | 470 | 65 | 50 | 120 |
| 1 GB 18421-2001 | As | Cd | Cr | Cu | Ni | Pb | V | Zn |
|---|---|---|---|---|---|---|---|---|
| Grade 1 | 1.0 | 0.2 | 0.5 | 10 | -- | 0.1 | -- | 20 |
| Grade 2 | 5.0 | 2.0 | 2.0 | 25 | 2.0 | 50 | ||
| Grade 3 | 8.0 | 5.0 | 6.0 | 50 | -- | 6.0 | -- | 100 |
| Sea cucumber-Q | 0.37 ± 0.04 | 0.05 ± 0.003 | 0.19 ± 0.02 | 1.41 ± 0.23 | 0.06 ± 0.003 | 0.05 ± 0.003 | 0.02 ± 0.001 | 2.70 ± 0.36 |
| Sea snail-Q | 13.91 ± 0.8 | 3.96 ± 0.49 | 0.33 ± 0.04 | 36.86 ± 2.61 | 0.18 ± 0.02 | 0.15 ± 0.01 | 0.05 ± 0.003 | 151.43± 8.53 |
| Sea cucumber-W | 1.05 ± 0.14 | 0.06 ± 0.003 | 0.28 ± 0.03 | 1.31 ± 0.21 | 0.20 ± 0.02 | 0.05 ± 0.003 | 0.08 ± 0.004 | 3.81 ± 0.41 |
| Sea snail-W | 8.15 ± 1.35 | 2.72 ± 0.36 | 0.41 ± 0.05 | 91.20 ± 6.56 | 0.55 ± 0.08 | 0.24 ± 0.007 | 0.06 ± 0.003 | 104.24 ± 7.37 |
| Sea cucumber-Y | 0.90 ± 0.11 | 0.28 ± 0.008 | 0.07 ± 0.004 | 1.16 ± 0.19 | 0.15 ± 0.01 | 0.03 ± 0.002 | 0.07 ± 0.004 | 5.84 ± 0.71 |
4. Results
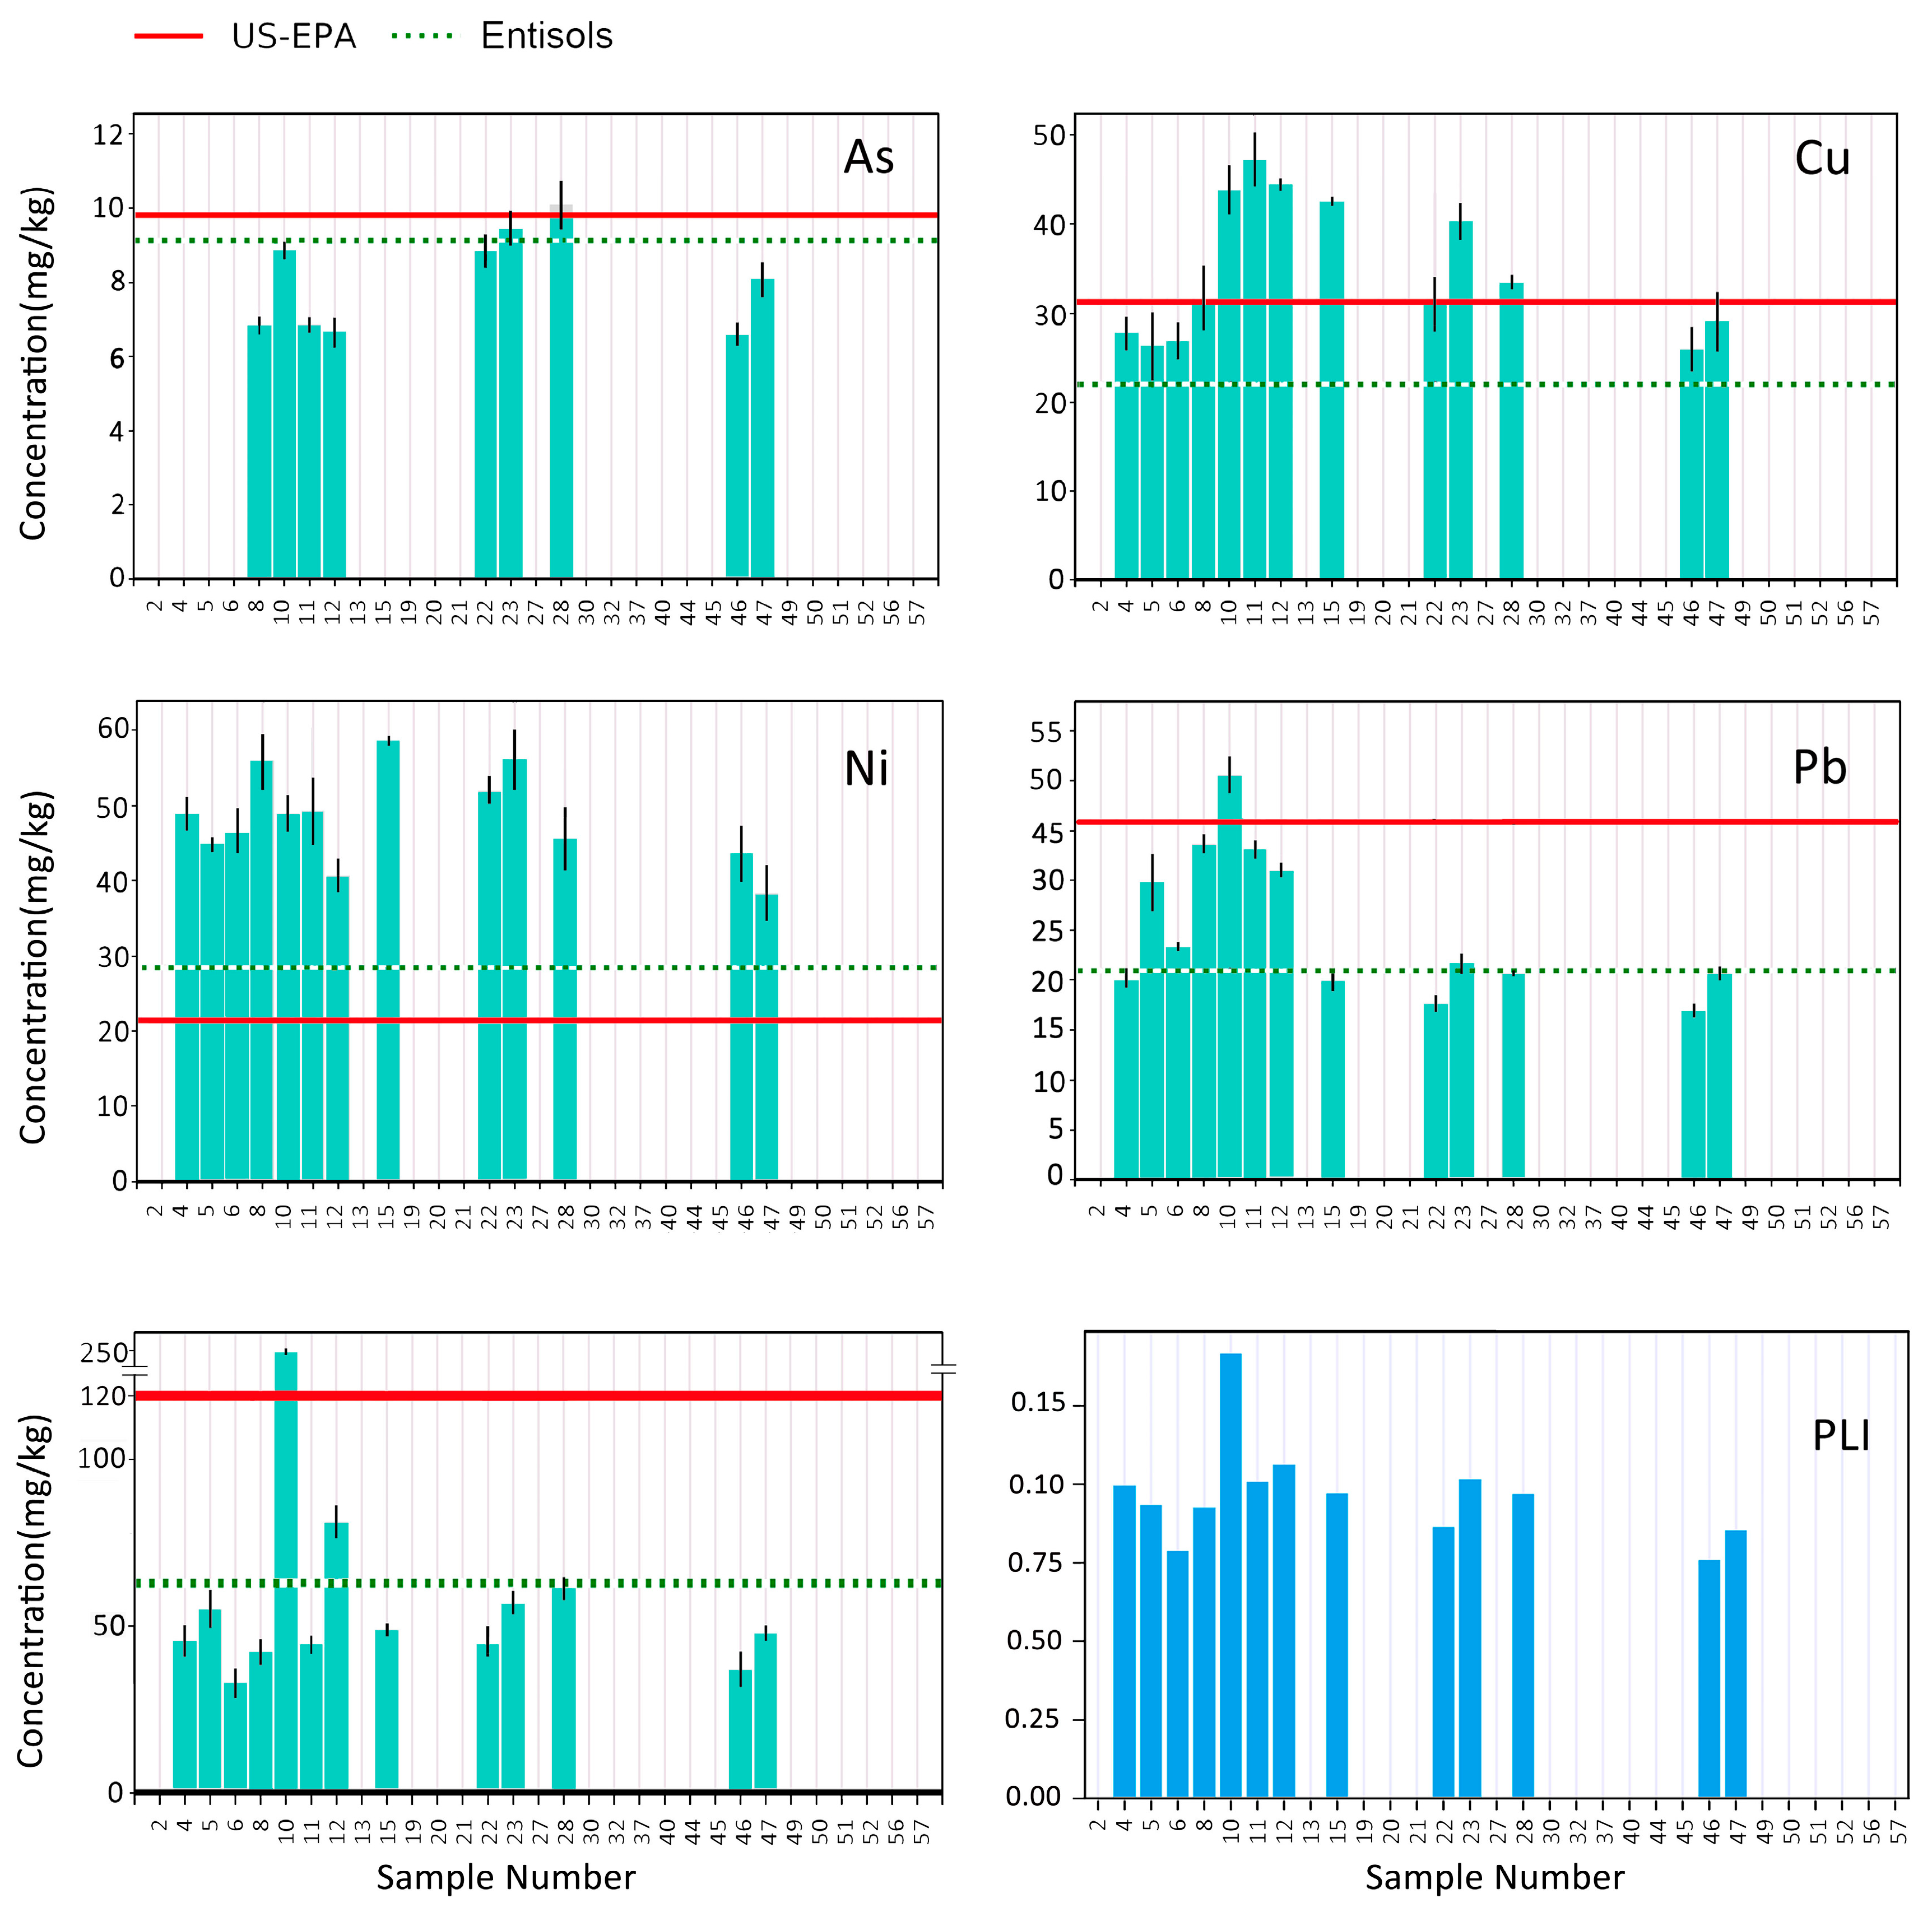
4.1. River Sediments
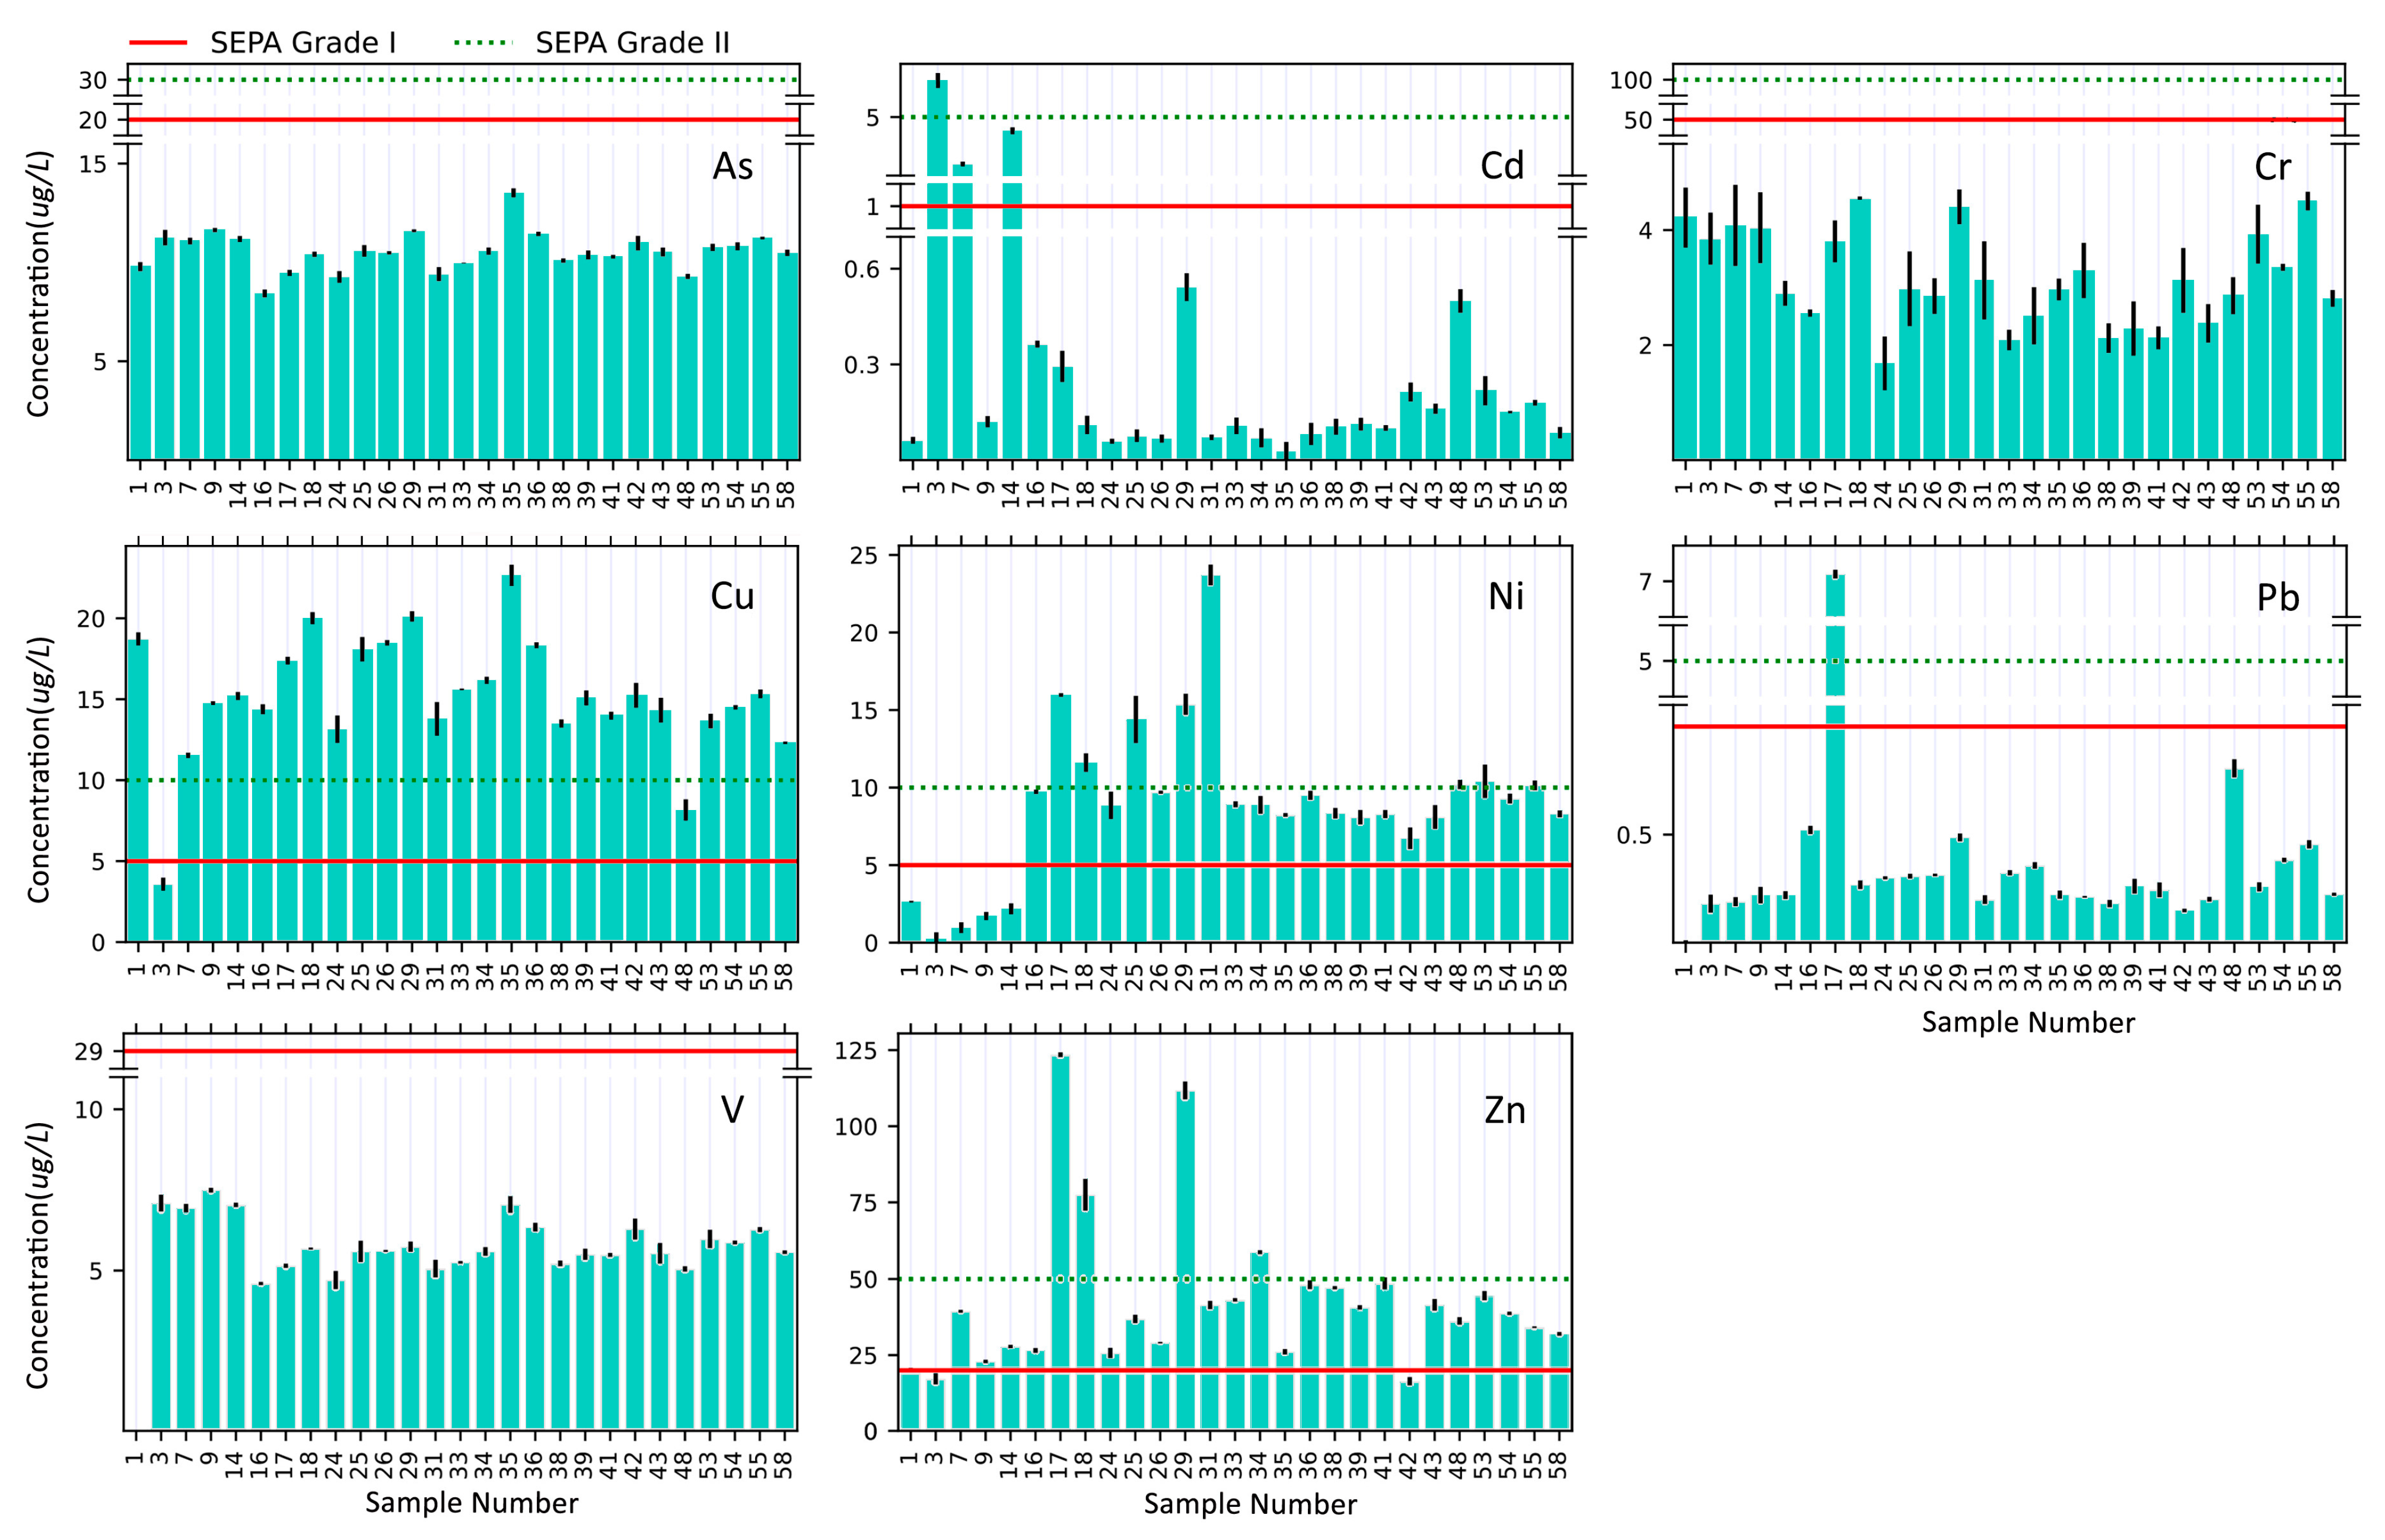
4.2. Seawater
4.3. Invertebrates
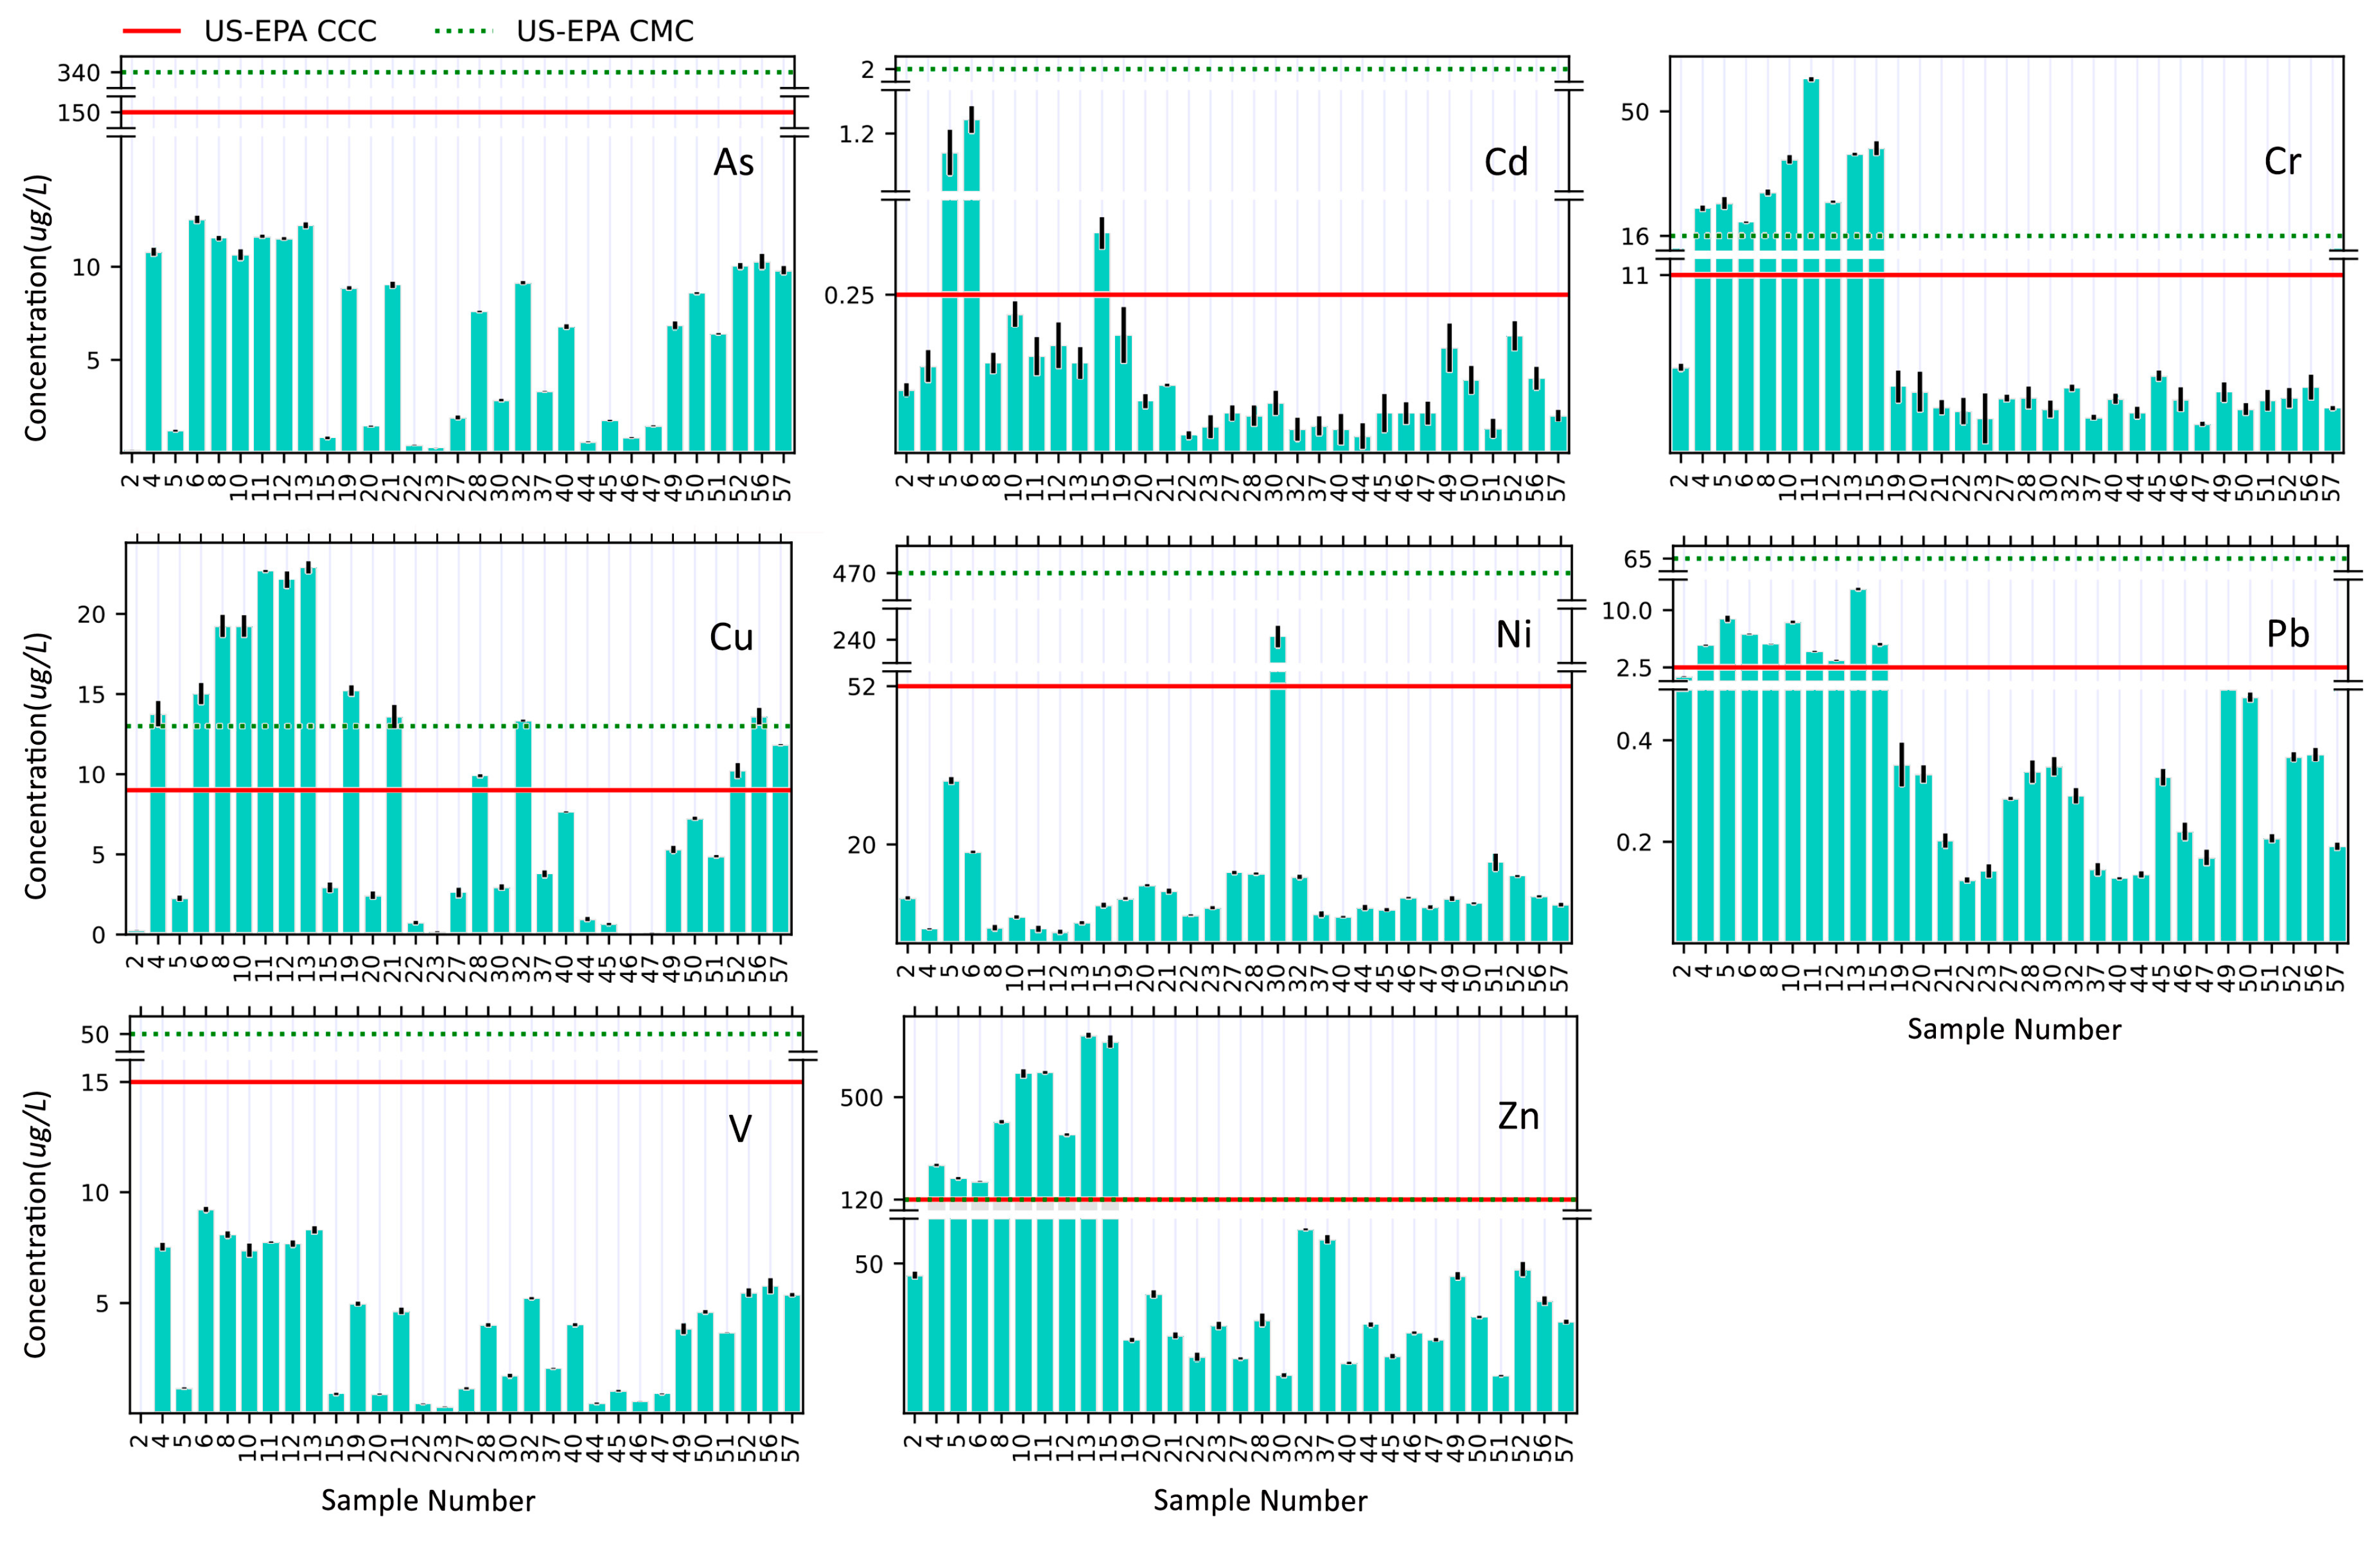
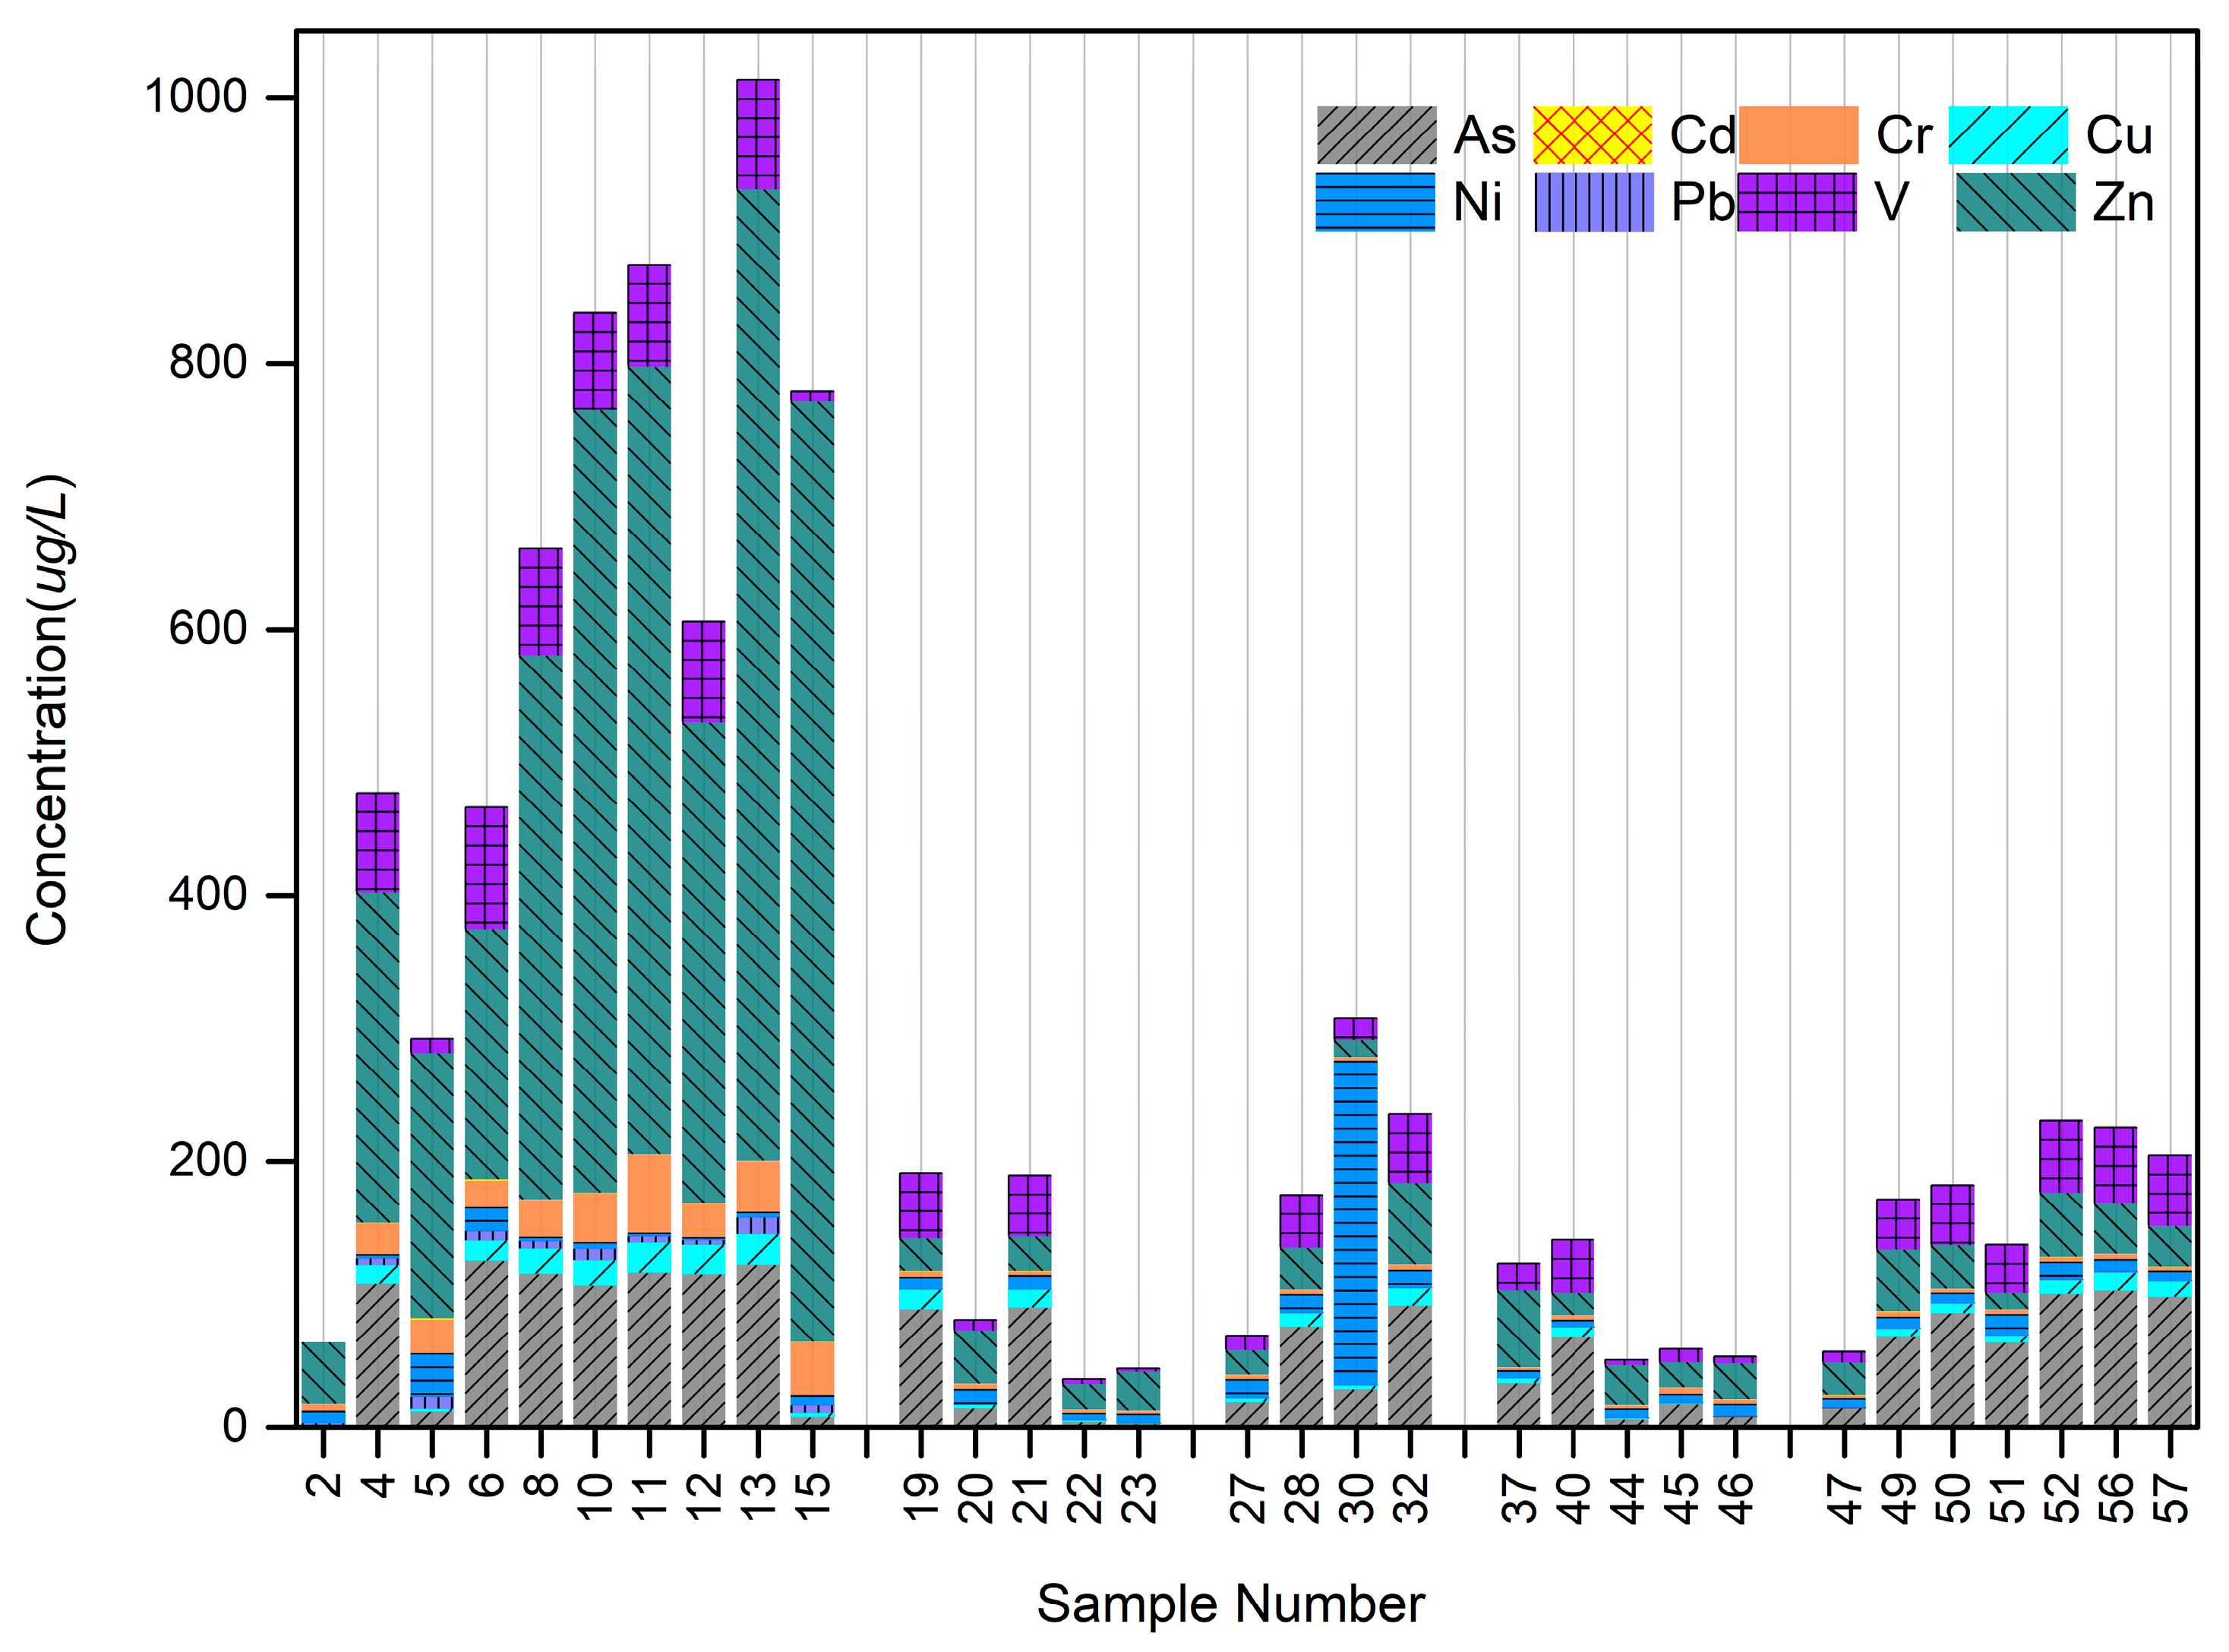
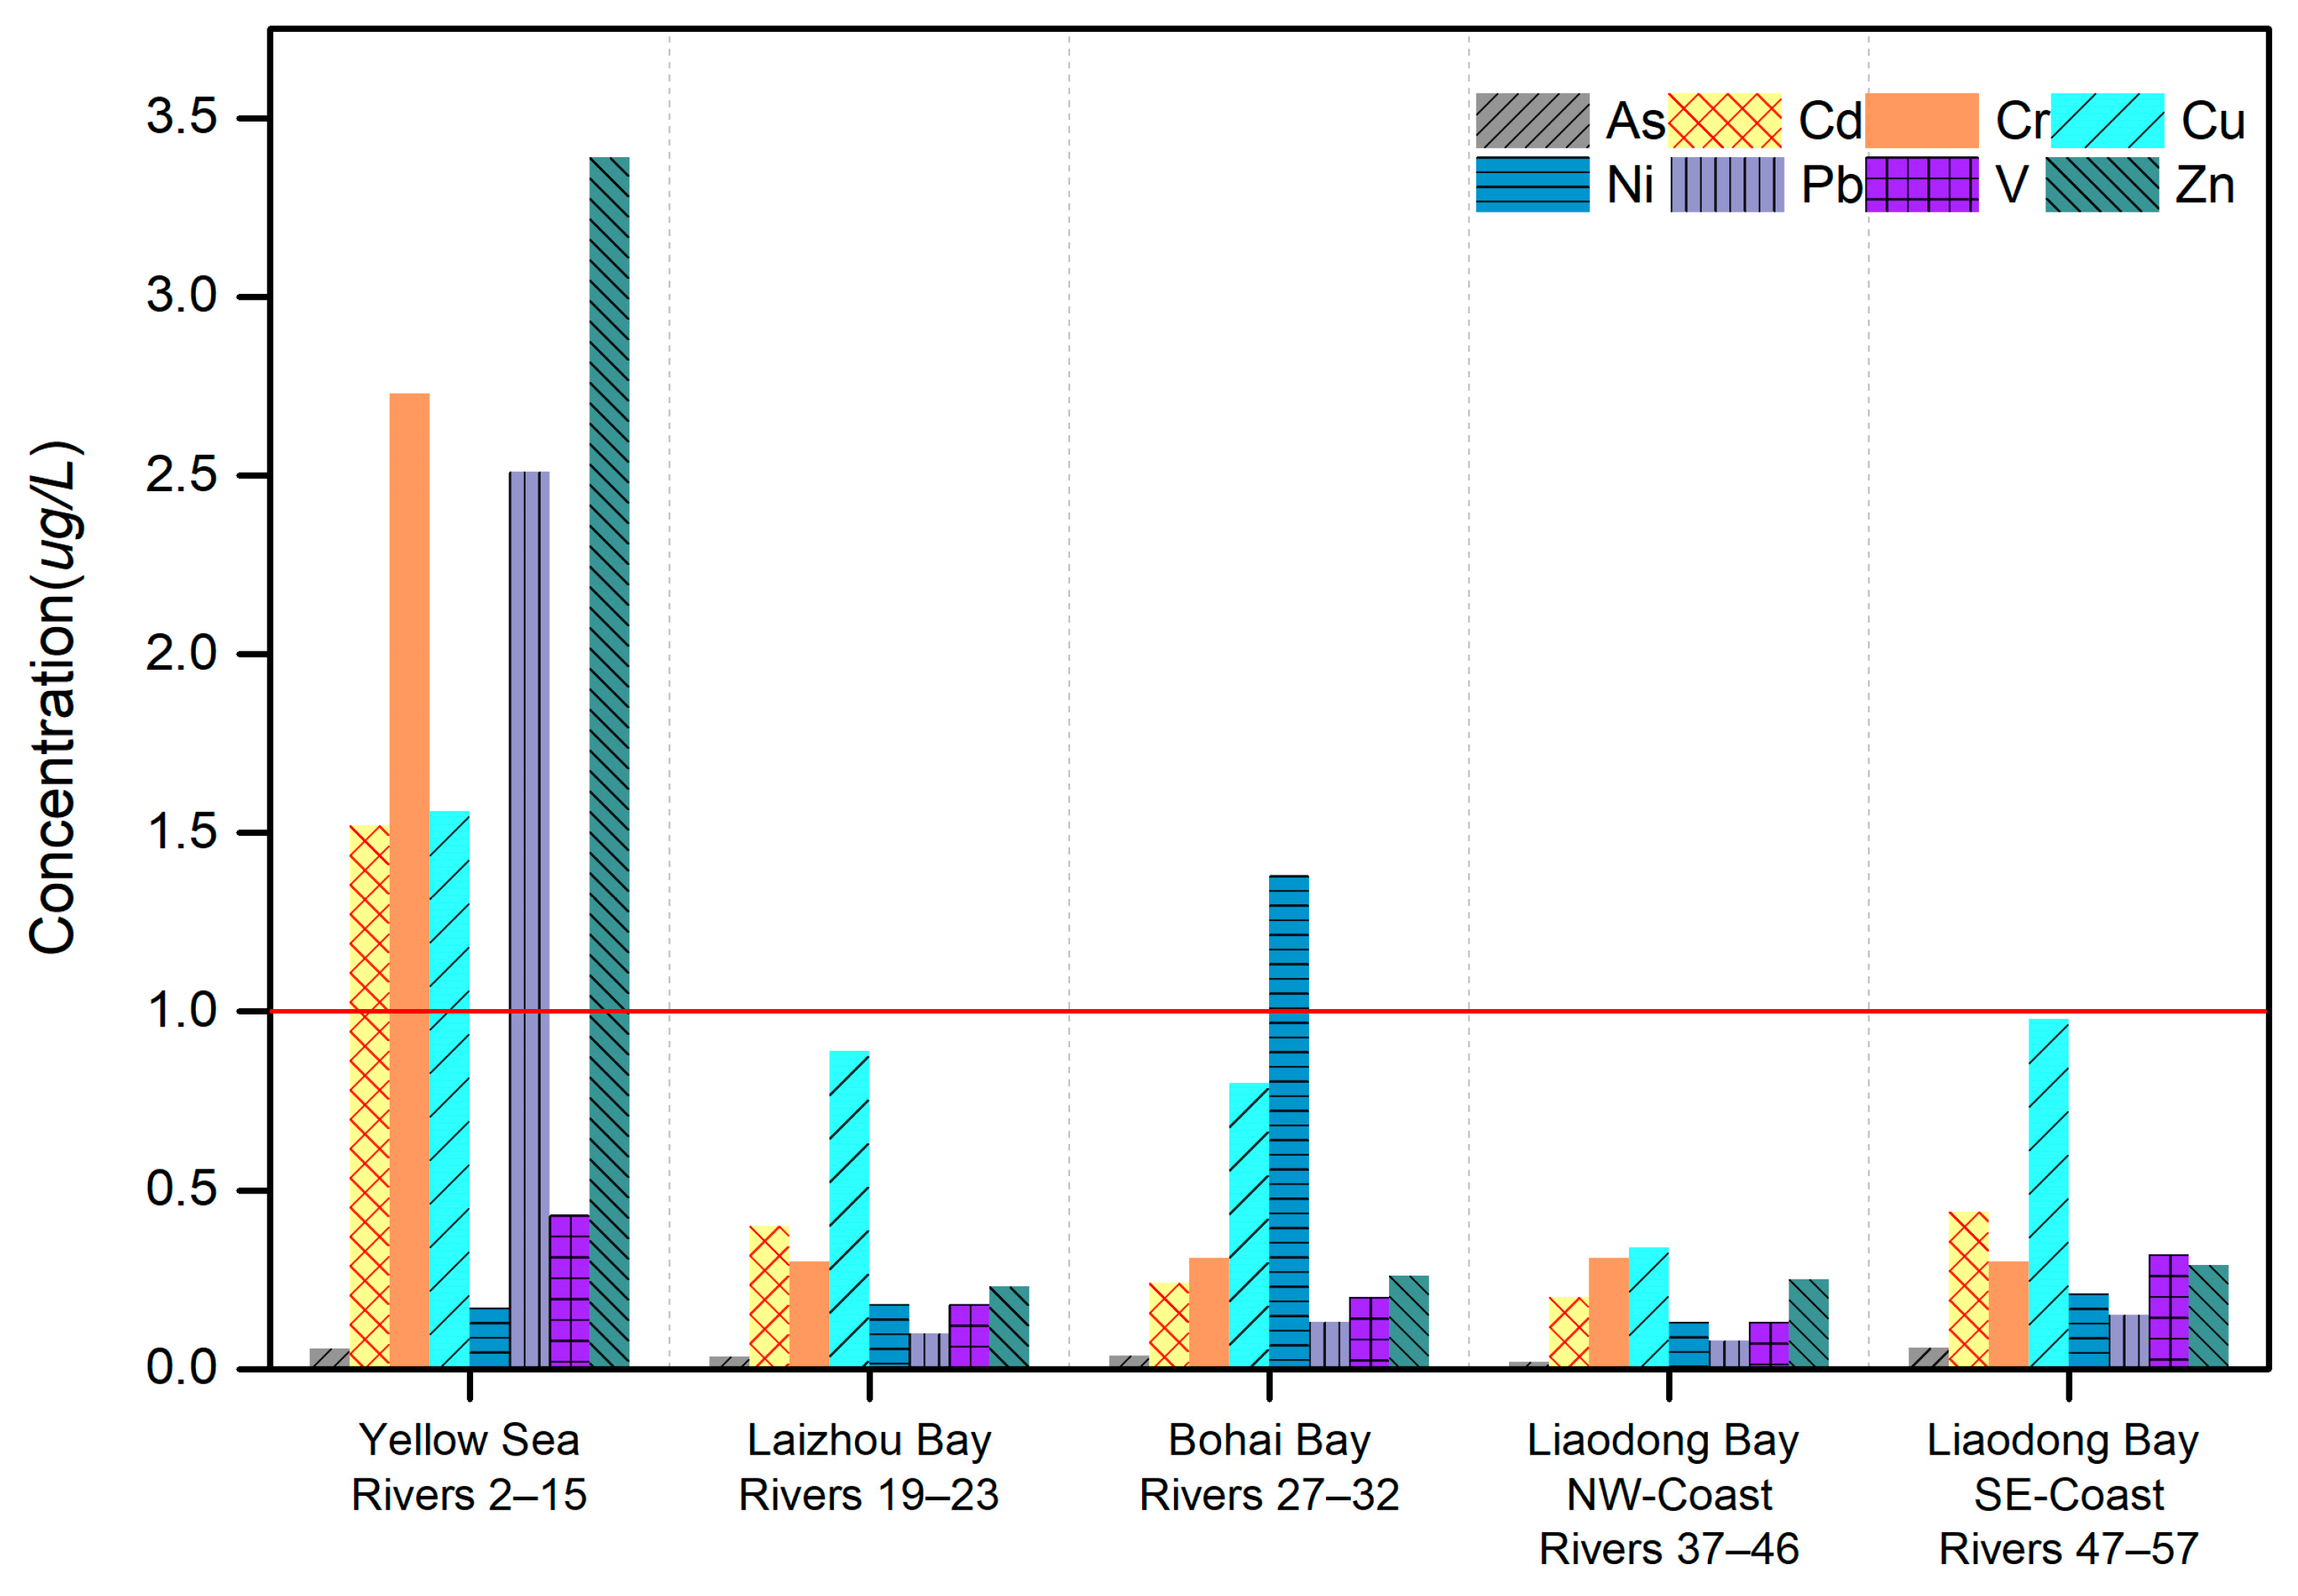
4.4. River Waters
5. Discussion
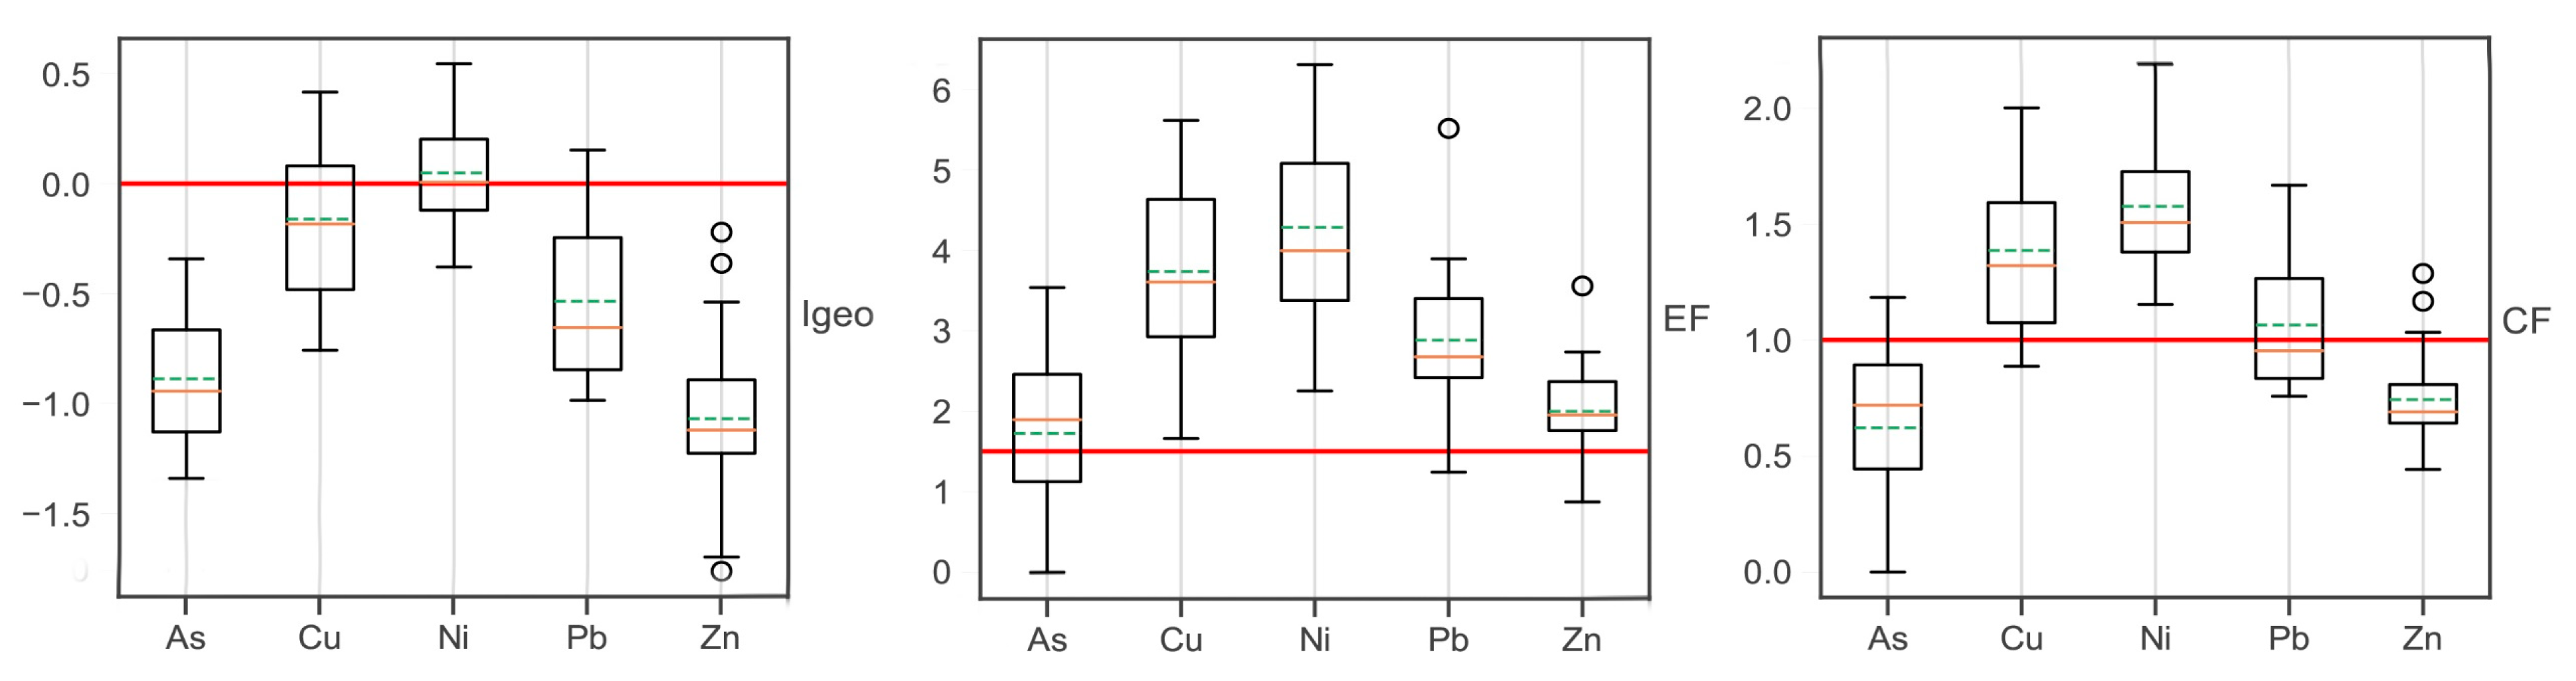
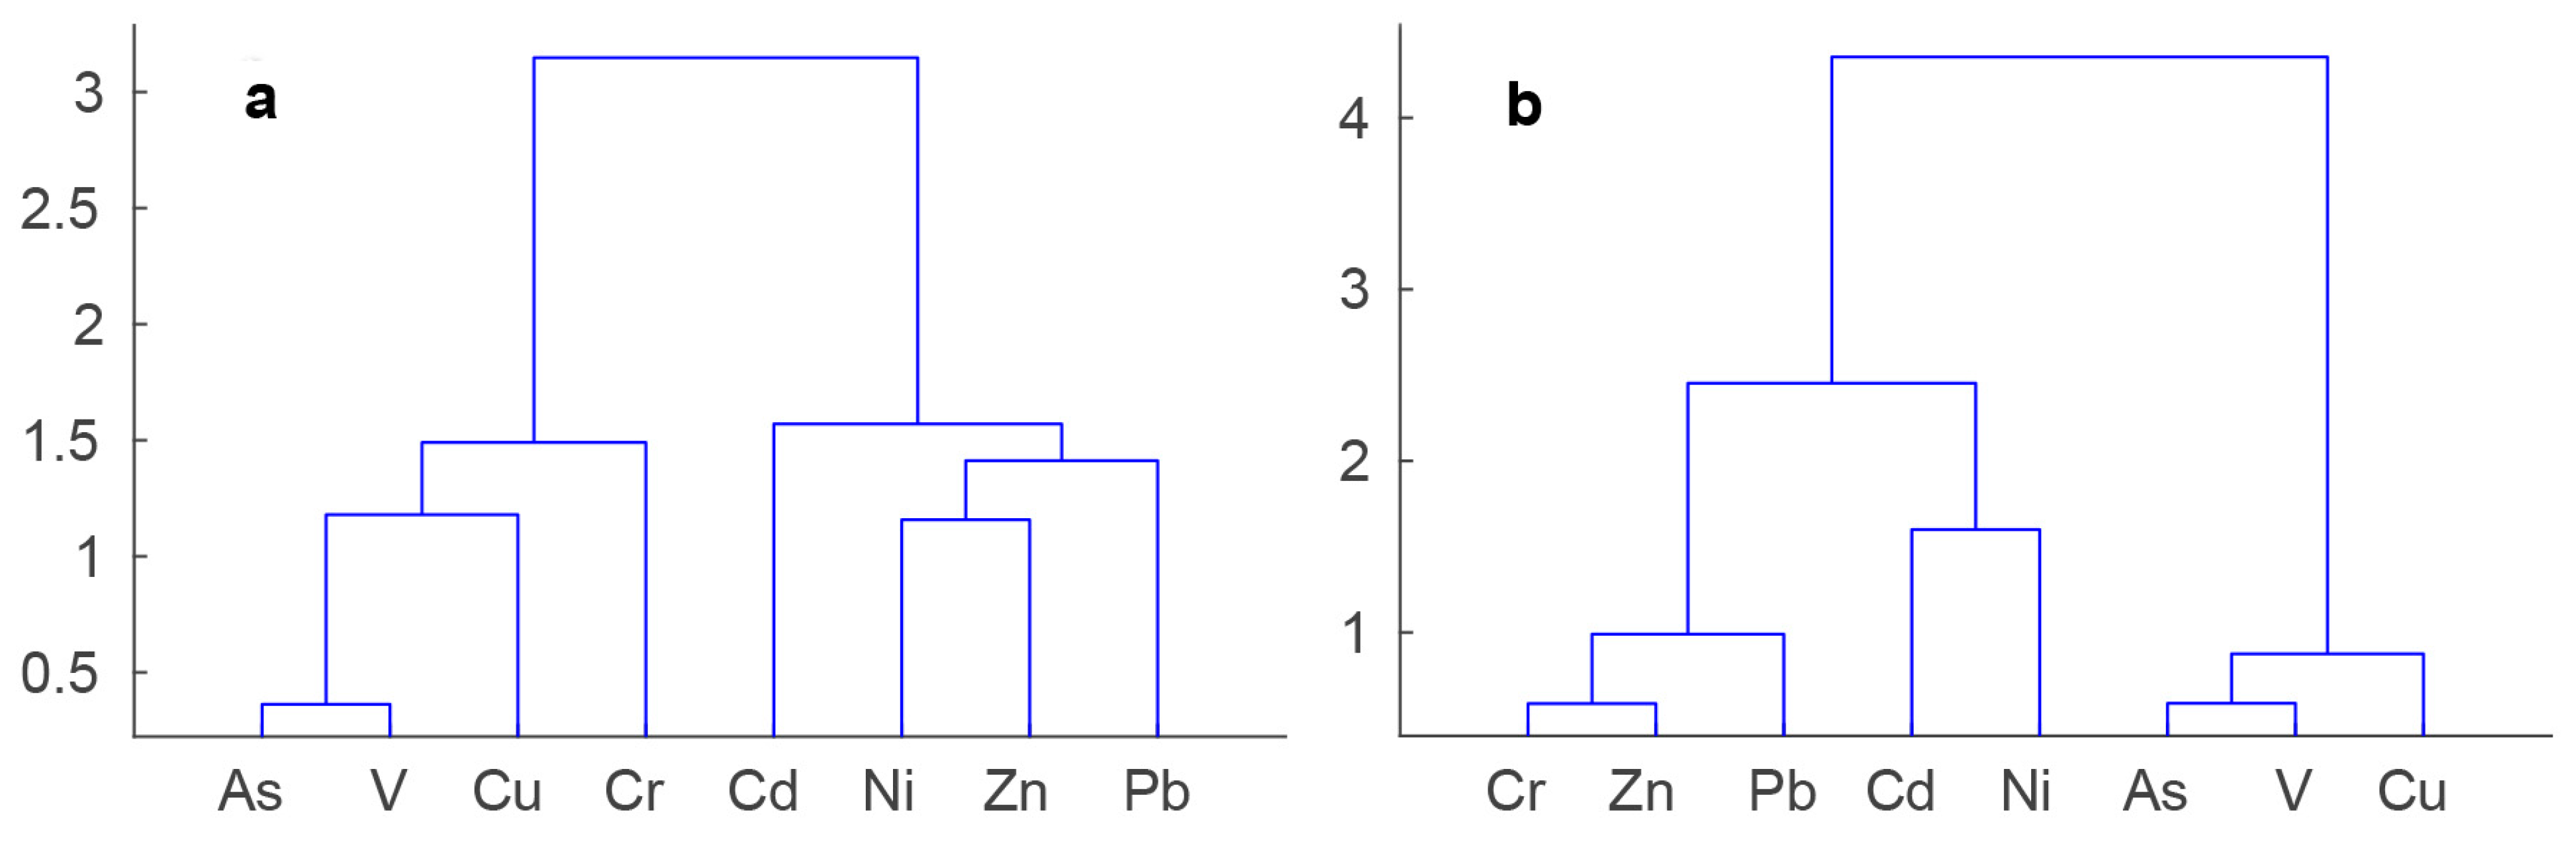
5.1. River Sediments
5.2. Seawater
5.3. Invertebrates
5.4. River Waters
6. Conclusions
Supplementary Materials
Author Contributions
Funding
Data Availability Statement
Acknowledgments
Conflicts of Interest
References
- Song, J.; Duan, L. The bohai sea. In World Seas: An Environmental Evaluation Volume II: The Indian Ocean to the Pacific; Elsevier: Amsterdam, The Netherlands, 2019; pp. 377–394. [Google Scholar]
- Gao, X.; Zhou, F.; Chen, C.-T.A. Pollution status of the Bohai Sea: An overview of the environmental quality assessment related trace metals. Environ. Int. 2014, 62, 12–30. [Google Scholar] [CrossRef]
- Zhan, S. The Bohai Sea’s Environment Has Deteriorated into a “Dead Sea”, with 2.8 Billion Tons of Sewage Entering the Sea Every Year; Pengpai News: Shanghai, China, 2015; Volume 2015. [Google Scholar]
- Liu, D.; Zhu, L. Assessing China’ s legislation on compensation for marine ecological damage: A case study of the Bohai oil spill. Mar. Policy 2014, 50, 18–26. [Google Scholar] [CrossRef]
- Gao, X.; Chen, C.-T.A. Heavy metal pollution status in surface sediments of the coastal Bohai Bay. Water Res. 2012, 46, 1901–1911. [Google Scholar] [CrossRef]
- Hu, B.; Li, J.; Zhao, J.; Yang, J.; Bai, F.; Dou, Y. Heavy metal in surface sediments of the Liaodong Bay, Bohai Sea: Distribution, contamination, and sources. Environ. Monit. Assess. 2013, 185, 5071–5083. [Google Scholar] [CrossRef]
- Li, Y.; Guo, L.; Feng, H. Status and trends of sediment metal pollution in Bohai Sea, China. Curr. Pollut. Rep. 2015, 1, 191–202. [Google Scholar] [CrossRef]
- Kuang, C.; Shan, Y.; Gu, J.; Shao, H.; Zhang, W.; Zhang, Y.; Zhang, J.; Liu, H. Assessment of heavy metal contamination in water body and riverbed sediments of the Yanghe River in the Bohai Sea, China. Environ. Earth Sci. 2016, 75, 1105. [Google Scholar] [CrossRef]
- Duan, X.; Li, Y. Distributions and sources of heavy metals in sediments of the Bohai Sea, China: A review. Environ. Sci. Pollut. Res. 2017, 24, 24753–24764. [Google Scholar] [CrossRef]
- Ding, X.; Ye, S.; Yuan, H.; Krauss, K.W. Spatial distribution and ecological risk assessment of heavy metals in coastal surface sediments in the Hebei Province offshore area, Bohai Sea, China. Mar. Pollut. Bull. 2018, 131, 655–661. [Google Scholar] [CrossRef]
- Han, X.; Wang, J.; Cai, W.; Xu, X.; Sun, M. The Pollution Status of Heavy Metals in the Surface Seawater and Sediments of the Tianjin Coastal Area, North China. Int. J. Environ. Res. Adn Public Health 2021, 18, 11243. [Google Scholar] [CrossRef]
- Zhang, D.; Pei, S.; Duan, G.; Feng, X.; Zhang, Y.; Wu, J. The pollution level, spatial and temporal distribution trend and risk assessment of heavy metals in Bohai Sea of China. J. Coast. Res. 2020, 115, 354–360. [Google Scholar] [CrossRef]
- Li, H.; Xu, L.; Feng, N.; Lu, A.; Chen, W.; Wang, Y. Occurrence, risk assessment, and source of heavy metals in Liaohe River Protected Area from the watershed of Bohai Sea, China. Mar. Pollut. Bull. 2021, 169, 112489. [Google Scholar] [CrossRef]
- Liang, X.; Tian, C.; Zong, Z.; Wang, X.; Jiang, W.; Chen, Y.; Ma, J.; Luo, Y.; Li, J.; Zhang, G. Flux and source-sink relationship of heavy metals and arsenic in the Bohai Sea, China. Environ. Pollut. 2018, 242, 1353–1361. [Google Scholar] [CrossRef] [PubMed]
- Guo, W.; Zou, J.; Liu, S.; Chen, X.; Kong, X.; Zhang, H.; Xu, T. Seasonal and spatial variation in dissolved heavy metals in Liaodong Bay, China. Int. J. Environ. Res. Public Health 2022, 19, 608. [Google Scholar] [CrossRef] [PubMed]
- Qin, Y.; Li, F. Study of influence of sediment loads discharged from the Huanghe River on sedimentation in the Bohai sea and the Huanghe sea. In Sedimentation on the Continental Shelf: With Special Reference to the East China Sea 2; China Ocean Press: Qingdao, China, 1983. [Google Scholar]
- Wang, J.; Chen, S.; Xia, T. Environmental risk assessment of heavy metals in Bohai Sea, North China. Procedia Environ. Sci. 2010, 2, 1632–1642. [Google Scholar] [CrossRef]
- Li, J.; Yang, S.; Li, R.; Shu, J.; Chen, X.; Meng, Y.; Ye, S.; He, L. Vegetation history and environment changes since MIS 5 recorded by pollen assemblages in sediments from the western Bohai Sea, Northern China. J. Asian Earth Sci. 2020, 187, 104085. [Google Scholar] [CrossRef]
- HJ/T 91-2002; Technical Specifications Requirements for Monitoring of Surface Water and Wastewater. Standards Press of China: Beijing, China, 2002.
- Carr, R.; Zhang, C.; Moles, N.; Harder, M. Identification and mapping of heavy metal pollution in soils of a sports ground in Galway City, Ireland, using a portable XRF analyser and GIS. Environ. Geochem. Health 2008, 30, 45–52. [Google Scholar] [CrossRef] [PubMed]
- Kalnicky, D.J.; Singhvi, R. Field portable XRF analysis of environmental samples. J. Hazard. Mater. 2001, 83, 93–122. [Google Scholar] [CrossRef]
- Radu, T.; Diamond, D. Comparison of soil pollution concentrations determined using AAS and portable XRF techniques. J. Hazard. Mater. 2009, 171, 1168–1171. [Google Scholar] [CrossRef]
- Akanchise, T.; Boakye, S.; Borquaye, L.S.; Dodd, M.; Darko, G. Distribution of heavy metals in soils from abandoned dump sites in Kumasi, Ghana. Sci. Afr. 2020, 10, e00614. [Google Scholar] [CrossRef]
- GB17378.3-2007; The Specification for Marine Monitoring Part 3: Sample Collection, Storage and Transportation. Standards Press of China: Beijing, China, 2007.
- Zhou, S.; Kang, R.; Ji, C.; Kaufmann, H. Heavy metal distribution, contamination and analysis of sources-Intertidal zones of Sandu Bay, Ningde, China. Mar. Pollut. Bull. 2018, 135, 1138–1144. [Google Scholar] [CrossRef]
- Müller, G. Schadstoffe in sedimenten-sedimente als schadstoffe. Mitteilungen Der Osterr. Geol. Ges. 1986, 79, 107–126. [Google Scholar]
- Din, Z.B. Use of aluminium to normalize heavy-metal data from estuarine and coastal sediments of Straits of Melaka. Mar. Pollut. Bull. 1992, 24, 484–491. [Google Scholar] [CrossRef]
- Hakanson, L. An ecological risk index for aquatic pollution control. A sedimentological approach. Water Res. 1980, 14, 975–1001. [Google Scholar] [CrossRef]
- Tomlinson, D.; Wilson, J.; Harris, C.; Jeffrey, D. Problems in the assessment of heavy-metal levels in estuaries and the formation of a pollution index. Helgoländer Meeresunters. 1980, 33, 566–575. [Google Scholar] [CrossRef]
- Chen, J.; Wei, F.; Zheng, C.; Wu, Y.; Adriano, D.C. Background concentrations of elements in soils of China. Water Air Soil Pollut. 1991, 57, 699–712. [Google Scholar] [CrossRef]
- CNEMC-1990; Background Values of Soil Elements in China. 1st ed. China Environmental Science Press: Beijing, China, 1990.
- US-EPA-905-B02-001-C; A Guidance Manual to Support the Assessment of Contaminated Sediments in Freshwater Ecosystems. US Environmental Protection Agency, Great Lakes National Program Office: Chicago, IL, USA, 2002; p. 232.
- GB 3097-1997; Sea Water Quality Standard. Standards Press of China: Beijing, China, 1997.
- US-EPA-822-Z-99-001; National Recommended Water Quality Criteria. Office of Water: Washington, DC, USA, 2004.
- EPA540-9-85-001; Hazard Evaluation, Standard Evaluation Procedure: Ecological Risk Assessment. Urban and Cook: Washington, DC, USA, 1986.
- GB 18421-2001; Marine Biological Quality. Standards Press of China: Beijing, China, 2001.
- Maimon, O.; Rokach, L. Data Mining and Knowledge Discovery Handbook; Springer: New York, NY, USA, 2005; Volume 2. [Google Scholar]
- Ward, J.H., Jr. Hierarchical grouping to optimize an objective function. J. Am. Stat. Assoc. 1963, 58, 236–244. [Google Scholar] [CrossRef]
- GB 11607-89; Water Quality Standard for Fishery. Standards Press of China: Beijing, China, 1989.
- Karthikeyan, P.; Marigoudar, S.R.; Mohan, D.; Sharma, K.V.; Murthy, M.R. Prescribing sea water quality criteria for arsenic, cadmium and lead through species sensitivity distribution. Ecotoxicol. Environ. Saf. 2021, 208, 111612. [Google Scholar] [CrossRef] [PubMed]
- Smith, C. Environmental Risk Limits for Vanadium in Water: A Proposal for Water Quality Standards in Accordance with the Water Framework Directive; Rijksinstituut voor Volksgezondheid en Milieu RIVM: Bilthoven, The Netherlands, 2012. [Google Scholar]
- Yakubov, M.; Milordov, D.; Yakubova, S.; Borisov, D.; Ivanov, V.; Sinyashin, K. Concentrations of vanadium and nickel and their ratio in heavy oil asphaltenes. Pet. Chem. 2016, 56, 16–20. [Google Scholar] [CrossRef]
- Hansen, J.P. Exhaust Gas Scrubber Installed Onboard MV Ficaria Seaways. Public Test Report; Project No. 1429; Danish Ministry of Environment, Environmental Protection Agency: Odense, Denmark, 2012. [Google Scholar]
- Kjølholt, J.; Aakre, S.; Jürgensen, C.; Lauridsen, J. Assessment of Possible Impacts of Scrubber Water Discharges on the Marine Environment; Project No. 1431; Danish Ministry of Environment, Environmental Protection Agency: Odense, Denmark, 2012; p. 91. [Google Scholar]
- He, C.; Wang, H. Container Throughput Forecasting of Tianjin-Hebei Port Group Based on Grey Combination Model. J. Math. 2021, 2021, 8877865. [Google Scholar] [CrossRef]
- Isakson, J.; Persson, T.; Lindgren, E.S. Identification and assessment of ship emissions and their effects in the harbour of Göteborg, Sweden. Atmos. Environ. 2001, 35, 3659–3666. [Google Scholar] [CrossRef]
- US-EPA-821-R-02-004; Development Document for Final Effluent Limitations Guidelines and Standards for the Iron and Steel Manufacturing Point Source Category. Office of Water: Washington, DC, USA, 2002.
- US-EPA-HQ-OW-2009-0819; Effluent Limitations Guidelines and Standards for the Steam Electric Power Generating Point Source Category. Office of Water: Washington, DC, USA, 2015.
- León, V.M.; Moreno-González, R.; Besada, V.; Martínez, F.; Ceruso, C.; García, V.; Schultze, F.; Campillo, J.A. Sea snail (Hexaplex trunculus) and sea cucumber (Holothuria polii) as potential sentinel species for organic pollutants and trace metals in coastal ecosystems. Mar. Pollut. Bull. 2021, 168, 112407. [Google Scholar] [CrossRef] [PubMed]
- McElroy, A.; Leitch, K.; Fay, A. A survey of in vivo benzo [α] pyrene metabolism in small benthic marine invertebrates. Mar. Environ. Res. 2000, 50, 33–38. [Google Scholar] [CrossRef] [PubMed]
- Su, C.; Lu, Y.; Johnson, A.C.; Shi, Y.; Zhang, M.; Zhang, Y.; Juergens, M.D.; Jin, X. Which metal represents the greatest risk to freshwater ecosystem in Bohai Region of China? Ecosyst. Health Sustain. 2017, 3, e01260. [Google Scholar] [CrossRef]
- Rodríguez-Lado, L.; Sun, G.; Berg, M.; Zhang, Q.; Xue, H.; Zheng, Q.; Johnson, C.A. Groundwater arsenic contamination throughout China. Science 2013, 341, 866–868. [Google Scholar] [CrossRef]
- Velusamy, S.; Roy, A.; Sundaram, S.; Kumar Mallick, T. A review on heavy metal ions and containing dyes removal through graphene oxide-based adsorption strategies for textile wastewater treatment. Chem. Rec. 2021, 21, 1570–1610. [Google Scholar] [CrossRef]
- Chen, L.; Ni, W.; Li, X.; Sun, J.B. Investigation of heavy metal concentrations in commercial fertilizers commonly used. J. Zhejiang Sci.-Tech. Univ. 2009, 26-02, 223–227. [Google Scholar]
- Gao, Y.; Luan, H.; Chen, F. Determination and analysis of heavy metal content in commonly used fertilizer products of China. Sci. Technol. Innov. 2017, 1, 124. [Google Scholar]
- Wang, W.; Cao, S.; Li, G.; Zhang, Y. Analysis and evaluation of heavy metal elements in common fertilizers and their effects on soil environment. Tianjin Agric. Sci. 2017, 23, 19–22. [Google Scholar]
- Ye, X.; Chen, D.; Xiao, W.; Zhang, Q.; Zhao, S. The distribution characteristics and risk analysis of heavy metal in pesticides. Chin. J. Pestic. Sci. 2022, 25, 227–236. [Google Scholar]
- Valentukeviciene, M.; Andriulaityte, I.; Chadysas, V. Assessment of Residual Chlorine Interaction with Different Microelements in Stormwater Sediments. Molecules 2023, 28, 5358. [Google Scholar] [CrossRef]
| Elements | As | Cu | Ni | Pb | Zn | Cd | Cr | V |
|---|---|---|---|---|---|---|---|---|
| LOD of a typical soil matrix (ppm) | 7 | 13 | 30 | 12 | 10 | 12 | 22 | 25 |
| Indices | Descriptions | Equations | References |
|---|---|---|---|
| Geo-accumulation index (Igeo) | Uses the relation of measured values to defined background values to rank the intensity of HM pollution into seven classes. | Igeo = log2 (Cn/1.5 Bn) where Cn = measured HM concentration; Bn = geo-chemical background. | [26] |
| Metal enrichment factor (EF) | Normalizing the observed elements and their background values based on an aluminum (Al) standard, followed by a ratio procedure to determine whether the pollution is of natural origin or manmade. | Values between 0.5 and 1.5 refer to natural sources, and those above 1.5 to human activities. | [27] |
| Contamination factor (CF) | Ratioing the concentration of each metal in the sediment samples by its background value, without normalization. This is a monitoring index of HM enrichment in the sediments over a period of time. | Results are scaled into four classes. | [28] |
| Pollution load index (PLI) | Defined as the nth root of the multiplications of the CF of metals, providing an evaluation of the overall toxicity status of the corresponding sample. | Values of 1 indicate a baseline level of pollution; those above 1 indicate progressive deterioration. | [29] |
| As | Cd | Cr | Cu | Ni | Pb | Zn | Al | |
|---|---|---|---|---|---|---|---|---|
| CNEMC 1 | 7.3 | 0.071 | 44.0 | 24.4 | 23.1 | 47.5 | 86.1 | 97,100 |
| Entisols 2 | 9.4 | 0.09 | 63.0 | 22.2 | 28.9 | 21.4 | 69.7 | -- |
| Element | As | Cd | Cr | Cu | Ni | Pb | V | Zn |
|---|---|---|---|---|---|---|---|---|
| CNKI 2010–2016 | 5 | 0.1 | 8 | 7 | 10 | 1 | -- | 50 |
| This study (2019) | 6.4 | 0.06 | 3.3 | 4.9 | 9.1 | 0.3 | 3.7 | 29 |
| Chemical Substance | Zn | Pb | Cr | As | |
|---|---|---|---|---|---|
| Pesticides | Herbicide | 839.5 | 250.5 | 2.2 | 3.6 |
| Aphids | 753.0 | 11.6 | 23.3 | 6.0 | |
| Urea | 3.9 | 7.5 | 3.4 | 0 | |
| Fertilizers | Organic | 10.08 | 28.3 | 38.6 | 18.5 |
| Diam.-hydrogen | 29.69 | 15.8 | 33.2 | 22.7 | |
Disclaimer/Publisher’s Note: The statements, opinions and data contained in all publications are solely those of the individual author(s) and contributor(s) and not of MDPI and/or the editor(s). MDPI and/or the editor(s) disclaim responsibility for any injury to people or property resulting from any ideas, methods, instructions or products referred to in the content. |
© 2024 by the authors. Licensee MDPI, Basel, Switzerland. This article is an open access article distributed under the terms and conditions of the Creative Commons Attribution (CC BY) license (https://creativecommons.org/licenses/by/4.0/).
Share and Cite
Kang, R.; Zhou, S.; Chen, T.; Yin, H.; Si, L.; Deng, C.; Kaufmann, H. Extent and Sources of Heavy Metal Pollution from Discharging Rivers in the Bohai Region, China. Water 2024, 16, 982. https://doi.org/10.3390/w16070982
Kang R, Zhou S, Chen T, Yin H, Si L, Deng C, Kaufmann H. Extent and Sources of Heavy Metal Pollution from Discharging Rivers in the Bohai Region, China. Water. 2024; 16(7):982. https://doi.org/10.3390/w16070982
Chicago/Turabian StyleKang, Ran, Shanyu Zhou, Tingting Chen, Huiying Yin, Lulu Si, Caiyun Deng, and Hermann Kaufmann. 2024. "Extent and Sources of Heavy Metal Pollution from Discharging Rivers in the Bohai Region, China" Water 16, no. 7: 982. https://doi.org/10.3390/w16070982
APA StyleKang, R., Zhou, S., Chen, T., Yin, H., Si, L., Deng, C., & Kaufmann, H. (2024). Extent and Sources of Heavy Metal Pollution from Discharging Rivers in the Bohai Region, China. Water, 16(7), 982. https://doi.org/10.3390/w16070982