
Socio-Economic Indicators for Water Management in the South-West Europe Territory: Sectorial Water Productivity and Intensity in Employment

 , ,
, ,  ,
,  , and
, and 
Abstract
1. Introduction
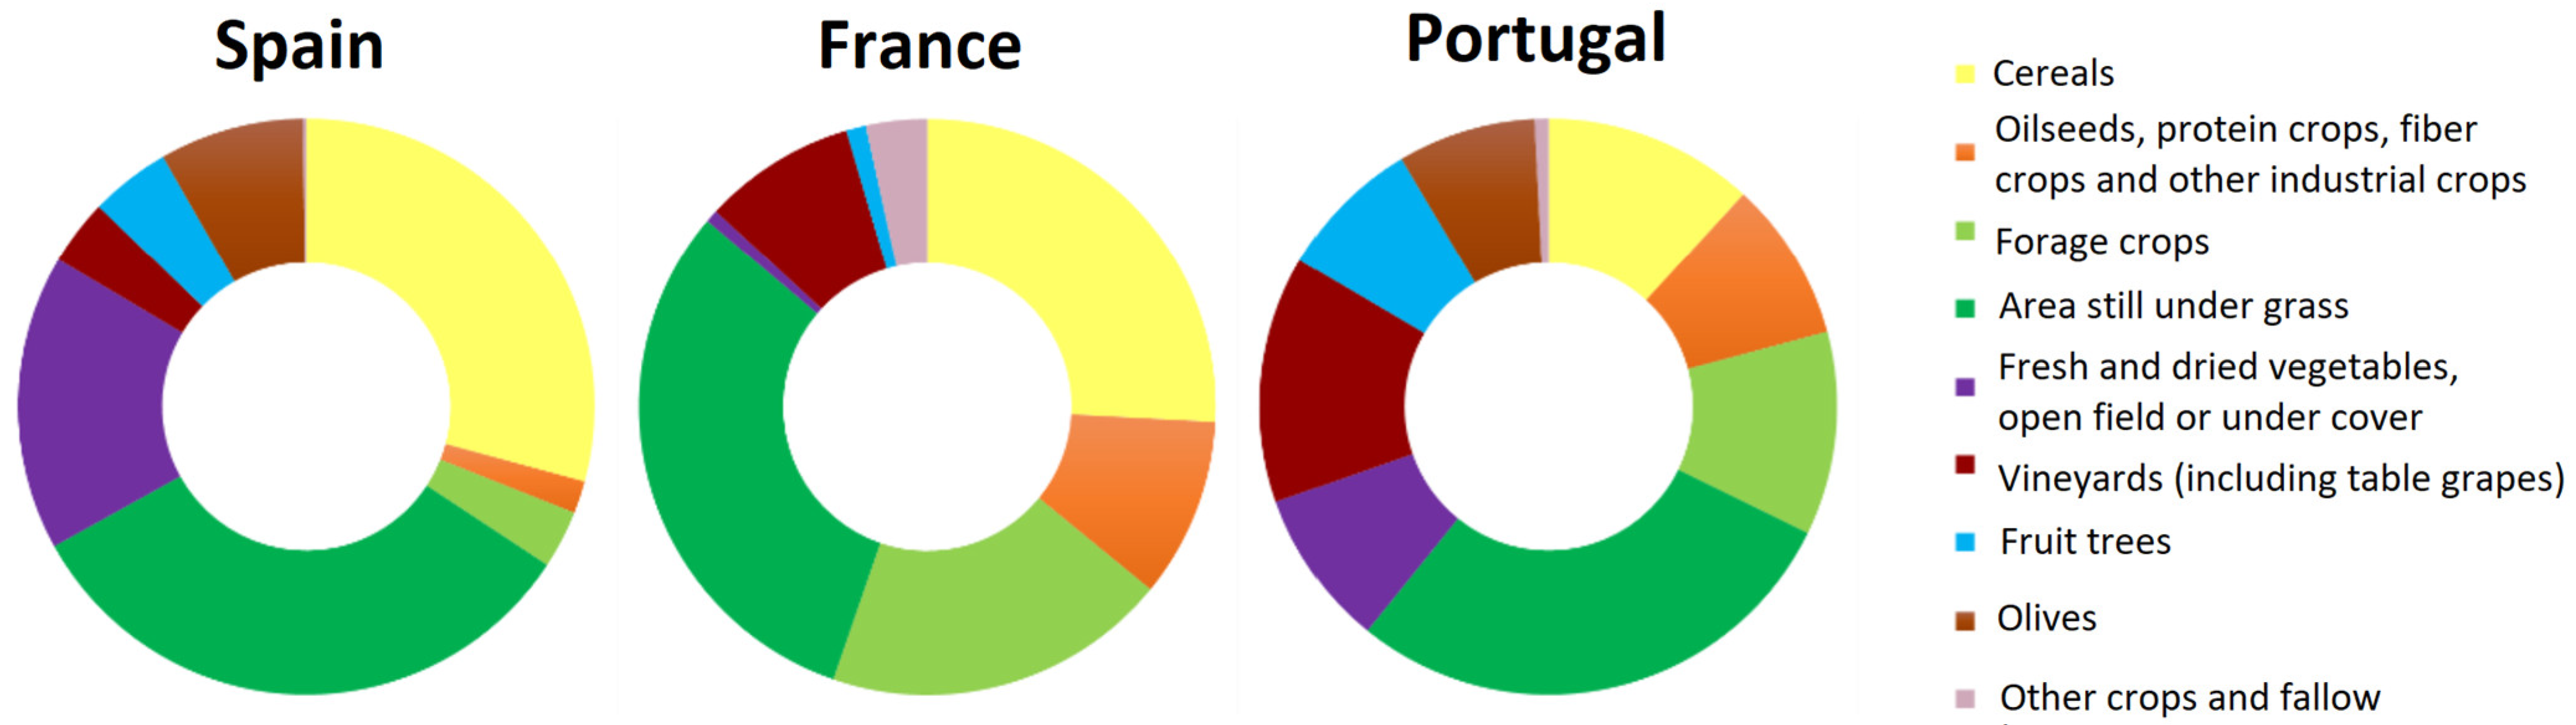
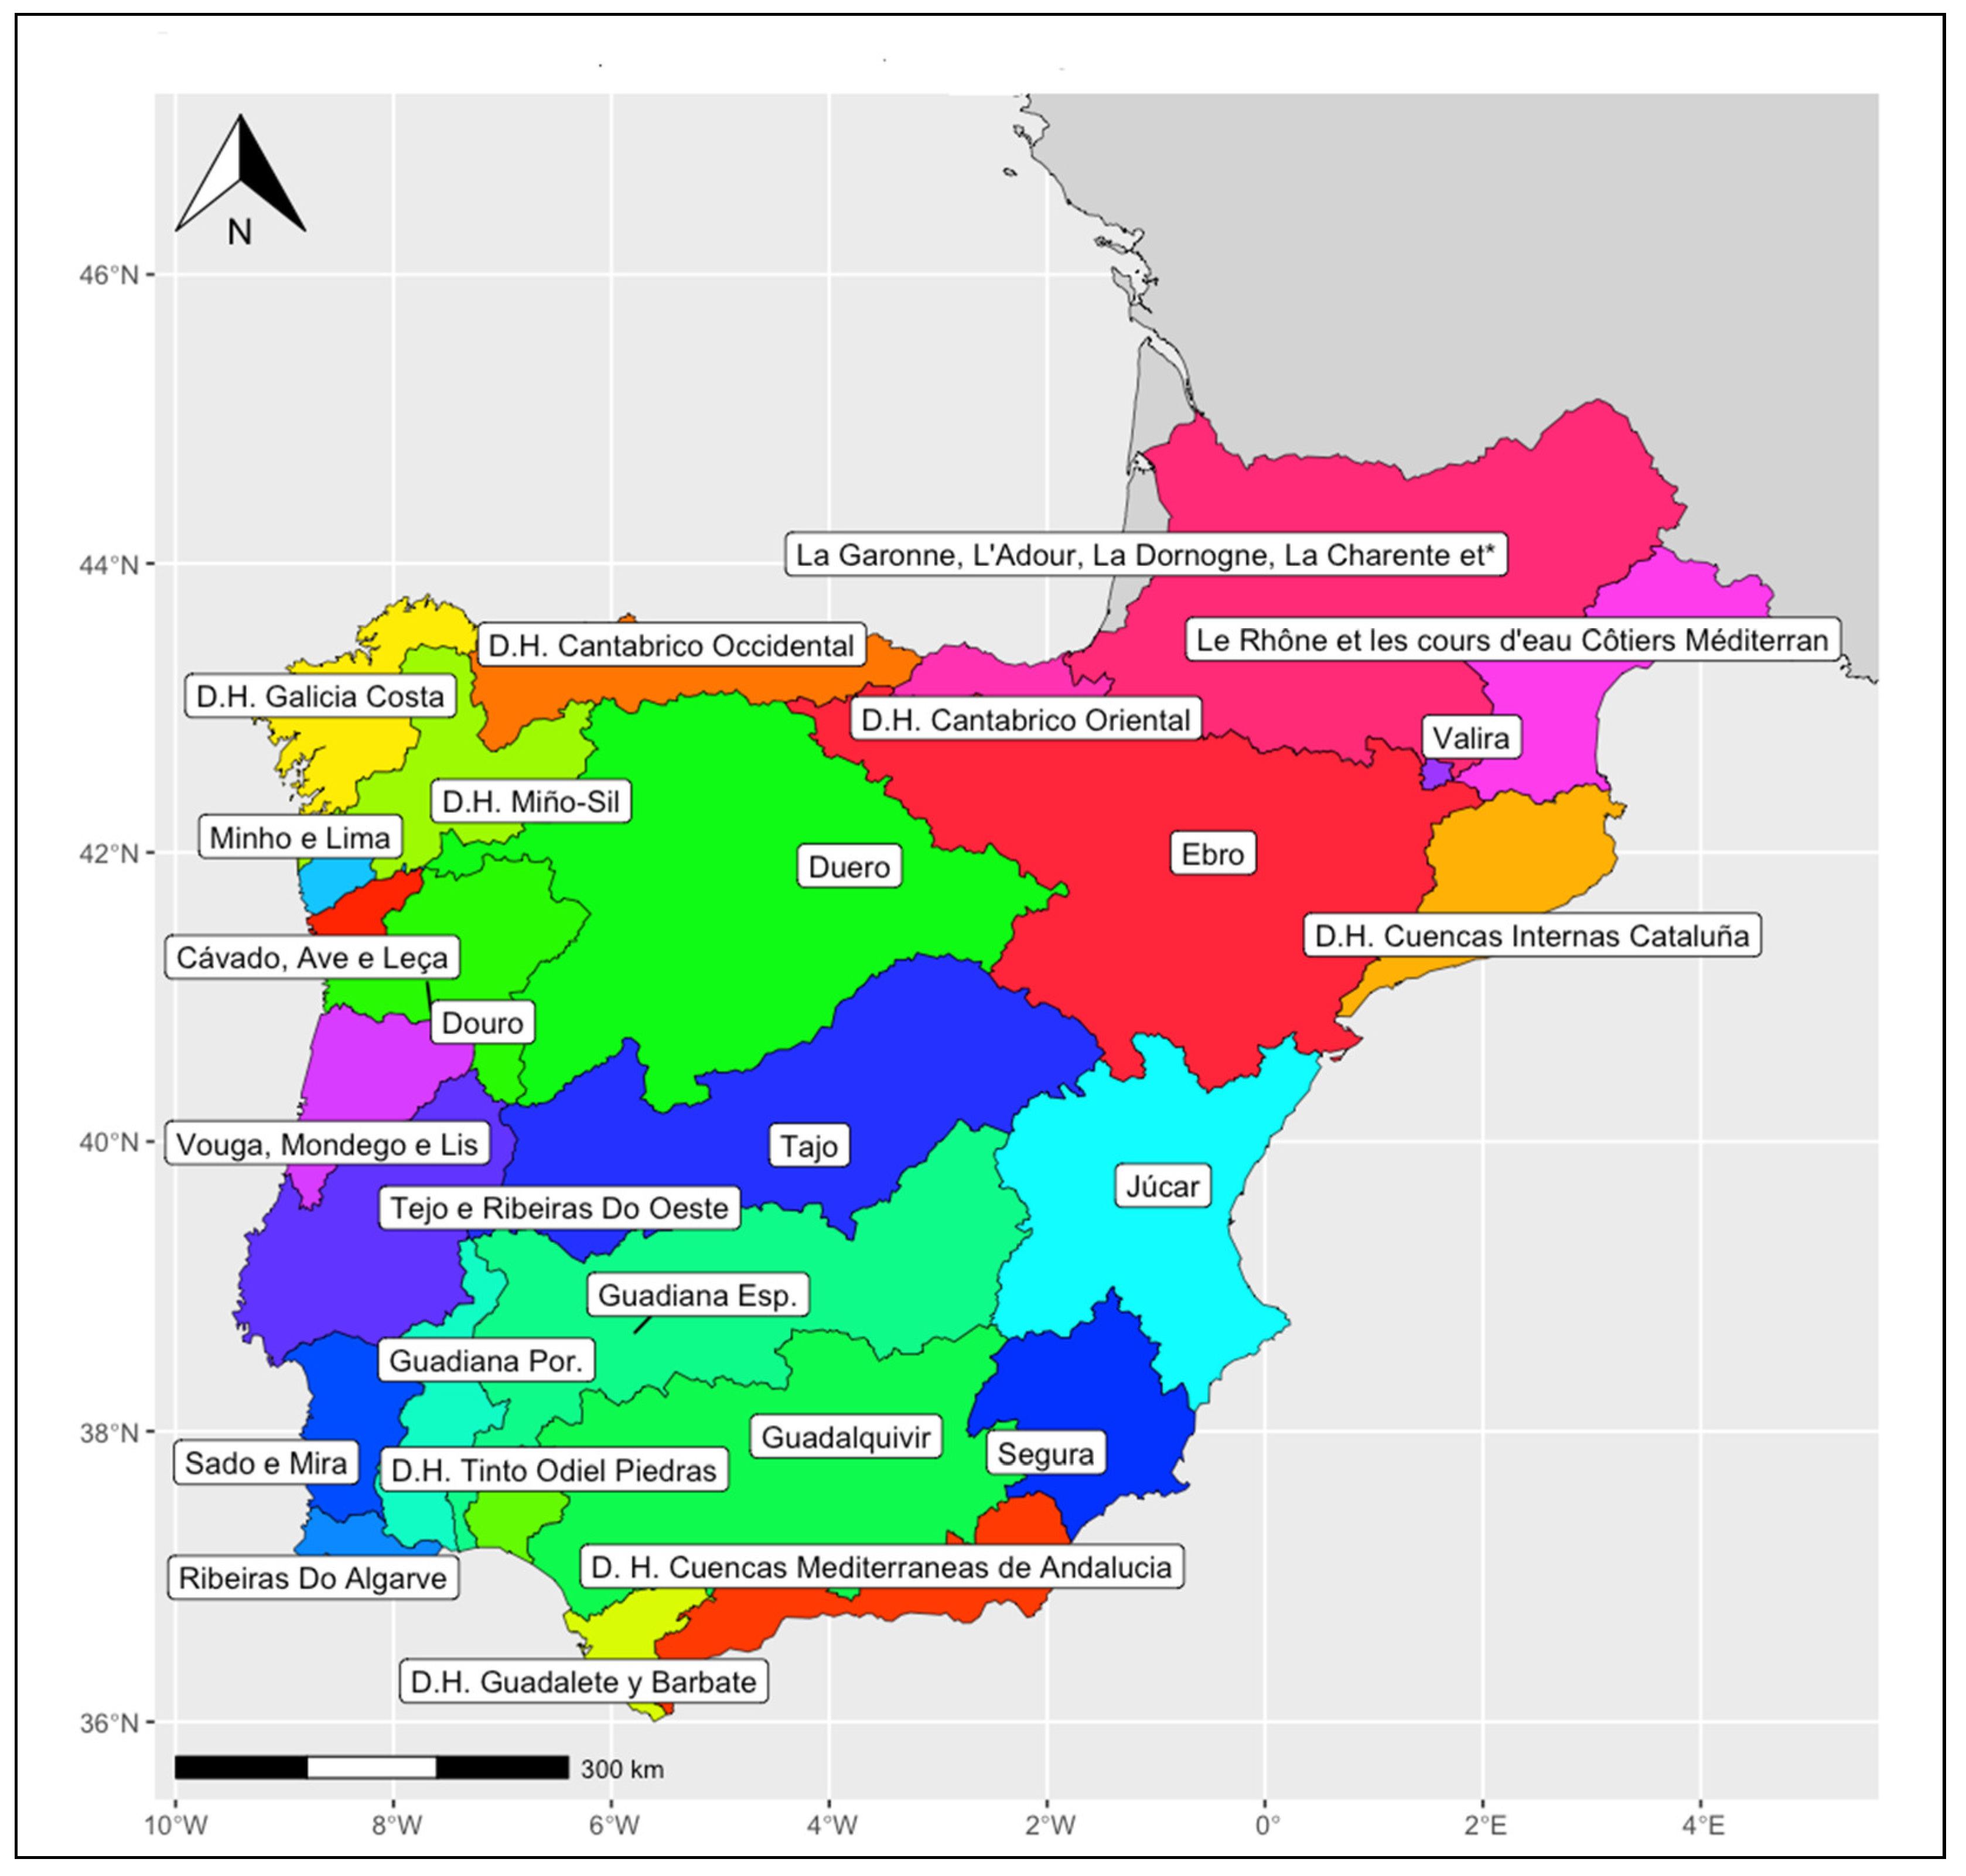
2. Study Site
3. Methodology
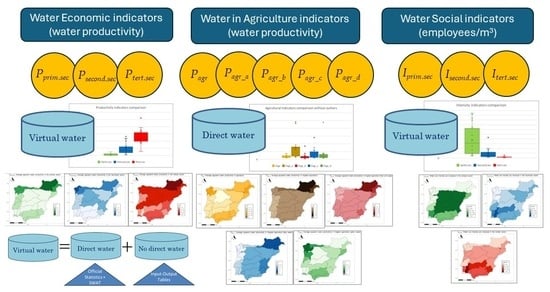
3.1. Set of Indicators
3.1.1. Average Apparent Water Productivity by Sector
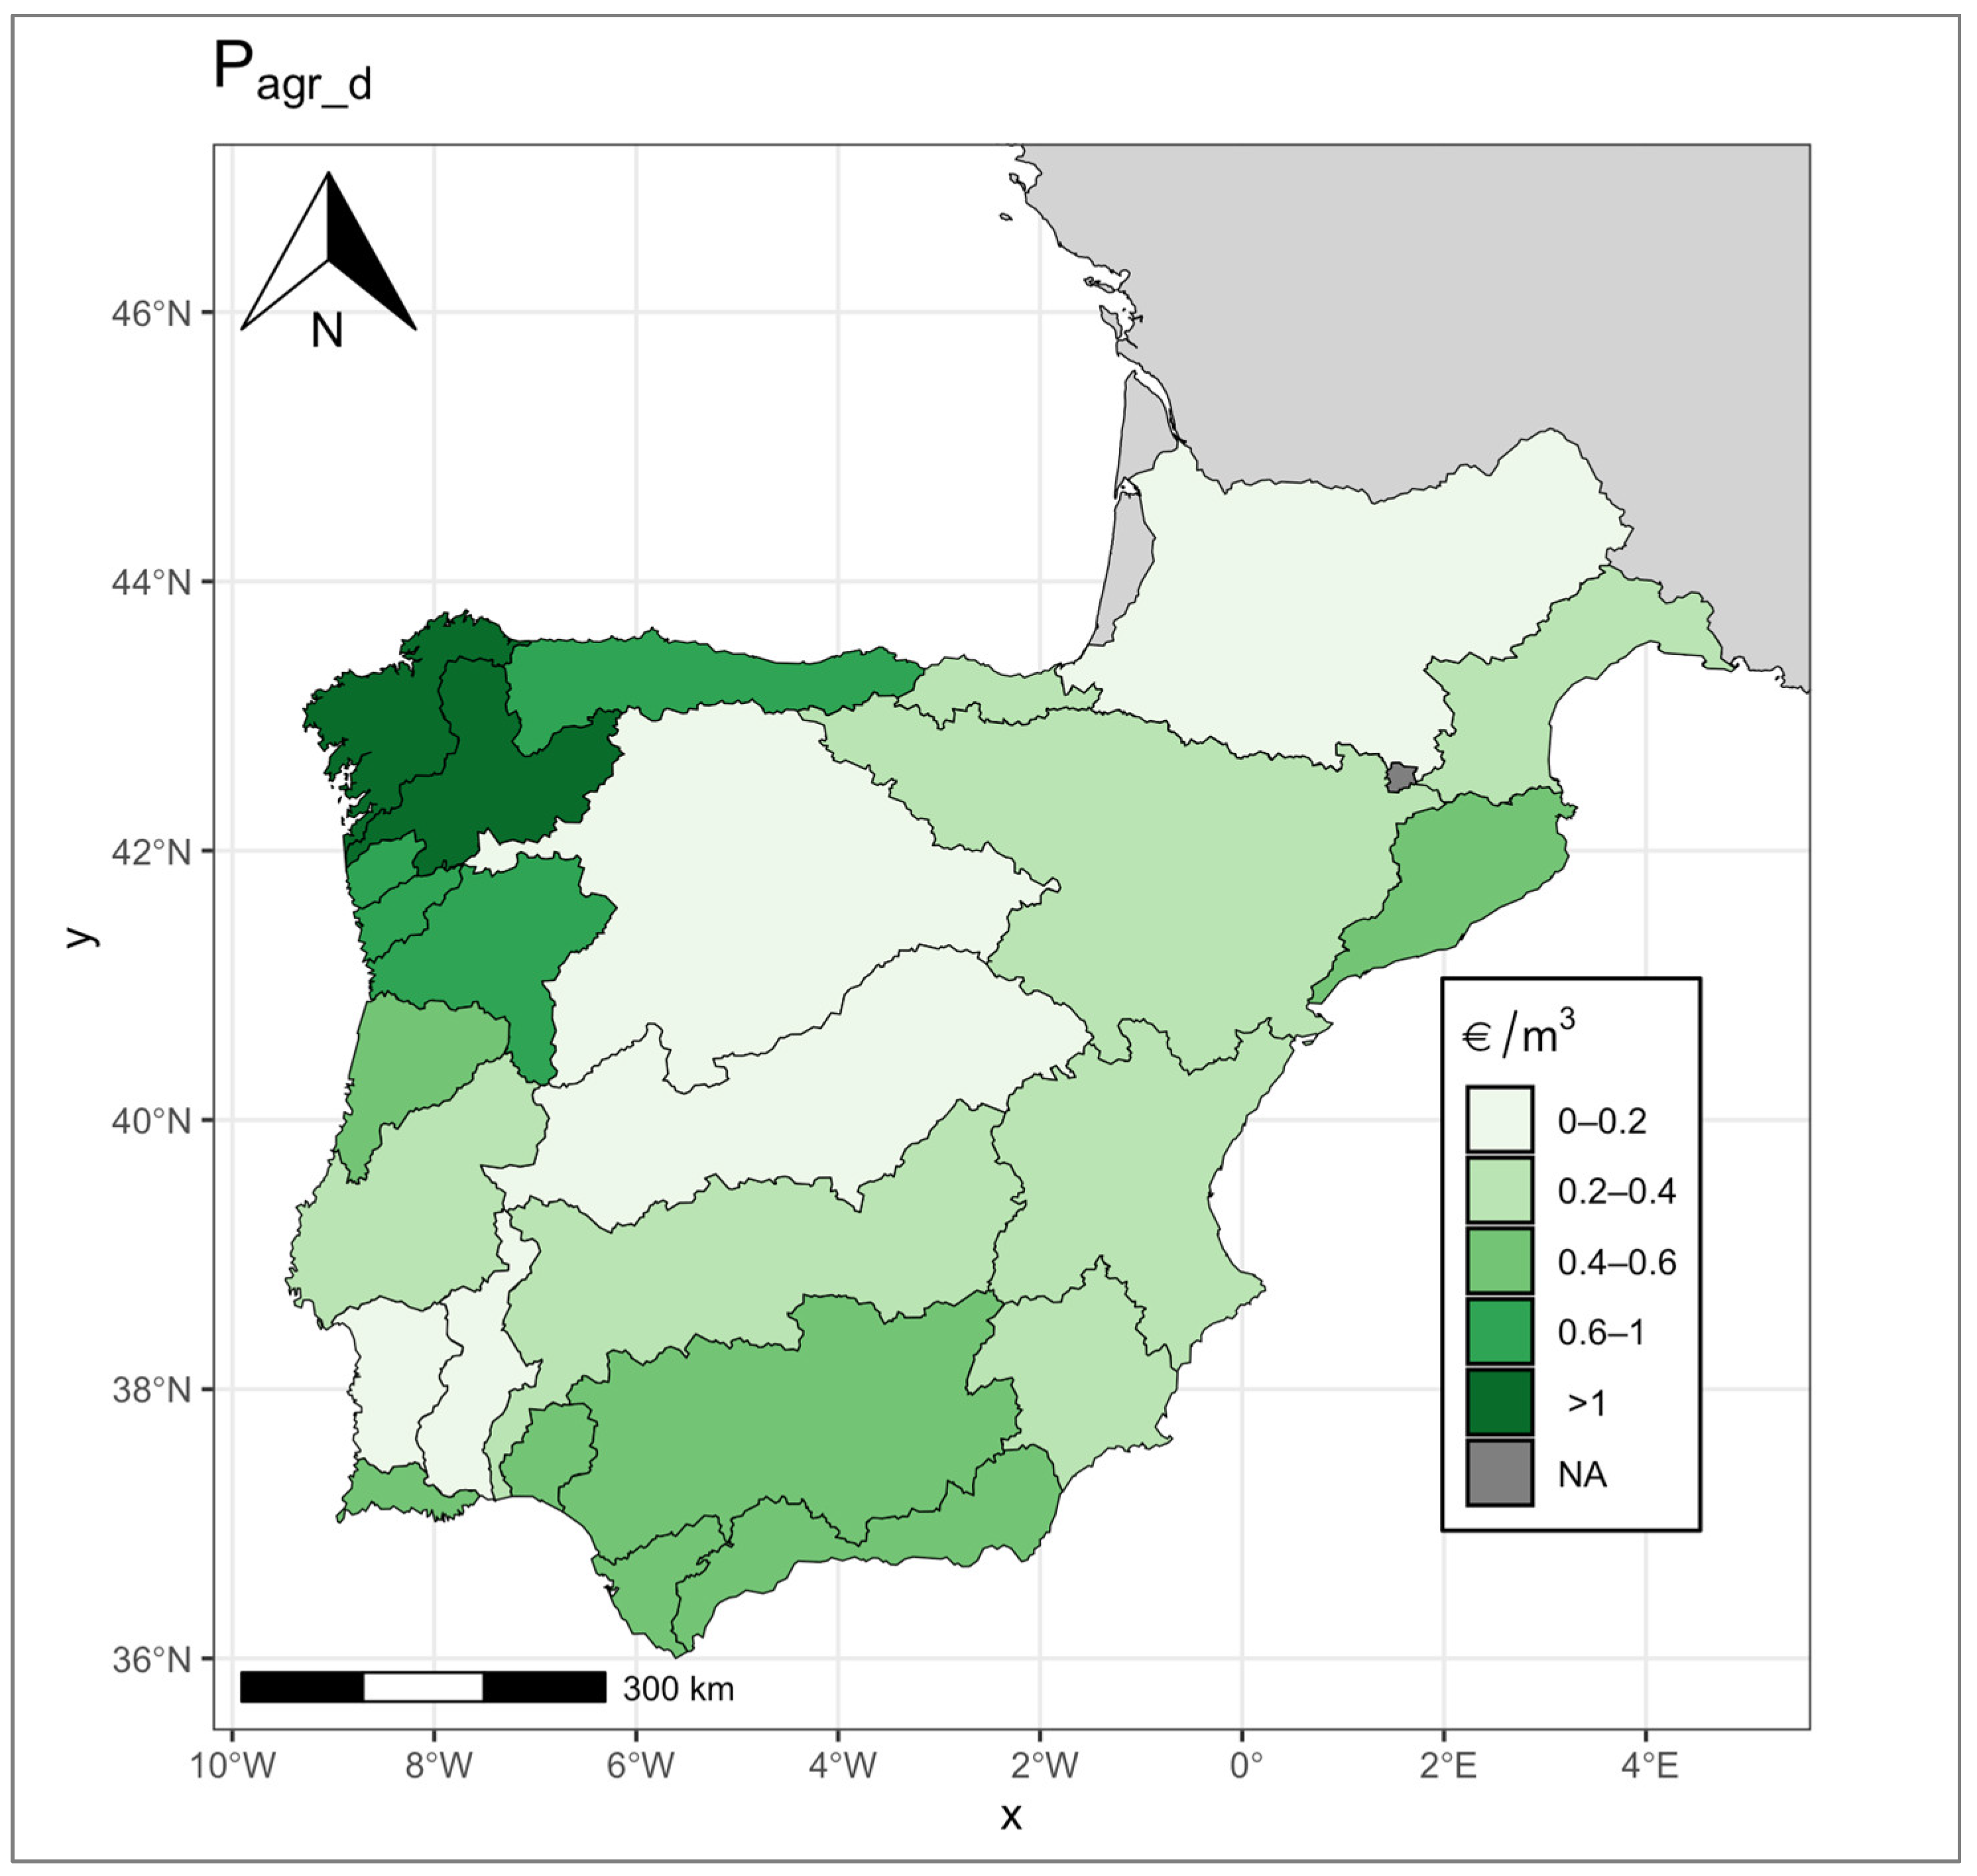
3.1.2. Water Productivity in Agriculture
Average Apparent Water Productivity in Total Agriculture
Average Apparent Productivity of Irrigation Water in Total Agriculture
Average Apparent Water Productivity in Irrigated Agriculture
Average Apparent Productivity of Irrigation Water in Irrigated Agriculture
Average Apparent Rainfall Water Productivity in Rainfed Agriculture
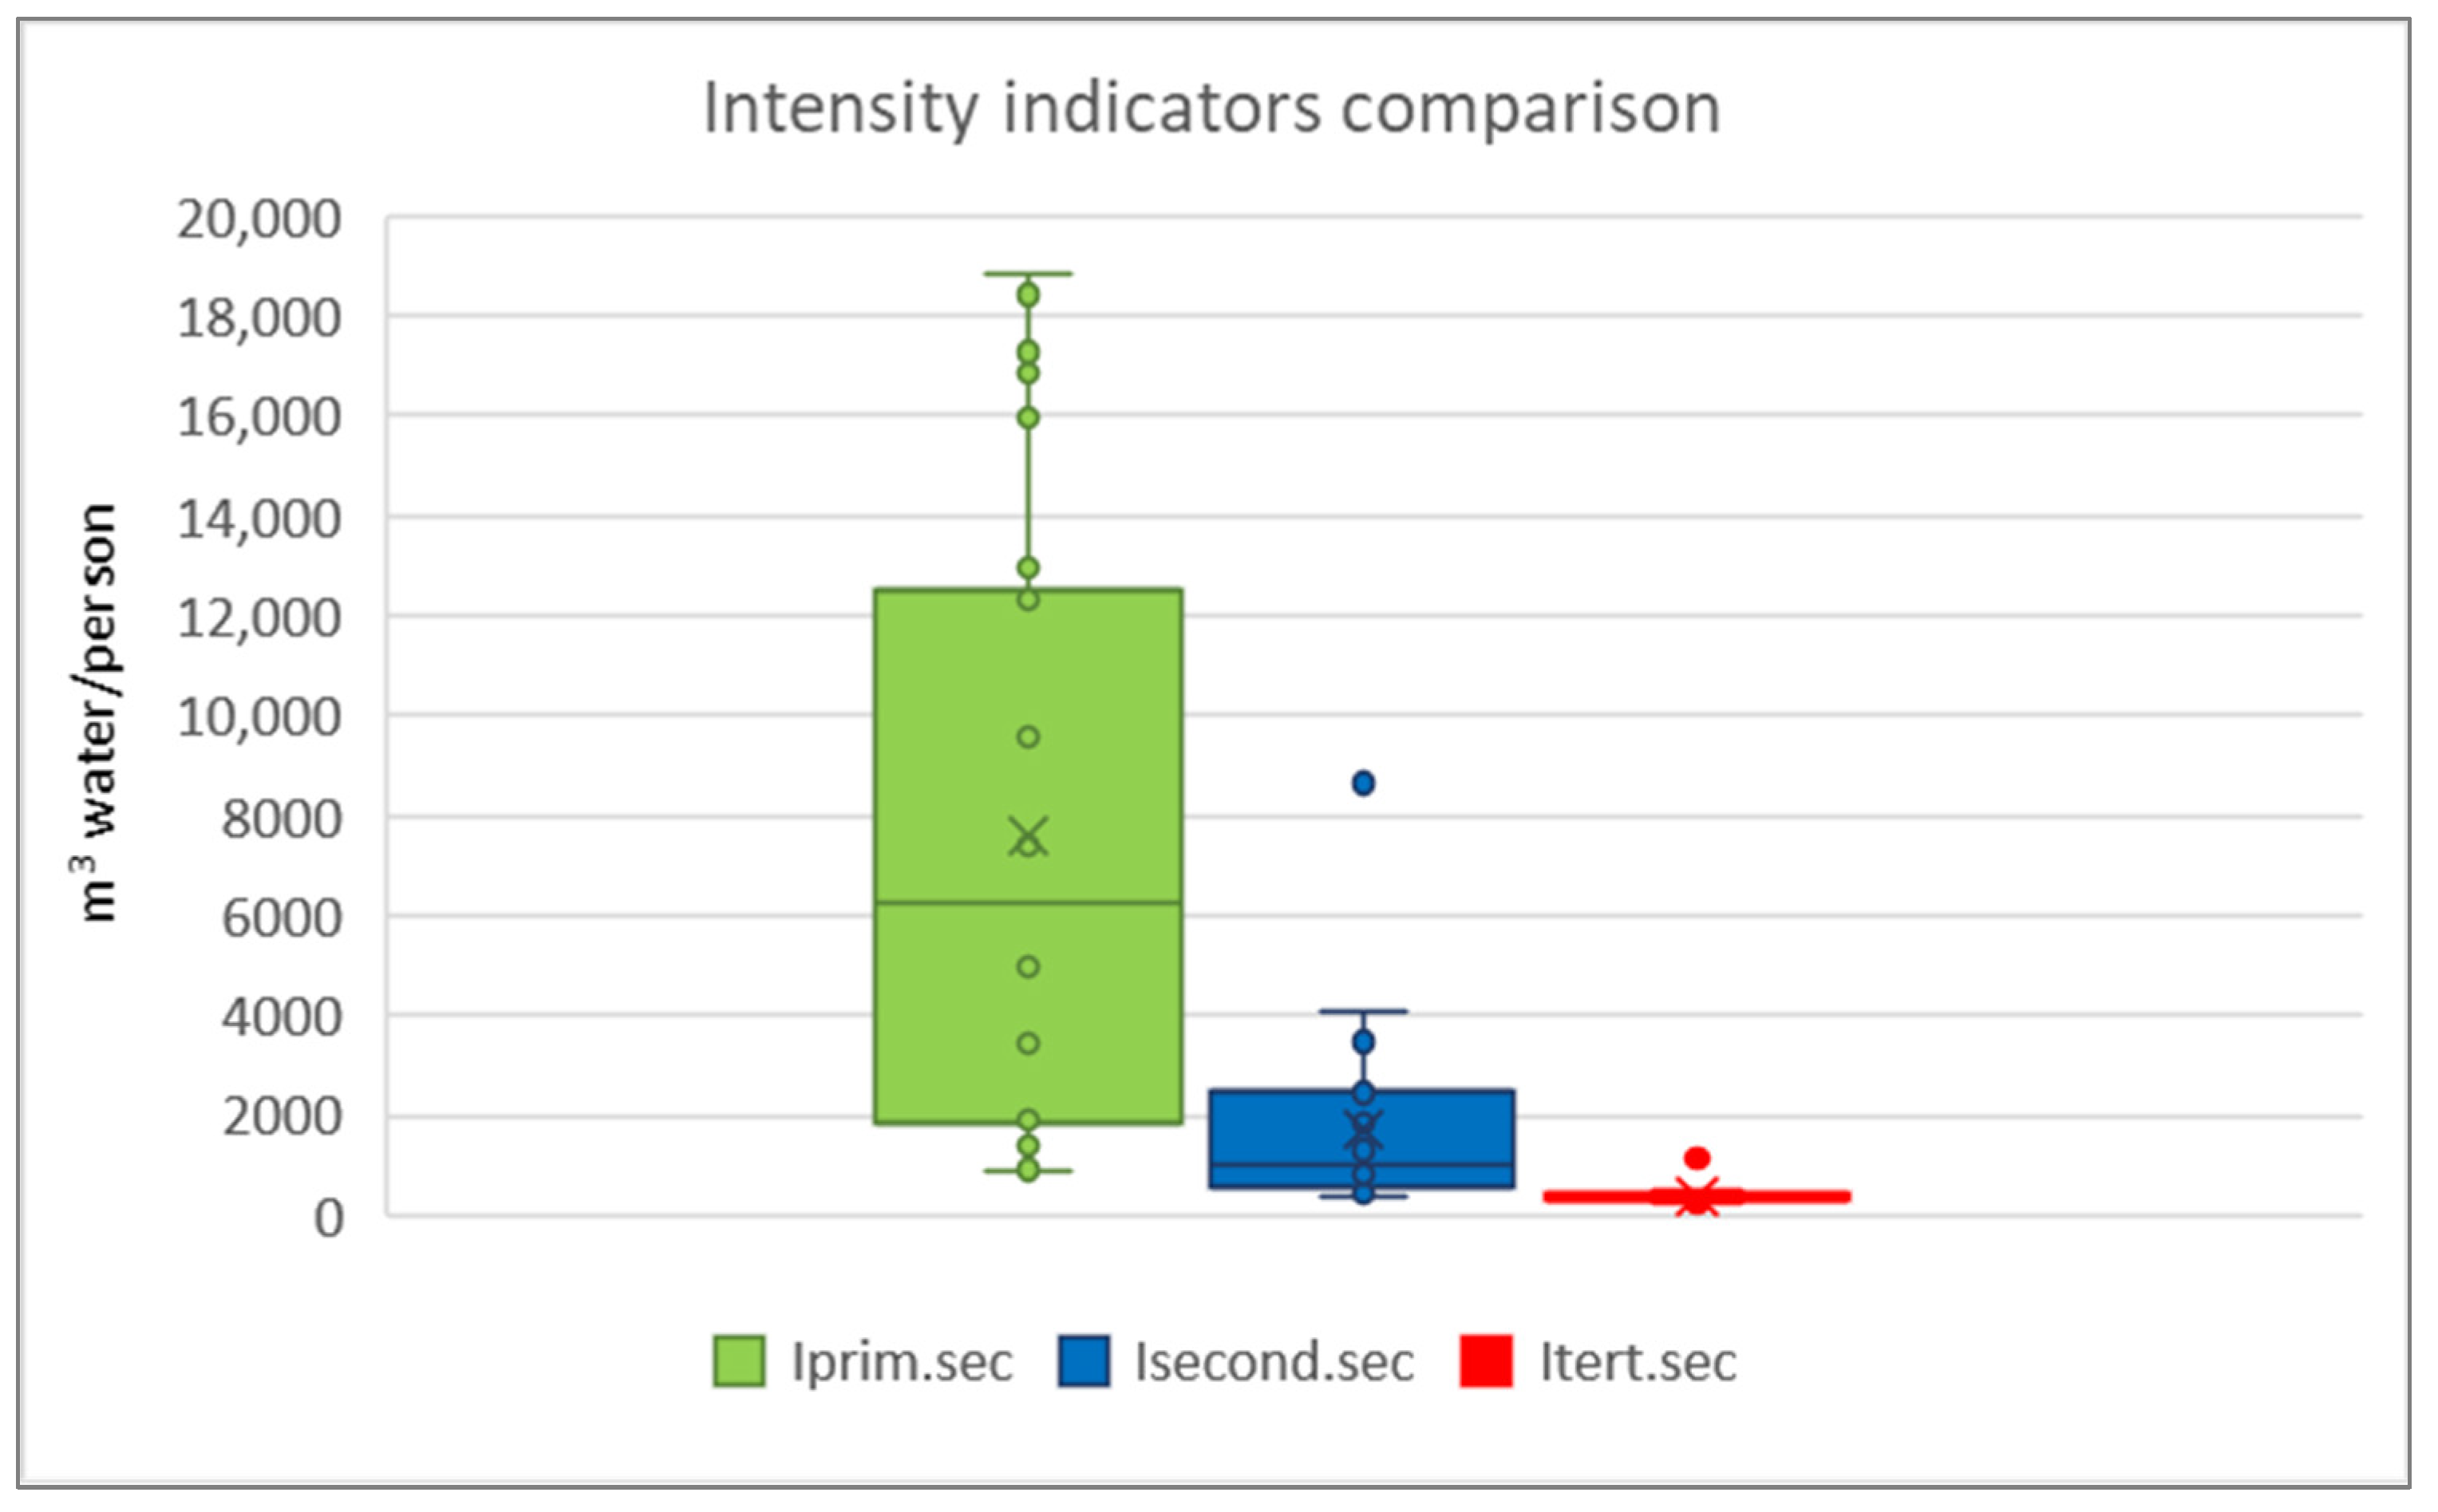
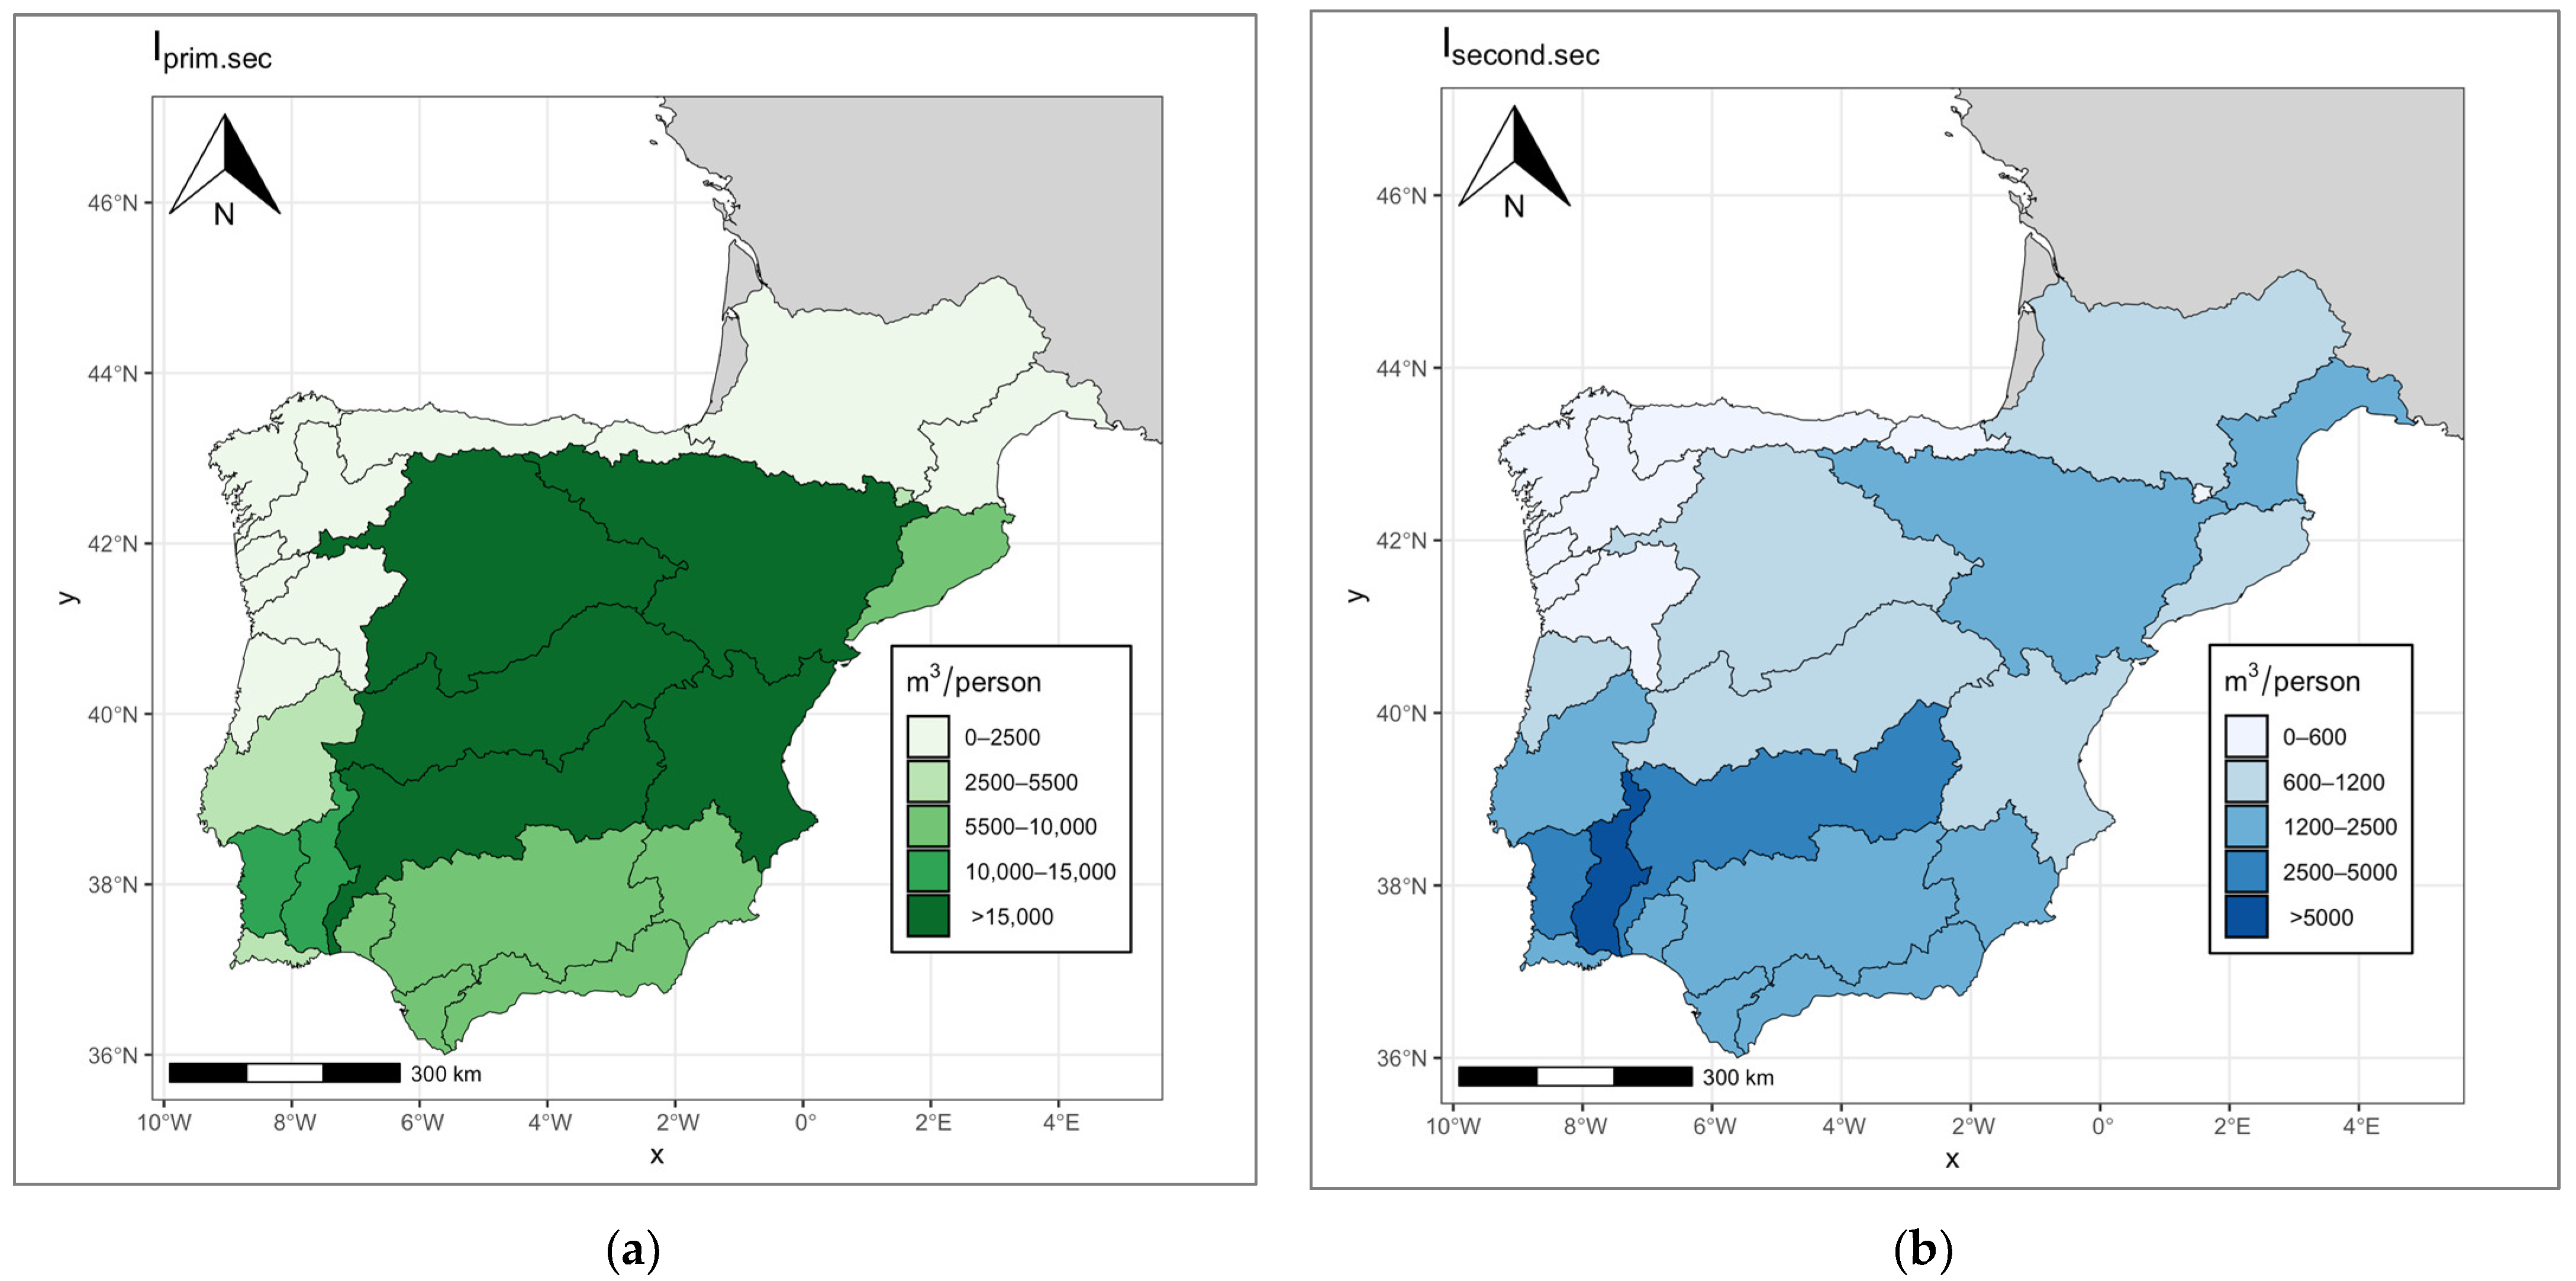
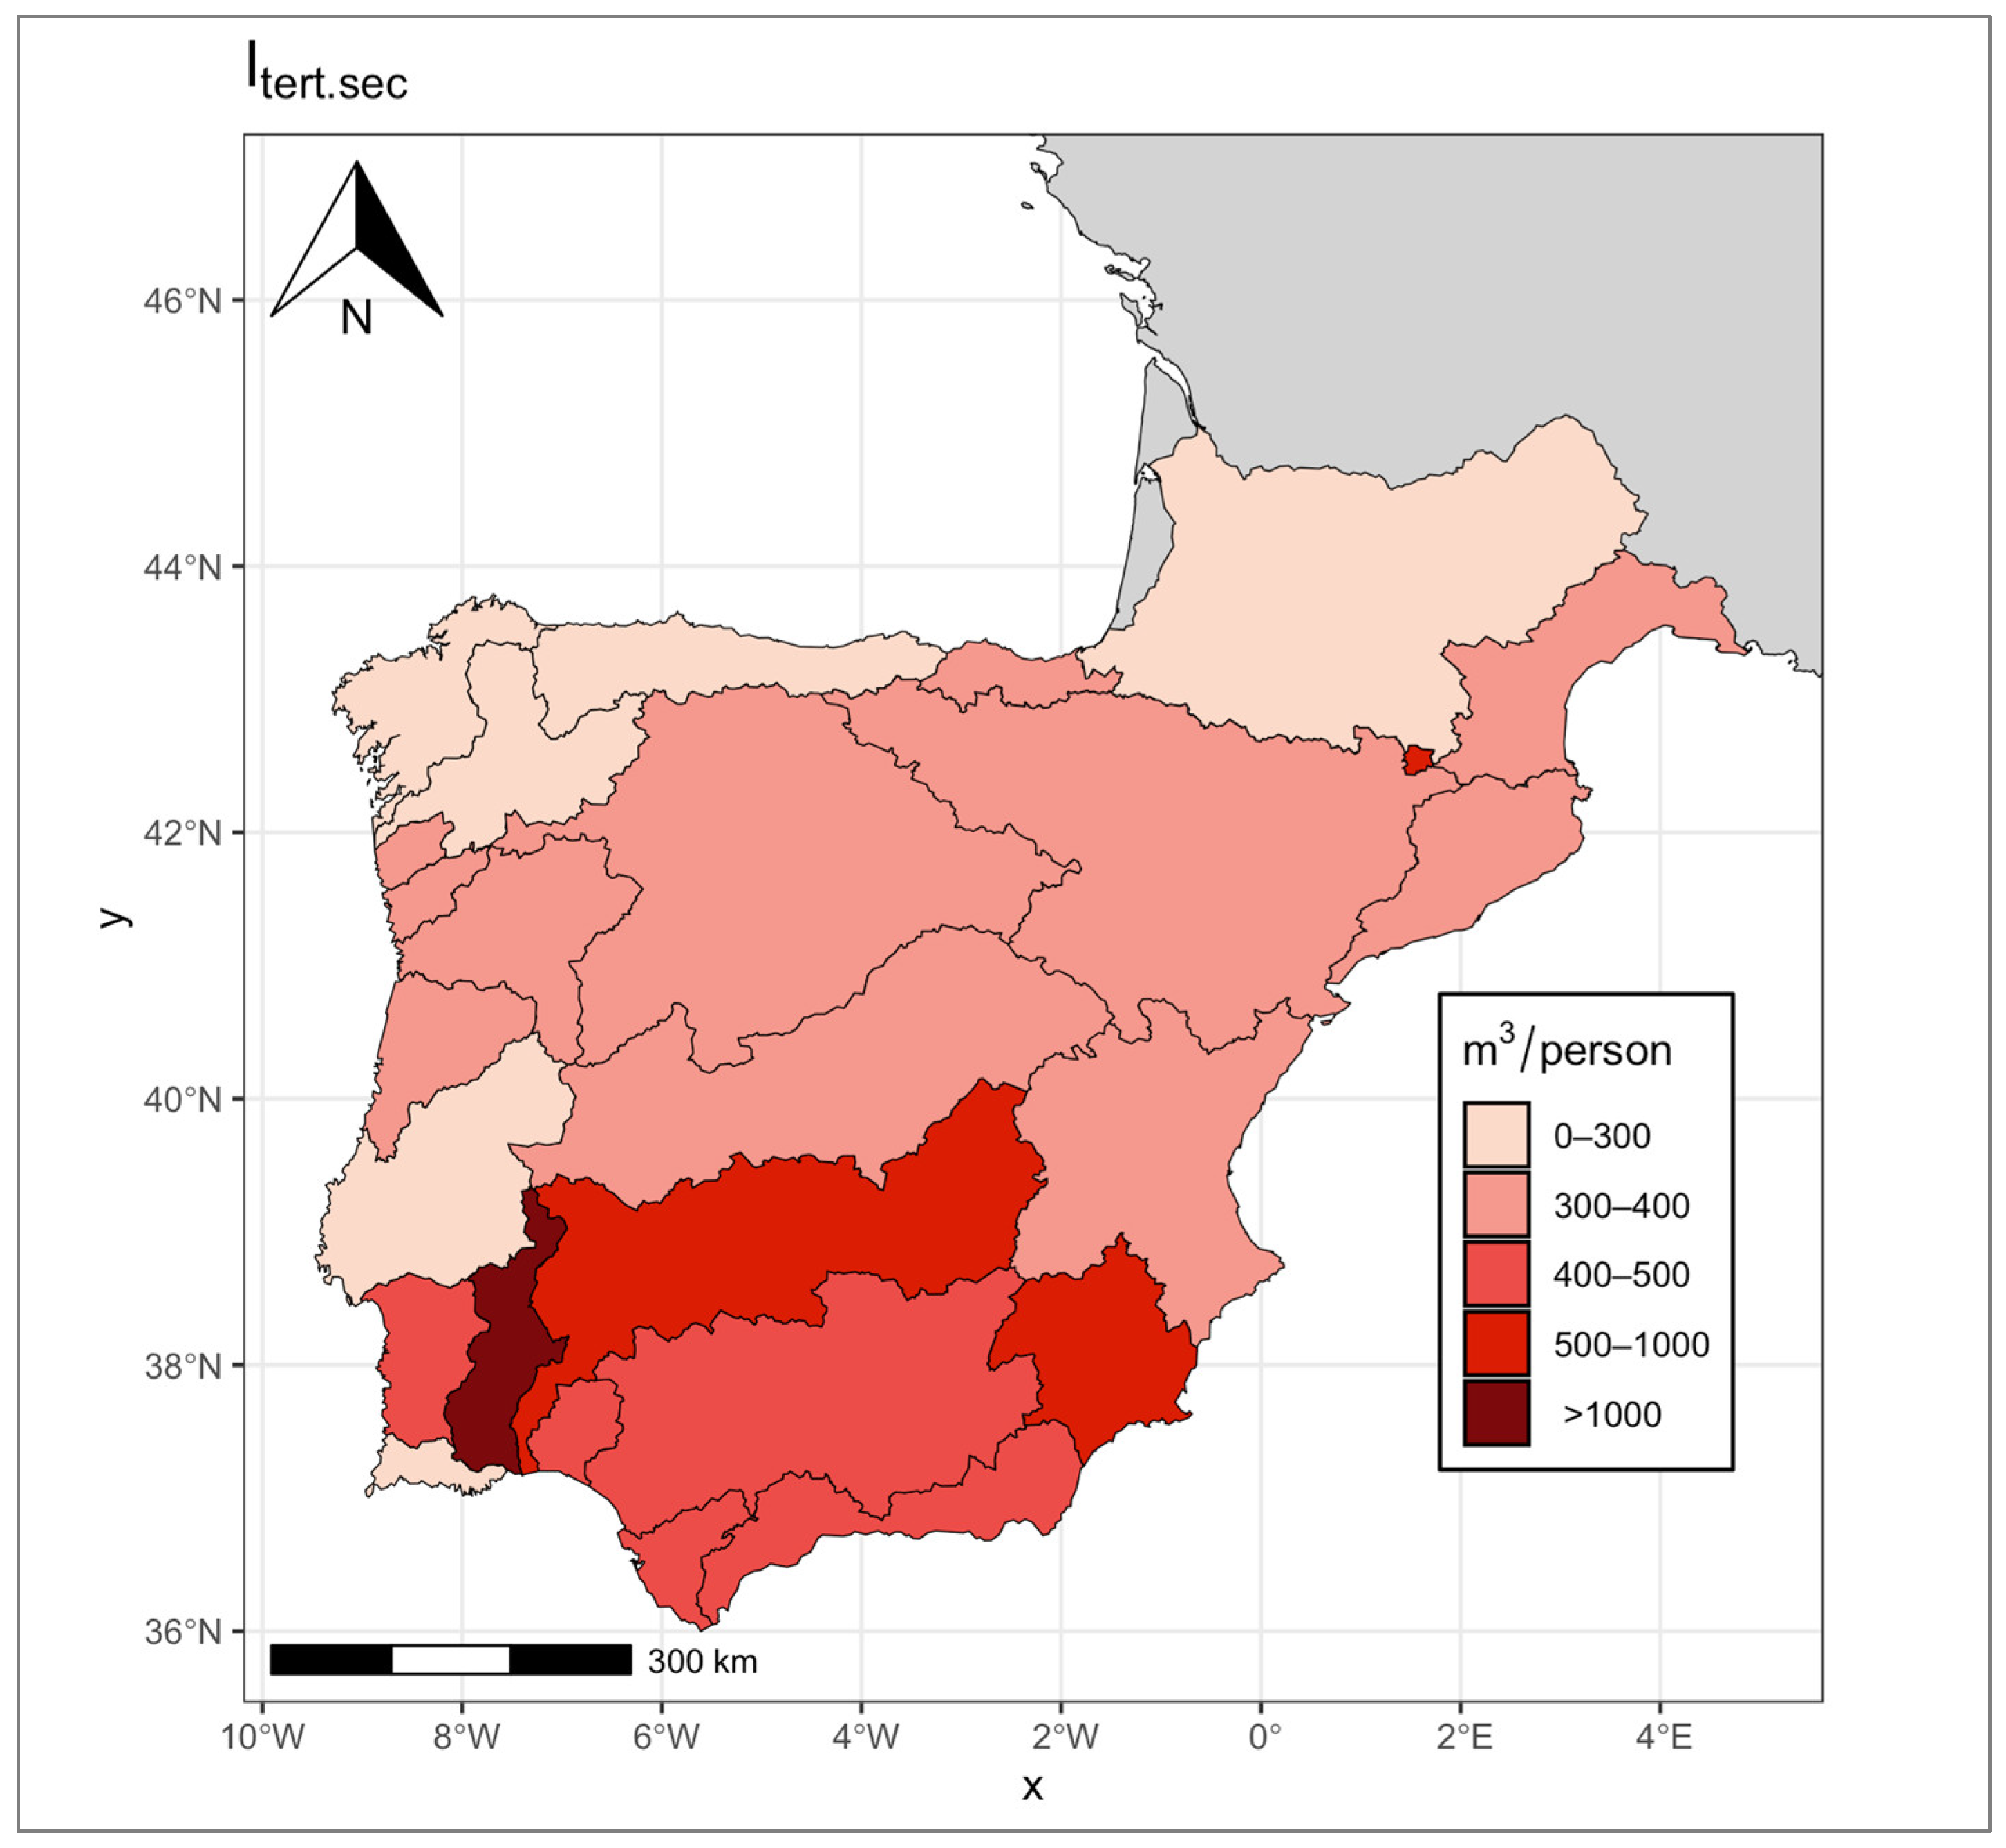
3.1.3. Intensity of Water Use in Employment by Sector
3.2. Direct and Virtual Water: I-O Method
3.3. Transformation of Scales: From Administrative to Basin District Levels
4. Data Sources
4.1. Water Data
4.2. Socioeconomic Data
5. Indicator Results at River Basin District Scale across the SUDOE Territory
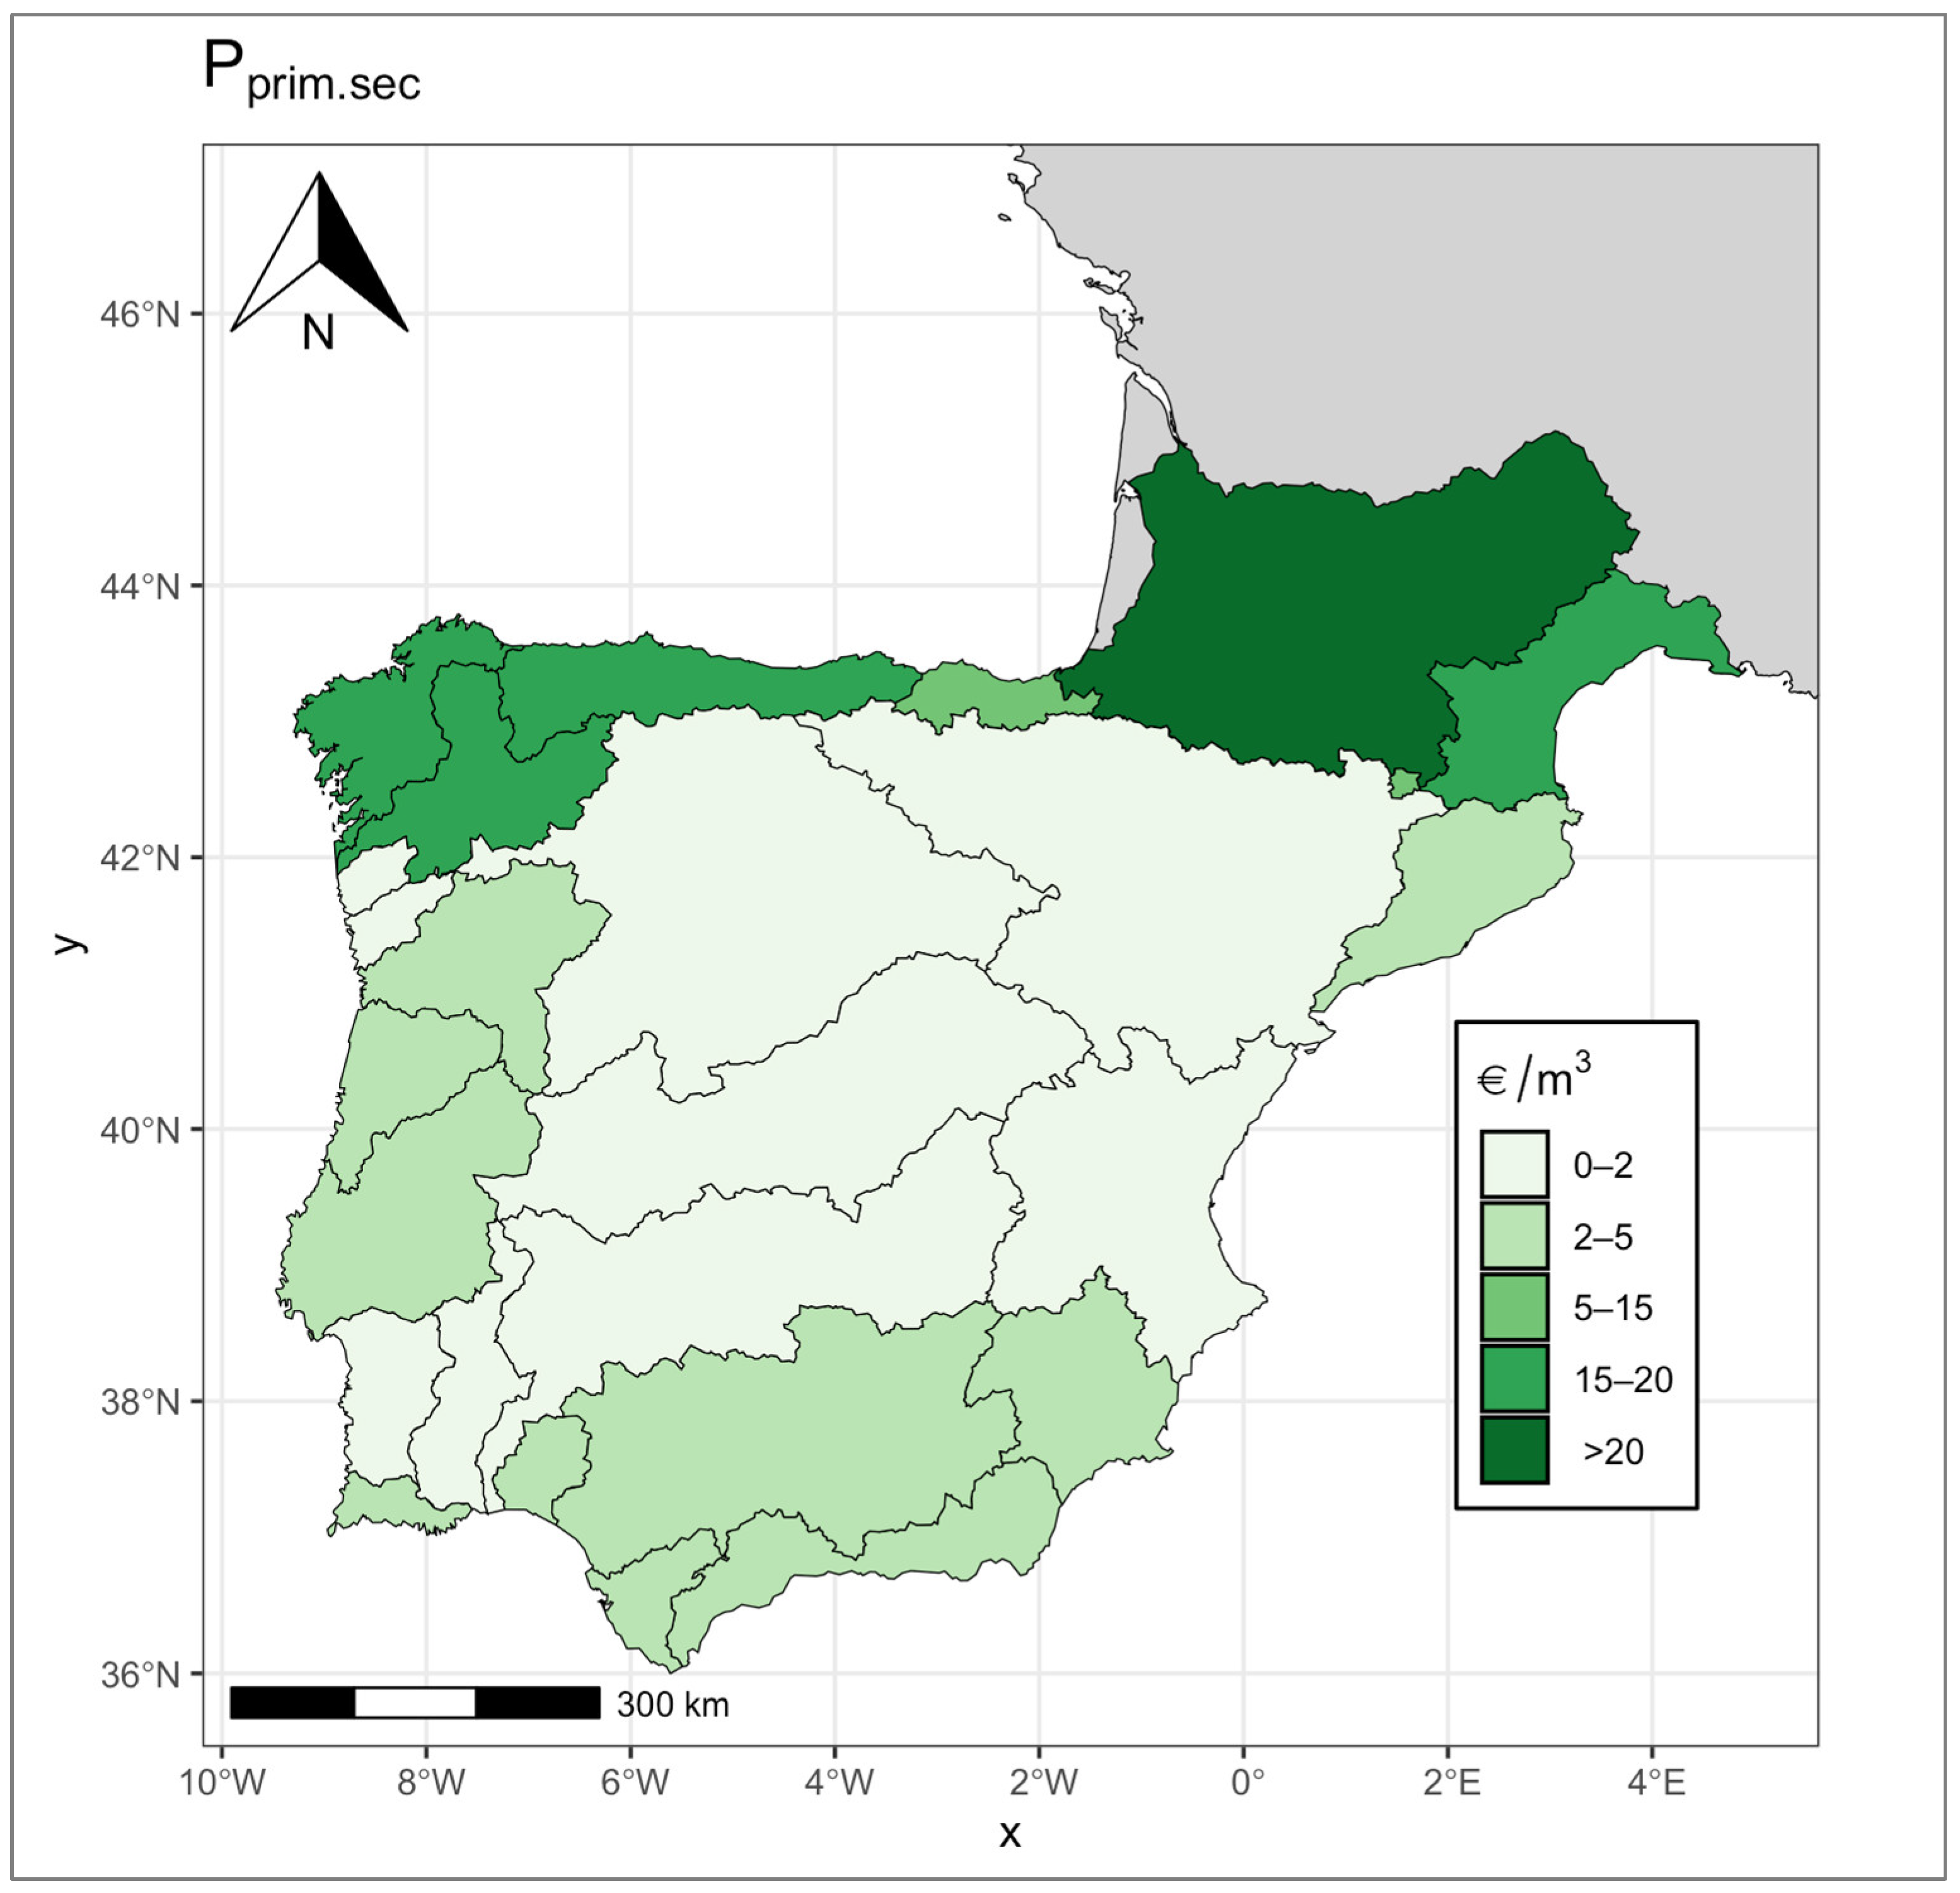
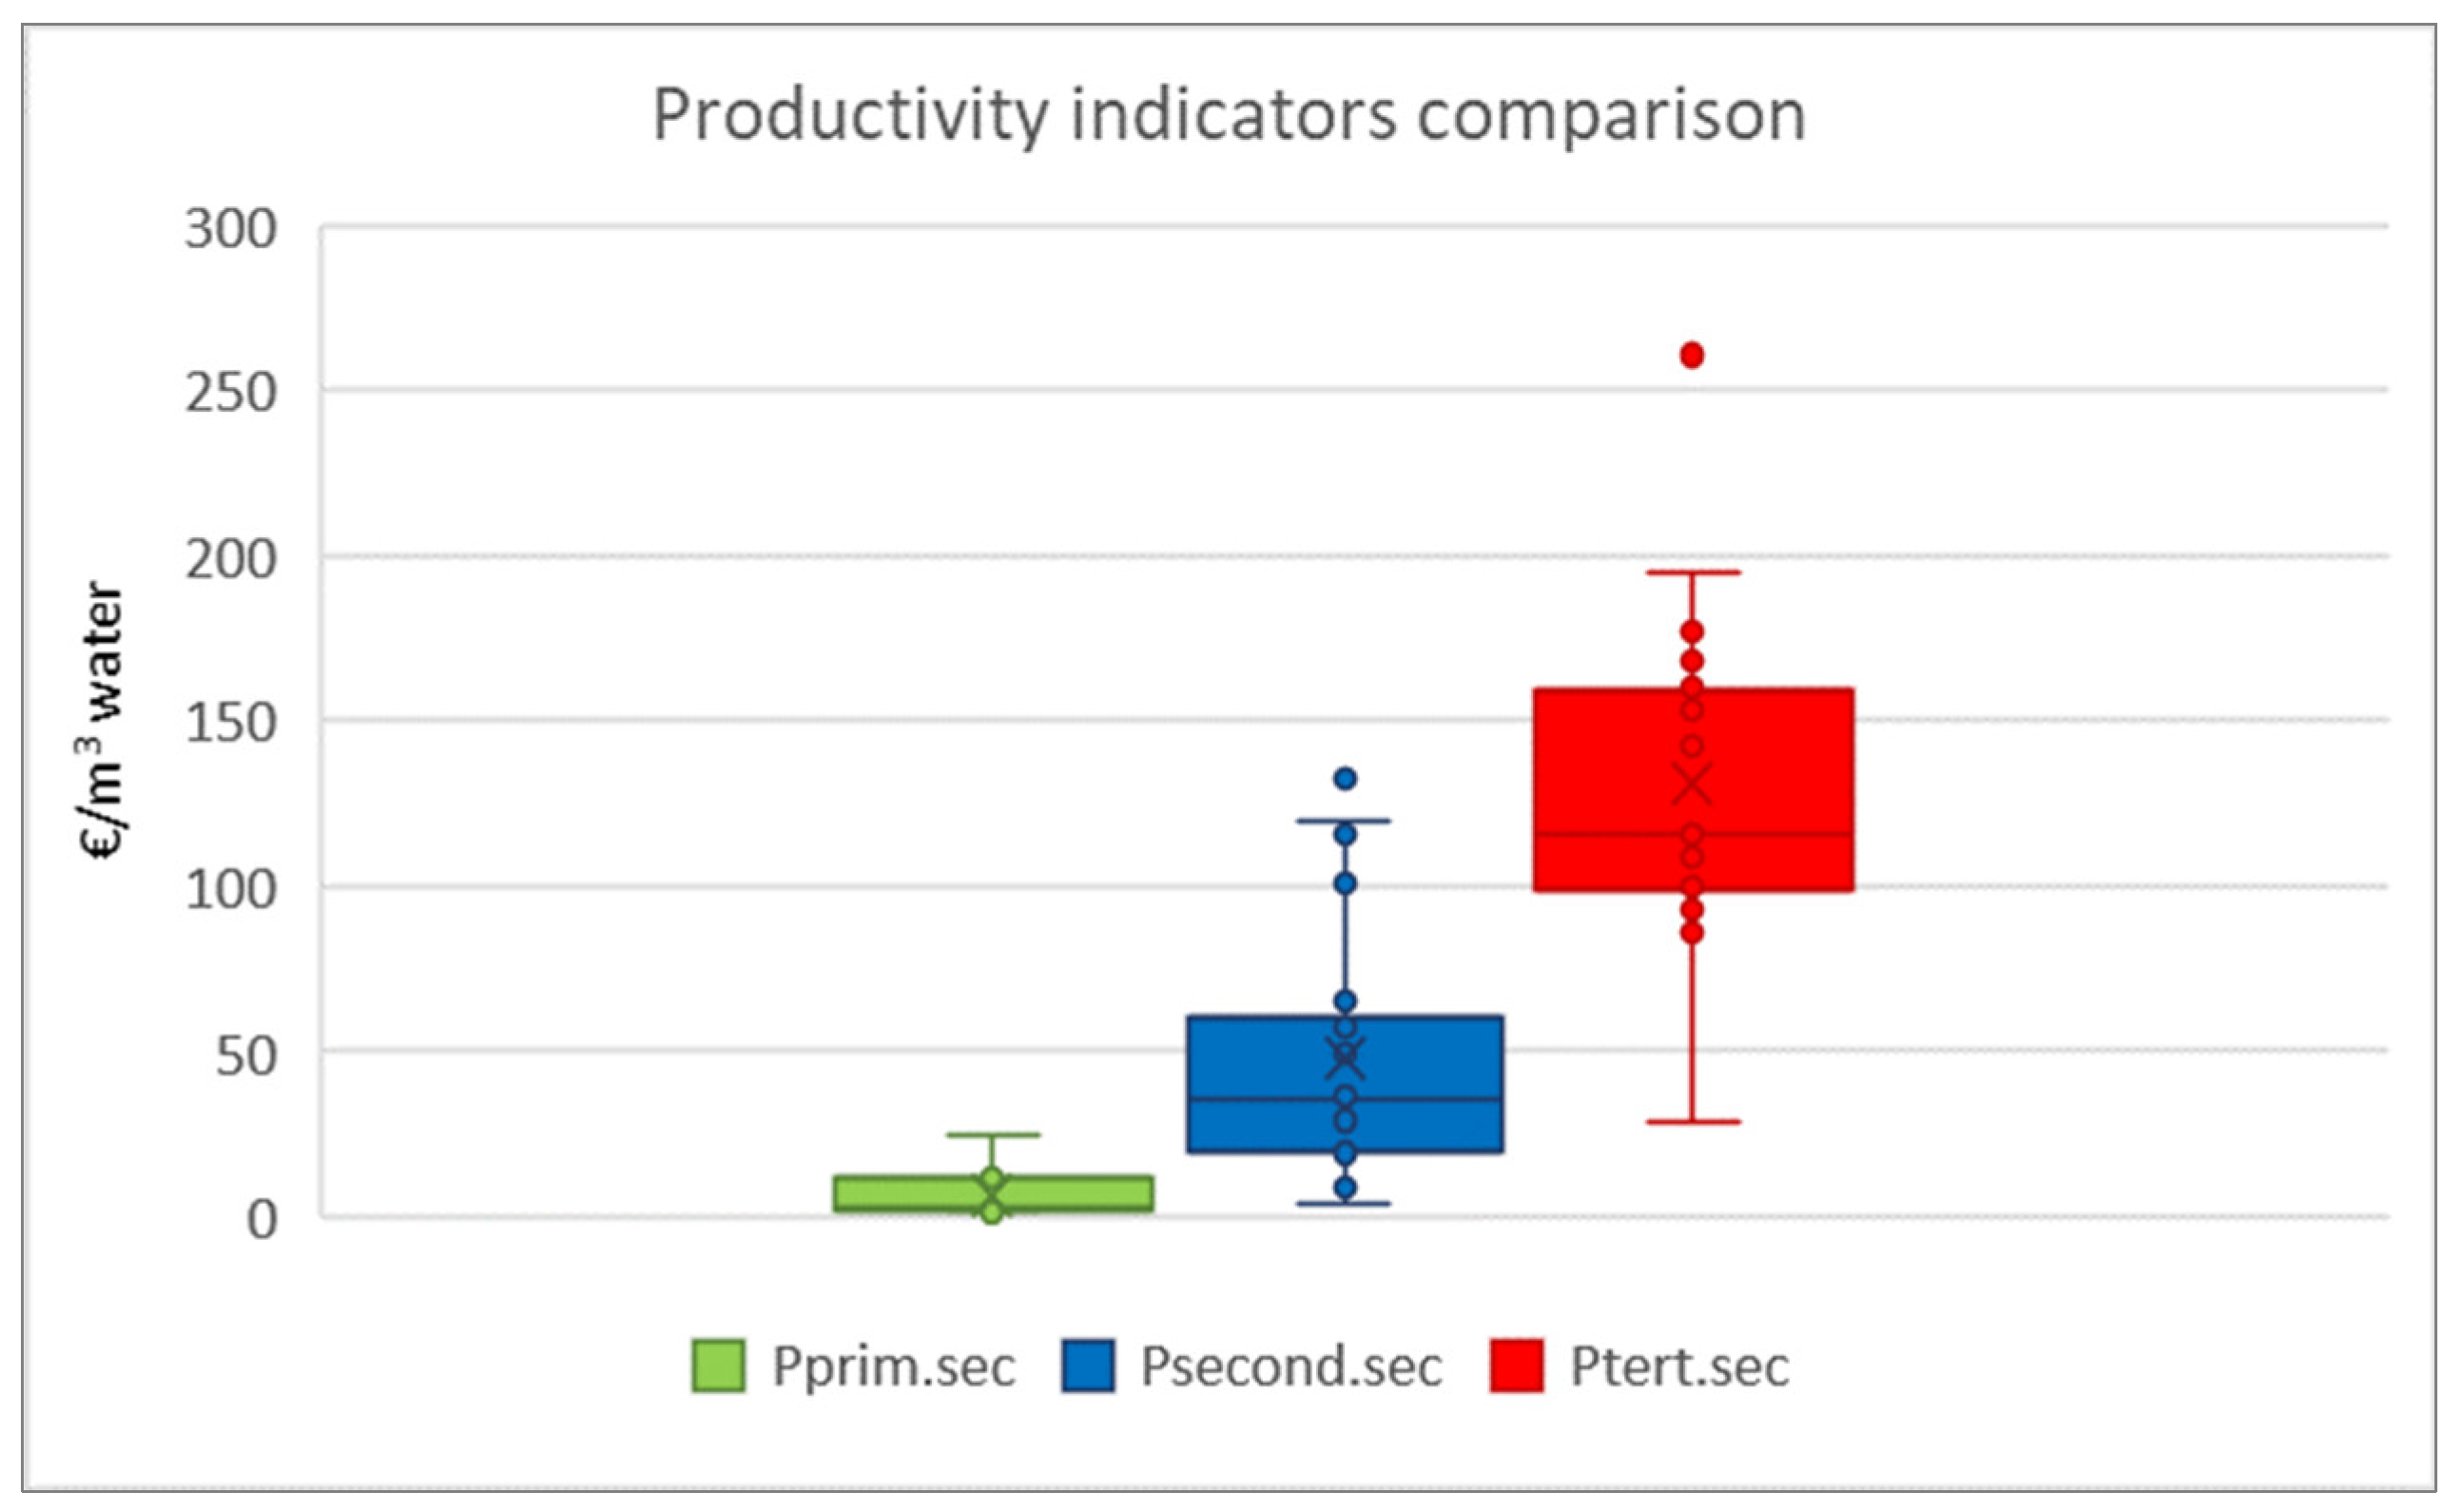
5.1. Average Apparent Water Productivity by Sector
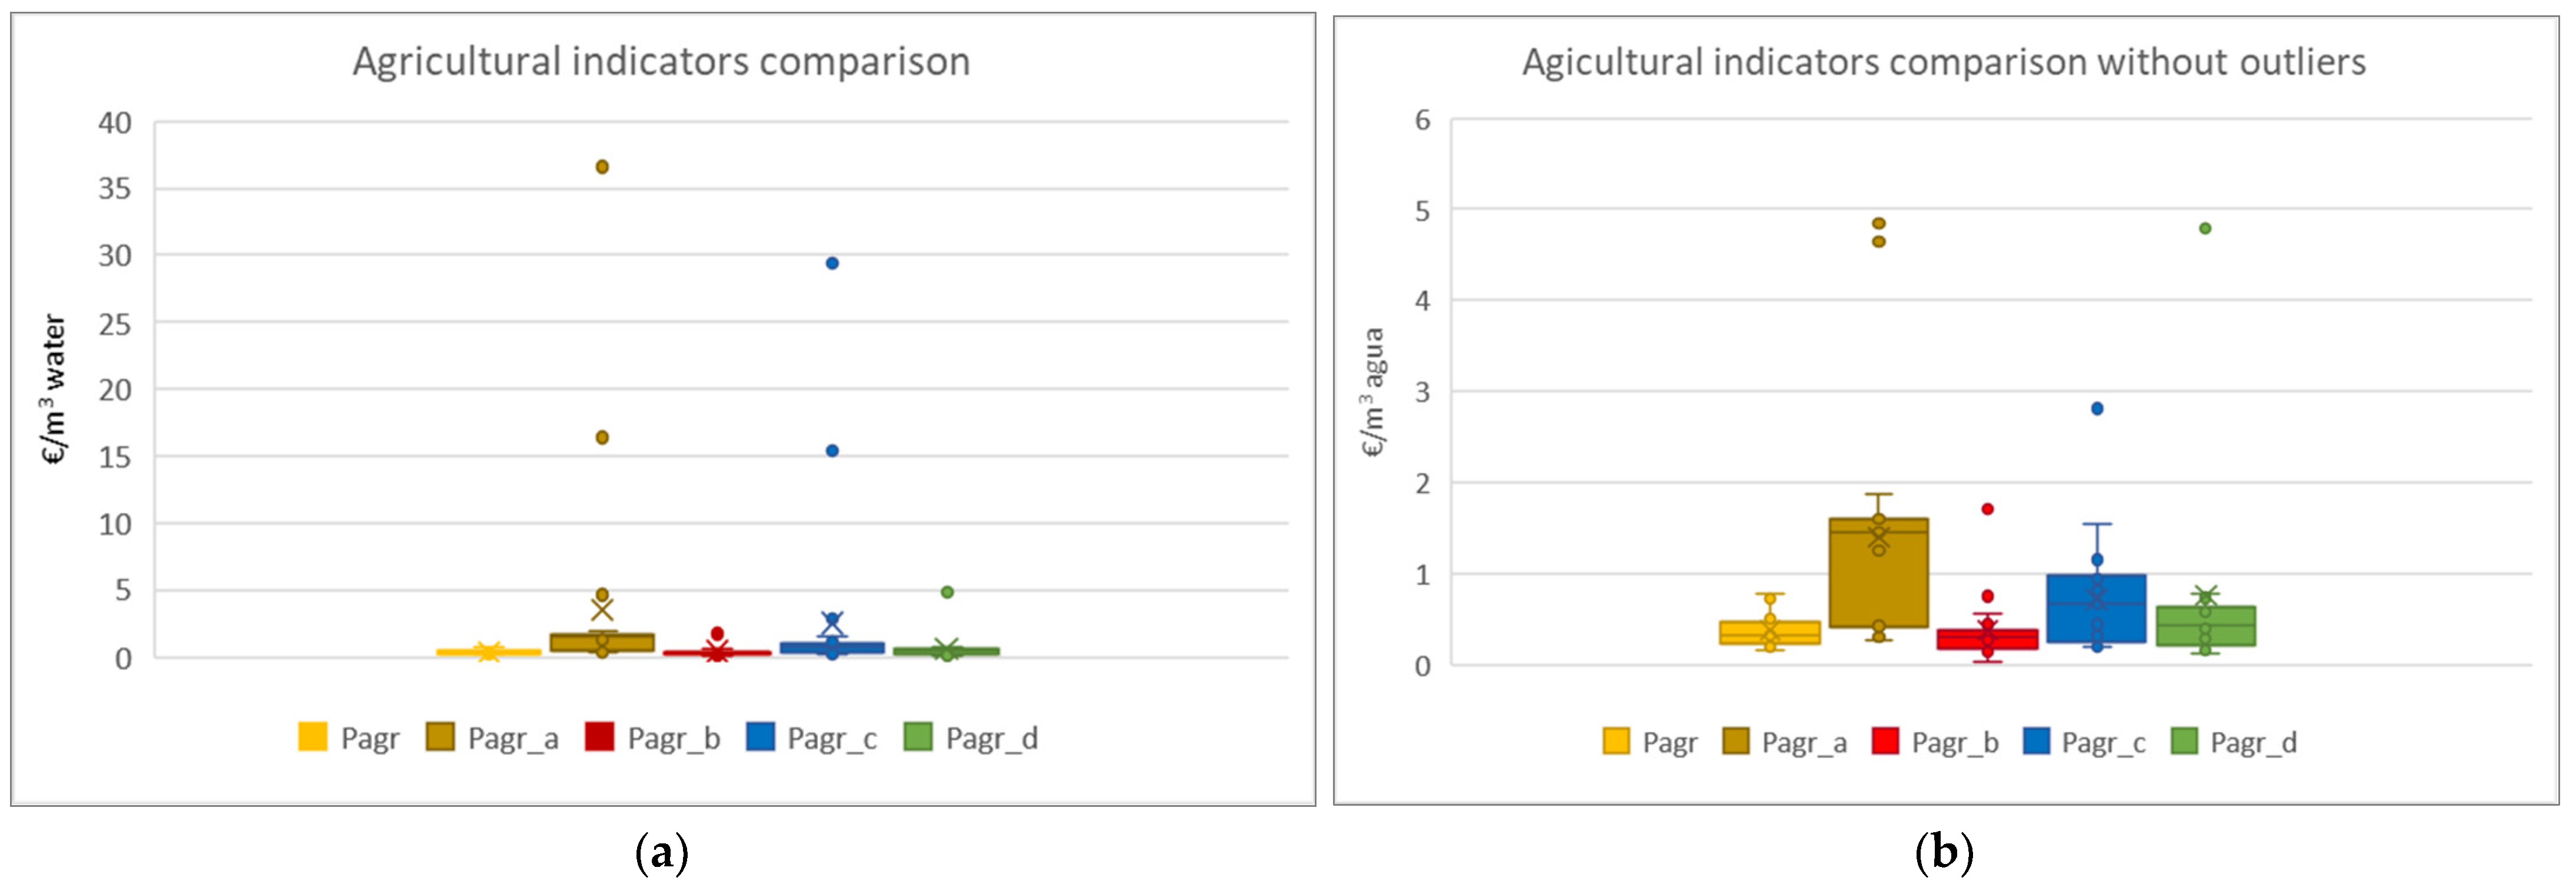
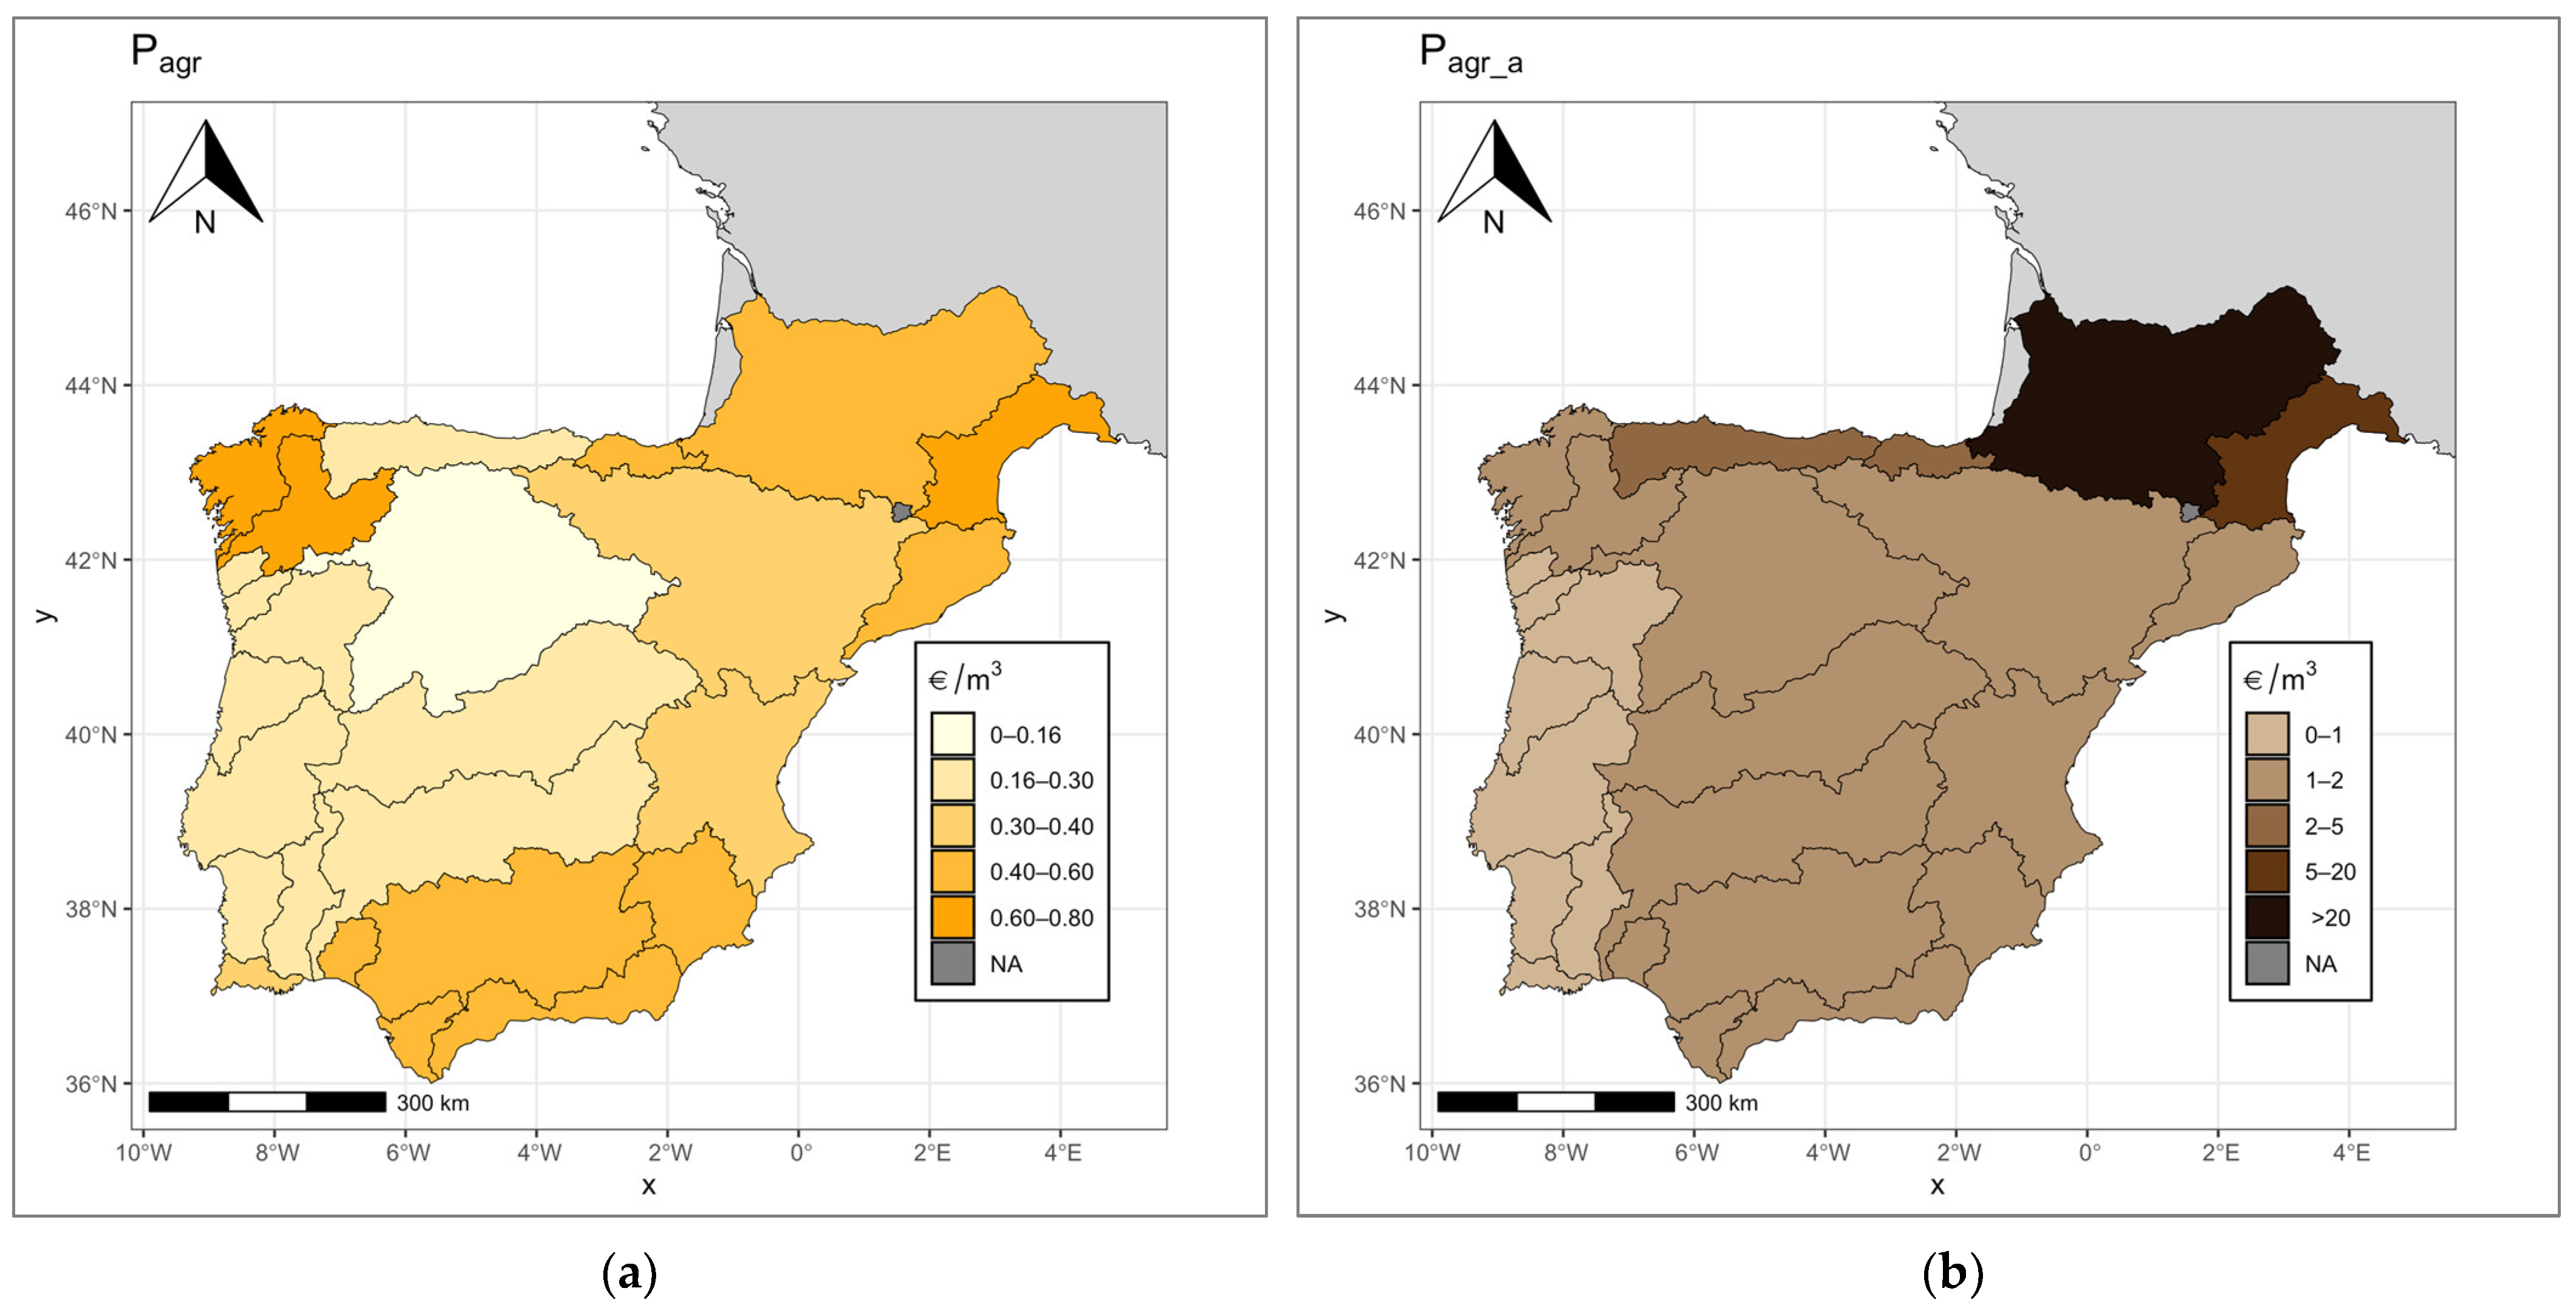
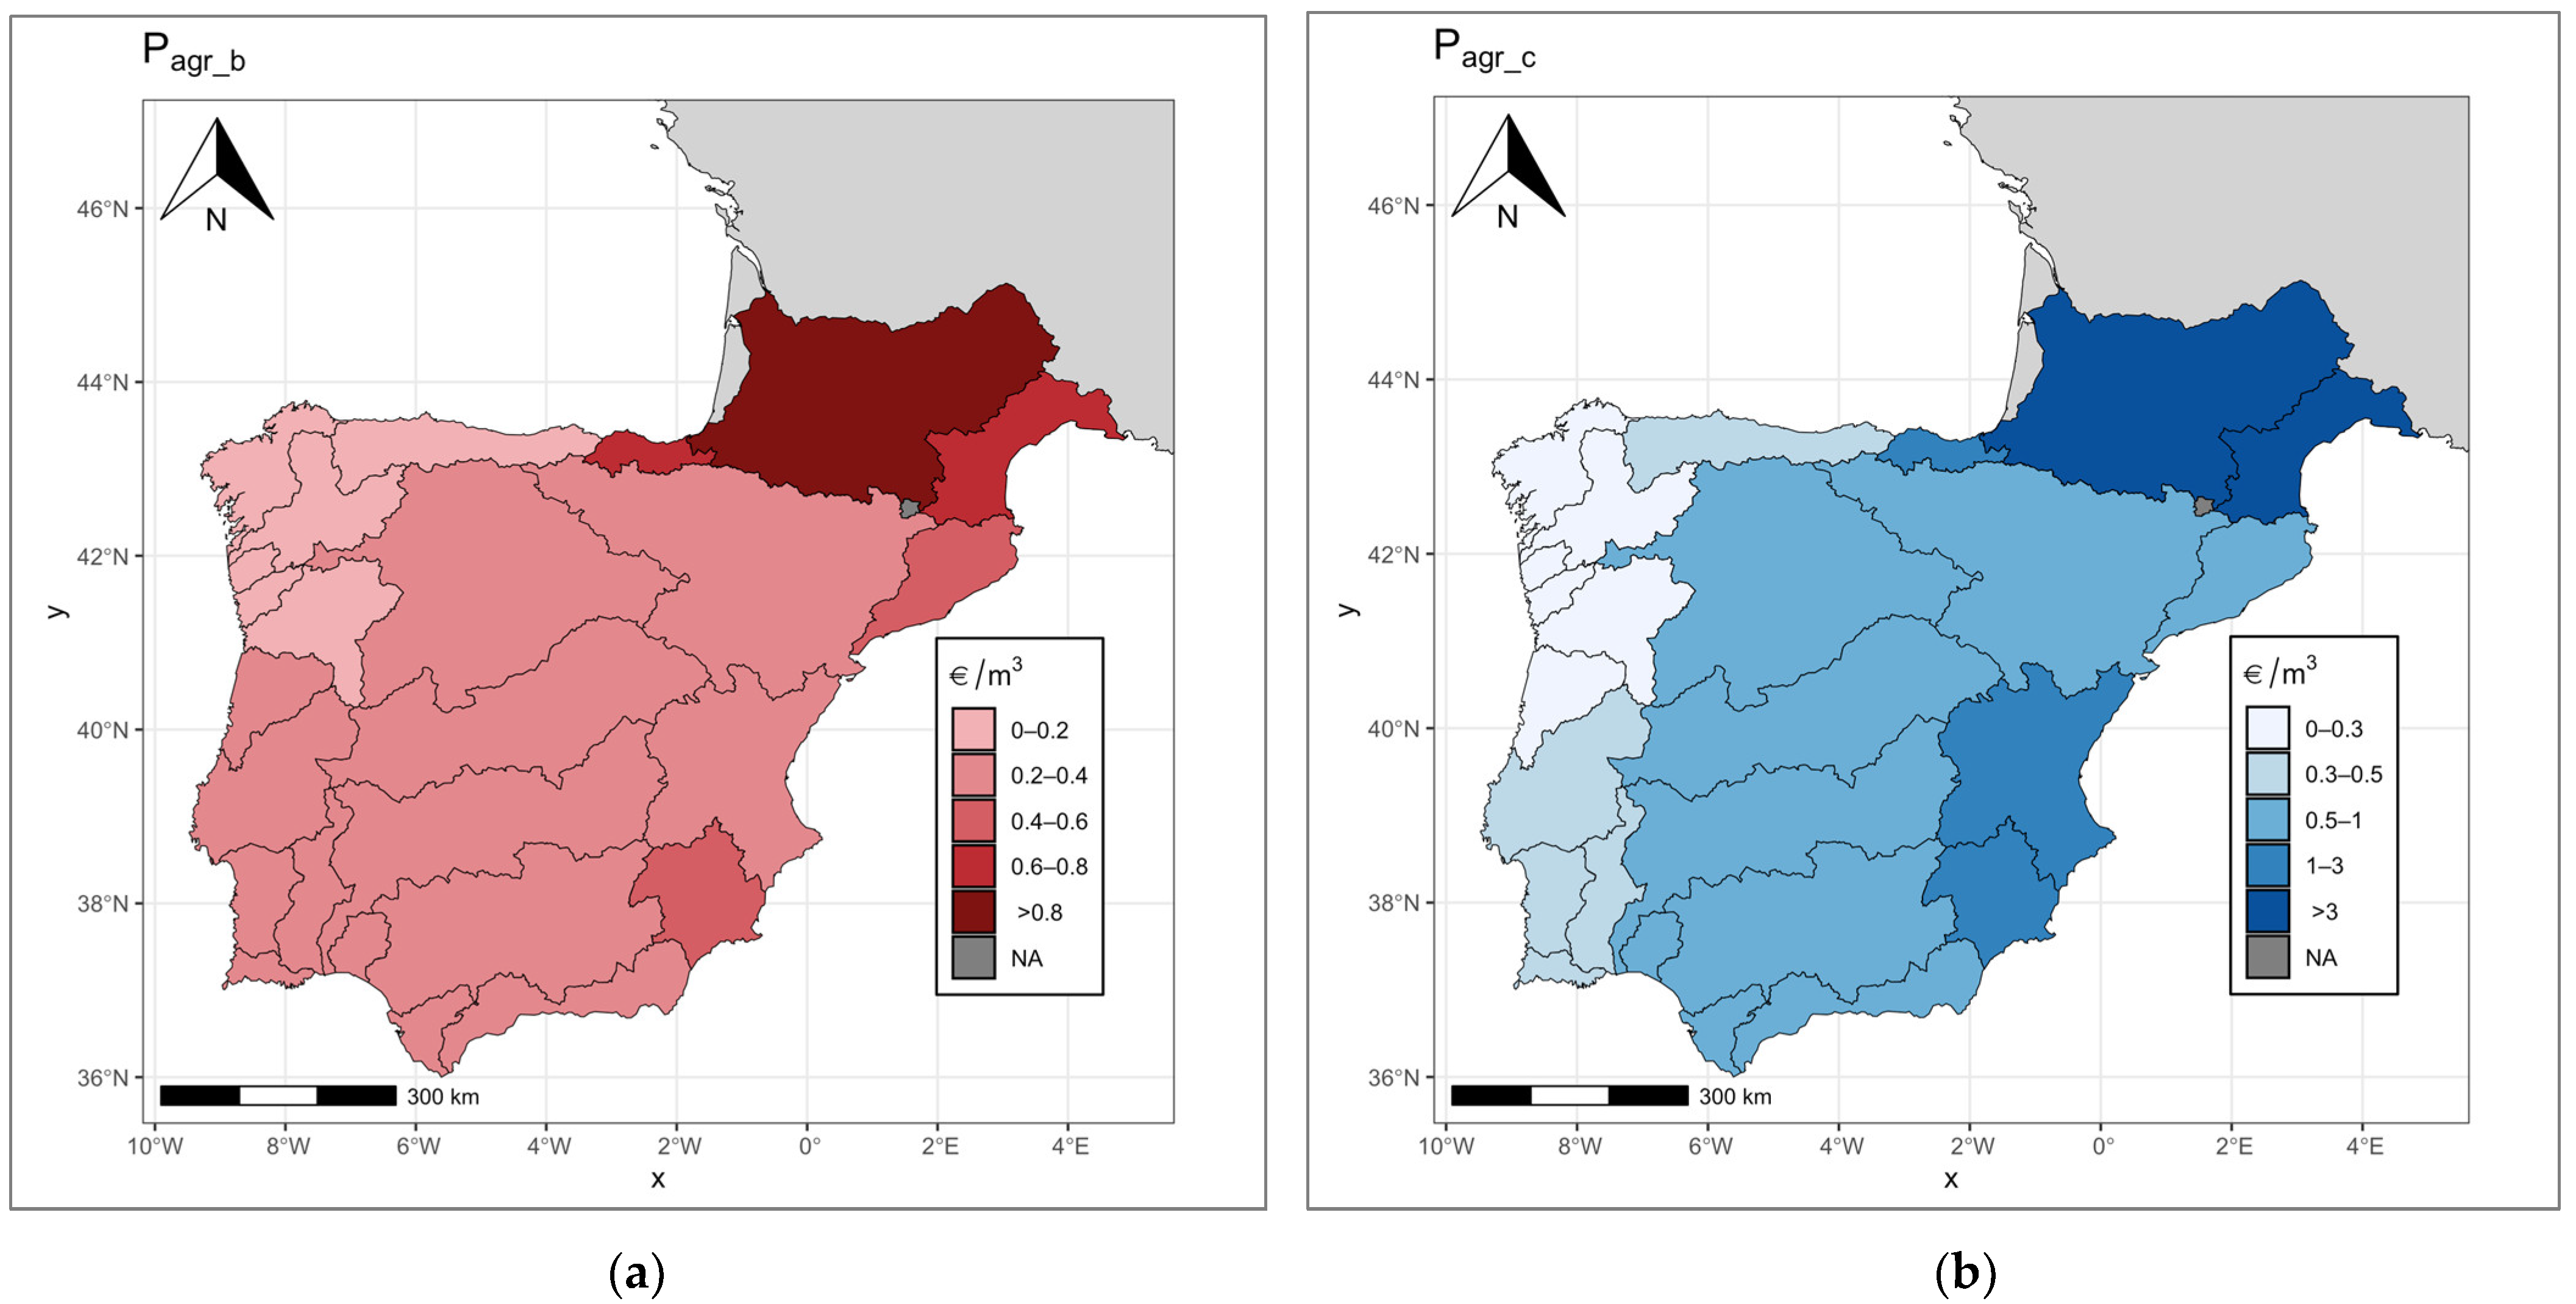
5.2. Water Productivity in Agriculture
5.3. Intensity of Water Use in Employment by Sector
6. Discussion and Conclusions
Author Contributions
Funding
Data Availability Statement
Acknowledgments
Conflicts of Interest
Appendix A

| SPAIN | |||
|---|---|---|---|
| Economic Sector | Period | Source | |
| Primary sector | |||
| 1 | Agriculture | 2000–2015 | http://www.ine.es/jaxi/Tabla.htm?path=/t26/p067/p03/serie/l0/&file=02003.px&L=0, accessed on 12 March 2023 |
| 2 | Livestock | 2002–2015 | https://porcinews.com/download/variacion-consumo-agua.pdf accessed on 12 March 2023 |
| https://conservancy.umn.edu/bitstream/handle/11299/140901/1/Muhlbauer.pdf accessed on 12 March 2023 | |||
| http://albeitar.portalveterinaria.com/noticia/3379/articulos-otros-temas-archivo/el-agua-y-su-importancia-para-los-bóvidos.html accessed on 12 March 2023 | |||
| https://www.agroterra.com/foro/foros/ganado-ganaderia-f10/cuanta-agua-bebe-una-vaca-al-dia-t18731.html accessed on 12 March 2023 | |||
| http://mundo-pecuario.com/tema64/agua_nutricion_animal/requerimientos-398.html accessed on 12 March 2023 | |||
| https://www.engormix.com/ovinos/articulos/evaluacion-consumo-agua-cabras-t29617.html accessed on 12 March 2023 | |||
| https://ppryc.files.wordpress.com/2011/04/capitulo-3.pdf | |||
| http://www.agroecologia.net/recursos/adge/articulos/agua%20ganaderia1%20jul-ago%2004.pdf accessed on 12 March 2023 | |||
| 3 | Forestry | 2001 | https://www.mapa.gob.es/es/ accessed on 12 March 2023 |
| 4 | Fishing | - | Non available |
| Secondary sector | |||
| 5 | Extractive Industries | 2005–2015 | https://www.miteco.gob.es/es/energia/mineria-explosivos/estadistica/consulta.html accessed on 24 March 2023 |
| 6 | Food, meat and dairy industries | 2006–2010 | www.ine.es/daco/daco42/ambiente/aguaindu/uso_agua_indu0710.pdf accessed on 24 March 2023 |
| 7 | Other Industry, Food: tobacco and beverages | 2006–2010 | |
| 8 | Textile industry | 2006–2010 | |
| 9 | Wood Industry | 2006–2010 | |
| 10 | Paper Industry | 2006–2010 | |
| 11 | Petroleum refining and Nuclear | 2006–2010 | |
| 12 | Chemical industry | 2006–2010 | |
| 13 | Rubber and Plastics Industry | 2006–2010 | |
| 14 | Industries of other non-metallic mineral products | 2006–2010 | |
| 15 | Metallurgy and metal products manufacturing | 2006–2010 | |
| 16 | Machine building, electronics and optics industries | 2006–2010 | |
| 17 | Manufacture of transport equipment | 2006–2010 | |
| 18 | Miscellaneous manufacturing industries | 2006–2010 | |
| 19 | Water collection, purification and distribution | 2008–2013 | http://www.ine.es/dynt3/inebase/index.htm?type=pcaxis&path=/t26/p067/p02/agua07-10&file=pcaxis&L=0 accessed on 24 March 2023 |
| 20 | Power and gas production and distribution | 2008–2013 | |
| 21 | Construction | 2008–2013 | |
| 22 | Wastewater and sewerage sanitation activities | 2008–2013 | |
| Tertiary sector | |||
| 23 | Hotels | 2001–2015 | https://ine.es/dynt3/inebase/es/index.htm?padre=238&dh=1 |
| 24 | Restaurants | 2008–2013 | http://www.ine.es/dynt3/inebase/index.htm?type=pcaxis&path=/t26/p067/p02/agua07-10&file=pcaxis&L=0 accessed on 24 March 2023 |
| 25 | Other economic activities (services) | 2008–2013 | http://www.ine.es/dynt3/inebase/index.htm?type=pcaxis&path=/t26/p067/p02/agua07-10&file=pcaxis&L=0 accessed on 24 March 2023 |
| 26 | Water supply | 2000–2014 | http://www.ine.es/jaxi/Tabla.htm?path=/t26/p069/p03/serie/l0/&file=01001.px&L=0 accessed on 24 March 2023 |
| FRANCE | |||
| Economic Sector | Period | Source | |
| Primary sector | |||
| Surface water used for agriculture | 2008–2013 | Producteurs: MEEM (CGDD/SOeS), Agences de l’Eau. Source: Données Agences de l’eau, estimations SOeS. accessed on 27 March 2023 | |
| Secondary sector | |||
| Surface water used for industry | |||
| Tertiary sector | |||
| Surface water used for domestic purposes | |||
| PORTUGAL | |||
| Economic Sector | Period | Source | |
| Primary sector | |||
| Agriculture and livestock | 2006–2016 | https://www.ine.pt/bddXplorer/htdocs/minfo.jsp?var_cd=0001868 accessed on 28 March 2023 | |
| Secondary sector | |||
| Industrial | |||
| Tertiary sector | |||
| Commercial and services | |||
| Domestic | |||
| At Regional (NUTS 2) Level | ||
|---|---|---|
| Period | Source | |
| Gross value added NACE constant prices | https://data.europa.eu/data/datasets/pksefp7fasxtmhta9nkozq?locale=en accessed on 2 April 2023 | |
| Average hours worked per employee, by working time—LCS survey | 2000–2016 | https://ec.europa.eu/eurostat/cache/metadata/en/lcs_r2_esms.htm accessed on 2 April 2023 |
| Population statistics at regional level | https://ec.europa.eu/eurostat/databrowser/view/demo_r_d2jan/default/table?lang=en&category=reg.reg_dem.reg_dempoar accessed on 2 April 2023 | |
References
- WCED. Our Common Future; (The Brundtland Report); World Commission on Environment and Development, United Nations: New York, NY, USA, 1987; Available online: https://sustainabledevelopment.un.org/content/documents/5987our-common-future.pdf (accessed on 15 May 2023).
- United Nations. The Dublin Statement on Water and Sustainable Development. In Proceedings of the International Conference on Water and the Environment, Dublin, Ireland, 26–31 January 1992; Available online: https://www.gdrc.org/uem/water/dublin-statement.html (accessed on 2 April 2023).
- European Courts of Auditors. Sustainable Water Use in Agriculture: CAP Funds more Likely to Promote Greater Rather than more Efficient Water Use; Special Report, Num. 20; Publication Office of the European Union: Luxembourg, 2021. [Google Scholar]
- World Bank. Renewable Internal Freshwater Resources per Capita (Cubic Meters); European Union, Food and Agriculture Organization, AQUASTAT Data; World Bank: Washington, DC, USA, 2020; Available online: https://data.worldbank.org/indicator/ER.H2O.INTR.PC?locations=EU (accessed on 15 May 2023).
- Young, R.A.; Loomis, J.B. Determining the Economic Value of Water, 2nd ed.; RFF Press, Routledge: New York, NY, USA, 2014. [Google Scholar]
- Hurd, B.; Callaway, M.; Smith, J.; Kirshen, P. Climatic Change and U.S. Water Resources: From Modeled Watershed Impacts to National Estimates. J. Am. Water Resour. Assoc. 2004, 40, 129–148. [Google Scholar] [CrossRef]
- Hoekstra, A.Y.; Hung, P.Q. Virtual water trade. A quantification of virtual water flows between nations in relation to international crop trade. In Proceedings of the International Expert Meeting on Virtual Water Trade; Value of Water Research Report Series No. 12. UNESCO-IHE, Institute for Water Education, IHE: Delft, The Netherlands, 2003. [Google Scholar]
- MMAMRM. Huella Hídrica de España; Moratilla, F.E., Ed.; Colección Sostenibilidad y Territorio; Ministerio de Medio Ambiente y Medio Rural y Marino: Madrid, Spain, 2011. (In Spanish) [Google Scholar]
- Gebre, S.L.; Cattrysse, D.; Van Orshoven, J. Multi-Criteria Decision-Making Methods to Address Water Allocation Problems: A Systematic Review. Water 2021, 13, 125. [Google Scholar] [CrossRef]
- Bisselink, B.; Bernhard, J.; Gelati, E.; Adamovic, M.; Guenther, S.; Mentaschi, L.; De Roo, A. Impact of a Changing Climate, Land Use, and Water Usage on Europe’s Water Resources; EUR 29130 EN; Publications Office of the European Union: Luxembourg, 2018. [Google Scholar]
- González-Cueto, O.; Montaña-Valladares, A.; López-Bravo, E.; Sánchez-Valle, S.; Zambrano-Casanova, D.E.; Macias-Martínez, L.M.; Herrera-Suárez, M. Irrigation water productivity in selected crops from central region of Cuba. Rev. Cienc. Téc. Agropecu. 2020, 29, e06. [Google Scholar]
- Hammami, Z.; Qureshi, A.S.; Sahli, A.; Gauffreteau, A.; Chamekh, Z.; Ben Azaiez, F.E.; Ayadi, S.; Trifa, Y. Modeling the Effects of Irrigation Water Salinity on Growth, Yield and Water Productivity of Barley in Three Contrasted Environments. Agronomy 2020, 10, 1459. [Google Scholar] [CrossRef]
- Booker, J.F.; Trees, W.S. Implications of Water Scarcity for Water Productivity and Farm Labor. Water 2020, 12, 308. [Google Scholar] [CrossRef]
- FAO. Water for Sustainable Food and Agriculture Water for Sustainable Food and Agriculture; Report Produced for the G20 Presidency of Germany; FAO: Rome, Italy, 2017. [Google Scholar]
- EEA. Use of Freshwater Resources in Europe; EEA Indicator Assessment; EEA: Copenhagen, Denmark, 2019; Available online: https://water.europa.eu/freshwater/europe-freshwater/freshwater-themes/water-resources-europe (accessed on 15 May 2023).
- Duarte, R.; Sánchez-Choliz, J.; Bielsa, J. Water use in the Spanish economy: An input-output approach. Ecol. Indic. 2002, 43, 71–85. [Google Scholar] [CrossRef]
- Allan, J.A. Fortunately there are substitutes for water otherwise our hydro-political futures would be impossible. In Priorities for Water Resources Allocation and Management; ODA: London, UK, 1993; pp. 13–26. [Google Scholar]
- Allan, J.A. Overall perspectives on countries and regions. In Water in the Arab World: Perspectives and Prognoses; Rogers, P., Lydon, P., Eds.; Harvard University Press: Cambridge, MA, USA, 1994; pp. 65–100. [Google Scholar]
- Allan, J.A. Virtual water—The water, food, and trade nexus. Useful concept or misleading metaphor? Water Int. 2003, 28, 106–113. [Google Scholar] [CrossRef]
- Hoekstra, A.Y., Ed.; Virtual water trade: An introduction. In Proceedings of the International Expert Meeting on Virtual Water Trade; Value of Water Research Report Series No. 12. UNESCO-IHE, Institute for Water Education, IHE: Delft, The Netherlands, 2003. [Google Scholar]
- Metzger, M.J.; Bunce, R.G.H.; Jongman, R.H.G.; Sayre, R.; Trabucco, A.; Zomer, R. High-resolution bioclimate map of the world. Glob. Ecol. Biogeogr. 2013, 22, 630–638. [Google Scholar] [CrossRef]
- Rivas-Martínez, S.; Penas, A.; Díaz, T.E. Biogeographic Map of Europe; Cartographic Service University of León: León, Spain, 2004. [Google Scholar]
- Büttner, G.; Soukup, T.; Kosztra, B. CLC2012 Addendum to CLC2006 Technical Guidelines; Final Draft; EEA: Copenhagen, Denmark, 2014. [Google Scholar]
- Eurostat. Farm Structure Statistics. 2013. Available online: https://ec.europa.eu/eurostat/statistics-explained/index.php?oldid=442608 (accessed on 20 March 2023).
- Jones, A.; Montanarella, L.; Jones, R. Soil Atlas of Europe; European Commission: Luxembourg, 2005. [Google Scholar]
- Agreste. Statistique Agricole Annuelle (SAA). 2023. Available online: http://agreste.agriculture.gouv.fr (accessed on 23 May 2023).
- MAPAMA. Estadísticas Agrarias: Agricultura; MAPAMA: Madrid, Spain, 2023; Available online: https://www.mapama.gob.es (accessed on 25 May 2023).
- INE. Agricultura, Floresta e Pescas; INE: Lisbon, Portugal, 2023; Available online: https://www.ine.pt/xportal/xmain?xpgid=ine_tema&xpid=INE&tema_cod=1510 (accessed on 4 June 2023).
- Morita. Conceptual issues in water use efficiency and water productivity. In Current Directions in Water Scarcity Research; Kumar, M.D., Ed.; Elsevier: Amsterdam, The Netherlands, 2021; Volume 3, pp. 49–63. [Google Scholar]
- Velázquez, E. An input-output model of water consumption: Analysing intersectoral water relationships in Andalusia. Ecol. Econ. 2006, 56, 226–240. [Google Scholar] [CrossRef]
- Pérez, C.D.; Gómez, C.M.; Del Villar, A. Water Uncertainty in Agriculture: An Application to Guadalquivir and Segura River Basins. Estud. Econ. Apl. 2011, 29, 333–358. (in Spanish). [Google Scholar]
- Pérez, C.D.; Thaler, T. An Input-Output Assessment of Water Productivity in the Castile and León Region (Spain). Water 2014, 6, 929–944. [Google Scholar] [CrossRef]
- Cazcarro, I.; Hoekstra, A.; Sánchez-Chóliz, J. The water footprint of tourism in Spain. Tour. Manag. 2014, 40, 90–101. [Google Scholar] [CrossRef]
- Cazcarro, I.; Duarte, R.; Sánchez-Chóliz, J. Multiregional Input–Output Model for the Evaluation of Spanish Water Flows. Environ. Sci. Technol. 2013, 47, 12275–12283. [Google Scholar] [CrossRef]
- Stone, R. Input–Output and National Accounts; Organization for European Economic Cooperation: Paris, France, 1961. [Google Scholar]
- Pavia, J.M.; Cabrer, B.; Sala, R. Updating input–output matrices: Assessing alternatives through simulation. J. Stat. Comput. Simul. 2009, 79, 1467–1482. [Google Scholar] [CrossRef]
- Cakir, R.; Raimonet, M.; Sauvage, S.; Paredes-Arquiola, J.; Grusson, Y.; Roset, L.; Meaurio, M.; Navarro, E.; Sevilla-Callejo, M.; Lechuga-Crespo, J.L.; et al. Hydrological Alteration Index as an Indicator of the Calibration Complexity of Water Quantity and Quality Modeling in the Context of Global Change. Water 2020, 12, 115. [Google Scholar] [CrossRef]
- San Martin, E.; Larraz, B.; Gallego, M.S. When the river does not naturally flow: A case study of unsustainable management in the Tagus River (Spain). Water Int. 2020, 45, 189–221. [Google Scholar] [CrossRef]
- Larraz, B.; San-Martin, E. A tale of two dams: The impact of reservoir management on rural depopulation in Central Spain. Water Resour. Manag. 2021, 35, 4769–4787. [Google Scholar] [CrossRef]
- European Parliament; Council of the European Union. Water Framework Directive. Directive 2000/60/EC of the European Parliament and of the Council of 23 October 2000 establishing a framework for Community action in the field of water policy. Off. J. Europ. Comm. 2000, L327, 1–73. [Google Scholar]
- Ai, J.; Ma, Z.; Xie, X.; Huang, T.; Cheng, H. Optimization of ecological reservoir operation rules for a northern river in China: Balancing ecological and socio-economic water use. Ecol. Indic. 2022, 138, 108822. [Google Scholar] [CrossRef]


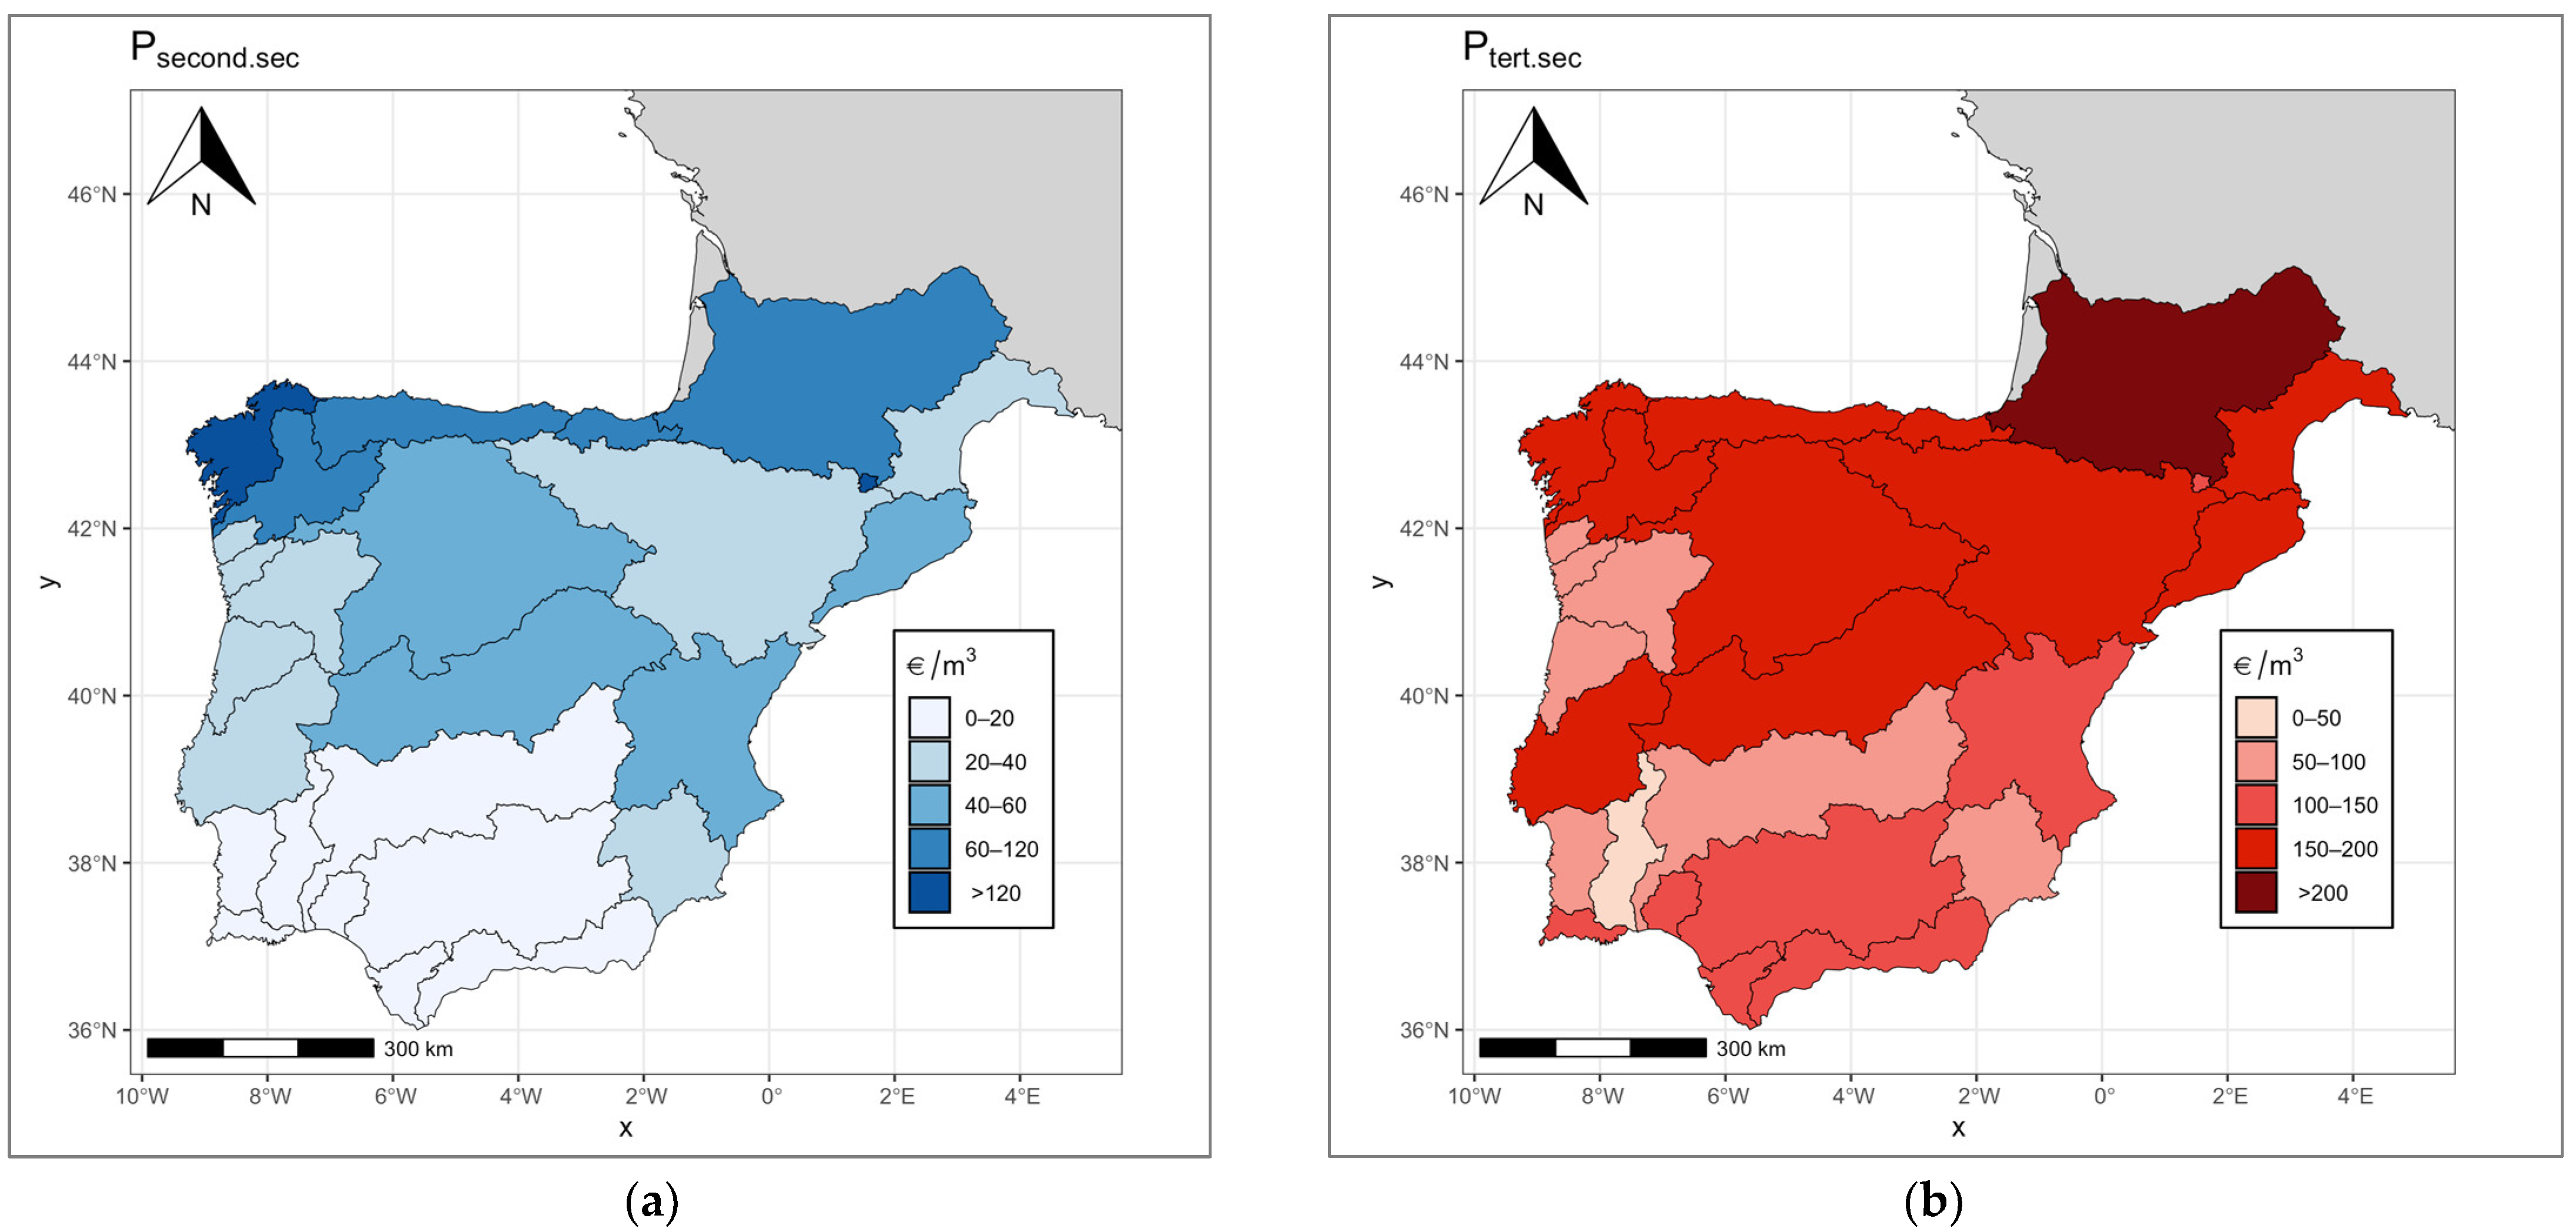


| Basic Statistics | Pprim.sec | Psecond.sec | Ptert.sec |
|---|---|---|---|
| Mean (EUR/m3) | 6.11 | 47.98 | 131.06 |
| Median (EUR/m3) | 3.05 | 36.42 | 123.65 |
| Standard deviation (EUR/m3) | 6.70 | 38.88 | 45.60 |
| Coefficient of variation | 1.10 | 0.81 | 0.35 |
| Basic Statistics | Pagr | Pagr_a | Pagr_b | Pagr_c | Pagr_d |
|---|---|---|---|---|---|
| Mean (EUR/m3) | 0.38 | 3.41 | 0.38 | 2.45 | 0.76 |
| Median (EUR/m3) | 0.34 | 1.55 | 0.34 | 0.78 | 0.47 |
| Standard deviation (EUR/m3) | 0.18 | 7.47 | 0.32 | 6.22 | 1.20 |
| Coefficient of variation | 0.48 | 2.19 | 0.86 | 2.54 | 1.58 |
| Basic Statistics | Iprim.sec | Isecond.sec | Itert.sec |
|---|---|---|---|
| Mean (m3/employee) | 7583.33 | 1711.35 | 397.78 |
| Median (m3/employee) | 6240.15 | 1022.44 | 349.69 |
| Standard deviation (m3/employee) | 6092.16 | 1700.01 | 170.97 |
| Coefficient of variation | 0.80 | 0.99 | 0.43 |
Disclaimer/Publisher’s Note: The statements, opinions and data contained in all publications are solely those of the individual author(s) and contributor(s) and not of MDPI and/or the editor(s). MDPI and/or the editor(s) disclaim responsibility for any injury to people or property resulting from any ideas, methods, instructions or products referred to in the content. |
© 2024 by the authors. Licensee MDPI, Basel, Switzerland. This article is an open access article distributed under the terms and conditions of the Creative Commons Attribution (CC BY) license (https://creativecommons.org/licenses/by/4.0/).
Share and Cite
Larraz, B.; García-Rubio, N.; Gámez, M.; Sauvage, S.; Cakir, R.; Raimonet, M.; Pérez, J.M.S. Socio-Economic Indicators for Water Management in the South-West Europe Territory: Sectorial Water Productivity and Intensity in Employment. Water 2024, 16, 959. https://doi.org/10.3390/w16070959
Larraz B, García-Rubio N, Gámez M, Sauvage S, Cakir R, Raimonet M, Pérez JMS. Socio-Economic Indicators for Water Management in the South-West Europe Territory: Sectorial Water Productivity and Intensity in Employment. Water. 2024; 16(7):959. https://doi.org/10.3390/w16070959
Chicago/Turabian StyleLarraz, Beatriz, Noelia García-Rubio, Matías Gámez, Sabine Sauvage, Roxelane Cakir, Mélanie Raimonet, and José Miguel Sánchez Pérez. 2024. "Socio-Economic Indicators for Water Management in the South-West Europe Territory: Sectorial Water Productivity and Intensity in Employment" Water 16, no. 7: 959. https://doi.org/10.3390/w16070959
APA StyleLarraz, B., García-Rubio, N., Gámez, M., Sauvage, S., Cakir, R., Raimonet, M., & Pérez, J. M. S. (2024). Socio-Economic Indicators for Water Management in the South-West Europe Territory: Sectorial Water Productivity and Intensity in Employment. Water, 16(7), 959. https://doi.org/10.3390/w16070959