Article

Using the Hydraulic Properties of Zeolite to Grow Desert Willow—A Case Study to Rehabilitate Riparian Areas of Semi-Arid Environments

by
Juan C. Solis
1,2,*,
A. Salim Bawazir
1,2 and
Aldo R. Piñon-Villarreal
2,3
1
Department of Civil Engineering, New Mexico State University, MSC 3CE, P.O. Box 30001, Las Cruces, NM 88003, USA
2
ReNUWIt Engineering Research Center, Stanford University, Stanford, CA 94305, USA
3
David L. Hirschfeld Department of Engineering, Angelo State University, San Angelo, TX 76909, USA
*
Author to whom correspondence should be addressed.
Water 2024, 16(7), 932; https://doi.org/10.3390/w16070932
Submission received: 26 February 2024 / Revised: 19 March 2024 / Accepted: 21 March 2024 / Published: 23 March 2024

Abstract

:
Plants in riparian areas are well known for their beneficial functions such as providing biodiverse habitats, maintaining water quality, and stabilizing streambanks. However, riparian plants are declining in semi-arid environments due to long-term drought, a decline in groundwater table, and an increase in soil salinity. A new technique using clinoptilolite zeolite (CZ) as a wicking material with minimum artificial irrigation to grow desert willow [Chilopsis linearis (Cav.) Sweet] under field conditions is introduced; desert willow is native to riparian regions of the southwestern United States. For this study’s experiment, desert willow seedlings were planted in boreholes filled with clinoptilolite zeolite (CZ) as a substrate and in situ riparian sandy loam soil (RS) as a control. The boreholes extended to the groundwater table at two distinctive depths, shallow (avg. depth = 1.21 m) and deep (avg. depth = 2.14 m). The plants’ viability was then assessed by measuring their midday water potential (Ψmd) as an indicator of water stress. There was no significant difference in Ψmd (p > 0.05) between the plants grown in CZ and RS (mean Ψmd = −0.91 vs. −0.81 MPa) where the groundwater was shallow and a significant difference (mean Ψmd = −0.75 vs. −2.03 MPa) where the groundwater was deep. The proposed method is promising as an alternative method for growing desert willow or other plants for riparian rehabilitation with no artificial irrigation. However, its effectiveness depends on groundwater being accessible at the base of the boreholes used for planting.

1. Introduction

Riparian zones can be defined as strips of vegetation near bodies of water (i.e., streams, rivers, lakes, and drainage canals, among other water bodies) and considered as one of “the most valuable ecosystems on the earth”, as stated by Singh et al. [1]. Many have described riparian zones as havens of biodiversity [2]. Riparian vegetation by a streamside serves multiple benefits, including but not limited to the moderation of the water temperature of adjacent water bodies in order to provide biodiverse habitats for terrestrial and aquatic species and their prey, maintaining water quality by reducing suspended solids and filtering nutrient inputs to the stream, and the stabilization of streambanks in order to reduce soil erosion [2,3,4,5,6]. Despite the beneficial role of riparian zones in sustaining a healthy environment for lakes, rivers, and canals, plants in these zones are slowly disappearing [1,7]. Their disappearances are, in part, related to prolonged droughts, the canalization of rivers and ephemeral water systems, declines in the groundwater table, increases in soil salinity, and biological invasion. To help reestablish riparian lands and prevent them from further decline, several methods have been implemented, which include seeding, stem cuttings, and propagation [8,9,10,11]. However, some of these methods can be labor-intensive and expensive, with little or no success [9], and require the availability of water for irrigation. A method that has shown some success in the riparian areas of the Rio Grande Valley in NM, USA, is the deep planting of tree stems [9]. Long stems from cottonwood trees were planted up to depths of 2.4 m. The deep planting technique ensured the plant roots were in contact with the groundwater capillary fringe to root and grow [11].
Although there is vegetation in riparian areas where the groundwater table is deep and capillary rise is insufficient, they can be susceptible to desiccation. A method has been proposed using clinoptilolite zeolite’s (CZ) hydraulic properties as a wicking material to grow plants [12,13,14]. However, the alleviation of water stress in riparian plants using zeolite as a wicking material to grow plants is not well understood. This study aims to utilize the hydraulic properties of zeolite to assess the impact of water stress on desert willow (Chilopsis linearis (Cav.) Sweet) when planted in zeolite-filled boreholes extended to groundwater. Desert willow plants are native to the warm, arid climate of the southwestern United States and northern Mexico. They are commonly found in dry washes and along riverbanks at less than a 1524 m height above mean sea level (a.m.s.l.), where underground water is available during the entire year [15,16,17]. While desert willow performs best in well-drained soils, plants can tolerate acidic and alkaline soil conditions and grow on most soils, including clay, loam, and sand [15,16,18]. Desert willow plants are well suited for many uses, such as controlling soil erosion when planted in groups and providing cover and food for wildlife and insects. They can also be used for riparian rehabilitation projects, horticultural purposes for their attractive beautiful blooms, and enticing hummingbirds, among others [15,16,18].
Natural zeolites and their geological formations have been documented in the literature [19,20,21,22]. Clinoptilolite zeolite (CZ) is a volcanogenic sedimentary mineral. It is composed primarily of aluminosilicates in a three-dimensional crystal lattice with loosely bound cations and can hydrate and dehydrate without altering its crystal structure [22]. Dung et al. [13] showed that CZ could be used as a wicking material to raise water to 1.5 m and as an amendment to sandy soils to improve their water retention properties. Pin͂on-Villarreal et al. [14] also tested the capillary rise of CZ and riparian soils in a field experiment and compared it with a simulation model using Hydrus-1D. The simulation coincided with field measurements and indicated that the application of CZ as wicking material could be used for sustaining native vegetation in dry environments, so long as the depth to groundwater table (DGW) remained shallow (<3 m).
This study measured the midday stem water potential (Ψmd) of desert willows planted in boreholes filled with CZ and those planted in riparian sandy loam soil (RS) during the growing season of 2016. It was hypothesized that: (i) the desert willows planted in boreholes filled with CZ under field conditions would exhibit less water stress than those planted in riparian sandy loam soils (RS), and (ii) the water stress in the desert willow would increase as the depth to groundwater table increased in both CZ and RS, but the stress would be more pronounced in RS.

2. Materials and Methods

2.1. Study Location and Experimental Setup

The study site was located within the Stanford Engineering Research Center for Reinventing the Nation’s Urban Water Infrastructure (ReNUWIt) riparian research Test-Bed at Sunland Park, New Mexico. The ReNUWIt Sunland Park Test-Bed covers an area of 9 hectares and is situated at the intersection of the Nemexas earthen drainage canal and the Rio Grande, near the border of Sunland Park, New Mexico, and El Paso, Texas (Latitude: 31°50′16.1″ N, Longitude: 106°36′36.8″ W, elevation: 1145 m above mean sea level). (See Figure 1).
The drainage canal starts near Chamberino, New Mexico and runs for about 35 km, intercepting irrigation drainage water, a high groundwater table at some locations, and flood runoff during rainfall events, and empties its water into the Rio Grande. The drain crosses underneath the Rio Grande at the study site by way of a 2.4 m diameter concrete culvert and eventually empties into the meandering part of the Rio Grande downstream on the El Paso, Texas, side. The site was cleared of a dense thicket of saltcedar (Tamarix ramosissima Ledeb. [Tamaricaceae]) and the topography of the land was altered to create a mild slope towards the canal for flood control.
The climate of the study site is typical of a semi-arid environment, where the average rainfall within the region is 200–230 mm according to Malm [23]. Most of the precipitation occurs from July through September monsoon season. The climate data by Malm [23] near the study site reported monthly minimum and maximum mean temperatures ranging from −3.3 °C to 34.5 °C, with, however, records of extreme high temperatures sometimes reaching greater than 37.8 °C.
The experiment design included two plots named DGW1 and DGW2, 83 m long by 24 m wide each. The plots were selected based on the depth to groundwater (DGW) from the ground surface, where the average DGW was 1.21 m for the DGW1 plot and 2.14 m for the DGW2 plot. The ground surface topography (i.e., elevation) was altered to achieve the two different DGWs. The DGW was monitored using 5.08 cm (2 inch) screened polyvinyl chloride (PVC) piezometers (Rodgers and Co., Inc., Albuquerque, NM, USA) installed in each of the plots. The electrical conductivity and pH of the groundwater were measured using the SensionTM5 conductivity meter and model HQ30D pH meter (HACH® Company, Loveland, CO, USA).
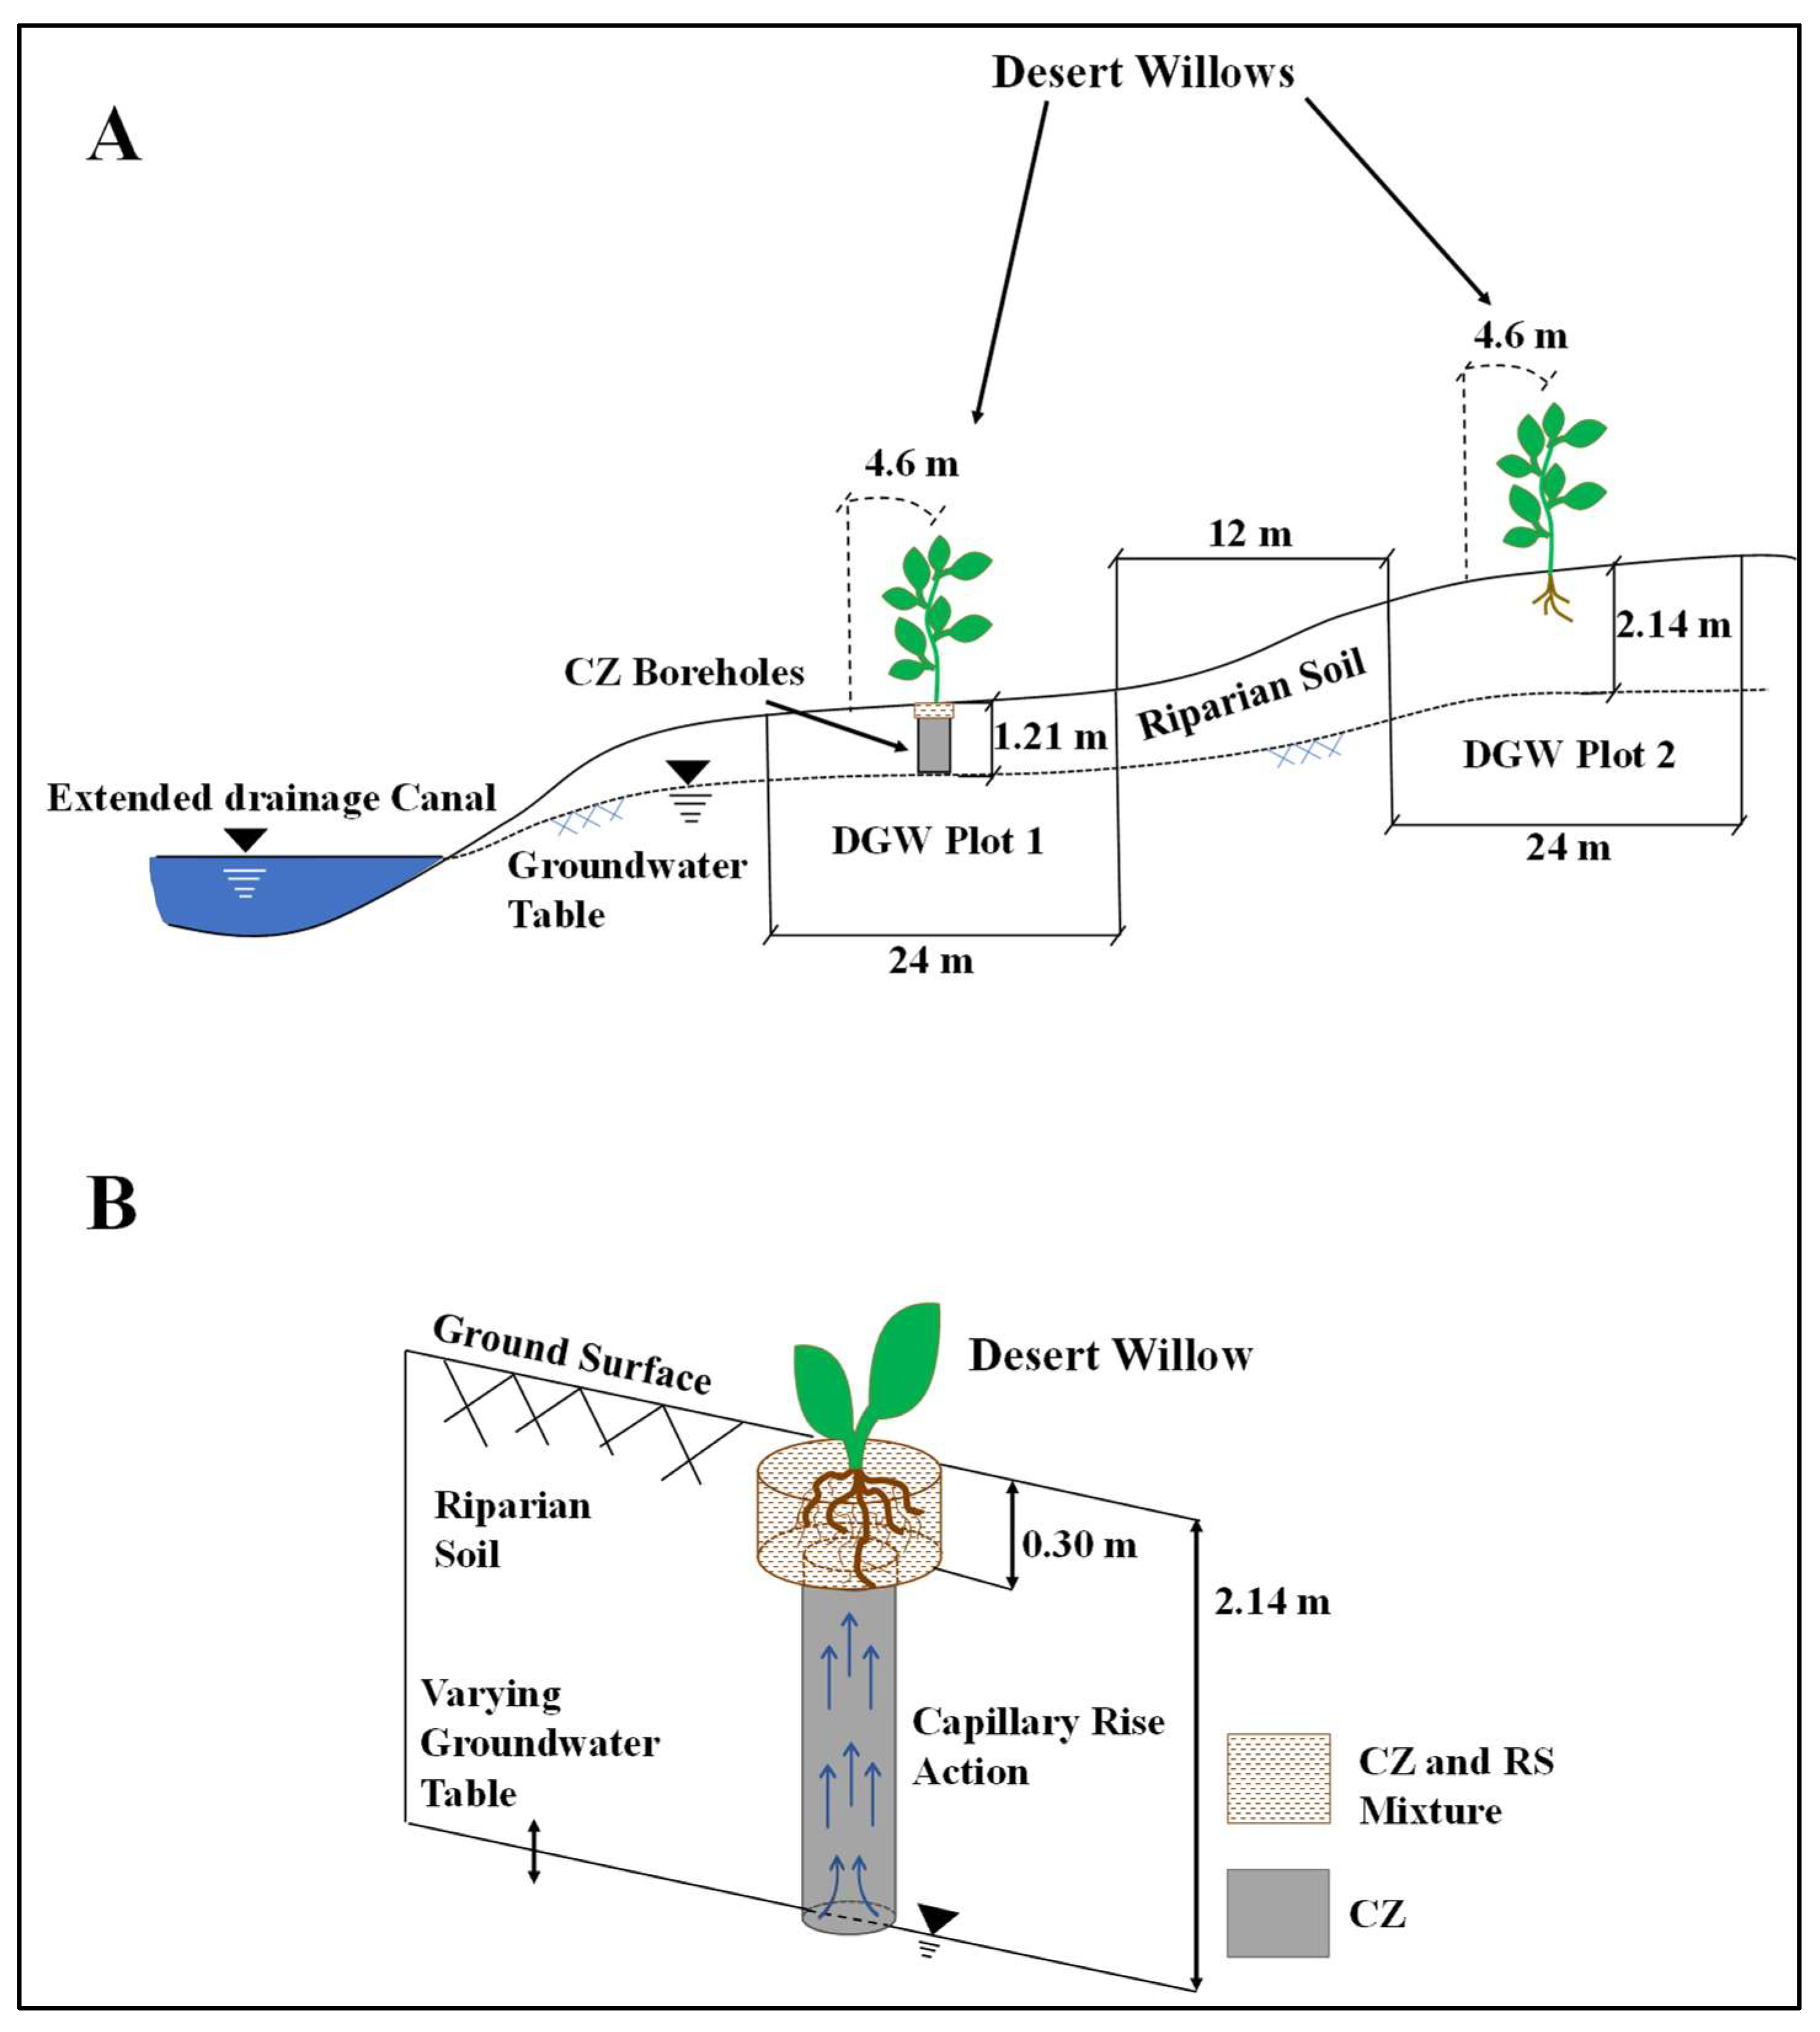
The two plots were separated 12 m apart, as shown in Figure 1 and Figure 2A. Two treatments of CZ (8 trees) and in situ riparian sandy loam soils (RS) (8 trees) were applied within each plot, with a total of 32 trees in the two plots. In DGW1, four plants in each treatment were staggered as RS-CZ-RS-CZ and in DGW2 as CZ-RS-CZ-RS. Sixteen boreholes were dug 4.6 m apart in each plot using a handheld auger with a 7.62 cm diameter until the groundwater was reached and then filled with CZ to within 30 cm below the ground surface (Figure 2). For the wicking process to work, it was ensured that the CZ was in contact with the groundwater with no air pockets within the filling material. Approximately 6 L of water was poured into the borehole until it was filled up to 30 cm below the ground surface. The top 30 cm of each borehole was then expanded to about 20 cm in diameter to accommodate the plant roots. The top 30 cm of the borehole was then backfilled with a mixture of CZ and RS at a volume ratio of 1:1 to inoculate inert CZ with in situ beneficial microorganisms (Figure 2B). The RS soil profile within the plots was determined as uniform based on multiple drillings using an auger to the groundwater table within the plots. The RS planting locations within each plot were left intact to reduce soil disturbance (compaction and porosity) and maximize the capillary rise under natural conditions.
The CZ-filled boreholes were left for a week to let the water wick to the surface before planting. After a week, a hole was dug where the CZ and RS were mixed to accommodate the plant roots in the CZ-filled boreholes for planting the trees. Similarly, a hole of 20 cm in diameter and 30 cm in depth was dug for RS. The plants in RS were also separated by 4.6 m. The salt and sodicity of RS were checked by taking several soil samples and testing them at a certified laboratory (AgSource Laboratories, Lincoln, NE, USA). The AgSource Laboratory uses a 1:1 soil/water slurry method for electrical conductivity and a saturated soil paste method for sodium adsorption ratio (SAR). The average electric conductivity (EC) of RS collected from the top 60 cm of the in situ soil was 2.5 dS/m and its SAR was 4.4. Meanwhile, the EC was 0.95 dS/m, with an SAR of 1.48 for CZ (St. Cloud Mining company, Winston, NM, USA). The ECs and SARs were determined as acceptable for growing the desert willow plants [24].
The CZ used in this experiment was mined in the USA at Winston, New Mexico, by the St. Cloud Mining Company. The company classified the CZ following the ASTM D392 method as medium coarse with a mesh size of 14 × 40 (sieved through a screen size of 1.4 mm and retained on a screen size of 0.42 mm). The bulk density of CZ was 0.78 g/cm3. Zeolite was purchased in 18.14 kg (40 lb) bags, with each bag containing a volume of 0.023 m3. About 0.7 of a bag (0.015 m3) was used for the deep boreholes (2.44 m) and 0.43 of a bag (0.01 m3) for the shallow boreholes (1.51 m). All the boreholes extended to approximately 30 cm below the water table. A total of 10 bags of CZ, including minor spills and borehole size adjustments, were used for all the 16 CZ boreholes in the DGW1 and DGW2 plots. The cost per bag was USD 5.00, a total of USD 50 for the ten bags. The cost of CZ can be relatively inexpensive at a discount rate when purchased in bulk (i.e., $ USD/Ton). It is essential to note that the costs of USD 50 do not account for labor costs and the cost of transporting material to the field site. The total cost will, therefore, vary depending on the restoration project location.
Desert willow seedlings in one-gallon tree pots (10 cm × 10 cm × 36 cm) about 92 cm tall were purchased from Los Lunas Plant Material Center, Los Lunas, NM, USA, (LLPMC). The propagation of riparian plants at the LLPMC is described in detail by Dreesen et al. [25]. The tree pots with plants were dipped in water in order to empty the plants with ease without damaging the roots, and they were then placed in the holes and covered with dug soils. The soil surrounding the plants was compacted slightly and then irrigated with 20 L of water once a week for a month and then once a month for the entire growing season of 2015, until the plants were fully established. No irrigation or fertilizer was applied after all the plants were established. The plants had grown as bushes to about 1.4 m tall when the stem measurements started. In each plot, 4 out of 8 plants in CZ and in RS, respectively, were randomly selected for Ψmd measurements.

2.2. Stem Water Potential and Climate Measurements

Water stress in desert willows was monitored by measuring their midday stem water potential (Ψmd). Ψmd is widely recognized as one of the most reliable physiological parameters for assessing the moisture status of plants [26,27,28,29]. Numerous studies have demonstrated that Ψmd serves as a superior indicator of water deficit due to its direct correlation with plants’ physiological changes [27,28,30,31]. Midday Ψmd is particularly sensitive to variations in a plant’s water status compared to other water status measurements [31], such as leaf water potential (Ψleaf) and predawn leaf water potential (Ψpd). Ψmd measurements are typically conducted at midday, when water demand and photosynthesis are at their peak. Prior to measurement, leaves are enclosed in foil bags while still attached to the plant for approximately 1 h. This process allows the water potential of the leaves inside the bag to equilibrate with the water potential of the stem by temporarily halting photosynthesis and water loss within the leaves [30,32].
The Ψmd of the desert willows was measured every 3 to 4 weeks from June through to November, when the leaves were fully expanded, until they were senesced using a pressure chamber (Model 1000 by PMS Instrument Co., Albany, OR, USA) following procedures described by Deb et al. [30]. In total, 3 stems from 4 randomly selected plants were initially selected from each treatment (CZ and RS) within each plot (DGW1 and DGW2) and covered with 14 cm × 23 cm aluminum foil bags. As the number of stems from the selected plants decreased over time, only two stems instead of three were selected for the measurements. Leaflets inside the tightly secured aluminum bags were left for an hour to allow the leaf matric potential to equilibrate with that in the stem and stop transpiration. After one hour of equilibration, the stems were cut from the plants using sharp hand pruners and immediately placed inside the pressure chamber to measure the stem water potential. Compressed nitrogen gas was released slowly into the chamber until a drop of sap appeared on the edge of the shoot. The amount of pressure applied to the chamber at this point was recorded as Ψmd. All measurements were conducted between 1200 HR and 1400 HR Mountain Standard Time in mid-afternoon.
Weather data, including precipitation, ambient temperature, and relative humidity, were measured hourly by the Sunland Park weather station (Figure 1) in the study site. The demand for moisture in the air or vapor pressure deficit (VPD), the difference between the saturated and actual vapor pressure, was calculated following Allen et al. [33] using air temperature and relative humidity. Evapotranspiration (ET) referenced to a short crop (ETSO) was calculated using the American Society of Civil Engineers (ASCE) standardized reference (ETSZ) equation [34]. The ETso serves as a good indicator of the potential ET.

2.3. Statistical Analysis

Statistical analyses of the midday Ψmd were conducted using SPSS Statistics (version 28) software® (IBM Corp., Armonk, NY, USA). The results from an analysis of variance (ANOVA) using the Tukey–Kramer Test [35] for an unequal number of sizes were used to determine if there were any statistical differences in the Ψmd among the plants grown in the CZ and RS treatments and DGW1 and DGW2 plots at p < 0.05. A non-parametric test was also applied using the Mann–Whitney–Wilcoxon (MWW) method [36]. This method compared the mean ranks from paired distributions of the Ψmd measurements from the CZ and RS treatments at p < 0.05. The MWW method was applied to provide additional confirmation of significant differences among the treatments and DGW plots.

3. Results

3.1. Climate

The climate of the region was drier than normal in 2016. The annual rainfall measured in the study site by the weather station was only 119 mm, or 60% of the average (200 mm) (Table 1). Of the annual rainfall measured, 57% (68 mm) occurred from July to September in the monsoonal season. The monsoonal season in New Mexico occurs during the summer months from July to September due to moisture coming from the Gulf of Mexico leading to local high-intensity storms, as described by Sheppard et al. [37] and Malm [23]. Very little or no rainfall (19% or 23 mm) occurred during the early part of the growing season (i.e., January–June). The warm months of May and June received a total of 5 mm only.
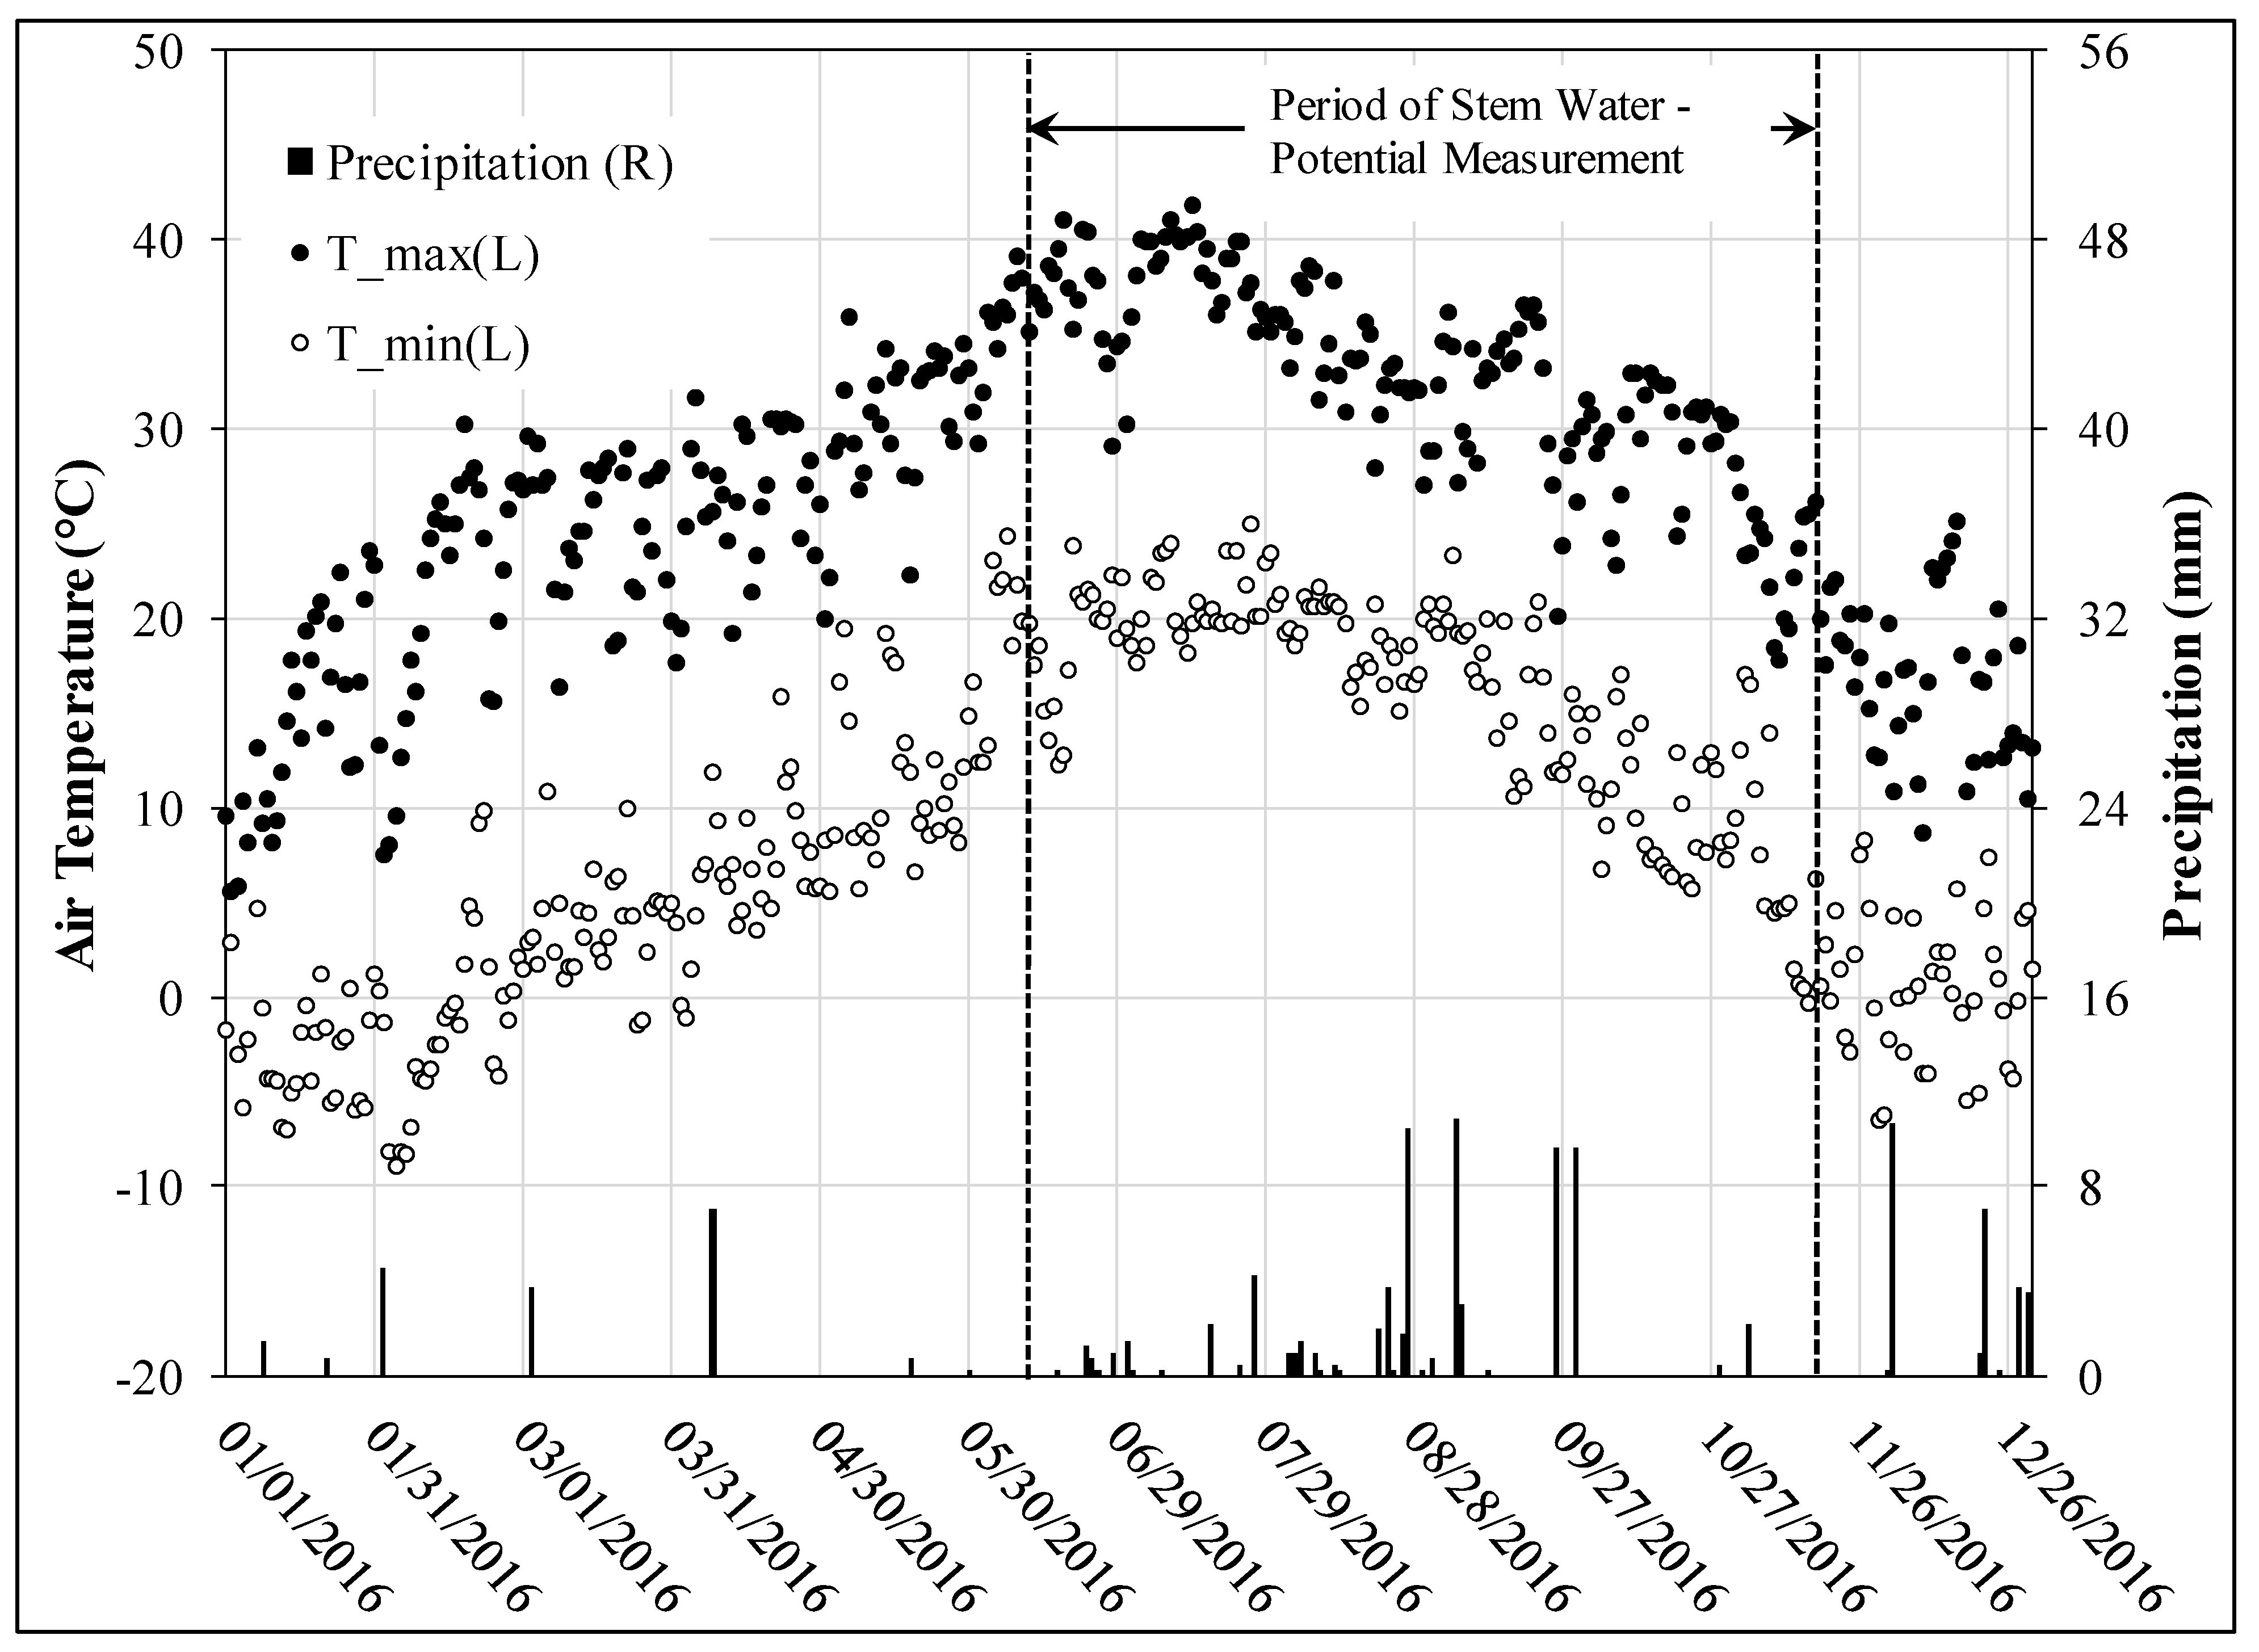
Most of the extremely high ambient temperatures in the study site occurred from June through to August. For example, the daily maximum ambient temperature from June to August exceeded 35 °C for a total of 29 days, with 9 days exceeding 40 °C (Figure 3). The average hourly temperature and relative humidity during the Ψmd measurements were 33.9 °C and 24%, respectively, with the hourly VPD ranging from 3.37 to 4.89 kPa. During June and September, the daily VPD ranged from 2.20 to 3.29 kPa, indicating ample demand for moisture in the air. The monthly ETSO ranged from 144 to 218 mm during the same period, peaking in the middle of the growing season and later declining as the season progressed (Table 1).

3.2. Groundwater

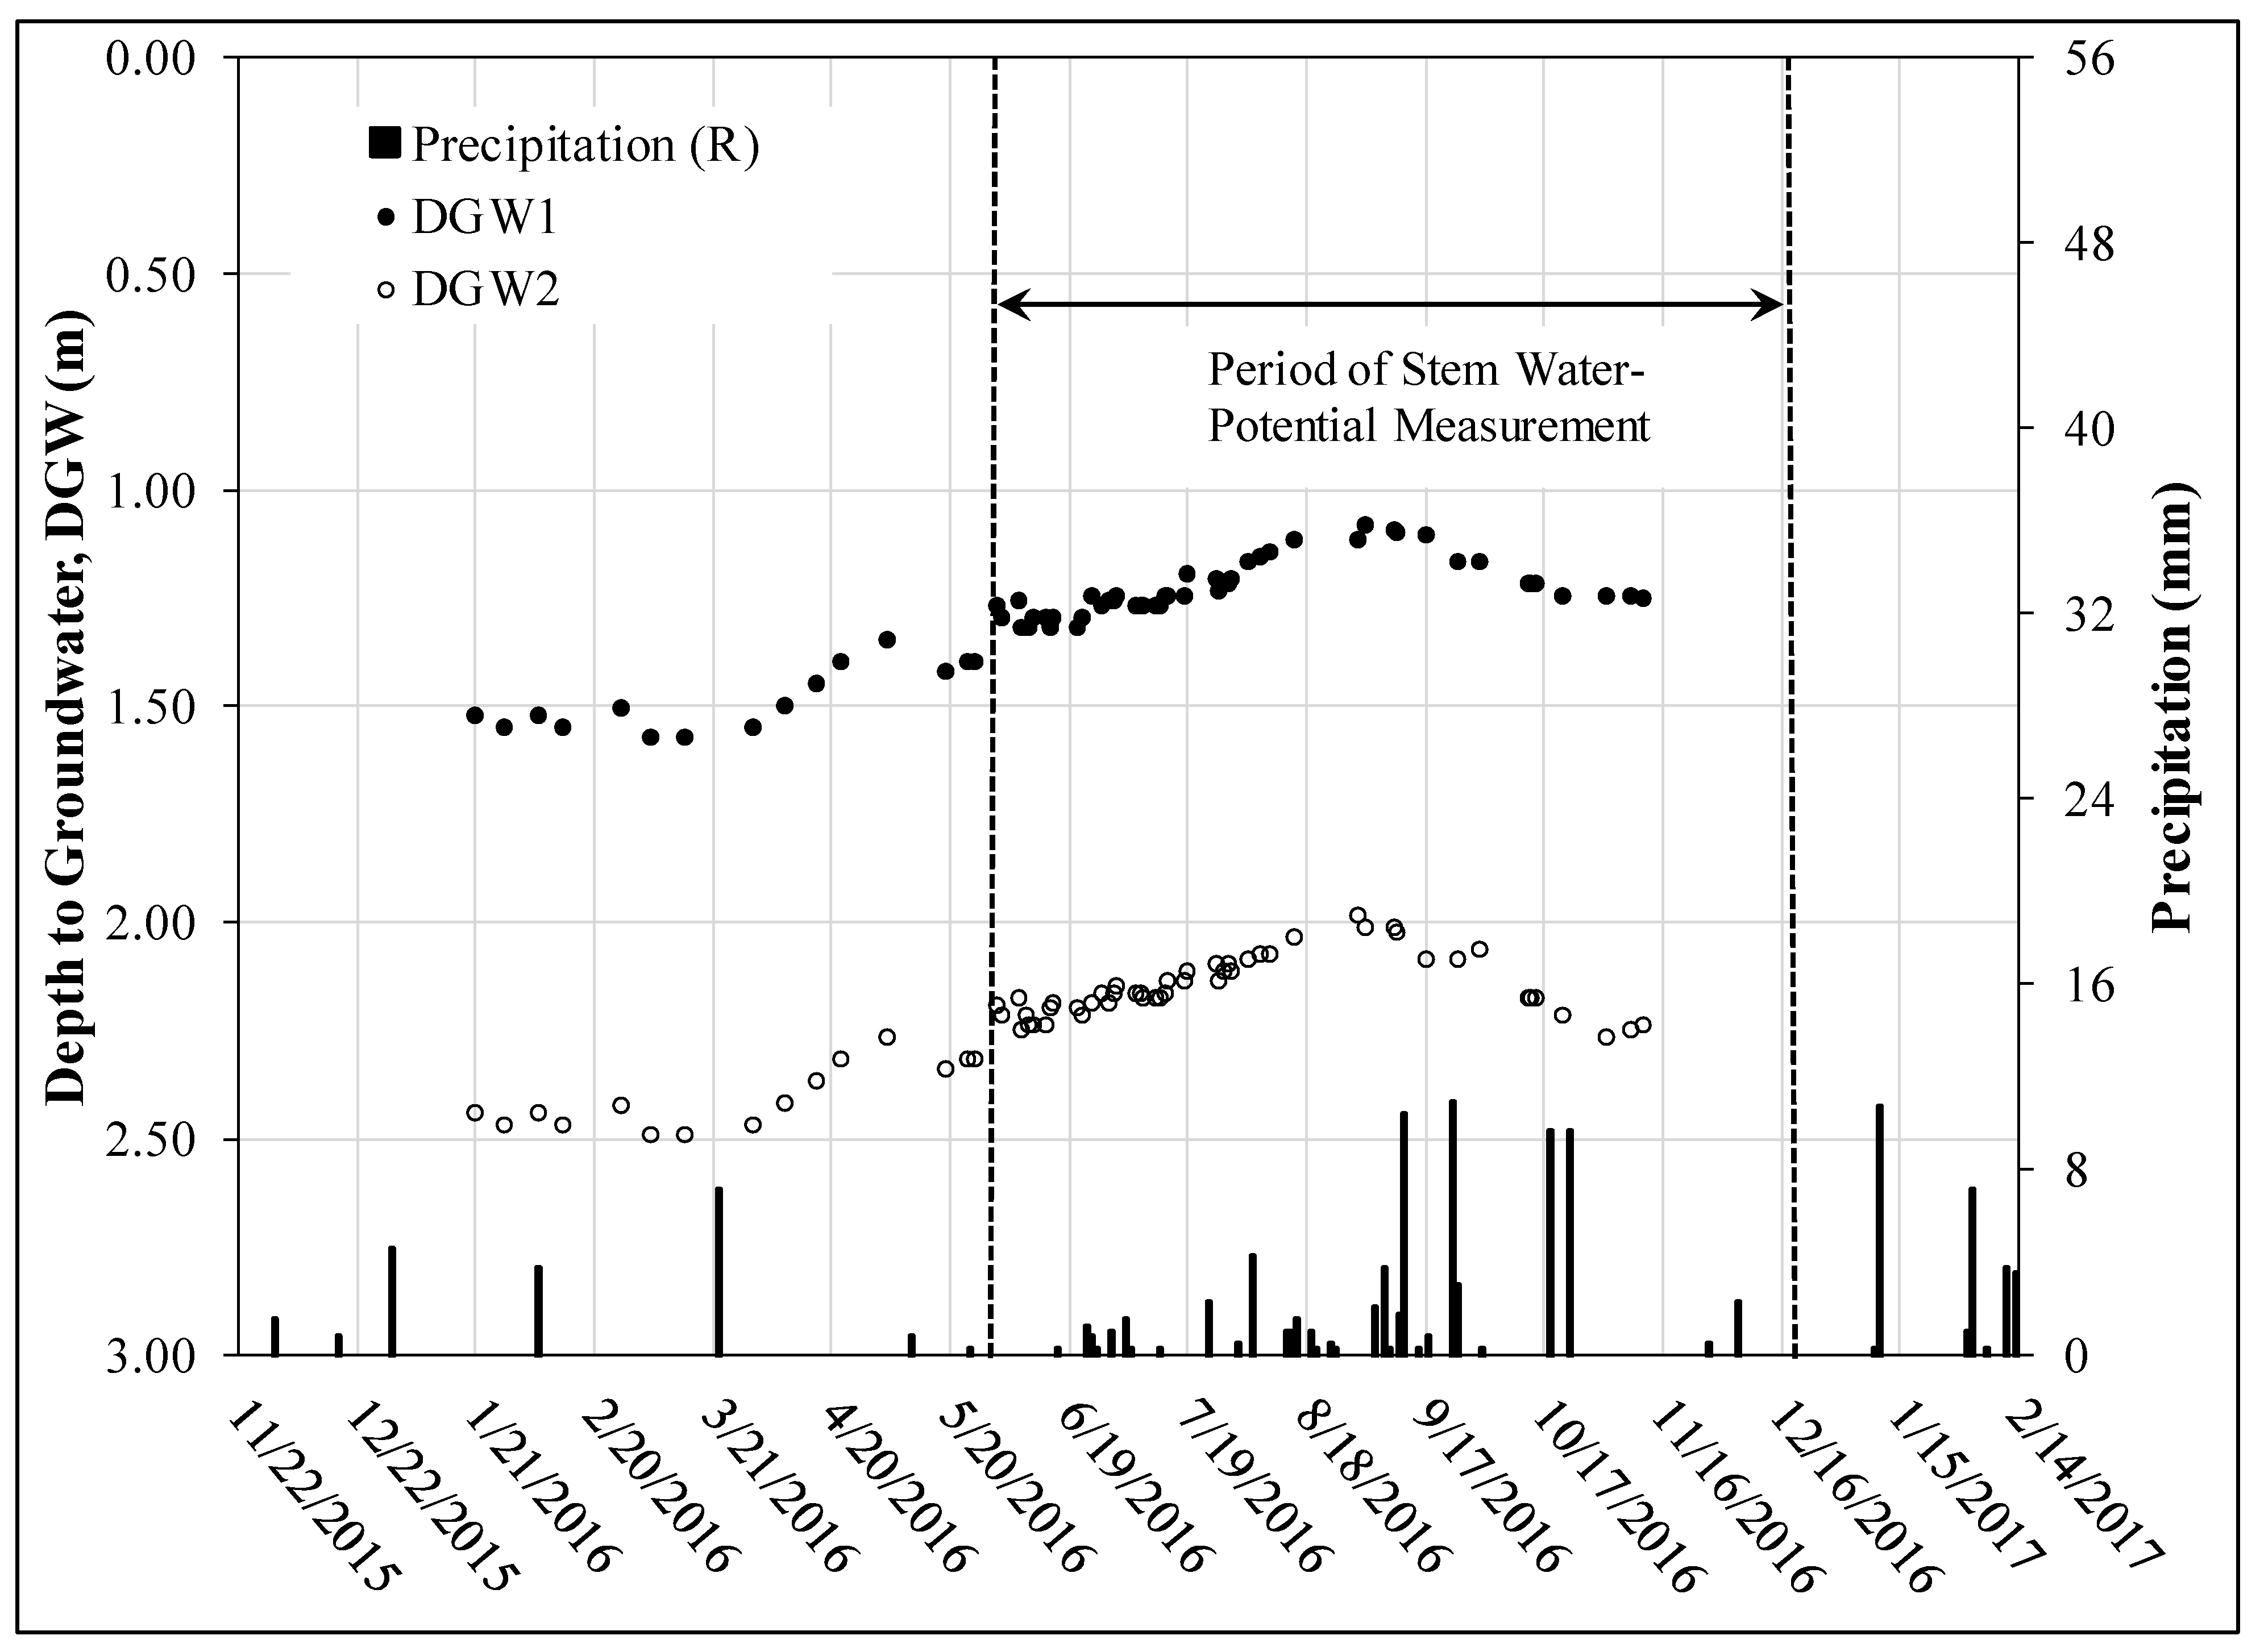
The daily mean depth to groundwater (DGW) during the Ψmd measurements ranged from 1.1 m to 1.6 m and 2.0 to 2.5 m in the DGW1 and DGW2 plots, respectively (Figure 4). The average DGW during the Ψmd measurements in DGW1 was 1.21 m and in DGW2 was 2.14 m. During the monsoon rainy season, which lasts from July to September, the DGW decreased due to rainfall infiltration, as shown in Figure 4. The EC of the groundwater ranged from 1.58 to 3.77 dS/m, with an average pH of 7.4.

3.3. Stem Water Potential

The Ψmd data were collected during the growing season from June through to November. The growing season in New Mexico starts in March and ends in November. The desert willow leaves started to emerge in late March, were fully expanded in June, and started senescing during the third week of November. The Ψmd values of the desert willow plants in CZ and RS measured in DGW plots 1 and 2 are shown in Figure 5.
The daily Ψmd means for the plants grown in RS in DGW1 were −0.99 and −0.85 MPa measured in June, and −1.06 MPa in July. In comparison, the daily Ψmd means for the plants in RS in DGW2 were −1.82 and −2.25 MPa measured in June, and −2.43 MPa in July. The plants in RS in DGW2 lost vigor and eventually died at the end of July, so no measurement could be recorded. No statistical differences in Ψmd using the Turkey–Kramer test were observed among the plants growing in the RS and CZ of DGW1 and CZ of DGW2 during the pre-monsoonal warm season (Table 2). However, a significant difference was observed in the plants growing in the RS of DGW2 (mean Ψmd = −2.03 ± 0.170 at F3, 136 = 74.333, p < 0.05). The daily Ψmd means of the plants in the CZ and RS of DGW1 and CZ of DGW2 were low during the post-monsoonal season. Meanwhile, similar results were observed using a non-parametric test (Table 3). Paired distributions among the treatments indicated significant differences between RS2 and other treatments (i.e., RS1, CZ1, and CZ2, p < 0.001). Some differences were also noted between treatments, such as RS1 versus CZ1 (p = 0.032) and CZ1 versus CZ2 (p = 0.006), which may be attributed to the slightly higher Ψmd during August.

4. Discussion

The desert willows planted in CZ exhibited less water stress (less negative Ψmd) than those planted in RS under field conditions, where the DGW fluctuated between 2 and 2.5 m, with an average of 2.14 m during the year. The CZ successfully wicked water to the roots of the plants and alleviated water stress during the warm and dry months of the season, with no artificial irrigation after the plant seedlings were established. The Ψmd measurements responded to the effects of soil moisture, air temperature, and VPD. Similar responses were also observed by De Swaef et al. [28] in young apple tree cultivars (Malus domestica Borkh. ‘Matsu’ and ‘Cox Organe’) and Deb et al. [30] and Othman et al. (2014) [31] in pecans [Carya illinoinensis (Wangenh.) K. Koch]. The VPD is a good indicator of the air’s dryness or the air’s ability to accept water vapor from evapotranspiration or precipitation. During the stem potential measurements between 1200 HR and 1400 HR, the ambient temperature averaged above 30 °C and the relative humidity ranged from 19% to 30% from June to August. Concurrently, the average VPD during the measuring period ranged from 3.37 to 4.89 kPa from June to August during the peak of the growing season, and then declined to a range from 1.37 kPa to 2.26 kPa as the season progressed. The plants growing in the CZ of DGW2 did not exhibit high water stress (Ψmd ranged from −0.82 to −1.12 MPa), despite a high VPD in the summer months (VPD ranging from 2.20 to 3.29 kPa), high evapotranspiration (ETSO ranging from 144 to 218 mm), and photosynthesis rates. This was primarily due to the availability of moisture wicked by CZ to the plant root zone.
In contrast, the plants in the RS of DGW2 exhibited high water stress exceeding −2.75 MPa. The soil was very dry (6% volumetric water content) due to low amounts of precipitation (12.7 mm from June to July). Eventually, the plants died from desiccation, since they could not access the groundwater. Meanwhile, the volumetric moisture content in DGW1 for RS was higher (15%) than in DGW2. The plant roots were within the groundwater capillary fringe, allowing them to survive.
According to Depree and Ludwig [38], during an excavation study at Jornada Bajada Site Desert Biome in New Mexico, the tap-roots of desert willow plants were observed to extend up to 1.6 m, with the highest percentages of root biomass (72%) observed in the topsoil layer from 0 to 0.4 m, 18% from 0.4 to 0.8 m, 8.6% from 0.8 to 1.2 m, and 1.4% at a 1.4 to 1.6 m depth. A high percentage of the root biomass in the topsoil layer subjects the desert willow plants to high evaporation loss from the topsoil, making them more vulnerable to desiccation. The desert willow plants in this study did not show water stress when planted in an area where the groundwater was shallow (i.e., 1.21 m). In this case, the use of CZ is not necessary, since the plants had access to the groundwater capillary fringe and water table. An increase in the volumetric soil moisture content from 6% to 17.5% during the rainy monsoon season alleviated the stress in the plants. Those plants that survived in the CZ and RS of DGW1 and CZ of DGW2 continued to flourish and looked healthy when inspected visually. Clinoptilolite zeolite as a wicking material is promising for use as an alternative method to grow plants that are physiologically similar to desert willow (e.g., cottonwood (Populus fremontii S. Wats), black willow (Salix nigra Marsh.), giant sacaton (Sporobolus wrightii Munro ex Scribn.), and seep willow (baccharis salicifolia (Ruiz & Pav.) Pers.) in riparian or other restoration projects where the groundwater table is, at most, 2.5 m. The water stress in other plants growing in CZ, however, is yet to be tested.
Meanwhile, the mean Ψmd values measured in the CZ and RS of DGW1 and CZ of DGW2 are comparable to those reported by Odening et al. [39]. Odening et al. [39] conducted a field study where the predawn water potentials (Ψpd) were measured for three plant species, including desert willow. They found that Ψpd values ranging from −1.4 to −1.7 MPa did not affect photosynthesis in the desert willow. The Ψpd reflects the plant water status after plants have recovered from the previous day’s conditions, but it does not reflect the water status during their maximum water demand, like Ψmd [32]. However, the variability caused by light exposure and temperature is reduced by taking measurements at dawn. In a separate study, Odening et al. [39] exposed desert willows to a dry cycle (less watering) under the controlled lighting and temperature conditions of a greenhouse. They found that, at a relatively high water potential (Ψpd = −3.5 MPa), the net photosynthesis of desert willow stopped. In comparison, some plants in the RS of DGW2 experienced high water stress, with Ψmd reaching up to −2.75 MPa. They wilted and eventually died.

5. Conclusions

The application of CZ as a wicking material to grow desert willow plants in riparian sandy soils where DGW is shallow was assessed. As an indicator of water stress, the Ψmd of the plants was measured. The CZ was able to supply water to the desert willow plants without irrigation where the DGW ranged between 2 and 2.5 m (average = 2.14 m). A slight fluctuation in DGW from 2.14 m did not make much difference in plant water stress (i.e., Ψmd). However, the plants would eventually desiccate if a decline in DGW in this study was to exceed 2.5 m, because the CZ would lose contact with the groundwater table and cutoff the capillary rise. The desert willow plants in the RS of DGW2 did not survive at the same groundwater table (2.14 m) as in CZ. The success of utilizing CZ to grow plants is contingent on the groundwater availability at the base of the boreholes used for planting.

Author Contributions

A.S.B. and J.C.S.: writing—original draft preparation; A.S.B., J.C.S. and A.R.P.-V.; A.S.B., J.C.S. and A.R.P.-V.: formal analysis; A.S.B. and J.C.S.: data curation; A.S.B., J.C.S. and A.R.P.-V.: investigation; A.S.B.: supervision; A.S.B.: funding acquisition; all authors: writing—review and editing. All authors have read and agreed to the published version of the manuscript.

Funding

This study was financially supported by the Reinventing the Nation’s Urban Water Infrastructure (ReNUWIt) Engineering Research Center, Stanford, CA (NSF-Project EEC-1028968).

Data Availability Statement

The data supporting the conclusions in this article will be made available by the authors on request.

Acknowledgments

The authors thank the National Science Foundation Engineering Research Center for Reinventing the Nation’s Urban Water Infrastructure (ReNUWIt) award no. EEC-1028968 for funding this project and Elephant Butte Irrigation District (EBID) especially Gary Esslinger, Zachary Libbin and James Phillip King for their contribution and support to make this project successful. Our extended appreciation to Richard Luthy, Nirmala Khandan, Rolston St. Hilaire and Brent Tanzy for their guidance and support throughout this project. We thank St. Cloud Mining Company, especially Joseph McEnaney for donating the CZ mineral used in the experiment. This project was made possible by the support and effort of the following students who assisted with the setup of the experiment: Ernesto Santillano, Cantekin Kivrak, Youness Bougteb, Ashley Jaramillo, Pablo Soto, John Miyagishima, and Garrett Gibson. Thanks to Kristina Macro from the State University of New York (SUNY) College of Environmental Science and Forestry, Syracuse, New York, for helping with the data collection as part of her project and Bachelor’s thesis (Macro K., 2017, Hon. Thesis) [40].

Conflicts of Interest

The authors declare no conflicts of interest.

References

  1. Singh, R.; Tiwari, A.K.; Singh, G.S. Managing Riparian Zones for River Health Improvement: An Integrated Approach. Landsc. Ecol. Eng. 2021, 17, 195–223. [Google Scholar] [CrossRef]
  2. Young-Mathews, A.; Culman, S.W.; Sánchez-Moreno, S.; Toby O’Geen, A.; Ferris, H.; Hollander, A.D.; Jackson, L.E. Plant-Soil Biodiversity Relationships and Nutrient Retention in Agricultural Riparian Zones of the Sacramento Valley, California. Agroforest Syst. 2010, 80, 41–60. [Google Scholar] [CrossRef]
  3. Lyons, J.; Thimble, S.W.; Paine, L.K. Grass versus Trees: Managing Riparian Areas to Benefit Streams of Central North America. J. Am. Water. Resour. Assoc. 2000, 36, 919–930. [Google Scholar] [CrossRef]
  4. Schaff, S.D.; Pezeshki, S.R.; Shields, F.D. Effects of Soil Conditions on Survival and Growth of Black Willow Cuttings. Environ. Manag. 2003, 31, 748–763. [Google Scholar] [CrossRef] [PubMed]
  5. McKergow, L.A.; Matheson, F.E.; Quinn, J.M. Riparian Management: A Restoration Tool for New Zealand Streams. Eco. Manag. Restor. 2016, 17, 218–227. [Google Scholar] [CrossRef]
  6. Hunter, M.L.; Acuña, V.; Bauer, D.M.; Bell, K.P.; Calhoun, A.J.K.; Felipe-Lucia, M.R.; Fitzsimons, J.A.; González, E.; Kinnison, M.; Lindenmayer, D.; et al. Conserving Small Natural Features with Large Ecological Roles: A Synthetic Overview. Biol. Conserv. 2017, 211, 88–95. [Google Scholar] [CrossRef]
  7. González, E.; Felipe-Lucia, M.R.; Bourgeois, B.; Boz, B.; Nilsson, C.; Palmer, G.; Sher, A.A. Integrative Conservation of Riparian Zones. Biol. Conserv. 2017, 211, 20–29. [Google Scholar] [CrossRef]
  8. Munshower, F.F. Practical Handbook of Disturbed Land Revegetation; CRC Press: New York, NY, USA, 2017; ISBN 9781351084376. [Google Scholar]
  9. Taylor, J.P.; McDaniel, K.C. Restoration of Saltcedar (Tamarix spp.)-Infested Floodplains on the Bosque Del Apache National Wildlife Refuge. Weed Technol. 1998, 12, 345–352. [Google Scholar] [CrossRef]
  10. Salinas, M.J.; Guirado, J. Riparian Plant Restoration in Summer-Dry Riverbeds of Southeastern Spain. Restor. Ecol. 2002, 10, 695–702. [Google Scholar] [CrossRef]
  11. Dreesen, D.R.; Fenchel, G.A. Deep-Planting Techniques to Establish Riparian Vegetation in Arid and Semiarid Regions. Nativ. Plants J. 2010, 11, 15–22. [Google Scholar] [CrossRef]
  12. Lopez, E.M. Using St. Cloud Clinoptilolite Zeolite as a Wicking Material to Sustain Riparian Vegetation. Masters’ Thesis, New Mexico State University, Las Cruces, NM, USA, 2009. [Google Scholar]
  13. Dung, T.T.; Bawazir, A.S.; Shukla, M.K.; Bandini, P. Some Hydraulic and Wicking Properties of St. Cloud Zeolite and Zeolite-Soil Mixtures. Appl. Eng. Agric. 2011, 27, 955–967. [Google Scholar] [CrossRef]
  14. Piñón-Villarreal, A.R.; Bawazir, A.S.; Shukla, M.K.; Samani, Z.A.; King, J.P. Modeling Capillary Rise in Clinoptilolite Zeolite and Riparian Soils to Sustain Vegetation in Water-Scarce Areas. J. Irrig. Drain Eng. 2017, 143, 04017044. [Google Scholar] [CrossRef]
  15. Fryer, J.L. Chilopsis Linearis, Desert Willow. Available online: www.fs.usda.gov/database/feis/plants/tree/chilin/all.html (accessed on 9 January 2024).
  16. Desert Willow Chilopsis Linearis (Cav.) Sweet, Plant Fact Sheet. Available online: https://plants.usda.gov/DocumentLibrary/plantguide/pdf/pg_chli2.pdf (accessed on 10 January 2024).
  17. Dodson, C.; Ivey, R.D. A Guide to Plants of the Northern Chihuahuan Desert; University of New Mexico Press: Albuquerque, NM, USA, 2012; ISBN 9780826350213. [Google Scholar]
  18. Gilman, E.F.; Watson, D.G. Chilopsis Linearis: Desert Willow. Available online: https://edis.ifas.ufl.edu/publication/ST159 (accessed on 20 November 2023).
  19. Breck, D.W. Zeolite Molecular Sieves: Structure, Chemistry, and Use; Wiley: New York, NY, USA, 1973; ISBN 9781523114528. [Google Scholar]
  20. Mumpton, F.A. La Roca Magica: Uses of Natural Zeolites in Agriculture and Industry. Proc. Natl. Acad. Sci. USA 1999, 96, 3463–3470. [Google Scholar] [CrossRef]
  21. Polat, E.; Karaca, M.; Demir, H.; Onus, A.N. Use of Natural Zeolite (Clinoptilolite) in Agriculture. J. Fruit Ornam. Plant Res. 2004, 12, 183–189. [Google Scholar]
  22. Eyde, T.; Holmes, D. Zeolite. In Industrial Minerals & Rocks: Commodities, Markets, and Uses; Kogel, J.E., Trivedi, N.C., Barker, J.M., Krukowski, S.T., Eds.; Society for Mining, Metallurgy, and Exploration: Littleton, CO, USA, 2006; ISBN 9780873352338. [Google Scholar]
  23. Malm, N.R. Climate Guide, Las Cruces, 1892–2000; New Mexico State University, Agricultural Experiment Station: Las Cruces, NM, USA, 2003. [Google Scholar]
  24. Miyamoto, S.; White, J.M. Foliar Salt Damage of Landscape Plant Induced by Sprinkler Irrigation; Texas Water Resources Institute TR -1202; Texas Agricultural Experiment Station, Agricultural Research and Extension Center at El Paso, Texas Water Resources Institute: El Paso, TX, USA, 2002. [Google Scholar]
  25. Dreesen, D.; Harrington, J.; Subirge, T.; Stewart, P.; Fenchel, G. Riparian Restoration in the Southwest: Species Selection, Propagation, Planting Methods, and Case Studies. In National Proceedings: Forest and Conservation Nursery Associations, 1999, 2000, and 2001; Dumroese, R.K., Riley, L.E., Landis, T.D., Eds.; U.S. Department of Agriculture Forest, Rocky Mountain Research Station: Odgen, UT, USA, 2002; pp. 253–272. [Google Scholar]
  26. Nortes, P.A.; Pérez-Pastor, A.; Egea, G.; Conejero, W.; Domingo, R. Comparison of Changes in Stem Diameter and Water Potential Values for Detecting Water Stress in Young Almond Trees. Agric. Water Manag. 2005, 77, 296–307. [Google Scholar] [CrossRef]
  27. Choné, X. Stem Water Potential Is a Sensitive Indicator of Grapevine Water Status. Ann. Bot. 2001, 87, 477–483. [Google Scholar] [CrossRef]
  28. De Swaef, T.; Steppe, K.; Lemeur, R. Determining Reference Values for Stem Water Potential and Maximum Daily Trunk Shrinkage in Young Apple Trees Based on Plant Responses to Water Deficit. Agric. Water Manag. 2009, 96, 541–550. [Google Scholar] [CrossRef]
  29. Mirás-Avalos, J.M.; Trigo-Córdoba, E.; Bouzas-Cid, Y. Does Predawn Water Potential Discern between Irrigation Treatments in Galician White Grapevine Cultivars? OENO One 2014, 48, 123. [Google Scholar] [CrossRef]
  30. Deb, S.K.; Shukla, M.K.; Mexal, J.G. Estimating Midday Leaf and Stem Water Potentials of Mature Pecan Trees from Soil Water Content and Climatic Parameters. HortScience 2012, 47, 907–916. [Google Scholar] [CrossRef]
  31. Othman, Y.; Steele, C.; VanLeeuwen, D.; Heerema, R.; Bawazir, S.; St. Hilaire, R. Remote Sensing Used to Detect Moisture Status of Pecan Orchards Grown in a Desert Environment. Int. J. Remote Sens. 2014, 35, 949–966. [Google Scholar] [CrossRef]
  32. Fulton, A.; Grant, J.; Buchner, R.; Connell, J. Using the Pressure Chamber for Irrigation Management in Walnut, Almond and Prune; University of California, Agriculture and Natural Resources: Davis, CA, USA, 2014; ISBN 9781601078582. [Google Scholar]
  33. Allen, R.G.; Pereira, L.S.; Raes, D.; Smith, M. Crop Evapotranspiration: Guidelines for Computing Crop Water Requirements; FAO irrigation and drainage paper; Food and Agriculture Organization of the United Nations: Rome, Italy, 1998; ISBN 9789251042199. [Google Scholar]
  34. Allen, R.G.; Walter, I.A.; Elliot, R.; Howell, T.; Itensfisu, D.; Jensen, M.; Snyder, R. The ASCE Standardized Reference Evapotranspiration Equation; American Society of Civil Engineers: Reston, VA, USA, 2005; ISBN 9780784408056. [Google Scholar]
  35. Kuehl, R.O.; Kuehl, R.O. Design of Experiments: Statistical Principles of Research Design and Analysis, 2nd ed.; Duxbury/Thomson Learning: Pacific Grove, CA, USA, 2000; ISBN 9780534368340. [Google Scholar]
  36. Dowdy, S.M.; Wearden, S.; Chilko, D.M. Statistics for Research, 3rd ed.; Wiley series in probability and statistics; Wiley-Interscience: Hoboken, NJ, USA, 2004; ISBN 9780471267355. [Google Scholar]
  37. Sheppard, P.; Comrie, A.; Packin, G.; Angersbach, K.; Hughes, M. The Climate of the US Southwest. Clim. Res. 2002, 21, 219–238. [Google Scholar] [CrossRef]
  38. DePree, E.; Ludwig, J.A. Vegetative and Reproductive Growth Patterns in Desert Willow (Chilopsis linearis (Cav.) Sweet). Southwest. Nat. 1978, 23, 239. [Google Scholar] [CrossRef]
  39. Odening, W.R.; Strain, B.R.; Oechel, W.C. The Effect of Decreasing Water Potential on Net CO2 Exchange of Intact Desert Shrubs. Ecology 1974, 55, 1086–1095. [Google Scholar] [CrossRef]
  40. Macro, K. Stem Water Potential in Desert Willow Grown in Clinoptilolite Zeolite and In-Situ Riparian Soil. Bachelor’s Thesis, State University of New York College of Environmental Science and Forestry, Syracuse, NY, USA, 2017. [Google Scholar]
Figure 1. Map of the United States with expanded inset showing experiment plots, DGW1 and DGW2, at ReNUWIt Sunland Park Test-Bed.
Water 16 00932 g001
Figure 2. Schematic illustration profile of: (A) desert willows planted in CZ-filled boreholes and riparian sandy loam soil (RS) within DGW plots; and (B) 3D profile view of Clinoptilolite zeolite (CZ) borehole profile surrounded by RS.
Water 16 00932 g002
Figure 3. Daily maximum (T_max) and minimum (T_min) air temperature and precipitation (R) measured by Sunland Park weather station.
Water 16 00932 g003
Figure 4. Daily mean depths from the ground surface to groundwater table measured in DGW1 and DGW2 plots. Precipitation is shown as bars.
Water 16 00932 g004
Figure 5. Midday stem water potential (Ψmd) measurements of desert willow plants grown in clinoptilolite zeolite (CZ) and riparian soil (RS); 1 and 2 represent DGW1 and DGW2 plots with their respective depths to groundwater (DGW); the standard error (SE) is shown as whiskers.
Water 16 00932 g005
Table 1. Monthly maximum (T_max) and minimum air temperature (T_min), average monthly relative humidity (RH), average monthly vapor pressure deficit (VPD), potential evapotranspiration (ETSO), and precipitation (Precip.) at ReNUWIt Sunland Park Test-Bed, NM, USA in 2016.
MonthT_maxT_minRHVPDETSOPrecip.
°C°C%kPammmm
January23.6−6.955.540.7355.82.3
February30.3−8.942.661.2683.94.6
March29.6−1.535.451.61140.43.8
April31.7−1.140.431.73158.97.1
May35.95.637.702.24202.91.0
June †41.112.339.793.05218.03.6
July †41.917.642.323.29217.39.1
August †38.615.153.792.20174.624.1
September †36.510.653.352.02143.934.3
October †33.05.849.311.89110.30.5
November †28.2−6.550.741.0876.52.3
December25.1−6.258.410.7351.826.7
Total1634.2119.4
† Period of stem water potential measurement.
Table 2. Results from ANOVA using Tukey–Kramer Test on mean midday stem water potential, Ψmd (MPa) for different treatments with corresponding depth to groundwater (DGW) plots.
DGW PlotsTreatmentN SamplesΨmd ± SE (MPa)
DGW1: 1.21 mCZ133−0.91 ± 0.046 a
RS150−0.81 ± 0.029 a
DGW2: 2.14 mCZ245−0.75 ± 0.032 a
RS212−2.03 ± 0.170 b
Note: Letters a, and b represent interaction between treatments. Same letters indicate no significant difference among treatments at p < 0.05.
Table 3. Results from non-parametric test using Mann–Whitney–Wilcoxon on mean midday stem water potential, Ψmd (MPa), for different treatments.
TreatmentN SamplesMean RanksZ-Valuep-Value
CZ13336.00−1.847 *0.032
RS15045.96
CZ13328.36−4.548 **<0.001
RS2128.25
CZ13332.03−2.499 *0.006
CZ24544.98
CZ24551.87−1.3010.097
RS15044.52
CZ24534.83−5.15 **<0.001
RS2127.13
RS15037.31−5.189 **<0.001
RS2127.29
Note: Different symbols * and ** indicate significant differences between treatments at p < 0.05 and p < 0.001, respectively.
Disclaimer/Publisher’s Note: The statements, opinions and data contained in all publications are solely those of the individual author(s) and contributor(s) and not of MDPI and/or the editor(s). MDPI and/or the editor(s) disclaim responsibility for any injury to people or property resulting from any ideas, methods, instructions or products referred to in the content.