Article

Historical Phosphorus Mass and Concentrations in Utah Lake: A Case Study with Implications for Nutrient Load Management in a Sorption-Dominated Shallow Lake

1
Department of Civil & Construction Engineering, Brigham Young University, Provo, UT 84602, USA
2
Department of Chemical Engineering, Brigham Young University, Provo, UT 84602, USA
*
Author to whom correspondence should be addressed.
Water 2024, 16(7), 933; https://doi.org/10.3390/w16070933
Submission received: 1 March 2024 / Revised: 15 March 2024 / Accepted: 20 March 2024 / Published: 23 March 2024
(This article belongs to the Section Hydrology)

Abstract

:
Utah Lake is unusual due to its large surface area, shallow depth, phosphorus-rich sediments, and well-mixed, unstratified waters. This creates conditions where water column phosphorous concentrations tend toward equilibrium, with lake sediments containing high concentrations of geologic phosphorus. To help understand the potential impact of phosphorous load reductions, we computed a time history of phosphorus mass in the lake using state and federal records of lake volume, dissolved phosphorus concentrations, and outflow. We show that historically, Utah Lake phosphorus concentrations have remained stable over time, in the range of 0.02 to 0.04 mg/L, despite large changes in lake volume and internal phosphorus mass. We performed sorption calculations using data from the literature, demonstrating that it would take unrealistically large load changes to alter water column phosphorus concentrations under sorption processes. The sorption model produces results consistent with historical data that show relatively constant phosphorous concentrations despite large lake volume changes. We show, through several lines of evidence, that water column phosphorus concentrations are insensitive to external loads. Phosphorous load reduction is unlikely to have a significant effect on phosphorus concentrations in Utah Lake and, by extension, in other sorption-dominated shallow lakes with phosphorus-rich sediment.

1. Introduction

1.1. Study Motivation

In November 2015, the Utah Department of Water Quality (DWQ) began the Utah Lake Water Quality Study (ULWQS) to develop nutrient standards, particularly for phosphorus (P), to protect Utah Lake’s designated beneficial uses. The ULWQS is a three-phase plan that involves (1) gathering and characterizing water quality data, (2) developing in-lake nutrient criteria, and (3) implementing plans to help Utah Lake reach the newly established nutrient criteria [1,2]. In December 2018, DWQ released their Phase 1 Report [3].
During the summer of 2023, a mass balance model for P in Utah Lake was presented to members of the ULWQS Science Panel. The model estimates that wastewater effluent is the most significant P load to Utah Lake, contributing an estimated 133.4 metric tons (t) of total phosphorus (TP) per year. The model accounts for other P sources, including estimates of 49.6 t of TP/year from tributaries, 45.0 t of TP/year from internal loading, and 32.0 t of TP/year from atmospheric deposition (AD) where P associated with particulates, dust, or precipitation is deposited in a water body. A decay factor is included in the model to account for internal P removal. Based on these criteria, this model predicts that Utah Lake will recover from its eutrophic state quickly—approximately 18 months—under a scenario where external P inputs, such as wastewater effluent, are reduced [4].
There are conflicting estimates for Utah Lake P loads. For example, AD studies performed by Brown et al. [5], Barrus et al. [6], Olsen et al. [7], and Telfer et al. [8] measured AD rates from 75 to 235 t of TP/year (approximately 2 to 7 times more AD mass than estimated by the ULWQS model). Other studies have shown that internal loading from lakebed sediments could contribute significantly to Utah Lake’s P content. Hogsett et al. [9] demonstrated that benthic sediments release P into Utah Lake’s water column, suggesting that internal loading can contribute up to 1500 t of TP/year.
Randall et al. [10] found that Utah Lake sediments have P concentrations ranging from 300 to 1100 mg/kg, with about 40% (120 to 440 mg/kg) of sediment P being available to the water column through sorption reactions. Abu-Hmeidan et al. [11] confirmed that the P content of Utah Lake sediments is high (with an average concentration of 666 mg/kg) and that they are not statistically different from offshore lacustrine soils, signifying that internal loading and the overall P content of Utah Lake are likely geologically driven. The geologic source of these high sediment P concentrations is supported by Casbeer et al. [12], who found similar P concentrations in sediments from Deer Creek Reservoir, located on the Provo River approximately 40 km upstream from Utah Lake. These P-rich sediments act as P reservoirs and are able to support P equilibrium with the water column through sorption processes.
We wanted to evaluate the potential impacts of P load reduction on Utah Lake. We used publicly available data to characterize the mass changes of P in Utah Lake using historical lake volume data from the Bureau of Reclamation, historical P concentration data from the Utah Division of Water Rights, and historical outflow data from the Utah Department of Environmental Quality. We evaluated whether historical data trends could be explained using a sorption model based on data in the literature rather than through a mass balance approach. Using these data, we show that Utah Lake is likely dominated by sorption processes and that water column P concentrations move toward equilibrium with the P-rich sediment, resulting in water column P concentrations that are relatively constant over time despite large changes in lake volume and internal dissolved P (DP) mass.

1.2. Utah Lake Background

Utah Lake is a large, shallow, freshwater lake (surface area of 380 km2 and an average depth of 3 m) located at 40°13′ N latitude and 111°48′ W longitude in the state of Utah, USA, in the easternmost portion of North America’s Great Basin region. Utah Lake is classified as a semi-terminal lake, fed by multiple headwaters while having a single outlet, the Jordan River, which empties into the Great Salt Lake [13]. Utah Lake is managed as a reservoir, providing water for irrigation, agricultural, and municipal use in addition to supplying water for the Great Salt Lake [14]. Utah Lake is also an important wildlife habitat for fish, such as the threatened June Sucker, and migratory birds [15,16].
The combination of Utah Lake’s large surface area and semi-arid environment causes the lake to experience evaporative losses equivalent to nearly half of its annual inflow. These losses, in conjunction with groundwater seepage through local limestone formations, result in elevated levels of total dissolved solids that render the lake slightly saline, with concentrations near the solubility limits of calcite. Utah Lake has elevated levels of suspended solids due to bioturbation from the feeding behavior of Common Carp and wave-induced resuspension caused by the lake’s overall shallowness and wind exposure [13]. Utah Lake is vertically well-mixed and does not stratify, though it is not well-mixed horizontally [17].
In 2016, the State of Utah Water Quality Board implemented a Technology-Based P Effluent Limit (TBPEL) of 1 mg/L for wastewater treatment plants (WWTPs) to take effect in 2020 [18]. The implementation date has since been delayed, as the regulation allowed deferrals to 2025 based on construction requirements (Utah State regulation R317-1-3.3). Nonpoint P sources for Utah Lake are significant contributors and are difficult to assess and regulate. Lake–sediment interactions are even more difficult to control or even quantify but can dominate nutrient mass balance processes in lakes where sediments are rich in P and interact significantly with the water column.

1.3. Phosphorous-Rich Sediments

Utah Lake is located in a naturally P-rich geologic environment, which results in high P concentrations in lakebed sediment, surrounding lacustrine soils, and sediment transported from the watershed. Detrital P in Utah Lake likely originates from outcrops of the Delle Phosphatic and Meade Peak Members throughout the Utah Lake Watershed (Figure 1) [11,19,20,21,22,23]. The Delle Phosphatic Member is a phosphate-rich sublayer of the Deseret Limestone (early Mississippian) found in Rock Canyon and the Lake Mountains adjacent to Utah Lake [20,24]. The Meade Peak Member is a phosphatic shale within the Park City and Phosphoria Formation (late Permian) found in outcrops throughout the Utah Lake Watershed, with mineable grade phosphate in the Uinta Basin watershed, the neighboring watershed due east of the Utah Lake watershed [20,23,25,26].
Due to erosion, the valley fill underlying Utah Lake is estimated to be as much as 4000 m thick [27] and includes P-rich source material from the Delle Phosphatic and Meade Peak Members [20]. Assessments of lakebed sediment and lacustrine soils surrounding Utah Lake found that they were not significantly different from each other with respect to their P content, with lakebed sediment TP concentrations ranging from 280 to 1710 mg/kg with an average TP concentration of 666 mg/kg (n = 85). The surrounding lacustrine soils range from 603 to 1114 mg/kg and have an average TP concentration of 786 mg/kg (n = 10) [11]. Sediments from Deer Creek Reservoir, about 40 km upstream of Utah Lake, have higher TP concentrations, with average measured values of 1107 mg/kg (n = 12) and 2573 mg/kg (n = 19) [12]. We infer that the high P content of Utah Lake sediment is primarily derived from geologic sources rather than having been precipitated from the water column or settled out from anthropogenic sources. This hypothesis is supported by the data that show that the surrounding lacustrine soils and upstream reservoir sediments have similar or higher P concentrations.

1.4. Nutrient Mass Balance Models

The construction of nutrient mass balance models is a well-established process that offers insight into a lake ecosystem [28,29]. Mueller [29] lists five general input–output mass balance approaches initially proposed by Vollenweider [28]. In general, mass balance models consist of model inputs such as point and nonpoint sources, internal sources or sinks, and outflows [29,30,31]. Model results are used to help manage or understand nutrient sources and predict impacts from changes to nutrient loads or lake processes [30,32,33,34,35,36].
TP mass balance models have proven useful for characterizing eutrophication and for predicting lake behavior in response to changes in the lake environment [35,37]. Estimated changes in nutrient concentrations are important considerations for lake restoration as management strategies are often focused on nutrient load reduction [37,38,39,40,41]. Studies on large, shallow, eutrophic lakes worldwide have demonstrated that Utah Lake and similar lake ecosystems can benefit from nutrient mass balance studies [40,42,43,44,45].
Mueller [29] highlights that one large source of uncertainty in P mass balance models is internal nutrient cycling, i.e., how nutrients are added to or removed from the water column due to sediment–water interactions. As such, studies that account for sediment–water interactions greatly increase the accuracy and value of these models [42,43,46]. These models, which included analyses of sediment–water interactions, provided important insight into each lake’s potential for P uptake or release by sediments and have been used to guide lake restoration measures.
We did not develop a mass balance model for this study. We instead used historical datasets for lake volume from the Bureau of Reclamation, lake outflow from the Utah Division of Water Rights, and water column P concentrations from the Utah Division of Water Quality to estimate the mass of P in Utah Lake and the Jordan River outflow. We also found that a sorption model can account for the patterns and changes we see in the data. This approach implies that Utah Lake water column concentrations of P are largely insensitive to external loads.

1.5. Sorption

Sorption is defined as the reversible partitioning of dissolved substances (i.e., solutes) with solid materials (i.e., sorbents) through the processes of adsorption, absorption, or ion exchange. When a solute becomes sorbed, it is called a sorbate. Most sorption can be modeled as an equilibrium process where the dissolved and sorbed concentrations are mathematically related [47]. Because of this equilibrium partitioning, sorption can act as either a sink or a source depending on solute concentrations as the system moves toward equilibrium [48].
In lake systems, P can sorb to clays, amorphous oxyhydroxides, carbonates, and similar materials and be readily desorbed depending on various physical, chemical, and biological conditions within the lake [49]. While sorption processes are not often included in mass balance models, they have been incorporated when sorption has been found to have a significant impact on water column concentrations. To demonstrate the importance of accounting for sorption, van der Salm et al. [47] evaluated five phosphate models with increasing complexity and found that the model that included sorption was the most accurate. Subsequent work has developed more involved models that include sorption, such as Wang et al. [48] and Chapra [34].
Sorption can be a dominant process in freshwater systems, making water column concentrations insensitive to other loads. Studies of the Kis-Balaton reservoir system in Hungary found that even though input mass was significantly reduced, the reservoir system exhibited little response because of nutrient interchange with sediments through sorption processes. Pollman and James [44] developed a mass balance model that included sorption for shallow Lake Okeechobee, Florida, USA. They showed that the sorption model performed better than models that treated sediments as either a sink or a source. This model estimated that P contribution from internal sources exceeded external loads by a factor of 2.6. Research on the Three Gorges Dam, a deep reservoir in China, showed that sorption played a significant role in P-retention, though less interaction with the water column was observed because of the limited soil–water interaction [50].

1.6. Research Overview

We used datasets collected by state and federal agencies from 1989 to 2023 to estimate internal P mass and associated changes in Utah Lake. Section 2.1 describes these datasets in depth, including their source, sampling frequency, statistical descriptions, and general observations. Section 2.2 presents the statistical methods and calculations we used to determine the mass of P in the lake and its outflow.
Using the methods outlined in Section 2, we present an analysis in Section 3 that demonstrates the high variability of lake volume and the estimated P mass in the lake over the study period. We show that this variability in lake mass and volume is in stark contrast to the consistency of DP concentrations over the same time, where we would expect lake volume to be correlated with concentrations. This includes characterizing monthly mass changes in the system. We show that estimated monthly external P loadings to Utah Lake are not large enough to account for the monthly mass changes seen in Utah Lake. We then used a hypothetical sorption model based on data in the literature to show that these trends and changes are consistent with a sorption-dominated system.
Section 4 discusses variability in lake volumes and concentrations and the associated implications. We discuss example sorption calculations and show how they explain both the historical data and support the conclusion that water column concentrations are insensitive to external loads. We conclude in Section 4 with numerous lines of evidence that all independently imply that Utah Lake water column concentrations are dominated by a sorption system, not external loads.
Section 5 summarizes our conclusion that internal P cycling, through sorption processes, is responsible for maintaining elevated P concentrations in Utah Lake despite the presence of other P loads and sinks. This leads to the conclusion that reducing external P sources to the lake, such as WWTP loads, would have a minimal impact on DP concentrations in the water column. We also discuss implications for similar reservoirs where restoration efforts may be more effective if focused on areas other than nutrient load reduction.

1.7. Hypothesis

Our hypothesis is that the water column and sediments in Utah Lake behave as a sorption system that is in equilibrium with respect to P. We assumed this hypothesis because Utah Lake is shallow, the water column is well mixed with the sediment, and the sediment has high concentrations of geologic P. If this hypothesis is true, then water column concentrations should be relatively insensitive to changes in nutrient loads or lake volumes. We evaluated this hypothesis using several lines of inquiry. This hypothesis has implications for the management of lakes with similar conditions (i.e., shallow waters that are well mixed with high P sediments) and ultimately means that P load reductions will have minimal impact on water column P concentrations in these types of lakes.

2. Data and Methods

2.1. Data Sources and Descriptions

2.1.1. Utah Lake Volume

We obtained Utah Lake daily volume data from the Bureau of Reclamation (BOR), which provides data since 1 January 1932 [51]. The BOR uses a rating curve to convert lake elevation to volume.
We used data from 13 July 1989 to 4 August 2023, as this period coincides with the available nutrient data (Figure 2). Utah Lake volumes exhibit an annual pattern, with peak volumes in the spring and lows near the end of the summer, though the timing of the peaks and troughs are variable. For example, the peak volume in 2019 occurred on 8 July, while peak volumes for 2018 and 2020 occurred on 15 April and 18 April, respectively (Figure 2). The lake also exhibits long-term volume trends. For example, the high volume in 2011 of 1.3 × 10⁹ m3 dropped to the low in 2016 of 1.3 × 10⁸ m3, an order of magnitude difference. The peak in 2016 was only 6.2 × 10⁸ m3, a peak-to-peak change of 6.8 × 10⁸ m3 in just over 5 years. Similar long-term drops in lake volume appear to be part of a semi-regular wet and dry cycle experienced by the lake.

2.1.2. Jordan River Outflow

We obtained Jordan River outflow data from the Utah Division of Water Rights, which has archived data from 1937 to the present [52]. For this study, we used data from 1 January 1989 to 1 July 2023 to coincide with the lake volume and nutrient datasets (Figure 3).
Jordan River outflow volumes from Utah Lake are right-skewed, with a mean monthly flow volume of 2.4 × 10⁷ m3 and a median flow volume of 1.9 × 10⁷ m3. In most winters, there is little to no flow from November until March (Figure 3 and Figure 4). For our study period, 20% of the flows are below 2.5 × 10⁵ m3, with no outflow about 10% of the time. During most years, there are no winter releases; however, winter flows occurred from 1997 to 2000 and from 2011 to 2012 during high water years to maintain reservoir levels below the legally required maximum lake elevation [14].
Monthly outflows from Utah Lake are highest in the late spring and early summer months (Figure 4). Average flows from June to August are similar. Only a small decrease in flows is observed during May and September (Figure 4). Median flows (the notches in Figure 4) show more variation, with July having the highest outflows, while June and August are similar, and May and September have noticeably lower median outflows. Spring flows, which occur from March to May, are variable, with low-water years having small releases and wet years having large releases.

2.1.3. Phosphorus Concentrations

We obtained P concentration data from the Ambient Water Quality Management System (AWQMS) database provided by the Utah Department of Environmental Quality [53]. We accessed the AWQMS website in the fall of 2023. We searched for all measurements that included “Utah Lake” in the location field, then excluded samples from the marinas because they are not representative of the lake body and generally exhibit higher concentrations. We also excluded samples labeled as “field blanks” or “duplicates”. We included samples labeled as “surface” or “water column” as our goal was to estimate the average concentration of P in the lake. This yielded 3269 samples collected from 31 August 1978 to 20 September 2022. The sampling frequency has continually increased with time. There are only two samples in 1978, and the next samples are from 11 July 1989, so our effective data timeline runs from 1989 to 2023.
The AWQMS measurements represent two fractions, TP and DP, which were measured using three different methods described as “Orthophosphate”, “Phosphate_mixed”, and “Phosphate_retired”. The “Phosphate_retired” method was used from the beginning of the dataset until 15 September 2021; after that time, the reference switched to the “Phosphate_mixed” method until the end of the dataset. There is no overlap in time between the two methods. Measurements with the method labeled “Orthophosphate” are only available after 23 September 2020.
For this study, we used DP values and included the data from all three methods, resulting in a usable sample size of 1658 samples, as approximately half of the original P samples were for TP concentrations. We did not use TP data because TP includes nonsorbed P associated with suspended solids, and we are interested in P available for sorption. DP is the portion of P that is related to the P sorbed onto solids, both suspended and in the sediment. This means that TP values include P sorbed onto the suspended sediments, while DP values characterize the P dissolved in the water column.
Figure 5 shows both the sample locations and the number of P sample measurements available in the AWQMS database. Panel A (left) summarizes the location and number of all the P samples, both TP and DP. Panel B (right) presents the DP samples we used in our analysis. The map shows that the samples are spatially distributed, and these data should provide a representative overview of lake conditions. Many of the larger clusters of samples are near WWTP discharges, so the data are skewed towards these areas and may be slightly higher than average lake conditions. This represents a conservative assumption. There are a large number of samples in the northwest corner of the lake near the Jordan River outfall, presumably to represent outflow concentrations. The cluster of 245 samples and a nearby single sample in the northeast corner close to shore is approximately 1500 m directly south of the outfall for Timpanogos Special Service District, the largest WWTP that discharges to Utah Lake. The single sample is about the same distance south but approximately 750 m to the east, closer to the shoreline. There is a large cluster of 186 samples directly west of Provo Harbor near the discharge point of the Provo River and the outfall from the Orem WWTP. There is also a cluster of 151 measurements at the mouth of Provo Bay, on the east side of the lake. The Provo City WWTP discharges into Provo Bay.
Table 1 is a list of the sample locations’ ID numbers and location names from the AQWMS database that have P results from Utah Lake. For most of this paper, we will use location IDs rather than location names to conserve space. There are samples from 22 unique locations, though some locations are relatively close to others, meaning that only 19 separate locations are readily visible in Figure 5.
Figure 6 shows the 1658 DP measurements used in this study. There are four points with anomalously high values, one point in 1989 and three points in 1991, with values of 1.42, 0.85, 0.60, and 0.59 mg/L, respectively, which are not included in the plot as they compress the scale. While these excluded measurements appear to be outliers, we included them in the analysis presented in this study. Figure 6 shows that no data, except the four excluded measurements, have values above 0.21 mg/L.

2.2. Analysis Methods

2.2.1. Statistical Analyses

We evaluated the variability of both lake volumes and P concentrations using standard analytical techniques and plots. To compare different data groups or times, we used analysis of means (ANOM) and the Tukey–Kramer test as implemented in JMP Pro 17® [54,55]. We grouped data by both month and year and compared the distributions of the population for a given year or month to the distribution of the entire data population over the study period using ANOM. We also performed pair-wise comparisons using the Tukey–Kramer test. We present the ANOM results using plots in which the annual mean is plotted along with the upper and lower decision boundaries for that time period. These plots graphically show the relative similarities between the annual mean and the population mean. We present the Tukey–Kramer results of connected letter reports in tables.

2.2.2. Phosphorus Mass Calculations

We computed DP mass in Utah Lake at any specific time as follows:
M L a k e = C P V L C f
where M L a k e is the mass of DP in the lake in kg, C P is the concentration of DP in the lake in mg/L, and V L is the lake volume in m3 all at a point in time. C f is a conversion factor defined as follows:
C f = C P m g L · V L m 3 · 1000   L m 3 · k g 10 6   m g C f = 10 3 L · k g m 3 · m g .
We computed M o u t , which is the mass of DP leaving Utah Lake via the Jordan River outflow, using the same equations, assuming that the DP concentration in the outflow was the same concentration as the overall lake (which we show to be valid in Section 3.2.3) and that the volume of the outflow ( V o u t ) was the total volume (m3) released during the examined time period—typically on a monthly basis.
We computed the mass of DP removed from the lake via the Jordan River as follows:
M o u t = C P C f V o u t
where V o u t is the volume of water that flows out of Utah Lake (m3), and M o u t is the mass of P removed (kg) from the lake via the Jordan River over the time period.
We evaluated monthly mass changes in the lake using a simple mass balance approach:
M L a k e = M i n M o u t
where M L a k e is the mass of DP in Utah Lake, M i n represents the cumulative DP load from all sources or sinks except the Jordan River over a given time period, and M o u t is the amount of DP removed by the Jordan River over the same period. This means that M i n includes or accounts for all other P sinks or sources. External sources for M i n include WWTP effluent, tributary inflows, nonpoint sources, atmospheric deposition, and groundwater. Internal fluxes for M i n include precipitation and sedimentation from the water column (which removes DP mass from the lake), and release from the sediment (which increases DP mass in the lake), as well as any other sources or sinks, including sorption (which can act as either a sink or a source depending on the relative concentration of P in the water column and the sediment).
We computed the change in mass for each month by subtracting the mass at the beginning of the previous month from the mass at the beginning of each given month for both the lake, M L a k e and the mass removed by the Jordan River over the month, M o u t , as follows:
M i n = M L a k e + M o u t
where represents the monthly change in the mass in any compartment over the study period.
We estimated the DP concentration at the beginning of each month, C P , by interpolating the measured values using the pandas python library with the PCHIP spline interpolation method, which eliminates over and undershoots [56]. On days with multiple measurements, we used either the daily mean or the median values, resulting in two different interpolated values of C P . We term these resulting monthly values C P a v g and C P m e d for interpolated values using the mean or the median, which is shown in Figure 7 as blue or black lines, respectively. The y-axis is limited to 0.5 mg/L; therefore, the four large measurements in 1989 and 1991 that are shown in Figure 6 are off-scale. These measurements affect the mean values, with their influence being shown by large spikes in the blue line for these two years; however, they have less impact on the median values. A similar case occurs in 2021 and 2022, as shown in Figure 7B, where large, isolated values affect the mean but have less impact on the median. The interpolation based on daily median values, the black line, does not show these large excursions.
P samples were usually only taken in the summer months for most of the study period, but since about 2019, the sampling frequency has increased to include the majority of the year (Figure 6 and Figure 7). For most of our analysis, we used interpolated values based on the median concentrations, though we occasionally reference interpolated values based on the mean concentrations.
We used measured daily values for lake volume at the beginning of each month and the interpolated monthly lake concentrations to compute the mass of DP at the start of each month. We used the month-to-month difference in DP mass to compute the change in in-lake DP mass, M L a k e . The Jordan River outflow data provide monthly volume release measurements. We multiplied these measured volumes by the interpolated concentrations at the beginning of each month to estimate the change in outflow mass, M o u t . We computed the cumulative mass of DP into the lake during the month, M i n , according to Equation (4).
Figure 8 presents the annual mean DP value for each year, with dots representing each measurement and bars showing the interquartile range. This graph shows that the mean DP concentration has not varied significantly over the study period. The one larger mean value in 1997 of about 0.06 mg/L is based on 12 measurements that were mostly taken in July. The remaining annual mean values are all below 0.05 mg/L, with most below 0.04 mg/L.

2.2.3. Sorption Calculations

In addition to our phosphorus mass calculations, we also performed sorption calculations using data from the literature to demonstrate how sorption could impact water column P concentrations in Utah Lake. Equilibrium-based sorption models, such as Freundlich or Langmuir models, can be used to mathematically define the concentration ratio of solutes and sorbates [50]. These models are called isotherm models, as sorption processes are temperature-dependent. While isotherm models are helpful for describing and predicting sorption activity, they do not define the specific reaction mechanisms that occur during a sorption event. Rather, they provide a simplified model that characterizes the relationship between concentrations in the solid and liquid phases [57].
We used the Freundlich model for example calculations as it is the simplest model and is generally accurate over concentration ranges found in reservoirs. The Freundlich model is defined as follows:
C s o l i d = K d C l i q 1 / n
where C s o l i d is the concentration in the solids or sediment (mg/kg), C l i q is the concentration in the liquid (mg/L), K d is a fitted constant called the distribution coefficient, and n is the correction factor for non-linear relationships. When n is 1, K d is the slope of the isotherm [50,58].

3. Results

3.1. Lake Volume Varibility

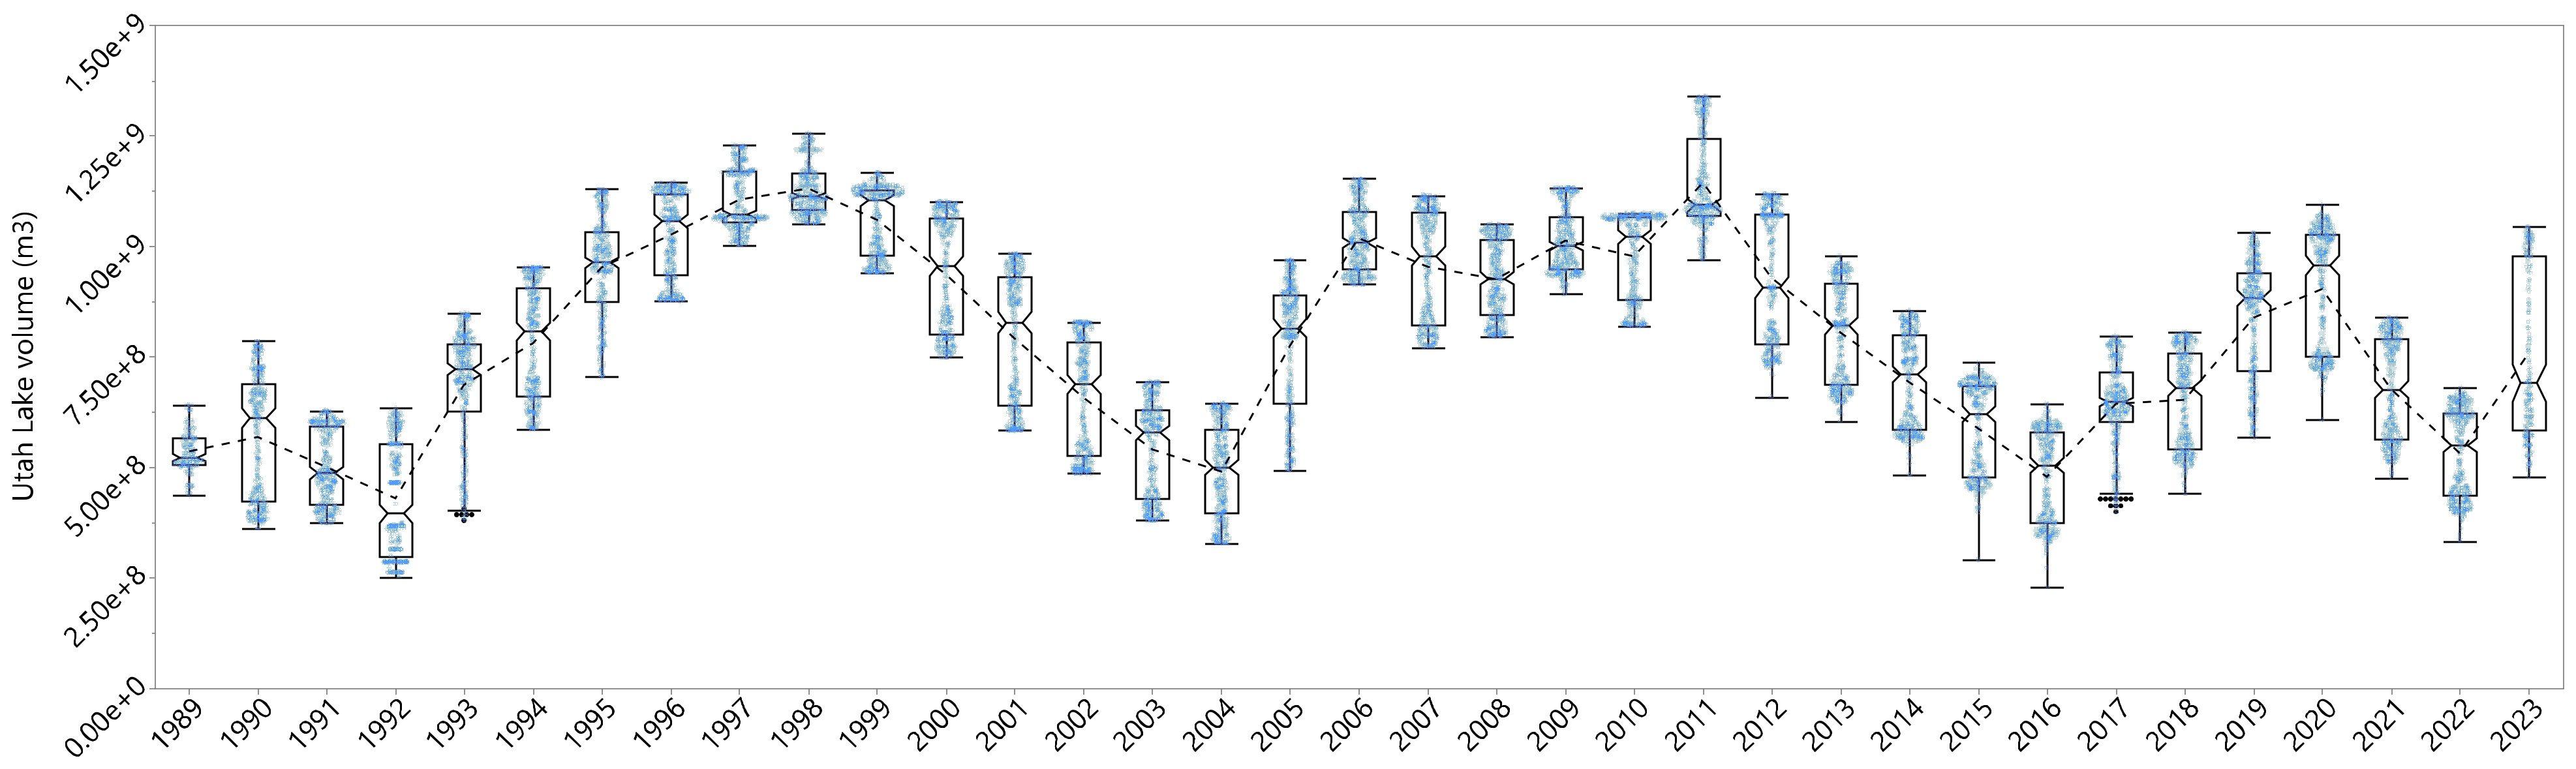
3.1.1. Volume Annual Variability

Utah Lake volumes are quite variable when compared to the variation in DP concentration, both on an annual and longer-term scale. The change in average Utah Lake volumes ranged from approximately 4 × 10⁸ m3 in 1997 to 1 × 10⁹ m3 in 1998 and 2011 (Figure 2 and Figure 9). The one-year change from the lowest volume in 2004 to the highest in 2005 (6.4 × 10⁸ m3) is even larger, as the reservoir started filling in early autumn of 2004, with the low of 3.3 × 10⁸ m3 occurring on 15 September 2004 and the high of 9.7 × 10⁸ m3 occurring on 28 June 2005. Utah Lake volumes show changes over longer terms (Figure 2 and Figure 9) as well. The lowest-volume period in our data occurred in 1992, and the highest occurred in 2011. Additionally, annual mean volumes exhibited approximately 10-year trends of increasing and decreasing volumes (Figure 9 and Figure 10). Monthly volume variation (Figure 11) shows that lake average volumes peak in May, but in any given month, the lake volume is quite variable, with historical peak volumes in any month, including those with the lowest average volume, being higher than the May average. The effect of climatic conditions can be seen in the longer-term trends; wet and dry cycles are reflected in lake storage patterns (Figure 9).
Figure 9. Annual distributions of Utah Lake volume (m3) from 13 July 1989 to 4 August 2023 with box plots showing the distribution and blue dots representing all individual values. The dashed line connects the mean values for each year, and the notches in the boxes represent the median values.
Water 16 00933 g009
An ANOM analysis of average lake volumes grouped by year (Figure 10) shows that, with few exceptions, annual lake mean volumes are significantly different from the average lake volume over the study period at the p = 0.05 level. This is in sharp contrast to mean DP concentrations, which, at a significance level of p = 0.05, are only statistically different from the population mean for a very small number of years, and those that are different are relatively close to the decision boundary (Figure 12). Thirty-one of the thirty-five average annual lake volumes are well outside the decision boundary. The four years in which the annual average lake volume is not significantly different from the population mean, 1994, 2001, 2005, and 2013, appear to be the result of a regular cycle in lake volumes, which go from below the average to above the average in those four years.
Figure 10. Analysis of means (ANOM) results of Utah Lake volume data grouped by year. The plot includes the mean for each year (green or red dots) and the blue decision region, bounded by the lower and upper decision boundaries, LDL and UDL, respectively, which represents the area where differences are not statistically significant at the p = 0.05 level. This shows that the majority of mean values for the majority of years are statistically significantly different from the mean for the entire population.
Water 16 00933 g010

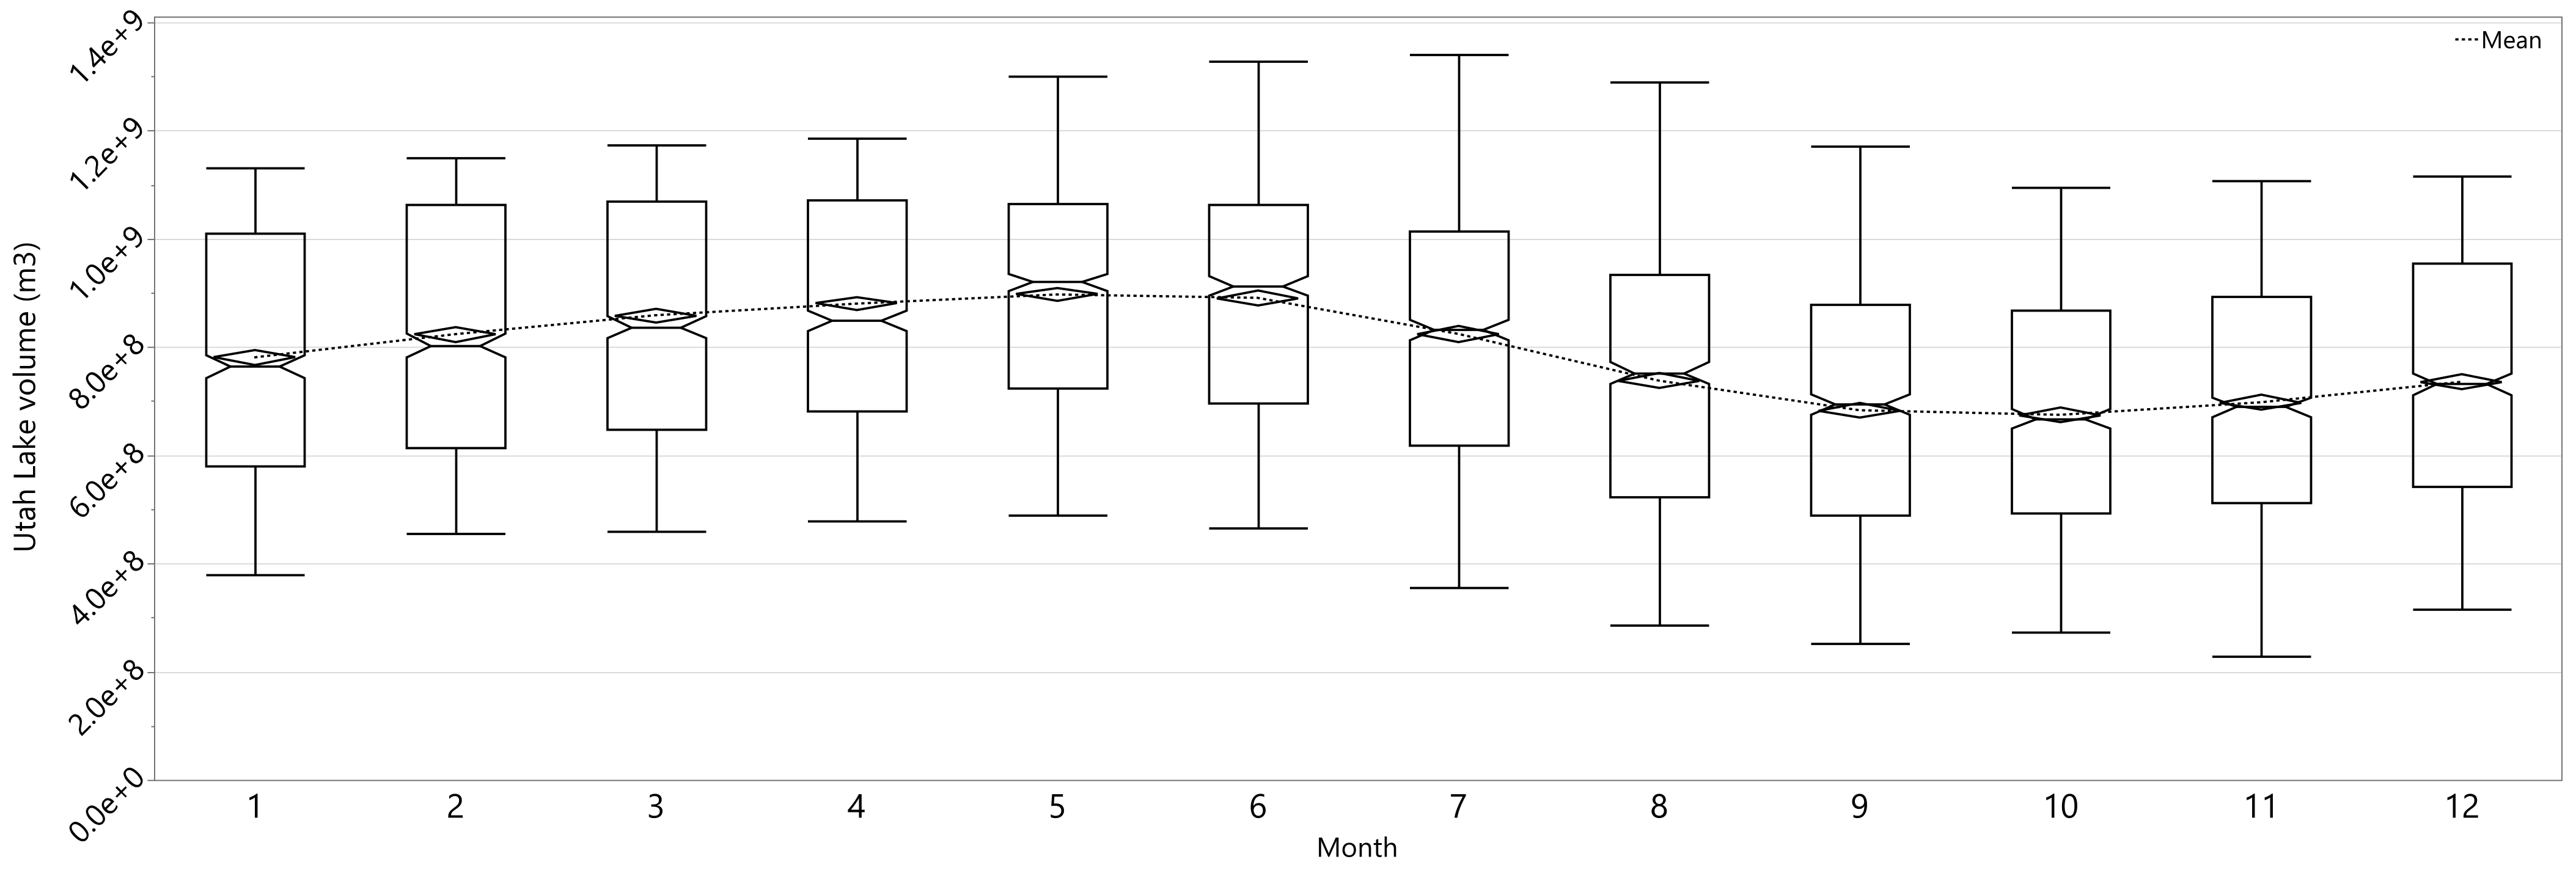
3.1.2. Volume Monthly Variability

Figure 11 shows the distribution of monthly volumes over the ~34-year study period. Monthly volumes generally peak in May but can peak as late as July (Figure 11). These volumes exhibit large variations. Lake volumes in May range from about 4 × 10⁸ m3 to 1.3 × 10⁹ m3, a difference of 9 × 10⁸ m3. The lake is generally at its lowest point in September or October, after which the lake gradually fills again. While these are the general trends, Figure 9 and Figure 11 show that any given year can vary considerably, with peak monthly values in any given month exceeding the peak average value in May.
Figure 11. Monthly distributions of Utah Lake volumes in cubic meters (m3). However, for the average peaks in May, the volumes are quite variable, with peak volumes in any month higher than the June average.
Water 16 00933 g011

3.2. Phosphorus Concentration Variabilty

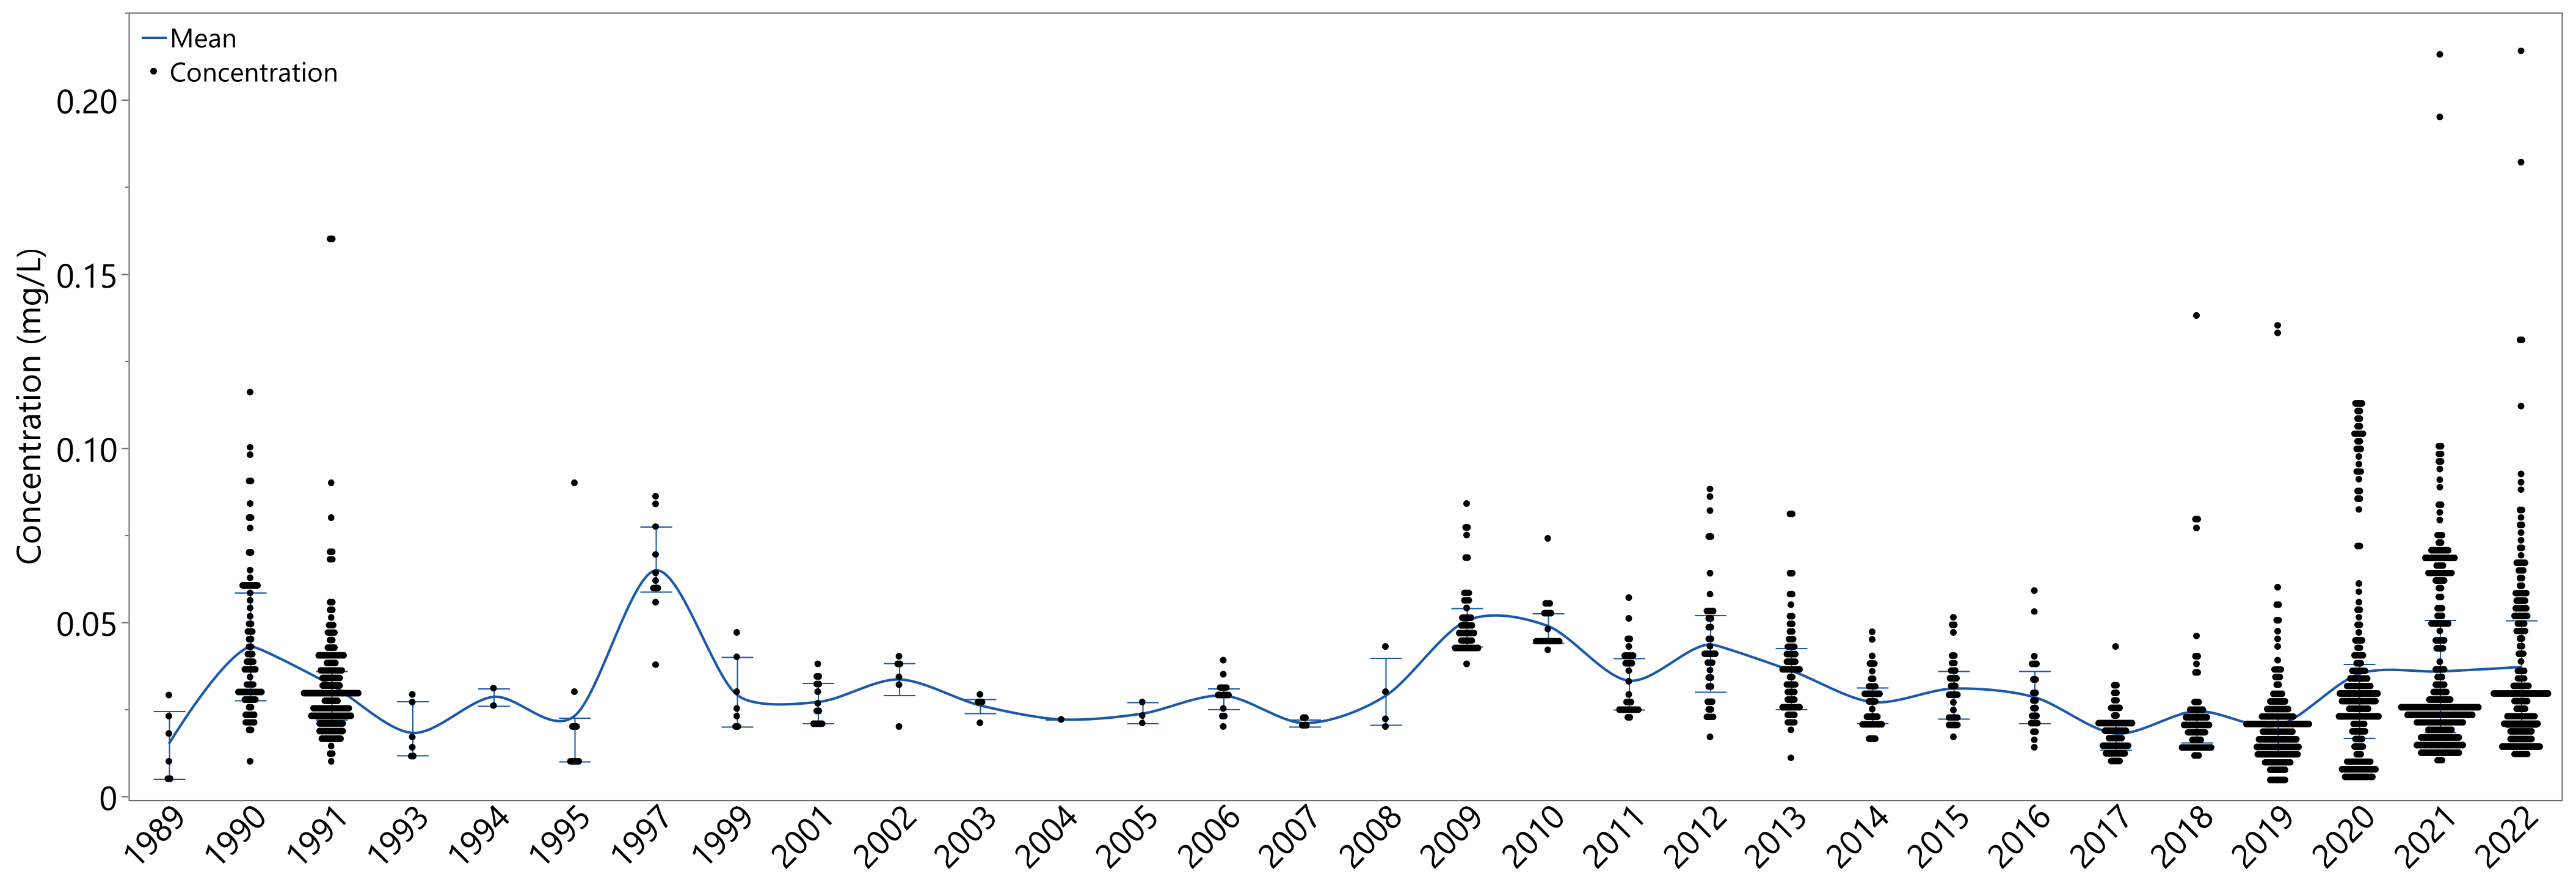
3.2.1. Phosphorus Concentration Annual Variability

Figure 8 shows the 1658 measurements of DP grouped by year, with the solid line connecting the annual mean value and the whiskers showing the interquartile range. The data show little variation in DP concentration over the period, with the annual means ranging from approximately 0.02 to 0.06 mg/L. In the initial years of 1990 to 1991 and the later years of 2018 to 2022, more of the data fall outside the interquartile range, but the interquartile ranges in these years are not significantly larger than in other years. The data show little trend, with a high in 1997. There is a slight decreasing trend from 2009 to 2019, then a slight increase from 2019 to 2020, after which mean annual concentrations have remained steady.
If we group DP concentrations by year, the annual mean values show a relatively narrow range from 0.015 mg/L to 0.064 mg/L, which occurred in 1989 and 1997, respectively (Figure 8 and Figure 12). We used both the analysis of means (ANOM) and the Tukey–Kramer test to determine how similar each year is to each other.
Except for 1997, the annual mean values are not statistically different from the mean of the entire dataset at the p = 0.05 level, though in several years (1990, 2009, 2010, 2012, and 2017–2019), the mean value for the year is slightly outside the ANOM decision boundary (Figure 8). While variation can be observed across the different years of our study period, that variation is either statistically insignificant (with the exception of 1997) or only slightly outside the decision boundaries.
Figure 12. Analysis of means (ANOM) results on Utah Lake dissolved P (DP) concentration data grouped by year. The plot includes the mean for each year (green or red dots) and the blue region, bounded by the lower and upper decision boundaries, LDL and UDL, respectively, which represents the area where differences are not statistically significant at the p = 0.05 level. The boundary locations are based on the number of samples in each year.
Water 16 00933 g012
The results from the pair-wise Tukey–Kramer test are presented in Table 2. This table orders the years based on the mean value from largest to smallest. If two years share a letter, then they are not statistically different. For example, 2002 has all seven letters assigned (A, B, C, D, E, F, G), indicating that it is not significantly different from any other year. The years 2017 and 2019, which only have the letter G assigned, are significantly different from years without a ‘G’, such as 1997. The significance of a difference in mean value depends on several parameters, including the mean value itself, the variability of the data in that year, and the number of samples.

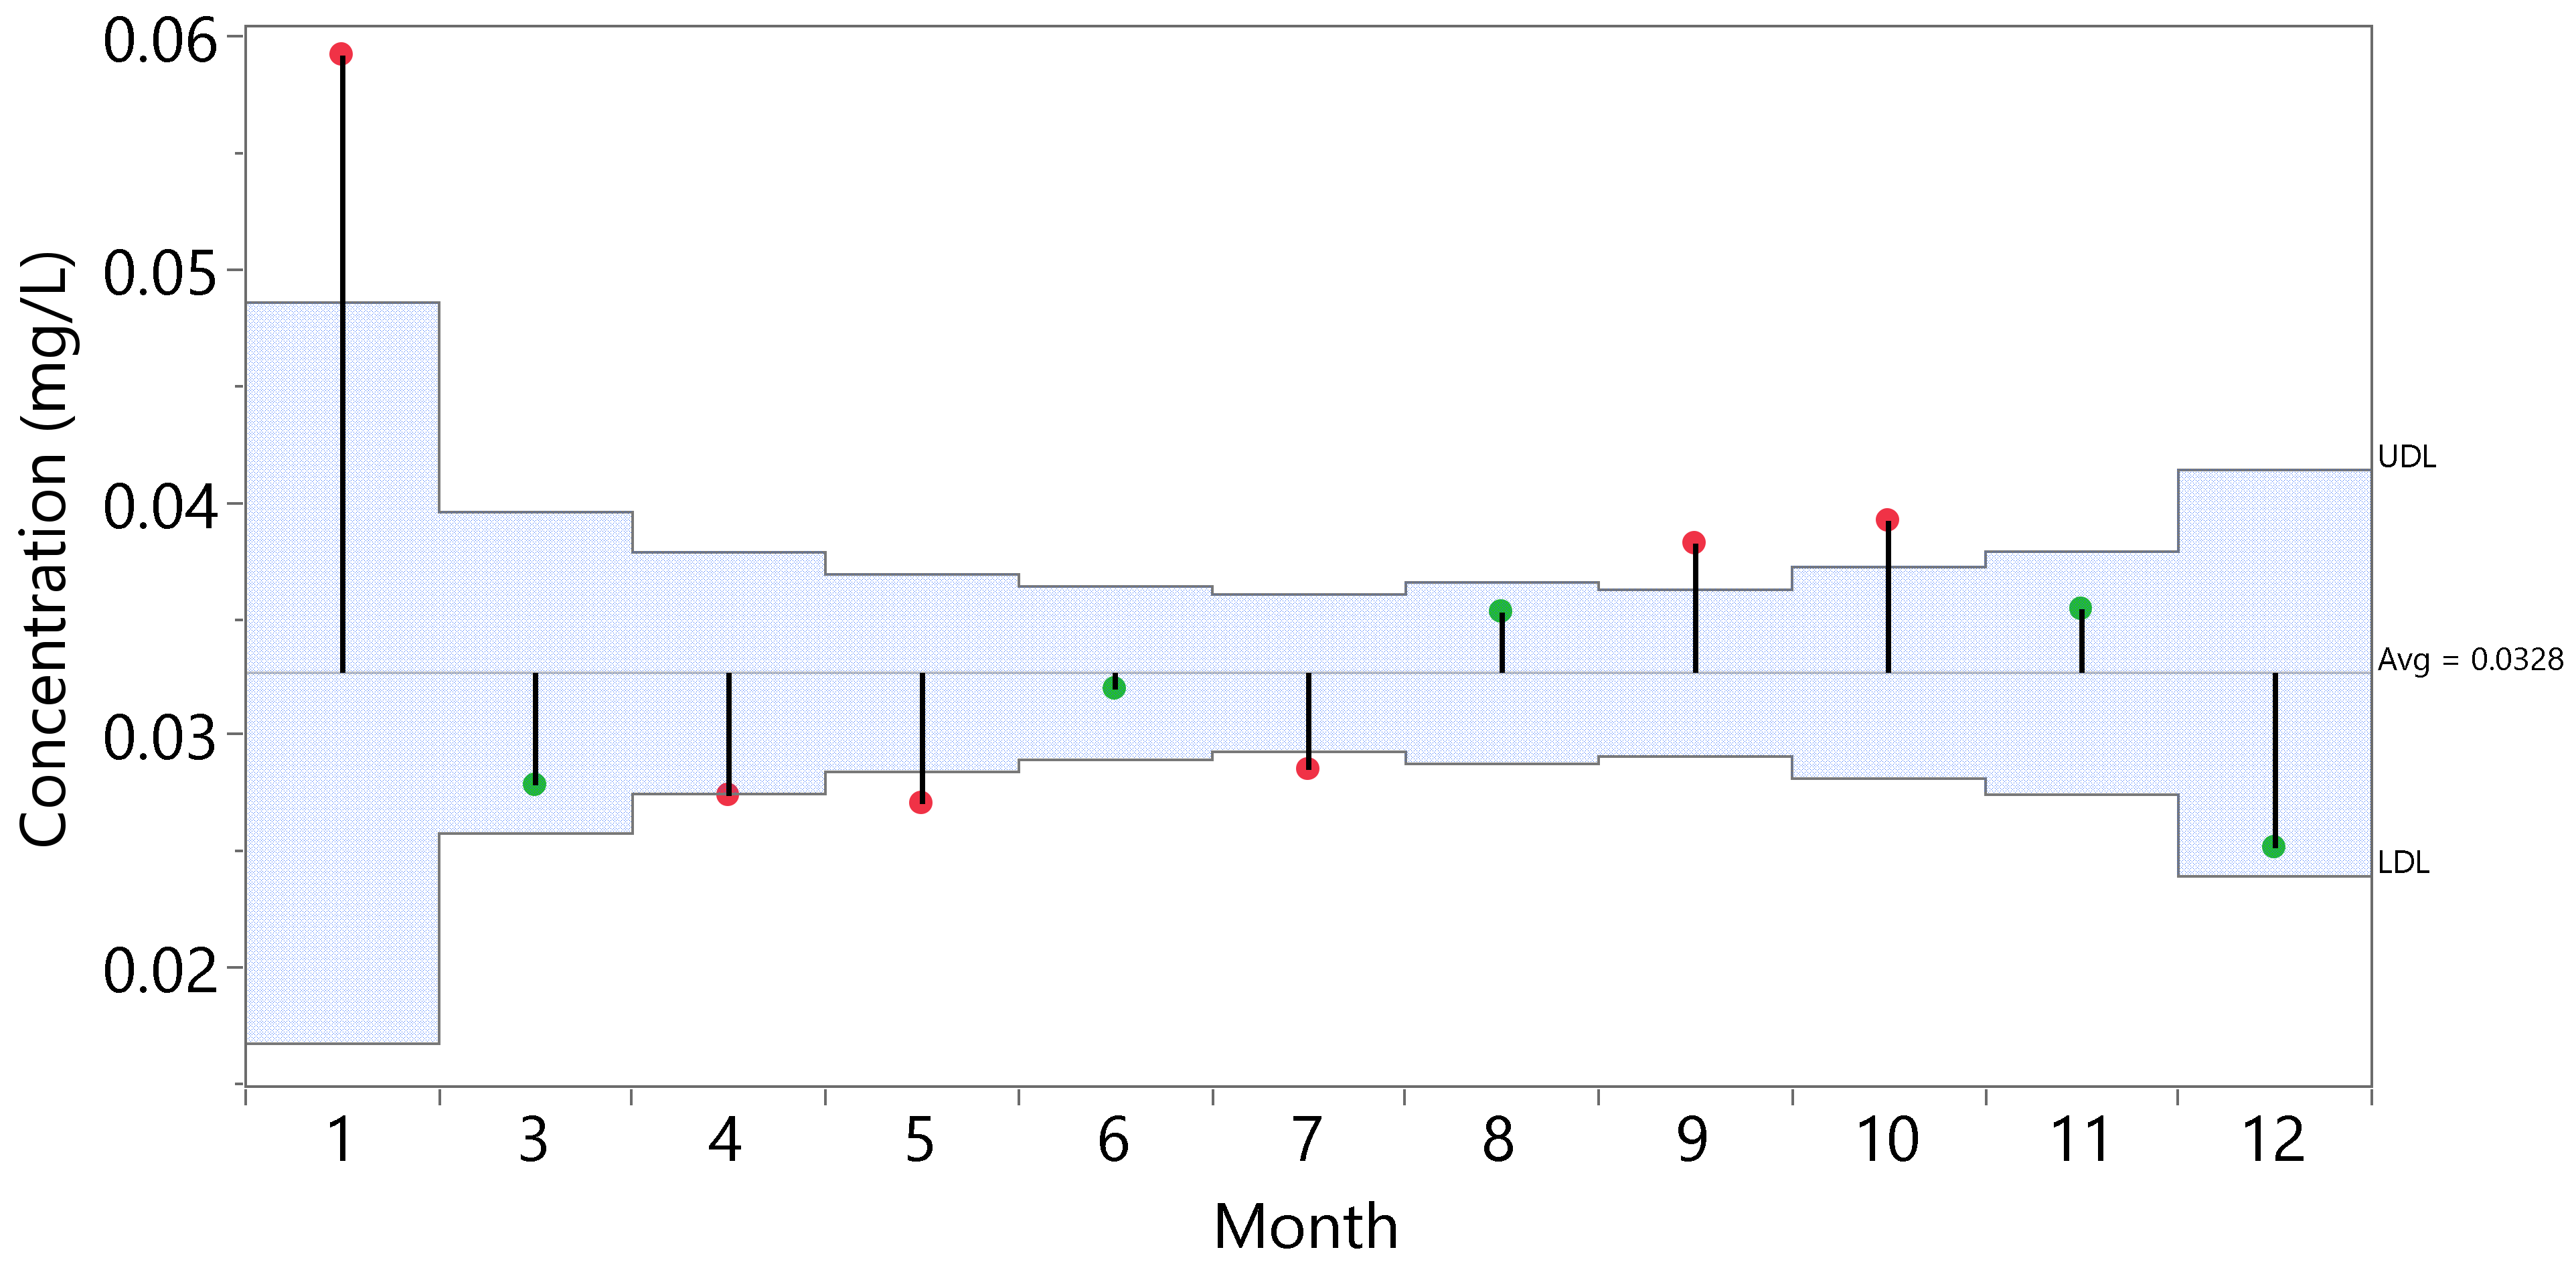
3.2.2. Phosphorus Concentration Monthly Variability

Monthly P concentrations show a pattern of slightly higher average values in the fall and slightly lower average values in the spring, though the observed changes are not large (Figure 13). In Figure 14, the highest mean DP value is reported in January, but we only have a limited number of January samples, all of which were collected in 1991, so this value is not as representative of typical lake conditions as the DP values reported in other months (Figure 8).
If we group DP concentrations by month, the monthly mean values range from 0.025 mg/L to 0.059 mg/L for December and January, respectively (Figure 14), falling in a relatively narrow range. ANOM analysis reveals a sinusoidal pattern, with higher values in the fall and lower values in the spring. We believe that the January value is an outlier since we only have a few measurements that were collected in January. Figure 14 supports this assertion with the large decision boundary (blue area), which is based on the number of samples. While there is variation in the monthly means, the variation is not large. Most monthly means that are significantly different from the population mean are only slightly outside the decision boundary (Figure 14).
The results from the pair-wise Tukey–Kramer test are presented in Table 3. The months are ordered by mean value from largest to smallest. January is significantly different from all the other months, while most other months are similar. The letters generally align with the calendar, with the ‘B’ group being the fall months, the ‘C’ group being the late summer through early fall, and the ‘F’ group being the late spring through early summer. Groups ‘D’ and ‘E’ represent transition periods and include months throughout the calendar year. While there is an annual sinusoidal pattern, the monthly data have relatively similar concentration values.

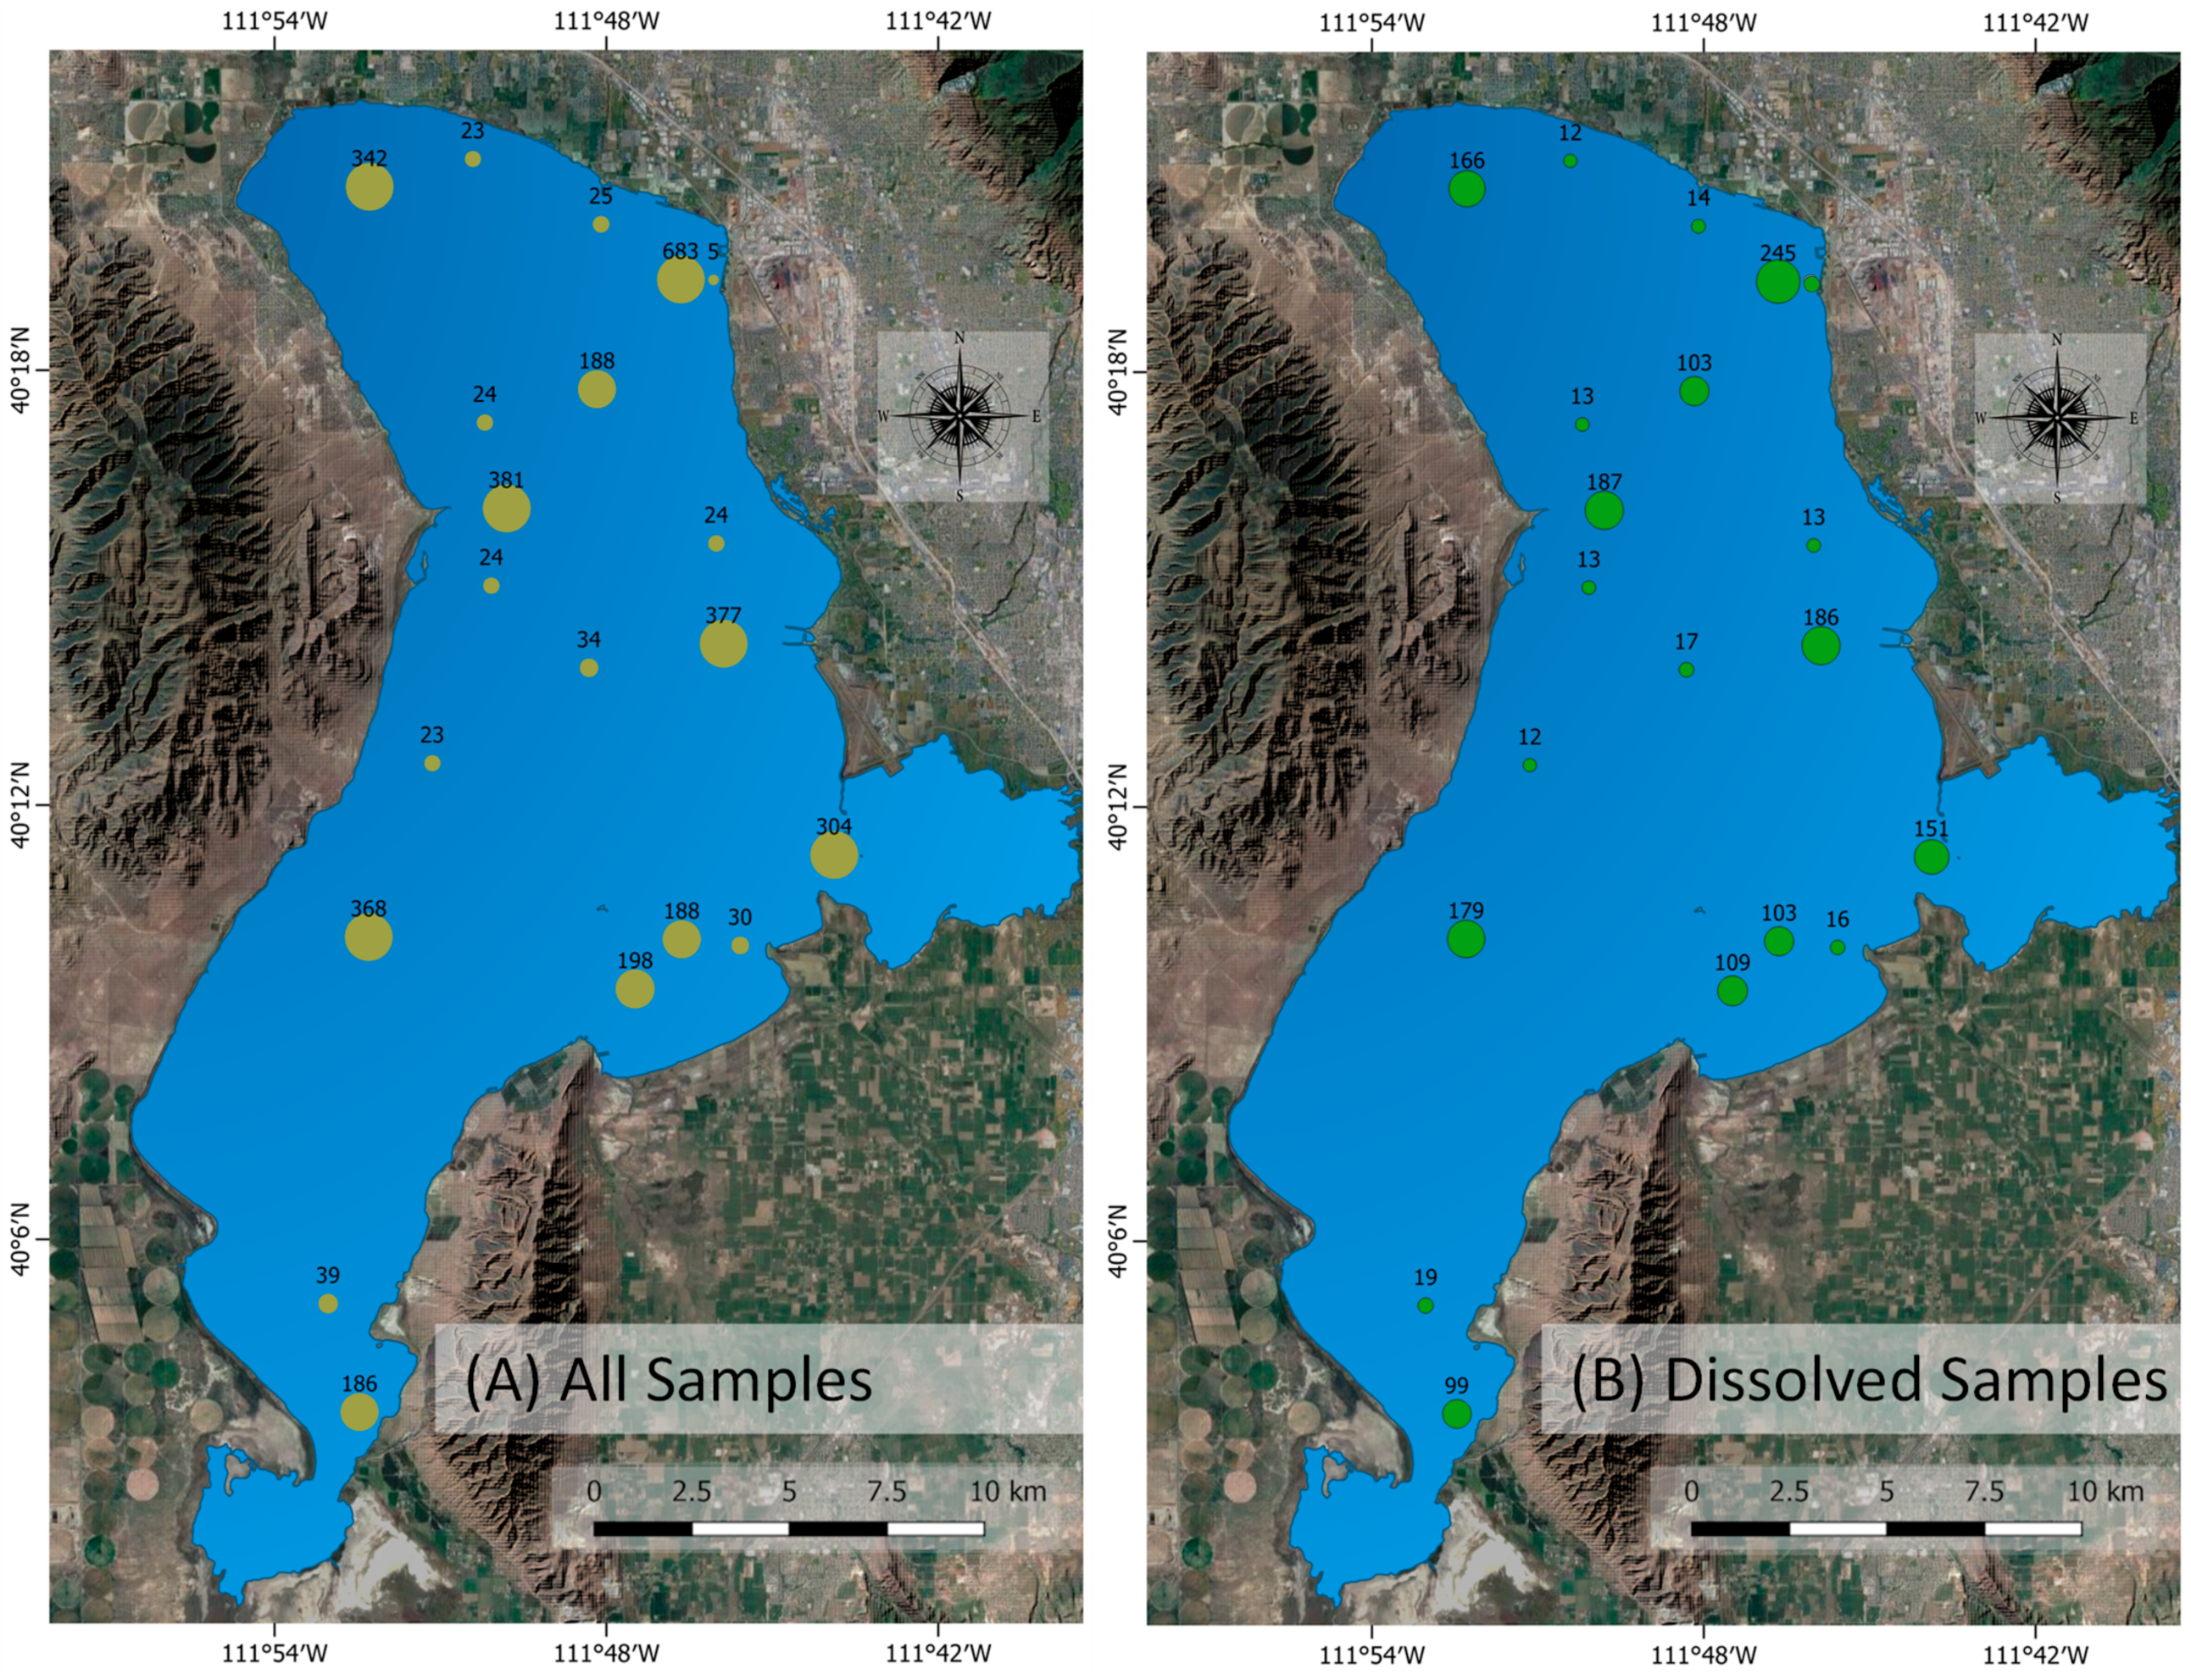
3.2.3. Phosphorus Concentration Variability by Location

In Figure 15, the DP measurements are grouped by location; the measurement locations are designated by the number codes assigned to them in the AWQMS records. This figure shows that the distribution of DP concentrations is similar for all the measurement locations. The 4917300 and 4917530 locations only have a single measurement. To examine the spatial distribution data, both the analysis of means (ANOM) and the pair-wise Tukey–Kramer test showed that there is no statistically significant difference in the means at the different locations at the p = 0.05 level either from the entire population (ANOM) or individual pairs (Tukey–Kramer).
Figure 16 presents the results of the ANOM test, which shows that the mean value for site 4917770 of 0.0385 mg/L slightly exceeds the upper decision limit. The ANOM plot presents the mean value for the data at each location (green or red dot), the mean of the entire dataset (horizontal line), and the upper and lower decision boundaries at the p = 0.05 level (LDL and UDL, respectively). The plot shows that, except for site 4917770, the means for each site are well within the decision boundaries. Site 4917770 is located at the mouth of Provo Bay and experiences more algal blooms than the rest of the lake [59,60]. The high values for site 4917770 (Figure 15) occurred in 2021 and 2022 and are visual outliers (Figure 8). While site 4917770 is slightly different based on the ANOM analysis, there is no statistically significant difference at the p = 0.05 level, with the Tukey–Kramer test using pair-wise comparisons with all the other locations. This implies that we can treat the lake samples as a single distribution that characterizes the lake spatially.

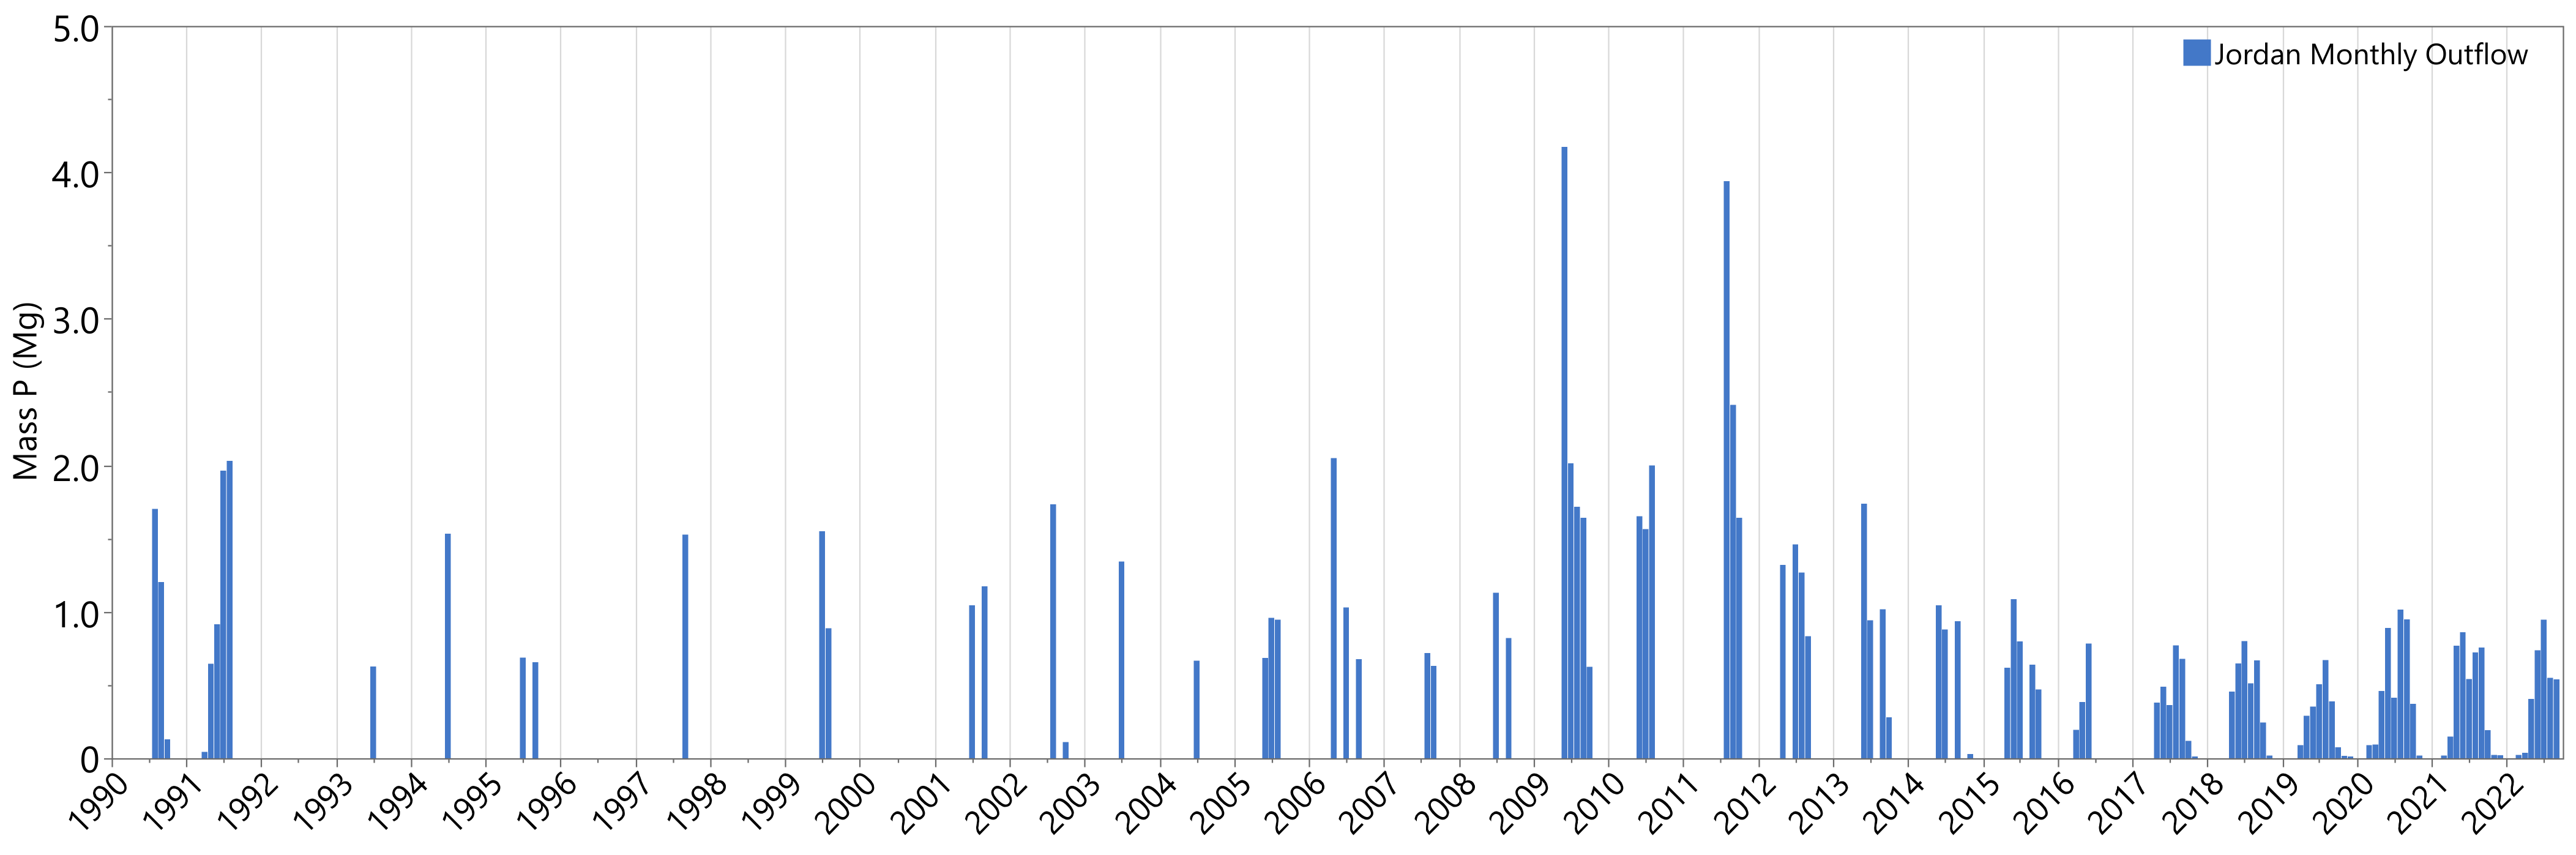
3.3. Phosphorous Outflow—Jordan River

We estimated the monthly outflow of DP in the Jordan River using Equation (2). Figure 3 shows that the Jordan River often has no outflows in winter months. This is reflected in Figure 17, where mass outflows are zero in most winter months. Figure 18 presents both the monthly mass of DP (t) removed by the Jordan River as blue and the total mass of DP (t) in Utah Lake as gray.
DP mass outflows in the Jordan River (Figure 17) for the 113 months in which we have measurements are slightly right skewed with mean and median values of 0.90 and 0.77 t, respectively. These statistics include only a few winter months, where outflows are generally zero, and the measured DP values are infrequent, so actual mean and median values are likely lower with a larger skew. We did not include months where we had no concentration measurements, and if we had concentration data but the flow was zero, we still included the data. DP mass outflows correspond to volumetric outflows (Figure 3), as the concentrations are relatively constant.
Figure 17. Monthly mass outflow (Mg or t) of Utah Lake dissolved P (DP) in the Jordan River for months in which we have measured data. We have flow data every month but limited concentration data. Large mass outflows correspond to large outflow volumes as the concentrations are relatively constant.
Water 16 00933 g017
DP mass outflow is correlated with the mass of P in Utah Lake (Figure 19), as volumetric outflows are larger in years when the lake is full. The monthly DP mass outflow is 2.5% of the mean lake DP mass and 3% of the median lake DP mass for any given month in which we have measurements. The Jordan River outflow is zero for slightly over 2% of the months for which we have measurements. Previous studies have shown that in the long term, Utah Lake acts as a P sink, retaining about 10% of the P inflow [13]. These data, shown in Figure 18, demonstrate that P mass outflows, while not large, do impact mass balances.
Figure 18. Monthly mass outflow (Mg or t) of Utah Lake dissolved P (DP) in the Jordan River as blue, with the total mass of P in Utah Lake as gray. These data use interpolated P concentrations to compute mass estimates in months with no data.
Water 16 00933 g018
Figure 19. Monthly values of the mass (Mg or t) of Utah Lake dissolved P (DP) as bars and the volume of Utah Lake (m3) as the dashed line on the left and right axis, respectively. While the values generally follow each other, the mass of DP typically follows rather than leads the lake volume as the lake moves toward equilibrium concentrations after the lake volume changes.
Water 16 00933 g019

3.4. Phosphorus Mass Varibilty

Figure 19 presents the mass of DP (t) and the volume of water (m3) in Utah Lake at the beginning of each month. We only show mass values in months for which DP concentration measurements exist. Contrary to the behavior expected in a strict mass balance model, the mass of DP increases and decreases with lake volumes, though the change in mass lags behind the change in volume to some degree. This is consistent with lake concentrations moving toward equilibrium values under a sorption system. The lake is reacting to either dilution events (e.g., spring runoff) or concentration (e.g., late summer evaporation). Without dominant sorption processes, we would expect the in-lake mass to be relatively insensitive to volume changes unless accompanied by external loads. As WWTPs and AD account for a large portion of the load, we do not expect large load changes over time. For Utah Lake, water influent loads are a small portion of the total estimated DP loads, and we would not expect large mass changes due to DP contributed by spring inflows. These data show that Utah Lake volume and DP mass have a correlation coefficient of 0.56, where the correlation is significant at the p < 0.001 level. This implies that changes in volume and mass are related, an observation consistent with a sorption system.
We computed the change in the mass of P in Utah Lake using Equations (1) through (4). To compute the DP mass in Utah Lake at the beginning of each month, M L a k e , we used Equation (1) and the outflow of mass in the Jordan River with the estimated concentration at the beginning of each month. The total monthly mass inflow of DP from all sources (Figure 20B) is equal to the monthly change in mass for the entire lake (Figure 20A) plus the monthly outflow in the Jordan River. This includes DP from point sources such as tributaries and WWTPs, from nonpoint sources such as AD and overland flow, and from internal sources such as mineral precipitation and sorption. We used concentration estimates based on the median of values on days with multiple measurements for the interpolation (Figure 7).
If DP inputs from external sources remain relatively constant, the mass of DP in the lake should remain relatively constant, and the concentration should decrease due to dilution from spring runoff and increase in the summer because of evaporation. In Utah Lake, however, the concentration of DP stays relatively constant. As shown in Figure 19, mass increases with increasing volume and decreases with decreasing volume, consistent with a sorption-dominant system.

3.5. Sorption Calculations

We do not have sorption isotherm data for Utah Lake, but to show how sorption in Utah Lake could affect water column concentrations, we use data from Sposito [61], who measured P sorption on sandy clay loam soil. Utah Lake sediments are similar in texture, with an abundance of clays and sands [10]. We fit a Freundlich isotherm to these data (Figure 21), which resulted in a K d of 1039 and n of 2.08:
C s o l i d = 1039 · C l i q 1 / 2.08
where C s o l i d is the sediment concentration of P (mg/kg) and C l i q is the water column concentration of DP (mg/L). In Utah Lake, water column DP concentrations are generally below 0.1 mg/L; the literature data used for the isotherm have a larger range (Figure 21).
The average Utah Lake water column DP concentration of 0.03 mg/L (Figure 12) using a Kd of 1039 results in a sediment concentration of 192.5 mg/kg, as shown in Equation (6). This concentration, 192.5 mg/kg, is consistent with the published values for Utah Lake sediment. Studies show that about 40% of the P in the sediment is loosely sorbed or associated with redox-sensitive P, both fractions that would be involved with sorption processes in Utah Lake [10]. This means that about 266 mg/kg, with a range of 120 and 440 mg/kg, would be the sediment concentration in equilibrium with the water column [10,11]. If the water column were in equilibrium with sediment concentrations in a range of 120 and 440 mg/kg, the range of water column equilibrium concentrations would be about 0.010 to 0.16 mg/L using this isotherm.
To show how the sorption process acts as a buffer to water column concentrations from large mass inflows or removals from the system, we present example calculations. If we assume Utah Lake is 3 m deep and interacts with 10 cm of sediment, with a density of 1.8 in a water column that has an area of 10 cm2 (0.001 m2), this gives a water volume of 3 L and a sediment mass of 0.18 kg. If we assume the concentrations presented above, 0.03 mg/L and 192.5 mg/kg, this results in 0.09 mg and 34.65 mg of P in the water column and sediment, respectively, with a total of 34.74 mg of P in the system.
Using concentrations of 0.03 mg/L and 192.5 mg/kg as a baseline, we can compute the total mass of P that would need to be added or removed from the system to adjust the water column concentration from 0.02 mg/L to 0.07 mg/L, which is about the range of observed values in Utah Lake over the last 30 years (Table 4).
Where C l i q and C s o l i d are defined by Equation (6), P s o l i d = M s o l i d C s o l i d , P l i q = V l i q C l i q , P t o t = P s o l i d + P l i q , and P a d d e d is the mass difference in P t o t at the baseline concentration ( C l i q = 0.03 mg/L) and the current concentration. In Table 4, we assume that V l i q = 3 L and M s o l i d = 0.18 kg.
The data in Table 4 show that in order to change the water column concentration from 0.03 mg/L to 0.035, the system would require 2.68 mg of P in just 3 L of water. If this amount were added to the water column and not allowed to partition into the sediment, it would result in a concentration of 0.92 mg/L, a concentration over 25 times higher than the equilibrium concentration with the sediment. Similarly, you would need to remove 2.92 mg of P from the system to change the water column concentration from 0.030 mg/L to 0.025 mg/L. The amount that would need to be removed from the system (from both the sediment and water column) is over 32 times the total amount of P in the water column at the beginning. Doubling the water column P concentration to 0.06 mg/L would require the addition of 13.8 mg of P, an amount which, if added to 3 L of lake water with an initial concentration of 0.03 mg/L, would result in water with a concentration of 4.63 mg/L—more than 77 times the equilibrium concentration of 0.06 mg/L.
We can evaluate Utah Lake using the same approach, assuming a water depth of 3 m and a sediment depth of 10 cm. If we use the average Utah Lake volume of about 8 × 10⁸ m3 (8 × 10¹¹ L), this gives 4.8 × 10¹⁰ kg of sediment. Changing the water column concentration from 0.030 to 0.035 mg/L changes the sediment concentration from 192.5 to 207.3 mg/kg. The initial P mass in the water and sediment is 24 and 9240 t, respectively, with a total mass of 9264. The final P mass in the water and sediment would be 28 and 9951 t, respectively, with a total mass of 9979 t, a total change of about 715 t of P. This amount of added P is larger than the total estimated annual load from all sources. The addition of 715 t, with no outflow, would only change the water column concentration by 0.005 mg/L.
If we assume a much lower Kd value of 500, then changing water column concentrations from 0.030 to 0.035 mg/L would result in sediment concentration changes from 92.6 to 99.8 mg/kg. The initial DP mass in the water column is about 24 t, with about 4446 t of P in the sediment. The final mass is 28 t in the water, 4789 t in the sediment, and 4817 t in total, an increase of 347 t. While about half the amount using a Kd of 1038, this increase in P mass is about the same as the estimated annual load and only changes the water column concentration by 0.005 mg/L.
Conversely, reducing water concentrations from 0.030 mg/L to 0.025 mg/L would reduce sediment concentrations from 207.3 mg/kg to 192.5 mg/kg (Kd = 1039) or from 99.76 mg/kg to 92.63 mg/kg (Kd = 500) and require a total P mass reduction in the system of 780 t or 377 t, respectively. This corresponds to water column mass reductions from 28 t to 24 t, a reduction of 4 t for either case, as the water column concentration reductions are the same. To achieve the total mass reductions of 780 t or 377 t would require flushing the entire reservoir about 27 times or 13 times for Kd = 1039 or Kd = 500, respectively. This assumes that we flush 28 t of P each time, which is the mass of P in the water column at a concentration of 0.030 mg/L. This highlights how well-buffered water column concentrations are in Utah Lake. Even with a Kd as low as 100, it would require three complete flushing events to reduce water column concentrations from 0.030 mg/L to 0.025 mg/L, with sediment concentrations changing from 20.0 mg/kg to 18.5 mg/kg and reducing the total mass in the system to 72 t of P.

4. Discussion

4.1. Varability

The volume of Utah Lake varies significantly over time. From 1989 to 2023, the average lake volume was 7.9 × 10⁸ m3, with a standard deviation of 1.1 × 10⁸ m3. Yearly, the lake volume fluctuated by 3.7 × 10⁸ m3, about half the lake’s volume. Monthly variation showed that the volume increased by as much as 4.5 × 10⁷ m3 or decreased by as much as 8.0 × 10⁷ m3 depending on the time of year. Lake volumes typically peak in May and reach a trough in October. Between 1989 and 2023, lake volume reached an all-time high in 2011, peaking at 1.3 × 10⁹ m3, which is 1.7 times larger than the lake’s average volume. In contrast, the all-time low during the same period was in 1992, with a trough of 2.5 × 10⁸ m3, about a third of the lake’s average volume. Statistical analyses show that Utah Lake volumes for most years are different from the mean. Meanwhile, Jordan River outflows are on the order of 4.5 × 10⁷ m3 per month (Figure 3 and Figure 4), with P outflows that are about 10% of the total mass of P in the lake.
Despite large fluctuations in lake volume, DP concentrations remained relatively constant in Utah Lake from 1989 to 2023. Average values frequently ranged between 0.02 and 0.06 mg/L, with no statistically significant variation in annual mean values in any given year or month besides a few minor exceptions (see Section 3.2). DP did follow a pattern of being slightly higher in the fall and slightly lower in the spring, but these variations were not statistically significant over our study period. The data for DP did contain outliers, including one sample from July 1989, two samples from January 1991, and eleven samples from September 1997. The presence of these outliers, however, was insignificant given the 1658 total measurements used in this study. These data points were included in the analysis and did not change the results.
Lake volume variability and relatively constant P concentrations are best illustrated by Figure 10 and Figure 12, respectively. ANOM graphically presents individual group comparisons with the overall mean for the population. It uses decision boundaries based on the number of samples and the variability of the population to determine if any group is different from the entire population. Figure 10 and Figure 12 present the ANOM analysis with lake volume and lake concentration grouped by year and compared to the complete data set. Figure 10 shows that except for 1994, 2001, 2005, and 2013, the lake volume in all years is very different from the 34-year mean. The years that are not different are where the lake volume is transitioning from a wet to a dry period. In stark contrast, Figure 12 shows that with eight exceptions, in none of the years is the lake DP concentration statistically different from the long-term average. For the eight years where the concentrations are different from the average, the values are only slightly outside the decision boundaries. This constant concentration behavior is distinctly different from the variable volume data, where nearly all the years were considerably outside the decision boundaries.
We estimate the mass of DP in Utah Lake to be between 10 and 50 t at any given time (Figure 19), with monthly mass changes that can be either positive or negative, increasing or decreasing by as much as 15 t (Figure 20). Current estimates for external TP loading, however, are between 18 and 35 t/month and are always positive [4,5,6,7,8]. We show that the monthly change in DP mass in Utah Lake is comparable in magnitude or exceeds the estimated total P load to the lake and that the differences in loading must be attributable to internal cycling caused by sediment–water interactions.
For a simple mass balance model, like the one presented in Equation (5), a lake would be expected to have its P concentration reduced by 50% if the lake’s volume was doubled based on dilution. Conversely, if the lake’s volume were decreased by 50% (half the volume), we would expect a concentration increase of 100%. The volume of Utah Lake often doubles in response to spring runoff, but the DP concentration only decreases slightly. Conversely, in late summer, the lake loses half its volume from evaporation with little increase in P concentration. The average monthly P concentration in the spring is not statistically different from the annual DP concentrations, nor is the concentration in the summer statistically different from the average DP concentration (Figure 13 and Figure 14). This implies that sorption is so dominant that lake concentrations are insensitive to external P loads.

4.2. Isotherm Calculations Implications

While we do not have isotherm data specific to Utah Lake, we showed in Section 3.5 that using Kd values of 1039 (from the literature) and 500 (an assumed reduction) still require additions of 714 t and 346 t of P, respectively, to change the water column concentration of Utah Lake from 0.030 mg/L to 0.035 mg/L, a change of only 0.005 mg/L. Conversely, changing the water column concentration from 0.030 mg/L to 0.025 mg/L would require flushing Utah Lake approximately 27, 13, or 3 times, assuming Kd values of 1039, 500, or 100, respectively.
These calculations assume the water column only interacts with sediments down to a depth of 10 cm. P-rich sediments are 1000’s of meters deep, and because diffusion processes transport P upward from the deeper sediments, the amount of sediment that could interact with the water column is practically infinite. If P is depleted from the near-surface sediments, additional P will diffuse from the anoxic regions with high P values in the pore water. If additional P is added, the P in the sediment will form calcite complexes, essentially removing the P from shorter-term equilibrium sorption processes. The sediment acts as a buffer to keep Utah Lake water column concentrations constant and insensitive to external loads.
We hypothesize that the variations seen in Utah Lake water column P concentrations are due to short-term kinetics, where the system is temporarily moved away from equilibrium by events such as high spring inflows, which dilute the P concentration in the water column, or late summer evaporation, which increases water column P concentrations. As concentrations move from the equilibrium concentration, sorption processes either add or remove P from the water column to re-establish equilibrium. This sorption-dominated model is supported by the limited variability of P concentrations in the water column over our 34-year study period, and the data that show that measured sediment P concentrations in the fractions associated with sorption processes match those predicted by the model.
This simple example, using isotherm data from the literature and an assumed reduction, demonstrates that water column concentrations of P in Utah Lake are essentially independent of external P loads and will remain constant even if external P sources, such as WWTP effluent, are significantly reduced.

4.3. Sorption Lines of Evidence

Using publicly available data, we presented analyses and data that strongly support the hypothesis that water column concentrations of P in Utah Lake are governed by sorption processes. This is unusual, as water column P concentrations in most lakes are better modeled by a mass balance approach, where reducing or increasing nutrient loads will reduce or increase water column concentrations, respectively. Utah Lake is unique in a number of aspects that allow sorption processes to dominate mass balance flows to the point where other loads or removals have a limited impact. While we have no concrete data to prove our hypothesis, we have a number of different lines of evidence that all strongly support our theory.
The main arguments and data that support the hypothesis that Utah Lake water column concentrations are governed by sorption processes are as follows:
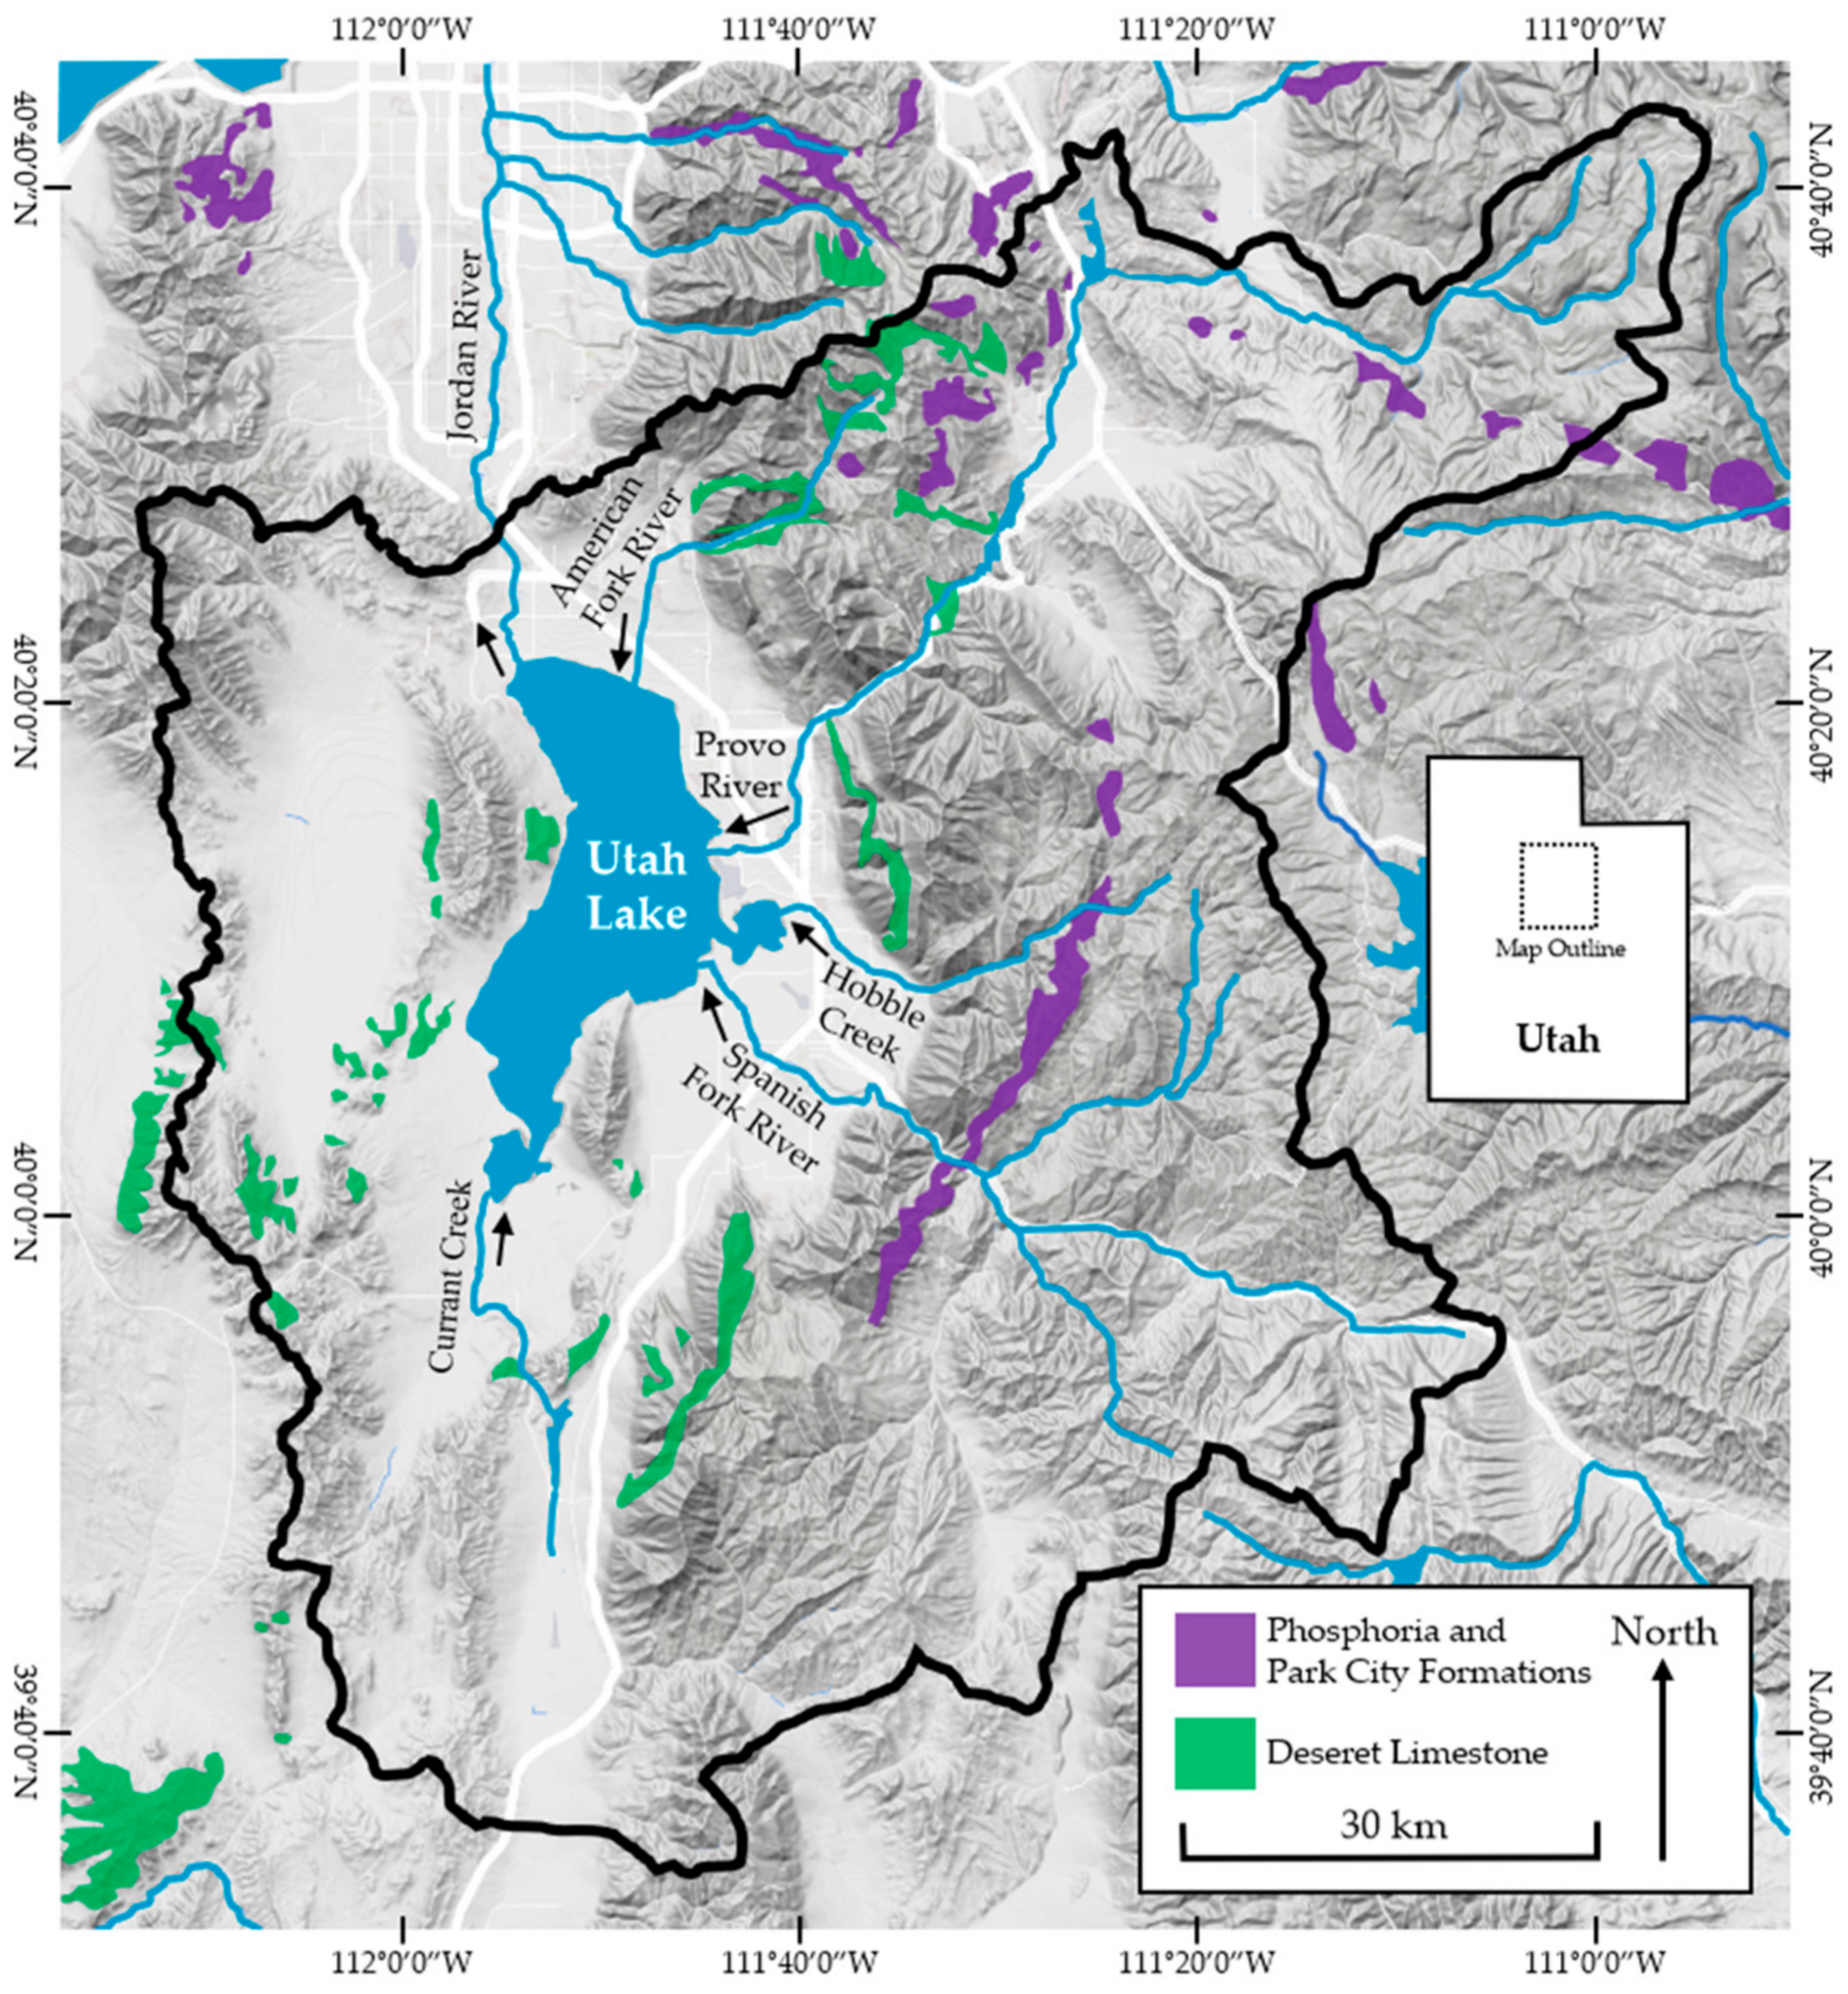
  • Utah Lake sediments are high in P that is available for partitioning. This P is geologic in origin rather than anthropogenic. Lakebed sediments [10], surrounding lacustrine soils [11], and sediment 40 km upstream [12] all have P concentrations on the order of 1000 mg/kg, with about 40% of the P in the fractions being available to the sorption process [10]. In addition, the sediments underlying the lake are deep [27], and because of the potential for anaerobic releases, the sediments represent an essentially infinite reservoir of P.
  • Utah Lake is very shallow, with a long fetch (~40 km), and strong winds. The lake does not stratify, and because of the depth, fetch, and winds, the lake’s sediments are continually mixed with the water column. We regularly measure total suspended solid concentrations on the order of 1000 mg/L and Secchi depths of a few 10s of cm. Because of this mixing with sediments, the water column can equilibrate with sediments in a sorption process.
  • Utah Lake has a large population of invasive carp. These fish contribute to sediment water column mixing through bioturbation, continually stirring up the sediment through bottom feeding and by preventing the establishment of vegetation that could armor the lakebed and help isolate the sediment from the water column [13].
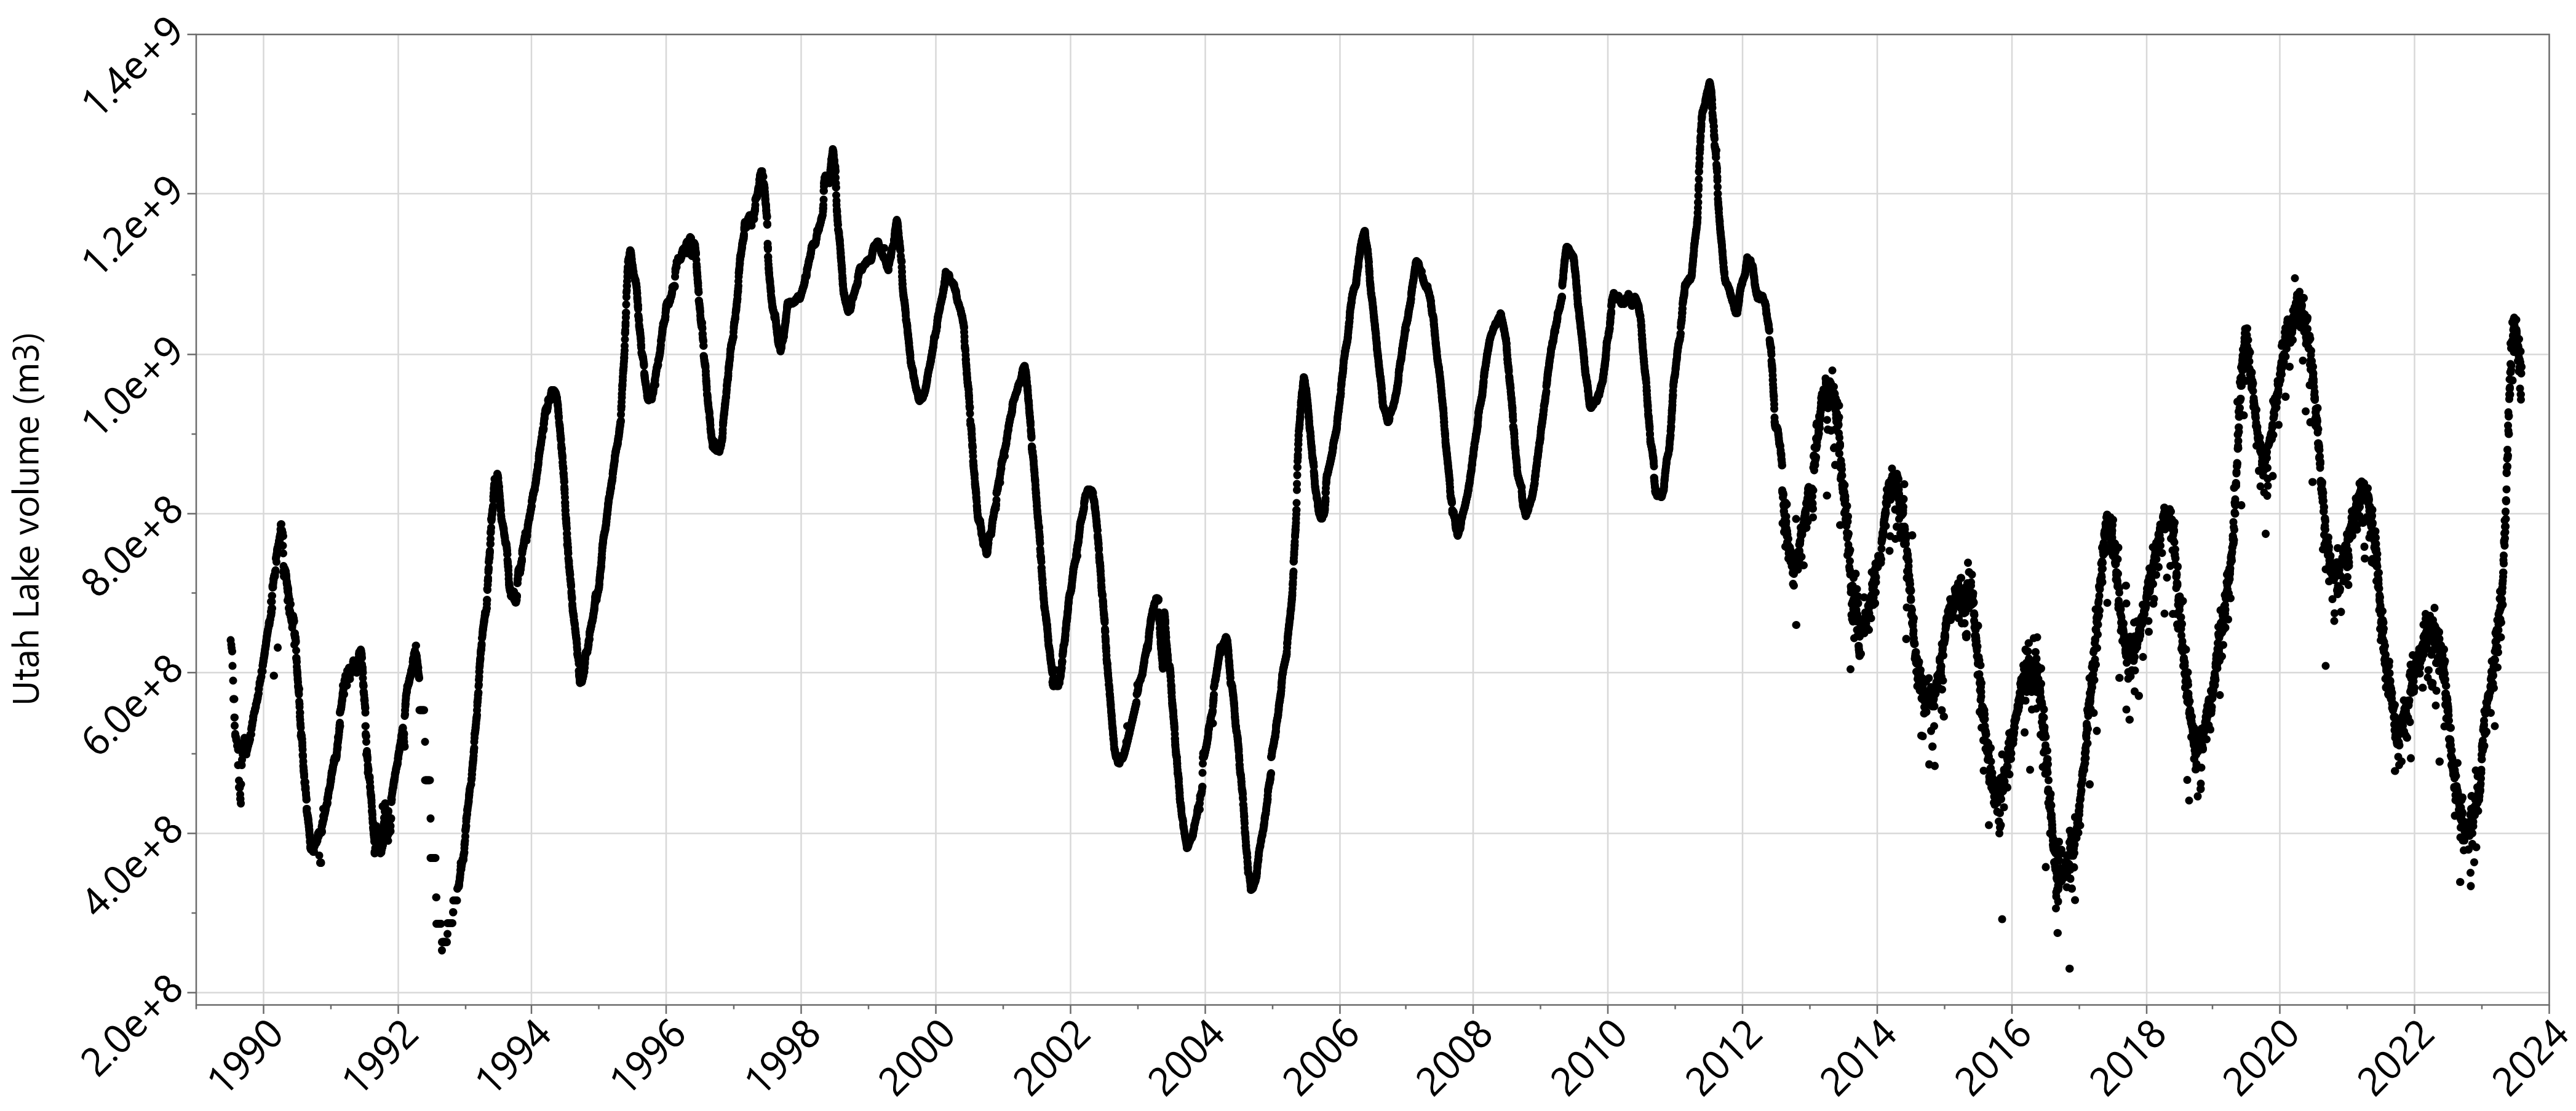
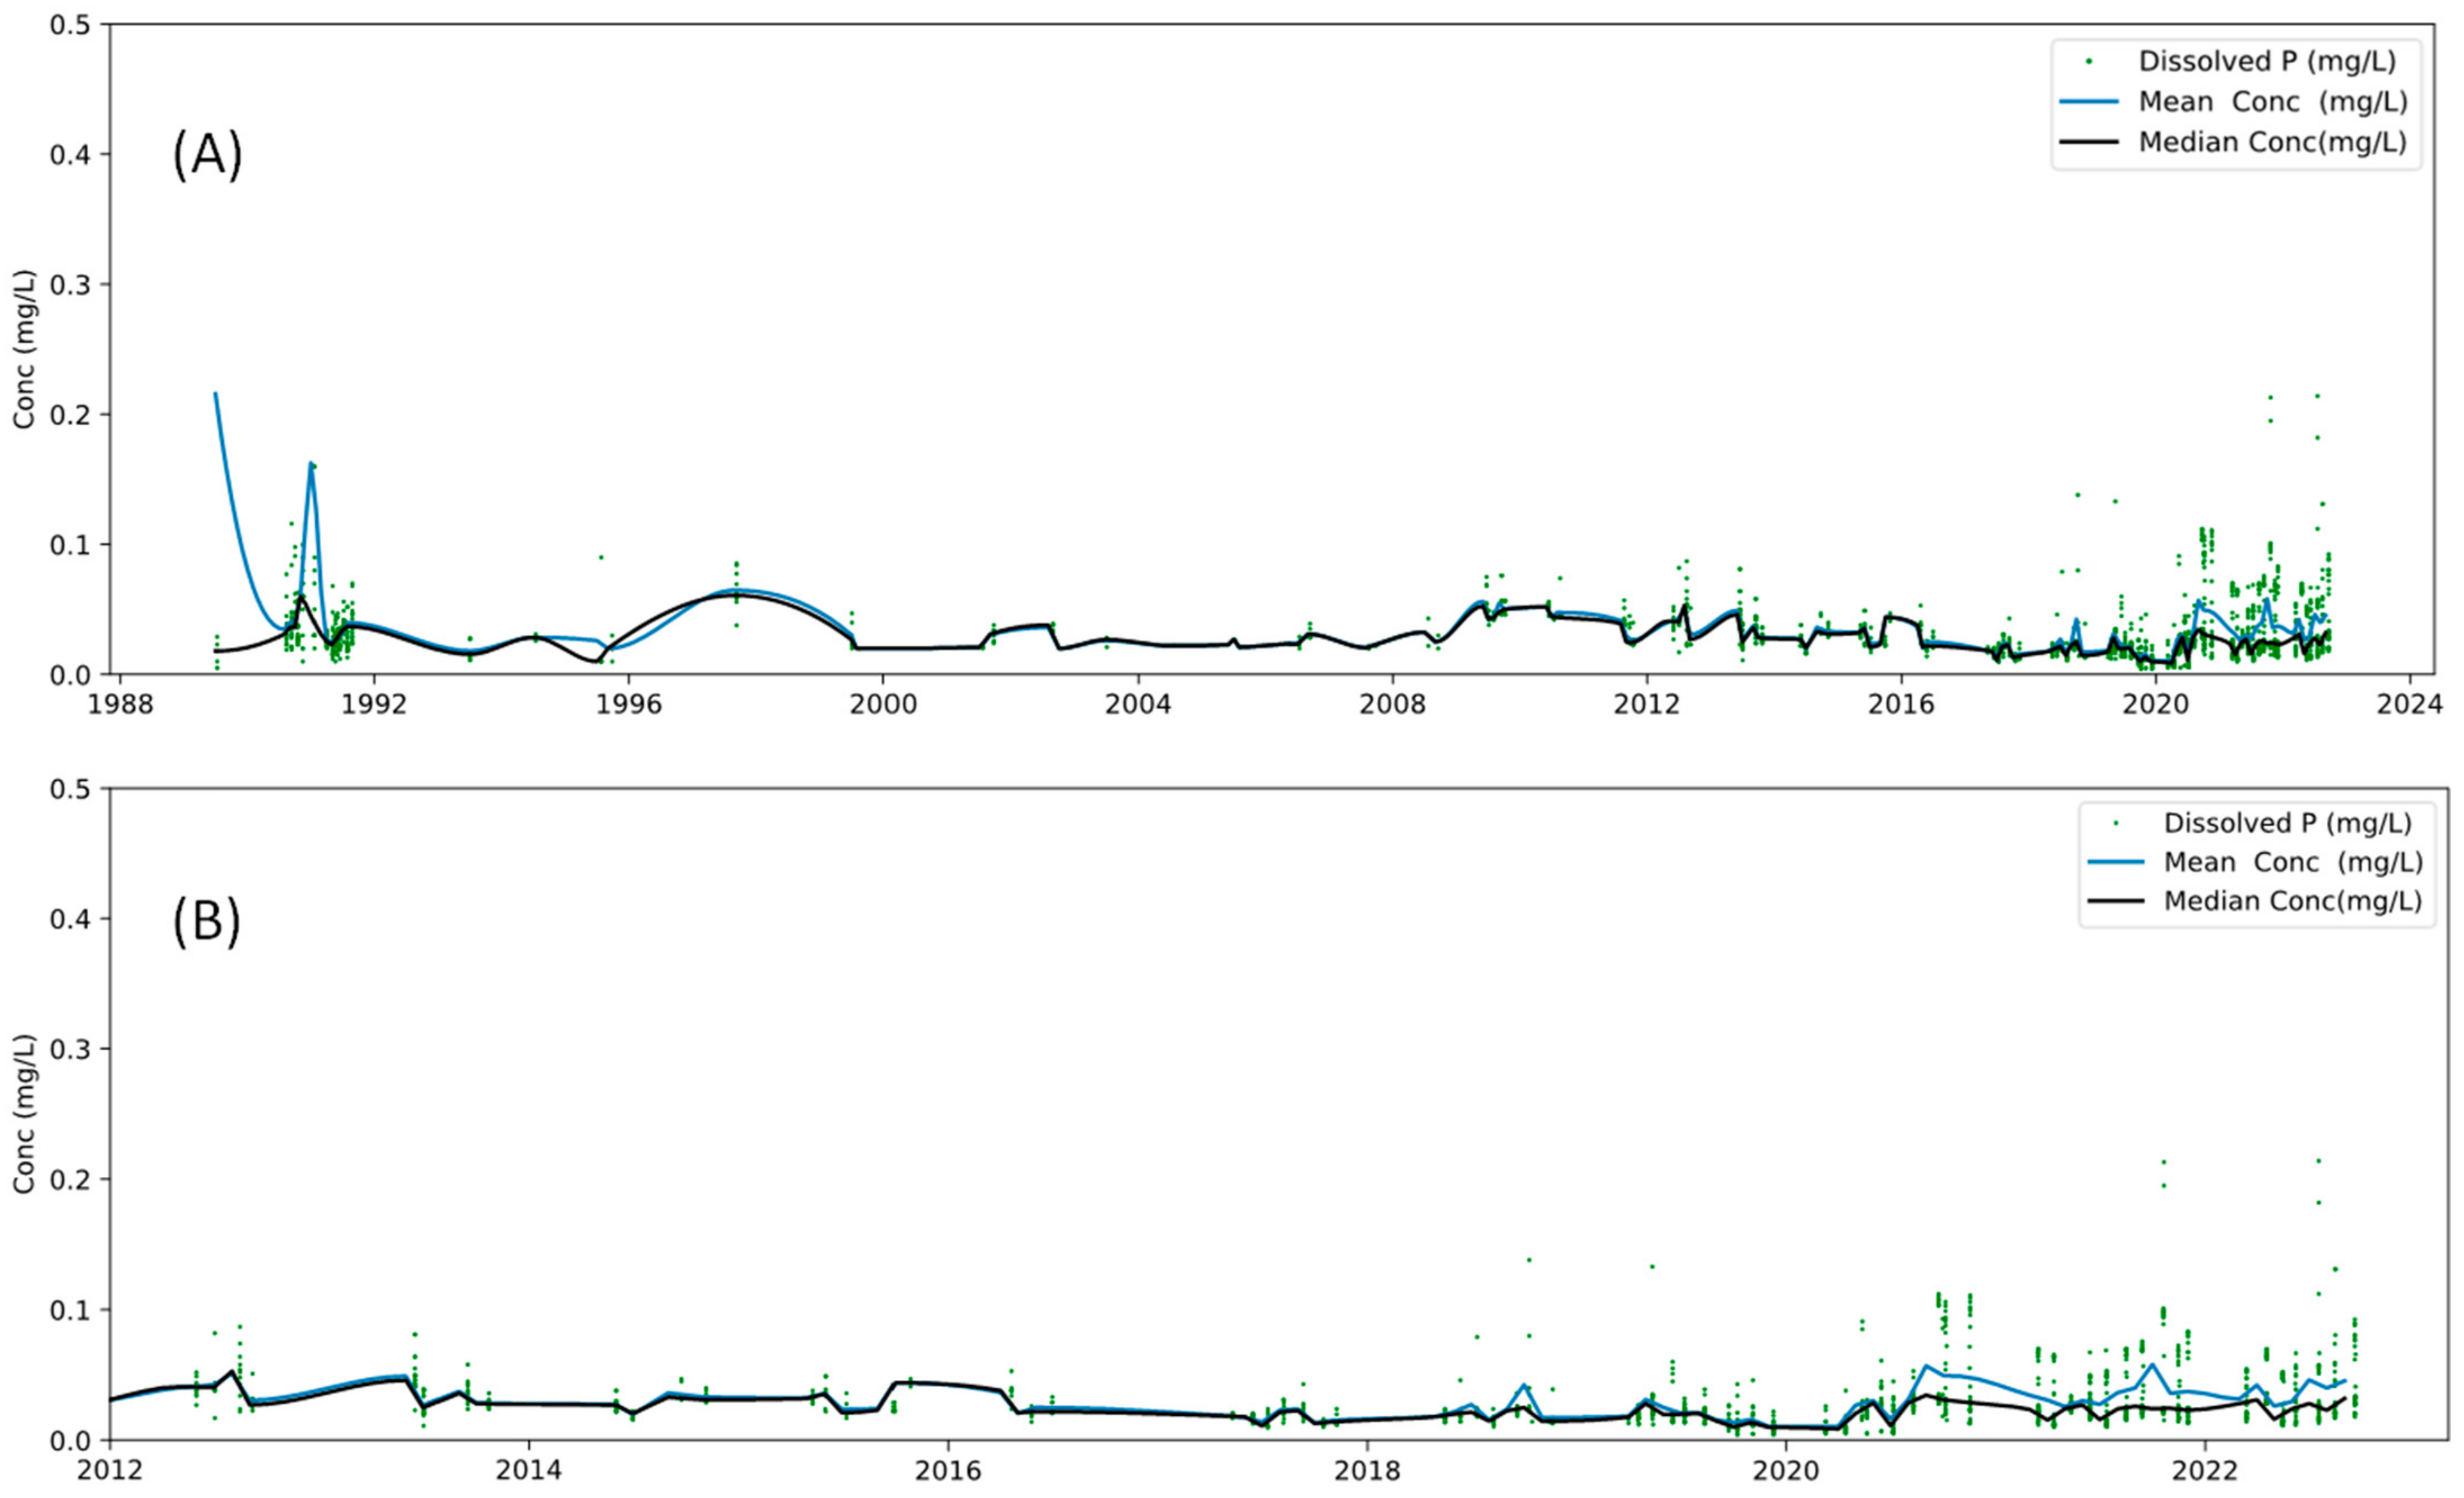
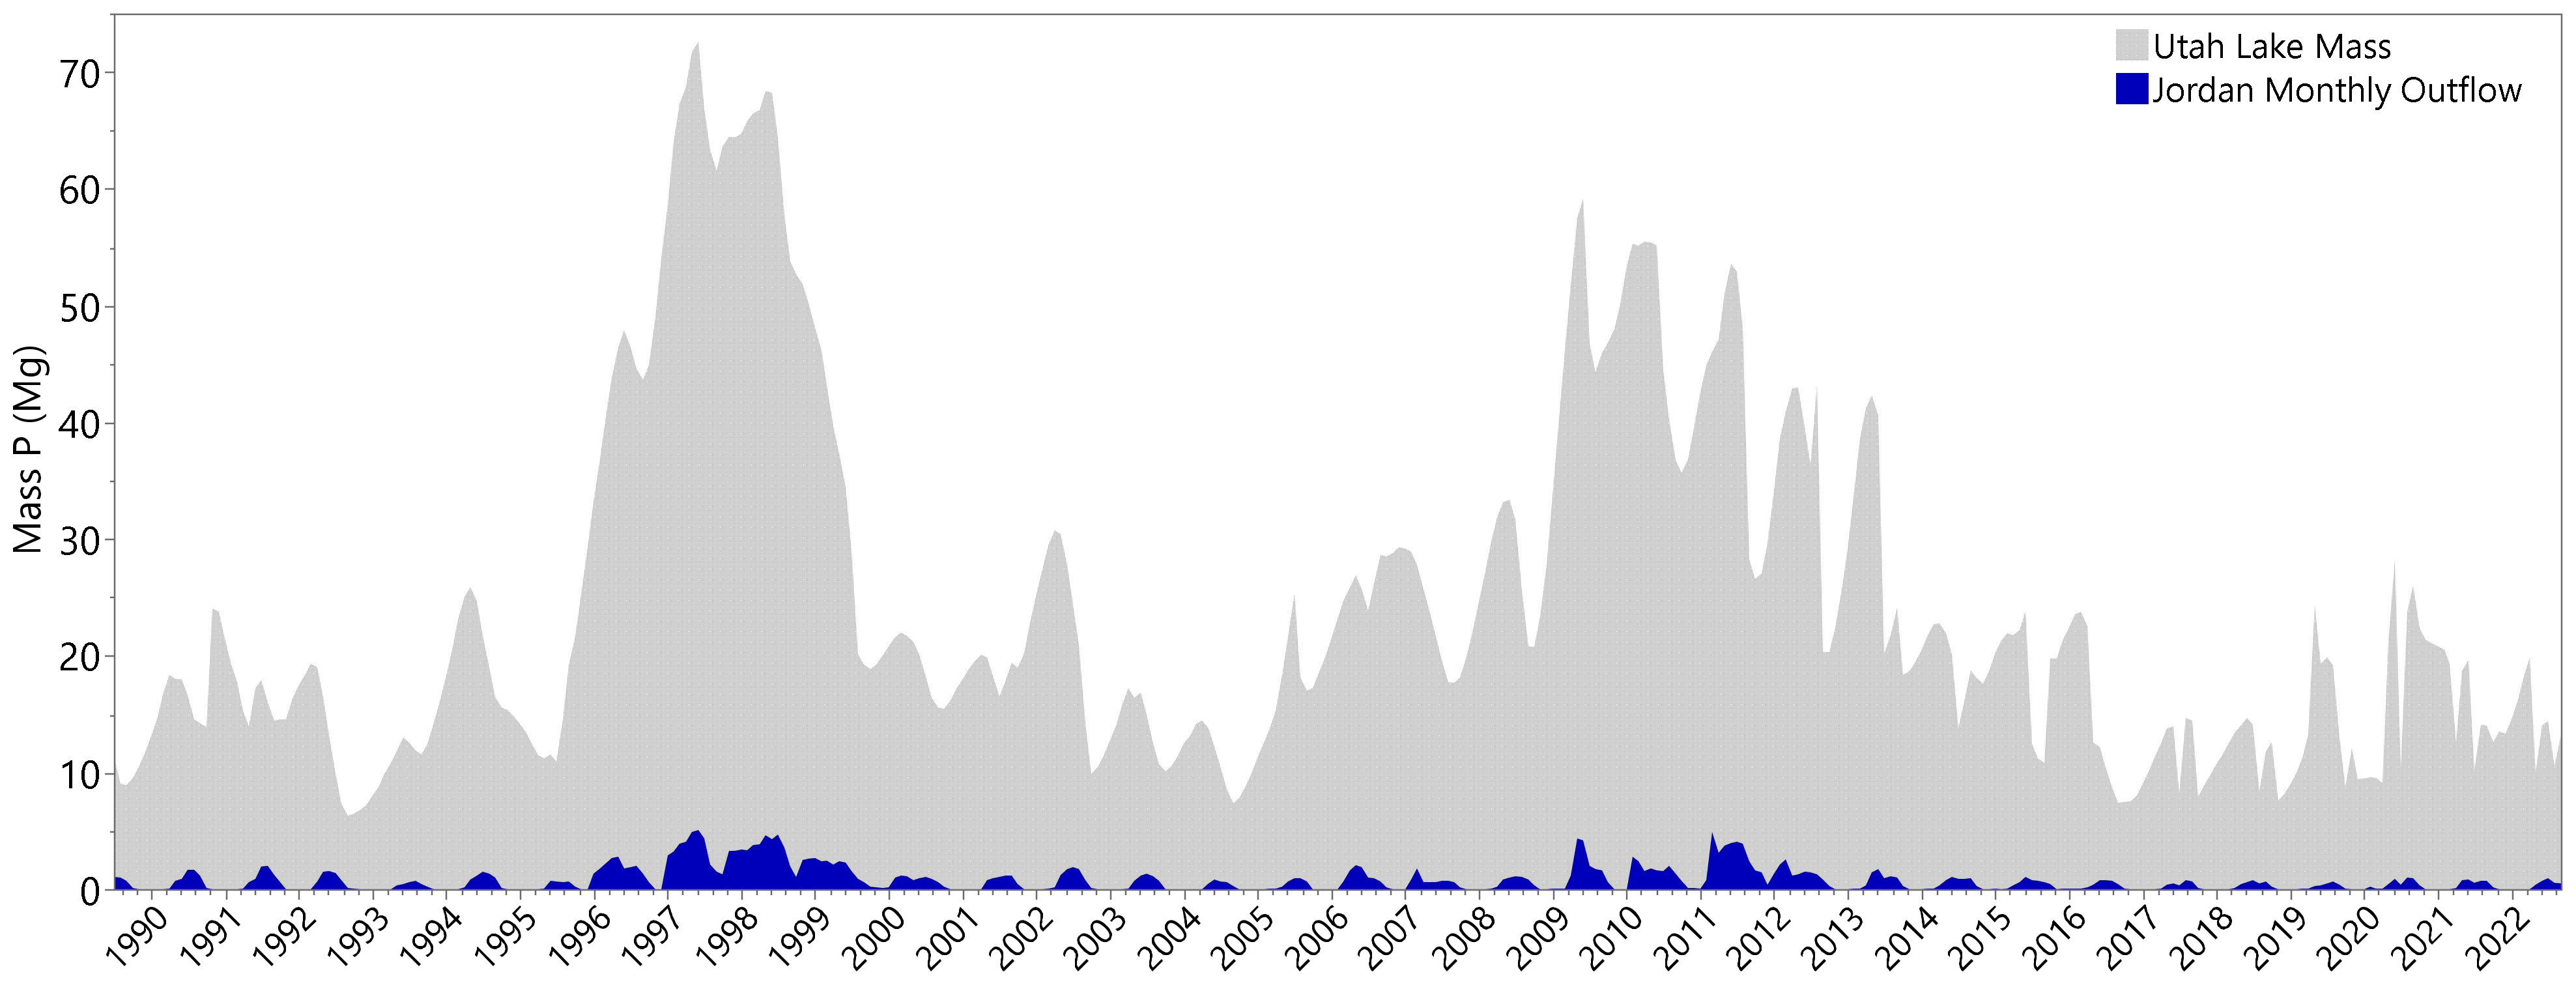
  • Utah Lake volumes are variable, easily changing volume by a factor of 2 in any given year, and often more (Section 3.1.1). Conversely, DP concentrations in Utah Lake are relatively constant, with values ranging from about 0.02 to 0.06 mg/L but remain mostly in the 0.03 to 0.04 range (Section 3.2). With large changes in lake volume, we would expect P concentrations to be diluted in the spring after spring runoff fills the lake and then be concentrated in the late summer, as about half the lake volume is lost to evaporation. While we do see changes in water column DP, they are small and are better explained by the kinetics of sorption processes.
  • An ANOM analysis of Utah Lake volume (Figure 10) and water column DP concentrations by year (Figure 12) shows that, for most years, the volume is outside of the decision boundaries and is significantly different from the mean, while the opposite is true for the concentration data—only a few years are outside the boundaries and only by a small amount. Statistically, the different annual average concentrations are not different from the population mean when nearly all the annual average yearly volumes are different from the population mean.
  • Monthly changes in the mass of DP in the water column show that large changes can occur in just a month’s time (Section 3.4). When we estimate P inflows using lake mass and Jordan River mass outflows, we see that monthly mass inflows are large and switch from loads to removals in short time periods (Section 3.4). These estimated monthly mass inflows are larger in magnitude than estimated loads. More importantly, these loads are both positive and negative, switching from month to month. This can easily be explained using a sorption approach, where the sorption term is significantly larger than other P loads or sinks. This same phenomenon is difficult to explain using external loads alone.
  • Using an isotherm fitted to data taken from the literature (as we do not have an isotherm for Utah Lake sediments) and an assumed value of half the literature’s Kd value, we can show the following:
    • The sediment concentration at equilibrium with a water column concentration of 0.03 mg/L (the average) is consistent with measured sediment P concentrations in the fractions available for sorption.
    • Because of the large sediment reservoir, it would require large P loads to cause even small changes in water column P concentrations when the system is at equilibrium. In a system without this large sediment reservoir in equilibrium with the water column, loads this large would increase water column concentrations by almost two orders of magnitude.
    • In most lakes, the water column is not vertically-mixed well enough to be in equilibrium with reservoir sediments and the reservoir sediments are not enriched in P from geological sources. These two unique features, shallow waters that are well mixed with sediments enriched in geologic P, allow sorption processes to dominate water column P concentrations.
    • It would require the addition of either 714 t or 346 t of P to change water column concentrations by only 0.005 mg/L for Kd values of 1039 and 500, respectively; this buffering process is supported by the constant water column concentrations observed over our 34-year study period.
These separate lines of evidence all support the hypothesis that water column P concentrations in Utah Lake are dominated by sorption processes and that water column concentrations are insensitive to external loads. This evidence supports the assertion that changing anthropogenic P loads to Utah Lake would have little to no impact on water column concentrations. For example, if WWTP loads were able to be reduced to zero, this analysis shows that water column P concentrations would not be decreased but would instead remain similar to historical levels.

5. Conclusions

We used publicly available data to analyze the variability of lake volumes, water column DP concentrations, and water outflow of Utah Lake. Using these data, we estimated the mass of DP in Utah Lake over time, along with changes in the mass of DP in the lake. Through statistical analysis, we showed that volumes are variable but that DP concentrations are relatively constant. Further, water column DP concentrations do not change as expected; we would expect the dilution of P as the lake fills as well as the concentration of P as the lake evaporates. We show that monthly changes in mass are large compared to estimated loads to the lake and that these changes switch from representing net sinks to net sources from one month to the next, a finding that is not consistent with simple mass balance models. Using an assumed isotherm, we show how these large mass changes, switching from a sink to source, are consistent with a mass balance model dominated by sorption processes. We estimate, using assumed isotherm data, that reducing or even eliminating external loads to Utah Lake will have little impact on water column P concentrations. Data from published studies highlight the fact that P sediments and soils in and around Utah Lake are geologic in origin, not anthropogenic, and represent a very large, essentially infinite reservoir for P. Importantly, we computed that measured average lake water column P concentrations of 0.03 mg/L are consistent with measured sediment P concentrations in the fractions available for sorption.
This study has implications for other shallow lakes with significant sediment–water interactions. If these lakes have sediments with high concentrations of P from geologic sources, water column concentrations could behave independently from external loads. For sorption to dominate in this manner requires several unique circumstances, including shallow water with no stratification, significant water–sediment interaction, and high background P concentrations in the sediment. While these conditions are unusual, they are not unique. We present this case study as a framework that can be used to evaluate and study other lakes or reservoirs.
For lakes and reservoirs that have water column P concentrations primarily driven by sorption processes, costs and efforts aimed at nutrient load reductions may prove ineffective. Other remedial or restoration efforts, such as measures that stabilize sediments and limit sediment–water interactions, may prove more feasible.

Author Contributions

Conceptualization, G.P.W. and J.B.T.; methodology, G.P.W., J.B.T. and R.L.R.; software, G.P.W.; validation, A.W.M.; formal analysis, G.P.W., J.B.T. and R.L.R.; investigation, G.P.W., J.B.T. and R.L.R.; resources, G.P.W. and A.W.M.; data curation, G.P.W., J.B.T. and R.L.R.; writing—original draft preparation, G.P.W., J.B.T. and R.L.R.; writing—review and editing, G.P.W., J.B.T., A.W.M., R.L.R., R.A.V., K.B.T. and A.C.C.; visualization, G.P.W., J.B.T. and R.L.R.; supervision, G.P.W. and A.W.M.; project administration, G.P.W. and A.W.M. All authors have read and agreed to the published version of the manuscript.

Funding

This research received no external funding.

Data Availability Statement

Publicly available datasets were analyzed in this study. These data can be found here in the links provided in the reference section and associated descriptions of data in the manuscript.

Acknowledgments

We would like to thank the Bureau of Reclamation, the Utah Division of Water Rights, and the Utah Department of Environmental Quality for making their databases publicly available so that we could conduct this study. We would like to acknowledge the Wasatch Front Water Quality Council for their support in this field.

Conflicts of Interest

The authors declare no conflicts of interest.

References

  1. DWQ. Utah Lake Water Quality Study Stakeholder Process, Version 10—Approved May 12, 2017; Utah Department of Environmental Quality Water Quality: Salt Lake City, UT, USA, 2017; pp. 1–11.
  2. DWQ. Study Phases: Utah Lake Water Quality Study. Available online: https://deq.utah.gov/water-quality/study-phases-utah-lake (accessed on 6 February 2024).
  3. DEQ. Utah Lake Water Quality Study Phase 1 Report, Final—December 7, 2018; Utah Department of Environmental Quality: Salt Lake City, UT, USA, 2018; pp. 1–111.
  4. Brett, M. Quantification of nutrient inputs, sediment storage and release, and long-term recovery in Utah Lake. In Proceedings of the Utah Lake Science Panel Meeting, Salt Lake City, UT, USA, 29 June 2023. [Google Scholar]
  5. Brown, M.M.; Telfer, J.T.; Williams, G.P.; Miller, A.W.; Sowby, R.B.; Hales, R.C.; Tanner, K.B. Nutrient Loadings to Utah Lake from Precipitation-Related Atmospheric Deposition. Hydrology 2023, 10, 200. [Google Scholar] [CrossRef]
  6. Barrus, S.M.; Williams, G.P.; Miller, A.W.; Borup, M.B.; Merritt, L.B.; Richards, D.C.; Miller, T.G. Nutrient Atmospheric Deposition on Utah Lake: A Comparison of Sampling and Analytical Methods. Hydrology 2021, 8, 123. [Google Scholar] [CrossRef]
  7. Olsen, J.M.; Williams, G.P.; Miller, A.W.; Merritt, L. Measuring and Calculating Current Atmospheric Phosphorous and Nitrogen Loadings to Utah Lake Using Field Samples and Geostatistical Analysis. Hydrology 2018, 5, 45. [Google Scholar] [CrossRef]
  8. Telfer, J.T.; Brown, M.M.; Williams, G.P.; Tanner, K.B.; Miller, A.W.; Sowby, R.B.; Miller, T.G. Source Attribution of Atmospheric Dust Deposition to Utah Lake. Hydrology 2023, 10, 210. [Google Scholar] [CrossRef]
  9. Hogsett, M.; Li, H.; Goel, R. The Role of Internal Nutrient Cycling in a Freshwater Shallow Alkaline Lake. Environ. Eng. Sci. 2019, 36, 551–563. [Google Scholar] [CrossRef]
  10. Randall, M.C.; Carling, G.T.; Dastrup, D.B.; Miller, T.; Nelson, S.T.; Rey, K.A.; Hansen, N.C.; Bickmore, B.R.; Aanderud, Z.T. Sediment potentially controls in-lake phosphorus cycling and harmful cyanobacteria in shallow, eutrophic Utah Lake. PLoS ONE 2019, 14, e0212238. [Google Scholar] [CrossRef] [PubMed]
  11. Abu-Hmeidan, H.Y.; Williams, G.P.; Miller, A.W. Characterizing total phosphorus in current and geologic utah lake sediments: Implications for water quality management issues. Hydrology 2018, 5, 8. [Google Scholar] [CrossRef]
  12. Casbeer, W.; Williams, G.P.; Borup, M.B. Phosphorus Distribution in Delta Sediments: A Unique Data Set from Deer Creek Reservoir. Hydrology 2018, 5, 58. [Google Scholar] [CrossRef]
  13. PSOMAS. Utah Lake TMDL: Pollutant Loading Assessment & Designated Beneficial Use Impairment Assessment; PSOMAS: Salt Lake City, UT, USA, 2007. [Google Scholar]
  14. Hooton, L.W., Jr. Utah Lake & Jordan River Water Rights & Management Plan; The Salt Lake City Department of Public Utilities: Salt Lake City, UT, USA, 1989. [Google Scholar]
  15. United States Fish and Wildlife Service. Reclassification of the Endangered June Sucker to Threatened with a Section 4(d) Rule; Final Rule; Fish and Wildlife Service: West Valley City, UT, USA, 2021; pp. 192–212.
  16. URMCC. Utah Reclamation Mitigation and Conservation Commission—Utah Lake Wetland Preserve. Available online: https://www.mitigationcommission.gov/wetlands/wetlands_ulwp.html (accessed on 10 November 2023).
  17. Zanazzi, A.; Wang, W.; Peterson, H.; Emerman, S.H. Using Stable Isotopes to Determine the Water Balance of Utah Lake (Utah, USA). Hydrology 2020, 7, 88. [Google Scholar] [CrossRef]
  18. State of Utah Division of Water Quality. Text of the Final TBPEL Rule (R317-1-3.3); Division of Water Quality: Salt Lake City, UT, USA, 2015.
  19. Clark, D.L.; Kirby, S.M.; Oviatt, C.G. Geologic Map of the Rush Valley 30′ × 60′ Quadrangle, Tooele, Utah, and Salt Lake Counties, Utah; Utah Geological Survey: Salt Lake City, UT, USA, 2023.
  20. Constenius, K.N.; Clark, D.L.; King, J.K.; Ehler, J.B. Interim Geologic Map of the Provo 30′ × 60′ Quadrangle, Utah, Wasatch, and Salt Lake Counties, Utah; Utah Geological Survey: Salt Lake City, UT, USA, 2011.
  21. Pampeyan, E.H. Geological Map of the Lynndyl 30′ × 60′ Quadrangle, West-Central Utah; Utah Geological Survey: Salt Lake City, UT, USA, 2005.
  22. Witkind, I.J.; Weiss, M.P. Geologic Map of the Nephi 30′ × 60′ Quadrangle, Carbon, Emery, Juab, Sanpete, Utah, and Wasatch Counties, Utah; U.S. Geological Survey: Denver, CO, USA, 1991.
  23. Rupke, A. Today’s (And Tomorrow’s?) Phosphate. Surv. Notes 2015, 47, 6–7. [Google Scholar]
  24. Jewell, P.W.; Silberling, N.J.; Nichols, K.M. Geochemistry of the Mississippian Delle Phosphatic Event, Eastern Great Basin, U.S.A. J. Sediment. Res. 2000, 70, 1222–1233. [Google Scholar] [CrossRef]
  25. Hiatt, E.E.; Budd, D.A. Sedimentary phosphate formation in warm shallow waters: New insights into the paleoceanography of the Permian Phosphoria Sea from analysis of phosphate oxygen isotopes. Sediment. Geol. 2001, 145, 119–133. [Google Scholar] [CrossRef]
  26. Maughan, E.K. Phosphoria Formation (Permian) and Its Resource Significance in the Western Interior, U.S.A. Pangea Glob. Environ. Resour. 1994, Memoir 17, 479–495. [Google Scholar]
  27. Hintze, L.F.; Kowallis, B.J. Geologic History of Utah: A Field Guide to Utah’s Rocks, Special Publications 9th ed.; Department of Geological Sciences, Brigham Young University: Provo, UT, USA, 2009. [Google Scholar]
  28. Vollenweider, R.A. Possibilities and limits of elementary models concerning budget of substances in lakes. Arch. Hydrobiol. 1969, 66, 1. [Google Scholar]
  29. Mueller, D.K. Mass Balance Model Estimation Of Phosphorus Concentrations In Reservoirs 1. JAWRA J. Am. Water Resour. Assoc. 1982, 18, 377–382. [Google Scholar] [CrossRef]
  30. Vollenweider, R.A. Input-output models: With special reference to the phosphorus loading concept in limnology. Schweiz. Z. Hydrol. 1975, 37, 53–84. [Google Scholar] [CrossRef]
  31. Jones, J.R.; Bachmann, R.W. Prediction of Phosphorus and Chlorophyll Levels in Lakes. Water Pollut. Control Fed. 1976, 48, 2176–2182. [Google Scholar]
  32. Bryhn, A.C.; Håkanson, L. A Comparison of Predictive Phosphorus Load-Concentration Models for Lakes. Ecosystems 2007, 10, 1084–1099. [Google Scholar] [CrossRef]
  33. Chapra, S.C. Total Phosphorus Model for the Great Lakes. J. Environ. Eng. Div. 1977, 103, 147–161. [Google Scholar] [CrossRef]
  34. Chapra, S.C. Surface Water-Quality Modeling; Waveland Press, Inc.: Long Grove, IL, USA, 2008. [Google Scholar]
  35. Chapra, S.C.; Dolan, D.M. Great Lakes total phosphorus revisited: 2. Mass balance modeling. J. Gt. Lakes Res. 2012, 38, 741–754. [Google Scholar] [CrossRef]
  36. Dillon, P.J.; Rigler, F.H. A Test of a Simple Nutrient Budget Model Predicting the Phosphorus Concentration in Lake Water. J. Fish. Res. Board Can. 1974, 31, 1771–1778. [Google Scholar] [CrossRef]
  37. Boynton, W.R.; Garber, J.H.; Summers, R.; Kemp, W.M. Inputs, Transformations, and Transport of Nitrogen and Phosphorus in Chesapeake Bay and Selected Tributaries. Estuaries 1995, 18, 285–314. [Google Scholar] [CrossRef]
  38. Anagnostou, E.; Gianni, A.; Zacharias, I. Ecological modeling and eutrophication—A review. Nat. Resour. Model. 2017, 30, e12130. [Google Scholar] [CrossRef]
  39. Bhagowati, B.; Ahamad, K.U. A review on lake eutrophication dynamics and recent developments in lake modeling. Ecohydrol. Hydrobiol. 2019, 19, 155–166. [Google Scholar] [CrossRef]
  40. Klump, J.V.; Edgington, D.N.; Sager, P.E.; Robertson, A. Sedimentary phosphorus cycling and a phosphorus mass balance for the Green Bay (Lake Michigan) ecosystem. Can. J. Fish. Aquat. Sci. 1997, 54, 10–26. [Google Scholar] [CrossRef]
  41. Van Heyst, A.; Sinclair, A.; Jamieson, R. Application of phosphorus loading models to understand drivers of eutrophication in a complex rural lake-watershed system. J. Environ. Manag. 2022, 302, 114010. [Google Scholar] [CrossRef] [PubMed]
  42. Noges, P. Water and nutrient mass balance of the partly meromictic temperate Lake Verevi. In Lake Verevi, Estonia—A Highly Stratified Hypertrophic Lake; Springer: Dordrecht, The Netherlands, 2005; pp. 21–31. [Google Scholar] [CrossRef]
  43. Havens, K.E.; James, R.T. The Phosphorus Mass Balance of Lake Okeechobee, Florida: Implications for Eutrophication Management. Lake Reserv. Manag. 2005, 21, 139–148. [Google Scholar] [CrossRef]
  44. Pollman, C.D.; James, R.T. A simple model of internal loading of phosphorus in Lake Okeechobee. Lake Reserv. Manag. 2011, 27, 15–27. [Google Scholar] [CrossRef]
  45. Kelderman, P.; Wei, Z.; Maessen, M. Water and mass budgets for estimating phosphorus sediment–water exchange in Lake Taihu (China P. R.). Hydrobiologia 2005, 544, 167–175. [Google Scholar] [CrossRef]
  46. Søndergaard, M.; Bjerring, R.; Jeppesen, E. Persistent internal phosphorus loading during summer in shallow eutrophic lakes. Hydrobiologia 2013, 710, 95–107. [Google Scholar] [CrossRef]
  47. van der Salm, C.; Kros, J.; de Vries, W. Evaluation of different approaches to describe the sorption and desorption of phosphorus in soils on experimental data. Sci. Total Environ. 2016, 571, 292–306. [Google Scholar] [CrossRef] [PubMed]
  48. Wang, H.; Appan, A.; Gulliver, J.S. Modeling of phosphorus dynamics in aquatic sediments: I—Model development. Water Res. 2003, 37, 3928–3938. [Google Scholar] [CrossRef] [PubMed]
  49. Spears, B.; Carvalho, L.; Paterson, D. Phosphorus partitioning in a shallow lake: Implications for water quality management. Water Environ. J. 2007, 21, 47–53. [Google Scholar] [CrossRef]
  50. Fetter, C.W. Applied Hydrogeology, 4th ed.; Waveland Press, Inc.: Long Grove, IL, USA, 2001. [Google Scholar]
  51. United States Bureau of Reclamation. Historic Data|Water Operations|UC Region|Bureau of Reclamation. Available online: https://www.usbr.gov/rsvrWater/HistoricalApp.html (accessed on 23 October 2023).
  52. DWR. Document Listing for Folder: DSYS059REPORT. Available online: https://www.waterrights.utah.gov/cgi-bin/docview.exe?Folder=DSYS059REPORT&Key=Sort%20by%20Date (accessed on 23 October 2023).
  53. DWQ. Databases & Information. Available online: https://deq.utah.gov/water-quality/databases-and-information (accessed on 23 October 2023).
  54. Kramer, C.Y. Extension of multiple range tests to group means with unequal numbers of replications. Biometrics 1956, 12, 307–310. [Google Scholar] [CrossRef]
  55. Tukey, J.W. The problem of multiple comparisons. In Multiple Comparisons; Chapman and Hall: Boca Raton, FL, USA, 1953. [Google Scholar]
  56. McKinney, W. Data structures for statistical computing in python. In Proceedings of the 9th Python in Science Conference, Austin, TX, USA, 28 June–3 July 2010; pp. 51–56. [Google Scholar]
  57. Sparks, D.L. Environmental Soil Chemistry, 3rd ed.; Academic Press: San Diego, CA, USA, 2003. [Google Scholar]
  58. Brezonik, P.L.; Arnold, W.A. Water Chemistry: An Introduction to the Chemistry of Natural and Engineered Aquatic Systems; Oxford University Press, Inc.: New York City, NY, USA, 2011; p. 782. [Google Scholar]
  59. Tanner, K.B.; Cardall, A.C.; Williams, G.P. A Spatial Long-Term Trend Analysis of Estimated Chlorophyll-a Concentrations in Utah Lake Using Earth Observation Data. Remote Sens. 2022, 14, 3664. [Google Scholar] [CrossRef]
  60. Cardall, A.C.; Hales, R.C.; Tanner, K.B.; Williams, G.P.; Markert, K.N. LASSO (L1) Regularization for Development of Sparse Remote-Sensing Models with Applications in Optically Complex Waters Using GEE Tools. Remote Sens. 2023, 15, 1670. [Google Scholar] [CrossRef]
  61. Sposito, G. The Surface Chemistry of Soils; Oxford University Press: Oxford, UK, 1984. [Google Scholar]
Figure 1. Geologic phosphate sources in the Utah Lake Watershed. The phosphate from these outcrops originates primarily from the Meade Peak Member of the Phosphoria and Park City Formations (marked in purple) and the Delle Phosphatic Member of the Deseret Limestone (marked in green) [19,20,21,22].
Water 16 00933 g001
Figure 2. Daily Utah Lake volumes in cubic meters (m3) from 13 July 1989 to 4 August 2023. We assume the data become more variable after 8 August 2012 because of automated measuring systems.
Water 16 00933 g002
Figure 3. Jordan River outflow volumes in cubic meters (m3) reported as cumulative monthly volumes from 1 January 1989 to 1 July 2023.
Water 16 00933 g003
Figure 4. Distribution of Jordan River outflow volumes by month in cubic meters (m3) from 1 January 1989 to 1 July 2023. Mean values are shown by the diamonds, with the diamond’s extent equal to the 95% certainty range. The median is shown by the notch, and the box ends are the 25th and 75th percentiles. The whiskers extend to 1.5 times the interquartile range. The mean monthly values are connected by the dashed line.
Water 16 00933 g004
Figure 5. The figure shows the locations and number of samples available from the AWQMS database used in this study. The figure shows all 3466 P (both total and dissolved) samples shown as brown dots (Panel (A)) on the left, and only the 1658 dissolved P (DP) measurements shown as green dots (Panel (B)) on the right.
Water 16 00933 g005
Figure 6. Dissolved P (DP) concentrations in Utah Lake from 1989 to 2022.
Water 16 00933 g006
Figure 7. Interpolated dissolved P (DP) concentrations in Utah Lake based on either the mean or median values measured on the same day. The top panel (A) shows the entire study period, and the bottom panel (B) shows details from 2012 to 2023.
Water 16 00933 g007
Figure 8. Dissolved P (DP) concentrations in Utah Lake from 1989 to 2022 grouped by year, with a line connecting the mean annual value and the bars showing the interquartile range. One point in 1989 and three points in 1991, with values of 1.42, 0.85, 0.60, and 0.59 mg/L, respectively, are not shown on the graph.
Water 16 00933 g008
Figure 13. Distribution of Utah Lake dissolved P (DP) concentration by month. Mean values are shown by the diamonds, with the diamond’s extent equal to the 95% certainty range. The median is shown by the notch, with the box ends at the 25th and 75th percentiles. The whiskers extend to 1.5 times the interquartile range. Dots represent every measurement with values outside 1.5 times the interquartile range.
Water 16 00933 g013
Figure 14. ANOM analysis of Utah Lake monthly dissolved P (DP) mean values. The plot includes the mean for each month (green or red dots) and the blue region, bounded by the lower and upper decision boundaries, LDL and UDL, respectively, which represents the area where differences are not statistically significant at the p = 0.05 level. The boundary locations are based on the number of samples in each month.
Water 16 00933 g014
Figure 15. Utah Lake dissolved P (DP) concentrations sorted by measurement location ID. The median is shown by the line dividing each box, with the box ends at the 25th and 75th percentiles. The whiskers extend to 1.5 times the interquartile range. Dots represent every measurement with values outside 1.5 times the interquartile range. See Table 1 for a list of which ID numbers are assigned to each sampling location.
Water 16 00933 g015
Figure 16. Analysis of means (ANOM) report for the 22 different Utah Lake sampling sites. The plot includes the mean for each site (green or red dots), the blue region, bounded by the lower and upper decision boundaries, LDL and UDL, respectively, represents the area where differences are not statistically significant at the p = 0.05 level. The boundary locations are based on the number of samples at each location.
Water 16 00933 g016
Figure 20. Panel (A) is a detail of Figure 19, which shows the total mass (Mg or t) of dissolved P (DP) in Utah Lake, while panel (B) shows monthly DP total mass inflows (Mg or t) from all sources including sorption into Utah Lake. These are computed as the change in the lake mass plus the mass outflow in the Jordan River. Data are shown only for months in which we have DP concentration measurements. Total mass DP inflows range from positive 17 t per month to negative 15 t per month. The graph is restricted to the period since 2017 for visualization purposes and because prior years have only a few data points per year.
Water 16 00933 g020
Figure 21. Example data that represent P adsorption to a sandy clay loam soil (from Sposito [61]) fit with a Freundlich isotherm. The y-axis is the concentration of P sorbed to the soil, while the x-axis is the concentration of P in solution.
Water 16 00933 g021
Table 1. A list of sampling locations and IDs for Utah Lake P data from the AWQMS database.
Location IDLocation Name
4917770Utah Lake Outside Entrance to Provo Bay
4917380Utah Lake 0.5 mi S of American Fork Boat Harbor #14
4917310Utah Lake 0.5 mi W of Geneva Discharge #15-A
4917320Utah Lake 0.5 mi W of Geneva Discharge #15-A Replicate Of 4917310
4917530Utah Lake 0.7 mi East of Pelican Point
4917370Utah Lake 1 mi East of Pelican Point
4917710Utah Lake 1 mi NE of Lincoln Point #03
4917410Utah Lake 1 mi NE of Pelican Point #10
4917420Utah Lake 1 mi SE of Pelican Point #09
4917390Utah Lake 1 mi West of Provo Boat Harbor
4917715Utah Lake 1 mile Southeast of Bird Island
4917400Utah Lake 1.5 mi NW of Provo Boat Harbor #16
4917520Utah Lake 2 mi E of Saratoga Springs #12
4917365Utah Lake 2 miles West of Vineyard
4917700Utah Lake 2.5 mi NE of Lincoln Point #02
4917500Utah Lake 3 mi W/NW of Lincoln Beach
4917300Utah Lake 300 ft Offshore from Geneva Steel
4917510Utah Lake 4 mi E of Saratoga Springs #11
4917330Utah Lake 5mi N/NW Of Lincoln Beach/1 mi Offshore
4917620Utah Lake Goshen Bay Midway Off Main Point On East Shore
4917600Utah Lake Goshen Bay Southwest End
4917340Utah Lake W of Provo Boat Harbor/6 mi N Of Lincoln Beach #08
Table 2. Tukey–Kramer pair-wise connecting letter report for annual means.
YearConnecting LetterMeanYearConnecting LetterMean
1997A 0.0652008ABCDEFG0.029
2009AB 0.0501994ABCDEFG0.029
2010ABCD 0.0492016 CDEFG0.028
2012ABCDE 0.0442001 BCDEFG0.027
1990ABC 0.0432014 EFG0.027
2022 CDE 0.0372003ABCDEFG0.026
2013 BCDEF 0.0362018 FG0.024
2021 CDE 0.0362005ABCDEFG0.024
2020 CDE 0.0351995 BCDEFG0.023
2002ABCDEFG0.0342004ABCDEFG0.022
2011 BCDEFG0.0332007 BCDEFG0.021
1991 DEF 0.0322019 G0.020
2015 CDEFG0.0311993 BCDEFG0.018
1999ABCDEFG0.0292017 G0.018
2006 BCDEFG0.0291989 CDEFG0.015
Note: levels not connected by the same letter are significantly different.
Table 3. Tukey–Kramer pair-wise connecting letter report for monthly means.
MonthConnected LettersMean
1A 0.059
10 B 0.039
9 BC 0.038
11 BCDE 0.036
8 BC E 0.035
6 CDEF0.032
7 D F0.029
3 DEF0.028
4 D F0.028
5 F0.027
12 DEF0.025
Note: levels not connected by the same letter are significantly different from each other.
Table 4. Equilibrium concentrations, mass, and dissolved P (DP) mass added to a column of water that is 3 m deep, has a cross-sectional area of 10 cm2, and interacts with sediment that is 10 cm deep. This equates to 3 L of water and 0.18 kg of sediment, respectively. This table assumes a water concentration of 0.03 mg/L as the baseline (with the corresponding row shaded in gray) to compute the amount added or removed from the system to achieve different concentrations.
Cliq
(mg/L)
Csolid
(mg/kg)
Psolid
(mg)
Pliq
(mg)
Ptot
(mg)
Padded
(mg)
0.020158.4128.510.06028.57−6.17
0.025176.3531.740.07531.82−2.92
0.030192.5134.650.09034.740.00
0.035207.3237.320.10537.422.68
0.040221.0739.790.12039.915.17
0.045233.9542.110.13542.257.50
0.050246.1144.300.15044.459.71
0.055257.6546.380.16546.5411.80
0.060268.6548.360.18048.5413.80
0.065279.1950.250.19550.4515.71
0.070289.3252.080.21052.2917.55
Disclaimer/Publisher’s Note: The statements, opinions and data contained in all publications are solely those of the individual author(s) and contributor(s) and not of MDPI and/or the editor(s). MDPI and/or the editor(s) disclaim responsibility for any injury to people or property resulting from any ideas, methods, instructions or products referred to in the content.

