Article

Wise Choice of Showerhead Patterns: How to Save Energy during Showering While Maintaining Thermal Comfort

Department of Building Environment and Energy Engineering, The Hong Kong Polytechnic University, Hong Kong, China
*
Author to whom correspondence should be addressed.
Water 2024, 16(7), 928; https://doi.org/10.3390/w16070928
Submission received: 22 February 2024 / Revised: 18 March 2024 / Accepted: 21 March 2024 / Published: 22 March 2024
(This article belongs to the Special Issue Advances in Management of Urban Water Supply System)

Abstract

:
Heat transfer coefficients between shower water and human skin could significantly impact occupants’ thermal sensation and energy consumption during showering. A recent study found that heat transfer coefficients varied considerably among showerhead patterns. However, the specific effects of the showering heat transfer process on the showerhead patterns have yet to be determined. Two experiments were conducted to quantify the spray patterns during showering, and the impacts of the patterns’ parameters on the heat transfer coefficient were examined using different statistical methods. 
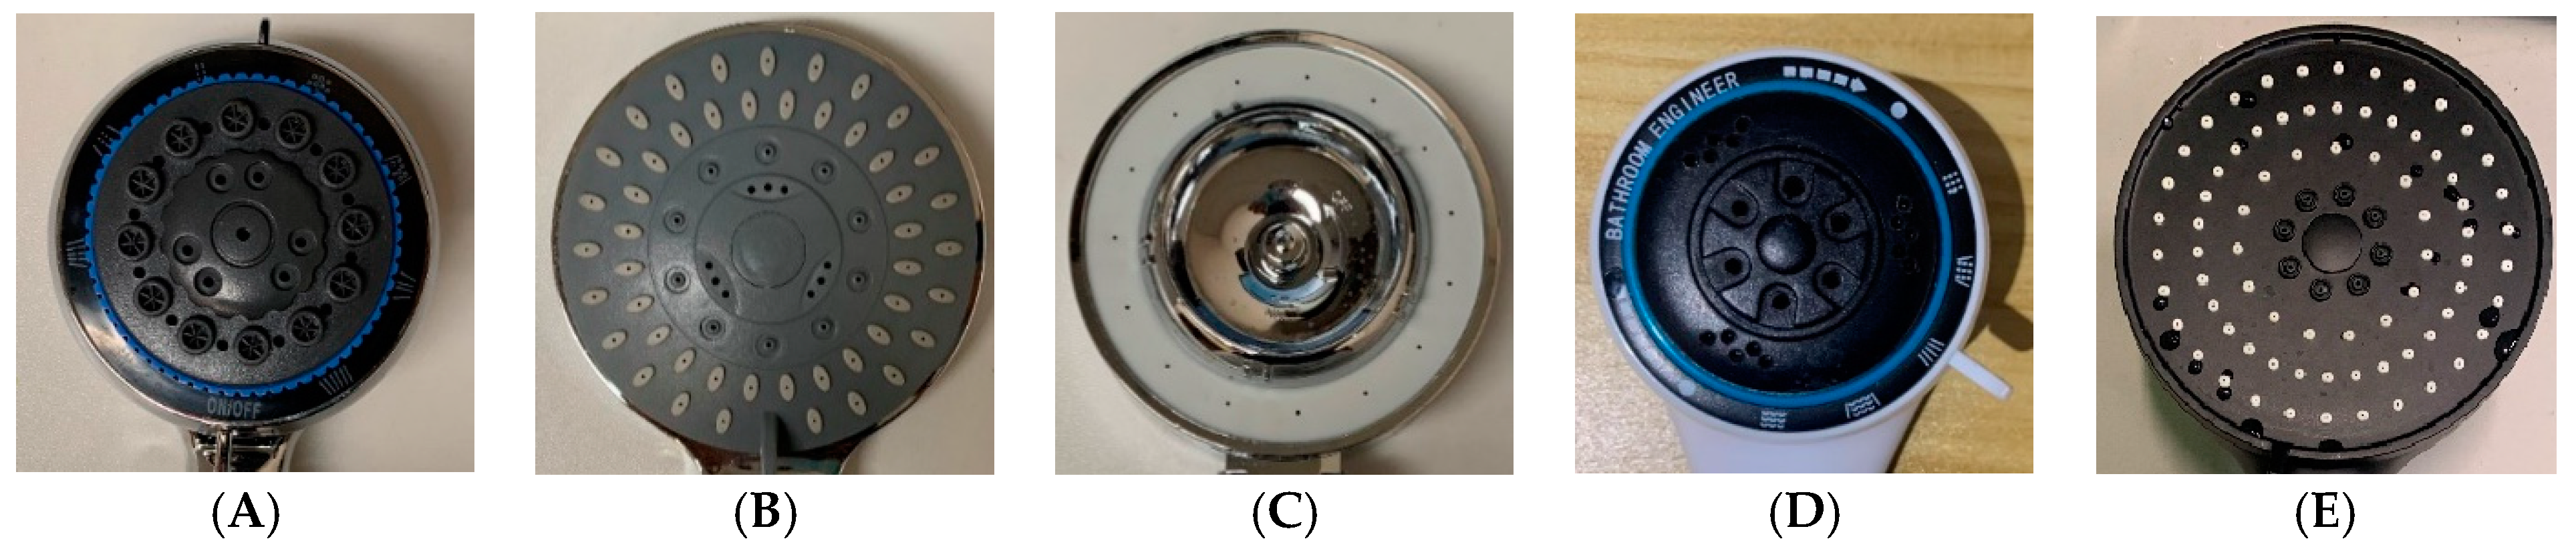
Five showerheads with 18 spray patterns were tested in this study. The resistance factor, water supply pressure, and nozzle area ratio of these patterns were measured to qualify their shower performance. The results indicated that all the tested parameters significantly impacted the heat transfer coefficient in general, and using resistance factor and nozzle area ratio could accurately predict the heat transfer performance of the showerhead pattern. Additionally, this study demonstrated that changing to a showerhead with a higher heat transfer coefficient could save considerable energy while maintaining the same thermal sensation during showering. The influence of water spray patterns on the heat transfer coefficient could provide residents with scientific references when selecting showerheads in their bathrooms.

1. Introduction

With improving living standards and developing health consciousness, showering has become a necessary part of modern people’s daily lives. Regular showering could maintain personal hygiene and provide a refreshing experience [1]. However, showering also consumes a significant amount of energy and water. According to the International Energy Agency, domestic water heating accounted for around 16% of household energy consumption [2,3]. Carbon reduction or energy saving has attracted much more attention in recent years because of climate change. As the second largest energy consumer in residential buildings, domestic water heating (or showering) has great potential for energy conservation [4]. Many previous studies demonstrated the possible ways to save energy during showering, such as enhancing heat pump efficiency [5], recovering heat from wastewater [6,7], using clean energy [8], etc. However, most of these studies focused on water heating or recycling techniques. Hardly any of them studied how to use water effectively.
Although many studies have investigated user behaviors’ impact on water and energy consumption in the past decades, most have focused on socioeconomic factors, ethical responsibilities, or social norms [9,10,11]. Saving water is more like a slogan of a social campaign rather than a permanent approach. My residential water-saving devices have been invented and proven efficient in water saving [12]. However, they seem difficult to spread and popularize without government subsidies [13]. According to prior research, two reasons might impede the acceptance of these devices: the incomprehension of the characteristics of the devices and the dissatisfaction that these devices might cause [14,15].
Earlier studies indicated that choosing optimal showerheads (i.e., low-flow showerheads in most cases) and using them wisely could improve residents’ health and thermal comfort during showering. Moreover, it could save water and energy [16,17,18]. It is not hard to understand that using a low water flow showerhead could reduce water and energy consumption. However, according to Wong et al. [19], people usually turn up the water temperature when the water flow rate is low to maintain thermal comfort. This operation, in turn, would increase the water heater’s energy consumption. Therefore, the best showerhead does not mean having the lowest water flow rate. Thermal comfort also cannot be ignored. The heat transfer between hot water and human skin is vital in determining users’ thermal sensations and energy consumption. For a hot water shower, the higher the heat transfer efficiency, the less water and energy are consumed to maintain a thermally neutral skin temperature (namely, a comfortable showering environment). For this reason, the heat transfer coefficient, as the principal influence factor of the heat transfer process, should be given more attention when analyzing thermal comfort and energy efficiency during showering.
A recently conducted experiment indicated that the showerhead’s water spray pattern significantly impacted the heat transfer coefficient between hot water and human skin during showering [20]. However, no specific effects for overall showerhead patterns were concluded since only one characteristic parameter of the water flow pattern—the nozzle area ratio—was considered in their study. Although the influence of spray patterns on the heat transfer coefficient was rarely studied during showering, it was investigated by many studies for the industrial spray cooling process [21,22]. Several parameters of spray patterns (such as spray pressure, water flux, and distribution of drop diameter) were examined to quantify their impacts on the heat transfer coefficient between water and metal surfaces [23,24]. Water pressure was one of the most studied parameters, and specific effects have been identified. Specifically, Cebo-Rudnicka et al. [21] observed an increased heat transfer coefficient when the water pressure increased from 0.5 to 1 Mpa. However, an inverse effect was reported by Hou et al. [25]. The result might be caused by the different liquid and surface temperatures tested in these two studies. Considering the other conditions between showering and spray cooling, the impact of spray patterns might be even more different.
Therefore, the current study conducted a series of experiments to determine the heat transfer coefficient for showering under different spray patterns of some showerheads. Additionally, to quantify the performance of each spray pattern, three parameters were examined: resistance factor, water supply pressure, and nozzle area ratio. The findings of this study could assist manufacturers and users in better understanding their showerheads. Moreover, based on the analyses of the experiment data, the impact of spray patterns on the heat transfer coefficient can be calculated, which could help the manufacturers optimize product design. Overall, these influences could lead to cumulative improvements in the efficiency of water use and a reduction in the carbon emissions associated with processes such as water treatment and distribution.

2. Methodology

The methodology consists of three parts, as shown in Figure 1. The first part was the measurement of the heat transfer coefficient. Five relatively popular showerheads (according to the online shopping website used in Hong Kong) with different surface areas and nozzle layouts were tested under six conditions: three water temperatures (35, 38, and 41 °C) × two water flow rates (6 L/min and 7.2 L/min). The tested conditions were selected based on previous studies on similar topics [15] and the water flow rate recommended by the water supplies department of Hong Kong [26]. A skin model (consisting of a Styrofoam board and a thin aluminum board) and five platinum resistance thermometers were applied in this measurement. The detailed measurement procedure was introduced in a previous study [20]. In total, 108 results of heat transfer coefficient were obtained. The second part described in Section 2.1 was the experimental study on showerhead characterization. The third part, as described in Section 2.2, was the data analysis to identify the relationships between the showerhead patterns and the heat transfer coefficients, which could help to determine the optimal showerhead pattern.

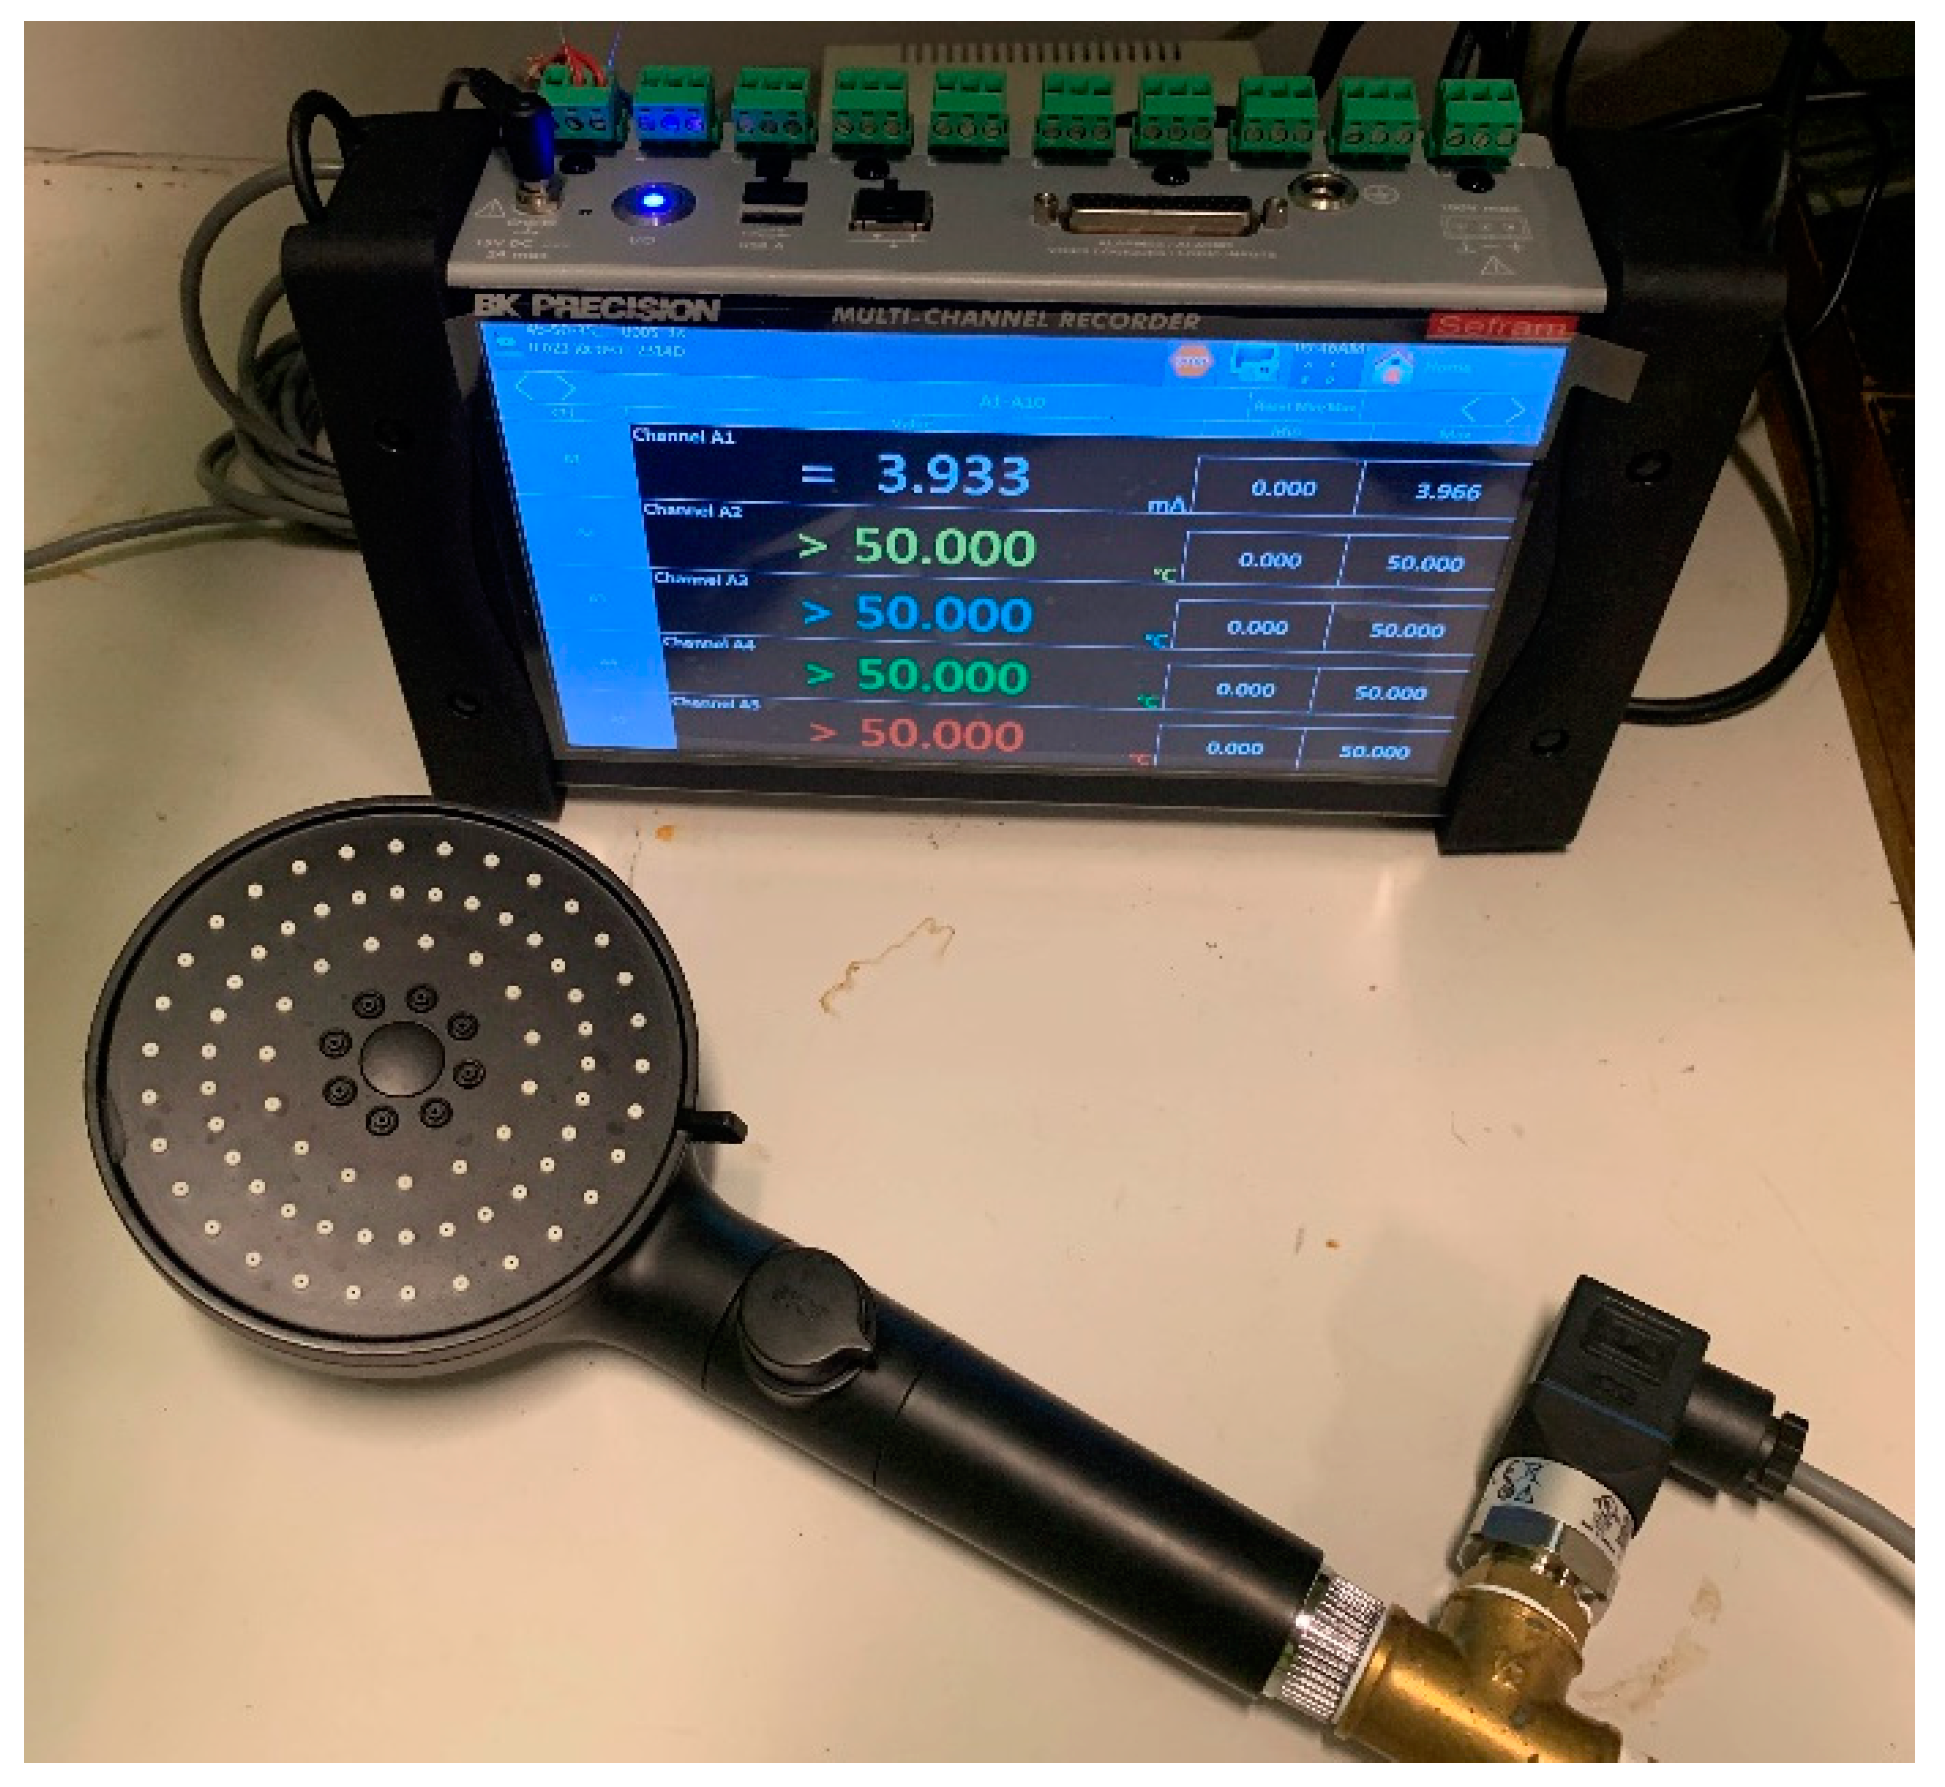
2.1. Experiment Setup

This study’s main experiment was measuring the water pressure of the 18 showerhead patterns. As shown in Figure 2, a pressure transmitter (WIKA A-10, WIKA Alexander Wiegand SE & Co., Ltd., KG, Klingenberg, Germany) installed between the water supply tube and the showerhead was used to measure the water pressure, and a data acquisition solution (DA200, © B&K Precision Corp., Yorba Linda, CA, USA) was connected to the pressure transmitter to show the signal and record the results. Then, the signal was converted to pressure according to the specification of the pressure transmitter.
Five showerheads, including 18 spray patterns, were tested in this study (see Figure 3). Showerheads A and B have five patterns, showerhead C has one pattern, showerhead D has three, and showerhead E has four. Three parameters were measured to quantify the shower performance of these patterns: nozzle area ratio ( A ), water pressure ( P ), and resistance factor ( K ). The nozzle area ratio can be calculated using Equation (1). The water pressure can be converted from the measurement data. The resistance factor can be calculated using Equation (2) [16].
A = A s A f
K = P Q 2
where A s is the total area of the working nozzles (m2); A f is the area of the whole faceplate of the showerhead (m2); Q is the water flow rate (L/min).

2.2. Data Analysis

The parameters obtained from the two experiments, namely, water temperature, water flow rate, heat transfer coefficient, showerhead pattern, nozzle area ratio, water pressure, and resistance factor, were imported into IBM SPSS statistics 27.0 (SPSS Inc., Chicago, IL, USA) for the data analysis. Then, the imported data was screened based on Z-scores of the heat transfer coefficient and the water pressure, where all the cases with Z-scores higher than two or lower than minus two were considered outliers and eliminated. After that, a series of Pearson correlation analyses were conducted to examine the relationships between the parameters of the showerhead pattern (i.e., nozzle area ratio, water pressure, and resistance factor) and heat transfer coefficient. Lastly, a two-way ANOVA analysis was carried out to investigate the interactive effect of the parameters of the showerhead pattern on the heat transfer coefficient.

3. Results and Discussions

3.1. General Results

The results obtained from the two experiments are shown in Table 1. The average heat transfer coefficients of these showerheads were similar (80–100 W/(m2·°C)), except for showerhead E. Moreover, it can be seen that the heat transfer coefficient of the tested showerheads varied largely with different shower conditions and different patterns. The impacts of shower conditions (i.e., water flow rate and water temperature) were reported in a previous paper [20]. Namely, the water flow rate positively impacts the heat transfer coefficient between the hot water and human skin during showering, while no significant effect of water temperature was identified. Considering the significant impact of the water flow rate, the analyses were conducted separately for different water flow rates in the current study. The present study only focuses on the impacts of showerhead-related parameters, i.e., nozzle area ratio, water pressure, and resistance factor, on the heat transfer coefficient.
Table 2 shows the general relationships among the nozzle area ratio, water pressure, and resistance factor of the showerhead patterns and the heat transfer coefficient. As can be seen, all the parameters of the showerhead pattern had significantly positive impacts on the heat transfer coefficient between the water flow and human skin (p < 0.05). Additionally, a strong positive correlation was identified between water pressure and resistance factor, which might explain the similar impacts of water pressure and resistance factor on the heat transfer coefficient.
Additionally, significant differences in the heat transfer coefficients were observed between the five showerheads (F(4, 97) = 11.10, p < 0.001) and between the 18 spray patterns (F(17, 84) = 4.56, p < 0.001). Figure 4 illustrates the quartiles and mean values (i.e., the “×” marks) of the heat transfer coefficient of the 18 tested patterns (five showerheads) under different shower conditions. In general, showerhead B had the highest average heat transfer coefficient (about 95 W/(m2 °C)), showerheads C and D had similar average values (about 88 W/(m2·°C)), followed by showerhead A (about 82 W/(m2·°C)), and showerhead E had the lowest average heat transfer coefficient (about 56 W/(m2·°C)).

3.2. Impacts of Spray Patterns on the Heat Transfer Coefficient for the Same Showerhead

Since showerhead C has only one spray pattern and performs similarly (in terms of the average heat transfer coefficient) to showerhead D, showerheads C, and D were considered one showerhead with four spray patterns in this section. Figure 5 shows the relationships between the nozzle area ratio and the heat transfer coefficient for each tested showerhead. The Pearson correlation coefficients are mentioned in the figures. It can be seen that showerhead E’s nozzle area ratios were relatively small, and they were positively correlated with the heat transfer coefficient (r = 0.493, p = 0.014). However, there was no such correlation for the other showerheads, even though the nozzle area ratio significantly positively impacted the heat transfer coefficient when considering the tested showerheads as a whole (see Table 2).
Figure 6 shows the relationships between the tested showerheads’ water pressure and the heat transfer coefficient. Significantly positive correlations were identified for showerheads A and D. In addition, it can be seen that the water pressure was positively correlated with the water flow rate. The larger the water flow rate was set, the higher the water pressure was detected.
Since the resistant factor was calculated based on water pressure, its impact on the heat transfer coefficient was similar to water pressure (as shown in Figure 6 and Figure 7). However, the correlations between the resistant factor and heat transfer coefficient were more substantial than those between the water pressure and heat transfer coefficient (see the Pearson correlation coefficients). The impacts of the resistant factor were significant for almost all the tested showerheads (see Figure 7).
Generally, the parameters of the showerhead pattern significantly positively impact the heat transfer coefficient between water and skin during showering. However, if these impacts are analyzed per showerhead, only the impact of resistant factors was significant for most showerheads. Therefore, more attention should be paid to the resistance factor when selecting a showerhead. In winter, the showerhead pattern with a higher resistant factor is suggested to be chosen to increase skin temperature quickly at the beginning of showering. In contrast, in summer, the showerhead pattern with a lower resistance factor is suggested to be selected to avoid overheating the body.

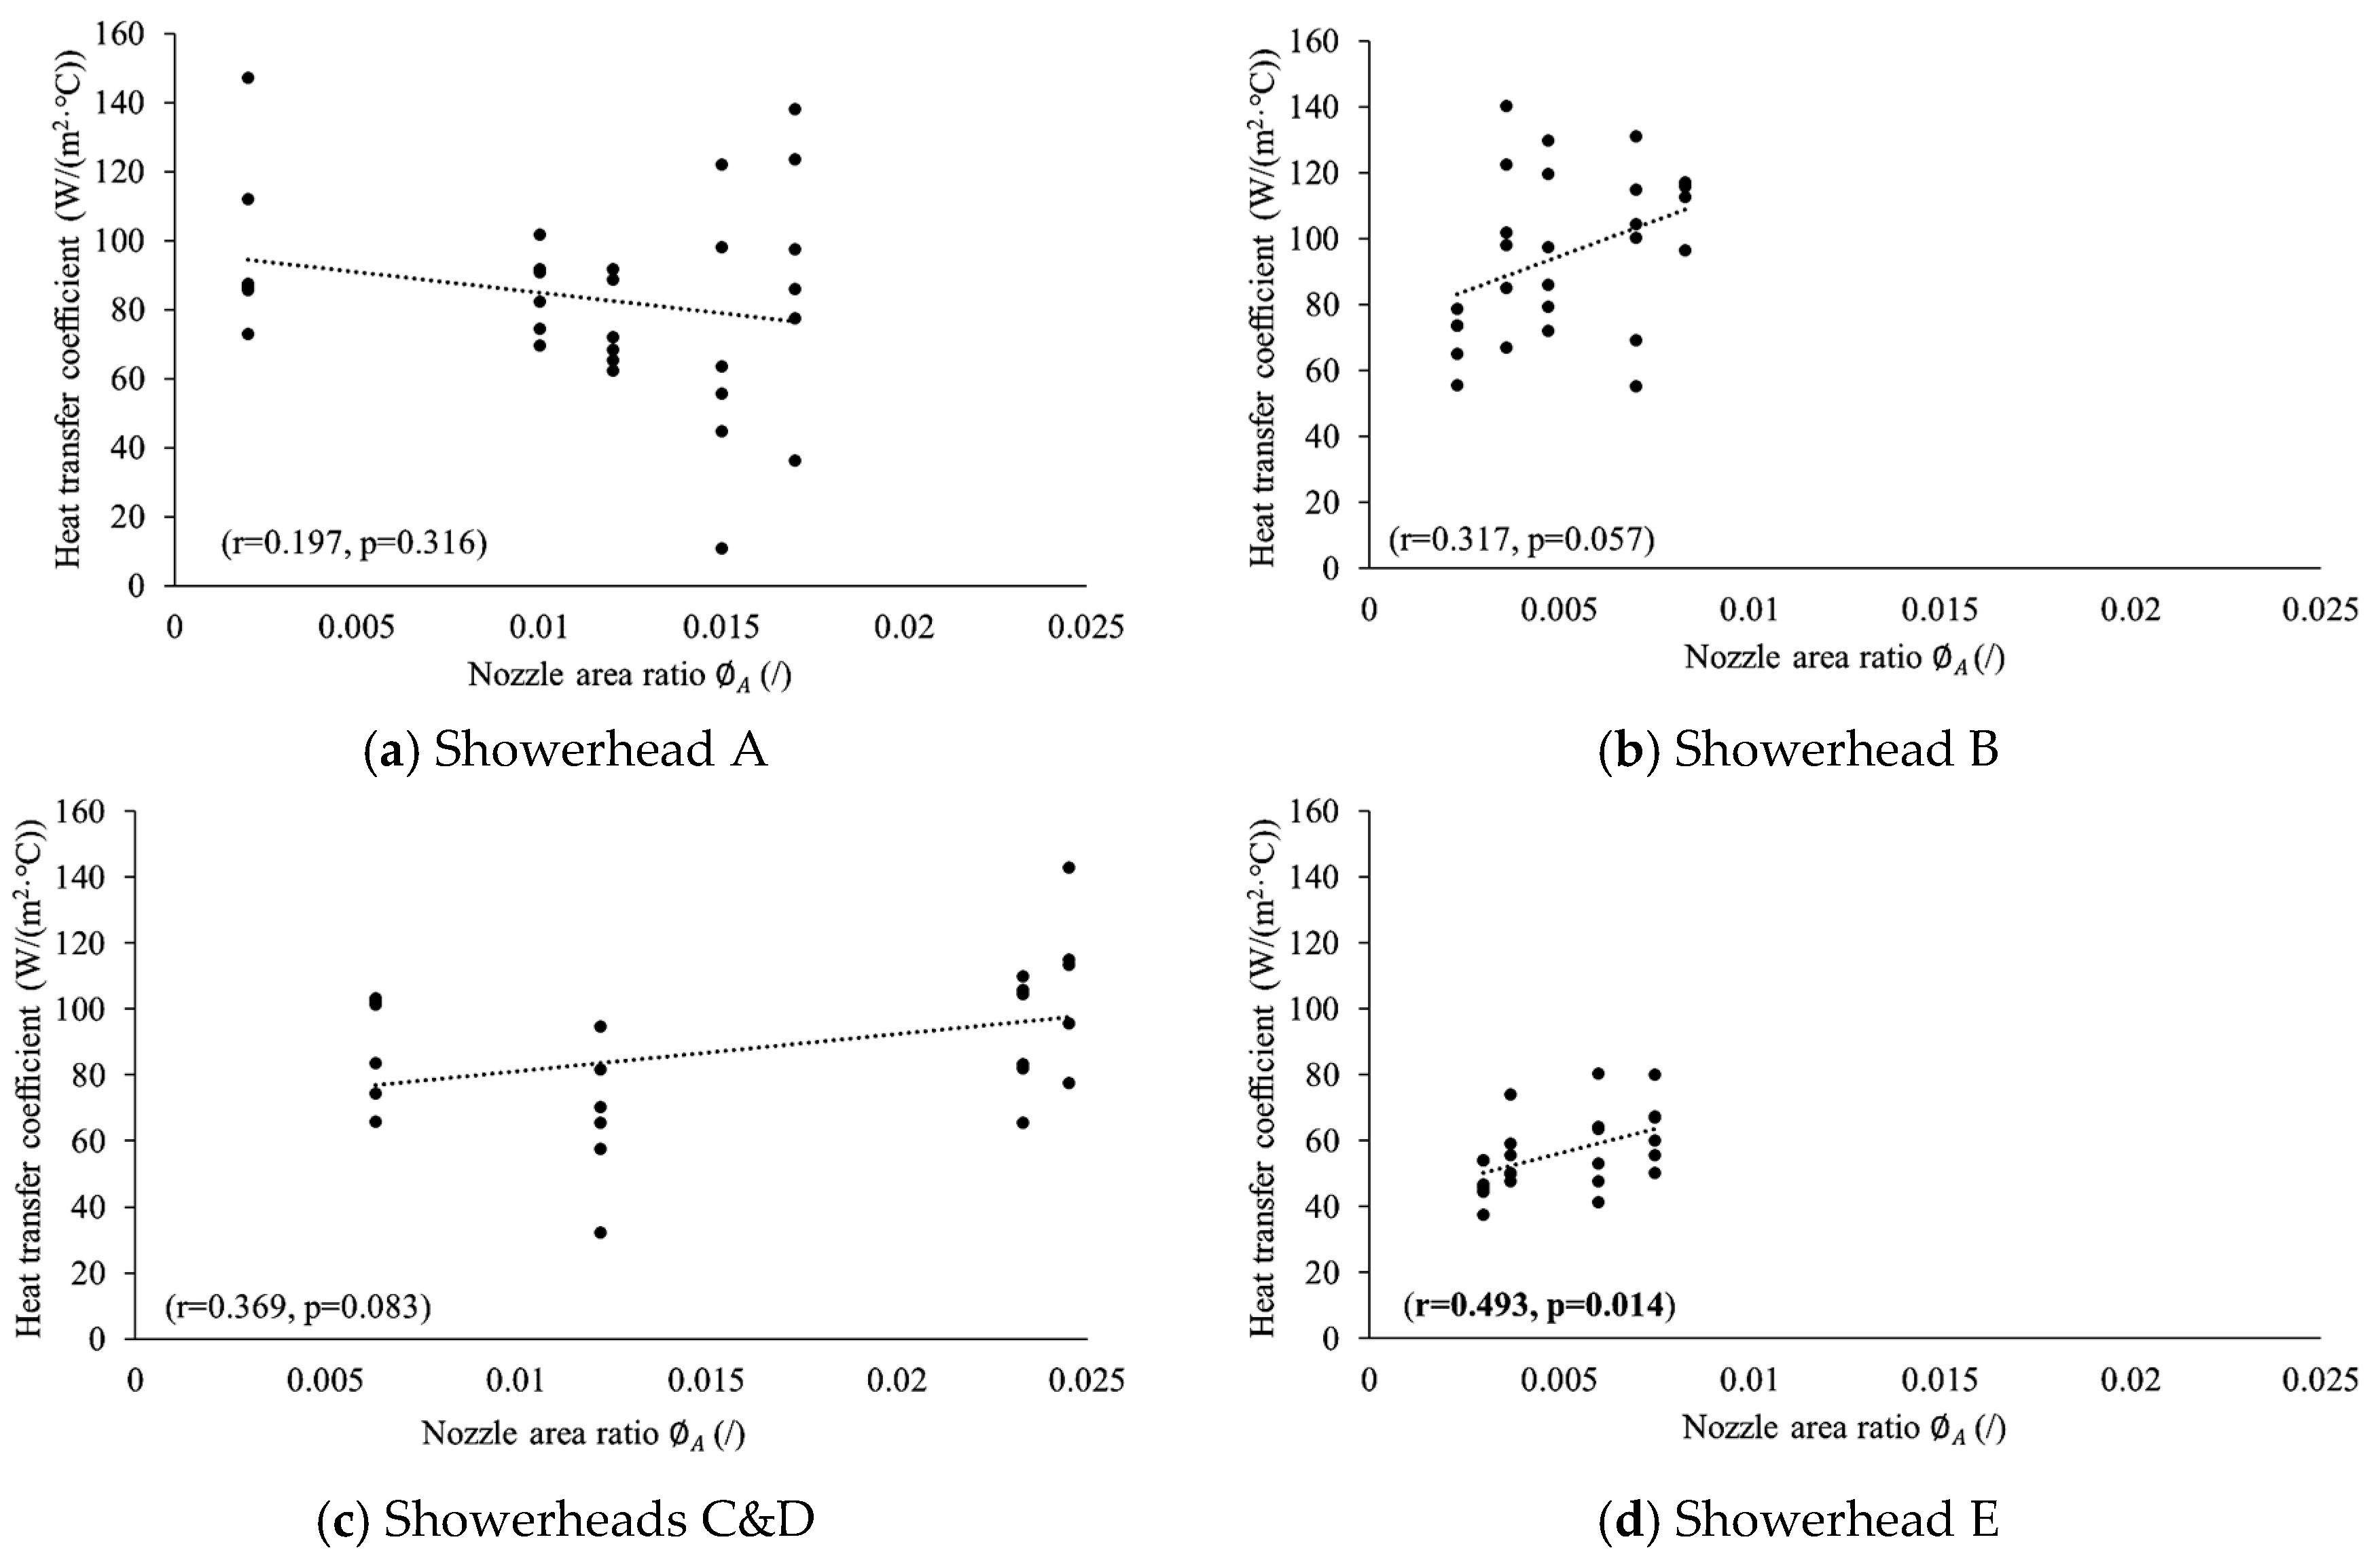
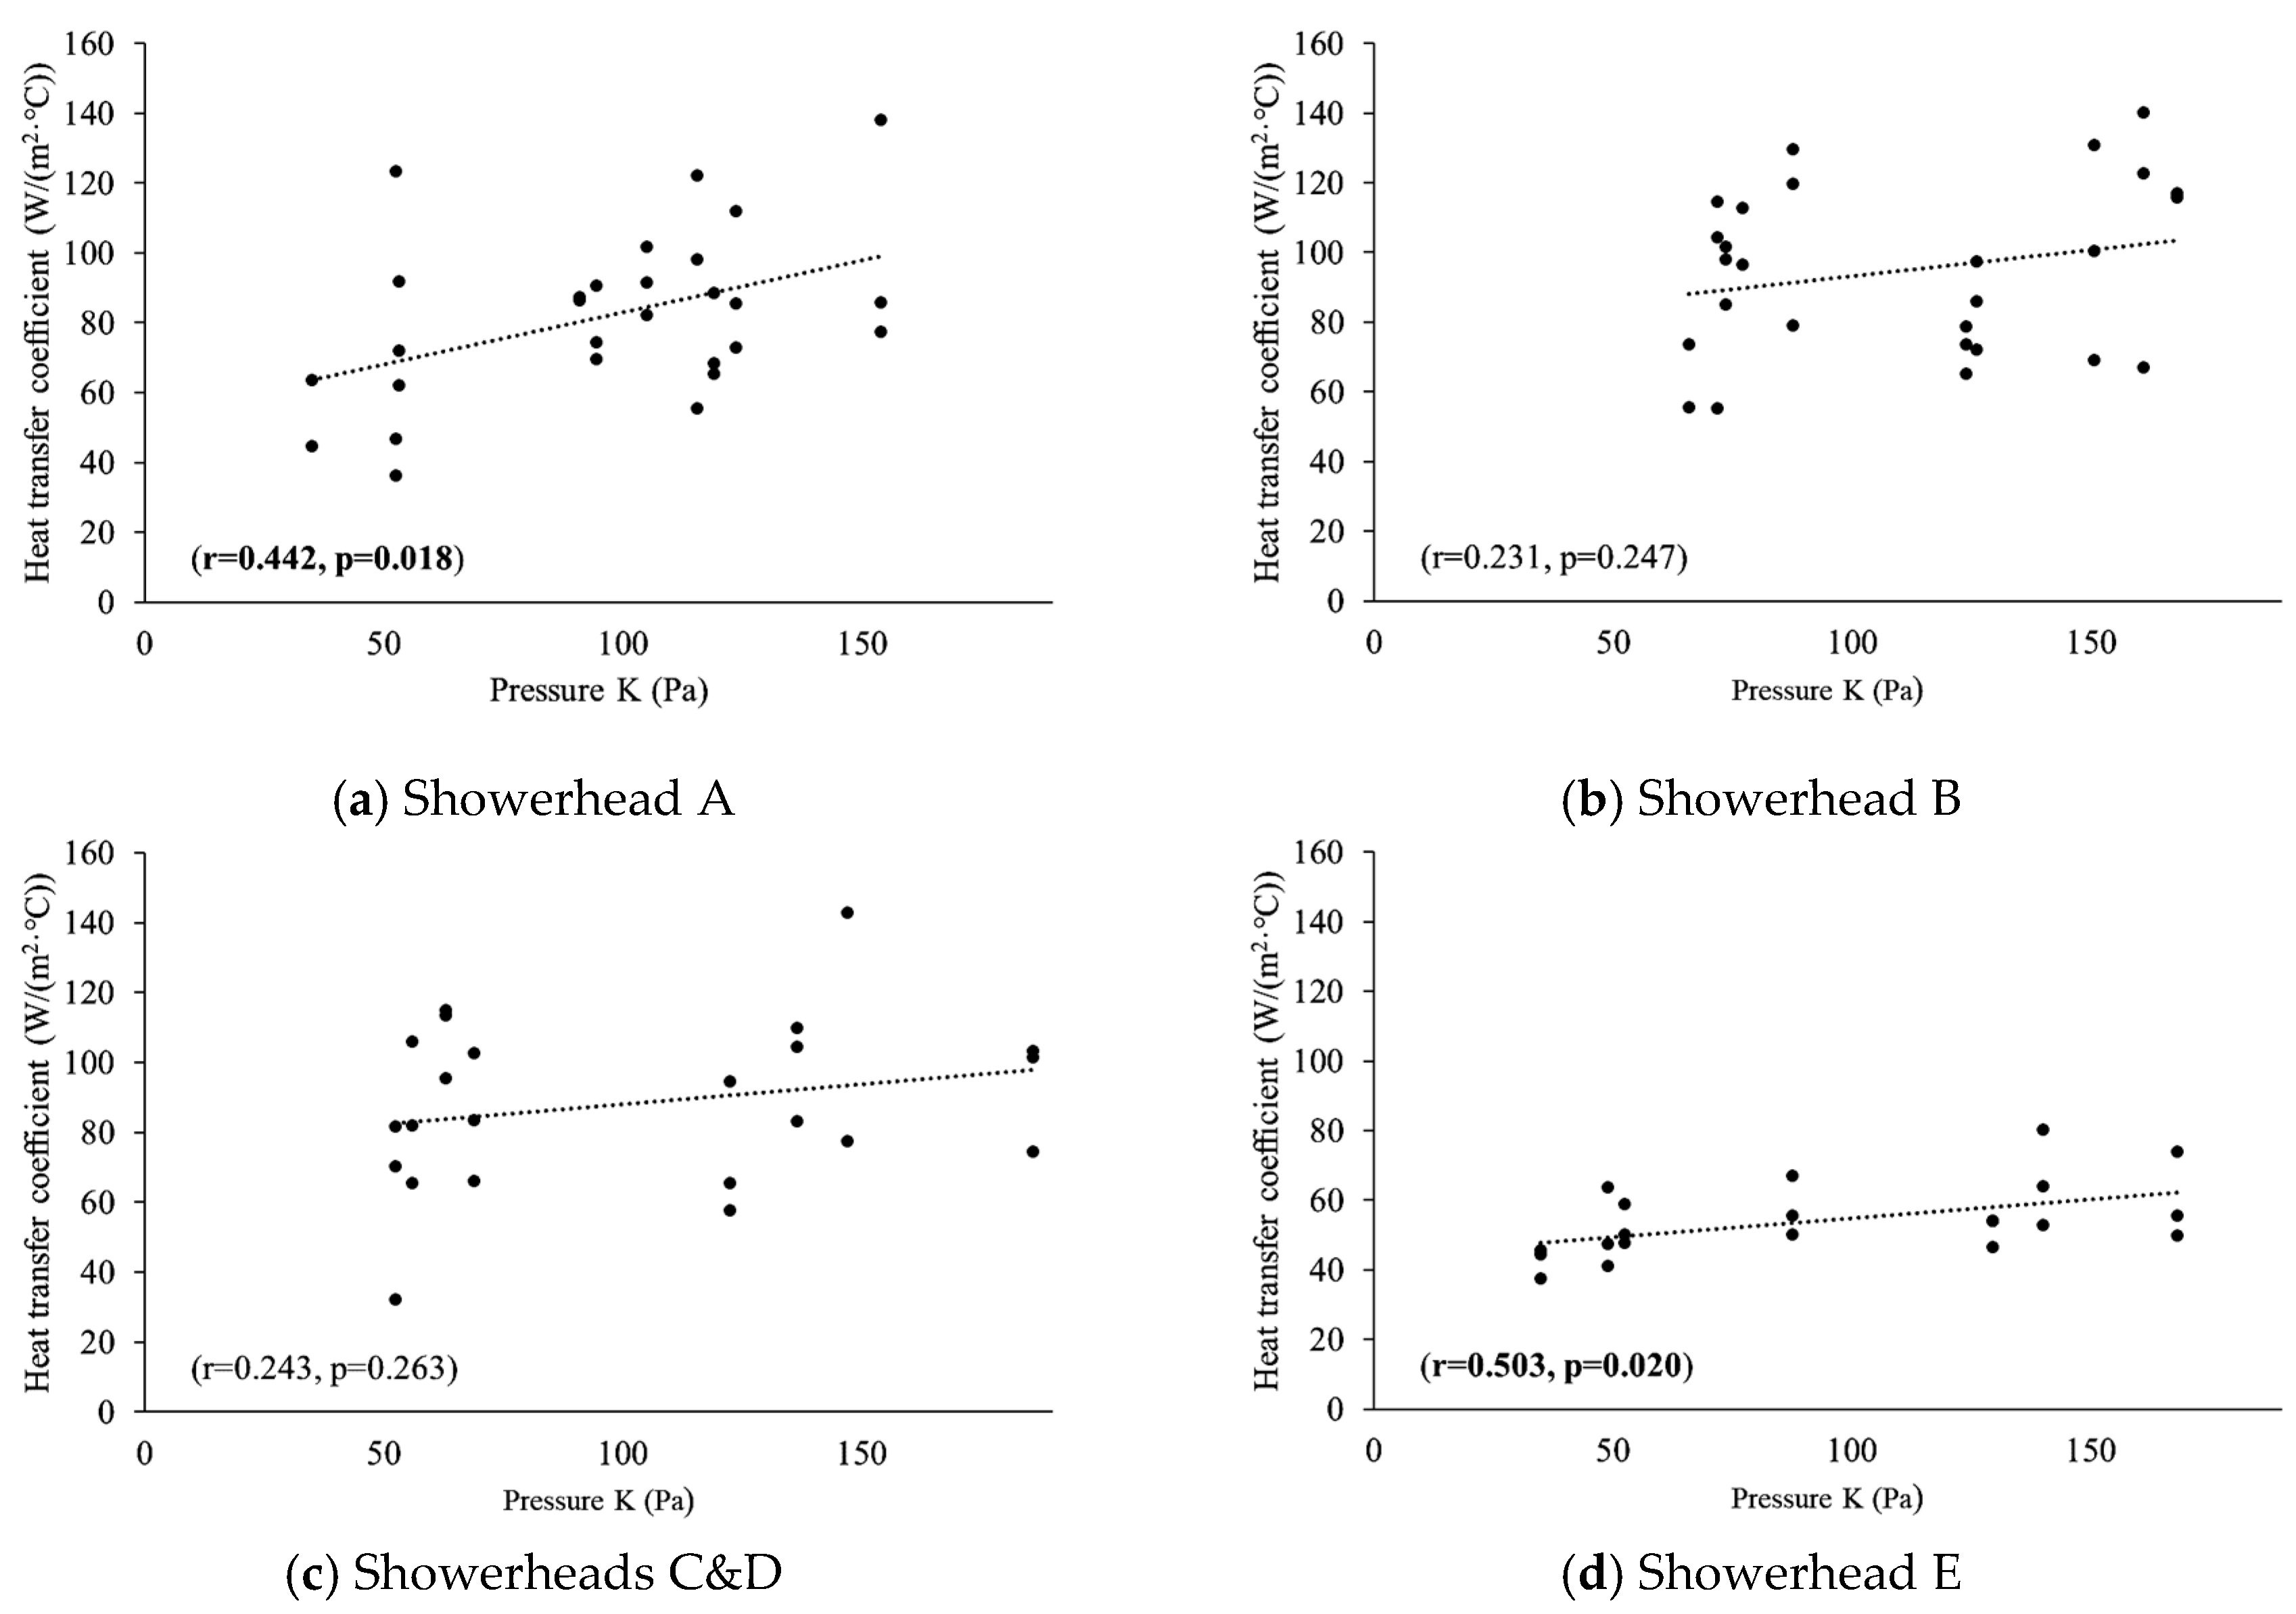
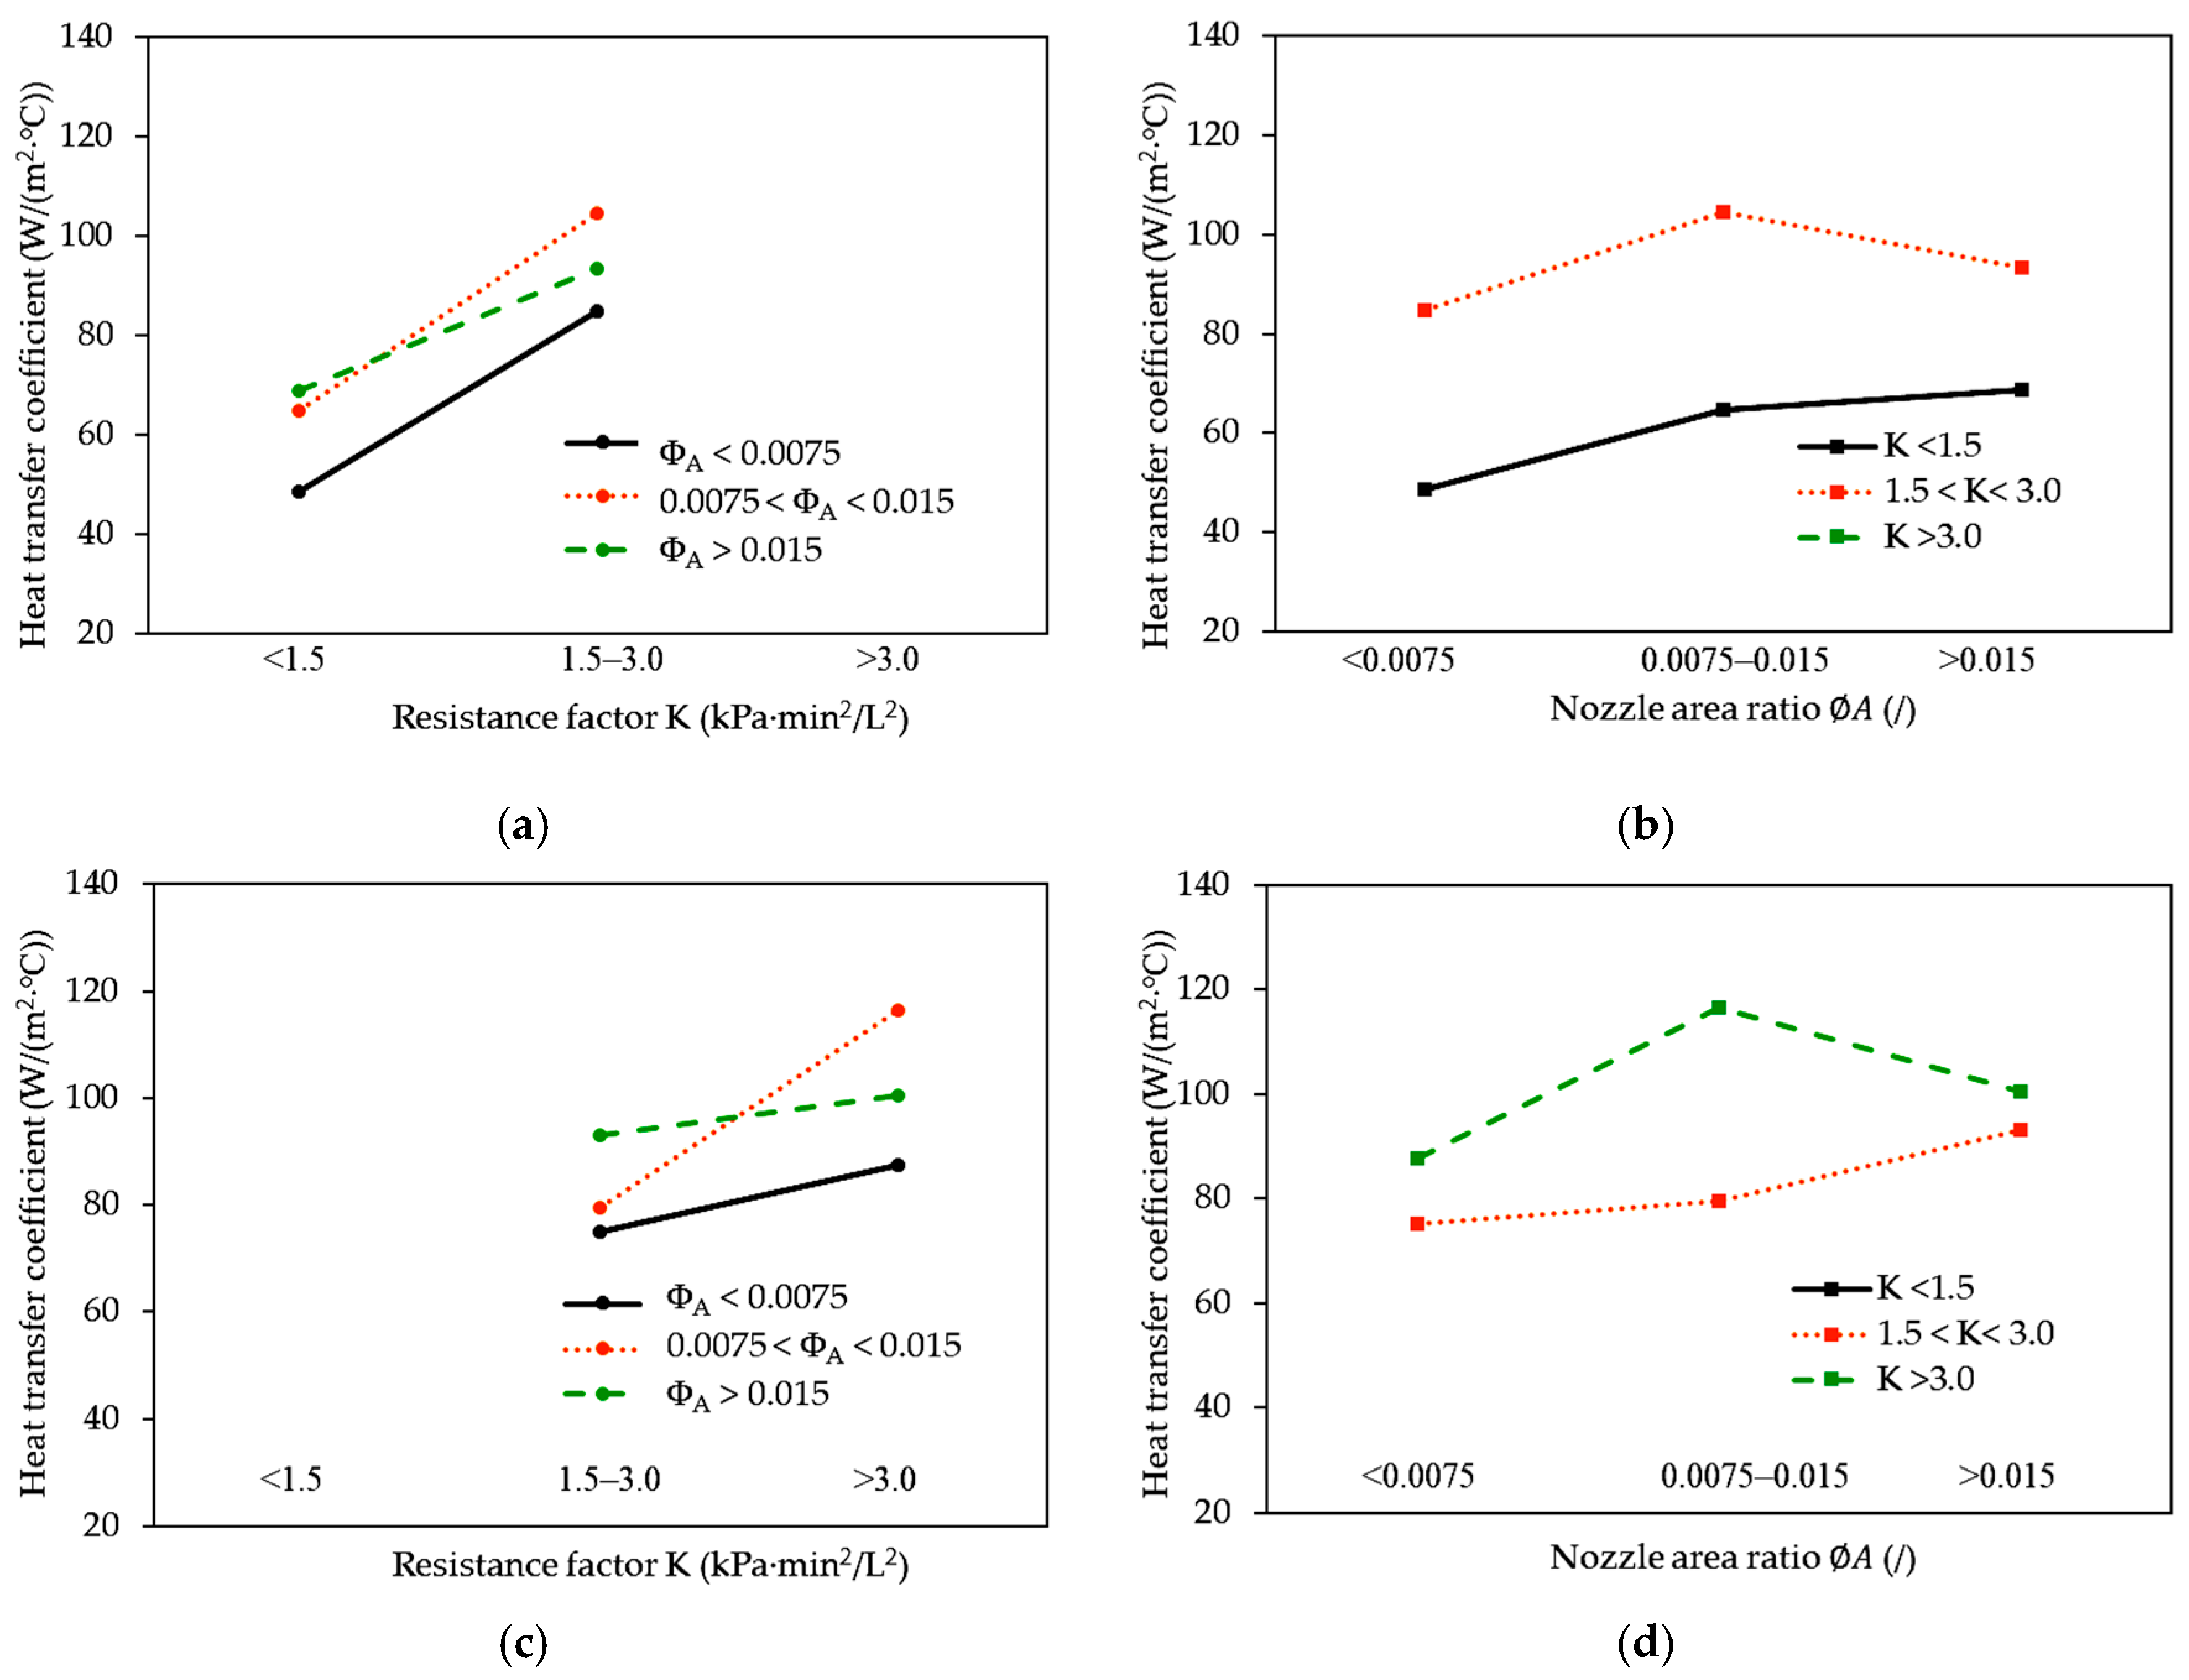
3.3. Interactive Impacts of the Parameters of Showerhead Pattern on the Heat Transfer Coefficient

Three parameters of showerhead pattern were investigated in the current study. Since water pressure was closely related to the resistance factor and the resistance factor had a relatively more significant impact on the heat transfer coefficient, the resistance factor can represent water pressure; hence, it was not separately considered in this section. Therefore, only the interaction between the resistance factor and nozzle area ratio was examined. As seen in Table 3, the two-way ANOVA results were similar for different water flow rates. Specifically, no statistically significant interaction was identified between the effects of the resistance factor and nozzle area ratio on the heat transfer coefficient. The simple main effects analysis showed that only the resistance factor had a statistically significant effect on the heat transfer coefficient. In contrast, no significant effect was identified for the nozzle area ratio.
Figure 8 illustrates the detailed interactive impacts of the resistance factor and nozzle area ratio on the heat transfer coefficient. For the showerhead patterns with similar nozzle area ratios, the ones with higher resistance factors always result in higher heat transfer coefficients (see Figure 8a,c). However, the relationships between the nozzle area ratio and the heat transfer coefficient were only positive for the showerhead patterns with relatively small resistant factors. Moreover, it also can be seen that the resistance factors were higher when the water flow rate was more significant. Specifically, when the water flow rate was 6 L/min, the resistance factors of all the showerhead patterns were less than 3.0 kPa·min2/L2, while when the water flow rate was 7.2 L/min, all the resistance factors were larger than 1.5 kPa·min2/L2. The heat transfer coefficient was the highest when the nozzle area ratio was between 0.0075 and 0.015 and the resistance factor was larger than 3.0 kPa·min2/L2.

3.4. Integrated Impacts of the Parameters of Showerhead Pattern on the Heat Transfer Coefficient

Since there is no correlation between the nozzle area ratio and the resistance factor (see Table 2) nor interactive effect between them on the heat transfer coefficient (see Table 3), a multivariate regression was conducted to identify further the integrated impact of these two parameters of showerhead on the heat transfer coefficient between the hot water and human skin. The results indicate that nozzle area ratio and resistance factor of the showerhead pattern could statistically significantly predict heat transfer coefficient (water flow rate = 6 L/min: F(2,51) = 14.73, p < 0.001; water flow rate = 7.2 L/min: F(2,48) = 88.64, p < 0.001). In other words, the regression models were good fits for the data. The detailed information on the models is shown in Table 4. When the water flow rate was 6 and 7.2 L/min, the impacts of the nozzle area ratio and resistance factor on the heat transfer coefficient ( α c ) can be expressed by Equations (3) and (4), respectively. When the water flow rate was low, only the resistance factor significantly impacted the heat transfer coefficient (p < 0.001). Thus, its contribution to the prediction was more significant than the nozzle area ratio. When the water flow rate was high, both parameters of the showerhead pattern significantly impacted the heat transfer coefficient, and the nozzle area ratio played a more decisive role in predicting the heat transfer coefficient (i.e., the standardized coefficients of both parameters were 0.4).
α c = 52.40 × A 0.039 × K 0.926   ( R 2 = 0.37 )
α c = 106.91 × A 0.191 × K 0.691   ( R 2 = 0.27 )
Detailed information on the models is shown in Table 4. Both resistance factor (p = 0.008) and nozzle area ratio (p < 0.001) were significant predictors in this model.

4. Discussions

4.1. Impacts of Showerhead Patterns on the Heat Transfer Coefficient

Three parameters (i.e., nozzle area ratio, water pressure, and resistance factor) of the showerhead pattern were examined in the current study. The results indicated that they all positively impact the heat transfer coefficient between the hot water and human skin. Regarding the impacts of nozzle area ratios and water pressure on the heat transfer coefficient, similar effects were reported before by Wong et al. [20] and Cebo-Rudnicka et al. [21]. The impact of the nozzle area ratio is easy to understand since the larger the nozzle area, the larger the contact area between the water and the skin. Thus, more heat could be transferred through the conduction and convection [27]. In terms of the impact of water pressure, as explained by Cebo-Rudnicka et al. [21] in their study, higher pressure could increase the water dispersion and velocity, resulting in more heat transfer between the water and skin. Similarly, Zhang et al. [17] also observed that the showerhead with smaller holes, which lead to high spraying force and water pressure, could result in a more significant temperature drop, i.e., more heat transfer. Considering that the resistance factor was calculated based on water pressure and they are closely related to each other (see Table 2), the same explanation should also work for the impact of the resistance factor on the heat transfer coefficient.
Additionally, the integrated impacts of resistance factor and nozzle area ratio on heat transfer coefficient were analyzed in this study under two different water flow rates. Two multivariate regression models were established, and both fit the data well. When the water flow rate was low, the impact of the nozzle area ratio on the heat transfer coefficient was insignificant, and only the resistance factor played a vital role in determining the heat transfer coefficient. With the increase in water flow rate, the impact of the nozzle area ratio increased. When the water flow rate was 7.2 L/min, its impact on the heat transfer coefficient was even more significant than the impact of the resistance factor.
Apart from that, it is worth noting that although there were statistically significant relationships between the predictors (i.e., nozzle area ratio and resistance factor) and the dependent variable (i.e., heat transfer coefficient) (p < 0.001), the R2 values were relatively low, suggesting moderate levels of explanatory power. In other words, only 27% or 37% of the variability in the heat transfer coefficient can be accounted for by the nozzle area ratio and the resistance factor, and the remaining 73% and 63% of the variances were unexplained. More predictors would be required in future studies. For example, Adeyeye et al. [15] found that spray distribution is an essential indicator of showerhead performance. Therefore, more variables are suggested for future research.

4.2. Selection of the Optimal Showerhead

Although the overall results indicated that all the investigated showerhead-related parameters were positively related to the heat transfer coefficient, the results collected for individual showerheads showed that only the impact of the resistance was significant for almost all the showerheads. Moreover, the integrated impacts of the resistance factor and nozzle area ratio implied that the resistance factor was more important to the heat transfer coefficient when the water flow rate was low. Many countries face water stress, and water conservation has been set as a global Sustainable Development Goal [28]. Therefore, low-flow water devices were suggested for use. In this case, showerheads with higher resistance factors at an elevated water supply pressure in high-rise buildings seem to be a better choice. Meanwhile, considering the interaction effect between the resistance factor and nozzle area ratio on the heat transfer coefficient (see Figure 8), showerhead patterns with resistance factors larger than 3 were suggested to be selected so that a higher heat transfer coefficient between water and skin can be obtained.
With a higher heat transfer coefficient, thermal comfort can be maintained at a relatively lower water temperature, and a certain amount of energy can be saved during showering. This result was inconsistent with the findings of Wong et al. [19] that the higher the resistance factor, the more energy can be saved. Apart from the high resistance factor, the interaction effect identified by the current study indicated that the optimal showerhead nozzle area ratio should be between 0.0075 and 0.015 to achieve effective heat transfer between water and skin. Under this condition, even better performance could be achieved by reducing the size of the holes and increasing the number of holes since the smaller the holes, the higher the pressure, so both the resistance factor and the heat transfer coefficient could increase. This finding aligns with the results of Woolf et al. [29] that reducing the size of the holes in the showerhead could maintain a good spray profile at lower flow rates.
A comparison between two cases with different showerhead patterns (i.e., B2 and E4) was conducted to demonstrate better showerhead patterns’ impact on energy consumption during showering. Detailed information about the selected cases is shown in Table 5.
According to the convective heat transfer theory, the heat transfer on the skin areas covered by flowing water can be calculated using Equation (5).
C = α c T s k i n T w a t e r
where, α c is the heat transfer coefficient; T s k i n and T w a t e r are skin temperature (°C) and water temperature (°C), respectively. Assuming the skin temperature is around 35.4 °C, the convection heat transfer rates from the hot water to the skin in the selected cases are similar, i.e., around 302 W/m2. However, since the heat transfer coefficient of showerhead B2 in case 1 is about twice as much as the value of E4 in case 2, to achieve a similar heat flux, the water temperature in case 2 must be higher than in case 1. According to the mathematical energy consumption model (i.e., Equation (6)) developed by Zhang et al. [30] to investigate the relationship between the showering condition and the energy consumption rate, the energy consumption will rise by 0.085 kWh per unit increase in water temperature during a 10-minute shower.
Q t o t a l = 0.19 × T a i r + 0.51 × T w a t e r + 62.08 × m a + 43.37 × m w 23.85
where, T a i r is the air temperature (°C); m a is the compartment mass ventilation rate (kg/s); and m w is the water flow rate for showering (kg/s). Assuming a normal and comfortable bathroom environment with T a i r equals 32 °C and m a equals 0.002 kg/s, the energy consumption during a 10-minute shower should be 1.16 kWh and 1.41 kWh in cases 1 and 2, respectively. In other words, showerhead E4 will consume 22% (0.25 kWh) more energy than showerhead B2 to maintain thermal comfort (i.e., the same heat transfer rate from hot water to human skin).

4.3. Suggestions for Manufacturers and Users

According to the analysis results identified by the current study, to maintain a comfortable and energy-saving showering experience, the future showerheads could be designed with more holes but with smaller sizes, and the nozzle area ratio is suggested to be between 0.0075 and 0.015 kPa·min2/L2. Additionally, to assist users in making a wise choice, manufacturers should provide more performance indicators of the showerhead, such as resistance factor and nozzle area ratio. Lastly, similar to the suggestions provided by Orr et al. [31] to the water companies, showerhead manufacturers could regularly conduct evaluation studies about their products or elicit information from recent related studies.
For the users, it is suggested that they pay more attention to the shower performance of the showerhead besides its appearance. According to the current study, the wise choice is the one with a higher resistance factor (larger than 3) and medium nozzle area ratio (0.0075–0.015 kPa·min2/L2). Showerheads processing these attributes facilitate the maintaining thermally comfortable showering experience using relatively less water at lower temperatures, which leads to energy and water conservation.

4.4. Limitations and Future Studies

As pioneering experimental research, the current study has several limitations. The first one is the limited sample size. Only five showerheads with 18 water spray patterns were tested in this study, which may affect the generalizability of the results. A larger and more diverse sample would be needed to validate the findings and explore the effects of different showerhead characteristics on the heat transfer from hot water to human skin during showering. A second limitation is the operation error for water flow rate controlling, which may introduce some variability and bias in the data collection. The water flow rate was controlled by a gate valve, which may not be accurate or consistent. A more precise and automated method of controlling the water flow rate would be preferable to reduce human error and ensure data reliability. The last limitation that should be mentioned is the lack of prior research studies on the topic, which may affect the validity and reliability of the results. Since the impact of showerhead patterns on thermal comfort and energy consumption during showering has rarely been studied before, there are uncertainties in the existing knowledge. The lack of prior research studies also limits the availability or quality of the methods and instruments used to experiment.
Based on these limitations, some possible future studies are suggested. First, a larger-scale study with a more representative showerhead sample could be conducted, and more characteristic parameters could be considered to confirm and extend the results of this study. The sample could include showerheads with different faceplate areas, number of nozzles, water pressure, water distribution, etc. Second, a more accurate study with a more reliable method of controlling the water flow rate could be carried out to eliminate or minimize the operation error and ensure the validity of the data. The technique could involve using a digital device or a sensor to adjust and monitor the water flow rate automatically and precisely. Lastly, a systematic and uniform evaluation method should be developed to assess and compare different showerhead patterns regarding heat transfer efficiency and user satisfaction.

5. Conclusions

Heat transfer coefficients between shower water and human skin are vital in determining occupants’ thermal comfort and energy consumption during showering. This study experimented to identify the impacts of three showerhead-related parameters, i.e., nozzle area ratio, water pressure, and resistance factor, on the heat transfer coefficient. Five showerheads with 18 patterns were tested under six showering conditions (two water temperatures × three water flow rates), and several statistical analyses were conducted to understand the impacts better and identify the optimal showerhead pattern. The general results indicated that all the tested parameters positively correlated with the heat transfer coefficient, among which the resistance factor had the highest coefficient. However, if each showerhead was examined individually, only the impacts of the resistance factor were significant for almost all the showerheads. Moreover, the multivariate regression models showed that the resistance factor was decisive in determining the heat transfer coefficient when the water flow rate was low. Additionally, the importance of the nozzle area ratio increased with the water flow rate. When the water flow rate was larger than 7.2 L/min, the nozzle area ratio showed a greater influence on the heat transfer coefficient than the resistance factor. Furthermore, the two-way ANOVA test result revealed that the showerhead pattern with a nozzle area ratio of 0.0075–0.015 and a resistance factor of 3.0 or above resulted in the highest heat transfer coefficient between water and human skin during showering; thus, it was suggested to be selected. The insights gained from this study could guide manufacturers in designing showerheads and assist residents in wisely selecting showerheads for comfortable and energy-saving showering.
On top of this, this study demonstrated the energy-saving potential of showerheads by comparing two showerhead patterns. Specifically, using the showerhead pattern with higher heat transfer capacity could reduce around 20% of energy without sacrificing thermal comfort during showering. This study proposed a way to assess the showerhead performance using a straightforward approach with a relatively small sample. Future studies should consider more showerhead patterns and develop a more comprehensive and robust evaluation system that can assist users in choosing the best showerhead. The findings of this study could assist manufacturers and users in better understanding their showerheads. Moreover, based on the analyses of the experiment data, the impact of spray patterns on the heat transfer coefficient can be calculated, which could help the manufacturers optimize product design. Overall, these influences could lead to cumulative improvements in the efficiency of water use and a reduction in the carbon emissions associated with processes such as water treatment and distribution.

Author Contributions

Conceptualization, L.-T.W.; methodology, L.-T.W. and D.Z.; formal analysis, L.-T.W. and D.Z.; investigation, D.Z.; resources, L.-T.W. and K.-W.M.; data curation, L.-T.W., and D.Z.; writing—original draft preparation, D.Z.; writing—review and editing, L.-T.W. and K.-W.M.; visualization, D.Z.; supervision, L.-T.W. and K.-W.M.; project administration, K.-W.M.; funding acquisition, L.-T.W. and K.-W.M. All authors have read and agreed to the published version of the manuscript.

Funding

This research was funded by the General Research Fund, Research Grants Council of the Hong Kong Special Administrative Region, China (Project no. 15217221, PoyU P0037773/Q86B) and the Policy Research Centre for Innovation and Technology (PReCIT) Seed Funding Scheme of The Hong Kong Polytechnic University (Project ID: P0043831).

Data Availability Statement

Datas are contained within the article.

Conflicts of Interest

The authors declare no conflicts of interest.

References

  1. McDonald, C. Four Surprising Benefits of Your Daily Shower. Available online: https://www.wellnessworkdays.com/post/four-surprising-benefits-of-your-daily-shower#:~:text=Did%20you%20know%20taking%20a,and%20serotonin%2C%20on%20the%20inside (accessed on 28 September 2023).
  2. International Energy Agency (IEA). Worldwide Trends in Energy Use and Efficiency; IEA: Paris, France, 2008. [Google Scholar]
  3. Eurostat, Energy Use in Households in 2020. Available online: https://ec.europa.eu/eurostat/web/products-eurostat-news/-/ddn-20220617-1 (accessed on 28 September 2023).
  4. U.S. Department of Energy, “Water heating”. Available online: https://www.energy.gov/energysaver/water-heating#:~:text=Water%20heating%20accounts%20for%20about,energy%20expense%20in%20any%20home (accessed on 28 September 2023).
  5. Wanjiru, E.M.; Sichilalu, S.M.; Xia, X. Optimal control of heat pump water heater-instantaneous shower using integrated renewable-grid energy systems. Appl. Energy 2017, 201, 332–342. [Google Scholar] [CrossRef]
  6. Kordana, S.; Słyś, D.; Dziopak, J. Rationalization of water and energy consumption in shower systems of single-family dwelling houses. J. Clean. Prod. 2014, 82, 58–69. [Google Scholar] [CrossRef]
  7. Piotrowska, B.; Słyś, D. Comprehensive Analysis of the State of Technology in the Field of Waste Heat Recovery from Grey Water. Energies 2022, 16, 137. [Google Scholar] [CrossRef]
  8. Veeraboina, P.; Ratnam, G. Analysis of the opportunities and challenges of solar water heating system (SWHS) in India: Estimates from the energy audit surveys & review. Renew. Sustain. Energy Rev. 2012, 16, 668–676. [Google Scholar] [CrossRef]
  9. Grecksch, K. Achieving Water Efficiency in the Public Sector Through Social Norms. Front. Environ. Sci. 2021, 9, 575583. [Google Scholar] [CrossRef]
  10. Rossi, G. Achieving ethical responsibilities in water management: A challenge. Agric. Water Manag. 2015, 147, 96–102. [Google Scholar] [CrossRef]
  11. Manouseli, D.; Kayaga, S.M.; Kalawsky, R. Evaluating the Effectiveness of Residential Water Efficiency Initiatives in England: Influencing Factors and Policy Implications. Water Resour. Manag. 2019, 33, 2219–2238. [Google Scholar] [CrossRef]
  12. Shi, L.; Wang, L.; Li, H.; Zhao, Y.; Wang, J.; Zhu, Y.; He, G. Impact of residential water saving devices on urban water security: The case of Beijing, China. Environ. Sci. Water Res. Technol. 2022, 8, 326–342. [Google Scholar] [CrossRef]
  13. Chu, J.; Wang, C.; Chen, J.; Wang, H. Agent-based residential water use behavior simulation and policy implications: A case-study in Beijing city. Water Resour. Manag. 2009, 23, 3267–3295. [Google Scholar] [CrossRef]
  14. Dieu-Hang, T.; Grafton, R.Q.; Martínez-Espiñeira, R.; Garcia-Valiñas, M. Household adoption of energy and water-efficient appliances: An analysis of attitudes, labelling and complementary green behaviours in selected OECD countries. J. Environ. Manag. 2017, 197, 140–150. [Google Scholar] [CrossRef]
  15. Adeyeye, K.; She, K.; Meireles, I. Beyond the flow rate: The importance of thermal range, flow intensity, and distribution for water-efficient showers. Environ. Sci. Pollut. Res. 2020, 27, 4640–4660. [Google Scholar] [CrossRef] [PubMed]
  16. Zhou, Y.; Mui, K.W.; Wong, L.T.; Tsui, P.H.; Chan, W.K. Aerosol generation rates for showerheads. Build. Serv. Eng. Res. Technol. 2019, 40, 595–610. [Google Scholar] [CrossRef]
  17. Zhang, J.; Cui, Y.; Lu, H.; Lin, Z. Prediction of outflow parameters for a shower head. Water Res. 2021, 202, 117436. [Google Scholar] [CrossRef]
  18. Zhou, Y. Impact Evaluation of low Flow Showerheads for Bathing of Hong Kong. Ph.D. Thesis, The Hong Kong Polytechnic University, Hong Kong, China, 2018. [Google Scholar]
  19. Wong, L.-T.; Mui, K.-W.; Zhou, Y. Impact evaluation of low flow showerheads for Hong Kong residents. Water 2016, 8, 305. [Google Scholar] [CrossRef]
  20. Wong, L.T.; Poon, C.; Mui, K.W.; Zhang, D. Experimental study of the heat transfer coefficient between human skin and the flowing water during showering. In Proceedings of the 48th CIB W062 Symposium Conference, Leuven, Belgium, 29–31 August 2023. [Google Scholar]
  21. Cebo-Rudnicka, A.; Malinowski, Z.; Buczek, A. The influence of selected parameters of spray cooling and thermal conductivity on heat transfer coefficient. Int. J. Therm. Sci. 2016, 110, 52–64. [Google Scholar] [CrossRef]
  22. Hnizdil, M.; Chabicovsky, M.; Raudensky, M.; Lee, T.-W. Heat Transfer during Spray Cooling of Flat Surfaces with Water at Large Reynolds Numbers. J. Flow Control Meas. Vis. 2016, 04, 104–113. [Google Scholar] [CrossRef]
  23. Somasundaram, S.; Tay, A. Comparative study of intermittent spray cooling in single and two phase regimes. Int. J. Therm. Sci. 2013, 74, 174–182. [Google Scholar] [CrossRef]
  24. Puschmann, F.; Specht, E. Transient measurement of heat transfer in metal quenching with atomized sprays. Exp. Therm. Fluid Sci. 2004, 28, 607–615. [Google Scholar] [CrossRef]
  25. Hou, Y.; Liu, X.; Liu, J.; Li, M.; Pu, L. Experimental study on phase change spray cooling. Exp. Therm. Fluid Sci. 2013, 46, 84–88. [Google Scholar] [CrossRef]
  26. Hong Kong Water Supplies Department. Voluntary Water Efficiency Labelling Scheme on Showers for Bathing. Hong Kong Water Supplies Department. Available online: https://www.wsd.gov.hk/en/plumbing-engineering/water-efficiency-labelling-scheme/wels-on-showers-for-bathing/voluntary-water-efficiency-labelling-scheme-on-sho/index.html (accessed on 12 October 2022).
  27. Hou, Y.; Tao, Y.; Huai, X.; Zou, Y.; Sun, D. Numerical simulation of multi-nozzle spray cooling heat transfer. Int. J. Therm. Sci. 2018, 125, 81–88. [Google Scholar] [CrossRef]
  28. United Nations (UN) General Assembly, Sustainable Development Goals. United Nations Development Programme, New York, USA, 2015. 2015. Available online: https://sdgs.un.org/goals (accessed on 12 October 2022).
  29. Woolf, D.; Pau, I.; Shouler, M. Shower head design: Increasing performance at lower flow rates. In Proceedings of the CIB W062 Symposium, Taipei, Taiwan, 18–20 September 2006. [Google Scholar]
  30. Zhang, D.; Mui, K.-W.; Wong, L.-T. Establishing the Relationship between Occupants’ Thermal Behavior and Energy Consumption during Showering. Buildings 2023, 13, 1300. [Google Scholar] [CrossRef]
  31. Orr, P.; Papadopoulou, L.; Twigger-Ross, C. Water Efficiency and Behaviour Change Rapid Evidence Assessment (REA) FINAL REPORT; Twenty 65: London, UK, 2018. [Google Scholar]
Figure 1. The research process of this study.
Water 16 00928 g001
Figure 2. The experiment setup.
Water 16 00928 g002
Figure 3. Tested showerheads (AE) (from left to right in order).
Water 16 00928 g003
Figure 4. Heat transfer coefficients of different showerhead patterns.
Water 16 00928 g004
Figure 5. Relationships between the nozzle area ratio and the heat transfer coefficient.
Water 16 00928 g005
Figure 6. Relationships between the pressure and the heat transfer coefficient.
Water 16 00928 g006
Figure 7. Relationships between the resistant factor and the heat transfer coefficient.
Water 16 00928 g007
Figure 8. Interactive impacts of nozzle area ratio and resistance factor on the heat transfer coefficient when the water flow rate was 6 L/min (a,b) and 7.2 L/min (c,d).
Water 16 00928 g008
Table 1. Results obtained from the two experiments.
ShowerheadPatternWater Flow Rate (L/min)Heat Transfer Coefficient (W/(m2·°C)) Nozzle   Area   Ratio   A (/)Pressure P (kPa)Resistance Factor K (kPa·min2/L2)
Tw = 35Tw = 38Tw = 41
A1662.291.871.90.01253.21.5
7.265.488.668.30.012119.02.3
2686.487.4147.20.02291.02.5
7.2111.972.985.70.022123.62.4
3646.936.2123.40.01452.51.5
7.213877.385.90.014154.03.0
4682.3101.791.60.017105.02.9
7.269.674.390.80.01794.51.8
5663.644.610.70.01035.01.0
7.2122.198.155.50.010115.52.2
Mean (S.D.)81.9 (23.5)0.015 (0.004)94.3 (35.4)2.1 (0.6)
B16101.885.198.10.00473.52.0
7.2122.6140.1670.004161.03.1
26147.396.4112.70.00877.02.1
7.2117.1115.8147.10.008168.03.2
36119.6129.679.20.00587.52.4
7.2728697.40.005126.02.4
46104.5114.755.30.00771.82.0
7.269.2130.9100.30.007150.52.9
56164.173.655.50.00265.81.8
7.278.773.765.20.002123.92.4
Mean (S.D.)94.9 (23.8)0.005 (0.002)110.5 (37.9)2.5 (0.5)
C1666102.783.50.00668.81.9
7.274.4103.2101.40.006186.03.6
Mean (S.D.)88.5 (14.8)0.006 (0.000)127.4 (66.7)2.80 (1.1)
D1670.381.732.30.01252.51.5
7.294.757.665.40.012122.52.4
2695.6113.51150.02563.01.8
7.2148.477.6142.80.025147.02.8
36105.965.481.90.02356.01.6
7.2109.9104.583.30.023136.52.6
Mean (S.D.)88.1 (25.6)0.020 (0.006)96.3 (39.8)2.1 (0.5)
E1659.050.247.70.00452.51.5
7.250.074.155.50.004168.03.2
2650.355.567.00.00887.52.4
7.260.267.580.20.008212.84.1
3641.247.663.60.00649.01.4
7.253.064.180.30.006140.02.7
4644.545.737.40.00335.01.0
7.246.654.054.00.003129.52.5
Mean (S.D.)56.2 (11.3)0.005 (0.002)109.3 (59.5)2.3 (1.0)
Note: The outliers were marked in italics and eliminated from the database.
Table 2. Correlations between the heat transfer coefficient and the showerhead performance parameters.
Nozzle   Area   Ratio   A Water Pressure PResistance Factor K
Heat transfer coefficient0.283 (0.004)0.321 (0.001)0.395 (<0.001)
Nozzle area ratio −0.024 (0.811)−0.013 (0.893)
Water pressure 0.941 (<0.001)
Note: Results were obtained from Pearson correlation analyses; p-values were shown in parentheses; p < 0.05 was considered statistically significant and marked in bold.
Table 3. Interactive impact of nozzle area ratio and resistance factor on the heat transfer coefficient.
Water Flow RateParametersdfMean SquareFp
6 L/minNozzle area ratio21213.7592.6850.079
Resistance factor18289.77718.340<0.001
Nozzle area ratio × Resistance factor2148.0290.3270.722
7.2 L/minNozzle area ratio21188.0271.9910.149
Resistance factor12665.3094.4670.040
Nozzle area ratio × Resistance factor2477.7690.8010.456
Note: Results were obtained from two-way ANOVA analyses; p < 0.05 was considered statistically significant and marked in bold.
Table 4. Integrated impact of nozzle area ratio and resistance factor of showerhead on the heat transfer coefficient.
Water Flow RateParameters Unstandardized βStandardized β (CI95%)p
6 L/minConstant 3.959 /
Ln ( A )0.0390.06 (−0.11–0.19)0.598
Ln(K)0.9260.59 (0.57–1.28)<0.001
7.2 L/minConstant 4.672 /
Ln ( A )0.1910.46 (0.08–0.30)<0.001
Ln(K)0.6910.37 (0.21–1.17)0.005
Note: Results were obtained from two-way ANOVA analyses; p < 0.05 was considered statistically significant and marked in bold.
Table 5. Two demonstration cases.
Parameters Case 1Case 2
Showerhead patterB2E4
Nozzle area ratio (/)0.0080.003
Resistance factor (kPa·min2/L2)3.242.50
Water flow rate (L/min)7.27.2
Water temperature (°C)3841
Heat transfer coefficient (W/(m2·°C))115.854.0
Disclaimer/Publisher’s Note: The statements, opinions and data contained in all publications are solely those of the individual author(s) and contributor(s) and not of MDPI and/or the editor(s). MDPI and/or the editor(s) disclaim responsibility for any injury to people or property resulting from any ideas, methods, instructions or products referred to in the content.

