Article

Determining Water Use Patterns for the Betula platyphylla in the Southern Greater Khingan Mountains and Its Adaptation to Drought

1
College of Forestry, Inner Mongolia Agricultural University, Hohhot 010019, China
2
Key Laboratory of Forest Ecology and Environment of National Forestry and Grassland Administration, Ecology and Nature Conservation Institute, Chinese Academy of Forestry, Beijing 100091, China
3
Department of Geography, Nipissing University, North Bay, ON P1B 8L7, Canada
4
Faculty of Geographical Science, Beijing Normal University, Beijing 100875, China
5
Inner Mongolia Saikhan-Uul National Natural Reserve Administration, Daban 025000, China
*
Author to whom correspondence should be addressed.
Water 2024, 16(7), 927; https://doi.org/10.3390/w16070927
Submission received: 18 February 2024 / Revised: 16 March 2024 / Accepted: 19 March 2024 / Published: 22 March 2024

Abstract

:
Due to global climate change, seasonal droughts have intensified and become more frequent in certain semi-arid regions, and plants often adjust their water uptake depths to adapt to shifting environmental conditions. The southern Greater Khingan Mountains have a large natural secondary forest area and act as an important ecological barrier. This study focused on examining the water use patterns of the primary plant species, Betula platyphylla, within the natural secondary forest of the southern Greater Khingan Mountains. The investigation utilized oxygen stable isotope techniques and covered a timeframe spanning from July 2019 to September 2020. The findings indicate that the adaptable water utilization strategies and rapid response to precipitation could facilitate plants fully utilizing water from all depths, thereby enabling them to better adapt to arid environments. When the rainfall was low (390.4 mm in the growing season of 2019), the developed shallow roots quickly absorbed shallow soil water (0–20 cm, with a utilization ratio of 40.4% for the entire root depth), but when the rainfall increased (501.5 mm in the growing season of 2020), Betula platyphylla gradually transitioned to extracting soil water from deeper soil layers (40–60 cm) and deepened its root system (with a utilization ratio of 39.4%), indicating its adaptability to semi-arid environments. Therefore, the flexible water use strategy of Betula platyphylla in the same habitat may give it a competitive advantage during low rainfall periods. The findings are important for the protection of natural forests and water management in the southern Greater Khingan Mountains.

1. Introduction

The forests in the southern Greater Khingan Mountains in China are an important component of a semi-arid area with limited water resources. Due to climate gradients and interannual climate fluctuations, as well as an uneven distribution of precipitation, the large-scale natural secondary forests have experienced decline and death driven by climate change [1,2], and forest vegetation is highly sensitive to climate change. The frequency and severity of extreme climate conditions (such as drought) are expected to increase in the future [3,4]. Drought significantly impacts natural mountain forests in semi-arid regions [5]. Drought is an independent source of pressure that consumes ecosystem water resources and may have devastating impacts on the environment [6]. Vegetation regulates the Earth’s water, energy and carbon cycles, and how its future functions will change largely depends on how it responds to droughts [7]. Water scarcity is a critical constraint on tree growth and ecosystem stability in arid and semi-arid regions. Water availability in the soil and the dynamics of tree water usage are pivotal for the functionality of forest ecosystems [8]. With the increase in atmospheric water demand caused by climate change, the water pressure during the growing season continues to rise, greatly affecting the growth of trees in semi-arid areas [9,10]. The water use patterns of trees and their adaptation to climate change are conducive to better explaining the response mechanisms of trees to climate change. Therefore, it is necessary to study the temporal differences in tree water use characteristics at the annual scale.
The adaptation mechanism of plants to drought can enable them to survive under long-term drought conditions, such as the deep root characteristics of stable water sources and their ability to switch between different water sources [11]. The water use sources of plants in different habitats are different [12,13,14], and the potential water sources used by plants have significant seasonal variations [15,16]. Numerous studies on tree water usage patterns in semi-arid regions have revealed that plants possess the ability to adapt their flexibility in absorbing water at varying depths to accommodate fluctuations in soil moisture levels [17,18]. Evidence indicates that in arid regions, vegetation shifts the depth of water absorption toward deeper soil layers, rock moisture, and groundwater sources [7]. In the semi-arid area of the southern foothills of the Taihang Mountains, jujube artificial forests mainly utilize deep soil water during both dry and rainy seasons. The artificial forests of Platycladus orientalis in the mountainous areas of Beijing mainly absorb and utilize stable deep soil water during the rainy season, with a contribution rate of 55.7%. In the dry season, as the soil moisture content decreases, the water absorption depth of Platycladus orientalis gradually shifts toward the shallow layer [18,19]. If long-term extreme drought causes a sharp decrease in the soil surface water content, then the water absorption of trees shifts to deep soil water and groundwater, and the use of groundwater increases from 25.3% in the early stage to 61.3% in later stages [20]. In the shrubland of yellow willow in the Otindag Sandy Land of Inner Mongolia, during the growing season (from May to October), mainly shallow soil water is utilized, with an average utilization rate of 90%. As a drought intensifies, appropriate adjustments are made to absorb middle and deep soil water. During the dry season, poplar mainly absorbs and utilizes shallow (0–40 cm) and deep (120–200 cm) soil water, with contribution rates of 50.2% and 31.5%, respectively. In the rainy season, the contribution rate of shallow soil water reaches 72.8% [21,22]. Similarly, Qinghai spruce and other species in the upper reaches of the Heihe River mainly absorb and utilize surface soil water during the rainy season, while they tend to utilize deep soil water during the dry season [23]. However, the tree’s water use adaptation has not been thoroughly studied or reported for the southern Greater Khingan Mountains.
The differences in the responses of trees to water determine the composition, diversity and productivity changes of forest ecosystems [24]. In arid and semi-arid regions, soil water affects the growth and survival of plants and is a key limiting factor. Moreover, due to the frequent water stress faced by plant communities, selecting appropriate adaptation strategies is crucial [8]. The performance of different tree species after experiencing extreme weather is not consistent. Previous studies have shown that after being affected by climate change, the mortality rate of Populus davidiana was higher than that of Betula platyphylla [25]. Betula platyphylla, as a pioneer species, is commonly found in temperate to subarctic regions [26,27,28], forming the main secondary forest in Northeast China [29], and it is recognized as a dominant species with a broad distribution range. In temperate forest and grassland areas (for example, around 47° N, 124° E), their distribution altitude is about 700–1000 m [26], indicating that they have a certain water adaptation ability. At present, the main research focus is on transpiration water consumption and radial growth [30,31], with limited research on the sources of water for Betula platyphylla in semi-arid areas. Therefore, it is important to understand the water use mechanism of Betula platyphylla in adapting to climate change, which will help to understand the changes in tree species composition caused by climate change and predict the future evolution direction of secondary forest vegetation communities in the region. Many studies in dry lands have shown that trees reduce water use in the shallow soil layers during drought and instead increase their dependence on deep soil layers. However, the water uptake characteristics of Betula platyphylla in such a special environment in semi-arid areas are not yet clear. Therefore, this study aimed to (1) assess the extent of soil water contribution across various soil layers and (2) compare the water uptake patterns at different stages to preliminarily determine the water use patterns of Betula platyphylla during drought. We hypothesized that (1) Betula platyphylla can flexibly switch its use of shallow and deep soil water, and (2) they mainly rely on deep soil water when rainfall is low. To test our hypotheses, we collected xylem water and soil water samples from two consecutive growing seasons of natural Betula platyphylla forests.

2. Materials and Methods

2.1. Study Area

The research area was located at the Inner Mongolia Saikhan-Uul Forest Ecological Station of the China Terrestrial Ecosystem Research Network (CEN), within the Saikhan-Uul National Nature Reserve in northeastern Inner Mongolia, China (Figure 1). It is situated from longitude 118°18′ to 118°55′ east and from latitude 53°59′ to 44°27′ north, with an average altitude of around 1300 m. It is about 115 km away from Daban Town. The climate in this area falls within the semi-arid category, characterized by an average annual temperature of 2 °C and an average annual rainfall of 400 mm. The majority of the rainfall occurs between June and August, constituting 70–80% of the annual average precipitation (Figure 2). The change in the annual average temperature has a clear difference before and after 1993, with the 10 year averaged temperature rising rate increasing from 0.26 °C per 10 years before 1993 to 0.43 °C per 10 years after 1993 [32]. Because of the high regional warming rate, unstable rainfall fluctuations and overall rainfall reduction [32], the study area has had frequent drought events, often encountering long-term droughts. The study site is situated in a mountainous area within the forest steppe transition zone in northern China. With differences in altitude and slope orientation, the distribution of vegetation exhibits a vertical zoning phenomenon, and the change pattern in altitude gradient and slope orientation is quite obvious. On shady slopes, with the variation in the altitude gradient, the main distribution areas include a Betula platyphylla belt, a mixed belt of Populus davidiana and Betula platyphylla forest and a Larix principis rupprechtii belt. On the sunny slopes, it is mainly distributed with the mountainous hills steppe belt, a Quercus mongolica forest belt and Ulmus pumila sparse forest belts [33].

2.2. Environmental and Meteorological Measurements

Meteorological data such as the rainfall and air temperature in the research area were obtained from the onsite meteorological station of the Saikhan-Uul Forest Ecological Station. The measurement of the air temperature was carried out through an air temperature recorder (HMP155A, Vaisala, Helsinki, Finland) and precipitation gauge (TE525MM, Texas Electronics Inc., Dallas, TX, USA), with data collected every 30 min by a data logger (CR1000, Campbell Scientific Inc., Logan, UT, USA). Soil moisture sensors (CS616–L50, Campbell Scientific, Logan, UT, USA) were deployed at various soil depths—0–5 cm, 5–10 cm, 10–20 cm, 20–40 cm and 40–80 cm—to measure the volumetric water content (VWC) from May to September. A data logger (CR1000) was used to collect data at 30 min intervals.

2.3. Experiment Design and Sampling

Over the course of two years, seasonal field experiments were carried out within a sample plot measuring 30 m × 30 m, established within a pure birch forest. We chose five healthy trees with their heights and diameters at breast height close to the average of the study area (Table 1). The soil profile of the sample plot was shallow. (The thickness was approximately 40–70 cm.) Soil sampling occurred in the middle of each month on rain-free days or several days following rainfall events. Monthly samples of tree xylem water and soil water at depths of 10 cm, 20 cm, 30 cm, 40 cm and 60 cm were systematically collected for stable isotope analysis. For the sampling of water in the xylem of trees, the isotopic composition of the water in the mature plant body can reflect the isotopic composition of the plant’s water source. In 2019 and 2020 (from May to October), samples were taken from the sample trees, with 3 replicates taken from each sample tree. Soil water samples were obtained using a hand auger and carefully sealed in glass containers with Parafilm for subsequent isotopic analysis. To mitigate the influence of evaporation on the isotopic content, all soil and plant samples were promptly frozen and stored until water extraction using cryogenic vacuum distillation. Precipitation samples were collected by utilizing a rainwater collector during precipitation events. Each sample was collected immediately following the cessation of a precipitation event. Throughout the growing seasons of 2019 and 2020, a total of 100 precipitation samples were gathered and securely sealed in clean polyethylene bottles with Parafilm. These precipitation samples were then stored in a refrigerator set at −2 °C until they were ready for isotopic analysis.
For the sampling of fine root biomass, we select 5 well-grown birch trees near the sample plot and used a “layered excavation” approach in two areas, 0.5 m and 1 m away from the plant trunk, to excavate the plant roots layer by layer. Each soil profile was divided into six layers of plant root systems: 0–10 cm, 10–20 cm, 20–30 cm, 30–40 cm, 40–50 cm and 50–60 cm. Soil samples within the same position of 30 cm × 30 cm × 10 cm were taken from each layer. We measured the root diameter of the root sample after soil screening, used a vernier caliper to pick out the fine roots (≤2 mm), weighed the fresh weight of each layer of root using an electronic balance and dried them in an oven to a constant weight (70 °C, 48 h). We then measured the biomass of the fine roots using a balance.

2.4. Isotopic Analysis

The plant and soil samples underwent water extraction utilizing an automated vacuum condensation extraction system (LI-2100, LICA, Beijing, China) in the State Key Laboratory of Earth Surface Processes and Resource Ecology at the College of Faculty of Geographical Science of Beijing Normal University and in the Experimental Center of the Pastoral Water Conservancy Science Research Institute of the Ministry of Water Resources. The rainwater and extracted plant and soil water underwent filtration, using 0.22 μm organic phase pin-type filters to remove impurities and organic contaminants. Based on the soil profile, the soil water sources were categorized into shallow (0–20 cm), middle (20–40 cm) and deep (40–60 cm) layers. Notably, groundwater was excluded as a potential water source for the trees given the mountainous terrain of the plot, where groundwater availability for tree roots may have been limited. Water isotopic measurements for the soil, plants and precipitation were conducted using an isotopic ratio infrared spectroscopy (IRIS) system (T-LWIA-45-EP, ABB-Los Gatos Research, San Jose, CA, USA). The analytical precision for the liquid water measurements was ±1% for δD and ±0.2% for δ18O [34]. The hydrogen and oxygen isotopic compositions of the water were measured, calibrated and normalized to internal laboratory water standards previously calibrated against the Vienna Standard Mean Ocean Water (VSMOW) [11,35].

2.5. Data Analyses

We conducted single-factor analysis of variance (ANOVA) on the soil water δ18O within each layer using SPSS 19.0 (SPSS Inc., Chicago, IL, USA), followed by Duncan’s new multiple range test (MRT). The assumptions of the ANOVA were respected and followed up. Furthermore, to estimate the potential ratio of tree water sources, we employed the Bayesian isotope mixing model MixSIAR (version 3.1.7) [36,37]. SPSS 19.0 and Origin 2023 (OriginLab Corporation, Northampton, MA, USA) were utilized for data organization, analysis and plotting.

3. Results

3.1. Precipitation and Soil Moisture Characteristics

The precipitation during the growing seasons (from May to September) of 2019 and 2020 was 390.4 mm and 501.5 mm, respectively (Table 2). The difference in monthly precipitation between the two years was that in 2020, it was 10.8 mm higher in May than in 2019, 6.6 mm higher in June, 25.2 mm higher in August and 65.8 mm higher in September. In 2019, it was 40.5 mm higher in July than 2020. It can be seen that during the growing season, except for July, the precipitation in all other months of 2020 was higher than that in 2019, especially in September, which was 65.8 mm higher (Figure 2). The difference in VWC between different soil layers in two years in different months is that there was no significant difference at 0–5 cm in May, but there were significant differences between other months. At a depth of 10–20 cm, there were differences in May, June and September, while there was no difference in July and August. At a depth of 20–40 cm, there was a significant difference in May, no difference in June and July and significant differences in August and September; At a depth of 40–80 cm, there was a difference in May, while there was no difference between the other months (Table 2). Overall, the VWC of each soil layer was affected by precipitation, especially in September, when there was a significant difference in precipitation. But this difference decreased at 40–80 cm, indicating that the current level of precipitation is not enough to irrigate the deeper soil layer.

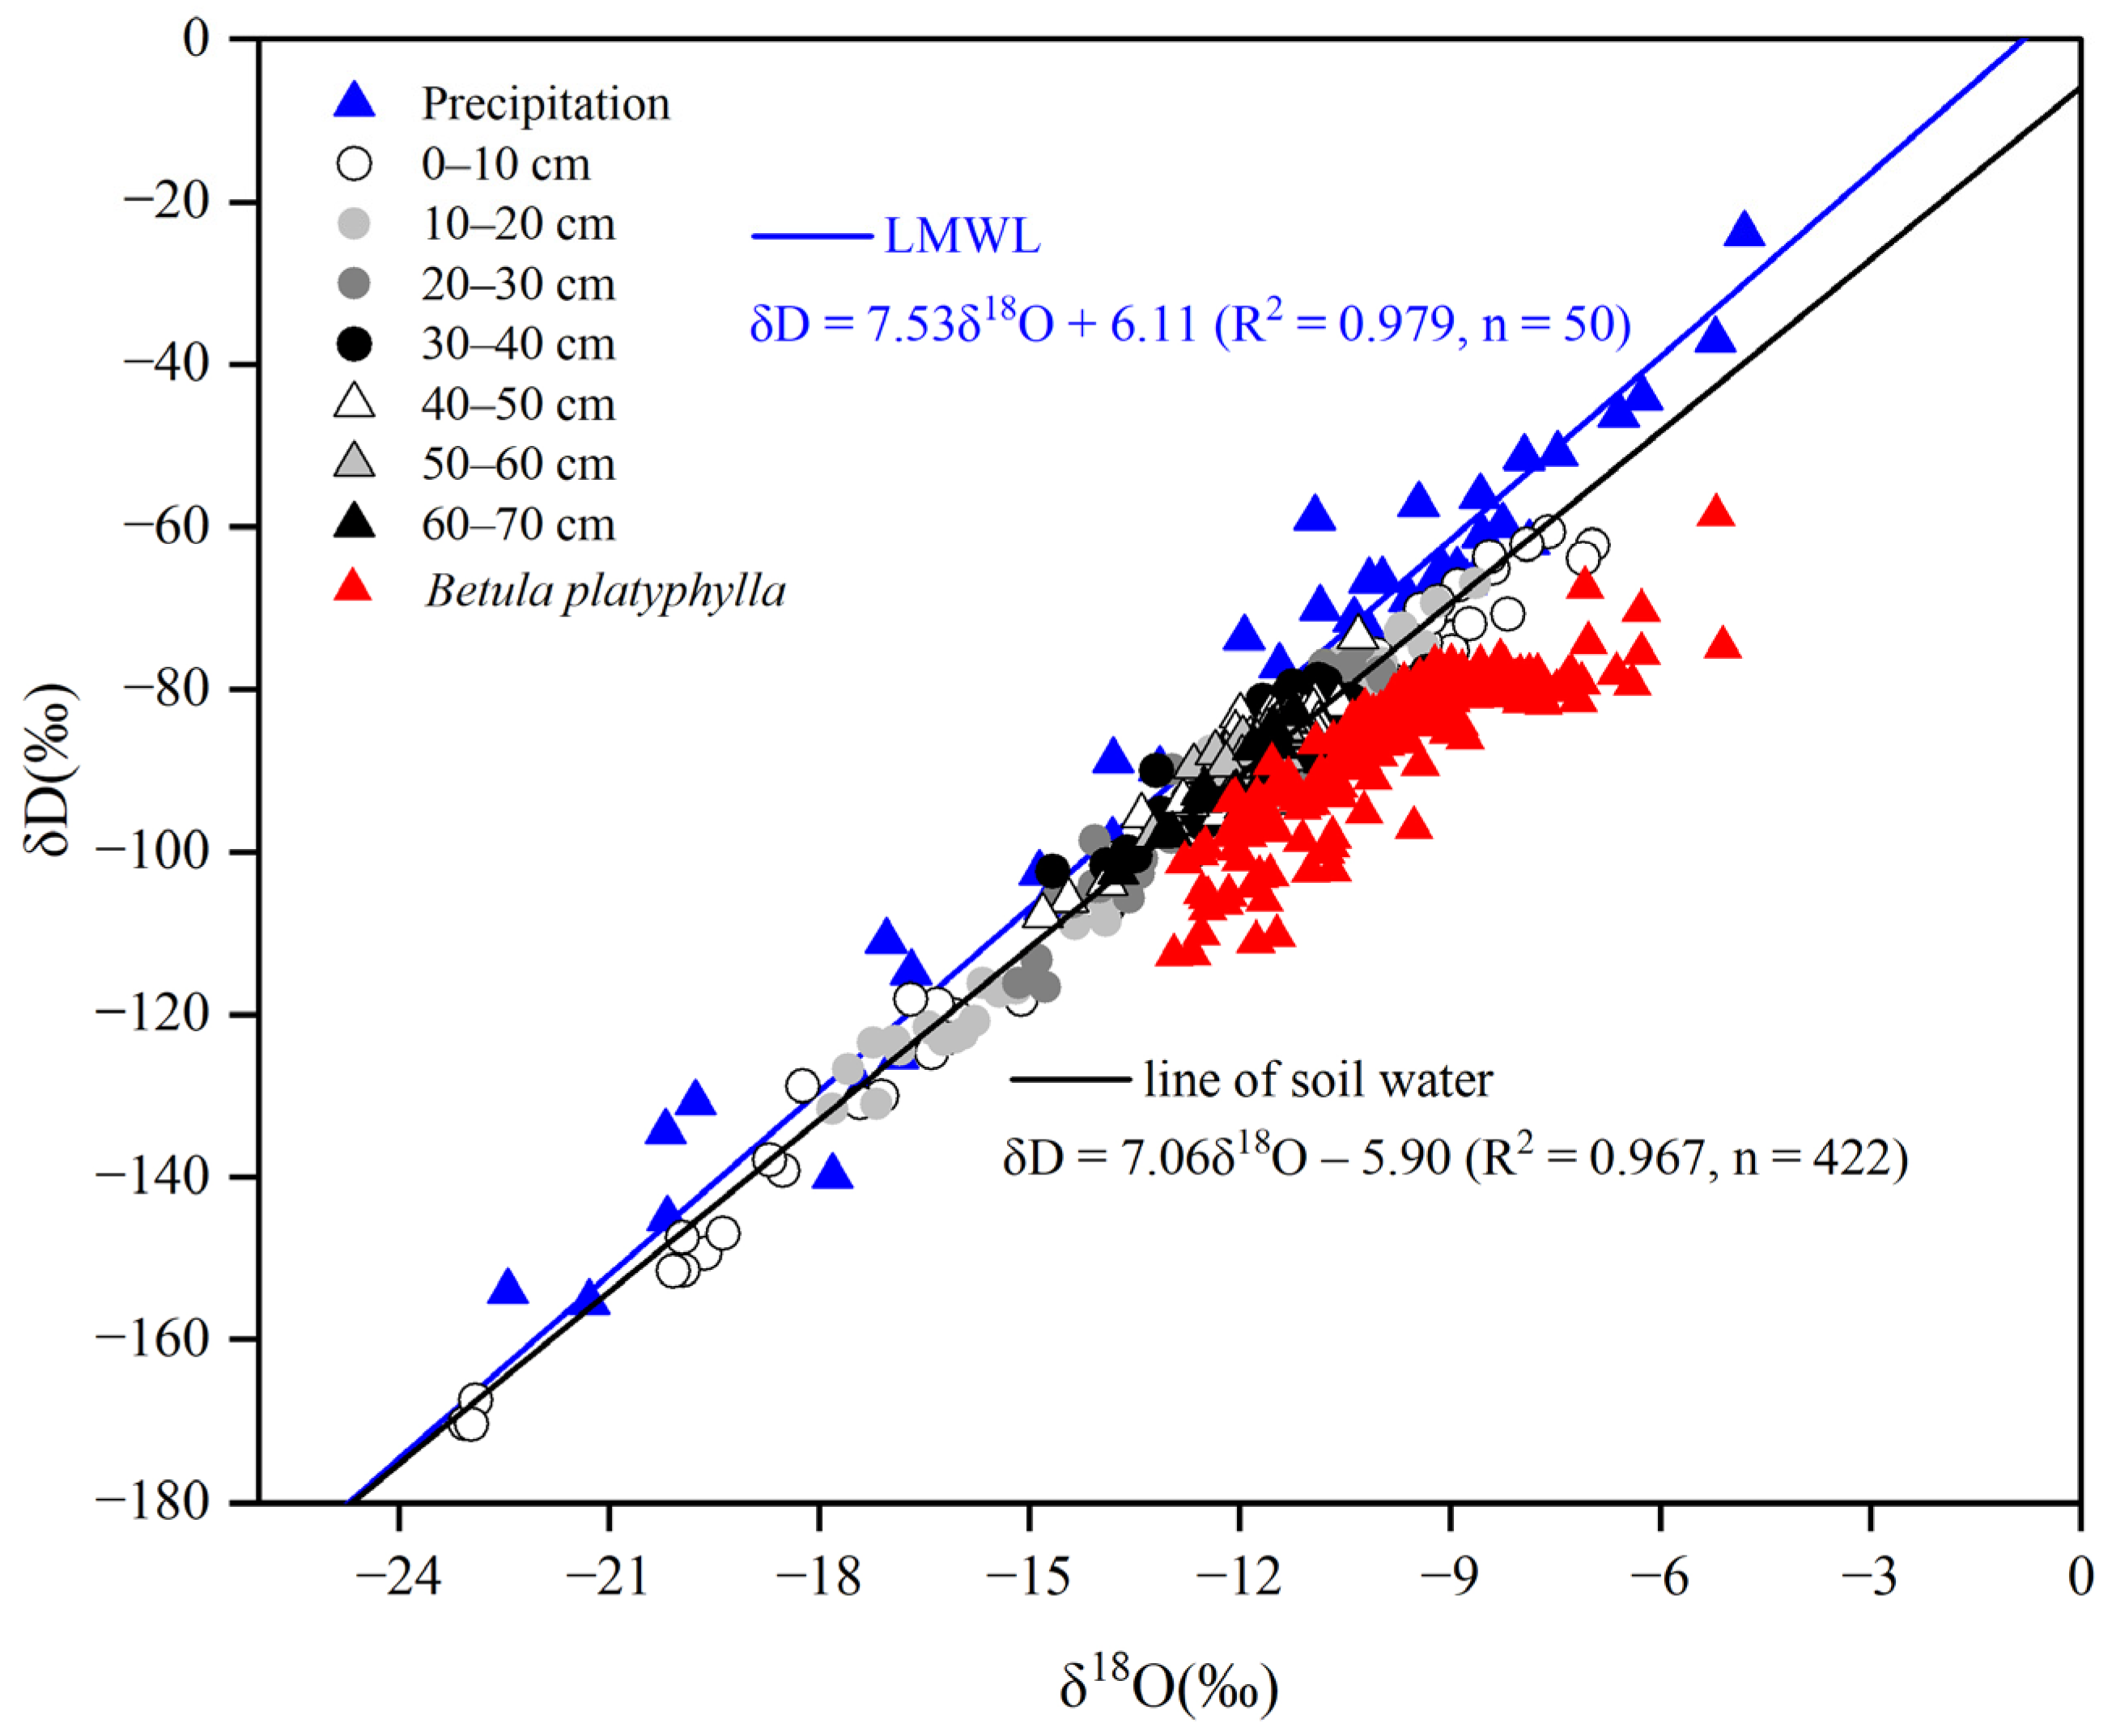
3.2. Precipitation, Soil Water, Xylem Water and Isotopic Composition

The variation ranges of the precipitation and soil water δD and δ18O were from −263.46‰ to −23.96‰ and from −33.85‰ to −4.80‰ as well as from −170.36‰ to −60.69‰ and from −23.05‰ to −6.97‰, respectively. The ranges of δD and δ18O in xylem water were form −112.65‰ to −58.55‰ and from −12.94‰ to −5.11‰, respectively. The average values of δD and δ18O in xylem water were −86.35‰ and −9.82‰, which were higher than the average values of −90.89‰ and −12.04‰ in the soil water of the area, respectively. The local meteoric water line (LMWL: δD = 7.53δ18O + 6.11, R2 = 0.97, p < 0.001) was derived from the precipitation isotopic data. Notably, the slope and intercept of the LMWL were observed to be lower than those of the global meteoric water line (GMWL: δD = 8δ18O + 10) [38] (Figure 3), which suggests that the local precipitation was influenced by evaporation, reflecting climatic characteristics characterized by reduced precipitation and increased evaporation [11]. Figure 3 shows that the xylem water of Betula platyphylla mainly comes from soil water.

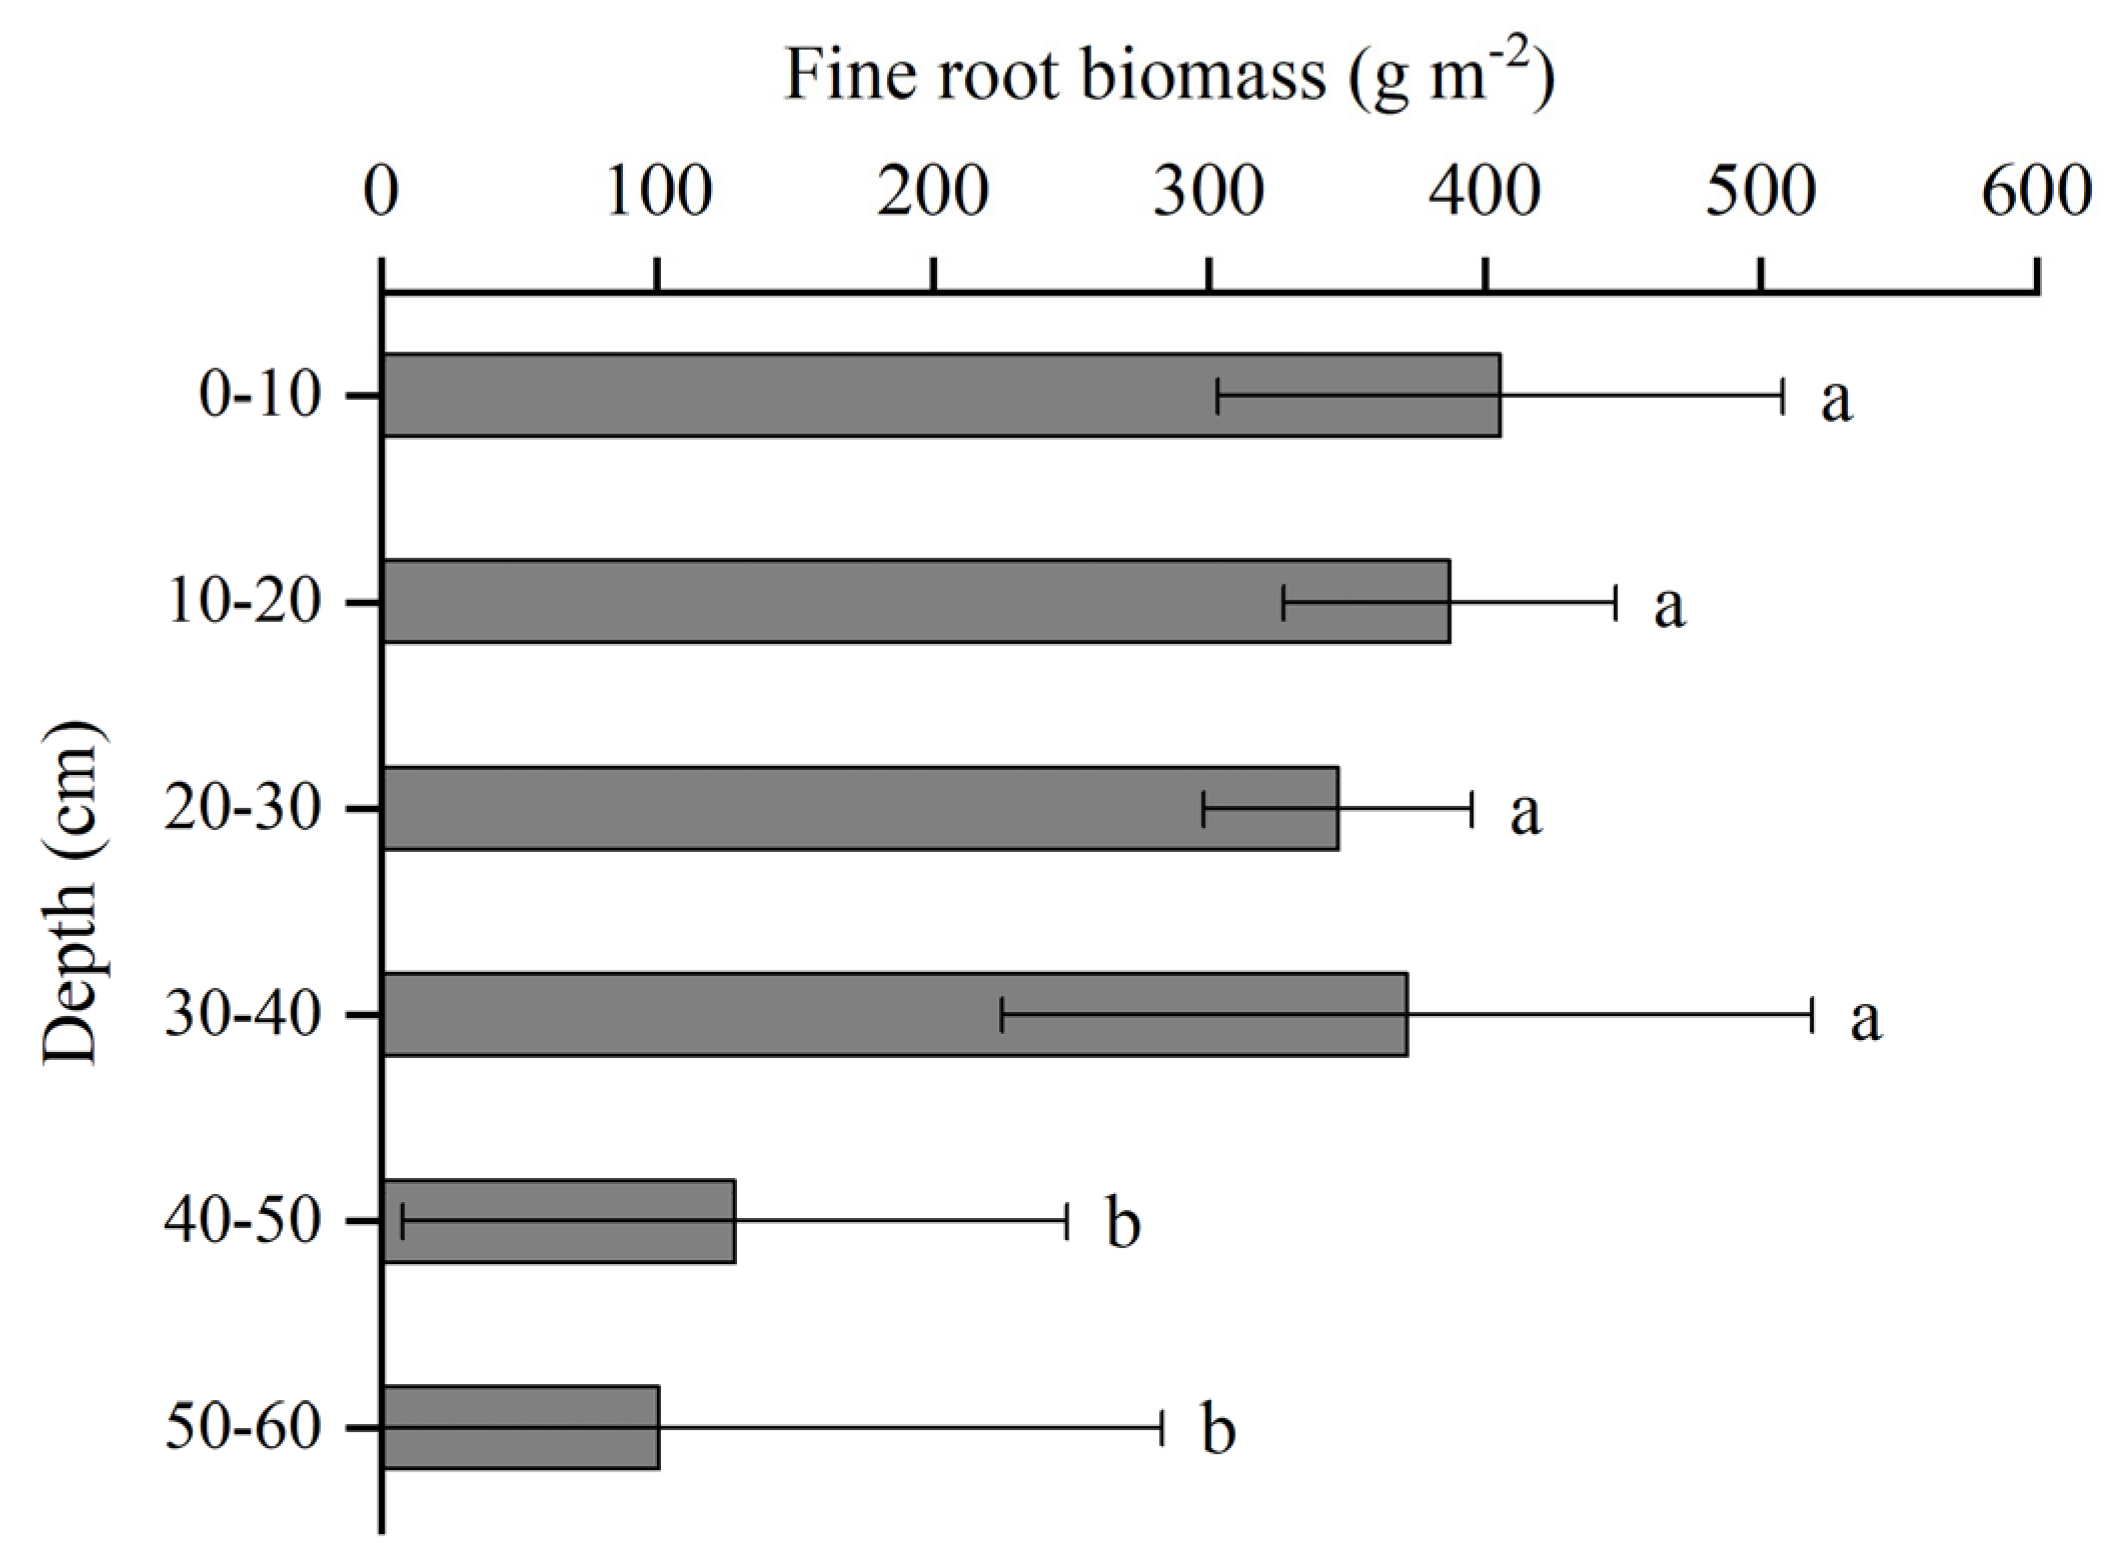
3.3. Root Distribution

There was no significant difference in root biomass observed between the 0–40 cm soil layers. However, a significant difference was noted when compared with the 40–60 cm soil layers (p < 0.05) (Figure 4). In the shallow soil layers, the root system was well developed, with 0–2 mm fine roots mainly distributed in the 0–40 cm soil layers (accounting for 86.87% of the total fine roots), being significantly higher than in the 40–60 cm soil layers (p < 0.05). The fine root biomass within the 0–10 cm soil layer measured 405.63 ± 102.31 (g·m−2), constituting approximately 23.31% of the total fine root biomass in that soil layer. The soil layers spanning 10–20 cm, 20–30 cm and 30–40 cm comprised 22.26%, 19.93% and 21.37% of the total fine root biomass, respectively. As the soil depth increased, the fine roots gradually decreased. At 40–50 cm and 50–60 cm, the ratio of the fine root biomass to the total fine root biomass as a percentage was 7.36% and 5.78%, respectively. Consequently, the fine roots of Betula platyphylla were predominantly distributed within the depth range of 0–40 cm.

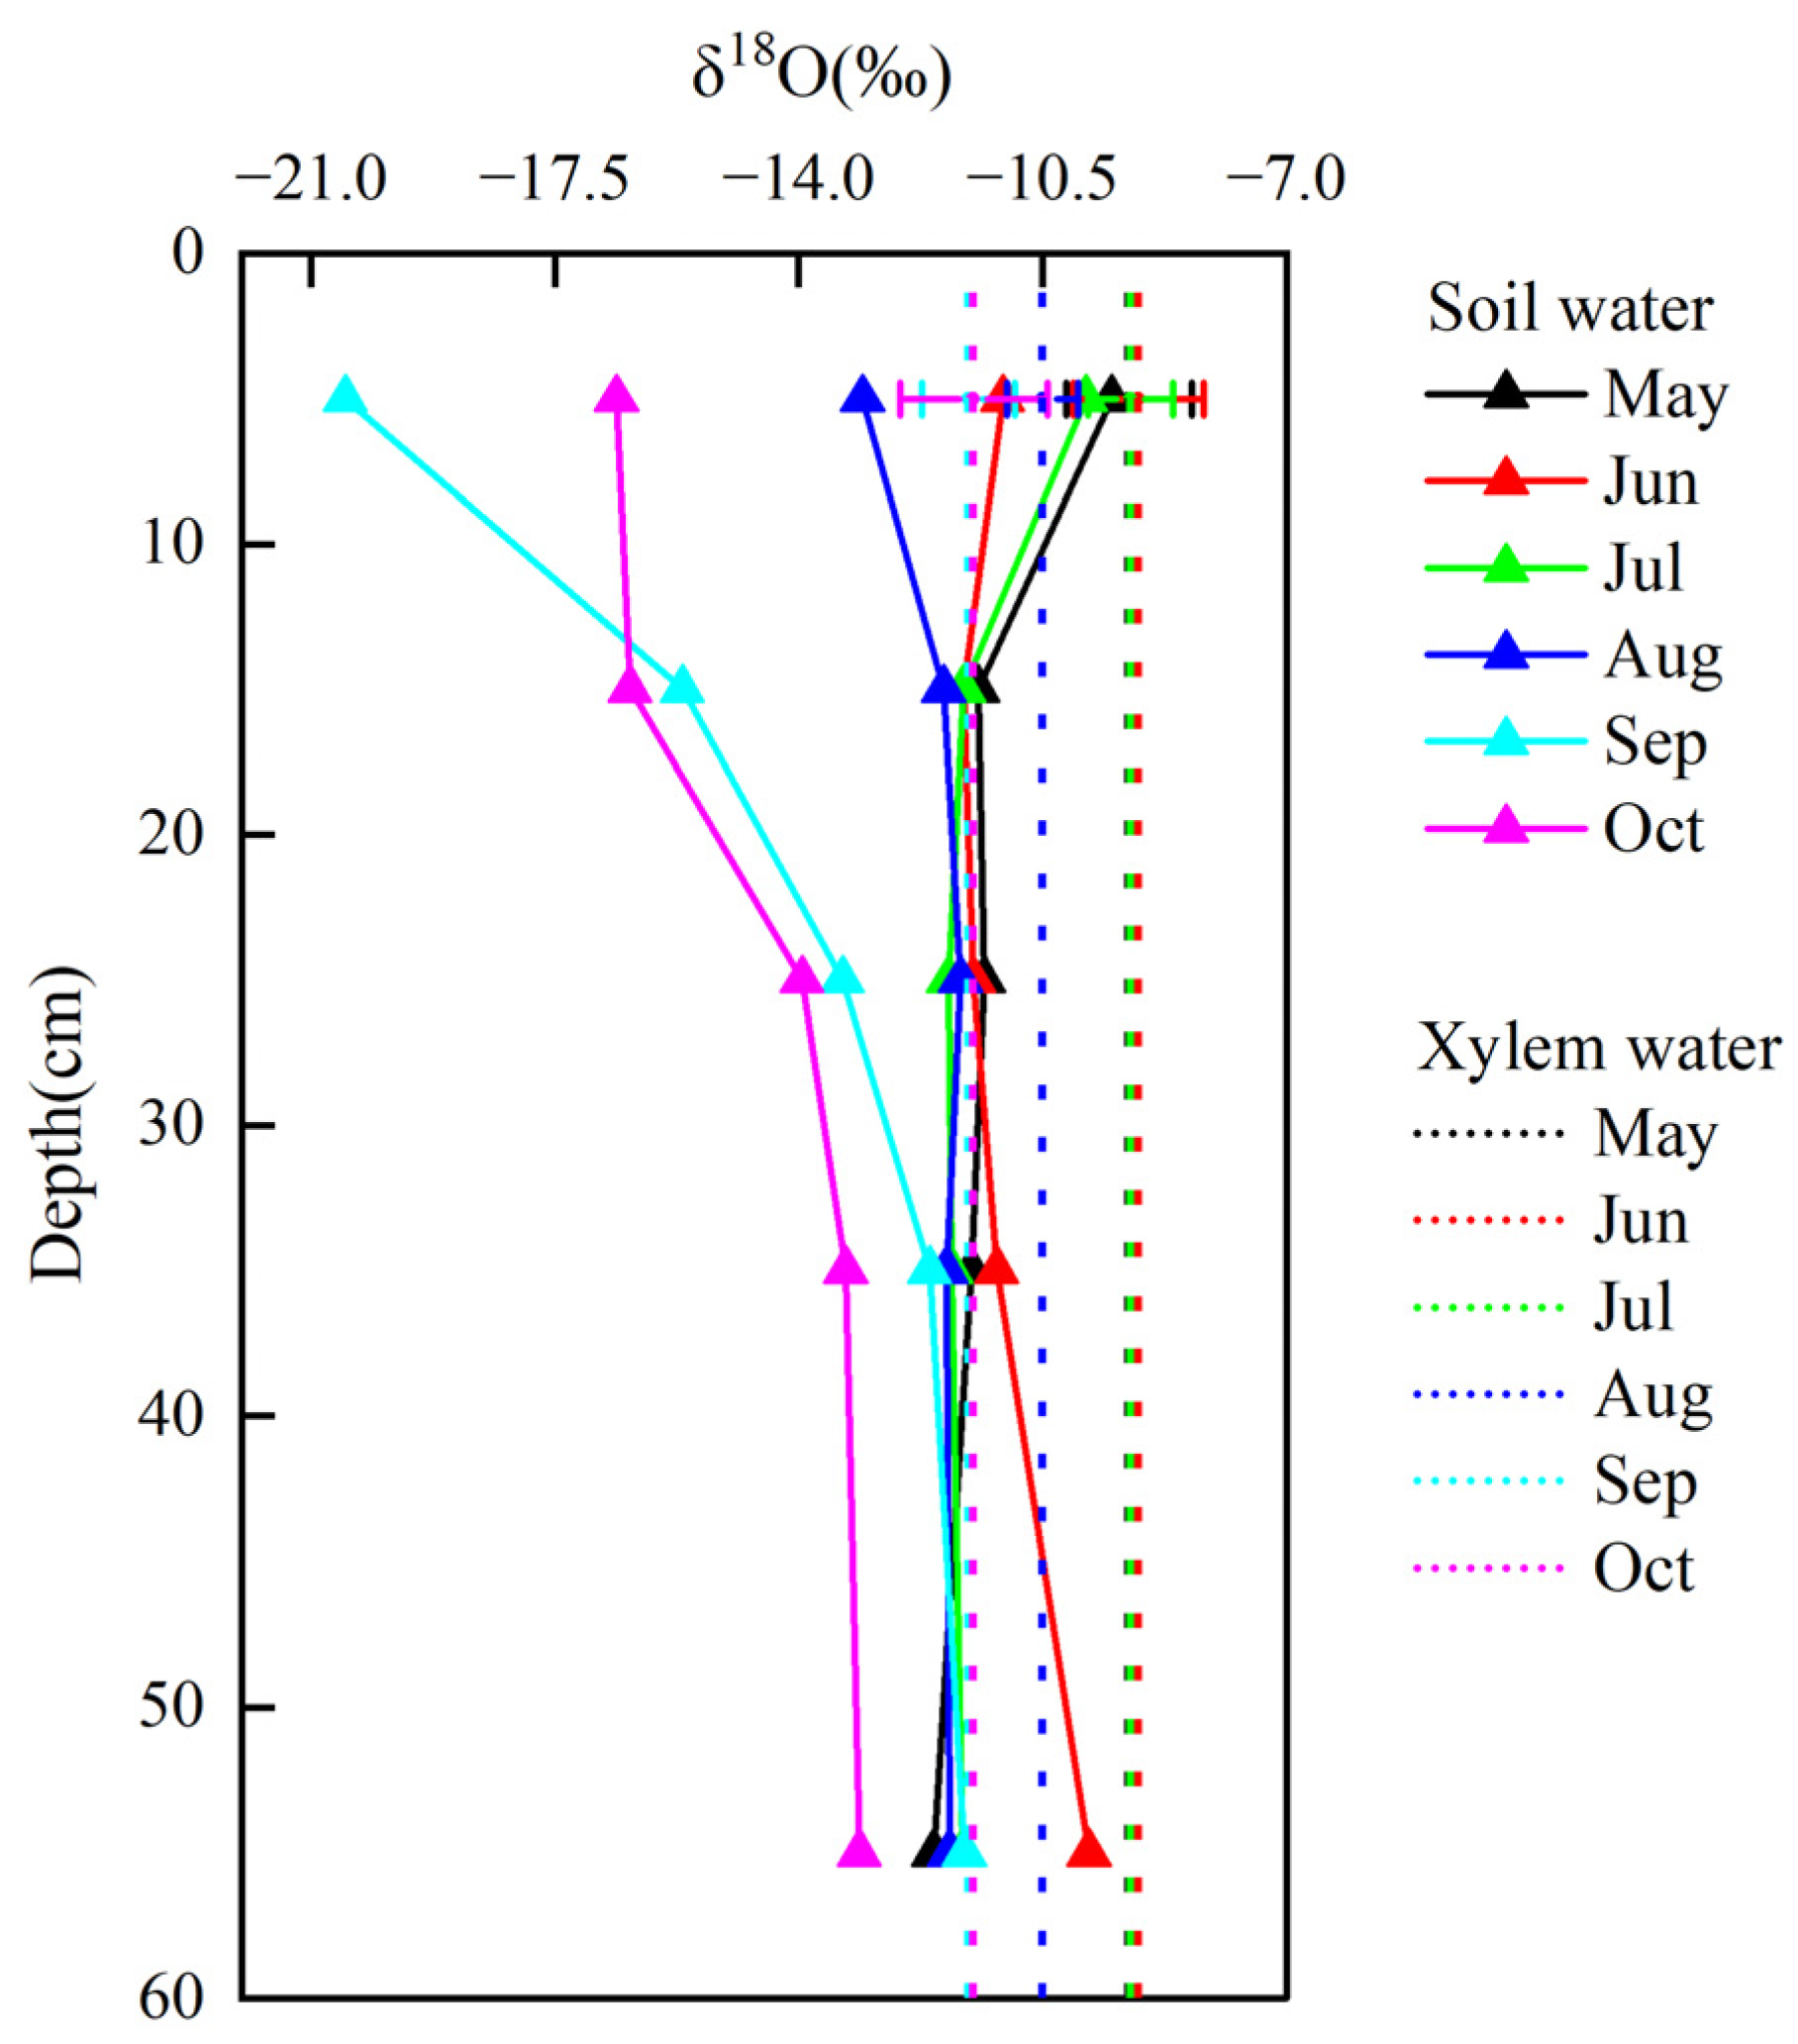
3.4. Soil Moisture and Isotopic Composition

Studies have shown that there may be a certain degree of δD fractionation when water is absorbed by plant roots [39]. Therefore, when analyzing the source of plant water, only the δ18O value was used. The shallow soil VWC decreased from the 0–10 cm layer to the 10–20 cm layer and then increased with the increase in soil depth in each month between the 10–20 cm and 30–40 cm layers, but the soil moisture content began to decrease beyond a depth of 40 cm (Figure 5). The VWC in 2020 was significantly higher than the average in 2019 (p < 0.05). The average VWC in the shallow and middle layers (0–40 cm) was 25% in 2020, significantly higher than the 23.4% VWC in 2019. The average VWC in the deep layer (40–60 cm) from July to October was 17.5% and 17.9% for 2019 and 2020, respectively, with no significant difference (p > 0.05). The average VWCs of the shallow and middle soil layers in July and August for the two years were not significantly different, while in September and October, the VWC in 2019 was significantly lower than that in 2020 (p < 0.05). This indicates that the VWC in September and October 2019 was lower than in other months. In May, the frozen soil began to thaw, and the VWC of the 0–40 cm soil layer fluctuated greatly. As the soil layer deepened, the VWC of the deep (below 40 cm) soil decreased. In different soil layers, the difference in δ18O values was not significant (p > 0.05), and the fluctuation in δ18O values was small, which was mainly related to precipitation and soil evaporation (Figure 5). At the monthly time scale, there was a significant difference in the soil water δ18O in September and October compared with other months (p < 0.05). In September and October, due to the low δ18O value in precipitation, the δ18O value of the shallow soil water was also low. As the soil depth increased, the δ18O value of the soil water was higher because of the enrichment of the heavier isotope.

3.5. Depth of Water Utilization

The δ18O value of the xylem water was within the δ18O range of soil water during May–August (Figure 6) and then gradually decreased and stayed out of the range during September–October. The δ18O values (−11.56‰ and −11.49‰) of the xylem water in September and October, respectively, were significantly lower than those in other months. The intersection plot of the oxygen values in the xylem water and soil water at various depths can provide a preliminary and intuitive indication of the depth at which plants absorb water. As shown in Figure 6, with the passage of time, the intersection points of δ18O in the xylem water and soil water gradually shifted downward. This indicates that the depth of water use deepened. Among them, the intersection point in September was significantly lower than other months, indicating the increased water use depth in September. Overall, the intersection points of the xylem water of Betula platyphylla and soil water changed from 0–10 cm in June–August to 40–60 cm in September.

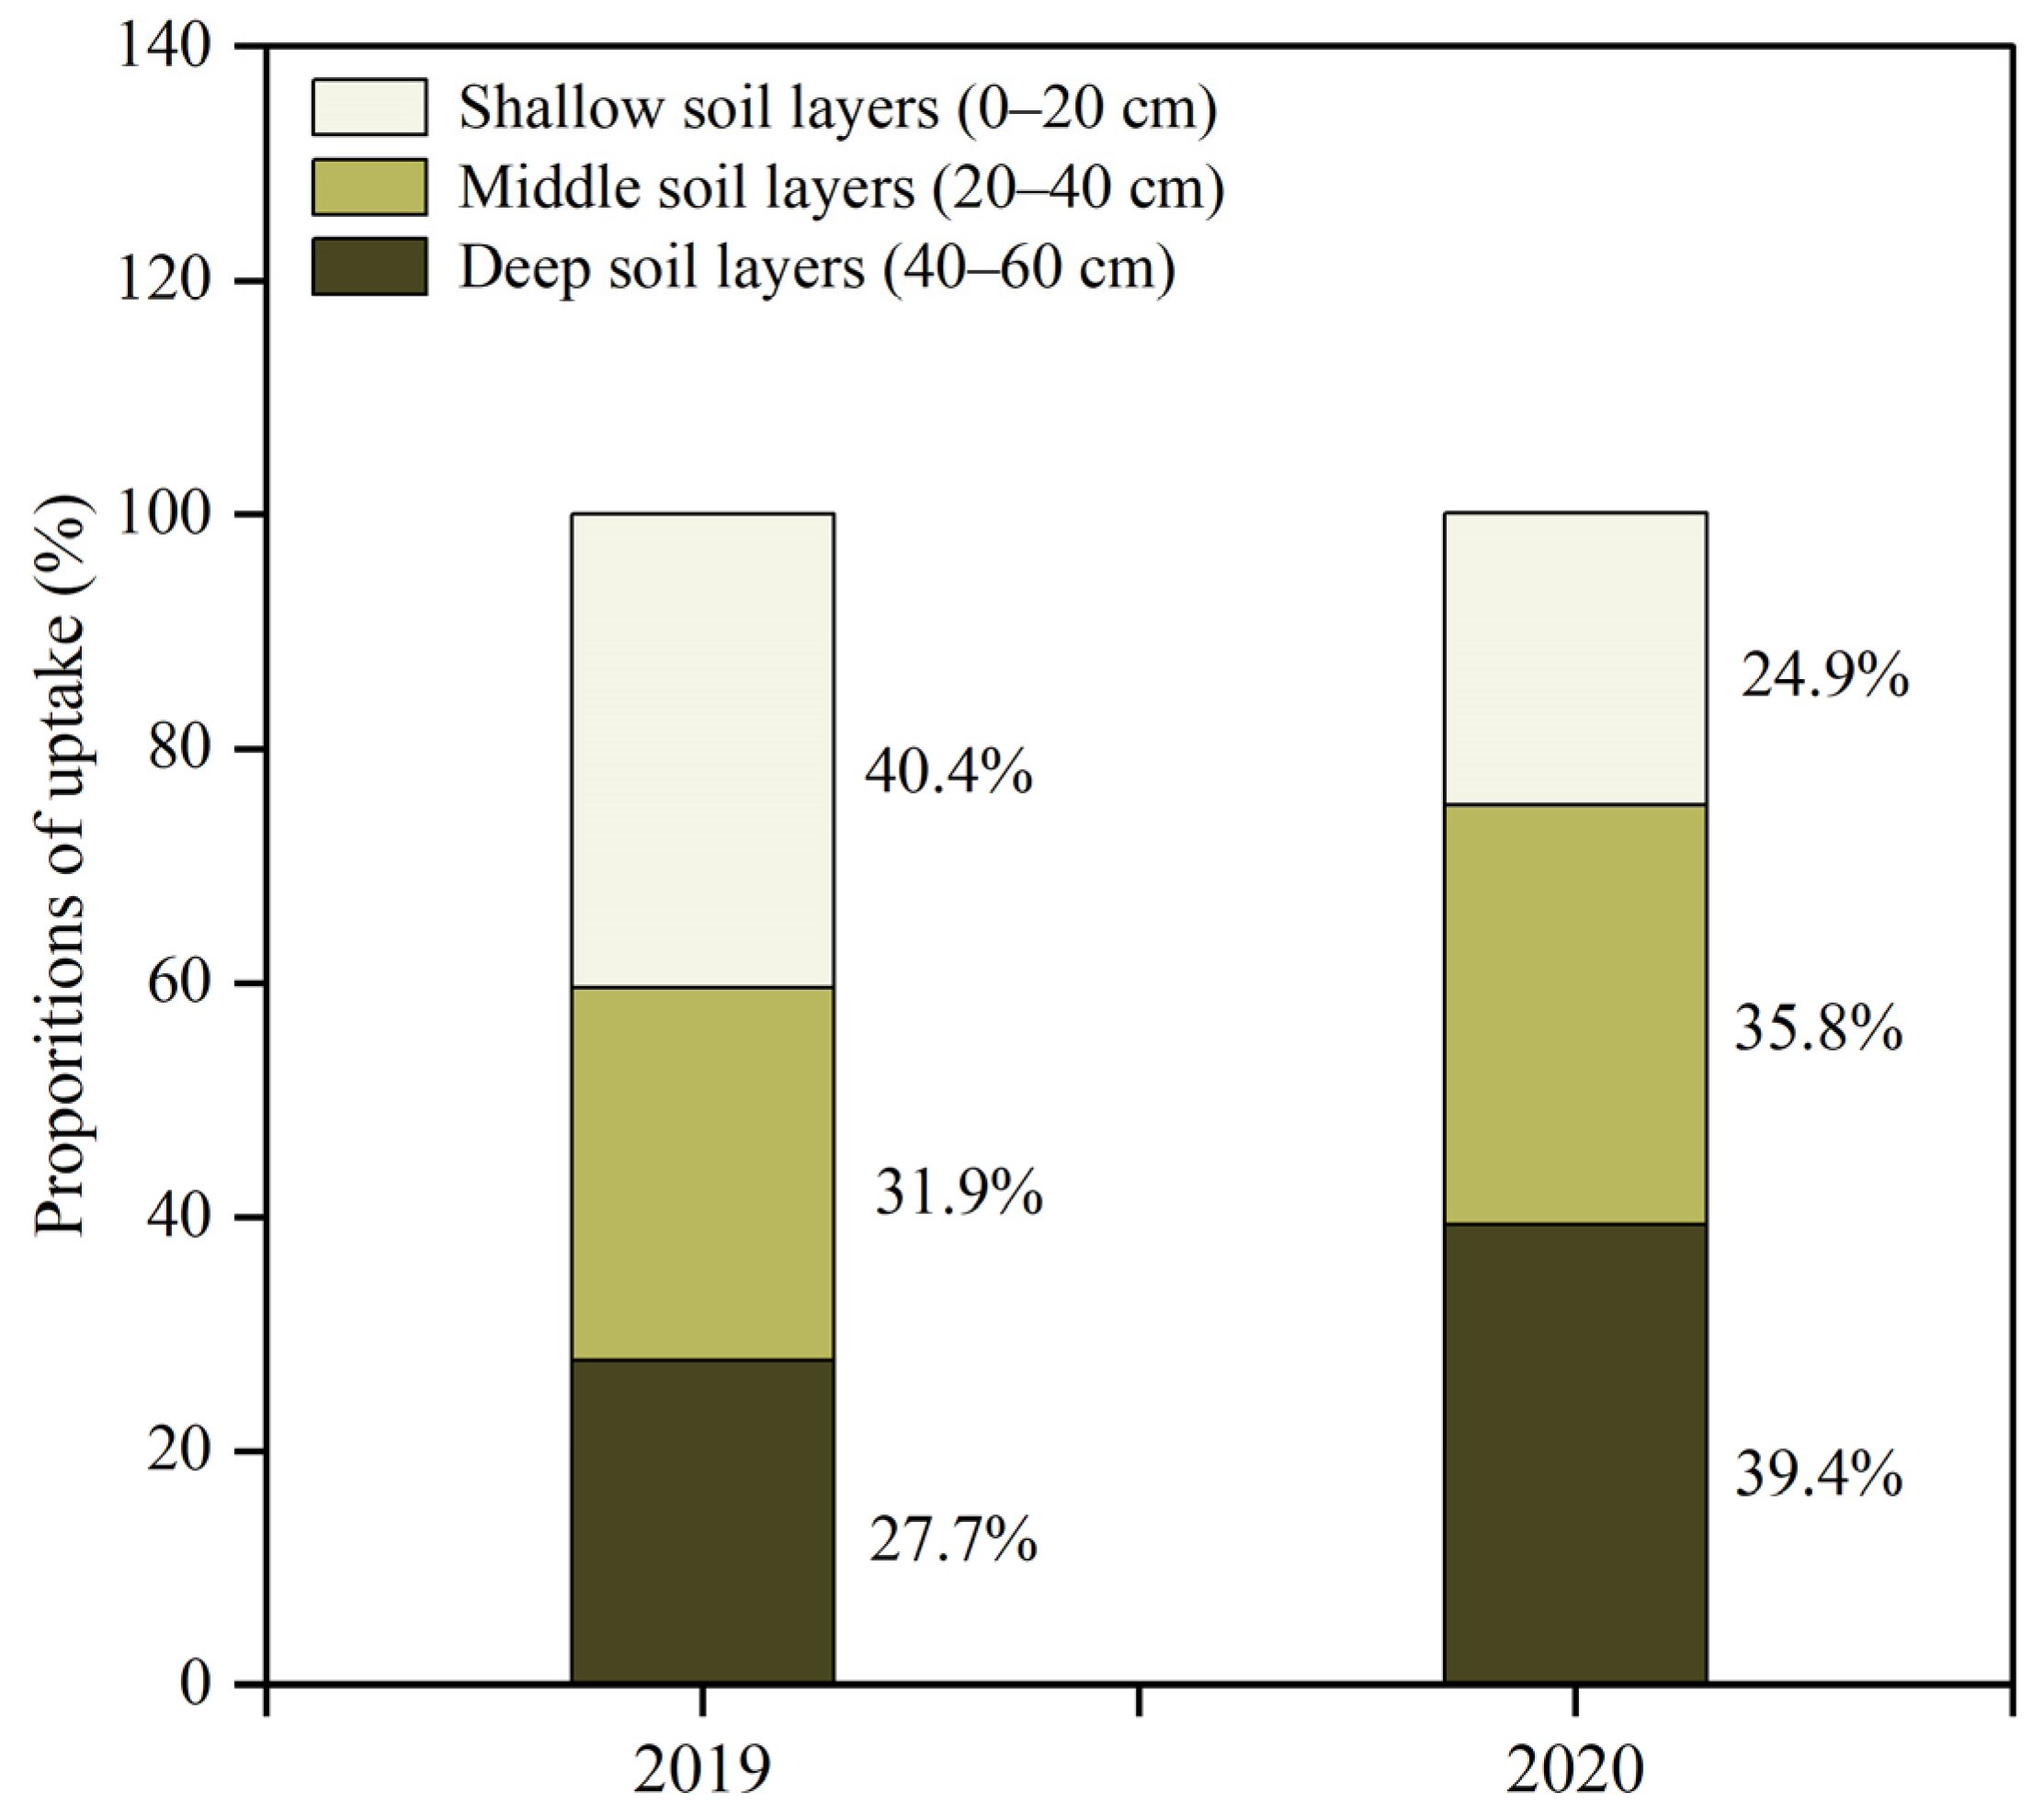
3.6. Seasonal and Interannual Variations in the Proportion of Betula platyphylla Water Uptake

The MixSIAR model results show that the water use proportion of Betula platyphylla had obvious seasonal (or monthly) differences during the sampling period (Table 3). In 2019, there was more precipitation before sampling in July, and the water use proportion of trees from the 0–10 cm soil layer was the highest among all layers for July 2019, with a utilization rate of 39.4%. The utilization rate of the water source in the deep 50–60 cm soil layer was the lowest (10.2%). In August, there was also rainfall before sampling. The trees mainly used soil water from the shallow 0–10 cm and 10–20 cm soil layers, with utilization rates of 18.4% and 19%, respectively. The water use proportion from other deeper soil layers was relatively low. In September, the soil water in the 0–10 cm and 10–20 cm layers was also mainly utilized, with utilization rates of 22.8% and 19.3%, respectively. In 2020, due to the melting of snow and the rapid increase in soil moisture, the trees mainly utilized the soil water in the 0–10 cm soil layer in May, with a utilization rate of 27.9%. The water use proportion in other soil layers was relatively uniform, ranging from 14.2% to 14.8%. Before the sampling in June, there was frequent precipitation. Although the water use proportion of the 0–10 cm layer was relatively high (18.3%), the utilization rates of other soil layers were not low, being 16.3%, 16.3%, 16.5%, 16.7% and 15.9%. Before the sampling in July, there was a supplement of precipitation, and thus the soil moisture was greatly replenished. At this time, the water use proportion of the 0–10 cm layer was the highest at 22.1%, and the utilization rates of the 30–60 cm layers were relatively uniform, ranging from 14.5% to 16.5%. Due to the significant cumulative precipitation of 94.7 mm preceding the sampling in August, the trees primarily relied on soil water from the middle 20–30 cm soil layer, accounting for 18.4% of water usage. Conversely, the utilization rate of shallow soil water in the 0–10 cm soil layer was comparatively low at only 13.2%. Due to the occurrence of numerous precipitation events, precipitation fully infiltrated the deep soil layers. In September, the utilization rates of soil water below the 40 cm soil layer were the highest, being 29.3% (40–50 cm) and 30.6% (50–60 cm). In summary, Betula platyphylla mainly utilizes shallow soil water after rainfall events. If there is high rainfall, and it can penetrate to deep soil, then Betula platyphylla will change to mainly utilizing deep soil water.
The interannual variations revealed distinct differences in the utilization rates of soil water across different soil layers between 2019 and 2020 (see Figure 7). In 2019, soil water from the shallow soil layers (0–10 cm and 10–20 cm) was predominantly utilized, with a utilization rate of 40.4%. Conversely, in 2020, the primary utilization of soil water occurred in the deep soil layers (40–50 cm and 50–60 cm), with a utilization rate of 39.4%. This shift in water utilization patterns in 2020 suggests that heavy rainfall led to a decrease in the utilization of shallow soil water, while a higher proportion of deep soil water was utilized. This implies that increased precipitation may have replenished the deep soil water, enabling Betula platyphylla to access and utilize it effectively.

4. Discussion

In 2019, when the rainfall was low, the birch mainly utilized shallow soil water during the growing season, and the utilization ratio of deep soil water (40–60 cm) remained low (Figure 7). In 2020, with higher rainfall, the utilization ratio of deep soil water increased. Our hypothesis was that when the rainfall was low, the main utilization would be deep soil water. This result is contrary to our hypothesis. It may be due to the fact that although there was precipitation every month, the amount of precipitation had not been able to penetrate into the deep soil, allowing the deep roots to absorb it. Also, due to the well-developed root system at the 0–40 cm depth (Figure 4), Betula platyphylla could quickly absorb water that flowed into the shallow soil. In May 2020, the δ18O value of the xylem water was close to the δ18O range of soil water in the 0–10 cm soil layer (Figure 6), indicating less utilization of deep soil water and mainly utilizing shallow soil water. This is because in mid-to-late May, the soil temperature gradually rose above 0 °C, causing the water in the shallow soil to thaw and the snow to melt, resulting in a rapid increase in shallow soil water and allowing the trees to effectively utilize it. Therefore, in the early growth season, Betula platyphylla mainly utilized shallow soil water. Hu et al. [40] suggested that trees also rely on snowmelt water in the later stages of the growing season, and forest carbon absorption is highly dependent on snowmelt water.
During June and July 2020, the utilization ratio of shallow soil water peaked. However, beginning in August, the utilization ratio of deep soil water gradually increased, eventually becoming the primary source of water uptake. This may have been due to the frequent and high precipitation in 2020, which replenished the deep soil water, allowing the trees to start utilizing deep soil water. Some studies showed that the larger the precipitation, the closer the hydrogen and oxygen isotopes in plant water are to those of precipitation [41]. This indicates that rain can infiltrate into the soil layer where plant roots are distributed, becoming the main source of water for plants [42]. Their study area is a temperate climate zone with less precipitation, which cannot replenish the deeper soil layers in a timely manner. Therefore, although precipitation is the main source of plant water in this area, it is not stable. Considering the research results of Gao [43] at Dinghu Mountain, the dominant plants mainly rely on precipitation and soil water as water sources. The findings of our research were consistent with previous research findings, further confirming the utilization of precipitation and soil water by plants.
Due to the absence of severe drought during the two years of sampling, we were unable to investigate the relations of water use patterns and droughts. Considering the relatively low precipitation of the water-scarce months in 2019, the precipitation in September was low (4.6 mm, Figure 2). The main water source used at this time came from the 0–10 cm soil layer, with a contribution rate of 22.8% (Table 3), and the deep soil water had not been utilized. Therefore, we can see that Betula platyphylla did not utilize soil water from the deep soil layers when encountering a drought or dry period like September; rarather, it timely utilized shallow soil water when precipitation replenished the shallow soil layers.
In 2020, when precipitation was abundant, Betula platyphylla used deep soil water instead of shallow soil water in September. This may also be because the study area is a mountainous area with a thin soil layer (40–70 cm), and groundwater resources may be scarce or unavailable to tree roots. Due to the lack of a stable water source such as groundwater, Betula platyphylla did not develop their root systems in deeper soil layers but instead developed many fine roots in the shallow soil layers. Plants possess denser root hairs and absorption zones in the shallow soil layers, facilitating greater water uptake from these layers. The selection of water sources absorbed by plants from each soil layer is influenced by the proportion of fine roots present in those layers [44]. Therefore, this feature can enable Betula platyphylla to absorb the infiltrating precipitation in shallow soil in a timely manner when the precipitation is low, thereby avoiding water stress.
The adaptable water usage pattern will facilitate adaptation to the anticipated rise in drought occurrences in the future [44]. In other studies, plants are more inclined to utilize deep soil water when encountering drought. These plants have well-developed root systems and stable groundwater in their growing environments. In the Horqin Sandy Land of Inner Mongolia, poplar trees mainly use deep soil water and groundwater below 130 cm in the dry season. During the rainy season, poplar trees mainly utilize soil water in soil layers above 130 cm [41]. Also, it has been pointed out that the root system of the poplar is distributed in both shallow and deep soil, and the main root can reach deep soil, which also contains a large amount of coarse roots and fine roots. In our study, although the distribution of fine roots of Betula platyphylla could reach deeper layers, its biomass was lower than that of shallow soil, and the depth of the soil layer in the sample plot was not so deep. Therefore, the water use characteristics of Betula platyphylla may be directly related to its unique environmental conditions and root distribution. On the other hand, in this study area, the height of Populus davidiana is often higher than that of Betula platyphylla, and most of the dead Populus davidiana have a larger diameter at breast height [32]. Research had shown that taller trees are often more susceptible to the effects of drought, as they typically have lower leaf area specific hydraulic conductivity due to longer water transport distances from their roots to their leaves [45]. Therefore, the unique physiological and water use characteristics among different tree species may be the fundamental reason for the higher mortality rate of Populus davidiana compared with Betula platyphylla in the study area.

5. Conclusions

The MixSIAR model, based on stable isotopes (δ18O), was employed to investigate seasonal variations in water usage strategies of the dominant species in a natural forest, specifically Betula platyphylla in the southern Greater Khingan Mountains. The findings revealed that the adaptable water usage patterns and swift response to precipitation could enhance plants’ ability to fully utilize available water resources, thereby aiding in adaptation to arid conditions. In years with lower rainfall (390.4 mm in 2019), Betula platyphylla predominantly relied on the rapid absorption of shallow soil water (0–20 cm), with a utilization ratio of 40.4%. However, with increased rainfall (501.5 mm in 2020), there was a notable shift toward the uptake of soil water from deeper layers (40–60 cm), with a utilization ratio of 39.4%. This adaptation assists Betula platyphylla with adjusting to semi-arid environments. Therefore, the flexible water use strategy of Betula platyphylla in the same habitat may give it a competitive advantage during low rainfall periods. These findings are important for the protection of natural forests and water management in the southern Greater Khingan Mountains.

Author Contributions

Conceptualization, P.Z., M.Z., H.Y., Y.W. and B.L.; instrument installation, P.Z., Y.W., L.Z. and C.X.; investigation, P.Z., Y.W., Y.S., C.X. and L.Z.; formal analysis, P.Z. and Y.W.; writing—original draft preparation, P.Z. and M.Z.; writing—review and editing, P.Z., M.Z., H.Y., Y.W., Y.L. and B.L. All authors have read and agreed to the published version of the manuscript.

Funding

This research was funded by the National Key Research & Development Program of China (No. 2022YFF0801803) and the Introduction Program of High-Qualified Foreign Experts in the Inner Mongolia Autonomous Region of China (no grant number).

Data Availability Statement

Data are contained within the article.

Acknowledgments

We thank Guilin Li, Baatar, Monkhe, Shuli Feng, Hailing Wang and other staff members of the Inner Mongolia Saikhan-Uul National Natural Reserve Administration for their assistance with the field work.

Conflicts of Interest

The authors declare no conflicts of interest.

References

  1. Zeng, N.; Yao, H.; Zhou, M.; Zhao, P.; Dech, J.P.; Zhang, B.; Lu, X. Species-specific determinants of mortality and recruitment in the forest-steppe ecotone of northeast China. For. Chron. 2016, 92, 336–344. [Google Scholar] [CrossRef]
  2. Xu, C.; Liu, H.; Hampe, A. Hydraulic adaptability promotes tree life spans under climate dryness. Glob. Ecol. Biogeogr. 2021, 31, 51–61. [Google Scholar] [CrossRef]
  3. Brodribb, T.J.; Cochard, H.; Dominguez, C.R.; Hultine, K. Measuring the pulse of trees; using the vascular system to predict tree mortality in the 21st century. Conserv. Physiol. 2019, 7, coz046. [Google Scholar] [CrossRef] [PubMed]
  4. Choat, B.; Jansen, S.; Brodribb, T.J.; Cochard, H.; Delzon, S.; Bhaskar, R.; Bucci, S.J.; Feild, T.S.; Gleason, S.M.; Hacke, U.G.; et al. Global convergence in the vulnerability of forests to drought. Nature 2012, 491, 752–755. [Google Scholar] [CrossRef]
  5. Boisvenue, C.; Running, S.W. Impacts of climate change on natural forest productivity—Evidence since the middle of the 20th century. Glob. Change Biol. 2006, 12, 862–882. [Google Scholar] [CrossRef]
  6. Clark, J.S.; Iverson, L.; Woodall, C.W.; Allen, C.D.; Bell, D.M.; Bragg, D.C.; D’Amato, A.W.; Davis, F.W.; Hersh, M.H.; Ibanez, I.; et al. The impacts of increasing drought on forest dynamics, structure, and biodiversity in the United States. Glob. Change Biol. 2016, 22, 2329–2352. [Google Scholar] [CrossRef]
  7. Miguez-Macho, G.; Fan, Y. Spatiotemporal origin of soil water taken up by vegetation. Nature 2021, 598, 624–628. [Google Scholar] [CrossRef] [PubMed]
  8. Cui, Y.; Ma, J.; Sun, W.; Sun, J.; Duan, Z. A preliminary study of water use strategy of desert plants in Dunhuang, China. J. Arid. Land 2014, 7, 73–81. [Google Scholar] [CrossRef]
  9. Liu, H.; Park Williams, A.; Allen, C.D.; Guo, D.; Wu, X.; Anenkhonov, O.A.; Liang, E.; Sandanov, D.V.; Yin, Y.; Qi, Z.; et al. Rapid warming accelerates tree growth decline in semi-arid forests of Inner Asia. Glob. Change Biol. 2013, 19, 2500–2510. [Google Scholar] [CrossRef]
  10. Köstner, B.; Granier, A.; Cermák, J. Sapflow measurements in forest stands: Methods and uncertainties. Ann. Des. Sci. For. 1998, 55, 13–27. [Google Scholar] [CrossRef]
  11. Zhang, Y.; Zhang, M.; Qu, D.; Duan, W.; Wang, J.; Su, P.; Guo, R. Water Use Strategies of Dominant Species (Caragana korshinskii and Reaumuria soongorica) in Natural Shrubs Based on Stable Isotopes in the Loess Hill, China. Water 2020, 12, 1923. [Google Scholar] [CrossRef]
  12. Zhao, G.; Li, X.; Wu, H.; Zhang, S.; Li, G. Study on plant water use in Myricaria squamosa with stable hydrogen isotope tracer in Qing-hai Lake basin. Chin. J. Plant Ecol. 2013, 37, 1091–1100. [Google Scholar] [CrossRef]
  13. Campbell, G.S.; Norman, J. An Introduction to Environmental Biophysics; Springer: New York, NY, USA, 1998. [Google Scholar]
  14. Chen, J.; Xu, Q.; Gao, D.; Song, A.; Hao, Y.; Ma, Y. Differential water use strategies among selected rare and endangered species in West Ordos Desert of China. J. Plant Ecol. 2016, 10, 660–669. [Google Scholar] [CrossRef]
  15. Nie, Y.-P.; Chen, H.-S.; Wang, K.-L.; Tan, W.; Deng, P.-Y.; Yang, J. Seasonal water use patterns of woody species growing on the continuous dolostone outcrops and nearby thin soils in subtropical China. Plant Soil 2010, 341, 399–412. [Google Scholar] [CrossRef]
  16. Eggemeyer, K.D.; Awada, T.; Harvey, F.E.; Wedin, D.A.; Zhou, X.; Zanner, C.W. Seasonal changes in depth of water uptake for encroaching trees Juniperus virginiana and Pinus ponderosa and two dominant C4 grasses in a semiarid grassland. Tree Physiol. 2008, 29, 157–169. [Google Scholar] [CrossRef]
  17. Sun, Z.; Long, X.; Ma, R. Water uptake by saltcedar (Tamarix ramosissima) in a desert riparian forest: Responses to intra-annual water table fluctuation. Hydrol. Process. 2015, 30, 1388–1402. [Google Scholar] [CrossRef]
  18. Wu, H.; Li, J.; Zhang, C.; He, B.; Zhang, H.; Wu, X.; Li, X.-Y. Determining root water uptake of two alpine crops in a rainfed cropland in the Qinghai Lake watershed: First assessment using stable isotopes analysis. Field Crops Res. 2018, 215, 113–121. [Google Scholar] [CrossRef]
  19. Zhang, H.; Cao, J.; Wang, H.; Song, B.; Jia, G.; Liu, Z.; Yu, X.; Zeng, J. Water utilization characteristics of the degraded poplar shelterbelts in Zhangbei, Hebei, China. Chin. J. Appl. Ecol. 2018, 29, 1381–1388. [Google Scholar] [CrossRef]
  20. Wenping, D.; Guodong, J.; Yuanqiu, L.; Qi, C.; Jiahui, H.; Linsheng, W.; Zhangling; Xiaojun, L.; Jianbo, J.; Songli, P. Long-term study on the seasonal water uptake of Platycladus orientalis in the Beijing mountain area, northern China. Agric. For. Meteorol. 2021, 307, 108531. [Google Scholar] [CrossRef]
  21. Su, W.; Jia, D.; Gao, R.; Lu, J.; Lu, F.; Zhao, H.; Wang, F. Water use characteristics of artificial sand-fixing vegetation on the southern edge of Hun-shandake Sandy Land, Inner Mongolia, China. Chin. J. Appl. Ecol. 2021, 32, 1980–1988. [Google Scholar] [CrossRef]
  22. Yang, L.; Jia, D.; Gao, R.; Su, W.; Lu, F.; Wendu, R. Characteristics of Hydrogen and Oxygen Isotopes in Different Water Bodies of Salix Gordejevii Forest in the South Edgeof Hunshandake Sand Land. Earth Environ. 2022, 50, 630–638. [Google Scholar] [CrossRef]
  23. Xie, C.; Zhao, L.; Meng, F.; Dong, X.; Liu, Q.; Ma, L. Water sources of plants in the forest ecosystem in the upper reaches ofthe Heihe River Basin. J. Lanzhou Univ. Nat. Sci. 2020, 56, 503–508. [Google Scholar] [CrossRef]
  24. Elkin, C.; Gutierrez, A.G.; Leuzinger, S.; Manusch, C.; Temperli, C.; Rasche, L.; Bugmann, H. A 2 °C warmer world is not safe for ecosystem services in the European Alps. Glob. Change Biol. 2013, 19, 1827–1840. [Google Scholar] [CrossRef]
  25. Zeng, N. Tree Mortality Dynamic and the Ecosystem Response in Broad-Leaved Forest in Southern Greater Khingan Mountains. Ph.D. Thesis, Inner Mongolia Agricultural University, Hohhot, China, 2017. [Google Scholar]
  26. Mao, Q.; Watanabe, M.; Koike, T. Growth characteristics of two promising tree species for afforestation, birch and larch in the northeastern part of Asia. Eurasian J. For. Res. 2010, 13, 76. [Google Scholar]
  27. Erdene-Ochir, T.; Ishiguri, F.; Nezu, I.; Tumenjargal, B.; Baasan, B.; Chultem, G.; Ohshima, J.; Yokota, S. Utilization potential of naturally regenerated Mongolian Betula platyphylla wood based on growth characteristics and wood properties. Silva Fenn. 2020, 54, 10284. [Google Scholar] [CrossRef]
  28. Talskih, A.I.; Kopanina, A.V.; Vlasova, I.I. Features of the structural response of the bark and wood of birch (Betula platyphylla, Betulaceae) in the landscapes of sea coasts, magmatic and mud volcanoes of Sakhalin and the Kuril Islands. Geosyst. Transit. Zones 2022, 6, 360–379. [Google Scholar] [CrossRef]
  29. Zhao, X.; Mao, Z.; Xu, J. Gas Exchange, Chlorophyll and Growth Responses of Betula Platyphylla Seedlings to Elevated CO2 and Nitrogen. Int. J. Biol. 2010, 2, 149. [Google Scholar] [CrossRef]
  30. Sun, S. Effects of Seasonal Drought on Physiology and Growth of Betula Platyphylla; Northeast Forestry University: Harbin, China, 2020. [Google Scholar]
  31. Xue, J. Effects of Metabolism and Wood Structure of Betulla Platphilla by Drought Stress; Northeast Forestry University: Harbin, China, 2007. [Google Scholar]
  32. He, M.; Wei, J.; Shi, L.; Zhou, M.; Zhao, P. The response of radial growth and death of Populus davidiana to regional climate change in southern Greater Khingan Mountains. Chin. J. Ecol. 2018, 37, 3237–3244. [Google Scholar] [CrossRef]
  33. Wu, Y.; Zhao, P.; Zhou, M.; Liu, Z.; Yao, H.; Wei, J.; Shu, Y.; Li, J.; Xiang, C.; Zhou, L. Environmental Factors Driving the Transpiration of a Betula platyphylla Sukaczev Forest in a Semi-arid Region in North China during Different Hydrological Years. Forests 2022, 13, 1729. [Google Scholar] [CrossRef]
  34. Wu, H.; Zhang, X.; Xiaoyan, L.; Li, G.; Huang, Y. Seasonal variations of deuterium and oxygen-18 isotopes and their response to moisture source for precipitation events in the subtropical monsoon region. Hydrol. Process. 2015, 29, 90–102. [Google Scholar] [CrossRef]
  35. Wang, X.; Jia, G.; Deng, W.; Liu, Z.; Liu, Z.; Qiu, G.; Li, W. Long-term water use characteristics and patterns of typical tree species in seasonal drought regions. Chin. J. Appl. Ecol. 2021, 32, 1943–1950. [Google Scholar] [CrossRef]
  36. Moore, J.W.; Semmens, B.X. Incorporating uncertainty and prior information into stable isotope mixing models. Ecol. Lett. 2008, 11, 470–480. [Google Scholar] [CrossRef]
  37. Parnell, A.C.; Inger, R.; Bearhop, S.; Jackson, A.L. Source partitioning using stable isotopes: Coping with too much variation. PLoS ONE 2010, 5, e9672. [Google Scholar] [CrossRef] [PubMed]
  38. Craig, H. Isotopic variations in meteoric waters. Science 1961, 133, 1703. [Google Scholar] [CrossRef]
  39. Ellsworth, P.Z.; Williams, D.G. Hydrogen isotope fractionation during water uptake by woody xerophytes. Plant Soil 2007, 291, 93–107. [Google Scholar] [CrossRef]
  40. Hu, J.; Moore, D.J.P.; Burns, S.P.; Monson, R.K. Longer growing seasons lead to less carbon sequestration by a subalpine forest. Glob. Change Biol. 2010, 16, 771–783. [Google Scholar] [CrossRef]
  41. Yang, A.; Fu, Z.; Wang, L.; Xiao, F.; Wang, L.; Fan, P.; Zhang, J. Strategies on Water Utilization of Poplar in Horqin Sandy Land of Northern China. J. Beijing For. Univ. 2018, 40, 63–72. [Google Scholar] [CrossRef]
  42. Ma, Y. Study on Hydrological Process of Freshwater Wetland Forests in Tangpu Reservoir Area Based on Stable Hydrogen and Oxygen Isotope Techniques; Chinese Academy of Forestry: Beijing, China, 2019. [Google Scholar]
  43. Gao, D. Characteristics of Stable Hydrogen and Oxygen Isotopes in the Typical Forest Hydrological Processes of Mt. Dinghu; Chinese Academy of Forestry: Beijing, China, 2017. [Google Scholar]
  44. Wang, J.; Fu, B.; Lu, N.; Zhang, L. Seasonal variation in water uptake patterns of three plant species based on stable isotopes in the semi-arid Loess Plateau. Sci. Total Environ. 2017, 609, 27–37. [Google Scholar] [CrossRef]
  45. McDowell, G.N.; Allen, D.C. Darcy’s law predicts widespread forest mortality under climate warming. Nat. Clim. Change 2015, 5, 669–672. [Google Scholar] [CrossRef]
Figure 1. Location of the study area in Northeast China and its distribution of forests (green). “Others” refers to land use types other than forest land (gray).
Water 16 00927 g001
Figure 2. The long-term average monthly precipitation (mm) and temperature (°C) for 1986–2019 and the monthly precipitation (mm) and mean monthly temperature (°C) for 2019 and 2020.
Water 16 00927 g002
Figure 3. During the growing season, a linear regression analysis was conducted to explore the relationship between δD and δ18O in soil water, xylem water and rainfall.
Water 16 00927 g003
Figure 4. Vertical distribution of fine root biomass. Different letters indicate significant differences between categories. Error bars represent standard errors.
Water 16 00927 g004
Figure 5. Vertical soil profiles of VWC and δ18O values of soil water for each month in 2019 and 2020.
Water 16 00927 g005
Figure 6. Distribution characteristics of δ18O in xylem water and soil water at different depths.
Water 16 00927 g006
Figure 7. Interannual fluctuations in the proportion of water uptake from various soil layers, as determined by MixSIAR analysis, for Betula platyphylla.
Water 16 00927 g007
Table 1. Characteristics of the sample trees.
Sample TreesDiameter at Breast Height (cm)Tree Height (m)
B129.513.9
B22513
B329.514
B42914.3
B525.413.3
Table 2. The accumulated precipitation (P, mm) and average volumetric water content (VWC, m3 m−3) of each soil layer (0–80 cm) in 2019 and 2020.
Year and MonthP (mm)0–5 cm10–20 cm20–40 cm40–80 cm
2019390.40.170.150.170.16
May97.90.27 a0.21 a0.19 a0.15 a
June780.23 bd0.24 b0.27 bcf0.17 bc
July97.90.29 c0.27 c0.28 cf0.18 bcdf
August94.80.26 ad0.22 a0.24 d0.18 df
September4.60.17 e0.17 d0.19 ae0.18 bcd
2020501.50.200.210.230.20
May108.70.28 ac0.25 bc0.21 e0.16 e
June84.60.27 ac0.27 c0.29 f0.17 b
July57.40.24 bd0.25 b0.28 cf0.18 f
August1200.22 b0.22 ae0.26 b0.18 df
September70.40.28 ac0.24 be0.27 bc0.18 cdf
Note: Different lowercase letters represent significant differences between the data sets (p < 0.01).
Table 3. Seasonal fluctuations in the proportion of water uptake from distinct soil layers, as determined by MixSIAR analysis, for Betula platyphylla.
Soil LayersSoil Depth
(cm)
20192020
JulyAugustSeptemberMayJuneJulyAugustSeptember
Shallow0–10 cm39.418.422.827.918.322.113.23.7
10–20 cm13.21919.314.816.316.317.16.3
Middle20–30 cm13.317.316.914.216.314.518.410.7
30–40 cm12.216.115.214.316.516.517.419.4
Deep40–50 cm11.715.313.114.516.715.617.829.3
50–60 cm10.213.912.614.315.91516.130.6
Disclaimer/Publisher’s Note: The statements, opinions and data contained in all publications are solely those of the individual author(s) and contributor(s) and not of MDPI and/or the editor(s). MDPI and/or the editor(s) disclaim responsibility for any injury to people or property resulting from any ideas, methods, instructions or products referred to in the content.

