Article

Detecting Shoreline Changes on the Beaches of Hainan Island (China) for the Period 2013–2023 Using Multi-Source Data

1
College of Ocean Science and Engineering, Shanghai Maritime University, Shanghai 201306, China
2
College of Harbour and Coastal Engineering, Jimei University, Xiamen 361021, China
3
State Key Laboratory of Estuarine and Coastal Research, East China Normal University, Shanghai 200241, China
*
Author to whom correspondence should be addressed.
Water 2024, 16(7), 1034; https://doi.org/10.3390/w16071034
Submission received: 8 March 2024 / Revised: 26 March 2024 / Accepted: 28 March 2024 / Published: 3 April 2024
(This article belongs to the Special Issue Application of GIS and Remote Sensing in Coastal Processes)

Abstract

:
This study presents an in-depth analysis of the dynamic beach landscapes of Hainan Island, which is located at the southernmost tip of China. Home to over a hundred natural and predominantly sandy beaches, Hainan Island confronts significant challenges posed by frequent marine natural disasters and human activities. Addressing the urgent need for long-term studies of beach dynamics, this research involved the use of CoastSat to extract and analyze shoreline data from 20 representative beaches and calculate the slopes of 119 sandy beaches around the island for the period from 2013 to 2023. The objective was to delineate the patterns of beach evolution that contribute to the prevention of sediment loss, the mitigation of coastal hazards, and the promotion of sustainable coastal zone management. By employing multi-source remote sensing imagery and the CoastSat tool, this investigation validated slope measurements across selected beaches, demonstrating consistency between the calculated and actual distances despite minor anomalies. The effective use of the finite element solution (FES) in the 2014 global tidal model for tidal corrections further aligned the coastlines with the mean shoreline, underscoring CoastSat’s utility in enabling precise coastal studies. The analysis revealed significant seasonal variations in shoreline positions, with approximately half of the monitored sites showing a seaward progression in summer and a retreat in winter, which were linked to variations in wave height. The southern beaches exhibited distinct seasonal variations, which contrasted with the general trend due to differing wave impacts. The western and southern shores showed erosion, while the northern and eastern shores displayed accretion. The calculated slopes across the island indicated that the southern beaches had steeper slopes, while the northern areas exhibited more pronounced slope variations due to wave and tidal impacts. These findings highlight the critical role of integrated coastal management and erosion control strategies in safeguarding Hainan Island’s beaches. By understanding the mechanisms driving seasonal and regional shoreline changes, effective measures can be developed to mitigate the impacts of erosion and enhance the resilience of coastal ecosystems amidst changing environmental conditions. This research provides a foundational basis for future efforts aimed at the sustainable development and utilization of coastal resources on Hainan Island.

1. Introduction

Beaches are an integral component of coastal zones worldwide, as they are the areas where land meets the sea [1,2]. The shorelines of beaches undergo dynamic changes due to the processes of coastal erosion, river inputs, and sea level rise [3,4], holding significant importance for studies on marine environment protection, marine resource exploration, and disaster risk assessment [5,6]. Furthermore, changes in the natural environment, along with intensified human activities, contribute to the trend of these changes. For instance, changes in sediment load due to altered river flows can profoundly affect sediment deposition patterns along river deltas or downstream coastal erosion rates [7]. Furthermore, tsunami waves triggered by submarine landslides can have diverse impacts on coastal areas, including coastal erosion, wave impact, and changes in coastal topography [8]. Therefore, it is essential to comprehend the reasons for shoreline changes, as they affect the preservation and management of coastal ecosystems, the estimation of natural disaster risks, the design of marine engineering projects, and the sustainability of the tourism industry [9,10,11].
The comprehensive and systematic collection of measurement data on the dynamic changes in shorelines is the foundation for understanding beach dynamics [12,13]. The law of the evolution of shorelines at different spatial and temporal scales has been a much-studied problem in the field of coastal engineering in recent years. However, due to the lack of historical beach topography monitoring data with high spatial and temporal resolutions, it is often difficult to conduct long-term beach evolution studies. Therefore, it is of great practical significance to strengthen the acquisition of multi-source beach monitoring data. Traditional shoreline surveying techniques include shoreline measurement, aerial photography, and laser-based measurement [14]. Shoreline measurement can provide high-precision shoreline data, but it is labor-intensive and costly, and it is usually only used for short periods or small survey areas. Aerial photography and laser-based methods are expensive and require specialized aircraft or equipment for data collection. Furthermore, data processing and decoding also require significant technical and resource investment, adding to the cost burden [15,16].
To overcome these limitations, remote sensing technology has been adopted as an efficient alternative for analyzing coastline changes. With the accumulation of high-resolution satellite images and advancements in observation technology and coastal evolution theory, it is now possible to obtain a large amount of high-frequency coastline data. Platforms such as Google Earth Engine offer access to resources such as the Landsat series and Sentinel-2, facilitating the comprehensive study of shoreline dynamics [17,18]. However, extracting shorelines from diverse remote sensing data sources necessitates a thorough consideration of the spectral characteristics of remote sensing images to ensure compatibility with shorelines’ image characteristics in varying geographical environments. The core challenge lies in identifying and locating the pixels marking the boundary between land and water [19], with the current extraction methods including threshold segmentation, edge detection, object-oriented methods, and region growing [20,21,22]. In addition, recent advancements in data-driven approaches have led to the development of innovative models for predicting changes in natural water boundaries. For instance, Yin et al. proposed a lake boundary change prediction model that combines U-Net and LSTM. This method enables the model to automatically capture trends in time series data and extract deep information regarding changes in lake boundaries. By leveraging such cutting-edge techniques, researchers can enhance their understanding of coastal and aquatic environments, contributing to more accurate and comprehensive analyses of shoreline dynamics and water body changes [23].
Several studies have leveraged remote sensing images to extract and analyze shorelines. For instance, Murray et al. [24] analyzed changes in beach erosion and accretion by monitoring the dynamics of the southwestern shoreline of South Africa and predicted its changes until 2040. Using optical remote sensing data (Landsat-7 ETM and Landsat-8 OLI) and radar data (ALOS Palsar and Sentinel-1 data), changes in the shoreline of East Java Province, Indonesia, were quantified using the Digital Shoreline Analysis System (DSAS) [25].
In recent years, the evolution of coastlines at different spatial and temporal scales has become a hot topic in coastal engineering research. In their study on Hainan Island, Wang et al. [26] assessed coastal vulnerability and analyzed the trends of surface sediment grain size. The grain size data, which were collected from a comprehensive survey of the entire island, provided information on grain size trends and sediment transport, allowing for the determination of whether the coastline was experiencing erosion or accretion. Additionally, Su et al. [27] conducted a comprehensive evaluation of coastal erosion risk on Hainan Island by considering factors such as the coastline change rate, coast type, beach slope, beach width, development status, and human activities. However, long-term studies on beach evolution have faced challenges due to insufficient historical beach data. To address this issue, this study made full use of remote sensing technology to conduct a long-term investigation of the beaches surrounding Hainan Island from 2013 to 2023. By automatically extracting the coastline, we revealed the trends of beach evolution and conducted an in-depth analysis of the erosion and deposition processes, providing data support for the understanding of the recent evolutionary characteristics of Hainan Island’s beaches. Through this research, we can not only effectively prevent the loss of coastal sediments, mitigate coastal hazards, and strengthen coastal protection, but also promote the sustainable development of Hainan Island. This integrated approach utilizing different research methods provides valuable references for a more comprehensive understanding and management of coastline evolution.

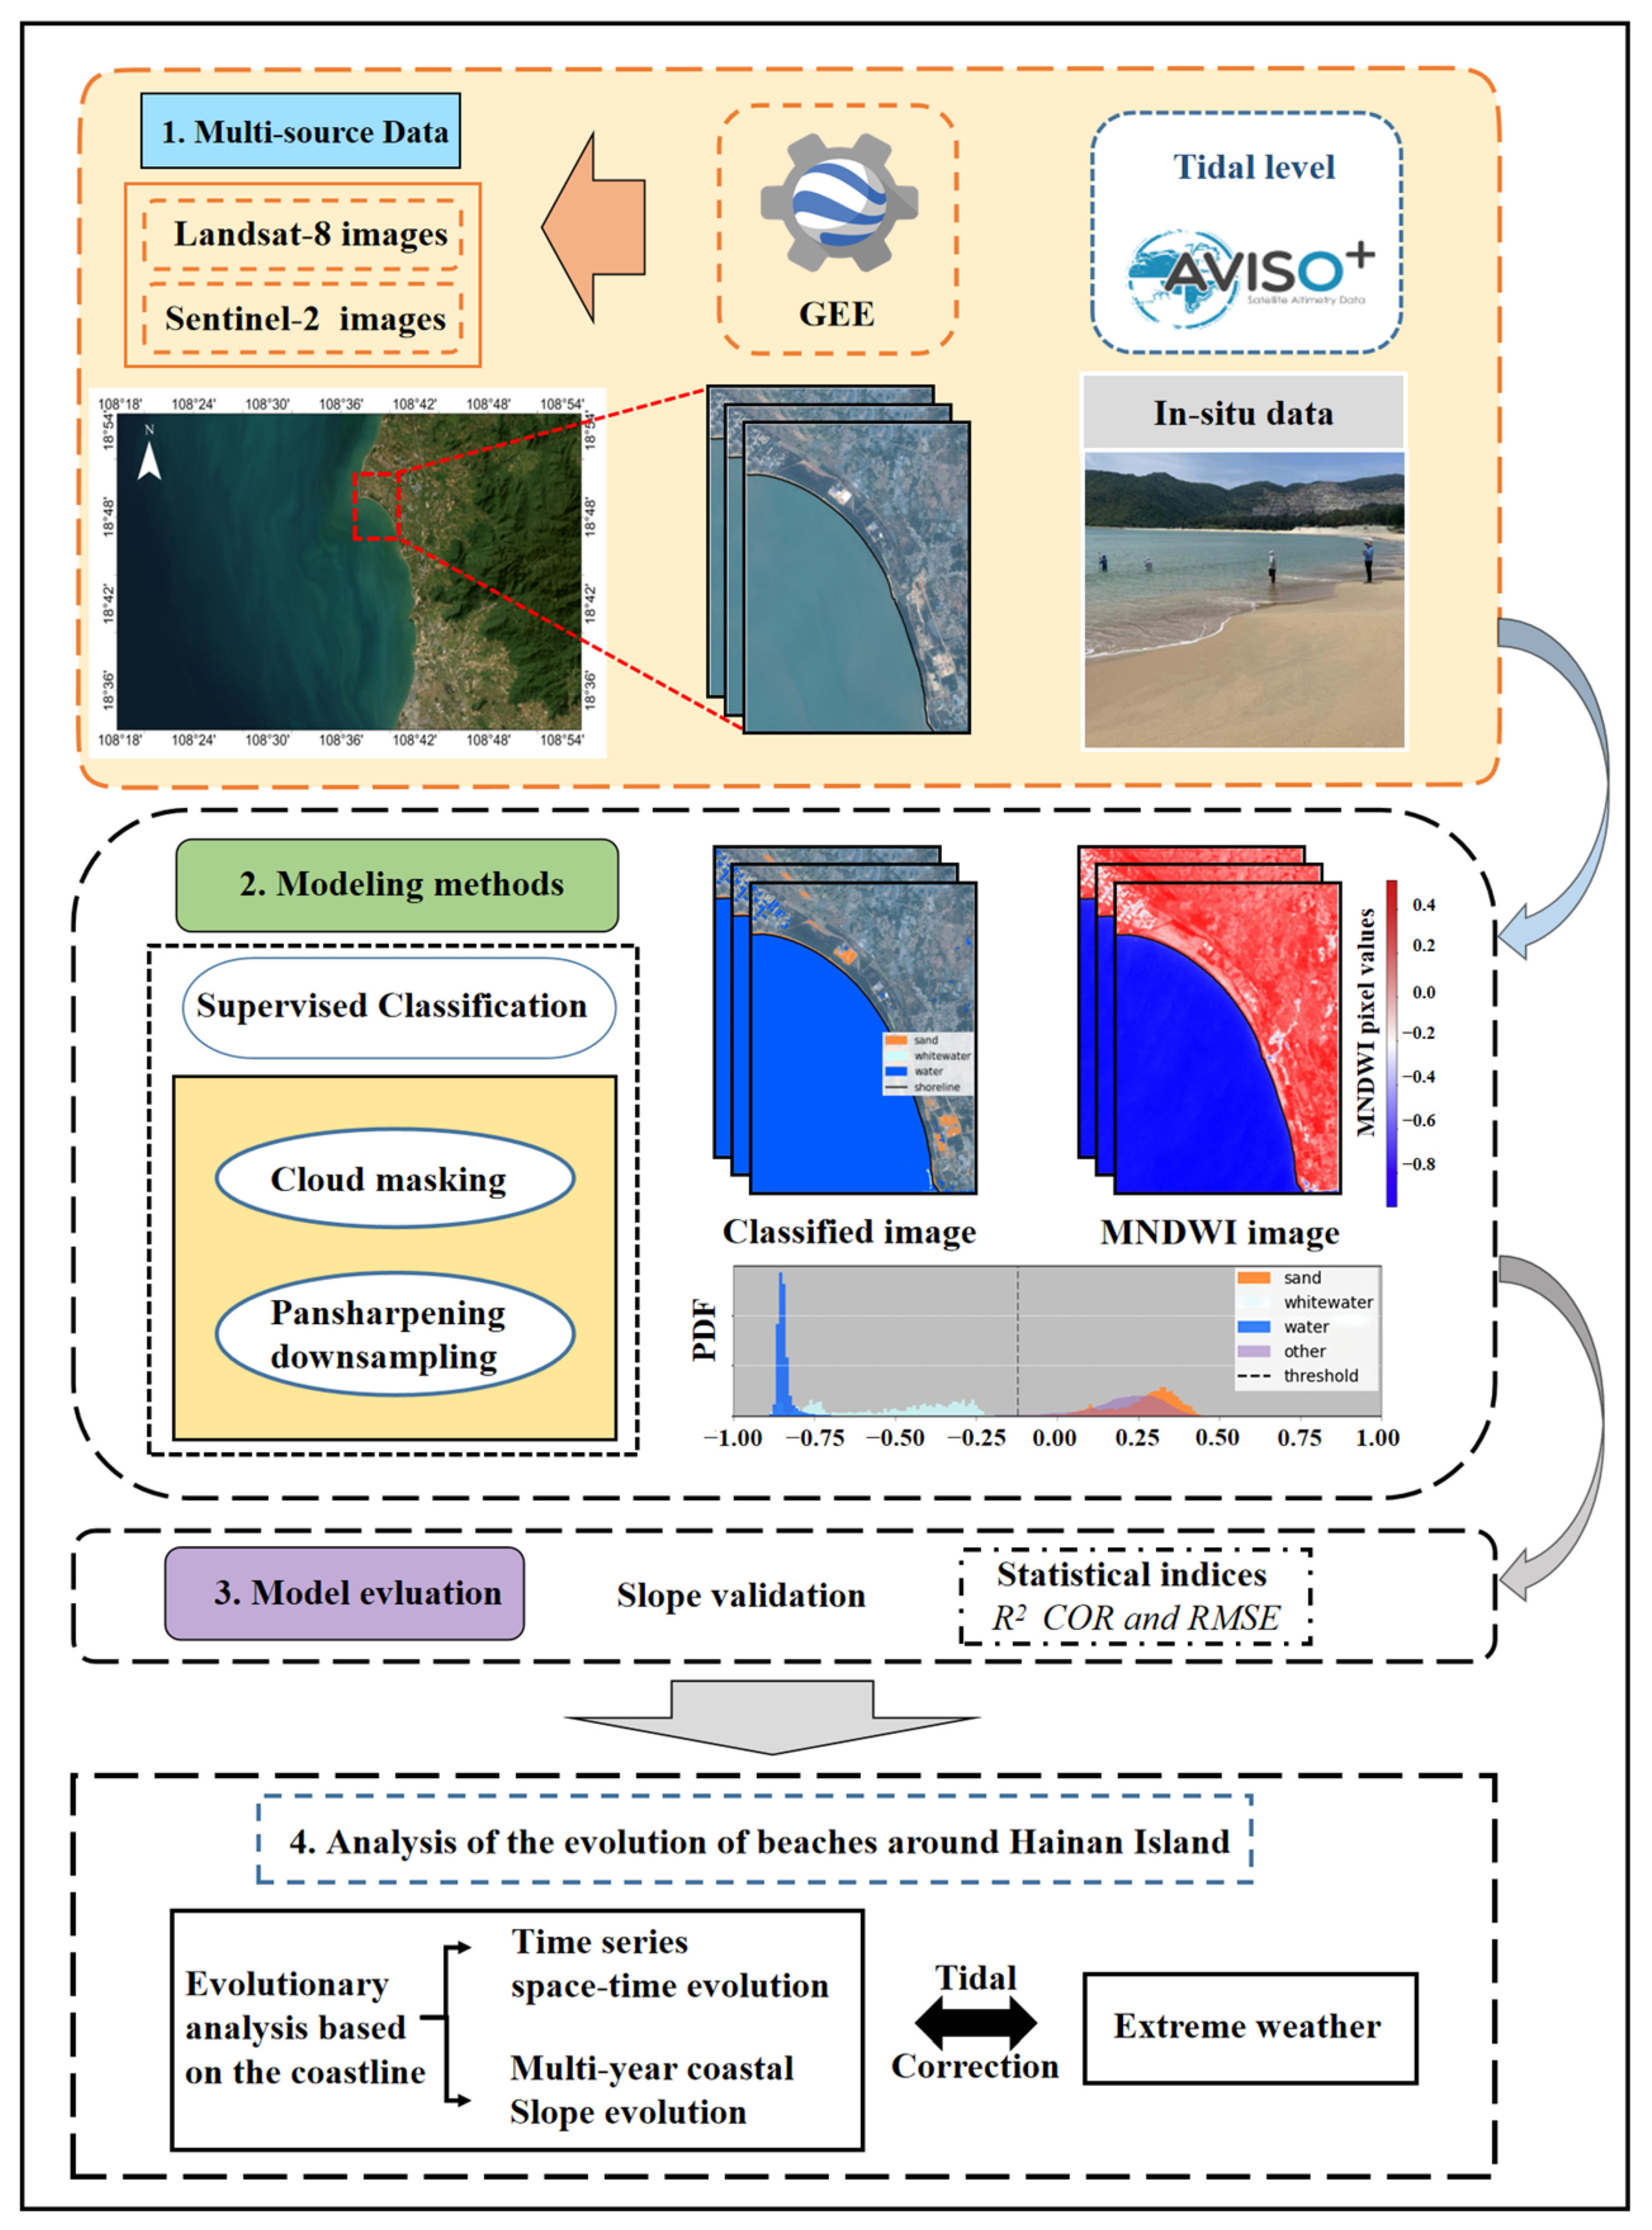
2. Materials and Methods
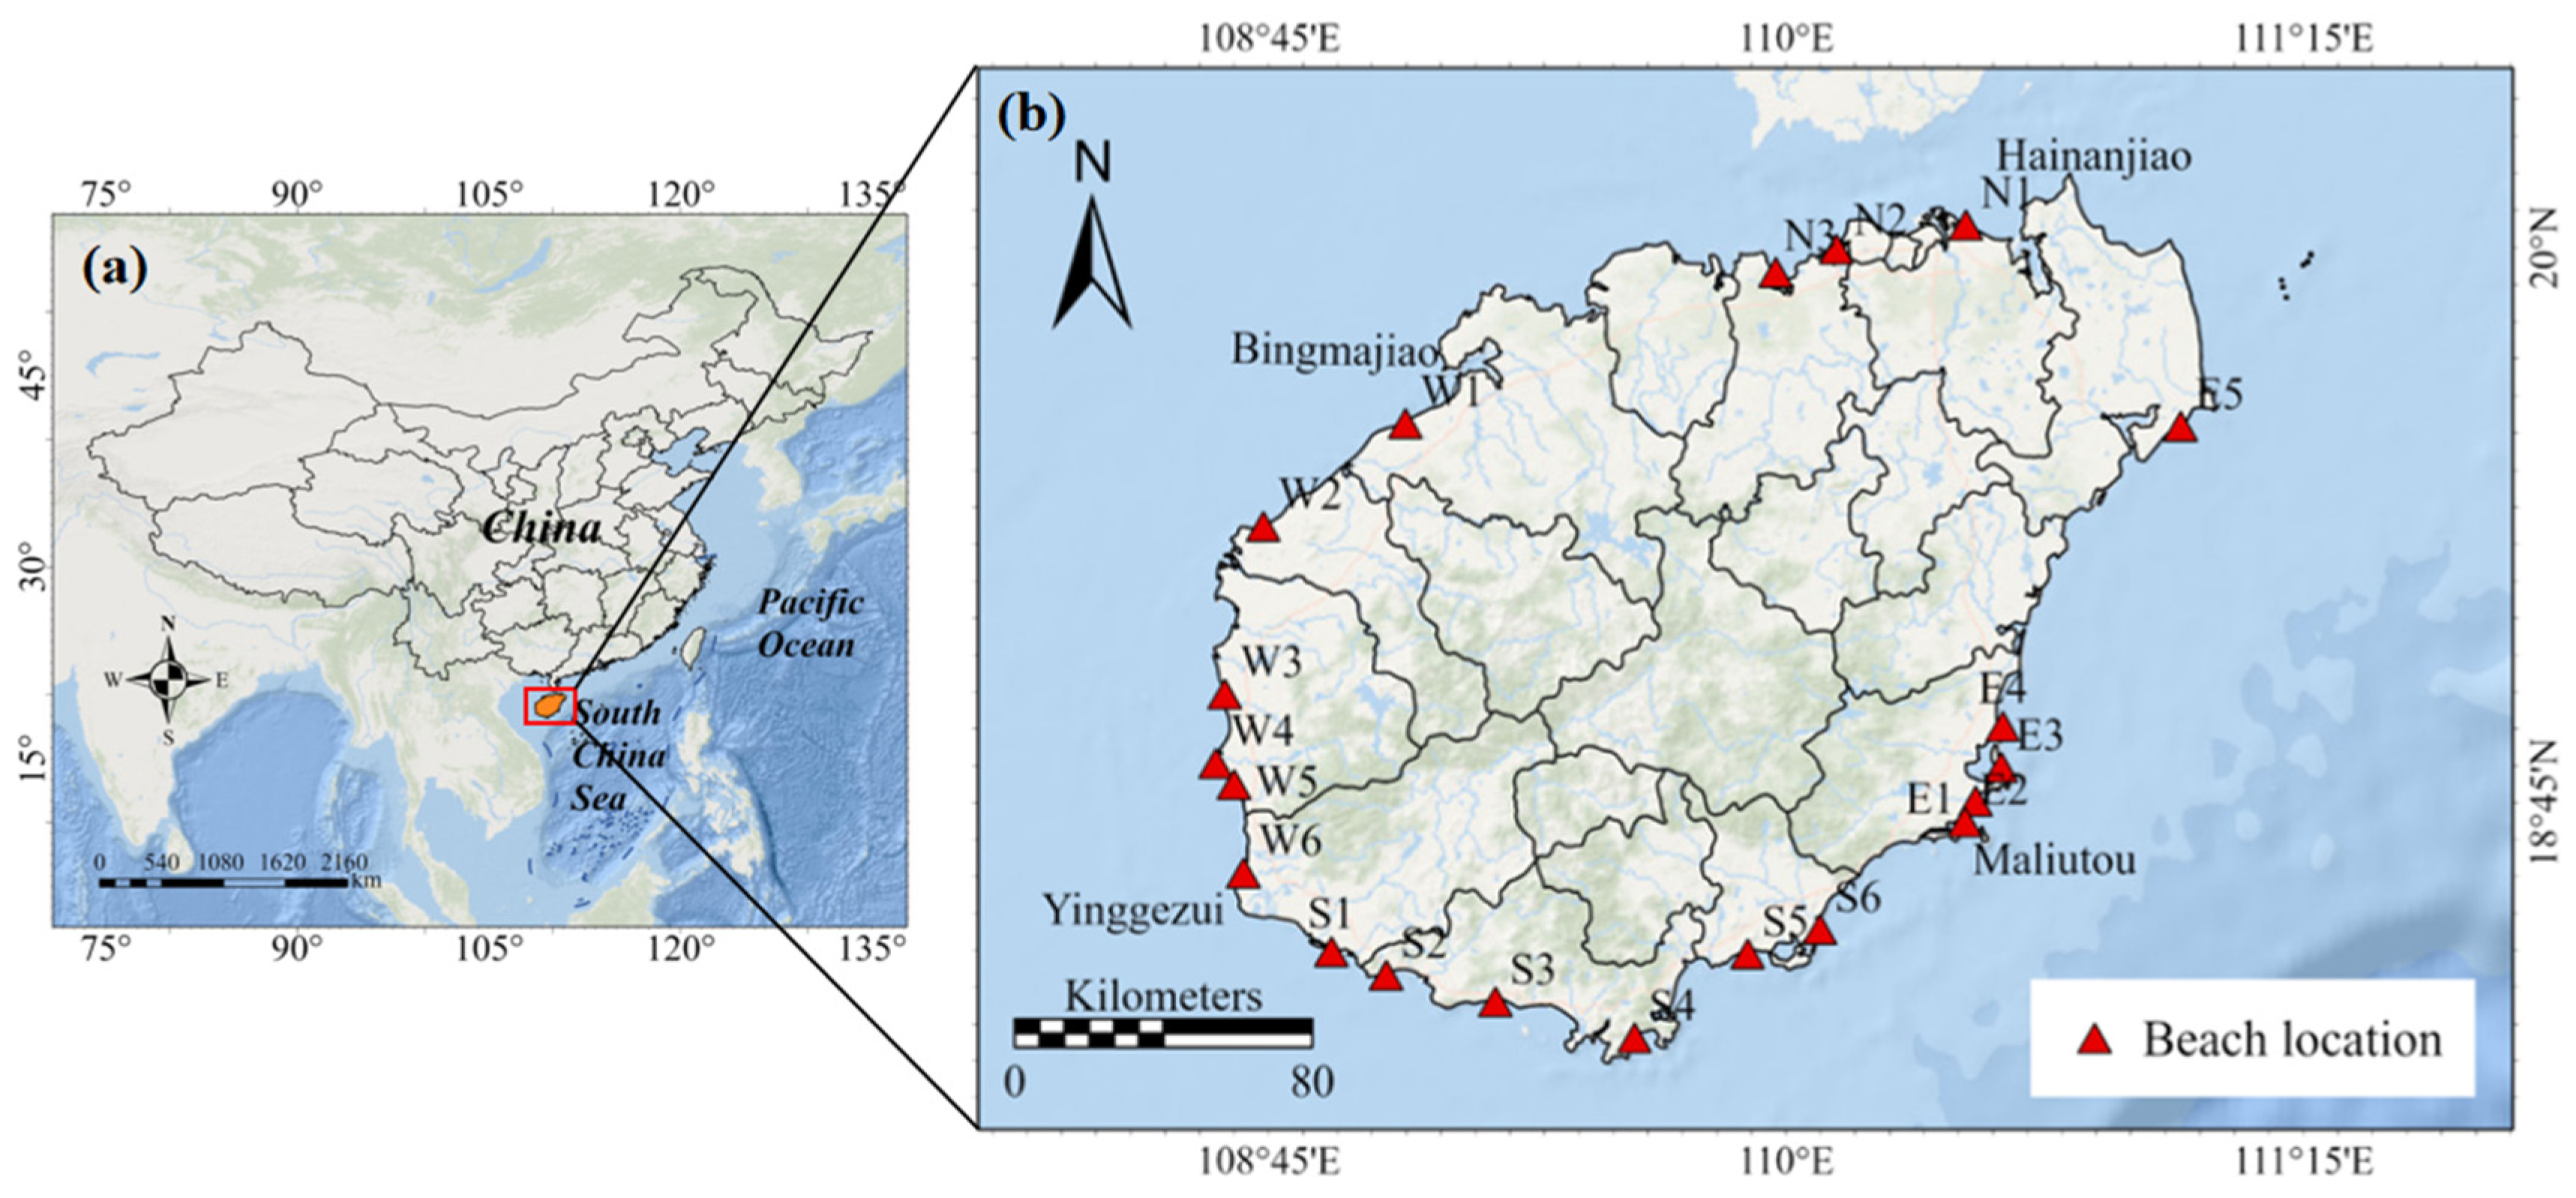
2.1. Study Areas

Hainan Island is located between 108°37′ and 111°03′ E and between 18°10′ and 20°10′ N (Figure 1) [28]. It is the second largest island in China after Taiwan, with a land area of about 33,920 km2. Hainan Island has a tropical climate, rich biodiversity, and beautiful beaches; therefore, it is also known as a popular tourist destination. Due to its developed beach tourism resources and frequent human activities, beaches play an important role in Hainan’s economic growth. Due to this, the topic of how Hainan Island’s beaches or coastlines evolve has attracted a lot of interest.
The coastal erosion of Hainan Island is mainly caused by waves and storm events. The spatial distribution of the wave direction and wave height is consistent in the offshore waters of the eastern and southern coasts, but there are large seasonal variations. In spring and summer, the dominant waves are SSE-directed and have a height of less than 0.8 m, while in autumn and winter, the dominant waves are ENE-directed and have a height of more than 1.0 m. The offshore waters of the west and north have a low wave height of less than 0.8 m and small seasonal changes.
The tidal regime is another hydrodynamic factor to be considered because the waterline position in satellite snapshots is highly correlated with tidal fluctuations. Depending on the location, the tidal range around Hainan Island varies from 0.5 m to 2 m, and the tides are irregularly diurnal or semi-diurnal. According to historical data, the average tidal range is about 0.5 m to 1 m on the eastern and southern coasts [29], while it is 1.5 m to 2 m on the western coast. The tidal currents are generally weak, except in some areas where the topography or upwelling creates stronger flows [30].
Sandy beaches are the main focus of this study, and they mostly occur in the western and southern parts of Hainan Island due to their topography and geomorphology. The northern part has fewer sandy beaches, and most of them are sandy bedrock beaches.

2.2. Data Sources

2.2.1. Satellite Imagery Sources

Beach changes in Hainan are complex and influenced by various factors, such as tidal type, wave erosion, and human activities. To describe and understand the long-term evolution of beach morphology and sediment dynamics, it is essential to use long-term high-resolution satellite data. In this study, the core idea was the use of a large number of instantaneous satellite images at the same location to reflect beach evolution. We used Landsat-8 and Sentinel-2 as the main data sources and obtained thousands of images from 2013 to 2023 through a multi-source remote sensing pathway. We analyzed the variations of 20 representative beaches in Hainan under different conditions (Figure 1); these beaches were unevenly distributed in various directions around the island. The number of satellite images obtained year by year is shown in Figure 2.

2.2.2. Datasets for Validation and Tidal Correction

To validate the accuracy of the satellite extraction, we used the in situ topography data from a typical beach as a reference. The in situ data were collected in May 2017 using a Real-Time Kinematic (RTK) system. Since the satellite images were acquired at different times and tidal levels, which could affect the shoreline position and beach morphology, we applied a tidal correction method to adjust the satellite data to a common tidal datum.
FES2014 provided the tide dataset, which was based on hydrodynamic tide modeling and the assimilation of long-term altimetry data and tidal gauges. It shows a significant advantage in accuracy and performance in coastal and shelf regions [31]; therefore, it is widely used for satellite altimetry de-aliasing, gravimetric data processing, and regional and coastal modeling. The details of the validation and tidal correction methods are described in the following sections.

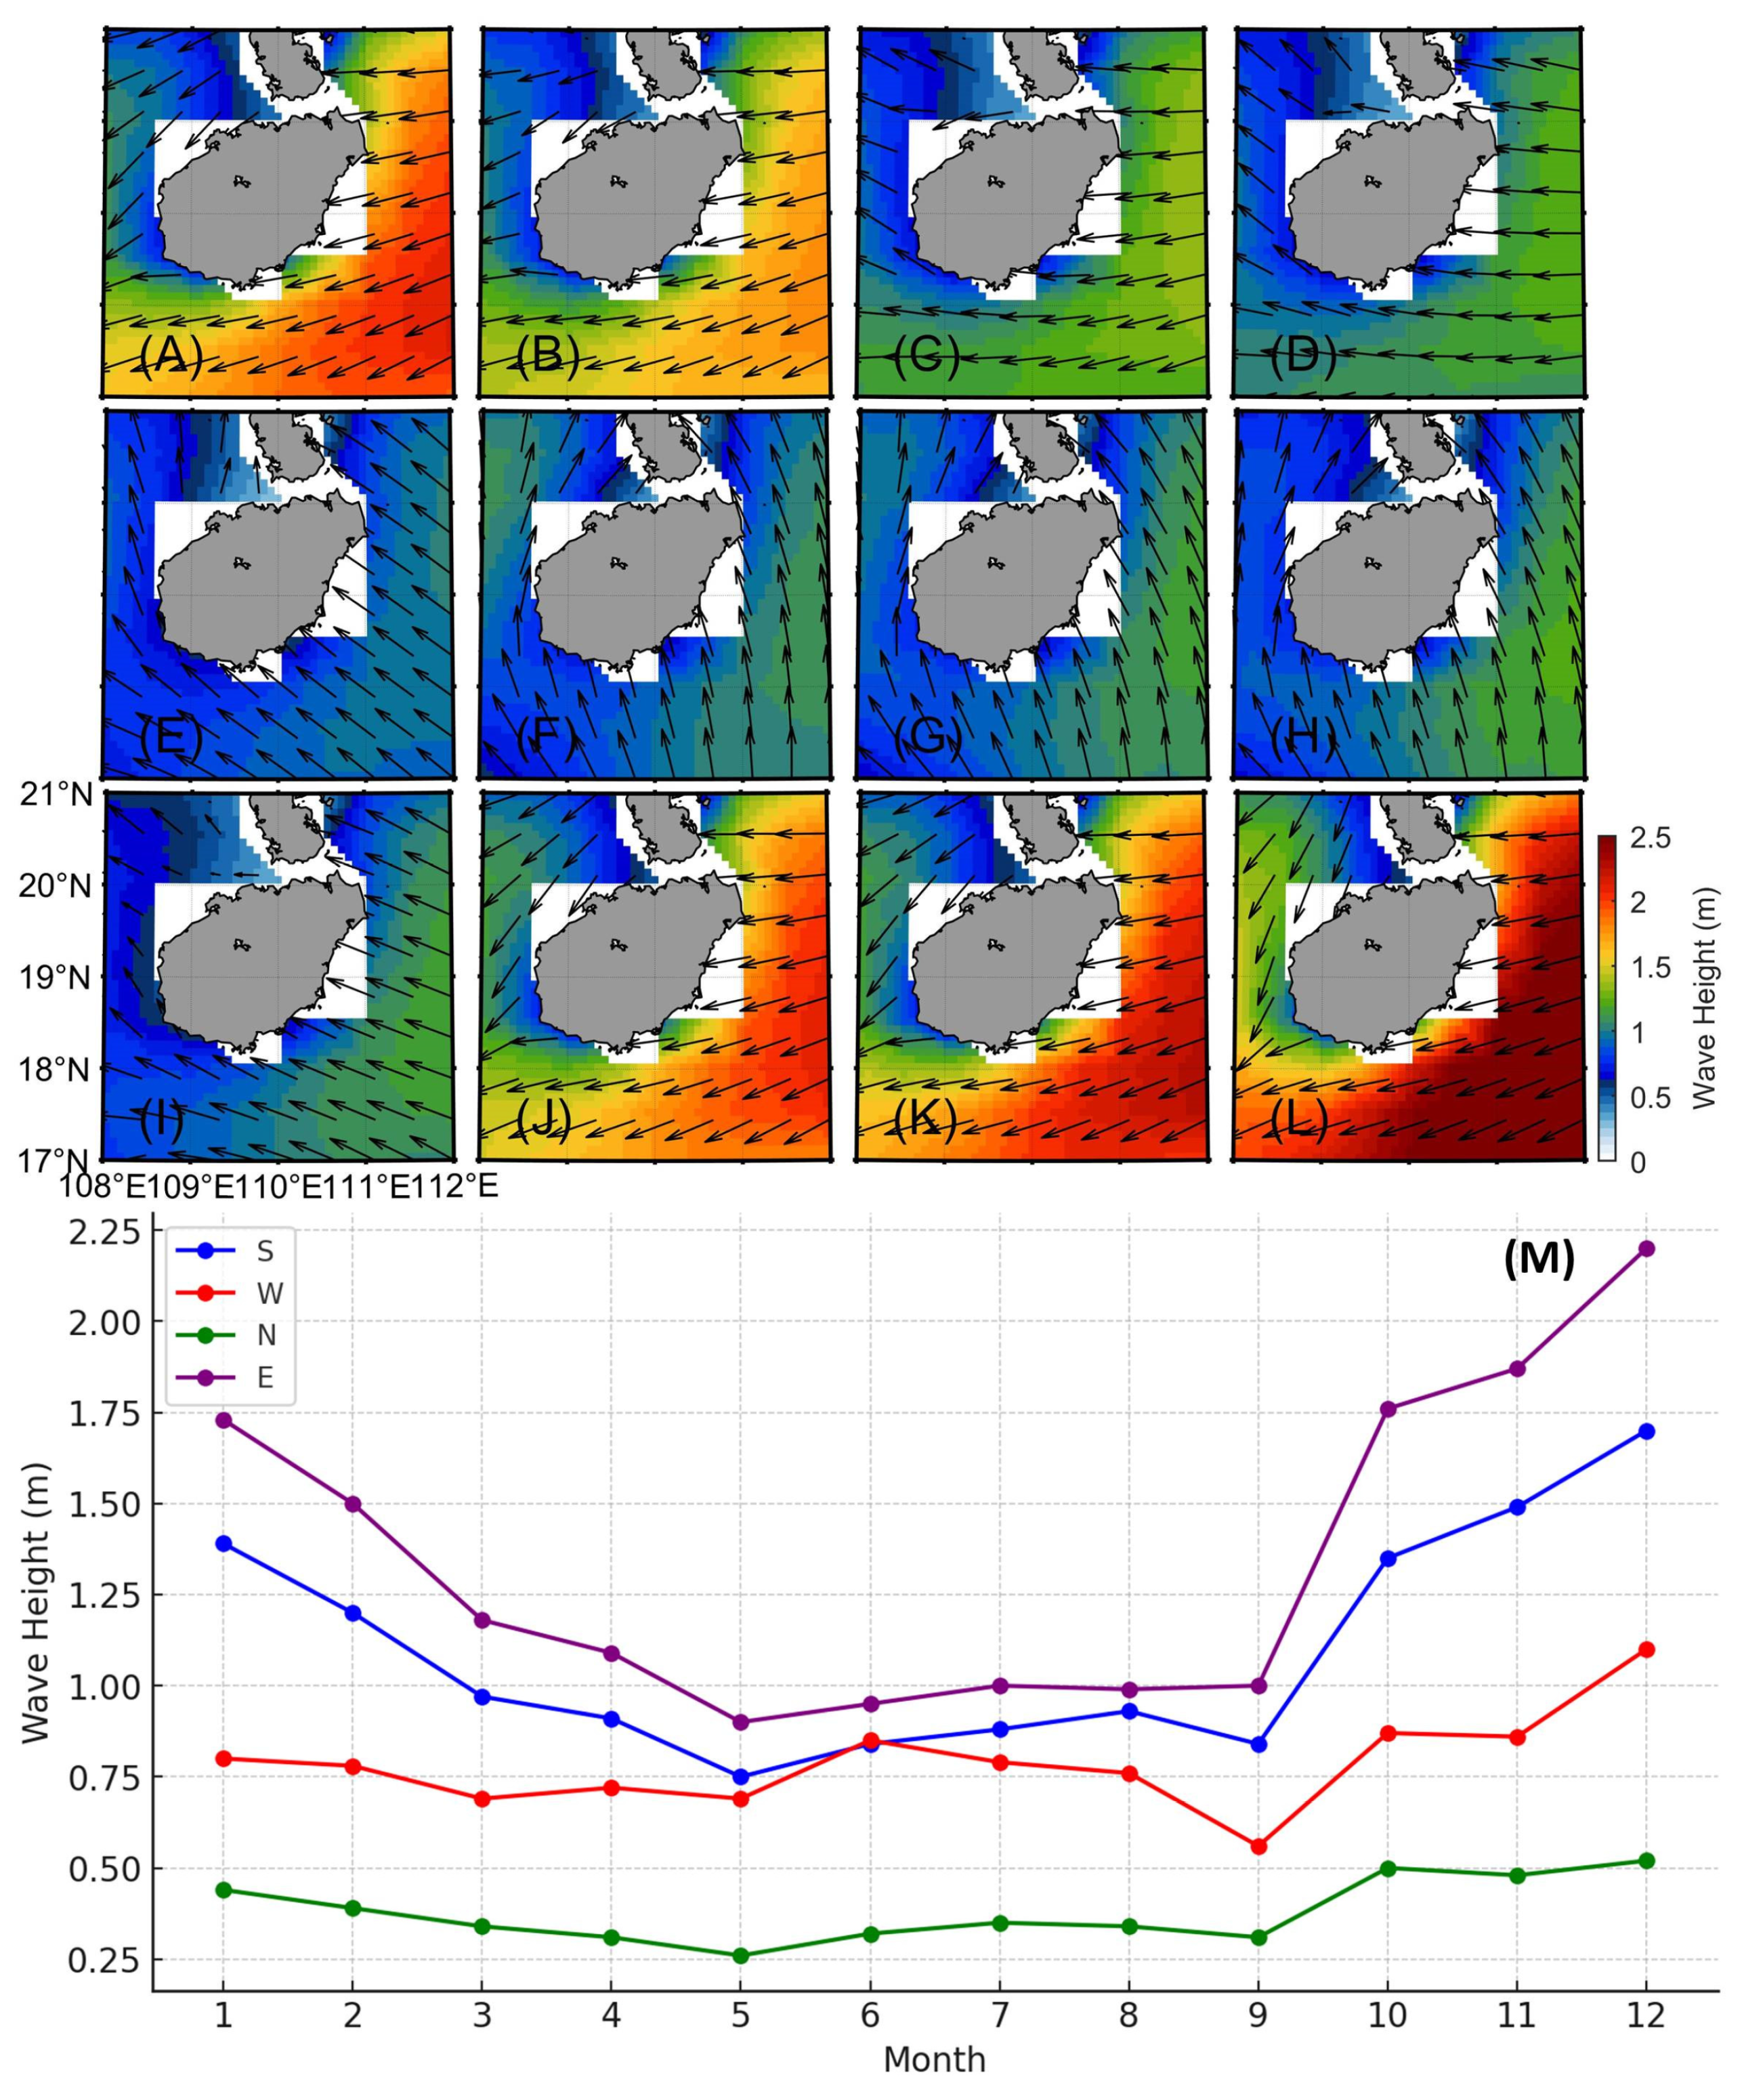
2.2.3. Datasets of Waves

Coastal waves, which are capable of generating runup on a beach, play a significant role in influencing distribution along a shoreline. The ERA5 dataset, a state-of-the-art climate reanalysis produced by the European Center for Medium-Range Weather Forecasts (ECMWF), served as the foundation for analyzing the wave distribution around Hainan Island in this study. ERA5 provides a comprehensive global atmospheric reconstruction using a wealth of observational data and advanced modeling techniques. It offers hourly estimates of a multitude of oceanic parameters dating back to 1940, thus providing extensive temporal coverage, which is invaluable for both climate research and operational forecasting. The spatial resolution is 0.5 degrees × 0.5 degrees (each pixel represents a 53 km (longitude) × 55 km (latitude) ground area at 18° N).
For the purposes of our investigation of the wave climate around Hainan Island, the ERA5 wave data specifically included the significant wave height. This metric is critical in characterizing wave dynamics and energy, which can significantly influence coastal processes, such as sediment transport, erosion, and shoreline stability.
The high spatial resolution and hourly temporal granularity of the ERA5 wave data enabled a detailed examination of the wave patterns and their interactions with the island’s coastline. This analysis is crucial for understanding the seasonal and interannual variability in wave energy, which is a key driver of the morphological changes observed in shoreline positions throughout the year.
Incorporating the ERA5 dataset into our study allowed for a robust assessment of the wave climate’s role in shaping the coastal dynamics of Hainan Island. The fidelity of the ERA5 reanalysis data coupled with its comprehensive global coverage ensured that the insights derived from this research were grounded in high-quality, reliable climatological information.
To comply with the timeframe of this study, we calculated the monthly average of the significant wave height and wave direction from 2013 to 2022 (Figure 3A–L) and listed the average monthly wave height of the four offshore directions of Hainan Island (Figure 3M).

3. Methodology and Validation

3.1. Shoreline Detection and Extraction via CoastSat

The instantaneous shorelines acquired from remote sensing images delineate the dynamic boundary between the sea and land during the fluctuations of waves and tides at the specific moment of the satellite’s passage [32]. The extraction of these instantaneous shorelines holds fundamental significance in the investigation of coastal evolution [33]. Consequently, this study primarily centered on the automatic processing and analysis of a dataset pertaining to these instantaneous shorelines.
This study was based on the algorithm of a thresholding segmentation technique called CoastSat used to detect and extract the shorelines. CoastSat was developed by Vos et al. [34] and has been shown to have good performance for beaches [35,36], reservoirs [37] and tidal flats [38]. The shoreline detection algorithm implemented in CoastSat combines sub-pixel edge segmentation with image classification components, refining the segmentation into four different categories: sand, water, whitewater, and other land features. This allows for the specific detection of a shoreline at the sand–water interface. The shoreline is then automatically extracted from the selected images using sub-pixel resolution techniques. The sub-pixel resolution boundary segmentation technique utilizes the Modified Normalized Difference Water Index (MNDWI), which is widely used to discriminate between water and land features. The formula for the MNDWI is the following:
MNDWI = S W I R 1 G r e e n S W I R 1 + G r e e n
The pixel intensities in the SWIR1 and Green bands corresponded to the shortwave infrared range (1.55–1.65 μm) and the green band (0.52–0.6 μm), respectively. The classification was refined by obtaining a threshold specific to the sand–water interface and ignoring other land features and clear water in the threshold algorithm. The MNDWI values were computed for each pixel, as shown in Figure 3, resulting in a grayscale image with values ranging from −1 to 1.
Figure 4 outlines the comprehensive workflow adopted in this study, and it details the systematic process from the initial acquisition of data sources to the final analysis of the results. It begins with the identification and procurement of relevant study data, followed by the meticulous processing of these source data to ensure accuracy and reliability. The subsequent steps include the evaluation of the methodologies applied, ensuring that they were robust and appropriate for the research objectives. The workflow culminated in a thorough analysis of the results, which was aimed at extracting meaningful insights and conclusions. This sequence not only underscores the methodical approach taken but also highlights the study’s commitment to rigor and precision at each stage of the research process.

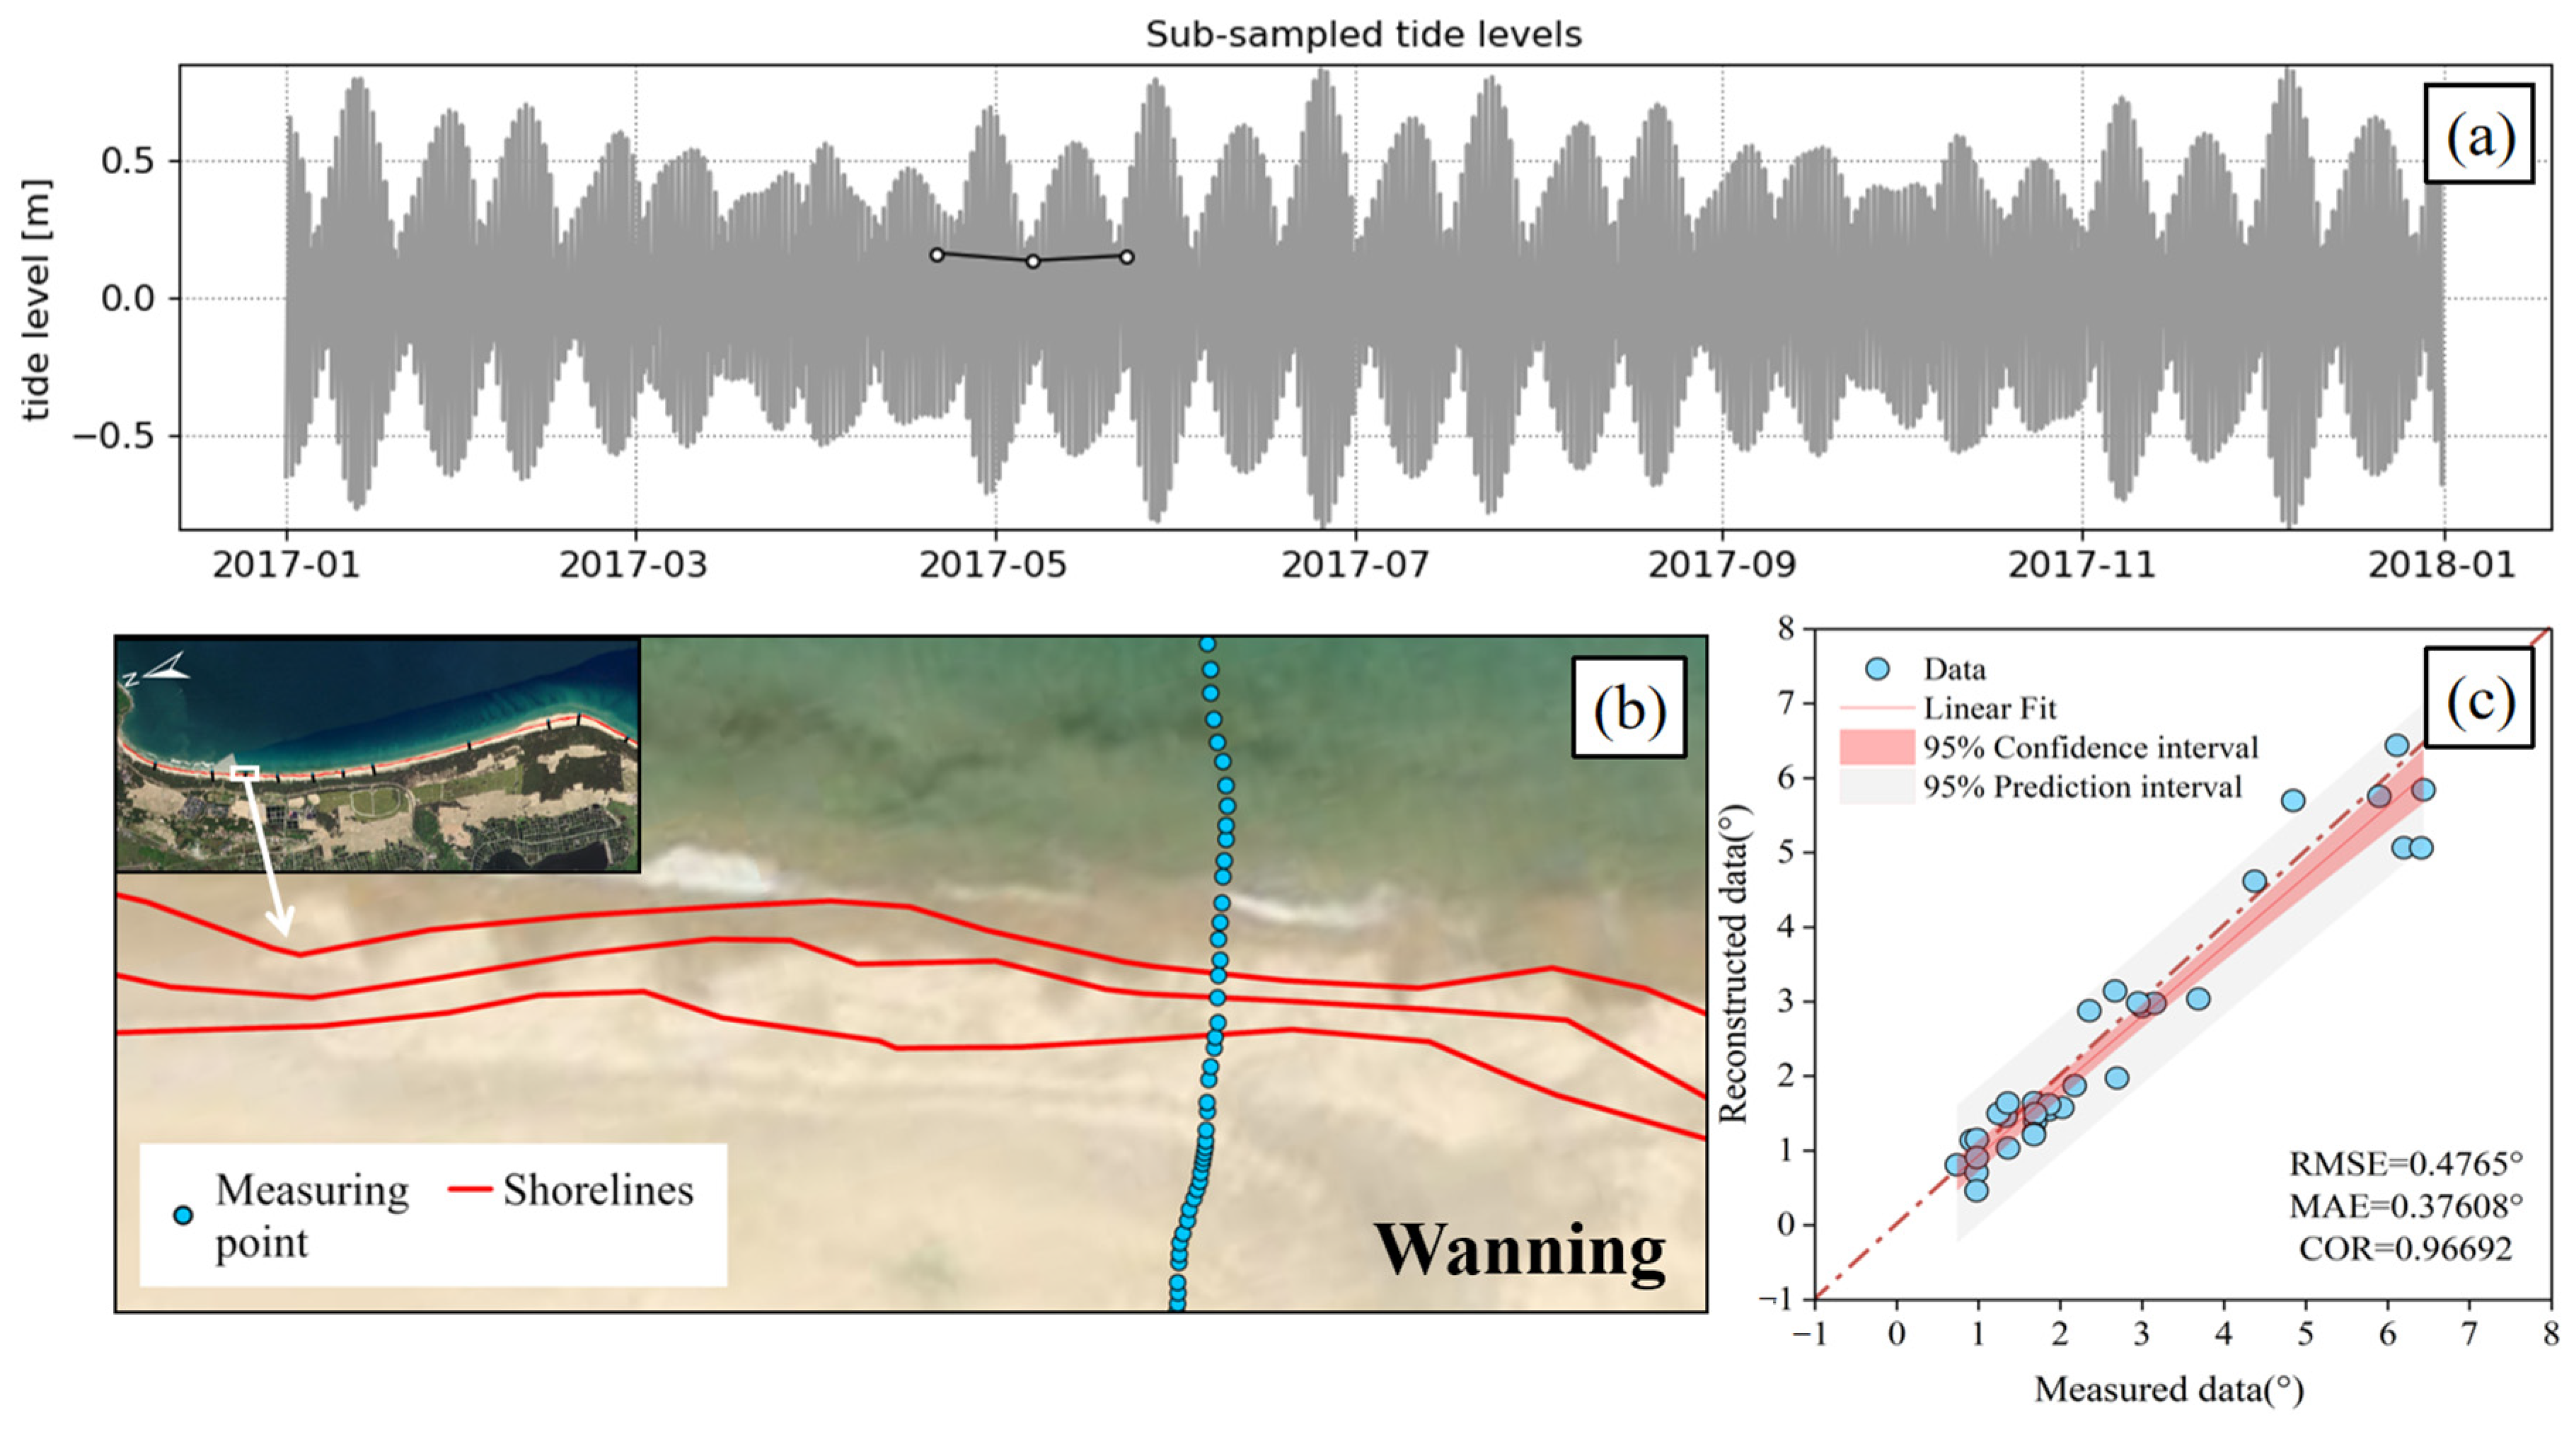
3.2. Tidal Correction

We used FES2014 to obtain the tide levels aligned to the shorelines extracted from the satellite imagery and followed a commonly used methodology, i.e., the use of the mean sea level (MSL) as a tidal reference datum for the correction of the tidal level, as proposed in [39]. The formula for tidal correction is as follows:
L = H h t i d e t a n θ i
where ΔL is the cross-shore horizontal shift (along the transect), H is the reference tidal datum, h t i d e is the tide level corresponding to the moment of the satellite image of the beach location in question, and t a n θ i represents the beach face slope specific to the site of interest.

3.3. Beach Slope Validation

To evaluate the extraction accuracy of CoastSat, the beach slopes measured in situ were collected and compared with the results from the extraction algorithm. The measured beach profile data were reported in [40], which suggested large-scale spatial variations in shoreline behavior on Hainan Island. Here, each profile slope θ i derived from the satellite images was calculated as follows:
tan θ i = H L i
where H represents the variance in tide levels between two consecutive time points when different shorelines were detected, and L i is the horizontal distance between two shorelines along each profile.
R M S E = 1 n i = 1 n X i Y i 2
M A E = 1 n i = 1 n X i Y i
C O R X , Y = c o v X , Y σ X σ Y = i = 1 n X i X ¯ Y i Y ¯ i = 1 n X i X ¯ 2 i = 1 n Y i Y ¯ 2
where X i is each evaluated slope, Y i represents each corresponding monitored datum, and n is the number of compared data.
As shown in Figure 5c, the comparisons between the reconstructed slope and monitored data had a root mean square error (RMSE) of 0.48°, the correlation coefficient was 0.97, and the mean absolute error was 0.38°, which confirmed the reliability of the outputs of CoastSat and FES2014.

4. Results

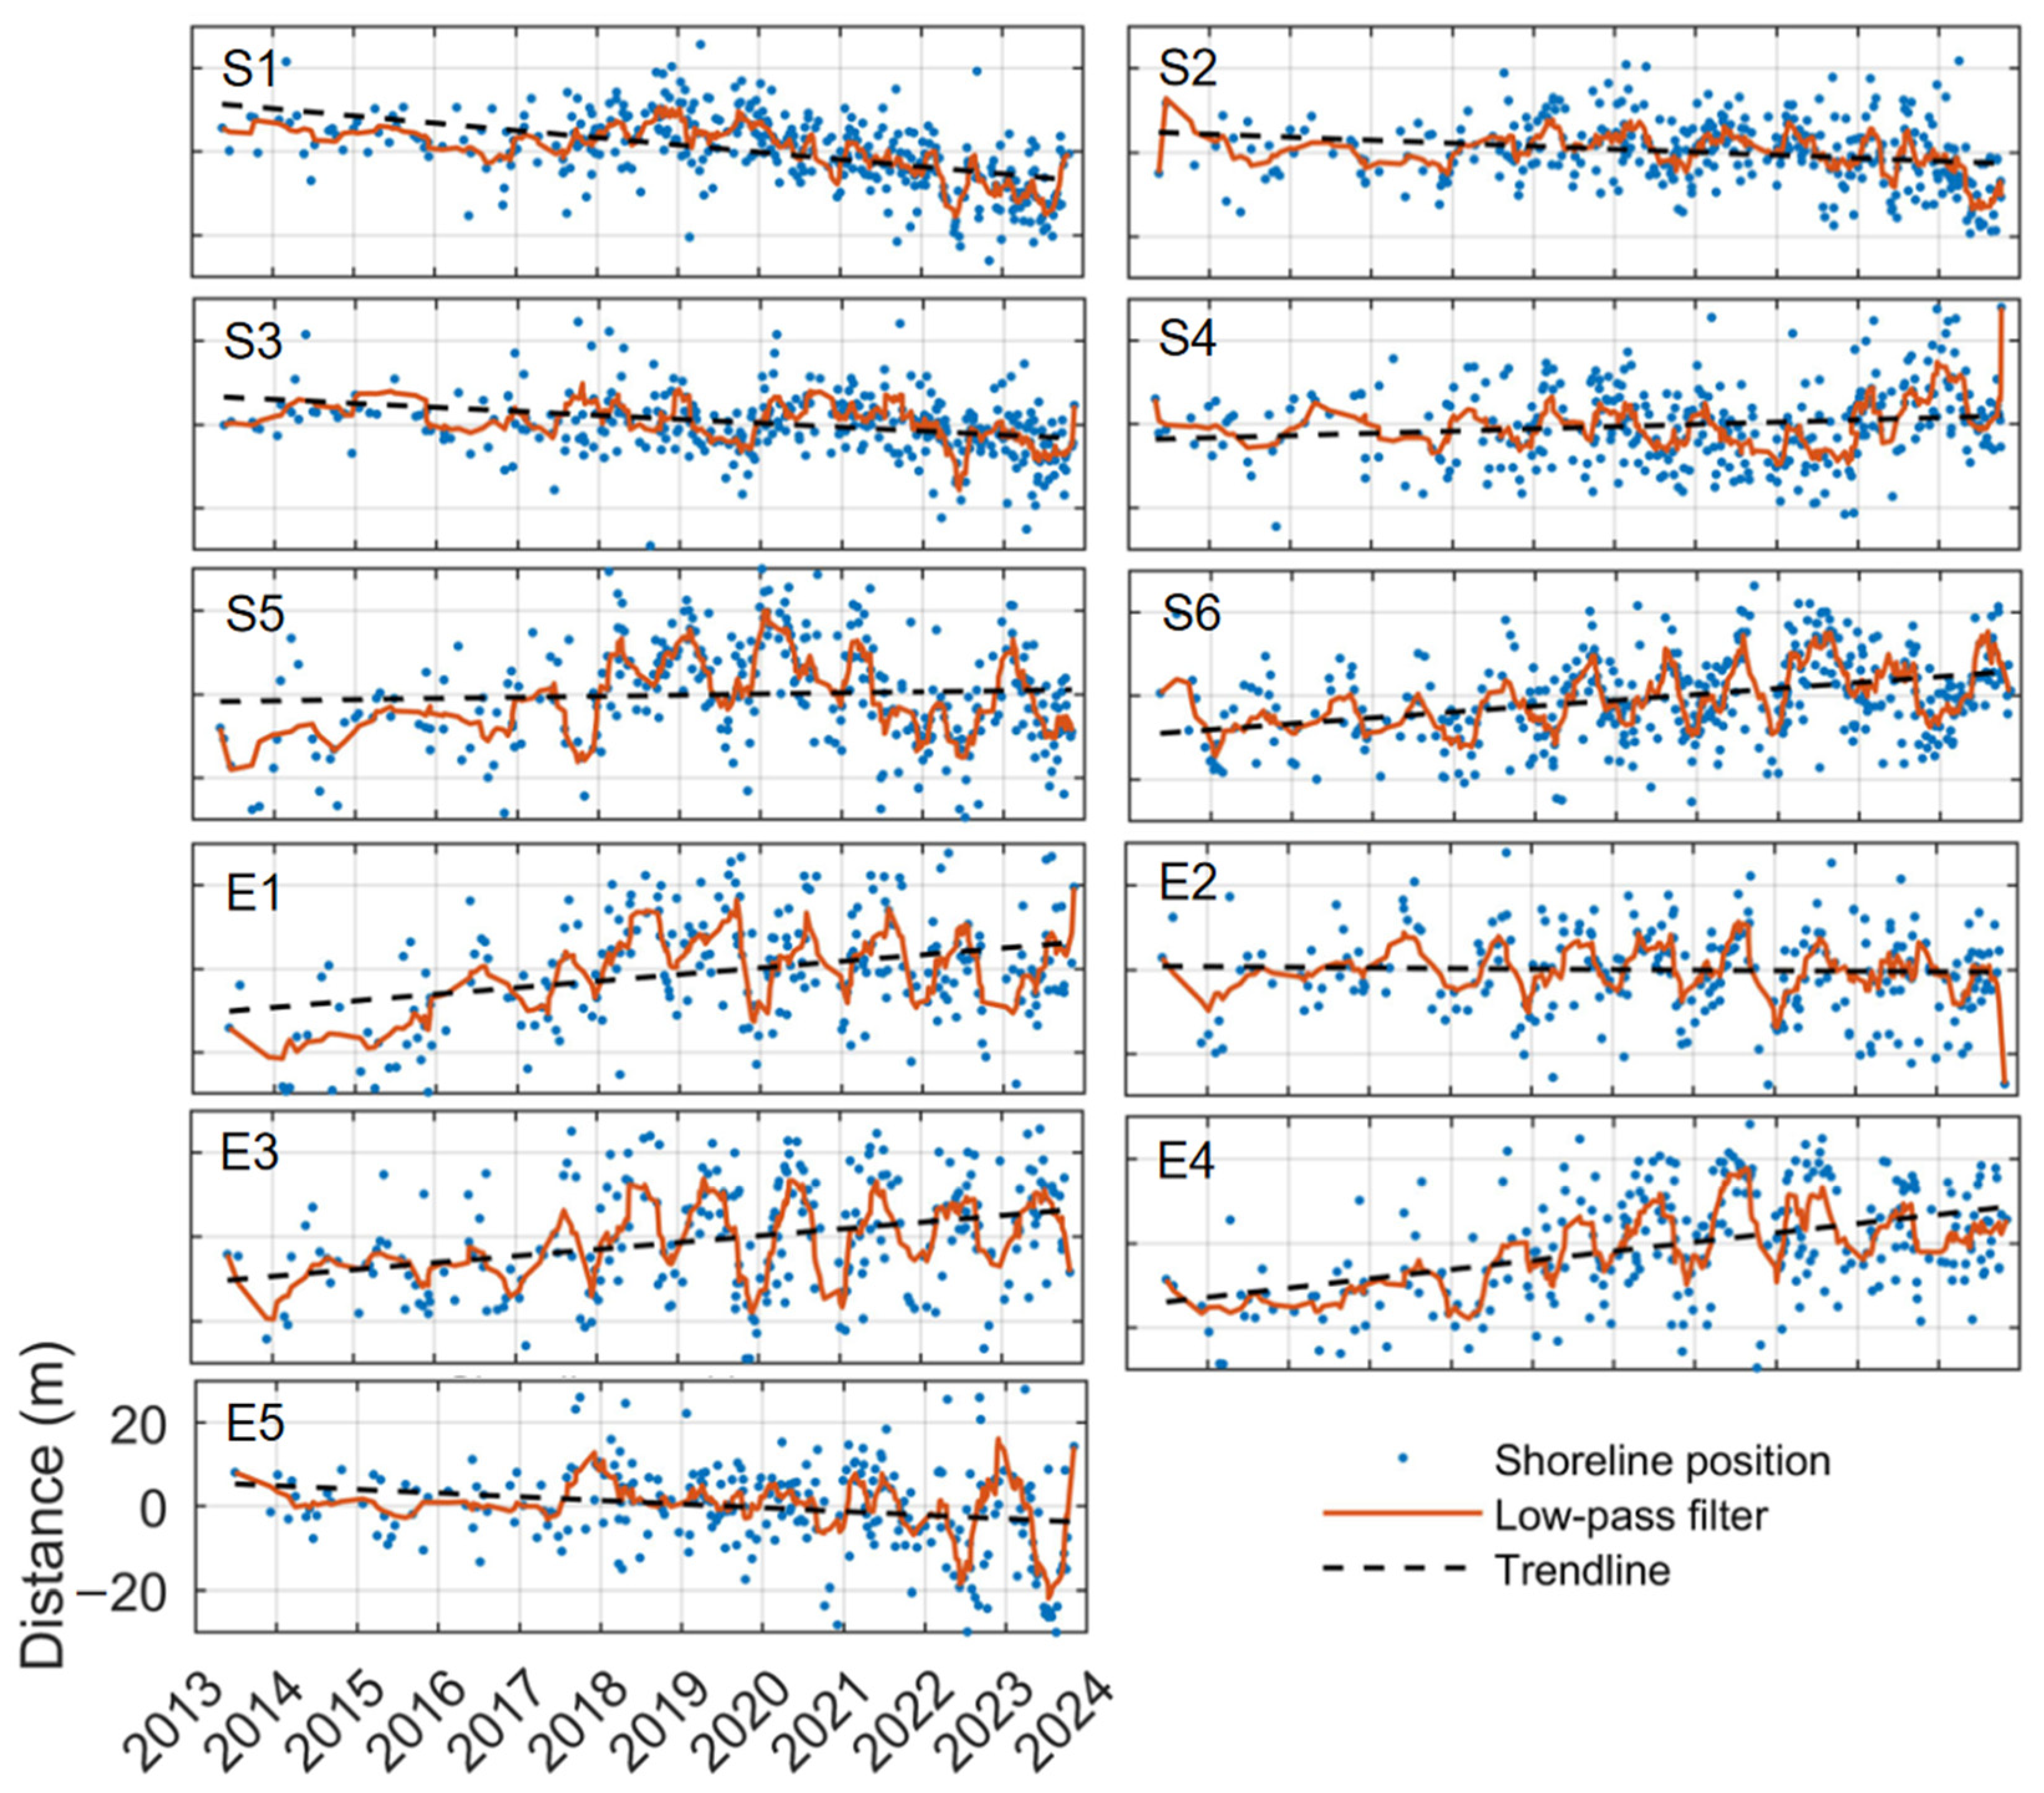
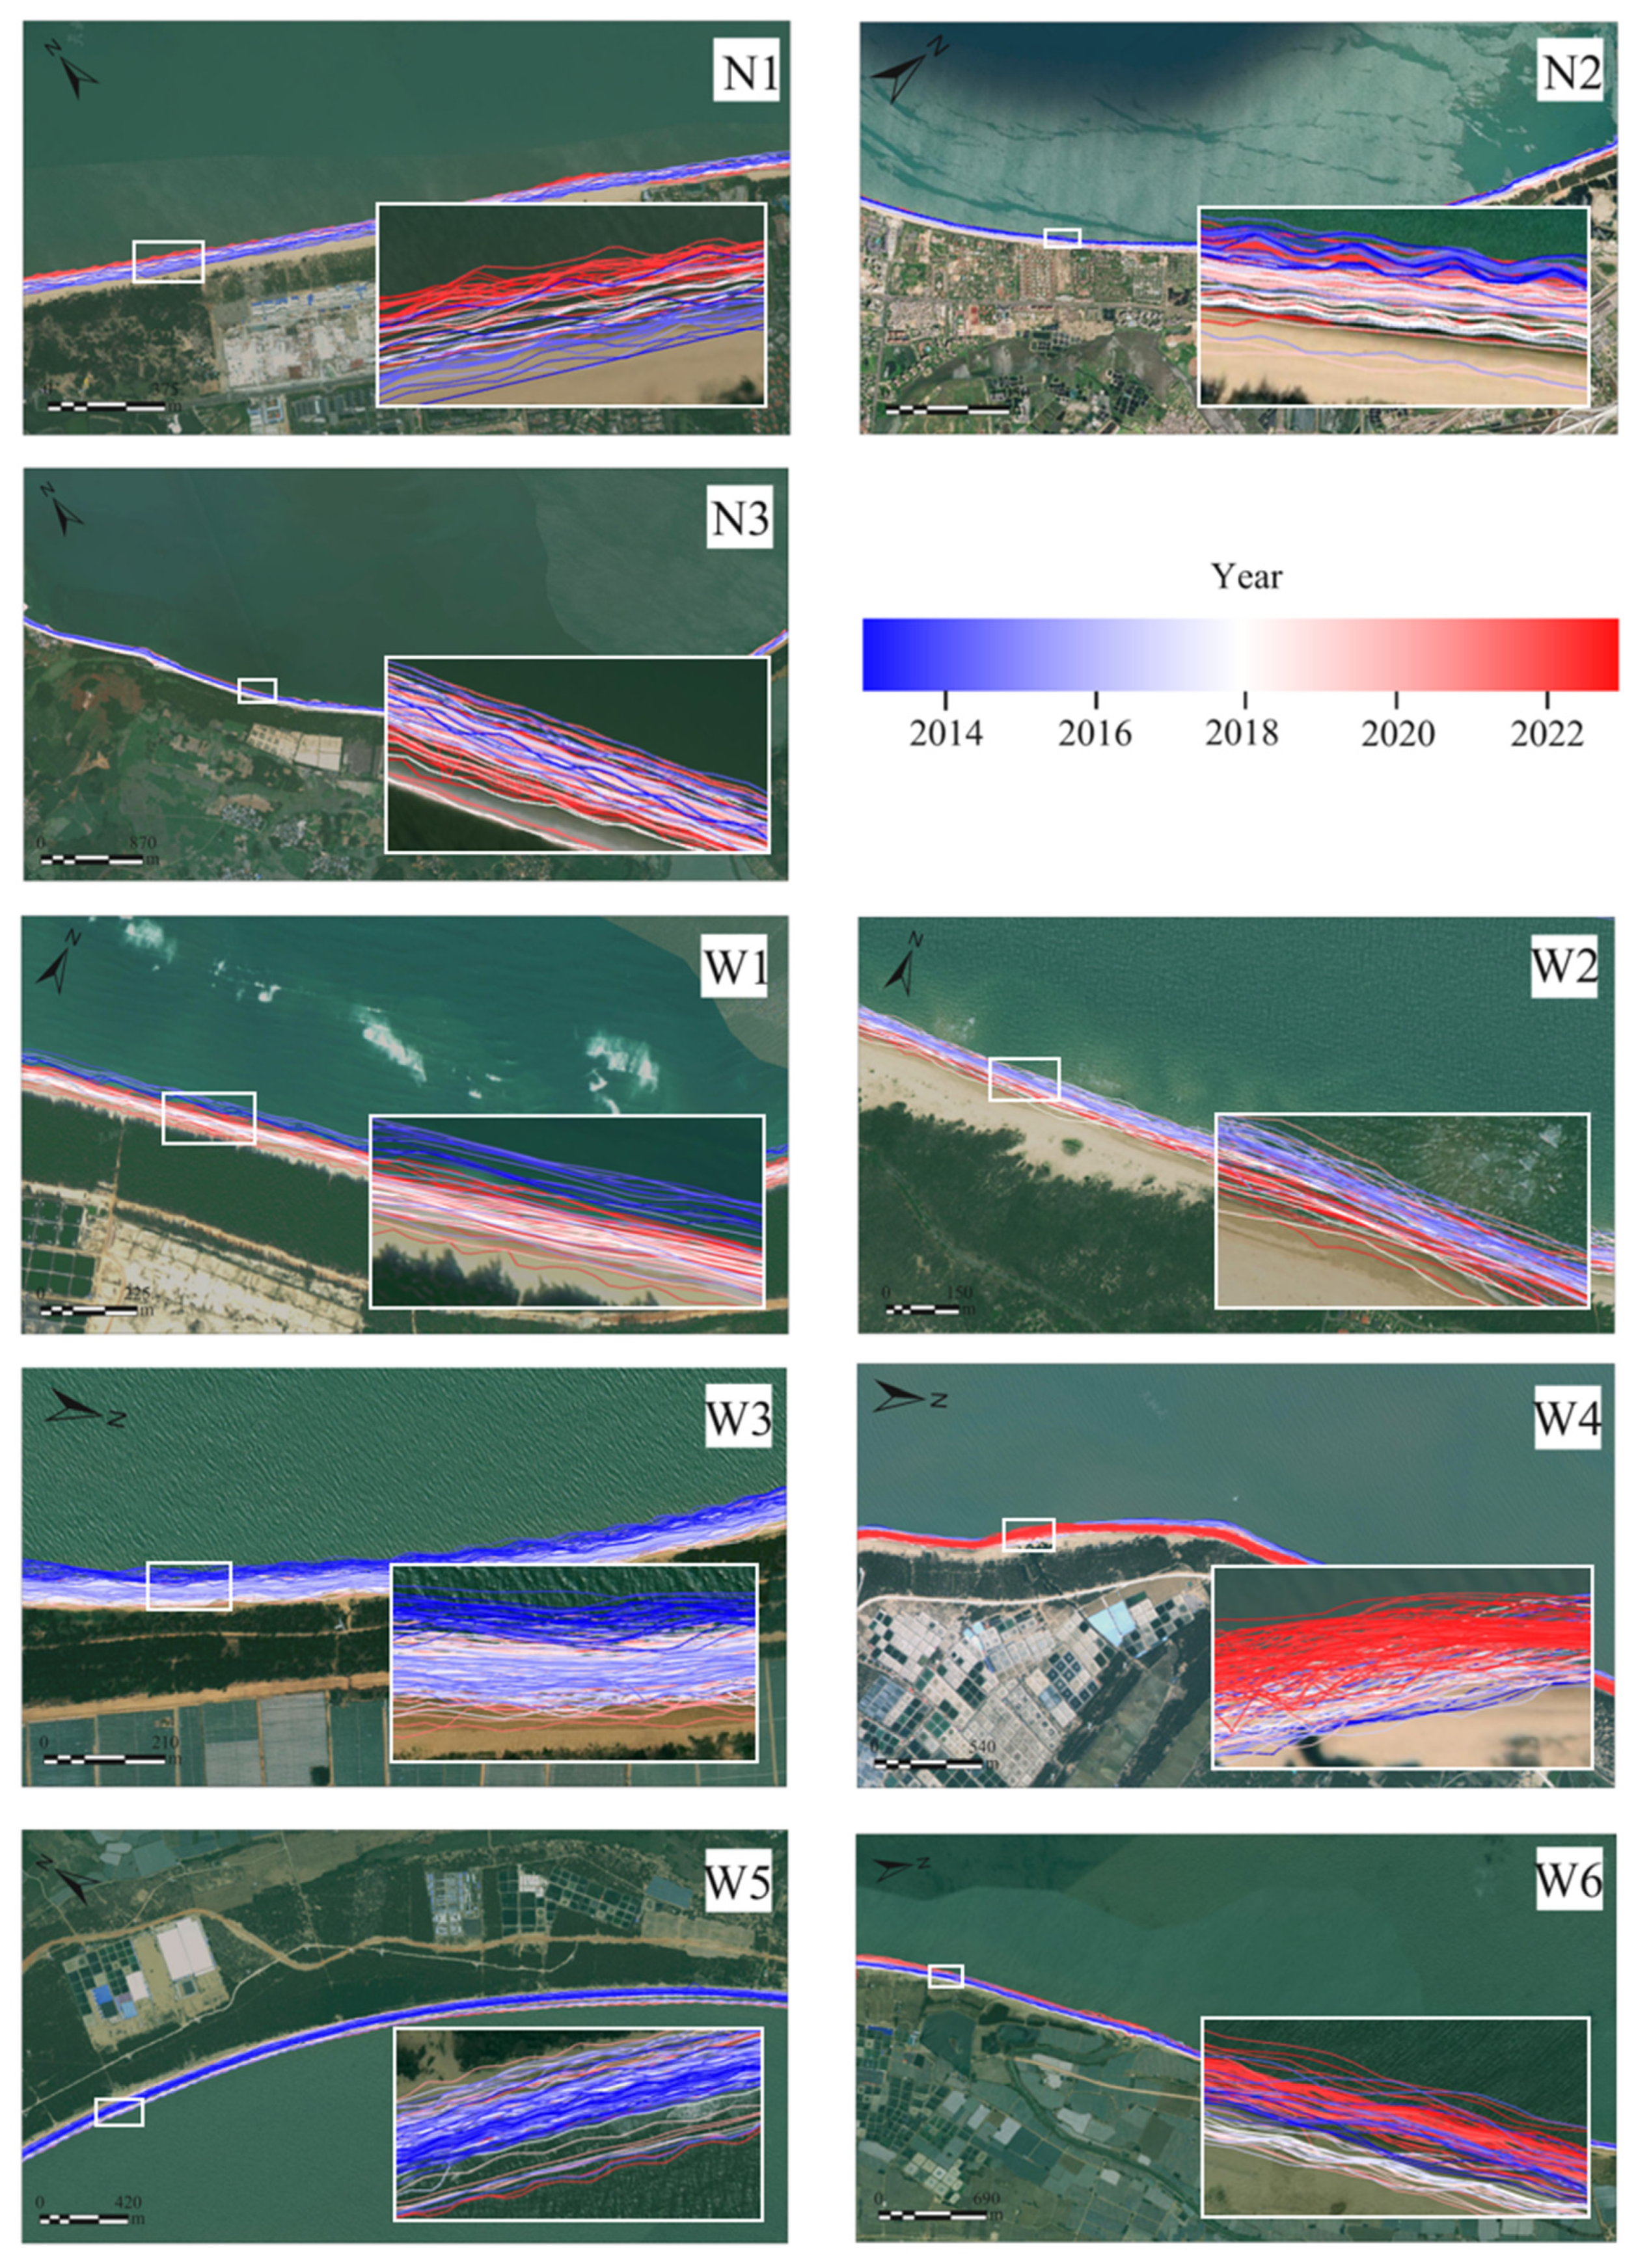
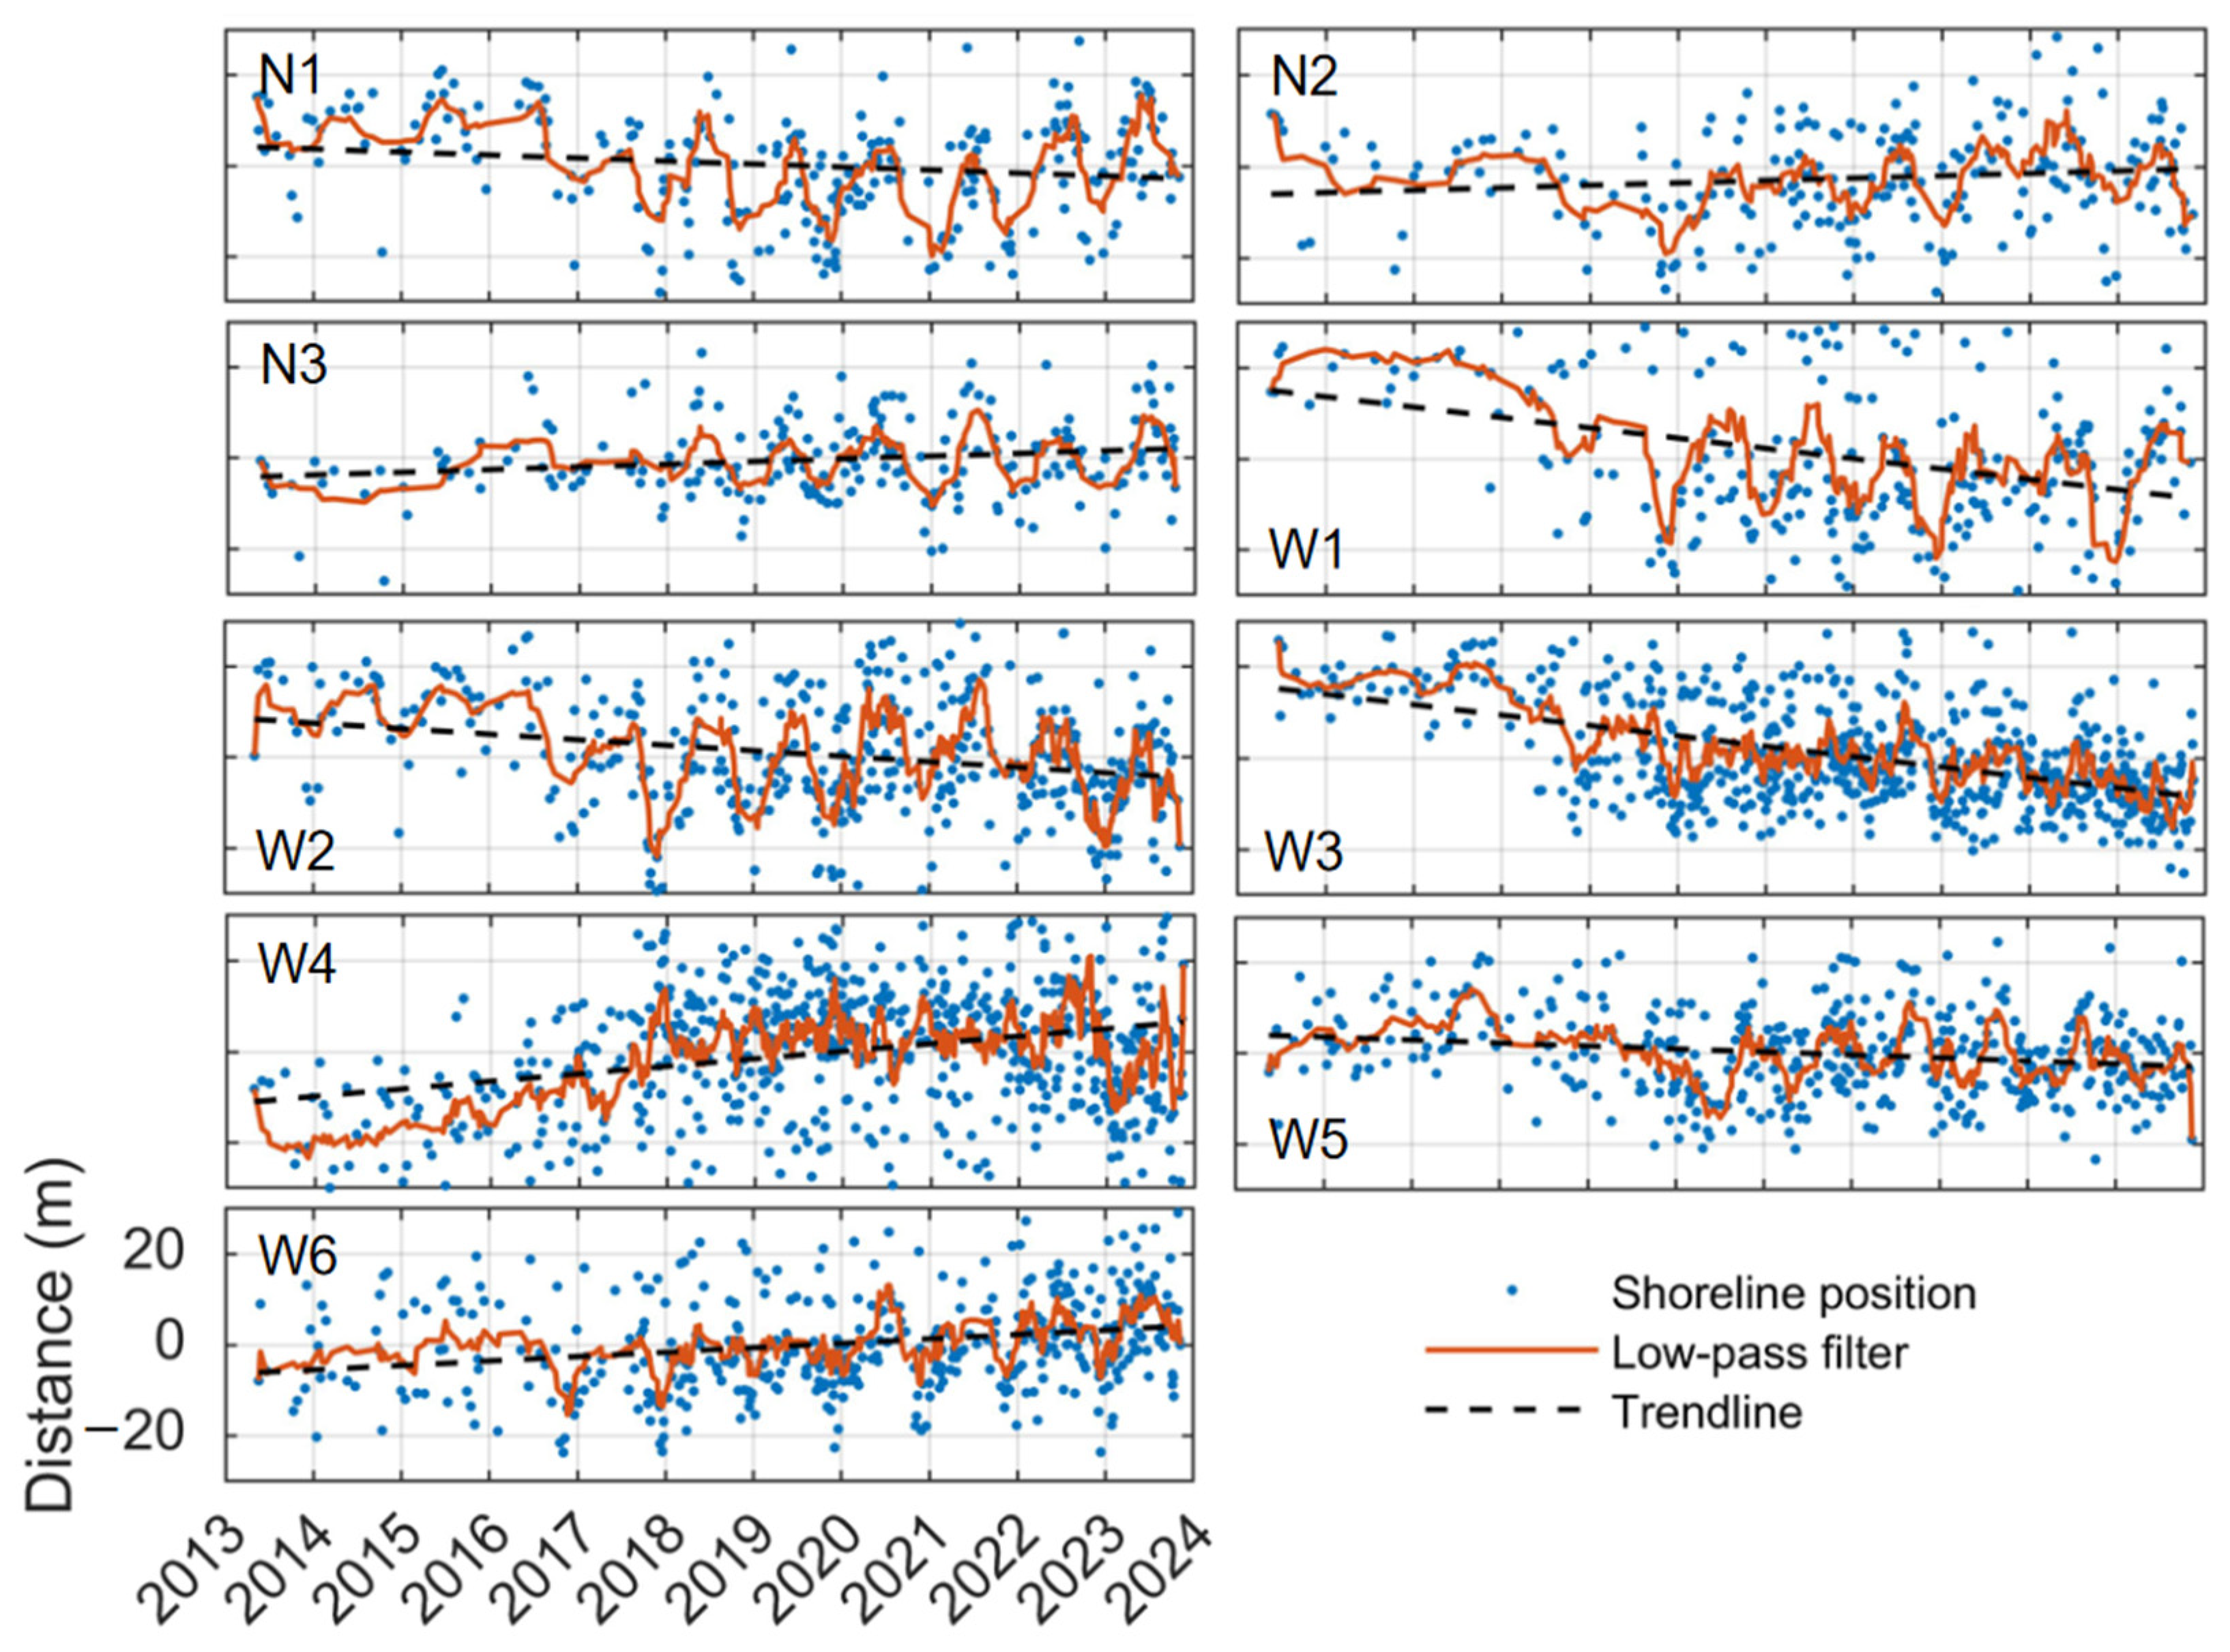
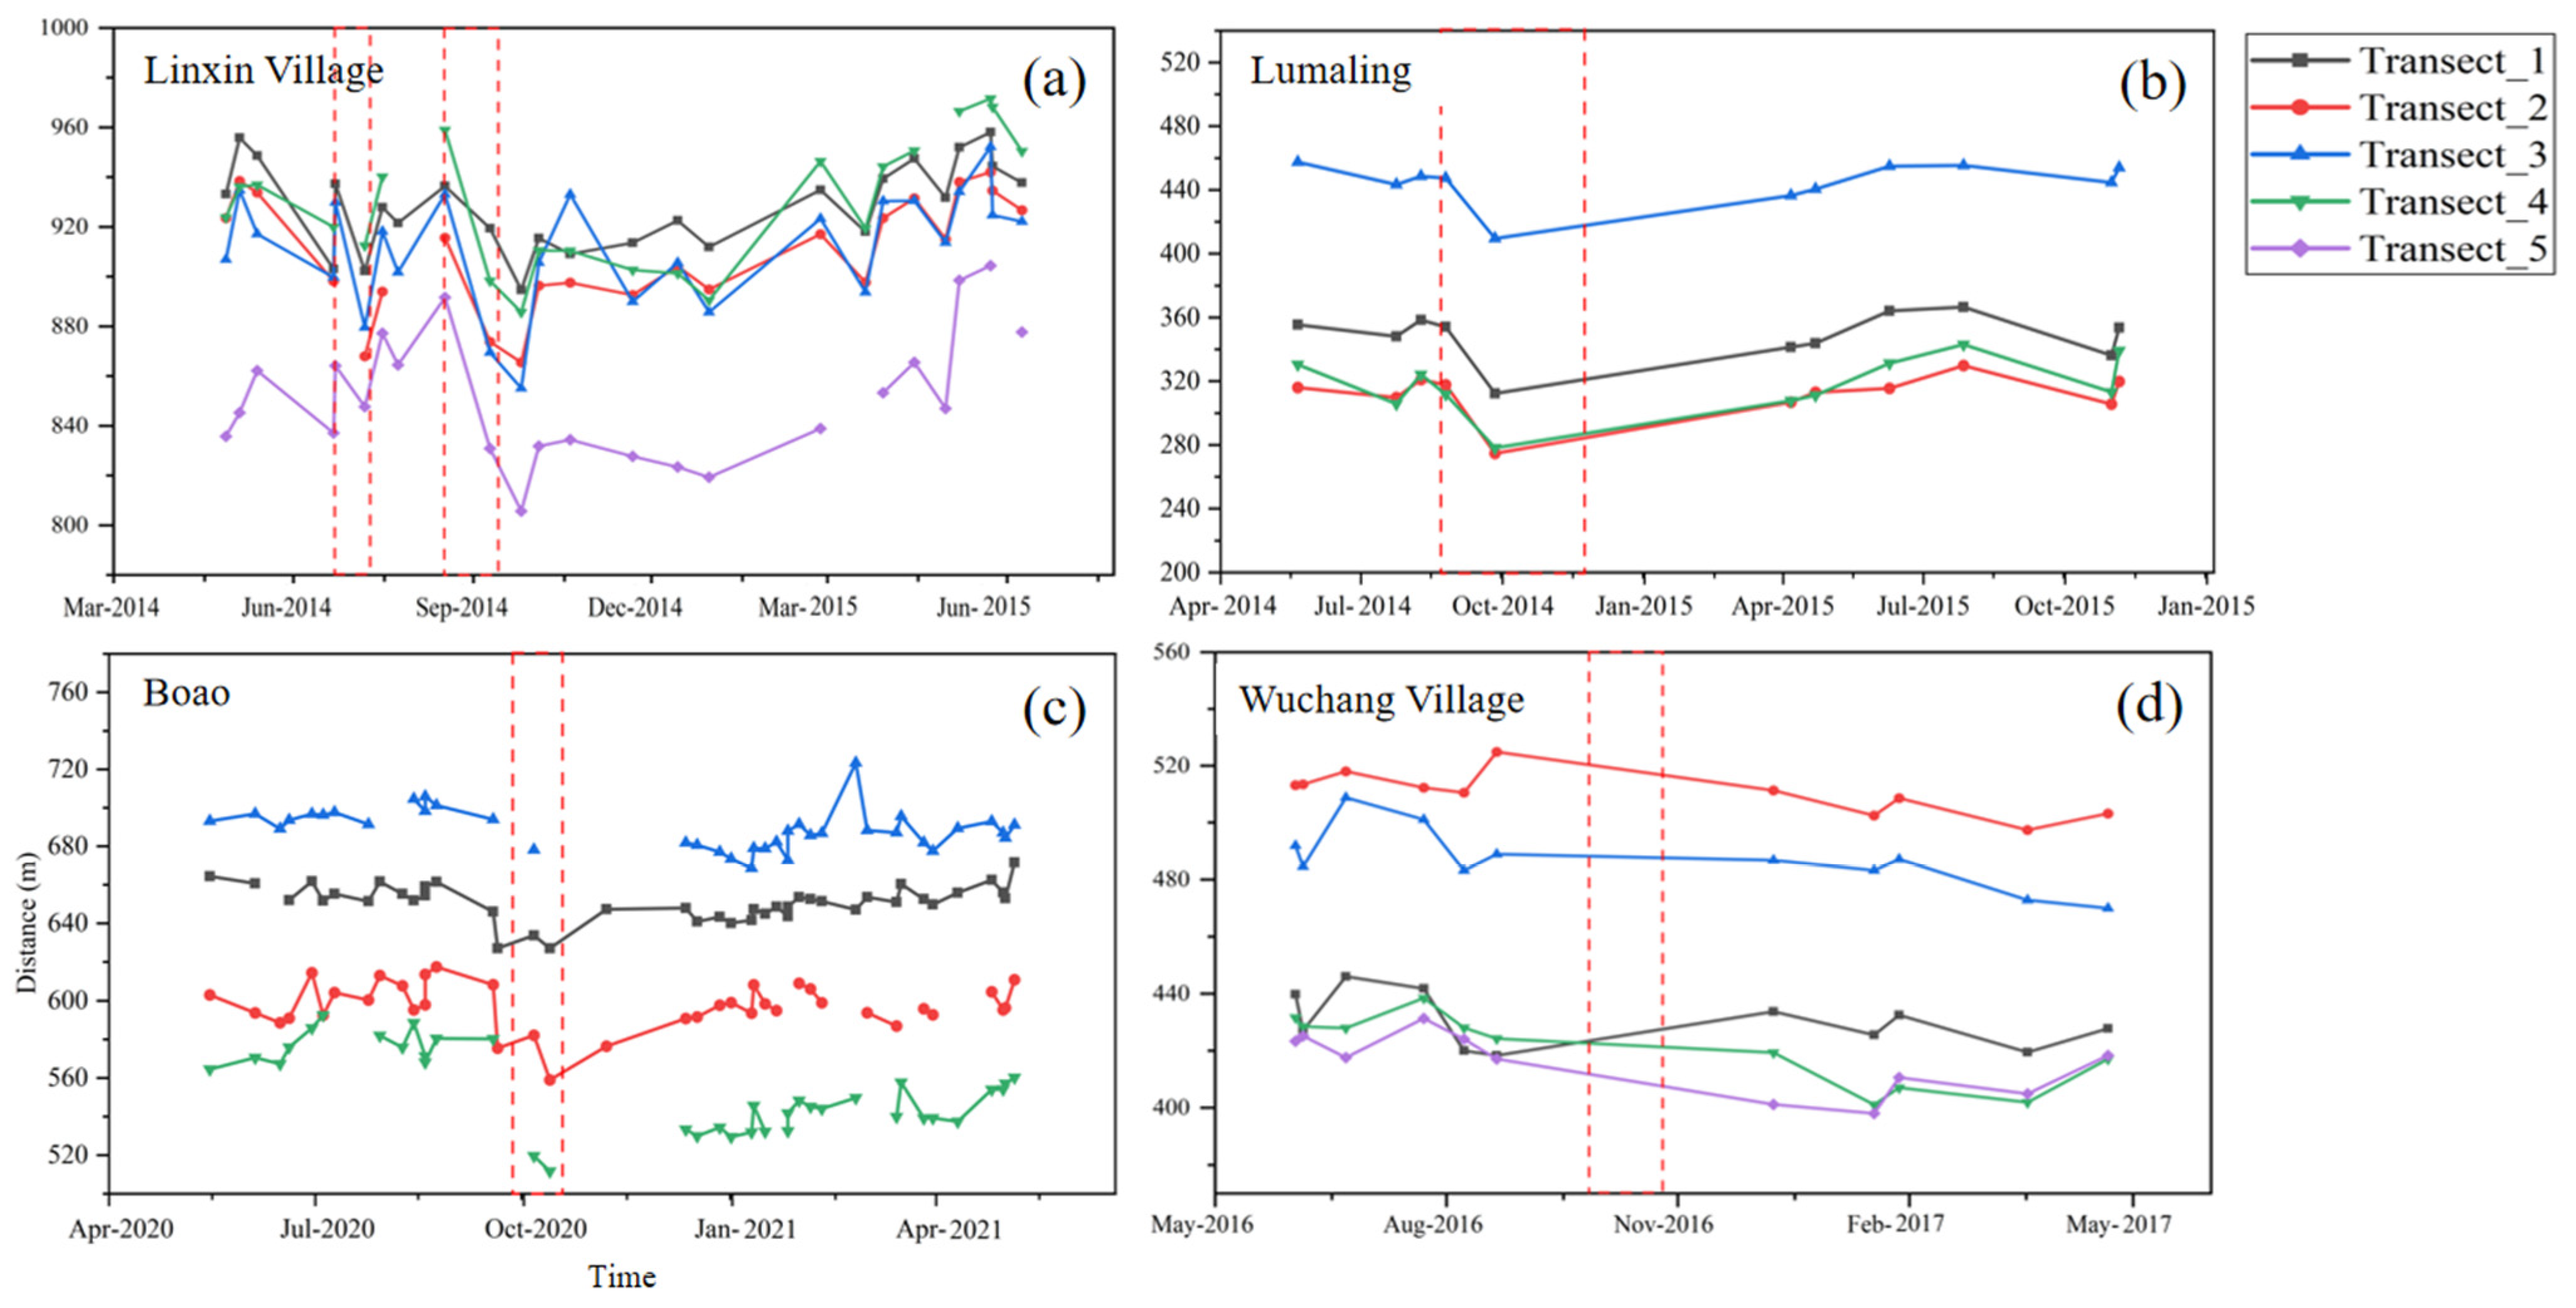
4.1. Shoreline Detection and Variations on Selected Beaches

After extracting the original shorelines of the 20 selected beaches, the shorelines of these beaches in the 2013–2023 period were visualized, as shown in Figure 6 and Figure 7. Each image shows a series of lines overlaid on the coastlines, with each line representing the position of a shoreline at different times from 2013 to 2023, as indicated by the color gradient from blue (2013) to red (2023) in the key. Although the extractions were not processed via tidal correction, they showed a distinct segment of the coastline undergoing various changes over the observed period. The lines were close together in some areas, suggesting that there was little change in the shoreline position over time, while in other areas, the lines were spread apart, indicating more significant shifts.
For instance, between 2014 and 2018, noticeable erosion occurred at location N2, while both W3 and S2 experienced significant erosion from 2013 to 2023. In contrast, during the same period, a clear instance of accretion was observed at locations E1 and E4.
To illustrate the temporal variations of the selected beaches, the shorelines were then cut with lines perpendicular to the shore at each site to obtain the cross-shore shoreline change over time. We chose five cross-shore transects from each beach and calculated the relative positions of the shoreline along each transect. Figure 8 and Figure 9 show the temporal variations in satellite-derived shoreline position deviations from the averaged values after correcting for the tidal effects. The vertical axis indicates the distance from the reference point, with positive values signifying a shoreline position seaward of the average and negative values indicating a position landward of the average. The data points, which are illustrated by blue dots, represent the recorded distances of the shoreline position from the fixed reference point, with each panel corresponding to a different beach location. The black dashed lines in each panel depict the trend lines, which were fitted to the data to illustrate the general movement direction of the shoreline over the observed period. Concurrently, the red solid lines represent the outcomes of a low-pass filter, which smoothed out short-term fluctuations to highlight the underlying patterns of movement within the data.
Regarding the observations of low-frequency fluctuations, it was noted that half of the monitored coastal sites (specifically, N1, N2, N3, W1, W2, S6, E1, E2, E3, and E4) demonstrated a distinct seasonal cycle. This pattern was characterized by a pronounced advancement of the shorelines towards the sea during the middle months of the year, a period typically coinciding with the summer season. This seaward progression stood in stark contrast to the shoreline positions observed during the winter months, where a retreat from the sea was commonly recorded. The observed seasonal dynamic closely aligned with the wave dynamics depicted in Figure 3, indicating that wave heights around Hainan Island were significantly greater during the summer months than those during the winter season. This pattern is critical in understanding coastal processes, as Stockdon et al. established a direct correlation between wave runup on beaches and the height of waves [41]. Consequently, the elevated wave heights observed during the winter could lead to a reduction in beach width across numerous beaches on Hainan Island.
In analyzing the overall patterns across the studied coastal locations, it was found that nearly half of the beaches—specifically, 9 out of the 20, sites S4, S6, E1, E3, E4, N2, N3, W4, and W6—displayed a rising slope gradient in the data collected. This trend suggested a noticeable expansion of the beachfront, with the shorelines advancing toward the sea over the course of the investigation. Such a seaward progression not only signified an increase in beach area but may also have reflected dynamic geomorphological processes at work, which could potentially be linked to sediment deposition rates, longshore drift, and other natural forces shaping the coastal environment. Compared to the ten previously mentioned beaches, those located to the south (S1, S2, S3, S4, S5) typically lacked the observed patterns of seasonal variation. Specifically, for S4 and S5, this trend was reversed, with beach expansion occurring during the winter and reduction occurring in the summer. Despite the stronger wave activity in the winter, the northerly wave direction did not favor onshore runup. Conversely, in the summer, even though the wave activity was weaker, the southerly wave direction could lead to significant onshore runup.
In contrast, W1, W2, W3, W5, S1, S2, and S3 exhibited a reduction in slope gradient over the decade-long period. Generally, the beaches located on the western and southern shores demonstrated a trend of erosion, whereas those situated in the northern and eastern regions predominantly showed a trend of accretion. This distinction in coastal behavior highlighted the varying impacts of environmental and possibly anthropogenic factors across different orientations of the coastline, influencing the long-term geomorphological changes and sediment dynamics of these areas.

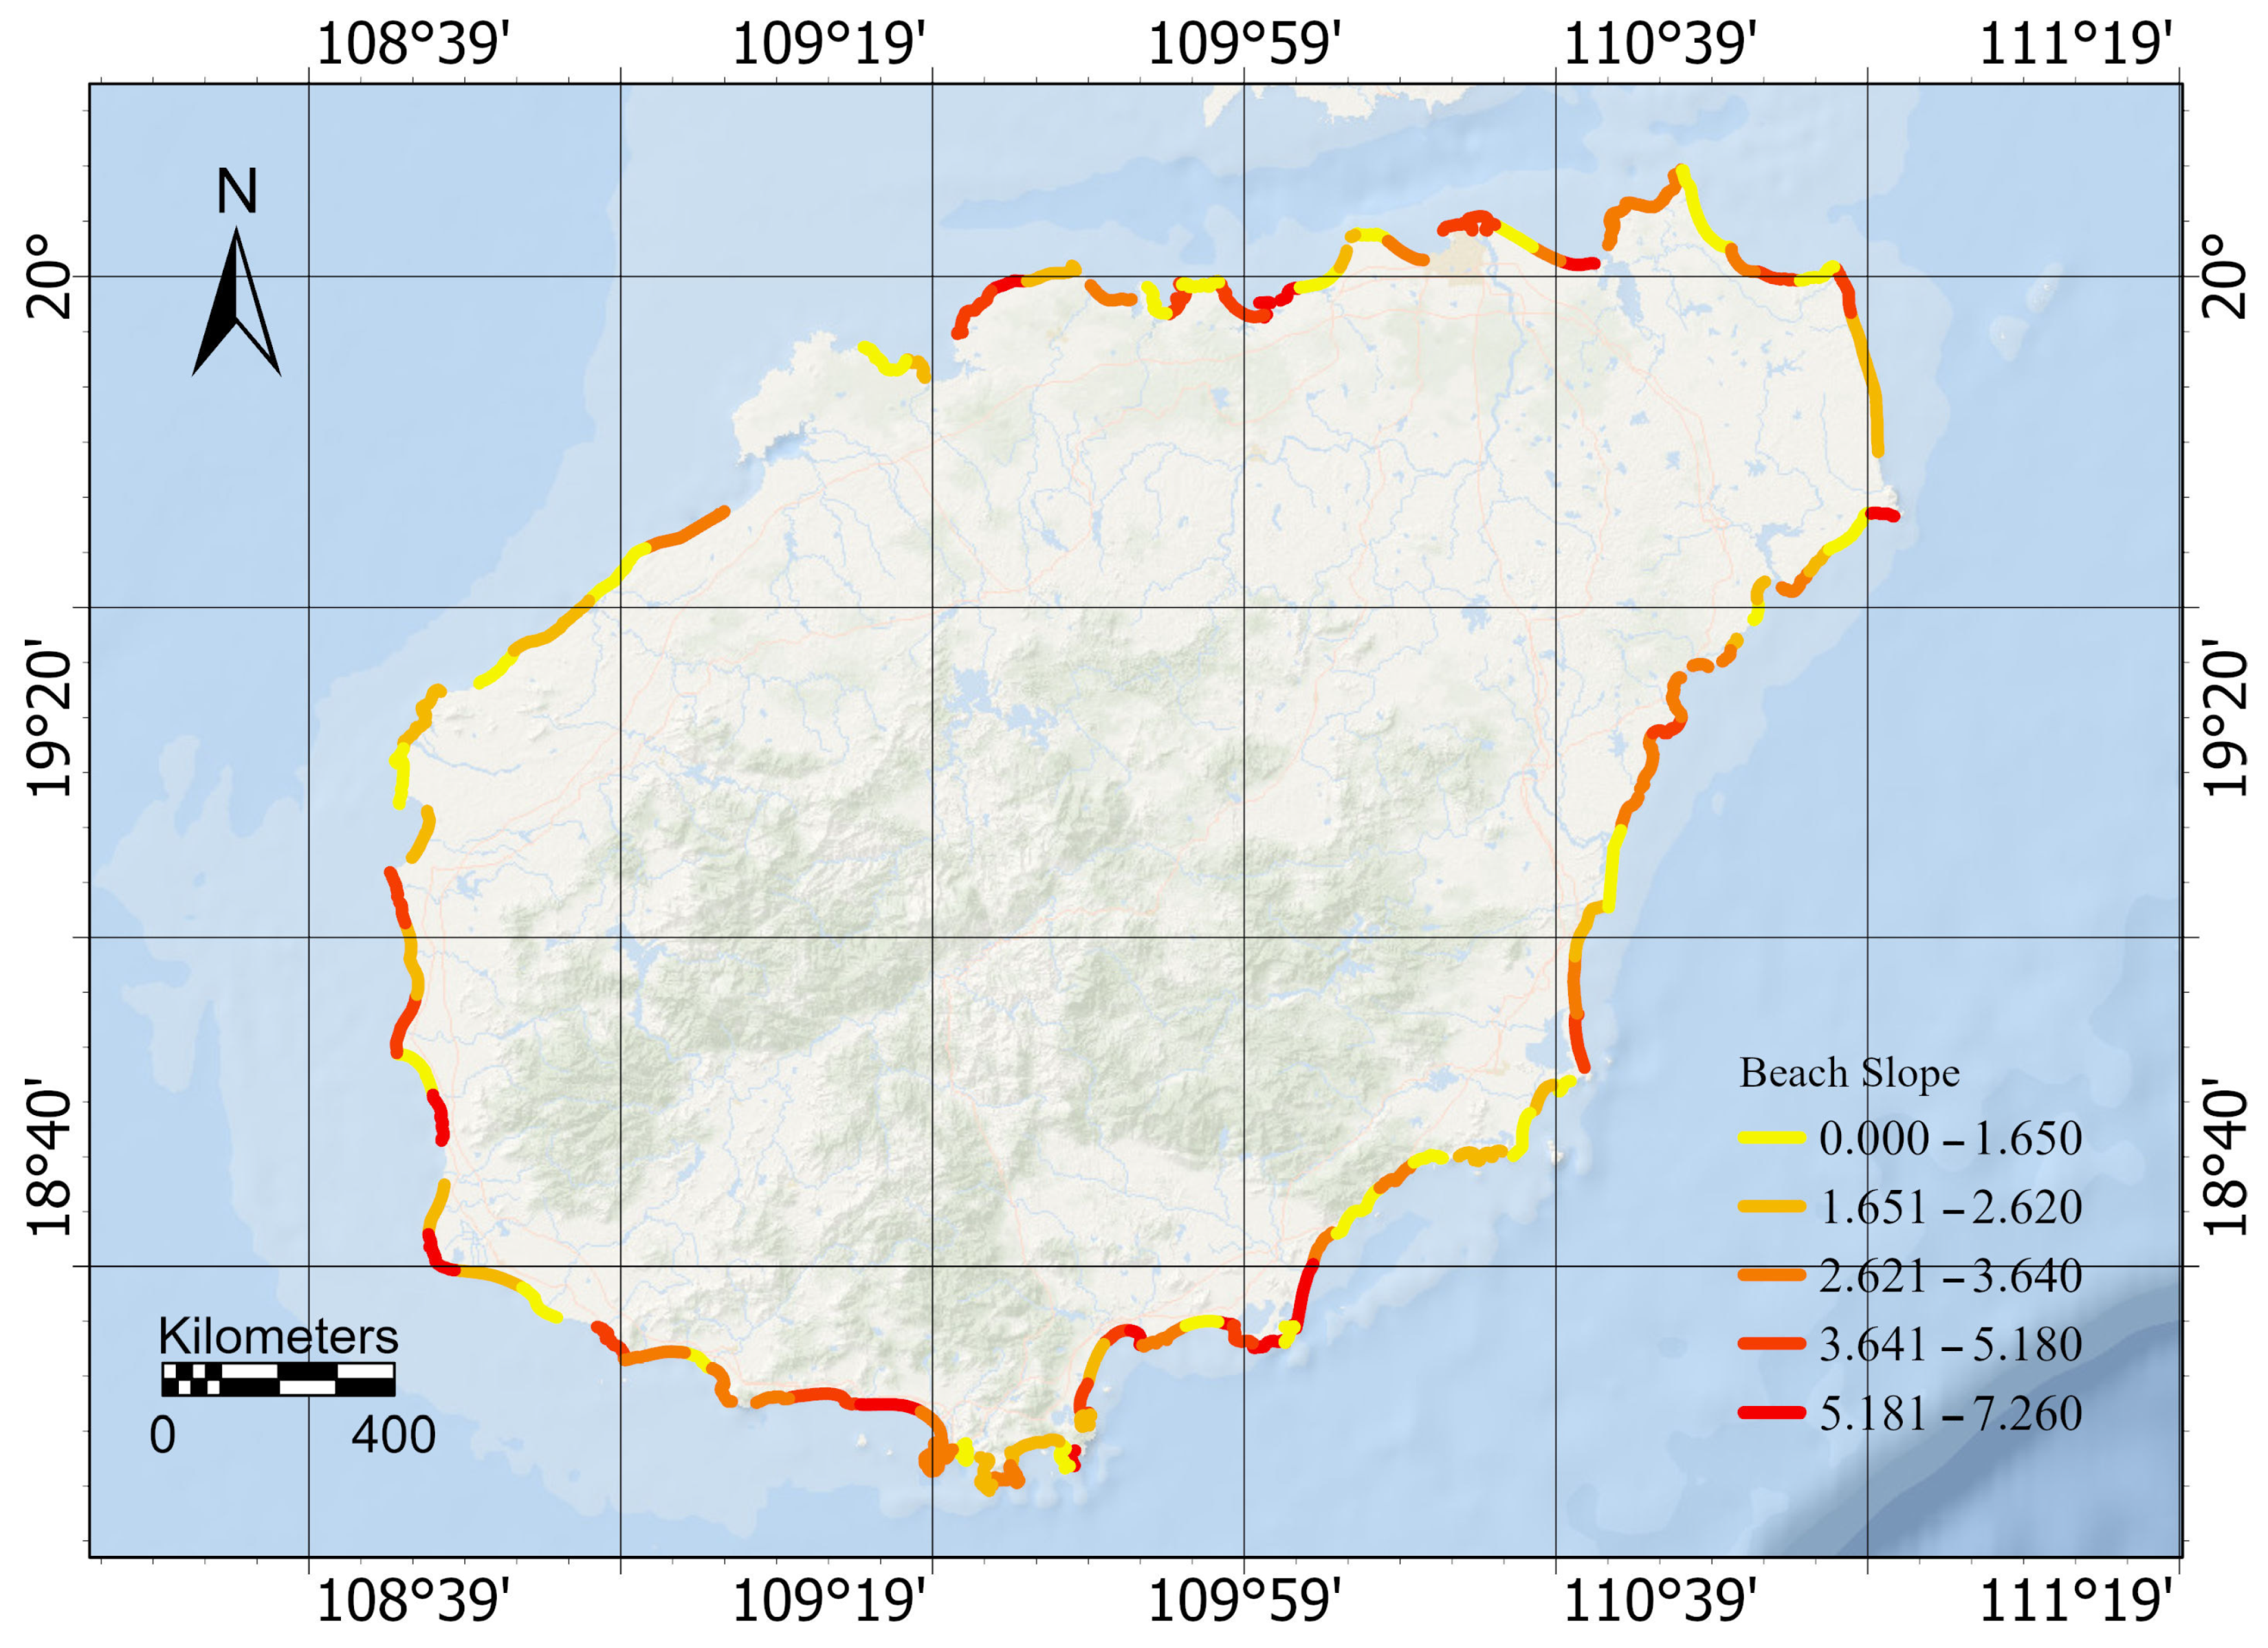
4.2. Beach Face Slopes

Taking the influence of diminished wave impacts into account, we chose shoreline data from 119 beaches surrounding Hainan Island for the period of July to August 2021. Each beach was analyzed with five cross-shore transects, amounting to a comprehensive total of 595 transects. To calculate the beach slopes, we utilized the instantaneous tidal level data of the coastlines, which were derived from satellite observations and simulated using FES2014 (Figure 10). The average slope of beaches in the eastern region of Hainan Island was 2.38°, that in the southern region was 3.48°, that in the western region was 2.75°, and that in the northern region was 2.80°. From the average slope of the beaches in each region, it can be seen that the overall slope of the beaches in the southern region was greater than that in other regions; it was also found that the steepness of the wave slope in the southern region was small, and the sediment in the sea was washed to the shore, resulting in a larger beach face slope. There were many headlands in the northern region, the waves and the tide level were greatly affected by the factors of the topography, and the slope changes of each beach were more pronounced.

5. Discussion

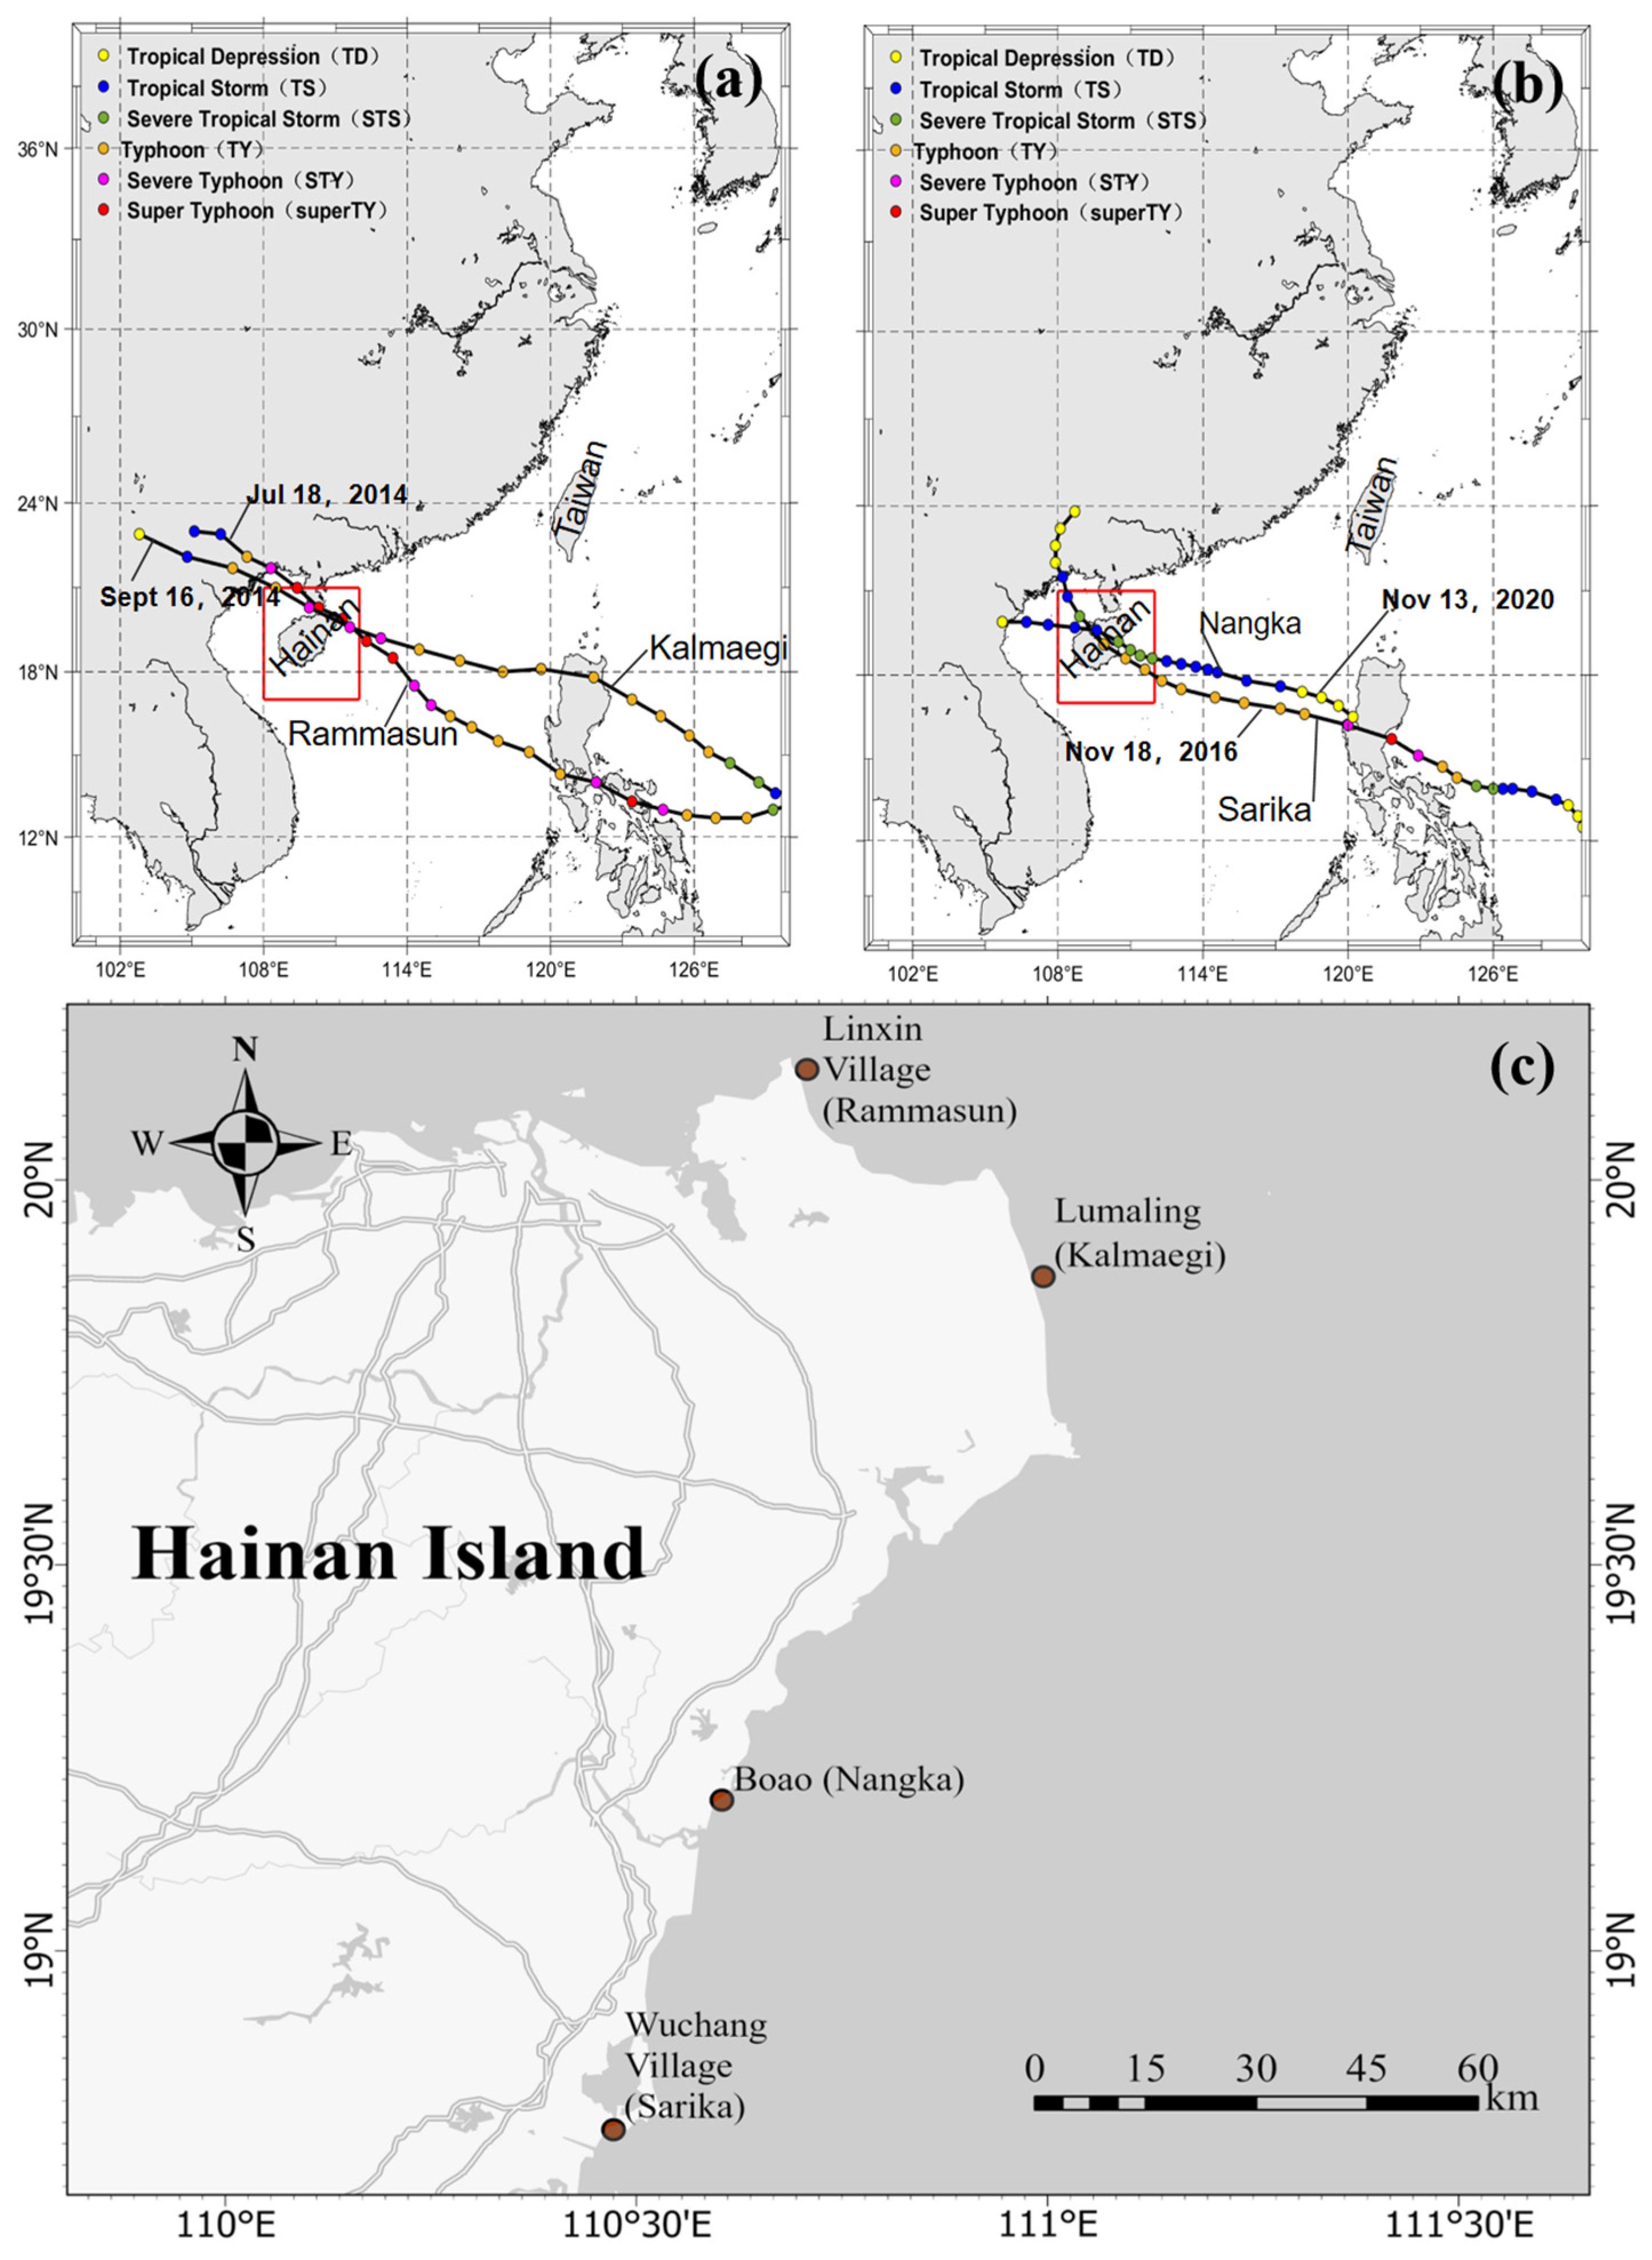
5.1. The Effects of Typhoons

To discuss the effects of typhoons on the evolution of beaches, our study focused on a selection of typhoons of various intensities originating from different areas that impacted Hainan Island. The typhoons analyzed in this research encompassed Typhoon Rammasun, a super typhoon that struck on 18 July 2014 (Figure 11a), Typhoon Kalmaegi, which was categorized as a severe typhoon that hit the island on 16 September 2014 (Figure 11a), Typhoon Sarika, another super typhoon that made landfall on 18 October 2016 (Figure 11b), and Typhoon Nangka, which was identified as a strong tropical storm that occurred in 2020 (Figure 11b). This selection allowed for a comprehensive understanding of how typhoons of differing magnitudes influenced the coastal morphology of Hainan Island.
Drawing from the specific timings and locations of typhoon occurrences, we gathered shoreline data from beaches in close proximity to the events (Figure 11c). For Typhoon Rammasun, we collected data from Linxin Village Beach; for Typhoon Kalmaegi, we collected data from Lumaling Beach; for Typhoon Sarika, we collected data from Wuchang Village Beach; for Typhoon Nangka, we collected data from Boao Beach. To assess the impacts of these typhoons on beach morphology, we compiled shoreline data spanning one year before and after each typhoon made landfall, allowing us to document and analyze the resultant changes in shoreline dynamics.
Typhoon Rammasun was a super typhoon that made landfall in Linxin Village, Wenchang on 18 July 2014, as shown in the red box in Figure 12a. The average retreat of the shoreline before and after the typhoon was 28 m, with transect 3 experiencing the greatest retreat of 50 m. In September 2014, there was a significant change in the shoreline, with an average retreat length of 48 m across the five sections. During this period, Super Typhoon Kalmaegi made landfall in Wenchang on September 16, as indicated by the red box in Figure 12b, causing noticeable shoreline erosion near Lumalin. The average erosion distance across four transects was 39 m, with transect 2 experiencing the greatest erosion of 43 m. In October 2020, Tropical Storm Nangka made landfall in Boao, Qionghai in October 2020, as indicated by the red box in Figure 12c, and there were no apparent signs of shoreline erosion due to the weak storm intensity. In mid-October 2016, as shown in Figure 12d, there was no significant shoreline retreat despite the landfall of Typhoon Salika in Wuchang Village.
While innovative methods offer promising alternatives for surveying shorelines, the paramount concerns of accuracy and reliability must be rigorously addressed. Prior to the implementation of new technological solutions, thorough validation and accuracy assessments are indispensable for ensuring their viability. In many instances, integrating various technologies and data sources into a unified shoreline mapping strategy may present a more viable approach. Despite the wealth of data accessible through satellite remote sensing, the intricate nature of certain landforms and smaller features necessitates the augmentation of satellite data with terrestrial observations or aerial surveillance to achieve precise identification and analysis.
The examination of shoreline data from different beaches before and after the occurrence of four specific typhoons revealed notable erosion consequences following extreme weather events. The extent of erosion was directly correlated with the intensity of the typhoon, with super typhoons causing significant shoreline recession. Interestingly, the most severe impacts on beaches were not always directly at the typhoon’s landfall location but could manifest more intensely within certain peripheral areas. Conversely, the effects of standard tropical storms on beach shorelines appeared to be minimal. It is critical to acknowledge that while satellite-derived shorelines offer insights into erosion events, they are limited by issues of timeliness and potential inaccuracies, thus providing only a general indication of erosion without precise quantification of its extent.
During the analytical process, the proximity of certain shorelines resulted in skewed slope calculations, which were compounded by data deficiencies that precluded slope determination for some areas. Consequently, out of the 132 beaches that were initially investigated, 13 beaches were unable to yield accurate slope measurements. This underscores the complexity of coastal analysis and the necessity of comprehensive methodologies that encompass both advanced technological tools and traditional observational techniques to ensure the thorough evaluation and management of coastal erosion and its multifaceted impacts.

5.2. Methodological and Academic Limitations

Despite its contributions to understanding coastal dynamics, the methodology employed encounters several inherent limitations and challenges that merit attention.
Firstly, the use of remote sensing, although advantageous for its broad coverage and historical data access, faces significant limitations in resolution that restrict our ability to accurately capture dynamic shoreline processes and small-scale coastal features. This is particularly challenging when attempting to discern transient phenomena such as those induced by abrupt weather events, indicating a pressing need for advancements in satellite technologies and data processing algorithms. The reliance on satellite imagery inherently introduces temporal and spatial gaps in the data. These gaps present substantial challenges in capturing the full extent of short-term coastal processes, such as the effects of storm surges on erosion and accretion patterns. Consequently, this may lead to potential underestimations or oversights in the analysis of shoreline dynamics.
Moreover, validating the accuracy of satellite-derived shoreline data against in-situ measurements is essential yet fraught with challenges. The scarcity of ground truth data, coupled with the temporal discrepancies between observed and satellite-derived shorelines, complicates validation efforts. The use of specific tools like the CoastSat and the FES2014 global tidal model for tidal corrections also introduces potential inaccuracies. The assumptions made by these tools may not be universally applicable across different coastal settings, potentially affecting the accuracy of our findings. Additionally, atmospheric conditions, such as cloud cover, pose further analytical challenges by impacting the quality of satellite data. Addressing these challenges is crucial for enhancing the reliability and precision of shoreline extraction methodologies.
Furthermore, although this research delves into the evolution of beaches over a decade, it lacks a comprehensive examination of the broader effects of climate change. The complexity added by factors such as sea level rise and increased frequency of extreme weather events underscores the need for integrated approaches that consider these environmental variables. The interpretation of seasonal variations is based on the assumption that the observed changes in shoreline positions are predominantly driven by natural processes such as wave energy variations. However, human activities—such as coastal engineering work, beach nourishment, and the construction of barriers—can also significantly affect shoreline dynamics. Our methodology might not fully account for these anthropogenic influences, potentially attributing changes to natural seasonal variations when, in fact, they may be partly the result of human intervention.

6. Conclusions

Hainan Island, which is positioned at the southernmost tip of China, is home to over a hundred natural beaches, which are predominantly sandy. These coastal areas face significant challenges due to frequent marine natural disasters and human-induced impacts, making the study of long-term beach dynamics crucial for preventing sediment loss, mitigating coastal hazards, enhancing coastal protection, and fostering the sustainable development and use of coastal zone resources. In this research, by utilizing CoastSat, shoreline data were extracted from 20 representative beaches around Hainan Island for the period from 2013 to 2023 and the slopes of 119 sandy beaches were calculated with the aim of understanding the patterns of beach evolution and distribution on the island.
This investigation leveraged multi-source remote sensing imagery alongside CoastSat to derive accurate data, and slope measurements for five selected beaches were compared and validated. The consistency between the calculated and actual distances affirmed the reliability of the slope measurements, despite minor anomalies being attributed to random topographical variations. This underscores CoastSat’s effectiveness in facilitating the study of Hainan Island’s beach evolution. Additionally, employing the FES2014 global tidal model to simulate tidal levels and make necessary tidal corrections led to coastlines more closely aligning with the mean shoreline. The minimized discrepancies between coastlines and the enhanced precision in overlapping demonstrate that CoastSat-derived coastline data can significantly support in-depth analyses of beach evolution, providing a robust foundation for comprehensive coastal management strategies.
The comprehensive analysis of temporal variations and shoreline changes across selected beaches on Hainan Island, as detailed through the examination of cross-shore transects and satellite-derived shoreline positions, revealed significant insights into coastal dynamics and geomorphological processes. The selected beaches exhibited significant temporal variations in shoreline positions, which were influenced by seasonal cycles and directional wave dynamics. Nearly half of the studied beaches showed an expansion trend, advancing towards the sea, which was indicative of geomorphological processes such as sediment deposition. This pattern was notably absent on southern beaches (S1, S2, S3, S4, S5), where the seasonal variations deviated, with some beaches expanding in winter and contracting in summer due to differing wave directions and their impacts on shoreline runup. Conversely, beaches on the western and southern shores experienced erosion, while those on the northern and eastern shores primarily saw accretion. These findings underline the complex interplay of natural forces and possibly human activities in shaping coastal landscapes over time. Understanding these mechanisms is vital for developing effective measures for mitigating the impacts of erosion and enhancing the resilience of coastal ecosystems against the backdrop of changing environmental conditions.
In addition, the slopes of 119 beaches around Hainan Island were calculated. Overall, the beaches in the southern part had relatively steeper slopes than those in the other regions. In the northern region, the wave and tidal influences in the estuary areas had a greater impact, leading to more noticeable variations in beach slopes. The impacts of typhoons of varying intensities on the evolution of beaches on Hainan Island were also discussed, focusing on significant events such as Typhoons Rammasun, Kalmaegi, Sarika, and Nangka. The study revealed that stronger typhoons caused notable shoreline retreats and erosion, with Typhoon Rammasun and Kalmaegi leading to significant morphological changes. Conversely, the less intense Typhoons Sarika and Nangka showed minimal impacts. These findings highlight the critical influence of typhoon intensity on coastal morphology and emphasize the importance of incorporating extreme weather event considerations into coastal management and preservation strategies.

Author Contributions

Conceptualization, R.Y. and S.C.; investigation, S.C., X.Z., H.Z. (Henzhenjia Zhang) and Y.H.; data curation, R.X., H.Z. (Hongsheng Zhang) and X.Z.; methodology, R.Y. and R.X.; validation, Y.H. and H.Z. (Henzhenjia Zhang); writing—original draft preparation, R.Y. and R.X.; writing—review and editing, S.C. and H.Z. (Hongsheng Zhang) All authors have read and agreed to the published version of the manuscript.

Funding

This research was funded by the National Natural Science Foundation of China (grant number 41906184), the Science and Technology Basic Resources Investigation Program of China (Grant No. 2022FY202404), and the National Natural Science Foundation of Fujian Province (2022J05156).

Data Availability Statement

The data used in this paper can be provided by Rui Yuan ([email protected]) upon request.

Acknowledgments

FES2014 was produced by NOVELTIS, LEGOS, CLS Space Oceanography Division, and CNES. It is distributed by AVISO, with support from CNES (http://www.aviso.altimetry.fr/, accessed on 1 August 2023). Several open-source toolboxes were used in this study, including CoastSat (https://github.com/mcuttler/CoastSat, accessed on 1 June 2023), and ChiPlot (https://www.chiplot.online/, accessed on 1 August 2023).

Conflicts of Interest

The authors declare no conflicts of interest.

References

  1. Armitage, D.; Johnson, D. Can resilience be reconciled with globalization and the increasingly complex conditions of resource degradation in Asian coastal regions? Ecol. Soc. 2006, 11, 2. [Google Scholar] [CrossRef]
  2. Muñoz, J.M.B. Progress of coastal management in Latin America and the Caribbean. Ocean Coast. Manag. 2020, 184, 105009. [Google Scholar] [CrossRef]
  3. Sheik Mujabar, P.; Chandrasekar, N. Coastal erosion hazard and vulnerability assessment for southern coastal Tamil Nadu of India by using remote sensing and GIS. Nat. Hazards 2013, 69, 1295–1314. [Google Scholar] [CrossRef]
  4. Thom, B.; Eliot, I.; Eliot, M.; Harvey, N.; Rissik, D.; Sharples, C.; Short, A.; Woodroffe, C. National sediment compartment framework for Australian coastal management. Ocean Coast. Manag. 2018, 154, 103–120. [Google Scholar] [CrossRef]
  5. Shameem, M.I.M.; Momtaz, S.; Rauscher, R. Vulnerability of rural livelihoods to multiple stressors: A case study from the southwest coastal region of Bangladesh. Ocean Coast. Manag. 2014, 102, 79–87. [Google Scholar] [CrossRef]
  6. Ward, N.D.; Megonigal, J.P.; Bond-Lamberty, B.; Bailey, V.L.; Butman, D.; Canuel, E.A.; Diefenderfer, H.; Ganju, N.K.; Goñi, M.A.; Graham, E.B.; et al. Representing the function and sensitivity of coastal interfaces in Earth system models. Nat. Commun. 2020, 11, 2458. [Google Scholar] [CrossRef] [PubMed]
  7. Yin, L.; Wang, L.; Keim, B.D.; Konsoer, K.; Yin, Z.; Liu, M.; Zheng, W. Spatial and wavelet analysis of precipitation and river discharge during operation of the Three Gorges Dam, China. Ecol. Indic. 2023, 154, 110837. [Google Scholar] [CrossRef]
  8. Dai, Z.; Li, X.; Lan, B. Three-dimensional modeling of tsunami waves triggered by submarine landslides based on the smoothed particle hydrodynamics method. J. Mar. Sci. Eng. 2023, 11, 2015. [Google Scholar] [CrossRef]
  9. Brown, A.C.; McLachlan, A. Sandy shore ecosystems and the threats facing them: Some predictions for the year 2025. Environ. Conserv. 2002, 29, 62–77. [Google Scholar] [CrossRef]
  10. Tanaka, N. Vegetation bioshields for tsunami mitigation: Review of effectiveness, limitations, construction, and sustainable management. Landsc. Ecol. Eng. 2009, 5, 71–79. [Google Scholar] [CrossRef]
  11. Hoggart, S.; Hanley, M.; Parker, D.; Simmonds, D.; Bilton, D.; Filipova-Marinova, M.; Franklin, E.; Kotsev, I.; Penning-Rowsell, E.; Rundle, S.; et al. The consequences of doing nothing: The effects of seawater flooding on coastal zones. Coast. Eng. 2014, 87, 169–182. [Google Scholar] [CrossRef]
  12. Lantuit, H.; Overduin, P.P.; Couture, N.; Wetterich, S.; Aré, F.; Atkinson, D.; Brown, J.; Cherkashov, G.; Drozdov, D.; Forbes, D.L.; et al. The Arctic coastal dynamics database: A new classification scheme and statistics on Arctic permafrost shorelines. Estuaries Coasts 2012, 35, 383–400. [Google Scholar] [CrossRef]
  13. Morton, R.A.; Leach, M.P.; Paine, J.G.; Cardoza, M.A. Monitoring beach changes using GPS surveying techniques. J. Coast. Res. 1993, 9, 702–720. [Google Scholar]
  14. Zimmerman, T.; Jansen, K.; Miller, J. Analysis of UAS flight altitude and ground control point parameters on DEM accuracy along a complex, developed shoreline. Remote Sens. 2020, 12, 2305. [Google Scholar] [CrossRef]
  15. Moore, L.J. Shoreline mapping techniques. J. Coast. Res. 2000, 16, 111–124. [Google Scholar]
  16. Yermolaev, O.; Usmanov, B.; Gafurov, A.; Poesen, J.; Vedeneeva, E.; Lisetskii, F.; Nicu, I.C. Assessment of shoreline transformation rates and landslide monitoring on the bank of Kuibyshev reservoir (Russia) using multi-source data. Remote Sens. 2021, 13, 4214. [Google Scholar] [CrossRef]
  17. Roca, M.; Navarro, G.; García-Sanabria, J.; Caballero, I. Monitoring sand spit variability using Sentinel-2 and Google Earth Engine in a Mediterranean estuary. Remote Sens. 2022, 14, 2345. [Google Scholar] [CrossRef]
  18. Adebisi, N.; Balogun, A.L.; Mahdianpari, M.; Min, T.H. Assessing the impacts of rising sea level on coastal morpho-dynamics with automated high-frequency shoreline mapping using multi-sensor optical satellites. Remote Sens. 2021, 13, 3587. [Google Scholar] [CrossRef]
  19. Dai, C.; Howat, I.M.; Larour, E.; Husby, E. Coastline extraction from repeat high resolution satellite imagery. Remote Sens. Environ. 2019, 229, 260–270. [Google Scholar] [CrossRef]
  20. Rasuly, A.; Naghdifar, R.; Rasoli, M. Monitoring of Caspian Sea shoreline changes using object-oriented techniques. Procedia Environ. Sci. 2010, 2, 416–426. [Google Scholar] [CrossRef]
  21. Toure, S.; Diop, O.; Kpalma, K.; Maiga, A.S. Shoreline detection using optical remote sensing: A review. ISPRS Int. J. Geo-Inf. 2019, 8, 75. [Google Scholar] [CrossRef]
  22. Vitousek, S.; Buscombe, D.; Vos, K.; Barnard, P.L.; Ritchie, A.C.; Warrick, J.A. The future of coastal monitoring through satellite remote sensing. Camb. Prism. Coast. Futures 2023, 1, e10. [Google Scholar] [CrossRef]
  23. Yin, L.; Wang, L.; Li, T.; Lu, S.; Tian, J.; Yin, Z.; Li, X.; Zheng, W. U-Net-LSTM: Time Series-Enhanced Lake Boundary Prediction Model. Land 2023, 12, 1859. [Google Scholar] [CrossRef]
  24. Murray, J.; Adam, E.; Woodborne, S.; Miller, D.; Xulu, S.; Evans, M. Monitoring shoreline changes along the southwestern coast of South Africa from 1937 to 2020 using varied remote sensing data and approaches. Remote Sens. 2023, 15, 317. [Google Scholar] [CrossRef]
  25. Arjasakusuma, S.; Kusuma, S.S.; Saringatin, S.; Wicaksono, P.; Mutaqin, B.W.; Rafif, R. Shoreline dynamics in East Java Province, Indonesia, from 2000 to 2019 using multi-sensor remote sensing data. Land 2021, 10, 100. [Google Scholar] [CrossRef]
  26. Wang, Y.; Shi, B.; Zhang, L.; Jia, J.; Xia, X.; Zhou, L.; Yu, R.; Yang, Y.; Gao, J. Assessing the vulnerability of changing coasts, Hainan Island, China. Acta Oceanol. Sin. 2017, 36, 114–120. [Google Scholar] [CrossRef]
  27. Su, Q.; Li, Z.; Li, G.; Zhu, D.; Hu, P. Coastal erosion risk assessment of Hainan Island, China. Acta Oceanol. Sin. 2023, 42, 79–90. [Google Scholar] [CrossRef]
  28. Chen, H.; Li, D.; Chen, Y.; Zhao, Z. Spatial–temporal evolution monitoring and ecological risk assessment of coastal wetlands on Hainan Island, China. Remote Sens. 2023, 15, 1035. [Google Scholar] [CrossRef]
  29. Zhou, L.; Yang, Y.; Li, G.; Tong, C. OSL dating of coastal dunes on the southeastern coast of Hainan Island, China. Front. Mar. Sci. 2023, 10, 1165551. [Google Scholar] [CrossRef]
  30. Bai, P.; Yang, J.; Zhang, S.; Xie, L.; Wu, J. Upwelling off the west coast of Hainan Island: Sensitivity to wave-mixing. Acta Oceanol. Sin. 2019, 38, 11–19. [Google Scholar] [CrossRef]
  31. Lyard, F.H.; Allain, D.J.; Cancet, M.; Carrère, L.; Picot, N. FES2014 global ocean tide atlas: Design and performance. Ocean Sci. 2021, 17, 615–649. [Google Scholar] [CrossRef]
  32. Kanwal, S.; Ding, X.; Sajjad, M.; Abbas, S. Three decades of coastal changes in Sindh, Pakistan (1989–2018): A geospatial assessment. Remote Sens. 2019, 12, 8. [Google Scholar] [CrossRef]
  33. Bishop-Taylor, R.; Nanson, R.; Sagar, S.; Lymburner, L. Mapping Australia’s dynamic shoreline at mean sea level using three decades of Landsat imagery. Remote Sens. Environ. 2021, 267, 112734. [Google Scholar] [CrossRef]
  34. Vos, K.; Splinter, K.D.; Harley, M.D.; Simmons, J.A.; Turner, I.L. CoastSat: A Google Earth Engine-enabled Python toolkit to extract shorelines from publicly available satellite imagery. Environ. Model. Softw. 2021, 122, 104528. [Google Scholar] [CrossRef]
  35. Vos, K.; Harley, M.D.; Splinter, K.D.; Walker, A.; Turner, I.L. Beach slopes from satellite-derived shorelines. Geophys. Res. Lett. 2020, 47, e2020GL088365. [Google Scholar] [CrossRef]
  36. Castelle, B.; Masselink, G.; Scott, T.; Stokes, C.; Konstantinou, A.; Marieu, V.; Bujan, S. Satellite-derived shoreline detection at a high-energy meso-macrotidal beach. Geomorphology 2021, 383, 107707. [Google Scholar] [CrossRef]
  37. Yuan, R.; Xu, R.; Zhang, H.; Qiu, C.; Zhu, J. Satellite-Derived Indicators of Drought Severity and Water Storage in Estuarine Reservoirs: A Case Study of Qingcaosha Reservoir, China. Remote Sens. 2024, 16, 980. [Google Scholar] [CrossRef]
  38. Yuan, R.; Zhang, H.; Qiu, C.; Wang, Y.; Guo, X.; Wang, Y.; Chen, S. Mapping morphodynamic variabilities of a meso-tidal flat in Shanghai based on satellite-derived data. Remote Sens. 2022, 14, 4123. [Google Scholar] [CrossRef]
  39. Vos, K.; Harley, M.D.; Splinter, K.D.; Simmons, J.A.; Turner, I.L. Sub-annual to multi-decadal shoreline variability from publicly available satellite imagery. Coast. Eng. 2019, 150, 160–174. [Google Scholar] [CrossRef]
  40. Zhong, X.; Dong, P.; Chen, S. Large-scale shoreline undulations and role of self-organization processes. Curr. Sci. 2018, 115, 729–738. [Google Scholar] [CrossRef]
  41. Stockdon, H.; Holman, R.; Howd, P.; Sallenger, A. Empirical parameterization of setup, swash, and runup. Coast. Eng. 2006, 53, 573–588. [Google Scholar] [CrossRef]
Figure 1. Location of (a) Hainan Island, with the study area depicted by the red box. (b) Distribution of the locations of beaches selected for this study, which are indicated by red triangles.
Water 16 01034 g001
Figure 2. The amount of shoreline data extracted from 20 typical beaches around Hainan Island. Refer to Figure 1 for the locations of the beaches.
Water 16 01034 g002
Figure 3. (AL) display the average monthly wave height and direction from January to December. (M) presents the average monthly wave height of the four cardinal offshore directions of Hainan Island: South (S), West (W), North (N), and East (E).
Water 16 01034 g003
Figure 4. Diagram of the workflow of this study.
Water 16 01034 g004
Figure 5. (a) Tidal levels at Wanning derived from FES2014; the marked points correspond to the moments when satellite images for validation were obtained. (b) Locations of monitored beach profiles collected in 2017 with a spatial resolution of 2 m along the profile direction (blue dots) and three shorelines (red lines) in close proximity to each other. (c) Comparison between the measured beach slopes obtained from different profiles and the reconstructed data considering the water level and shoreline.
Water 16 01034 g005
Figure 6. Shoreline dynamics on the selected beaches (N1 to N3, W1 to W6) from 2013 to 2023. Each panel highlights different behaviors of the shoreline over time. For instance, panels show a shoreline that has extended seaward (more red lines towards the sea), this suggests accretion in those areas. Conversely, if the red lines retract landward, this indicates erosion.
Water 16 01034 g006
Figure 7. Shoreline dynamics on the selected beaches (S1 to S6, E1 to E5) from 2013 to 2023. Each panel highlights different behaviors of the shoreline over time. For instance, panels show a shoreline that has extended seaward (more red lines towards the sea), this suggests accretion in those areas. Conversely, if the red lines retract landward, this indicates erosion.
Water 16 01034 g007
Figure 8. Shoreline position variations of the beaches on the northern and western shores (for the positions, see Figure 1). The black dashed line represents the trend fit, while the red solid line portrays the low-pass-filtered result. A positive value indicates a beach profile wider than the average and vice versa.
Water 16 01034 g008
Figure 9. Shoreline position variations of the beaches on the southern and eastern shores (for the positions, see Figure 1). The black dashed line represents the trend fit, while the red solid line portrays the low-pass-filtered result. A positive value indicates a beach profile wider than the average and vice versa.
Water 16 01034 g009
Figure 10. Beach slopes around Hainan Island.
Water 16 01034 g010
Figure 11. (a) Track charts of Typhoon Rammasun (1409) and Kalmaegi (1415); (b) track charts of Typhoon Sarika (1621) and Tropical Storm Nangka (2008). (c) Landfall locations of the different typhoons.
Water 16 01034 g011
Figure 12. Transect-based shoreline variations following typhoon landfalls. (a) For Typhoon Rammasun, we collected data from Linxin Village Beach; (b) for Typhoon Kalmaegi, we collected data from Lumaling Beach; (c) for Typhoon Nangka, we collected data from Boao Beach; (d) for Typhoon Sarika, we collected data from Wuchang Village Beach.
Water 16 01034 g012
Disclaimer/Publisher’s Note: The statements, opinions and data contained in all publications are solely those of the individual author(s) and contributor(s) and not of MDPI and/or the editor(s). MDPI and/or the editor(s) disclaim responsibility for any injury to people or property resulting from any ideas, methods, instructions or products referred to in the content.

