1. Introduction
With China’s strategic emphasis on becoming a maritime power, the marine economy has emerged as a crucial driver of global economic expansion. This strategy advocates for a sustainable blue economy, highlighting the importance of marine ecological preservation alongside economic advancement. Yet, the evolution of globalization presents dual challenges. On one side, reliance on expansive development and the adverse effects of climate change-induced marine disasters have significantly compromised marine ecological integrity, hindering sustainable progress. On the other hand, mounting global uncertainties, including economic trade tensions and geopolitical disputes, have markedly decelerated marine economic growth. Within this global scenario, bolstering the blue economy’s resilience and enhancing its network cohesion to effectively navigate and thrive amid crises and volatility are paramount. Achieving this goal necessitates comprehensive policy coordination, innovation in science and technology, and market integration on a global scale. Moreover, it entails a delicate balancing act between marine ecological conservation and economic expansion, aiming to elevate the global marine economy’s quality of development and stimulate new momentum and pathways for worldwide economic growth.
The term “blue economy” gained prominence during a 2012 US Senate hearing, symbolizing the United States’ commitment to leveraging this strategy as a pivotal element in solidifying their maritime dominance. At its heart, this strategy seeks a harmonious balance between economic advancement and the safeguarding of marine ecosystems, aspiring towards a marine economic framework which fosters both growth and ecological preservation (Griggs et al., 2013) [
1]. The World Bank’s interpretation of the blue economy underscores the critical role of sustainable marine resource utilization in spurring economic growth, enhancing livelihoods, and securing employment, all while preserving marine ecosystems’ health (World Bank, 2017) [
2]. Furthermore, Voyer et al. (2018) offer a comprehensive examination of the blue economy through the lenses of marine ecological resources, livelihoods, commerce, and innovation, contributing valuable insights to marine governance [
3]. Despite these advancements, there remains a noticeable gap in geospatial research within the blue economy sphere. Doloreux (2017) [
4] delves into marine agglomeration perspectives, whereas Garland et al. (2019) review the pertinent literature to delineate the blue economy’s geographical dimensions, thereby facilitating further academic exploration in this arena [
5].
The scope of blue economy research has broadened significantly in recent years, extending its reach from Europe and North America to embrace East Asia (Ebarvia, 2016 [
6]), South Asia (Humayun, 2014 [
7]; Sarker, 2018 [
8]), and Southeast Asia (Sarker, 2018 [
9]). This expansion not only underscores the growing global interest in the blue economy but also highlights the distinct challenges and opportunities that different regions encounter in fostering its growth. In China, the “maritime power strategy” has elevated the blue economy to a pivotal role in the nation’s economic reform and pursuit of high-quality development, particularly in coastal regions. The development and refinement of a resilience network for the blue economy is seen as a crucial strategy for enhancing regional economic quality and navigating global adversities. An examination of the development traits of China’s coastal blue economy resilience network and its determinants offers valuable insights to other nations and regions aiming to advance the sustainable growth of the global blue economy.
Recent scholarly work has delved deeply into the domain of economic resilience, offering valuable perspectives on mitigating the negative impacts of risk shocks on economic frameworks [
10,
11,
12,
13,
14]. These investigations encompass a broad spectrum of economic systems, extending beyond terrestrial economies to increasingly encompass maritime domains, underscoring the escalating emphasis on the resilience of marine economies. The resilience of marine economies has emerged as a critical area of inquiry, paralleling the global shift towards sustainable marine resource utilization. Zhu et al. (2021) investigated the interplay between the resilience and efficiency of marine economies, employing a marine economy-specific resilience index derived from the marine GDP. This approach unveils novel insights into the marine economy’s adaptive capabilities against external perturbations [
15]. Furthermore, Wang & Wang (2019) developed a comprehensive resilience evaluation framework for marine economies, incorporating elements of robustness, recovery, reorganization, and renewal. This framework serves as a tool for assessing the marine economy’s overall capacity to navigate diverse challenges [
16]. Additionally, Wu & Li (2022) applied the entropy weight method to assess the resilience of China’s marine economy, examining its spatial and temporal progression. Their findings not only highlight the regional disparities in China’s marine economic resilience but also offer a scientific foundation for informed policymaking [
17].
The advancements in these research endeavors underscore that the exploration of marine economic resilience has emerged as a pivotal intersection of environmental transformation, economic progression, and societal welfare. Through the development and application of varied resilience assessment metrics, scholars have been able to pinpoint critical factors influencing marine economic resilience. This includes evaluating the marine economy’s resistance, recuperation, and adaptability to external disturbances, thereby offering both theoretical insights and practical guidance to foster the sustainable advancement of the marine economy. Moreover, as global marine economic activities escalate and the exploitation of marine resources intensifies, the study of marine economic resilience is poised to make a significant contribution. It aims to enhance our comprehension and fortification of the marine economic system’s stability and sustainability, marking a crucial step towards a balanced integration of ecological conservation and economic development.
The existing scholars on this subject has predominantly concentrated on delineating the conceptual framework and gauging the extent of the blue economy or its resilience, seldom intertwining the two to delve into the determinants impacting the blue economy’s resilience. Notably absent are cross-sectional analyses exploring developmental variances within the blue economy across coastal areas, alongside a marked scarcity in discourse adopting a network-centric viewpoint. Thus, the unique contributions of this article are illuminated through three primary dimensions. Firstly, by amalgamating the principles of the blue economy with those of resilience, this investigation meticulously charts the interaction between maritime and land-based dynamics, crafting a layered evaluative framework for the blue economy’s resilience which spans systemic, dimensional, and indicator levels. This elaborate framework captures the core elements of the blue economy while thoroughly addressing the complex essence of resilience, thereby enriching the marine economy’s appraisal with a more comprehensive and insightful exploration. Secondly, leveraging social network analysis, this study probes the structural nuances of China’s blue economy resilience network, conducting both longitudinal and latitudinal assessments of resilience within diverse marine economic zones. This methodological progression furnishes a novel perspective and analytical toolset for unraveling the evolving dynamics within the blue economy’s resilience network, enhancing our comprehension and strategic augmentation of sustainable marine economic frameworks. Thirdly, by employing the time-varying effect random graph model (TERGM), this research reveals the structural evolution and driving forces behind China’s blue economy resilience network, offering a solid foundation of empirical evidence for subsequent inquiries, grounded in data integrity.
The architecture of this study is meticulously organized, presenting a clear and logical progression. The
Section 2 introduces the theoretical foundations. In the
Section 3, this paper delineates its research design, elaborating on the methodologies and data sources employed, thereby laying a solid foundation and offering a transparent framework for its readers. The
Section 4 employs a statistical analysis to map out the resilience characteristics and distribution patterns of China’s blue economy, highlighting regional disparities and specific resilience trends across different locales. The
Section 5 delves into a comprehensive analysis of the social network underpinning the blue economy’s resilience, crafting a detailed portrait of the network’s evolution through the examination of individual, overall, and spatial structural dynamics. In the
Section 6, this study leverages the time-varying effect random graph model (TERGM) to intensify the investigation into the drivers influencing the dynamics of China’s blue economy resilience network, offering a scientific elucidation of the pivotal factors and mechanisms at play. The concluding
Section 6 encapsulates the research findings and, drawing upon these insights, proposes nuanced policy recommendations aimed at fostering the synergistic advancement of blue economy resilience in China’s coastal regions alongside the high-quality development of the marine economy. This comprehensive approach not only illuminates the intricacies of marine economic resilience but also charts a path forward for sustainable and robust development within this critical sector. In the
Section 7 analyzes China’s coastal blue economy’s resilience from 2007 to 2019, highlighting fluctuating growth due to technological advancements and regional imbalances, with recommendations for optimizing network structure and enhancing ecological protection for sustainable development.
The distinctive value of this study is rooted in its novel research perspective and methodological approach. It introduces a fresh theoretical framework and analytical instruments for assessing and dissecting the resilience of the blue economy, extending beyond theoretical contributions to offer empirically grounded policy recommendations. These insights are aimed at aiding policymakers in fostering the sustainable progression and holistic management of the marine economy. By delving into the structure and dynamics of the blue economy’s resilience network, this paper significantly augments the corpus of marine economics and resilience economics. Its contributions bear substantial theoretical and practical relevance, providing a robust foundation for guiding the high-quality advancement of the global marine economy. This blend of innovative analysis and practical application underscores this study’s pivotal role in navigating the complexities of marine economic sustainability and resilience, marking a significant stride toward informed and effective economic policy and management in the marine sector.
2. Theoretical Foundations
2.1. Adaptive Theory
Adaptive theory, emerging from global climate governance [
18], offers a nuanced lens for examining economic systems through the prism of resilience and adaptability. This theory is instrumental in dissecting a system’s ability to respond to environmental shocks, self-regulate, and undergo innovative transformations. The cyclical model of system evolution—comprising exploitation, conservation, release, and reorganization stages [
19]—provides a robust framework for understanding the dynamic interplay between economic activities and marine ecosystems within the blue economy. By situating economic systems as entities subject to adaptive processes and environmental systems as the adaptation’s target, this theory underscores the necessity of harmonious co-evolution for sustainable marine development [
20,
21,
22]. The incorporation of adaptive theory into blue economy research highlights the potential for resilience through adaptive management strategies, emphasizing the importance of responsive governance, regulatory frameworks, and innovation in fostering economic and environmental sustainability.
2.2. Vulnerability Theory
Vulnerability theory has expanded from its roots in natural disaster prevention [
23] to become a cornerstone in economic resilience and sustainable science discourse. Within the context of the blue economy, this theory elucidates the dual nature of systems’ attributes in terms of vulnerability and resilience. Vulnerability exposes a system’s fragilities against external shocks, while resilience encompasses a system’s inherent capacity for self-reorganization and controlled transformation post shock [
24]. Applying vulnerability theory to the blue economy illuminates the critical need for strategies that mitigate vulnerabilities through enhanced resilience, thus ensuring the marine economy’s stability and sustainability in the face of environmental and economic perturbations.
2.3. Theory of Creative Destruction
Schumpeter’s theory of creative destruction [
25] elucidates the pivotal role of innovation in economic renewal and growth. It posits that economic development is propelled by the cyclical process of innovation, leading to the disruption of old structures and the creation of new growth avenues. This theory’s application to the blue economy suggests that external shocks, rather than solely having detrimental effects, can serve as catalysts for innovation and structural transformation, thereby opening new paths for economic development within marine sectors [
26]. Creative destruction becomes an essential mechanism for resilience, driving the blue economy towards sustainable practices and innovative solutions which address both economic and environmental challenges.
2.4. Regional Economic Resilience Theory
The concept of regional economic resilience, integral to regional economics, offers valuable insights into the resilience of the blue economy. This theory focuses on the capacity of regional economic systems to resist, recover from, and adjust to external shocks. Resilience, in this context, emerges not as a reaction to external shocks but as a characteristic inherent to a regional economic system, shaped by its internal structure and dynamics [
27,
28,
29]. Applying regional economic resilience theory to the blue economy emphasizes the significance of understanding regional disparities and strengths in marine economic activities. It advocates for a tailored approach to enhancing the resilience of marine economies by leveraging local advantages, fostering innovation, and strengthening regional cooperation and connectivity. This perspective encourages a nuanced analysis of marine economic systems, highlighting the role of spatial dynamics, regional policies, and community engagement in building a resilient blue economy.
2.5. Integrated Theoretical Analysis of the Blue Economy
- (1)
Adaptive Theory and the Blue Economy
Adaptive theory highlights the cyclical nature of economic and environmental systems, emphasizing the necessity for the blue economy to continually adapt to changing marine conditions, regulatory frameworks, and technological advancements. This theory underscores the importance of adaptability in ensuring the sustainability of marine economic activities, suggesting that the blue economy’s resilience can be enhanced through adaptive management practices which anticipate and respond to environmental and economic shocks. By fostering an environment conducive to innovation and flexibility, the blue economy can evolve in harmony with marine ecosystems, ensuring long-term sustainability.
- (2)
Vulnerability Theory’s Implications for the Blue Economy
Vulnerability theory brings to light the inherent susceptibilities within the blue economy, urging stakeholders to recognize and address these vulnerabilities to prevent systemic collapses in the face of external shocks. It suggests that a deep understanding of these vulnerabilities, combined with proactive resilience-building measures, can transform potential weaknesses into strengths. For the blue economy, this means not only safeguarding against environmental degradation and market fluctuations but also building a robust framework that supports economic stability, environmental conservation, and community well-being.
- (3)
The Role of Creative Destruction in the Blue Economy
The theory of creative destruction offers an optimistic perspective on the role of innovation and structural transformation within the blue economy. It posits that disruptions, whether from technological breakthroughs, policy shifts, or environmental crises, can serve as catalysts for renewing and strengthening marine economic systems. By embracing innovation and the restructuring of marine industries, the blue economy can generate new growth opportunities that align with sustainable practices, thus fostering a resilient economic structure which is better equipped to handle future challenges.
- (4)
Regional Economic Resilience and the Blue Economy
Regional economic resilience theory emphasizes the importance of localized strategies in enhancing the overall resilience of the blue economy. It recognizes that regions have unique economic structures, resource endowments, and environmental challenges that require tailored approaches to resilience building. By leveraging regional strengths and fostering inter-regional collaboration, the blue economy can enhance its capacity to withstand and recover from shocks, ensuring equitable growth and sustainability across different marine economic zones. This approach calls for integrated policies that consider the diverse needs and potentials of regions within the blue economy, encouraging innovation and investment in areas most likely to drive sustainable growth.
The integration of these theoretical perspectives offers a comprehensive understanding of the complexities and dynamics of the blue economy. It highlights the importance of adaptability, vulnerability mitigation, innovation, and regionalized strategies in building a resilient and sustainable blue economy. By drawing on insights from these theories, policymakers, researchers, and practitioners can develop more effective frameworks for managing marine resources, fostering economic growth, and ensuring environmental sustainability within the context of global and regional challenges.
4. Evaluation Results of the Resilience of the Blue Economy
This paper, through constructing violin plots of blue economy resilience in coastal areas from 2007 to 2019 (
Figure 2), aims to more intuitively display the statistical characteristics and distribution density of the blue economy’s resilience in coastal regions. A violin plot is a combination of a box plot and a kernel density plot. The white dot in the plot represents the median of blue economy resilience, useful for comparing the average level of blue economy resilience across regions. The inner black box’s upper and lower sides represent the upper and lower quartiles, respectively; a position higher up indicates an upward trend in resilience for that region. The length of the outer violin shell reflects the range of data fluctuation during the study period, with longer lengths indicating a broader range of fluctuation. The width of the outer violin shell reflects the probability density (i.e., kernel density) of the data distribution, with wider shells indicating a more concentrated distribution.
Overall, the resilience of the blue economy in China’s coastal regions has grown amidst fluctuations. The continuously expanding scale of the marine economy, the increasingly optimized marine industrial structure, the steadily enhanced marine scientific and technological strength, and more proactive marine environmental responses have strengthened the growth and recovery capabilities, control and transformation capabilities, and adaptability and adjustment abilities of the blue economy. However, due to the imbalance in the development foundation and differences in the development positioning of the marine economy, there is a significant gap in the blue economy’s resilience among provinces, with issues of uneven and insufficient growth still present.
Specifically, within the northern marine economic circle, Shandong’s blue economy resilience median is higher than 0.3, significantly above other regions, and its violin plot length is longer, with the black box positioned higher up. This indicates that the region has a high level of blue economy resilience and a fast improvement rate. The kernel density curves for Liaoning, Tianjin, and Shandong are all “single-peaked”, whereas Hebei’s blue economy resilience level is far below that of other regions, with a “double-peaked” kernel density curve, indicating low and unstable resilience levels. The possible reason for this is Hebei’s smaller marine economy scale, its marine industry still being in a more extensive development stage, and its insufficient marine innovation capabilities, resulting in lower scores for Hebei in terms of growth and recovery, control, and transformation capabilities. In the eastern marine economic circle, Shanghai’s blue economy resilience median ranges between 0.25 and 0.3, slightly higher than in the area of Jiangsu–Zhejiang. Although the outer violin shell length is long, the inner black box is positioned lower, indicating a general downward trend in Shanghai’s blue economy resilience. High-intensity socio-economic activities have increased marine ecological pressure, coupled with frequent marine disasters in recent years, leading to reduced scores in terms of resistance and resilience capabilities for regions like Shanghai. In the southern marine economic circle, Guangdong’s blue economy resilience median is close to 0.4, significantly higher than Fujian, Guangxi, and Hainan. The latter three have their medians and black boxes positioned very low, with “single-peaked” kernel density distributions. Although the southern marine economic circle is known for its rich marine resources, there is still a significant development space. Apart from Guangdong, the scale of marine economic development in these areas is far lower than that of other regions in the same period, indicating a heavy task in developing the blue economy in the southern marine economic circle.
5. Social Network Analysis
5.1. Characteristics of Individual Network Structure
This study meticulously applies the principle of temporal symmetry to judiciously choose the starting, ending, and intermediate years for the sample period, employing the igraph package within R-4.2.3 software for an in-depth computation and analysis of the centrality within the blue economy resilience network across coastal areas in the years of 2007, 2013, and 2019 in
Table 4. This analysis uncovers a pronounced core–periphery status in the network, highlighting the evolving dynamics and the intensity of inter-regional interactions within the coastal blue economy resilience framework. This approach not only delineates the structural nuances of the network but also sheds light on the shifting patterns of resilience and collaboration among coastal regions over time.
The analysis of nodal centrality reveals that Shandong, Shanghai, and Guangdong occupy pivotal roles within their respective marine economic circles, demonstrating significant influence and leadership. This suggests that these regions are central to the network of blue economy resilience, exerting a substantial radiating effect and holding commanding positions. Notably, Shanghai’s nodal centrality has seen a decline in recent years, indicating a shift towards a more comparable standing with Zhejiang within the central marine economic circle. This change points to evolving dynamics of competition and collaboration within the network, highlighting the fluid nature of leadership and influence in the blue economy resilience framework.
From the viewpoint of betweenness centrality, there was a noticeable decline from 2007 to 2013 and 2019, suggesting a reduction in the network’s polarizing tendencies and a more balanced distribution of influence among its nodes. Specifically, Shandong, Guangdong, and Shanghai maintained high levels of betweenness centrality across these periods, underscoring their significant control and pivotal roles as connecting hubs within the network. Conversely, regions such as Tianjin, Hebei, Guangxi, and Hainan consistently exhibit a betweenness centrality of zero, placing them in comparatively peripheral positions within the network. This dynamic highlights a shift towards a more equitable connectivity and interaction among regions, albeit with certain areas remaining less central in the overall structure.
The analysis of closeness centrality further reveals that, while regions like Liaoning, Zhejiang, Guangdong, Guangxi, and Hainan may not occupy leading positions within the network, they have consistently demonstrated an upward trajectory in this measure. This trend signifies an acceleration in the flow and exchange of blue economy resources across these areas. Notably, in 2019, the closeness centrality across coastal areas saw a general improvement, highlighting a significant enhancement in the mobility and interconnectivity of the entire blue economy resilience network. This advancement indicates a strengthened interaction among the nodes, thereby facilitating a more dynamic and responsive network structure. These insights not only shed light on the structural features and evolving patterns of the blue economy resilience network in coastal regions but also offer critical policy insights and strategic recommendations for further enhancing the network’s architecture and elevating the resilience level of the blue economy in these areas.
5.2. Overall Network Structure Characteristics
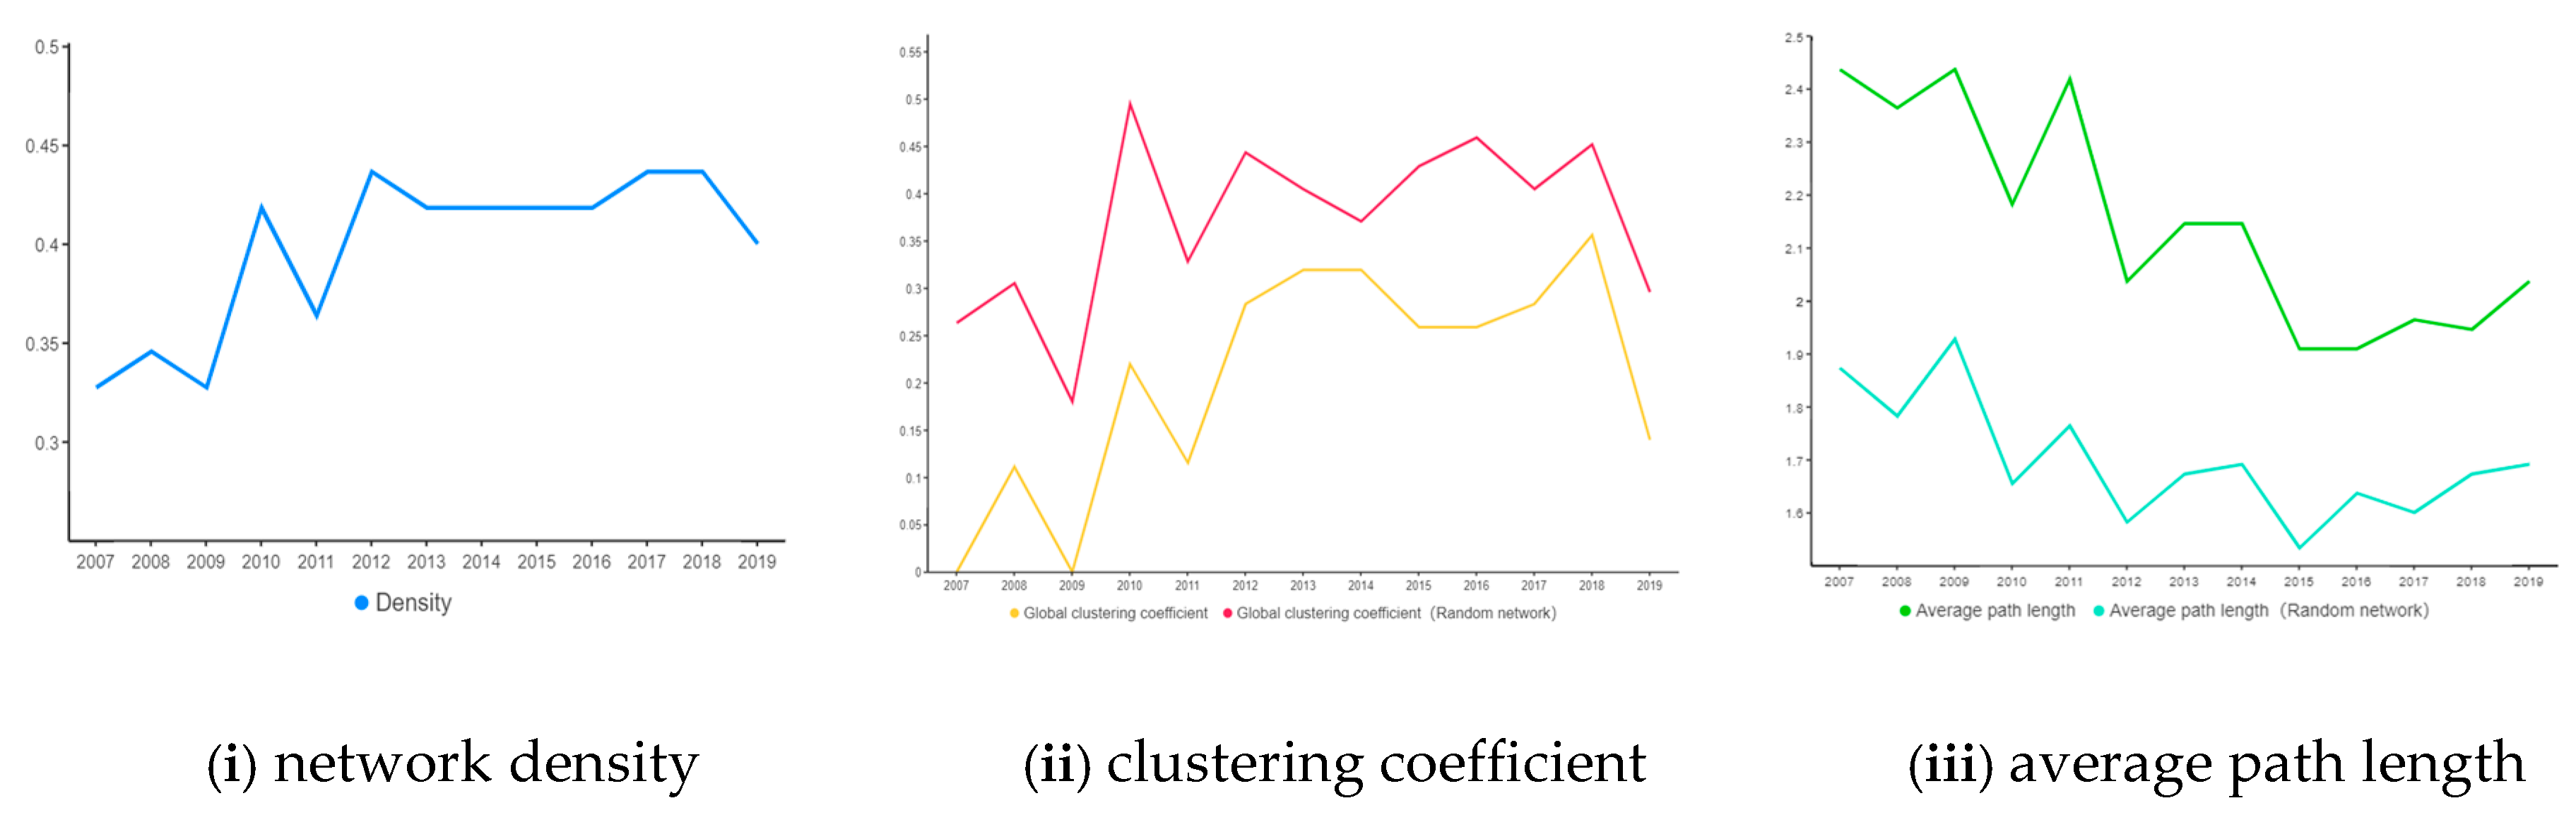
Utilizing the igraph package within the R-4.2.3 software, this study comprehensively examines the structural characteristics of the blue economy resilience network in coastal regions, focusing on three key dimensions—network scale, density, and connectivity—as illustrated in
Figure 3.
This research meticulously investigates the evolution of the blue economy resilience network within China’s coastal regions from 2007 to 2019, crafting a detailed map of structural changes based on pivotal metrics such as network density, clustering coefficient, and average path length. The observed yearly variations and overall growth in network density underscore an intensification of connections within the blue economy’s resilience across these coastal areas, particularly between 2013 and 2019. Despite a trend towards stabilization in the network’s structure, the average network density remains at a modest 0.397, highlighting significant potential for enhancing collaborative efficiency within the blue economy resilience network.
The network clustering coefficient exhibits an inverted “W”-shaped trend, consistently remaining below that of a similarly scaled random network. This pattern underscores a low degree of clustering within the blue economy resilience network across coastal areas, indicating that the connections between the nodes are relatively sparse. This dispersion suggests that, while certain regions may engage in robust interactions within the blue economy sphere, overall, blue economic activities are predominantly focused around a few central nodes. This concentration prevents the emergence of a broad-based regional synergy, highlighting an area for potential enhancement to foster a more interconnected and collaborative blue economy network.
The analysis of the network’s average path length indicates that the efficiency of information and resource dissemination within the coastal areas’ blue economy resilience network is generally suboptimal. Notably, a slight upward trend post 2016 suggests a decline in the network’s efficiency regarding the flow of resources and information in recent years. This trend may stem from factors such as the geographic distribution of marine economic activities, adjustments in the industrial structure, and shifts in the marine environment. These factors contribute to increased costs associated with emergency responses and resource allocation within the network. Particularly in the context of marine disasters and other urgent situations, the capability for rapid inter-regional response appears constrained.
In conclusion, while the blue economy resilience network in coastal areas has achieved a degree of structural stability, there remains substantial scope for enhancing its coordination, clustering, and transmission efficiency. Future efforts should aim to bolster inter-regional coordination within the blue economy, refine the network’s architecture, and augment the efficiency of information and resource flows. By doing so, we can forge a more interconnected and efficient blue economy resilience network, thereby advancing the sustainable development of the blue economy in coastal regions.
5.3. Evolution Characteristics of Cyberspace Structure
To more vividly depict the spatial structure evolution of China’s blue economy resilience network, this study employs the ggplot2 package in R to create spatial correlation networks for the years 2007, 2013, and 2019 [
22] (in
Figure 2). In these visualizations, the size of the network nodes represents the resilience level of the regional blue economy, while the thickness of the edges’ connecting nodes indicates the strength of the resilience connections between regions.
While the thickness of the edges’ connecting nodes indicates the strength of the resilience connections between regions.Drawing from an in-depth analysis of China’s blue economy resilience network, this study uncovers the emergence of a distinctive spatial pattern characterized by “multi-point leadership and tri-regional coordination”. This pattern highlights the dynamic development and unique features of the blue economy resilience network across China’s coastal regions (in
Figure 4).
Firstly, the network’s scale expansion and density increase signify a strengthening of connections within marine economic circles and a notable enhancement of the network’s radiative effect. This evolution from sparse to dense connectivity not only bolsters the network’s cohesion but also fosters inter-circle resilience in the blue economy, thereby reinforcing the coordinated development across the northern, eastern, and southern marine economic circles.
Secondly, the network’s hierarchical structure is manifested through the radial dispersion of core nodes within the spatial layout, transitioning from Shandong–Shanghai–Guangdong to Shandong–Zhejiang–Guangdong. This shift indicates that Shanghai’s marine ecological environment faces challenges due to intense socio-economic activities and frequent marine disasters, and, thus, its pivotal role in the blue economy resilience network is under threat. Meanwhile, Zhejiang has emerged as the new cornerstone of the eastern marine economic circle, attributed to its stable marine economic growth and efficient marine resource management.
Thirdly, the enhancement of network connectivity within distinct marine economic zones is evident in the notable performance of both the northern and southern marine economic sectors. Leveraging its robust marine scientific and technological capabilities, the northern marine economic zone consistently deepens integration, fosters the exchange and coordination of marine economic resources, and bolsters the gravitational pull among internal network nodes. Meanwhile, the southern marine economic zone capitalizes on its abundant marine resources, particularly centered around Guangdong, to significantly bolster its capacity for stability enhancement and industrial recovery within the marine economy. This strengthens its control and driving influence within the network, further accentuating the siphoning effect of its core node.
By employing a spatial framework characterized by multi-faceted leadership and coordination across the three regions, China’s blue economy resilience network not only demonstrates the dynamic evolution of its internal architecture but also presents a fresh perspective and strategy for advancing high-quality development within coastal blue economies. Moving forward, prioritizing the enhancement and synchronization of inter-regional connections within the blue economy resilience network while optimizing its structural layout holds paramount importance for fostering the sustainable growth of China’s marine economy and significantly bolstering the overall resilience of the blue economy.
6. TERGM Analysis
Building upon the preceding analysis, this paper has fundamentally elucidated the spatiotemporal evolution traits and spatial correlation structure of China’s blue economy resilience network spanning from 2007 to 2019. Subsequently, this paper will proceed with a TERGM analysis, as per Equation (2), with the ensuing results being presented in
Table 5. To ensure the robustness of the model fitting outcomes, MPLE (maximum pseudo-likelihood estimation) methodologies are employed in this study.
In this study, both estimation methods are employed to conduct a thorough analysis of the factors influencing the formation of the blue economy resilience network. The model’s AIC and BIC values, both below 1000, signify high degrees of fit and explanatory capabilities. This outcome not only validates the chosen model’s efficacy but also provides a scientific foundation for comprehending the pivotal factors shaping the construction of the blue economy resilience network.
The estimation outcomes of the model unveil the influence of numerous pivotal factors on the establishment of the blue economy resilience network [
30,
31,
32].
Firstly, the variance in the stability enhancement capacity of the marine economy profoundly influences the establishment of the blue economy resilience network. This suggests that, within regions marked by substantial differences in their economic development levels, those experiencing swifter economic growth are notably appealing to regions with slower development rates. This “siphon effect” fosters resource flow between regions, hastening the cross-regional exchange and integration of blue economy resources.
Secondly, the coefficient of influence of the variance in marine industrial structure is negative, suggesting that a greater similarity in marine industrial structure between regions correlates with closer ties in the blue economy resilience network. This phenomenon likely stems from the fact that comparable industrial structures foster the convergence of capital, technology, and labor demands, thereby facilitating resource sharing and collaboration among regions.
Thirdly, the positive coefficient of influence regarding the variance in environmental regulation intensity suggests that regional disparities in regulatory stringency may prompt market players to relocate from regions with stricter regulations to those with more lenient ones. This not only affects resource allocation between regions but also influences the formation of the blue economy’s resilience network.
Fourthly, the negative coefficient of influence pertaining to the variance in marine scientific and technological prowess underscores the fact that, when marine economic resources are heavily concentrated in certain developed regions, differences in marine scientific and technological capabilities among regions impede scientific and technological exchanges and cooperation. This scenario is detrimental to the construction and advancement of the blue economy’s resilience network.
In conclusion, the disparities in the stability enhancement capacity of the marine economy, marine industrial structure, environmental regulation strength, and marine science and technology strength intricately shape the formation and progression of the resilience network within coastal blue economies. These insights not only offer policy directives for fostering the efficient construction of the blue economy’s resilience network but also serve as crucial benchmarks for advancing blue economy collaboration and sustainable development within the marine economy [
33].
Robustness Test
To ensure the robustness of the model fitting results, this paper will employ the following methods to re-conduct the TERGM analysis: (1) The estimation method of TERGM will be changed to MCMC MLE (Markov Chain Monte Carlo Maximum Likelihood Estimation), with the empirical results presented in column (2) of
Table 6. (2) The time interval will be changed from 1 year to 3 years, with the criteria for edge selection remaining unchanged and the empirical results being shown in column (3) of
Table 6. Then, (3) a complete binary processing of the dependent variable will be conducted, with the empirical results shown in column (4) of
Table 6. It is not difficult to observe that the data in
Table 6 and the baseline regression both demonstrate relatively consistent empirical results; hence, it is considered that the research conclusions of this paper are robust.
7. Conclusions and Suggestions
7.1. Conclusions
This study systematically measures and deeply analyzes the resilience of the blue economy in China’s coastal regions from 2007 to 2019, employing a comprehensive approach encompassing the entropy weight method, social network analysis, and the time series edge plot regression model (TERGM). Through these methodologies, this paper unveils the dynamic evolutionary process and influencing factors of the blue economy’s resilience network, yielding the following key conclusions:
- (1)
Growth Trend and Challenges
Over the study period, the resilience of the blue economy in China’s coastal regions exhibited a fluctuating growth trend, propelled by the expansion of the marine economy scale and advancements in marine scientific and technological capabilities. However, due to the imbalanced foundation of marine economic development and regional disparities in marine economic development strategies, growth within the marine economy remains uneven and insufficient. Particularly, regions such as Hebei and Guangxi display a low resilience, while Shanghai’s blue economy resilience demonstrates a downward trajectory, highlighting challenges in marine economic development across certain regions.
- (2)
Analysis of Network Structure Characteristics
The individual structure of the blue economy’s resilience network exhibits prominent core–periphery characteristics, with core regions like Shandong and Guangdong holding high degrees of centrality within the network, while Tianjin and Hebei consistently occupy peripheral positions. In recent years, the strengthening of regional indirect closeness centrality indicates an enhanced regional interconnectedness within the network, signifying a gradual improvement in the integration level of the blue economy’s resilience network.
- (3)
Network Performance and Spatial Pattern
The rise in network density and expansion of the network scale signify the development of the blue economy’s resilience network towards a closer and more extensive direction. Nonetheless, network agglomeration and transmission remain lower compared to a random network of a similar scale, indicating the need for enhanced flexibility and adaptability. Furthermore, the increase in network spatial correlation strength contributes to the spatial pattern of “multi-point leading, three-zone coordination”, significantly enhancing interactions among diverse marine economic circles.
- (4)
Analysis of Influencing Factors
Variances in the stability enhancement capacity of the marine economy and marine industrial structure positively impact the formation of the blue economy’s resilience network, while disparities in environmental regulation intensity and marine science and technology strength exert negative influences. This finding sheds light on pivotal factors driving the formation and development of the blue economy’s resilience network, providing robust support for the formulation of pertinent policies and strategies.
In summary, this study not only offers insights into understanding and fortifying the resilience of the blue economy in China’s coastal regions but also provides critical guidance for crafting strategies and policies aimed at promoting sustainable development within the marine economy. Moving forward, optimizing the network structure and enhancing the network performance of the blue economy’s resilience network will be pivotal in driving high-quality development within coastal blue economies.
7.2. Suggestions
The aforementioned research findings hold significant implications for fostering resilient and coordinated development within China’s coastal blue economy and promoting the high-quality development of the marine economy. Firstly, bolstering the coupling and coordination between marine economic growth and marine scientific and technological prowess stands as a pivotal strategy for enhancing blue economy resilience. Nurturing innovative marine scientific and technological talent, amplifying investments in basic and applied research within the marine domain, and facilitating the transformation and application of marine scientific and technological innovations can provide robust scientific and technological underpinnings for blue economy development [
34].
Secondly, leveraging the first-mover advantage of core areas within the blue economy’s resilience network and providing effective guidance and assistance to peripheral regions constitute effective approaches to realizing balanced development across coastal blue economies. Through industrial upgrading, innovation cooperation, and other initiatives, the status and role of peripheral regions within the network can be elevated, fostering the overall development and optimization of the blue economy’s resilience network in coastal areas [
35].
Moreover, safeguarding the marine ecological environment and enhancing the value of marine ecology are pivotal in constructing a healthy and stable blue economy resilience network. Strengthening marine ecological protection and restoration and enhancing the efficiency and efficacy of marine environmental governance can effectively bolster the resilience of the blue economy in coastal regions, ensuring strong support for its sustainable development.
Finally, clarifying the development positioning and comparative advantages of the three marine economic circles and establishing a flexible and diversified blue economy network pattern characterized by competitive disparities and complementary advantages are essential in realizing high-quality development within coastal blue economies. By solidifying the bridging role of regions such as Shandong and Guangdong and fostering communication and collaboration among different marine economic circles, the coordinated development of the blue economy’s resilience network can be effectively promoted, ultimately enhancing the overall blue economy across China’s coastal regions [
36].
Through the implementation of these measures, not only can the internal connectivity and external interaction of the blue economy resilience network in coastal areas be strengthened, but also efficient collaboration and high-quality development of the marine economy can be advanced, laying a robust foundation for achieving the strategic objective of maritime prowess.


