Article

Adapting Water Resources Management to Climate Change in Water-Stressed River Basins—Júcar River Basin Case

by
Clara Estrela-Segrelles
1,2,
Miguel Ángel Pérez-Martín
1,* and
Quan J. Wang
3
1
Research Institute of Water and Environmental Engineering (IIAMA), Universitat Politècnica de València, 46022 Valencia, Spain
2
Júcar River Basin Authority, 46010 Valencia, Spain
3
Department of Infrastructure Engineering, University of Melbourne, Parkville, VIC 3010, Australia
*
Author to whom correspondence should be addressed.
Water 2024, 16(7), 1004; https://doi.org/10.3390/w16071004
Submission received: 12 March 2024 / Revised: 24 March 2024 / Accepted: 26 March 2024 / Published: 29 March 2024
(This article belongs to the Section Water Resources Management, Policy and Governance)

Abstract

:

Highlights

  • Highly stressed basins will experience increased water scarcity under climate change.
  • Water scarcity indices are easy and quick to use for analysing water resource systems’ sustainability.
  • The methodology allows to define measures to adapt river basin management to climate change.
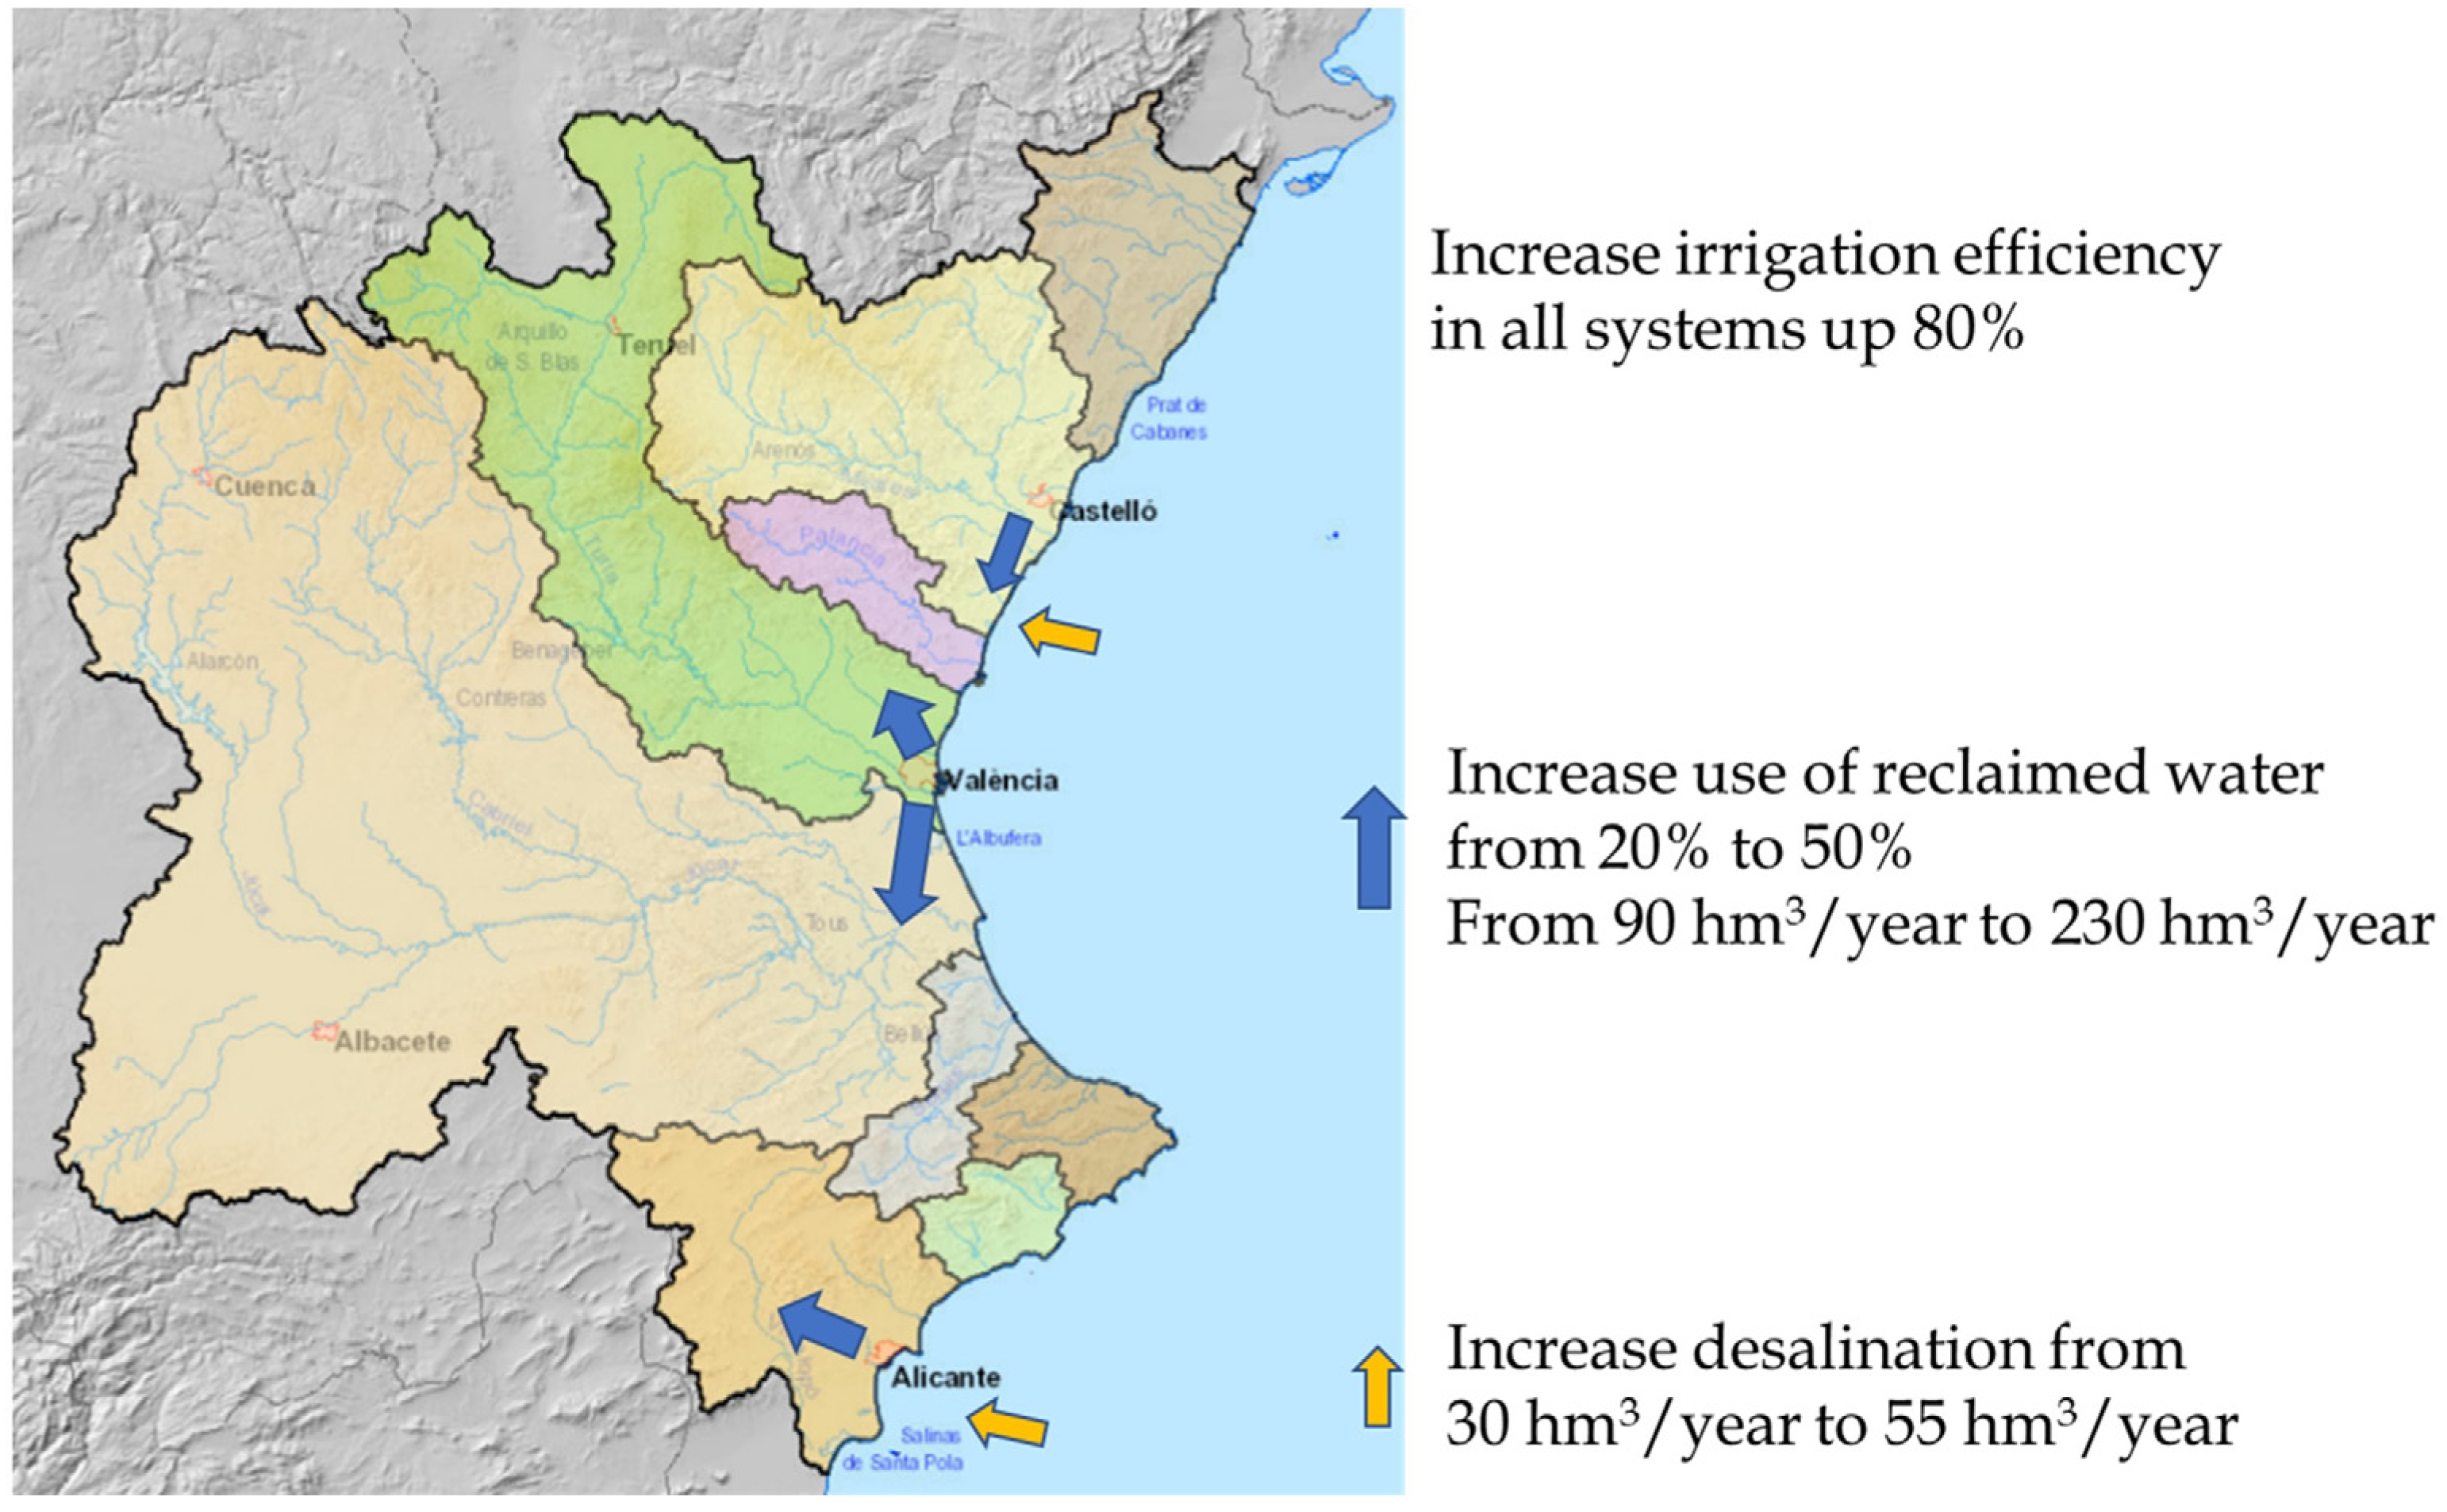
  • Increasing reclaimed water use from 20% to 50%, irrigation efficiency up to 80%, desalination, and interconnection are the main measures.
  • One of the main measures is to start to move water from downstream to upstream, from the coast to inland, using renewable energy.

Abstract

Water scarcity will increase due to climate change, especially in basins that are currently highly stressed. The Mediterranean area is one of the most vulnerable areas in the world, with a predicted natural water resource reduction of 20% to 35% at the end of the century, due to temperature increases and a 10–20% precipitation reduction. Water scarcity indices, including gross abstraction, net abstraction, and consideration of environmental requirements, can be efficiently used to analyse the effects of climate change in water resource systems and determine the main measures to adapt these systems to climate change. Increasing the reclaimed water use, seawater desalination, irrigation efficiency, and interconnecting water resource systems are the main measures to adapt basins under water stress and reduce their vulnerability to climate change. In the Júcar River Basin District (JRBD), with a 20% reduction in natural water resources, the main measures are: increasing the reclaimed water use in agriculture from 20% to 50% (91 hm3/year to 230 hm3/year), increasing seawater desalination from 30 to 55 hm3/year, increasing irrigation efficiency from 54% to 80%, and finally, fully developing the current water interconnections between water resource systems. In highly stressed basins, moving water from downstream to upstream using energy supplied by photovoltaic systems can help adapt river basins to climate change.

Graphical Abstract

1. Introduction

Water scarcity (WS) has become a major issue to sustainable development [1]. WS refers to the condition when the water supply cannot be fully satisfied, including the environmental requirements [2,3,4]. In several regions, WS is increasing due to the increasing water demands for urban and irrigation uses [5,6]. Many water scarcity indices (also named water scarcity indicators) have been developed to facilitate assessment of the WS status around the world [1] or measure water stress, such as the Falkenmark water stress indicator [2] to measure water availability per capita, the critical ratio, also known as the withdrawal-to-availability ratio (WTA) [2,3,4,7], the water footprint-based assessment [8], and others.
Water stress is a measure of the pressure that human activities exert on natural freshwater resources and provides an indication of the environmental sustainability of the use of water resources [9]. Water stress is a global challenge, but it is regionally differentiated and has multiple causes, ranging from climate to demography to land use. The water scarcity index (WSI), defined as the ratio between demand and water resources, is the most common index [10].
The main properties of the WSI are: (1) both gross and net water abstraction (or withdrawal) provide important information to understand WS, (2) WS indices need to incorporate environmental flow requirements (EFR), (3) temporal and (4) spatial disaggregation are required in a WS assessment, (5) both renewable surface water and groundwater resources, including their interactions, need to be accounted for as available renewable water resources, and (6) alternative available water resources need to be considered [11].
The rapid increase in population, together with the increase in demand for food, requires an expansion of agricultural land to achieve sufficient production, so water availability is declining now and will also reduce in the future [12]. Two-thirds of the global population (4.0 billion people) live under severe WS conditions for at least one month of the year, and half a billion people in the world face severe WS all year [13]. Half of them are in India and China, but other areas are also affected in Australia, Africa, America, and Europe, including the south-eastern part of Spain. Balancing water demand and natural available water is increasingly difficult, making systems especially vulnerable during drought episodes.
In many regions that are currently exposed to WS, climate change will increase the WS. The increase in the global average temperature has led to a rapid increase in WS due to climate change in many regions of the world, up to 2 °C, followed by a stabilisation of up to 4 °C [14]. Climate change is likely to considerably exacerbate regional and global WS [15]. Under climate change scenarios, more than half of the world population will live under extreme water scarcity by the end of the 21st century [16].
The impacts of climate change on water resources mainly depend on changes in precipitation amounts but are also conditioned by temporal distribution and temperature changes. The climate change impacts on water resources might be further intensified when they occur in regions that already experience imbalances between water demands and available resources [17].
Water stress indices are diverse and useful to quantify water stress in a system. They compare water use with water availability [6,18,19]. Water stress indices can be differentiated into two groups [11]: those that use gross water abstraction and those that use net water abstraction. When net water abstraction (also called consumptive water use, water consumption, or the blue water footprint) is used, the resulting water stress index is often called the consumption-to-availability (CTA) ratio, also known as WEI+ [20]. When gross water abstraction is used, the resulting water stress index is often called the withdrawal-to-availability ratio (WTA), also known as WEI [20]. The CTA and WTA are often classified in different levels using thresholds. In the case of net abstraction, values greater than 40% denote “high water stress” [7,21,22], and in the case of gross abstraction, values greater than 100% denote critical water scarcity. However, the current water scarcity and water stress thresholds in the CTA and WTA for continental- and global-scale applications are a matter of scientific debate because they may not represent certain realities [10].
The Water Exploitation Index (WEI) is obtained as the percentage of the average annual total freshwater gross abstraction with respect to the long-term average annual resources, including environmental requirements, so it is included in the WTA group. A ratio of withdrawals/renewable natural water resources (%) above 50% indicates local or random shortages, and above 100% indicates a structural, general shortage [20]. The Water Exploitation Index+ (WEI+) is similar to the WEI, only replacing gross abstraction with net water abstraction [23].
Adaptation policies play a crucial role in the economic effect of WS due to climate change. Major watersheds may experience strongly positive or negative economic impacts due to global trade dynamics and market adaptations to regional shortages. Market adaptation profoundly influences economic uncertainty in relation to hydrological uncertainty [24]. The integrated water resources management (IWRM) and the use of nonconventional resources, such as the reuse of treated wastewater (reclaimed water) or seawater desalination, can support reducing the impact of WS. Coordinated institutional responses, carefully planned technologies, and planning for projected climate risks are essential tools to reduce the impact of climate change [25].
Climate Change Adaptation Plans in the river basin districts are the instruments through which impacts and risks associated with climate change are analysed and adaptation measures to be developed in the coming years are proposed. On the other hand, it is necessary to have a long-term vision of climate change effects on the water resource systems, beyond the traditional planning horizons of 6 or 12 years. Therefore, in this work, the medium- and long-term effects of climate change and the measures required to adapt the currently highly stressed water resource systems are analysed.
This study develops a methodology for the analysis of water resource systems (also named water exploitation systems) based on the application of water scarcity indices: the CTA and WTA indices, which can be applied quickly and with less data requirements. The methodology provides a global and comprehensive vision of the sustainability of the water resource systems, the effects of climate change in the Mediterranean basins, and the main axes for the implementation of measures to adapt the basins to climate change. Very valuable information can be obtained through the application of these indices.
The objective of this work is to define a simple methodology for its application in any water resource system, with relatively low data and time consumption requirements, to gain a strategic vision for the water resource systems’ sustainability in the long-term, including the effects of climate change scenarios. Regardless of whether these studies are carried out, the detailed simulation (daily or monthly time steps) of the water resource management systems makes it possible to optimise water management [26] and establish specific measures with greater detail.

2. Methodology and Case Study

2.1. Case Study

Júcar River Basin District (JRBD) is located in the east of the Iberian Peninsula. Its total area, excluding coastal waters, is 42,756 km2. Geomorphologically, the JRBD has two large areas: a mountainous one, with altitudes greater than 1500 m.a.s.l., and a coastal one made up of coastal plains. This geomorphology influences the climatology. The total annual precipitation is around 510 mm, but its interannual and spatial distribution is characterised by heterogeneity, with many rainy (mainly the autumn, winter, and spring months) and dry months (summer).
Around 80% of surface runoff comes from groundwater discharges, so there is a great natural regulation of the river flows. Besides, the total regulation capacity of the dams is 2846 hm3, which represents 90% of the annual natural average resources of the JRBD, so it provides the water resource systems with great multi-year regulation. In these conditions, natural resources are strongly regulated, so the annual values are quite representative to define the water scarcity in these water resource systems.
In relation to land uses, 30% of JRBD’s territory is cropland, with irrigation being the largest user of water. Regarding the urban water use, the JRBD has more than 5 million inhabitants. Most cities with more than 35,000 inhabitants are concentrated on the coastal strip.
Water resource systems (or water exploitation systems) are management units that allow for meeting the water requirements of the different water users: urban, agriculture, and industry. They are made up of surface and groundwater bodies, hydraulic infrastructure facilities, regulations for the use of water abstractions from the water users, and rules of water exploitation. The JRBD is divided into nine water resource systems, as follows in Figure 1.
The Mediterranean is one of the areas most vulnerable to climate change. In the JRBD, climate change scenarios predict a decrease in annual precipitation (1–6% in the short term: 2021–2040, and 4–11% in the long term: 2070–2100). Natural water resources will decrease (4–11% in the short term and 21–36% in the long term) [27]. These estimated reductions were obtained by comparing natural resources calculated with the hydrological model, applying the current climate, and applying the future climate under the climate change scenarios to the same hydrological model. The future climate was obtained by applying precipitation and temperature anomalies from climate change scenarios to the historical precipitation and temperature time series. This reduction will affect the ecosystems associated with the water bodies [28] and the water uses [29].

2.2. Methodology

The methodology applied two water scarcity indices (WSI), CTA and WTA, at annual scales in each water resource system (Figure 2). The anthropic surface water regulation and natural groundwater regulation in these river basins make the annual WSI representative of the water scarcity, so it was not necessary to obtain the indices on a monthly scale. In both cases, the WSI was obtained by dividing water use (WU) by the available water resources (AWR) for each water resource system (i):
W S I i = W U i A W R i
Available water resources are formed by the sum of all the resources in the water resource system: surface and underground natural resources, reclaimed water, seawater desalination, and external contributions from other basins. Natural resources are the annual average resources in a representative multidecadal period.
The CTA (consumption-to-availability) index uses annual net abstraction (NA) and the WTA (withdrawal-to-availability) index uses annual gross abstraction (GA). In both cases, the water uses include urban, industrial, and agricultural uses.
C T A i = N A i A W R i             a n d             W T A i = G A i A W R i
Gross abstraction is the volume of fresh water from its source (rivers, lakes, and aquifers) for water supply for urban, industrial (including thermoelectric plants), or agricultural demands [9]. Net abstraction is the amount of water transferred to the atmosphere, so it disappears from the system. Both are related by the system global efficiency, eg.,
G A i = N A i E g i
In the JRBD, environmental requirements (ER) include environmental flow requirements to rivers and wetlands, and groundwater discharges to the sea to avoid marine intrusion in coastal aquifers. The compliance with the ER is carried out by checking whether the available resources minus the net abstractions are superior to the environmental requirements in each system, as follows:
A W R i N A i > E R i
The UN Indicator 6.4.2 of the UN Target 6.4, as well as the WEI, has been defined as the ratio between total fresh water withdrawn (TFWW)—gross abstraction—by all major sectors, and total renewable freshwater resources (TRWR), after considering the environmental flow requirements (EFR). This indicator is related to WTA family indices because it uses the gross abstraction in the system, and it is calculated using the following formula [30]:
W a t e r   S t r e s s % = W E I = T F W W T R W R E F R · 100
The WEI+ indicator can be obtained by applying the same formula but using net abstraction rather than gross abstraction.
Water scarcity threshold levels for CTA and WTA were defined based on the literature review and the expertise about the current status of the water resource systems of the JRBD (Table 1). There is great agreement about whether water resource systems can be considered ‘severely stressed’ or ‘highly stressed’ if annual withdrawals exceed 40% of the annual available water resources, so this value was considered a reference value for the CTA index. The WTA levels were defined similar to FAO Indicator 6.4.2 or the WEI because they are related to the gross abstraction in the system, only the critical level was modified to 1.25 to reflect the current situation of the 9VA Vinalopó-Alacantí system, which is severely affected but not in critical condition.
The JRBD has had 3 multi-year droughts in the last 40 years, which have been able to be managed with the current levels of water scarcity. This means that with these values of the scarcity indices, it is possible to manage droughts such as these historical ones, which represents the real behaviour of these water resource systems. For these reasons, the goal is to obtain the current values of the scarcity indices under the climate change scenarios, considering that these scarcity levels would also guarantee the management of multi-year droughts in the future.
Natural resources were obtained with the Model PATRICAL for the period 1980/1981–2017/2018 as the difference between precipitation and evapotranspiration (P–EV), which is equal to surface runoff plus infiltration, as indicated in [9]. This period corresponds to the period used in the last Water Management Plan developed under the European Water Framework Directive. The PATRICAL model is a monthly distributed (1 km2) water balance model, which includes surface water, groundwater, and river–aquifer interactions, calibrated for the JRBD [31], as well as water quality [32]. Natural resources under climate change scenarios were obtained by applying to the current natural resources, the changes in water resources for two scenarios: RCP4.5 and RCP8.5 [33], as well as for two future periods: 2041–2070 and 2071–2100. Changes in water resources for each water resource system were obtained from the application CAMREC [34].
Water gross and net abstractions made by users were obtained from the Júcar River Basin Management Plan 2022–2027 [35]. According to Spanish legislation [36], water uses are considered to be the different types of use of the resource, as well as any other activity that has repercussions on the state of the water. In this work, urban, agricultural, and industrial uses have been considered. Water abstraction is the volume of water, in quantity and quality, that users acquire to satisfy their production or consumption objectives.
Water abstractions that belong to the same use that share the origin of supply and whose returns are reincorporated in the same area were grouped into abstraction units. The methodology for estimating water abstractions is characterised by being based on real data.
The calculation of urban water abstractions considers the forecasts of the urban planning, the demographic, economic, productive, industrial, and service evaluations, and includes industries with little water consumption located in population centres and connected to the municipal network. These evaluations consider both the permanent and seasonal population, as well as the number of main and secondary homes by typology. Urban demand was estimated from real data obtained through real measurements and surveys. However, in the case of not having this information, the starting data were the population and the theoretical water consumption (on average, 245 L/person/day), from which the total urban abstractions were estimated. Net abstractions were obtained by taking into account the efficiency of supply systems. In this study, an average efficiency of 80% was established.
The agricultural abstraction was estimated considering the forecasts for the evolution of the irrigated area, crop types, irrigation systems and efficiencies, and water savings as a consequence of the implementation of new irrigation techniques or improvement of infrastructure. Agri-Food Statistics forms and Yearbooks provided information used to obtain the irrigated area (ha) and the type of crop for each abstraction unit. In addition to the previous sources of information, the data were contrasted using remote sensing techniques, and water needs for each crop type were estimated with a methodology that combines the FAO 56 PM method and a hydrologic model [37]. In JRBD, the crop water requirements are, on average, 3.468 m3/ha/year. Irrigation net abstraction was obtained by multiplying each crop area by its water requirement. Irrigation gross abstraction was obtained by dividing net abstraction by global efficiency. Global efficiency was composed of transport, distribution, and application efficiency, which depend on many factors. Transport efficiency and distributed efficiency are related to the conduction typology, open-air channels or pipes, and the network state of conservation. Water application efficiency depends on how water is applied in the crop area, such as by flood, sprinkler, or drip irrigation. To obtain the typology of transportation and distribution networks, specific maps were used. Then, different efficiencies were applied for each typology.
Finally, the demand for industrial and energy uses considered the current forecasts and long-term sustainable development of each sector of activity.

3. Results and Discussion

3.1. Current Water Scarcity Indices

The natural renewable resource or total contribution obtained with the PATRICAL model [31] for the period 1980/1981–2017/2018 in the JRBD was 3.165 hm3/year (Table 2). The JRBD receives 76 hm3/year from other large basins. Nonconventional water resources were seawater desalination (from 6 plants) and reclaimed water (also named wastewater reuse, water reuse, or water recycling), with 121 hm3/year.
Current reclaimed water (91 hm3/year from 30 wastewater treatment plants (WWTPs)) represented 20% of the urban and industrial wastewater treated (451 hm3/year from 124 WWTPs). Environmental requirements were 470 hm3/year, and this represents 15% of the natural renewable resources in the JRBD.
In the JRBD, total net abstractions were 1456 hm3/year and total gross abstractions were 3102 hm3/year. Agriculture represented 89% of the net abstractions and 78% of the gross abstractions, and it had a mean efficiency of 0.54.
The compliance with the environmental requirements was assessed by comparing if the unused resources were greater than the environmental requirements. In all the water resource systems, the amount of unconsumed (not evaporated) water was much higher than the environmental requirements, varying between 1.6 times in the 1CM water resource system to 8 times in the 2MP WRS. In the whole JRBD, the unconsumed water was 4 times greater than the environmental requirements.
The WEI+ and CTA indices provided similar values, but the WEI+ was slightly higher since the environmental requirements reduced the water resources available for use. In these basins, the CTA yielded more realistic values, such as the case of the 1CM. Currently, this water resource system does not have problems; however, the WEI+ indicated that is a highly stressed basin (>0.4), in comparison with the CTA, which indicated it as a low-stressed basin.
Similarly, Indicator 6.4.2 showed higher values than the WTA. The entire JRBD and three basins yielded values above 1.00, indicating that these water resource systems are in critical condition. This result does not reflect the current real condition of these basins: it is true that the JRBD is currently in high-stress conditions, but not critical conditions (FAO-UN6.4.2/WEI > 1), so it was necessary to modify the general thresholds defined for Indicator 6.4.2 to adapt it to highly water-stressed basins and apply it to these water resource systems.
In conclusion, the results of CTA vs. WEI+ and WTA vs. WEI were quite similar. Both can be used for the purpose of this study. WEI+ and Indicator 6.4.2/WEI thresholds must be modified for these water resource systems to better reflect the reality of these basins.

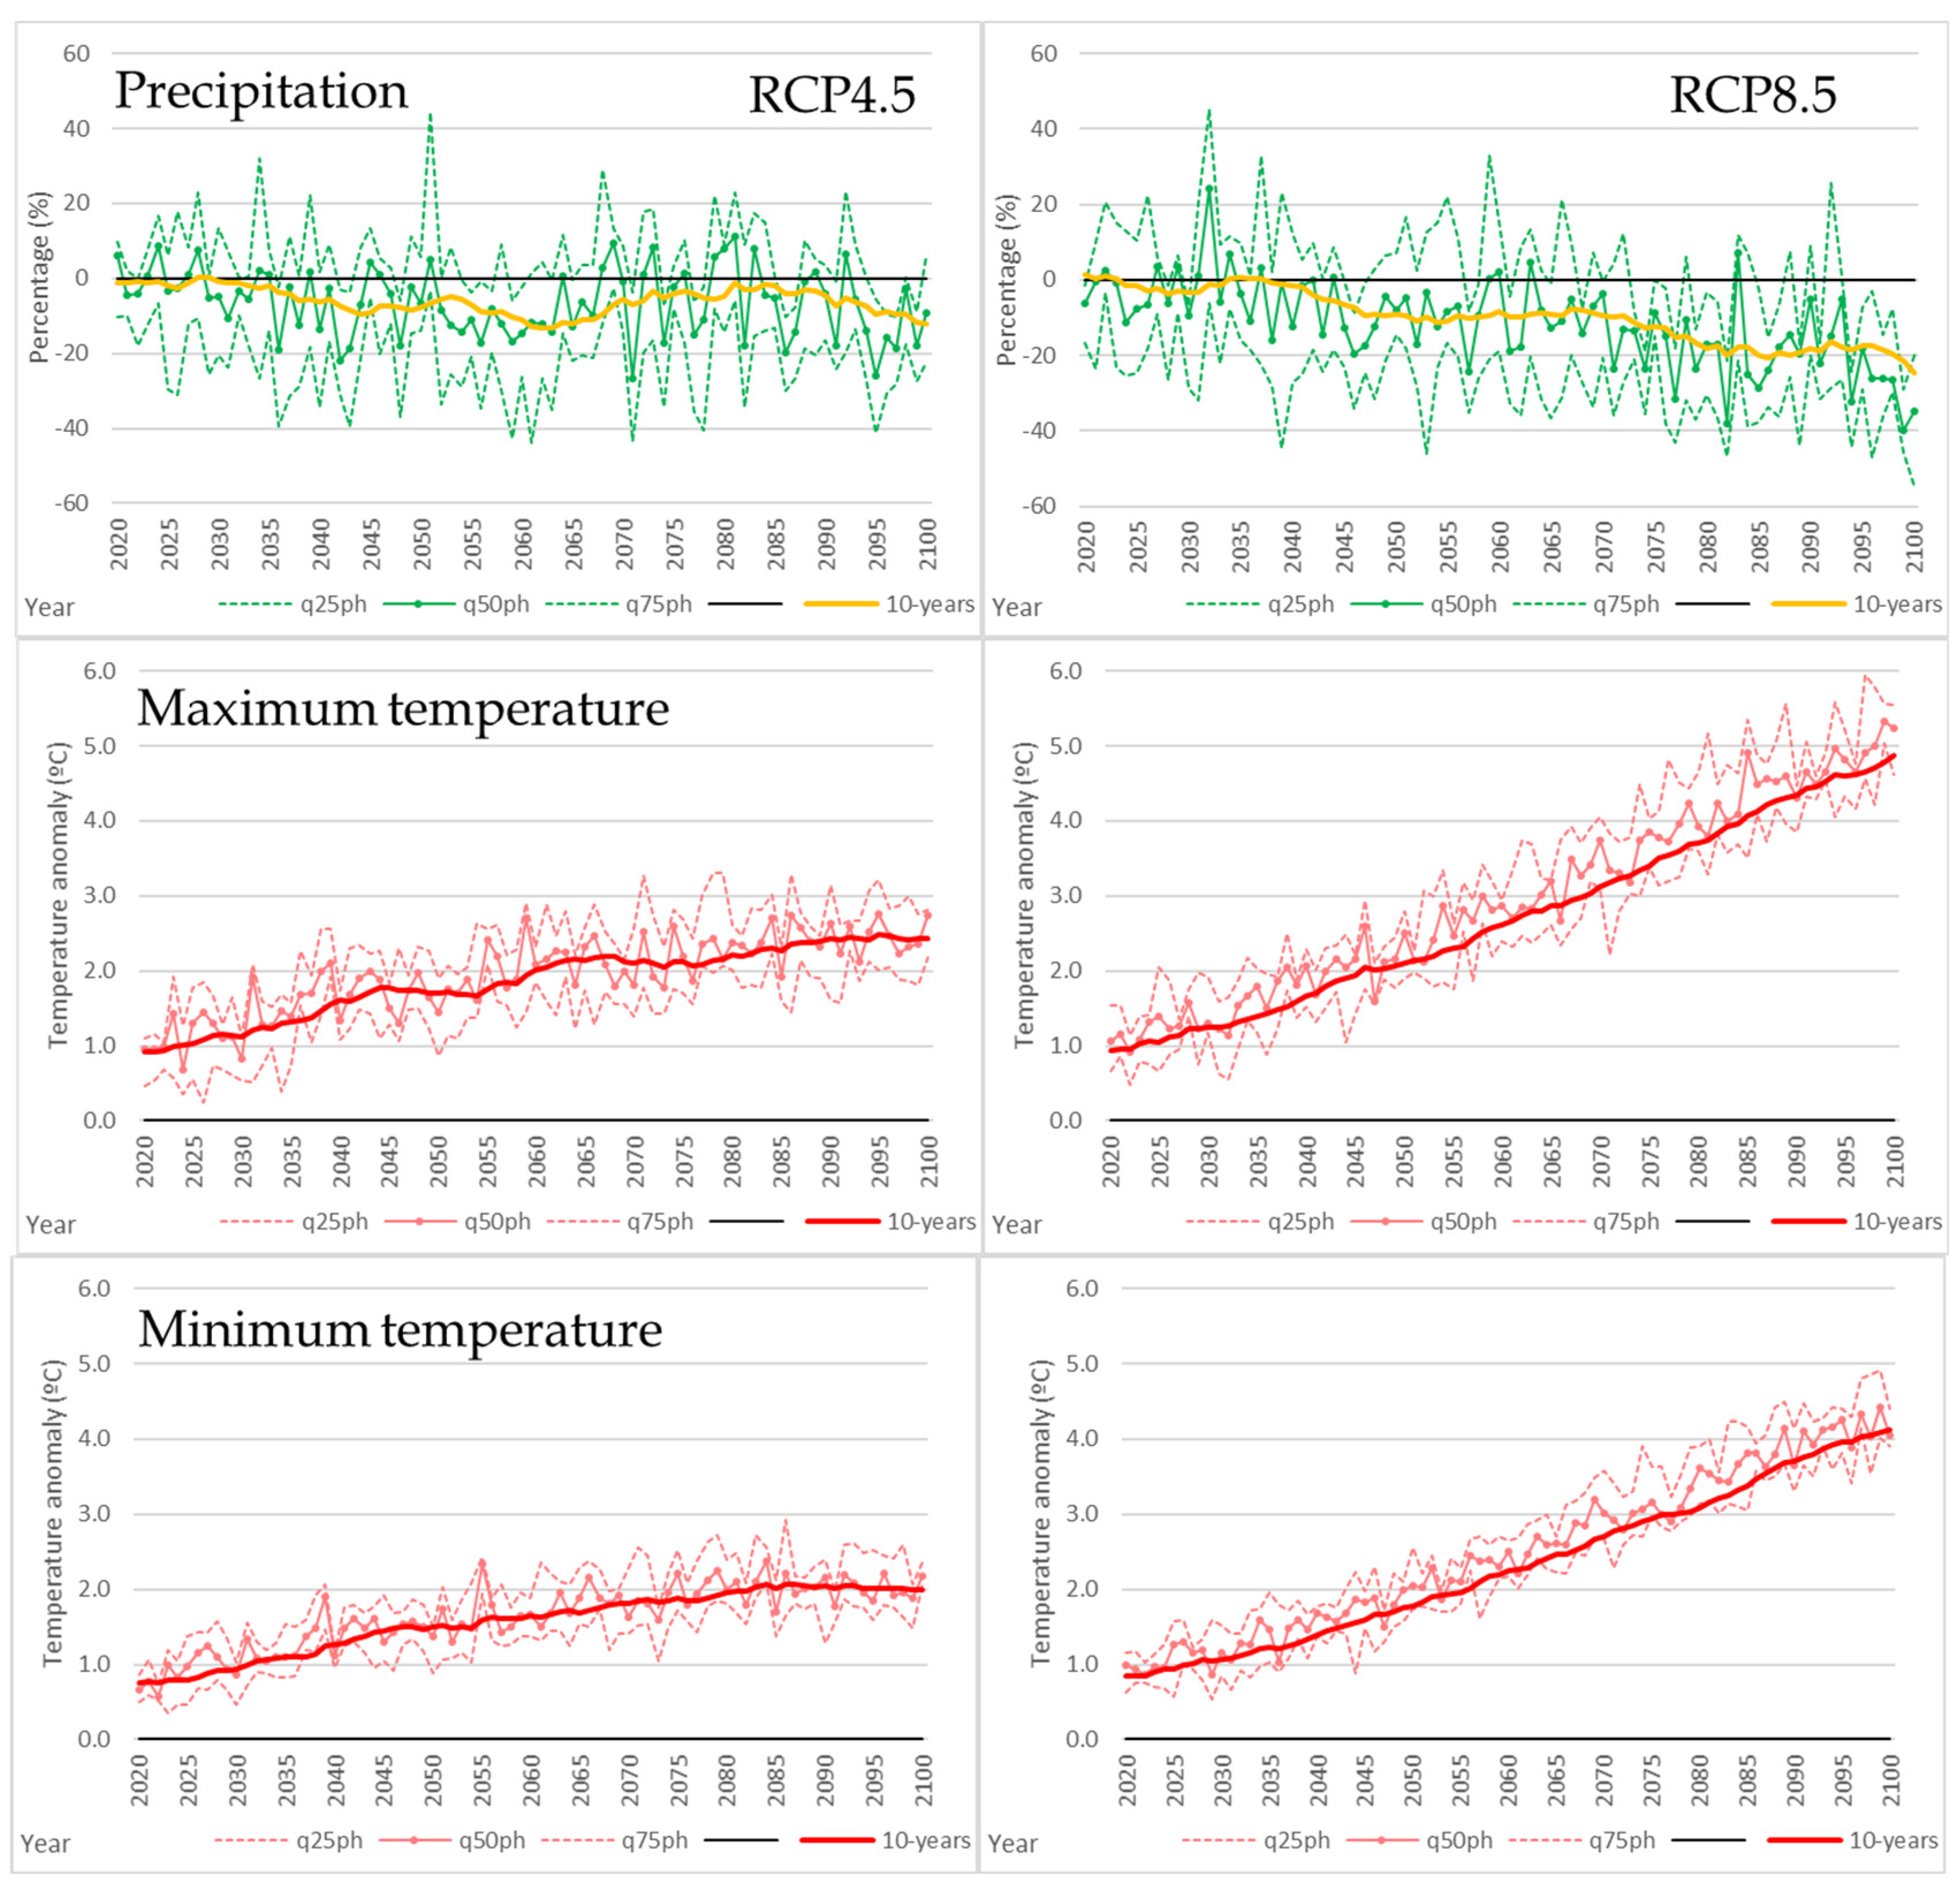
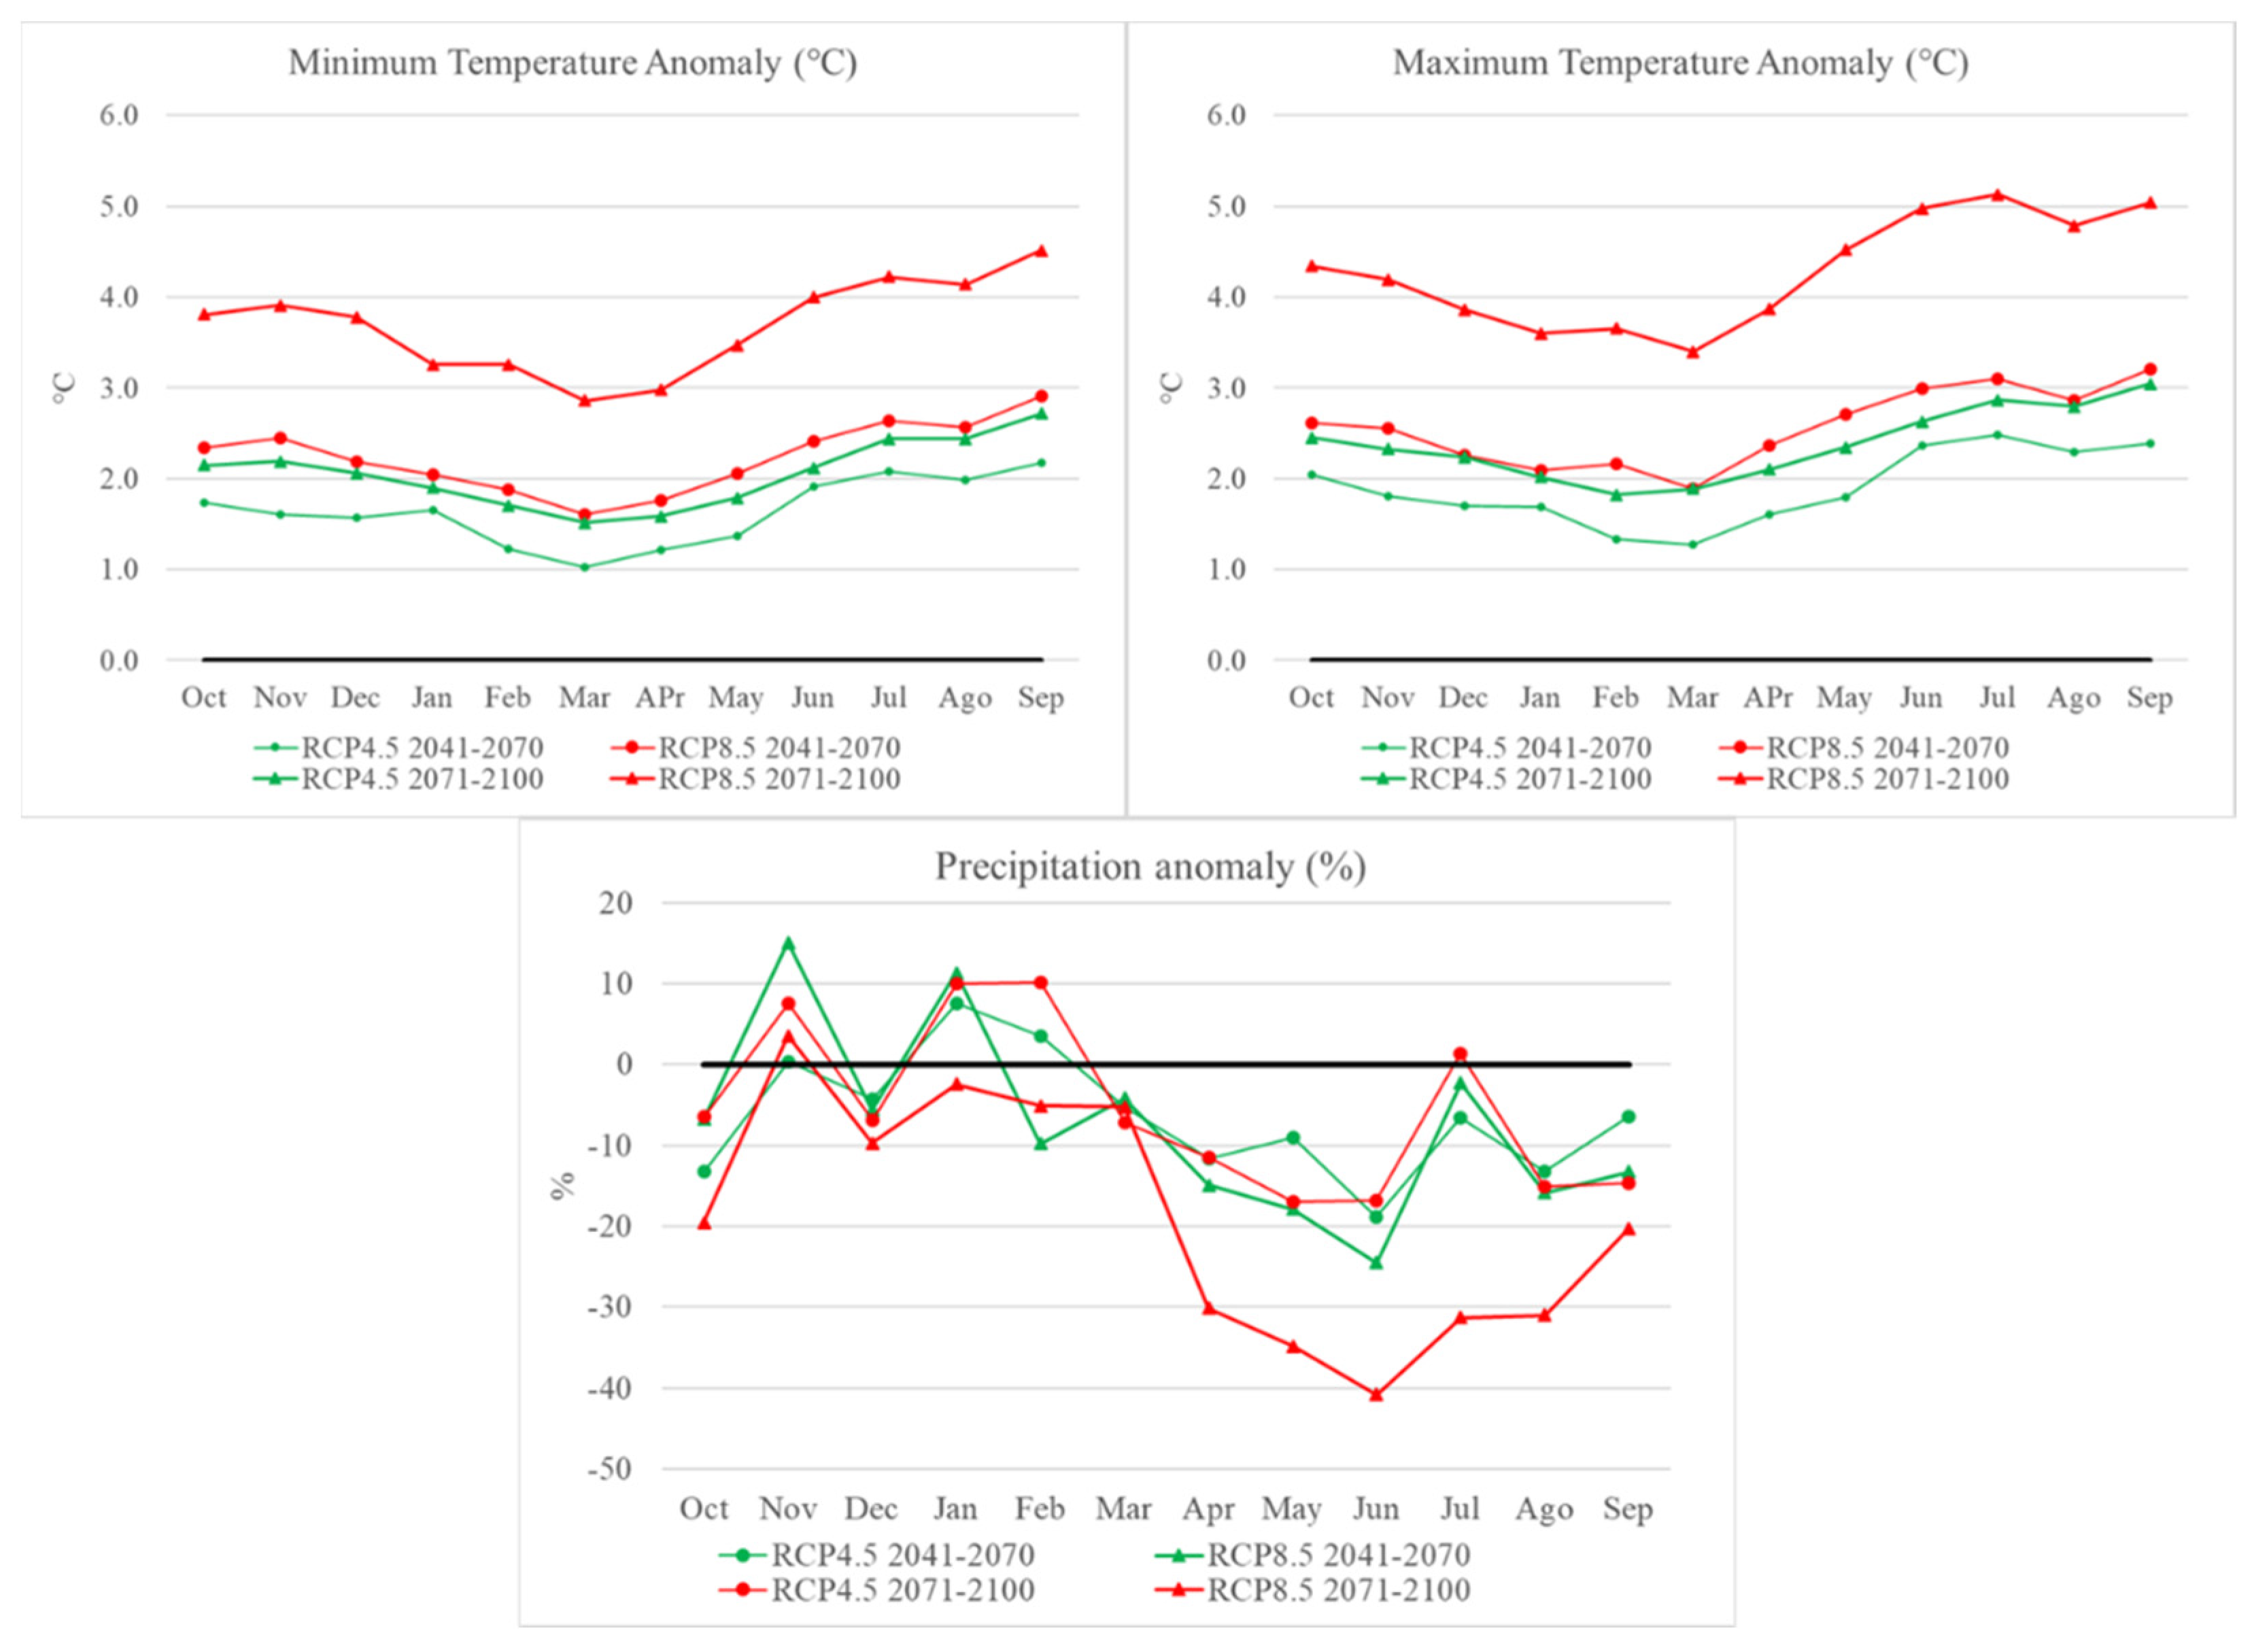
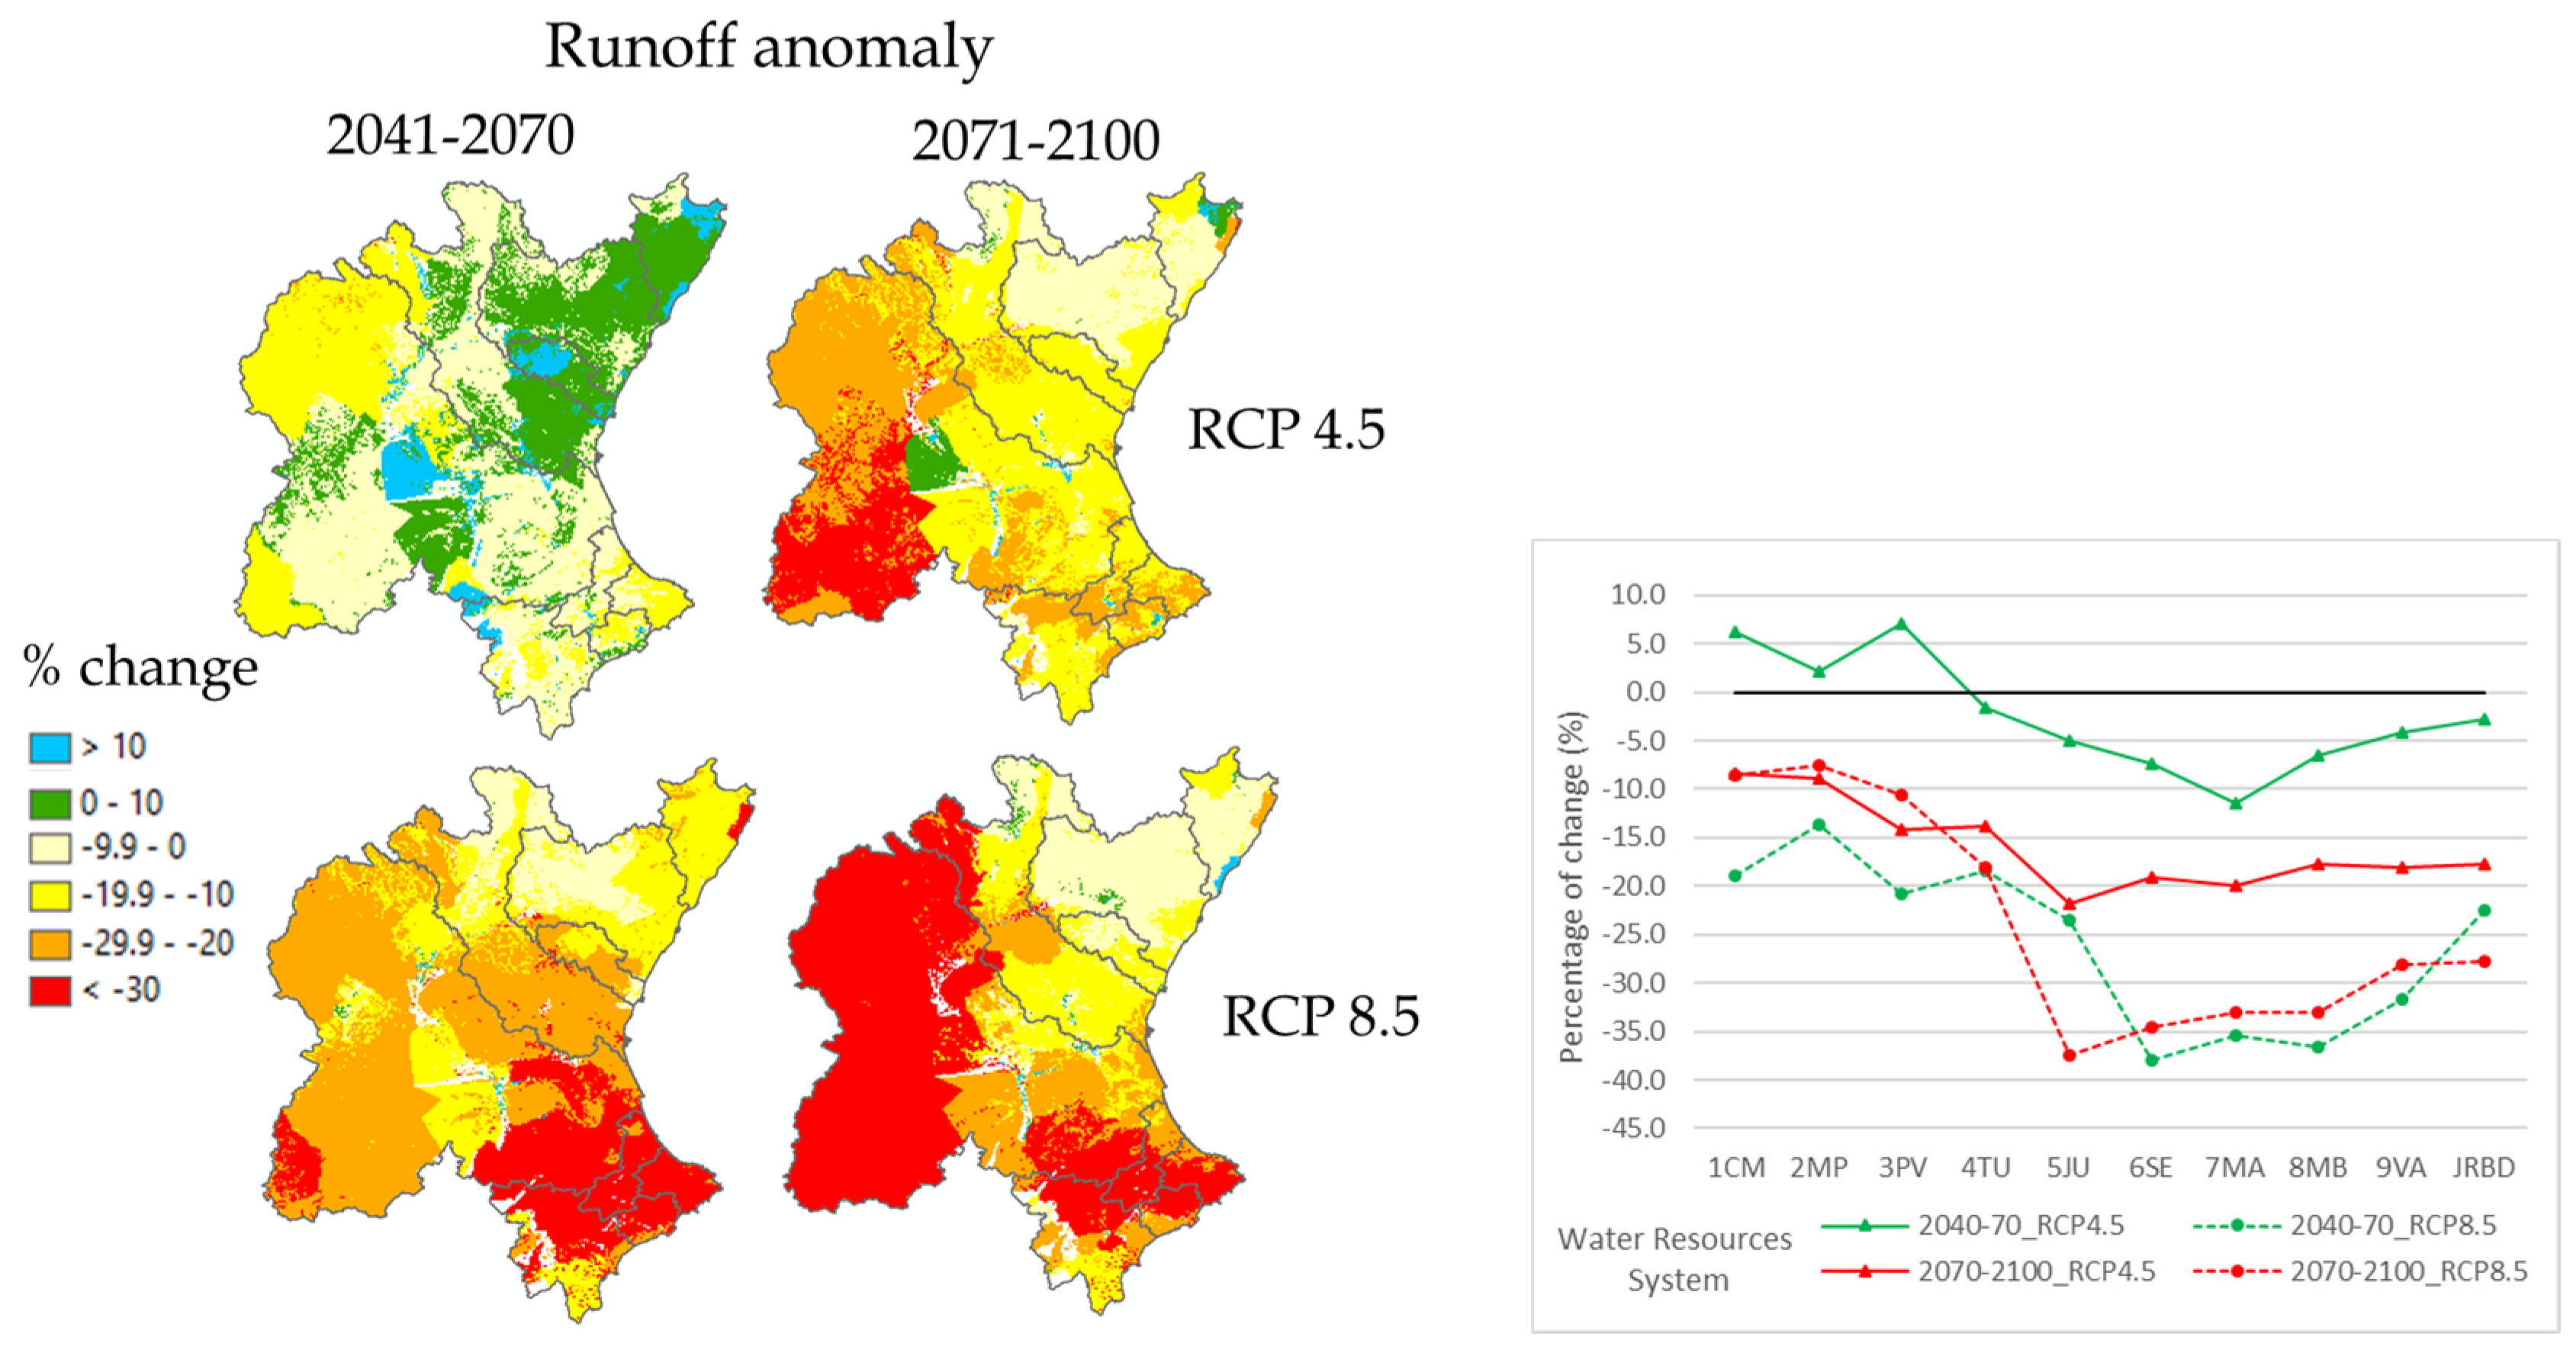
3.2. Effect of Climate Change on Water Scarcity Indices

The analysis of the impact of climate change on water resources was carried out based on the information collected from the ADAPTECCA platform [38], where bias-corrected projections from the International Euro-CORDEX Initiative are available. Annual average values for the JRBD for scenarios RCP4.5 and RCP 8.5 were considered to have a complete variation range in this research.
Temperature had a similar increase until mid-century in both scenarios, but in RCP4.5, it stabilised at a 2 °C increase around the middle of the century, while in RCP8.5, it showed a continuous increase until 4–5 °C at the end of the century (Figure 3). Precipitation had a gradual reduction during the century, with around 10% in the RCP4.5 scenario and 20% in the RCP8.5 scenario at the end of the century. In general terms, RCP4.5 and RCP8.5 are quite similar until the middle of the century; however, from this point, RCP4.5 stabilised, but RCP8.5 still increased for both temperature and reductions in precipitation.
Two future periods were used to characterise medium-term (2041–2070) and long-term (2071–2100) time horizons under climate change scenarios. The combination of the two scenarios and two horizons led to four scenario cases (Figure 4). As previously indicated, three scenario cases were quite similar: RCP4.5 medium term, RCP8.5 medium term, and RCP4.5 long term, because scenario RCP4.5 stabilised in the middle of the century. These three cases showed similar increases in temperature and similar decreases in precipitation. All of them had a higher increase of temperature in summer (JAS), around 2 °C in minimum temperature and 3 °C in maximum temperature, and higher precipitation reduction in spring (AMJ) and summer (JAS). Clearly, the last case, RCP8.5 for the long term, showed the worst scenario, with a temperature increase that could reach 4 °C and 5 °C in summer and extreme precipitation reductions also in spring and summer.
Consequently, variations in temperature and precipitation will lead to a natural resource reduction under all climate change scenarios in the JRBD. Additionally, spatial patterns have a crucial role in runoff generation (Figure 5). In the scenario RCP4.5, the main reductions were focused in the southeast area, so water resource systems from 6SE to 9VA had the largest reductions. On the other hand, in the RCP8.5 scenario, runoff reduction also included the inland part of the JRBD, so the main system, 5JU, was strongly affected. Natural resources will reduce from 3% in the better case, RCP4.5 medium term, to around 20% for the scenarios RCP4.5 long term and RCP8.5 medium term, so both scenarios are quite similar for the entire JRBD. Finally, in the worst scenario, RCP8.5, natural water resources will reduce by around 27%.
Under climate change scenarios, the CTA and WTA indices of most water resource systems worsened (Figure 6). The 5JU WRS was at a critical level with both the CTA and WTA indices, and the systems 04TU and 09VA were at a critical level with the WTA index.

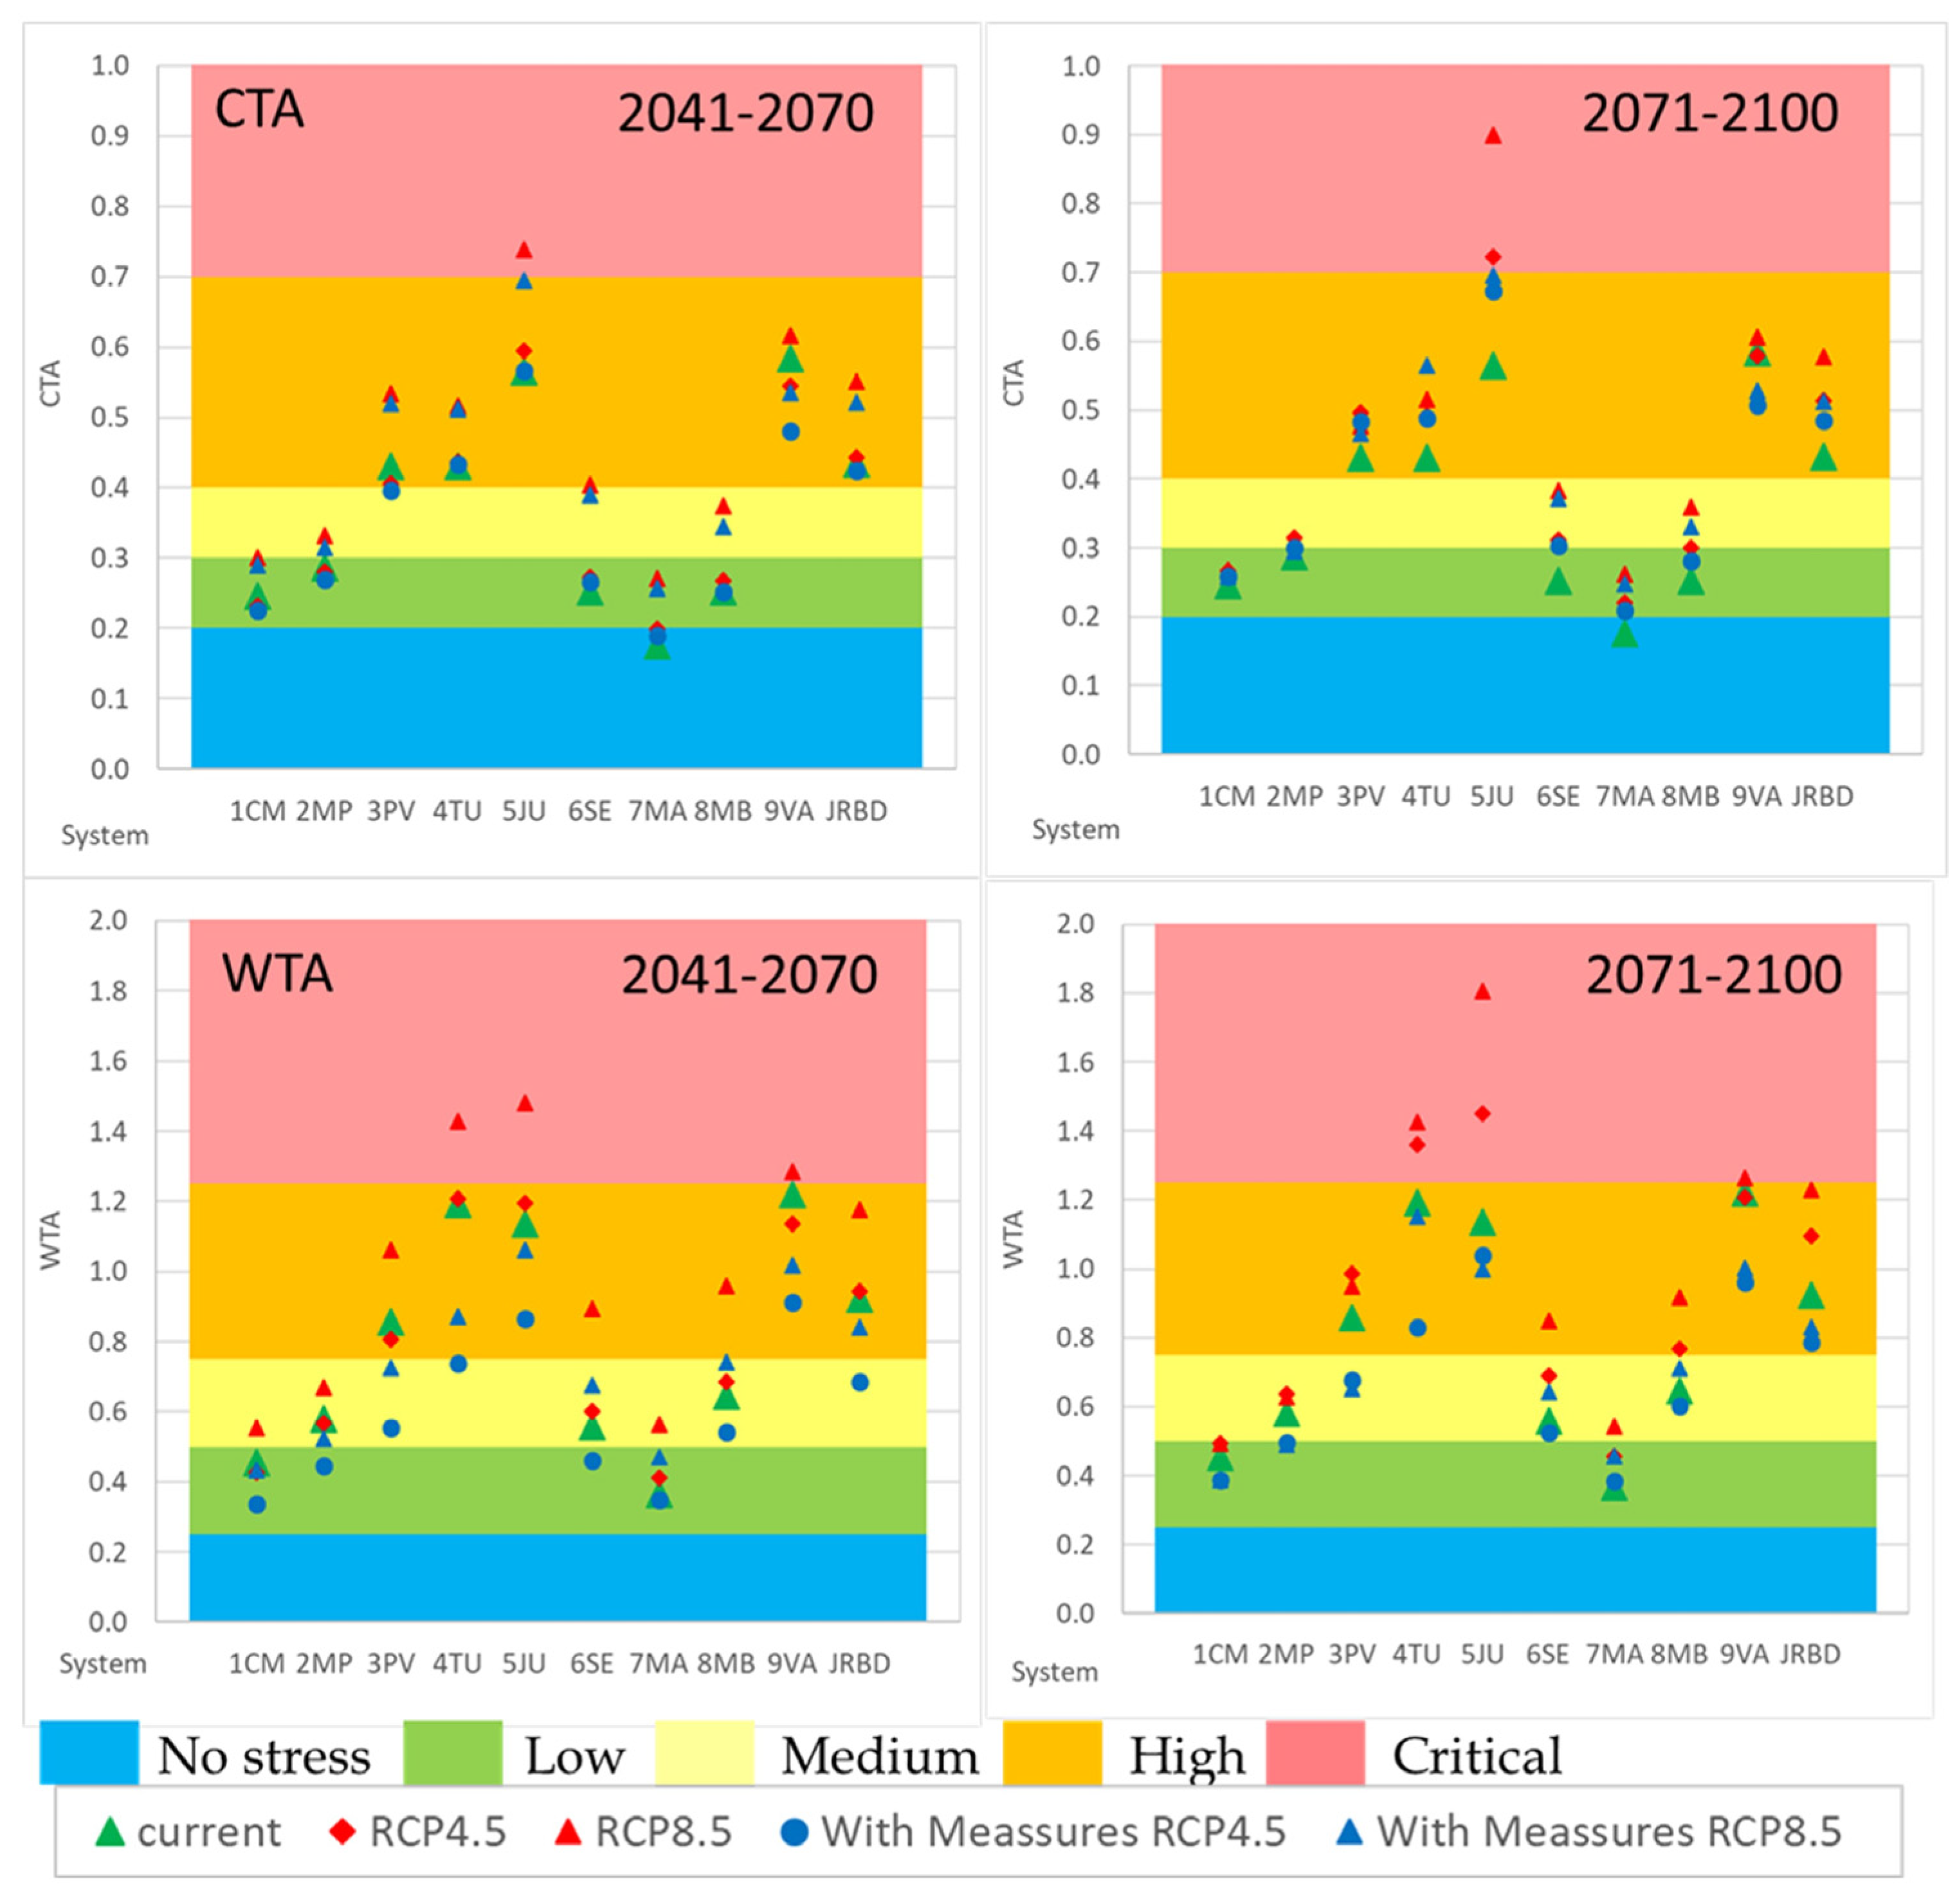
3.3. Measures to Adapt Mediterranean River Basins to Climate Change

A set of measures to adapt the Mediterranean river basins to climate change was analysed. All the measures proposed are measures that have already been developed at different scales and in areas of the Mediterranean basins, such as Júcar or Segura RBD, and they are environmentally friendly and cost-effective, as described below. Sensitivity analysis of the measures’ effectiveness showed that agricultural efficiency improvement was the main measure to reduce WTA, as this index uses gross water abstractions. However, this measure does not affect the total water consumption in the basin, so the CTA does not change, as this index uses net water abstractions. Measures to reduce the CTA are related to an increase in water resources’ availability or water consumption reductions.
Measures to increase water resources’ availability are reclaimed water use (or wastewater reuse), seawater desalination, river flow regulation increases, interconnection between basins, and the exploitation of coastal aquifers to intercept underground outlets to the sea.
The criteria used to define the increase in the available water resources are based on the water cost and the environmental impact of different water resources. Reclaimed water has a cost related to elevating water from wastewater treatment plants to the irrigation areas, as the wastewater treatment cost is assumed by the urban or industrial users. The water pumping cost can be reduced by combining these facilities with photovoltaic systems. The reuse of treated wastewater also reduces the nutrient discharges to the environment, including nitrogen and phosphorus, reducing eutrophication risks in inland and coastal waters. Seawater desalination is more expensive, but its combination with photovoltaic systems can reduce operation costs and make this resource more attractive to farmers.
Considering these costs and environmental aspects, it is necessary, firstly, to develop all the reclaimed water possible in the water resource systems without the need for additional regulation capacity and, secondly, to increase seawater desalination.
The JRBD is considered a highly regulated river basin, where the water storage capacity is around 90% of the natural annual runoff. In this case, increasing the water storage for multi-year regulation does not significantly increase the available water resources, so this measure is not an economically and environmentally effective measure at this time. On the other hand, the coastal aquifers are currently heavily exploited, so increasing their exploitation would imply the penetration of the marine wedge and the aquifers’ salinisation. The interconnection between basins has already been constructed but is not fully developed, and no external contributions are planned in the future.
Therefore, based on environmental concerns and cost efficiency, currently, the main measures to increase available water resources are reclaimed water, seawater desalination, and the full development of the current interconnections between basins.
Regarding water consumption reduction or net abstraction (evapotranspiration reduction), they can only be obtained by reducing irrigated areas or changing crop types. Under the global context of population growth, which will lead to a higher food demand in the future, food security is becoming more important, and there is a global increase in water scarcity; for this reason, no reduction in water consumption has been considered to maintain food production. Besides, these changes could depend more on changes in the economic markets [24].
Gross water abstraction reduction is achieved by improving the efficiency of urban, industrial, and mainly, agricultural systems. Recent droughts in the JRBD [39,40,41] have meant that urban systems have reduced their water losses, strongly increasing their efficiency. Under these circumstances, the measure that most significantly reduces the WTA index is the modernisation of irrigation systems, considering that they represent 78% of the current gross water abstraction. This measure does not significantly contribute to water consumption reduction in the district (CTA, no changes) since water irrigation excess returns to the system through surface or groundwater. Although irrigation modernisation does not imply a reduction in water consumption, and if it is not well controlled it can cause a rebound effect [42], this measure keeps water in the river or in the aquifer, significantly reducing gross abstractions, which produces an environmental improvement by reducing the resource relocation at the source. On the other hand, irrigation modernisation significantly reduces agricultural returns, with high concentrations of nitrate, phosphorus, and pesticides. This measure, accompanied by fertigation, can be the main measure applied to recover nitrate-polluted aquifers [43] and to reduce the eutrophication risk in rivers and lakes [44,45].
After analysing the CTA and WTA indexes’ sensitivity to changes in the measures, the following measures have been established for climate change adaptation in the Mediterranean basins: increase reclaimed water use, increase seawater desalination use, and make improvements in the irrigation systems’ efficiency and the basins’ interconnections (Table 3).
Currently, approximately 20% of the treated wastewater is reused in the JRBD, being one of the basins with the greatest wastewater reuse in the Mediterranean area after suffering three drought periods in last 40 years. Specific studies developed by the government indicated that reclaimed water use can increase to 50% without large regulation infrastructures in the following years (from 91.4 hm3/year to 229.3 hm3/year). Seawater desalination is also another element that can contribute to the sustainability of the system, developing up to the currently installed capacity and even expanding it in some specific areas (from 30.0 hm3/year to 55.2 hm3/year). Irrigation efficiency is considered to be able to increase from the current 54% to 80% in all the systems applying drip irrigation, except in rice crops in the 5JU system. Finally, fully developing the existing interconnections between basins will make the water management more flexible, improving the CTA index in some basins.
Under natural resources’ reduction to 20%, corresponding with the three cases of RCP4.5 medium and long term and RCP8.5 medium term, the measures considered here were enough to obtain similar or better values of the CTA and WTA, so the water resource systems can be sustainable. The results (Figure 7) showed greater improvements in the WTA index than in the CTA index, associated with the greater reduction in irrigation diversions.
In the most pessimistic case, RCP8.5 long term (2071–2100), natural resources are expected to see a 27% reduction, making it necessary to implement additional measures to guarantee the system’s sustainability. In this extreme case, it will be necessary to: Increase reclaimed water use up to 80%, for which it will be necessary to develop additional water storage infrastructure. Connect systems on the demand side, redistributing water supply to urban demands and changing the main water source to Valencia city, from the Júcar to the Turia systems (30% from Júcar and 70% from Turia, the opposite situation to the current one). Increase desalinated water in the Júcar system by 60 hm3/year, and the reduction of net irrigation demands should also be considered in this situation. Only under these conditions is it possible to maintain the indices at similar values to the current ones.
Wastewater treatment plants that allow direct reuse of treated wastewater are usually located in areas near the coast, such as the cities of Valencia, Alicante, and Castellón, as well as seawater desalination plants. Desalination, wastewater treatment, both located at low altitude (Figure 8), and their subsequent elevation to agricultural areas are large energy consumers, so exploitation costs will be high, making the economic viability of these resources in agriculture difficult. For these reasons, a combination of these facilities, treatment plants, desalination plants, and pumping stations, with photovoltaic solar facilities can reduce the cost of energy and make them viable for farmers [46]. Starting by moving water from downstream to upstream can be the main measure to adapt highly stressed basins to climate change.

4. Conclusions

Comparing the current water scarcity indices with those obtained under climate change scenarios in each water resource system is a quick method that enabled us to define long-term strategic approaches for adapting basin management to climate change. Additionally, it offered a comprehensive global overview of all the water resource systems and the entire river basin district. This approach is enough for the medium and long term considering uncertainties associated with climate change scenarios and the global behaviour of the economy. After that, more time-consuming water management models can provide additional information with more detail on the final effect of these measures in the water resource systems’ management, both in the short term (6–12 years) and the medium term (around 30 years).
Water resource systems in the Júcar River Basin District in the last decades have been highly stressed, but not in critical conditions, and have been able to overcome several periods of drought. For this reason, general indices, such as Indicator 6.4.2/WEI and WEI+, need to adjust their overall thresholds to more accurately capture the historical behaviour of these basins. The outcomes derived from these indices closely resembled those obtained from the CTA and WTA. Consequently, both sets of indices proved valuable for investigating the shifts in water scarcity under climate change scenarios.
Climate change will intensify water scarcity in the basins that are currently experiencing water stress. The Mediterranean basins are some of the most vulnerable areas to climate change, and their natural water resources are projected to decrease by approximately 20% across most scenarios: RCP4.5 in the medium and long term (2041–2070 and 2071–2100, respectively) and RCP8.5 in the medium term. In the worst-case scenario, RCP8.5 in the long term, this reduction could reach up to 27%.
Under the climate change scenarios RCP4.5 medium and long-term and RCP8.5 medium term, the main environmentally and economically efficient measures to adapt highly stressed basins and reduce their vulnerability include increasing reclaimed water in irrigation, increasing seawater desalination, increasing the irrigation efficiency, and increase the water interconnections between water resource systems. In this case study, under a 20% natural resource reduction, reclaimed water must increase from 20% to 50% (from 91 hm3/year to 229 hm3/year) of the treated wastewater, seawater desalination must increase from 30 hm3/year to 55 hm3/year, irrigation efficiency must increase from 54% to 80%, and finally, the water interconnections between water resource systems must be fully developed.
In the extreme scenario, RCP8.5 in the long term, with a 27% reduction in natural water resources, additional measures must be developed, such as further increasing the use of reclaimed water to 80%, which will require the construction of large water storage tanks, increasing the water desalination, considering the possibility of a reduction in irrigation areas or changing the types of crops, and making changes to the water source to meet supply demands.

Author Contributions

Conceptualization, C.E.-S., M.Á.P.-M. and Q.J.W.; Methodology, M.Á.P.-M.; Validation, M.Á.P.-M.; Formal analysis, C.E.-S. and M.Á.P.-M.; Investigation, C.E.-S. and M.Á.P.-M.; Writing—original draft, C.E.-S. and M.Á.P.-M.; Writing—review & editing, C.E.-S., M.Á.P.-M. and Q.J.W.; Visualization, C.E.-S. and M.Á.P.-M.; Supervision, M.Á.P.-M. and Q.J.W. All authors have read and agreed to the published version of the manuscript.

Funding

This research received no external funding.

Data Availability Statement

Data available on request due to restrictions.

Acknowledgments

The authors would like to thank the Universitat Politècnica de València and University Ministry, and the Plan de Recuperación Transformación y Resiliencia, founded by NextGenerationEU. The authors would like to thank the Spanish Climate Change Office and the Júcar River Basin Authority—JRBA—for their cooperation in the compilation of this paper. Additionally, we would like to thank the Biodiversity Foundation of the Ministry for the Ecological Transition and the Demographic Challenge. We acknowledge the World Climate Research Programme’s Working Group on Regional Climate, the Working Group on Coupled Modelling, the former coordinating body of CORDEX, and the panel responsible for CMIP5. We also acknowledge the Earth System Grid Federation infrastructure, an international effort led by the U.S. Department of Energy’s Program for Climate Model Diagnosis and Intercomparison, the European Network for Earth System Modelling, and other partners in the Global Organisation for Earth System Science Portals (GO-ESSP).

Conflicts of Interest

The author declares no conflicts of interest.

References

  1. Huang, Z.; Yuan, X.; Liu, X. The key drivers for the changes in global water scarcity: Water withdrawal versus water availability. J. Hydrol. 2021, 601, 126658, ISSN 0022-1694. [Google Scholar] [CrossRef]
  2. Falkenmark, M.; Lundqvist, J.; Widstrand, C. Macro-scale water scarcity requires micro-scale approaches. Nat. Resour. Forum 1989, 13, 258–267. [Google Scholar] [CrossRef] [PubMed]
  3. Alcamo, J.; Henrichs, T.; Rösch, T. World Water in 2025-Global Modeling and Scenario Analysis for the World Commission on Water for the 21st Century; Kassel World Water Series; University of Kassel: Kassel, Germany, 2000. [Google Scholar]
  4. Vörösmarty, C.J.; Green, P.; Salisbury, J.; Lammers, R.B. Global Water Resources: Vulnerability from Climate Change and Population Growth. Science 2000, 289, 284–288. [Google Scholar] [CrossRef] [PubMed]
  5. Alcamo, J.; Döll, P.; Henrichs, T.; Kaspar, F.; Lehner, B.; Rösch, T.; Siebert, S. Global estimates of water withdrawals and availability under current and future “business-as-usual” conditions. Hydrol. Sci. J. 2003, 48, 339–348. [Google Scholar] [CrossRef]
  6. Liu, J.; Yang, H.; Gosling, S.N.; Kummu, M.; Flörke, M.; Pfister, S.; Hanasaki, N.; Wada, Y.; Zhang, X.; Zheng, C.; et al. Water scarcity assessments in the past, present, and future. Earth’s Futur. 2017, 5, 545–559. [Google Scholar] [CrossRef] [PubMed]
  7. Raskin, P.D.; Hansen, E.; Margolis, R.M. Water and sustainability. Nat. Resour. Forum 1996, 20, 1–15. [Google Scholar] [CrossRef]
  8. Hoekstra, A.Y.; Chapagain, A.K.; Aldaya, M.M.; Mekonnen, M.M. The Water Footprint Assessment Manual: Setting the Global Standard; Earthscan: London, UK; Washington, DC, USA, 2011. [Google Scholar]
  9. Food and Agriculture Organization of the United Nations (FAO). FAO and UN Water Progress on Level of Water Stress. Global Status and Acceleration Needs for SDG Indicator 6.4.2; Food and Agriculture Organization of the United Nations (FAO): Rome, Italy, 2021; ISBN 9789251348260. [Google Scholar]
  10. Damkjaer, S.; Taylor, R. The measurement of water scarcity: Defining a meaningful indicator. AMBIO 2017, 46, 513–531. [Google Scholar] [CrossRef] [PubMed]
  11. Vanham, D.; Hoekstra, A.Y.; Wada, Y.; Bouraoui, F.; De Roo, A.; Mekonnen, M.M.; Van De Bund, W.J.; Batelaan, O.; Pavelic, P.; Bastiaanssen, W.G.M.; et al. Physical water scarcity metrics for monitoring progress towards SDG target 6.4: An evaluation of indicator 6.4.2 “Level of water stress”. Sci. Total Environ. 2018, 613–614, 218–232. [Google Scholar] [CrossRef] [PubMed]
  12. Fitton, N.; Alexander, P.; Arnell, N.; Bajzelj, B.; Calvin, K.; Doelman, J.; Gerber, J.; Havlik, P.; Hasegawa, T.; Herrero, M.; et al. The vulnerabilities of agricultural land and food production to future water scarcity. Glob. Environ. Chang. 2019, 58, 101944, ISSN 0959-3780. [Google Scholar] [CrossRef]
  13. Mekonnen, M.M.; Hoekstra, A.Y. Four billion people facing severe water scarcity. Sci. Adv. 2016, 2, e1500323. [Google Scholar] [CrossRef]
  14. Gosling, S.N.; Arnell, N.W. A global assessment of the impact of climate change on water scarcity. Clim. Chang. 2016, 134, 371–385. [Google Scholar] [CrossRef]
  15. Schewe, J.; Heinke, J.; Gerten, D.; Haddeland, I.; Arnell, N.W.; Clark, D.B.; Dankers, R.; Eisner, S.; Fekete, B.M.; Colón-González, F.J.; et al. Multimodel assessment of water scarcity under climate change. Proc. Natl. Acad. Sci. USA 2014, 111, 3245–3250. [Google Scholar] [CrossRef] [PubMed]
  16. Hejazi, M.I.; Edmonds, J.; Clarke, L.; Kyle, P.; Davies, E.; Chaturvedi, V.; Wise, M.; Patel, P.; Eom, J.; Calvin, K. Integrated assessment of global water scarcity over the 21st century under multiple climate change mitigation policies. Hydrol. Earth Syst. Sci. 2014, 18, 2859–2883. [Google Scholar] [CrossRef]
  17. Estrela, T.; Pérez-Martin, M.A.; Vargas, E. Impacts of climate change on water resources in Spain. Hydrol. Sci. J. 2012, 57, 1154–1167. [Google Scholar] [CrossRef]
  18. Savenije, H. Water scarcity indicators; the deception of the numbers. Phys. Chem. Earth Part B Hydrol. Ocean. Atmos. 2000, 25, 199–204. [Google Scholar] [CrossRef]
  19. Pedro-Monzonís, M.; Solera, A.; Ferrer, J.; Estrela, T.; Paredes-Arquiola, J. A review of water scarcity and drought indexes in water resources planning and management. J. Hydrol. 2015, 527, 482–493. [Google Scholar] [CrossRef]
  20. European Commission (EC); Margat, J.; Detoc, S.; Carmi, N.; Iglesias, A.; Khalifa, E.; Gabina, D.; Davy, T.; Blinda, M.; Tagar, Z.; et al. Mediterranean Water Scarcity and Drought Report–Technical Report on Water Scarcity and Drought Management in the Mediterranean and the Water Framework Directive; Directorate-General for Environment; European Commission: Brussels, Belgium, 2011.
  21. Rijsberman, F.R. Water scarcity: Fact or fiction? Agric. Water Manag. 2006, 80, 5–22. [Google Scholar] [CrossRef]
  22. Rockström, J.; Falkenmark, M.; Karlberg, L.; Hoff, H.; Rost, S.; Gerten, D. Future water availability for global food production: The potential of green water for increasing resilience to global change. Water Resour. Res. 2009, 45, W00A12. [Google Scholar] [CrossRef]
  23. Casadei, S.; Peppoloni, F.; Pierleoni, A. A New Approach to Calculate the Water Exploitation Index (WEI+). Water 2020, 12, 3227. [Google Scholar] [CrossRef]
  24. Dolan, F.; Lamontagne, J.; Link, R.; Hejazi, M.; Reed, P.; Edmonds, J. Evaluating the economic impact of water scarcity in a changing world. Nat. Commun. 2021, 12, 1915. [Google Scholar] [CrossRef]
  25. Filho, W.L.; Totin, E.; Franke, J.A.; Andrew, S.M.; Abubakar, I.R.; Azadi, H.; Nunn, P.D.; Ouweneel, B.; Williams, P.A.; Simpson, N.P. Understanding responses to climate-related water scarcity in Africa. Sci. Total Environ. 2021, 806, 150420. [Google Scholar] [CrossRef]
  26. Andreu, J.; Capilla, J.; Sanchis, E. AQUATOOL, a generalized decision-support system for water-resources planning and operational management. J. Hydrol. 1996, 177, 269–291. [Google Scholar] [CrossRef]
  27. CEDEX. Evaluation of the Impact of Climate Change on Water Resources and Droughts in Spain; CEDEX Hydrographic Studies Center: Madrid, Spain, 2017. [Google Scholar]
  28. Estrela-Segrelles, C.; Gómez-Martinez, G.; Pérez-Martín, M.Á. Risk assessment of climate change impacts on Mediterranean coastal wetlands. Application in Júcar River Basin District (Spain). Sci. Total Environ. 2021, 790, 148032. [Google Scholar] [CrossRef]
  29. Estrela-Segrelles, C.; Gómez-Martínez, G.; Pérez-Martín, M.Á. Climate Change Risks on Mediterranean River Ecosystems and Adaptation Measures (Spain). Water Resour. Manag. 2023, 37, 2757–2770. [Google Scholar] [CrossRef]
  30. FAO. IMI-SDG6-Integrated Monitoring Initiative for SDG 6–Step-by-Step Monitoring Methodology for SDG Indicator 6.4.1. 2019. Available online: www.fao.org/3/ca8484en/ca8484en.pdf (accessed on 13 August 2021).
  31. Pérez-Martín, M.A.; Estrela, T.; Andreu, J.; Ferrer, J. Modeling Water Resources and River-Aquifer Interaction in the Júcar River Basin, Spain. Water Resour. Manag. 2014, 28, 4337–4358. [Google Scholar] [CrossRef]
  32. Pérez-Martín, M.A.; Estrela, T.; Del-Amo, P. Measures required to reach the nitrate objectives in groundwater based on a long-term nitrate model for large river basins (Júcar, Spain). Sci. Total Environ. 2016, 566–567, 122–133. [Google Scholar] [CrossRef]
  33. IPCC. Climate Change 2013: The Physical Science Basis. Contribution of Working Group I to the Fifth Assessment Report of the Intergovernmental Panel on Climate Change; Stocker, T.F., Qin, D., Plattner, G.-K., Tignor, M., Allen, S.K., Boschung, J., Nauels, A., Xia, Y., Bex, V., Midgley, P.M., Eds.; Cambridge University Press: Cambridge, UK; New York, NY, USA, 2013; p. 1535. [Google Scholar] [CrossRef]
  34. CEDEX. Incorporation of Climate Change to Third Cycle Hydrological Plans; Nota. 26 de octubre; CEDEX Hydrographic Studies Center: Madrid, Spain, 2020. [Google Scholar]
  35. CHJ. Júcar River Basin Management Plan; Júcar River Basin Authority: Cuenca, Spain, 2021. [Google Scholar]
  36. BOE-A-2008-15340; Order ARM/2656/2008, of September 10, Approving the Hydrological Planning Instruction. Spanish Environmental Ministry: Madrid, Spain, 2008.
  37. Martínez-Medina, M.A. Methodological Proposal for Estimating Irrigation Water Needs in Hydrological Planning: Ap-plication in the Júcar River Basin District. Master’s Thesis, Polytechnical University of Valencia, Valencia, Spain, 2021. [Google Scholar]
  38. MITECO. Ministry for the Ecological Transition and the Demographic Challenge, Spain. 2024. Available online: https://escenarios.adaptecca.es/ (accessed on 10 March 2024).
  39. Ortega-Gómez, T.; Pérez-Martín, M.A.; Estrela, T. Improvement of the drought indicators system in the Júcar River Basin, Spain. Sci. Total Environ. 2018, 610–611, 276–290. [Google Scholar] [CrossRef]
  40. Urquijo, J.; De Stefano, L. Perception of Drought and Local Responses by Farmers: A Perspective from the Jucar River Basin, Spain. Water Resour. Manag. 2016, 30, 577–591. [Google Scholar] [CrossRef]
  41. Rubio-Martin, A.; Pulido-Velazquez, M.; Macian-Sorribes, H.; Garcia-Prats, A. System Dynamics Modeling for Supporting Drought-Oriented Management of the Jucar River System, Spain. Water 2020, 12, 1407. [Google Scholar] [CrossRef]
  42. Wheeler, S.; Carmody, E.; Grafton, R.; Kingsford, R.; Zuo, A. The rebound effect on water extraction from subsidising irrigation infrastructure in Australia. Resour. Conserv. Recycl. 2020, 159, 104755. [Google Scholar] [CrossRef]
  43. Pérez-Martín, M.Á.; Arora, M.; Estrela, T. Defining the Maximum Nitrogen Surplus in Water Management Plans to Recover Nitrate Polluted Aquifers in Spain. J. Environ. Manag. 2024, 356, 120770. [Google Scholar] [CrossRef] [PubMed]
  44. Pérez-Martín, M.Á.; Benedito-Castillo, S. Fertigation to recover nitrate-polluted aquifer and improve a long time eutrophicated lake, Spain. Sci. Total Environ. 2023, 894, 165020. [Google Scholar] [CrossRef] [PubMed]
  45. Pérez-Martín, M.Á. Understanding Nutrient Loads from Catchment and Eutrophication in a Salt Lagoon: The Mar Menor Case. Water 2023, 15, 3569. [Google Scholar] [CrossRef]
  46. Martínez, G.G.; Martín, M.Á.P. Water Management Adaptation to Climate Change in Mediterranean Semiarid Regions by Desalination and Photovoltaic Solar Energy, Spain. Water 2023, 15, 3239. [Google Scholar] [CrossRef]
Figure 1. Júcar River Basin District (JRBD) location (a), including its water resource systems (b).
Water 16 01004 g001
Figure 2. CTA and WTA indices at the water resource system scale.
Water 16 01004 g002
Figure 3. Annual temperature and relative precipitation anomalies for the JRBD for the scenarios RCP4.5 and RCP8.5, the 10-year moving average and the confidence interval (range between q25ph and q75ph).
Water 16 01004 g003
Figure 4. Minimum and maximum temperature and precipitation anomalies for the whole JRBD under scenarios RCP4.5 and RCP8.5 for the medium term (2041–2070) and long term (2071–2100).
Water 16 01004 g004
Figure 5. Natural resource changes under climate change scenarios.
Water 16 01004 g005
Figure 6. CTA and WTA indices under climate change scenarios.
Water 16 01004 g006
Figure 7. CTA (net abstraction vs. resources) and WTA (gross abstraction vs. resources) indices, in current conditions, under climate change scenarios (variability range RCP4.5 and RCP8.5) and with measures (variability range with measures RCP4.5 and with measures RCP8.5).
Water 16 01004 g007
Figure 8. Main measures to adapt Mediterranean river basins to climate change for the scenarios RCP4.5 medium and long term and RCP8.5 medium term.
Water 16 01004 g008
Table 1. Threshold levels for the CTA and WTA indexes and values established for the FAO index (Colors express the water scarcity level).
LevelCTAWTAFAO UN6.4.2/WEI
No stress<0.20<0.25<0.25
Low0.20–0.300.25–0.500.25–0.50
Medium0.30–0.400.50–0.750.50–0.75
High0.40–0.700.75–1.250.75–1.00
Critical>0.70>1.25>1.00
Table 2. WTA and CTA indexes for the water resource systems and the JRBD (bold indicates the sum of the components or water resources systems).
Components1CM2MP3PV4TU5JU6SE7MA8MB9VAJRBD
Renewable resources (hm3/year)231.3417.189.1422.41409.6202.2230.269.693.83165.3
Reclaimed water (hm3/year) (1)0.52.60.144.73.72.61.38.327.691.4
Seawater desalination (hm3/year)7.51.87.10.00.00.00.00.013.630.0
Transfer input (hm3/year)0.00.00.00.05.00.00.00.071.276.2
Total water resources (hm3/year) (AWR)239.3421.596.3467.11418.3204.8231.577.9206.23362.9
Wastewater (hm3) (2)15.437.69.9177.489.428.015.821.456.4451.2
Ratio of reclaimed/treated wastewater (1)/(2)0.030.070.010.250.040.090.080.390.490.20
Urban net abstraction (hm3/year)3.59.31.016.437.65.06.24.717.6101.3
Industrial net abstraction (hm3/year)0.75.40.78.828.21.80.91.48.856.6
Agricultural net abstraction (hm3/year)54.5106.139.9175.8735.944.933.713.794.11298.5
Total net abstraction (hm3/year) (NA)58.7120.841.5201.1801.851.740.719.7120.51456.4
CTA Index = NA/AWR0.250.290.430.430.570.250.180.250.580.43
Urban gross derivation (hm3/year)17.746.44.982.2188.125.130.823.388.0506.4
Industrial gross derivation (hm3/year)2.121.73.440.456.78.41.92.036.3172.8
Agricultural gross derivation (hm3/year)88.9176.074.3433.91364.480.952.025.1127.22422.7
Total gross abstraction (hm3/year) (GA)108.6244.282.6556.51609.1114.484.650.3251.63101.9
WTA Index = GA/AWR0.450.580.861.191.130.560.370.651.220.92
Transfer output (hm3/year) (3) 15.0 15.0
Not derived resources (hm3/year) (4) = AWR-NA-(3)180.6300.754.8266.1601.5153.1190.858.285.71891.4
Environmental requirements (hm3/year) (ER)114.937.512.731.5131.245.758.015.323.3470.1
Ratio = (4)/ER1.68.04.38.44.63.43.33.83.74.0
WEI+ = NA/(AWR-ER)0.470.310.500.460.620.320.230.310.660.50
FAO UN6.4.2/WEI = GA/(AWR-ER)0.870.640.991.281.250.720.490.801.381.07
Table 3. Main measures to adapt water resource systems to climate change: current and future conditions, including the defined measures.
Water Resource SystemTreated Water, hm3Reclaimed Water, hm3Reclaimed Water, hm3Desalinated Water, hm3Desalinated Water, hm3Irrigation EfficiencyIrrigation EfficiencyExternal Inputs, hm3External Inputs, hm3
CurrentCurrentFutureCurrentFutureCurrentFutureCurrentFuture
1CM Cenia-Maestrazgo15.40.57.57.57.561%80%
2MP Mijares-Plana de Castellón37.62.612.71.810.960%80%
3PV Palancia-Los Valles9.90.11.07.18.454%80%
4TU Turia177.444.747.90.00.041%80%
5JU Júcar89.43.771.90.00.054%75%5.05.0
6SE Sérpis28.02.67.00.00.055%80%
7MA Marina Alta15.81.310.20.00.065%80%
8MB Marina Baja21.48.313.00.00.055%80%
9VA Vinalopó-Alacantí56.427.652.413.618.374%90%71.290.3
JRBD451.291.4223.630.055.254%78%76.295.3
Disclaimer/Publisher’s Note: The statements, opinions and data contained in all publications are solely those of the individual author(s) and contributor(s) and not of MDPI and/or the editor(s). MDPI and/or the editor(s) disclaim responsibility for any injury to people or property resulting from any ideas, methods, instructions or products referred to in the content.

