Synoptic Analysis of Flood-Causing Rainfall and Flood Characteristics in the Source Area of the Yellow River
Abstract
1. Introduction
2. Data and Methods
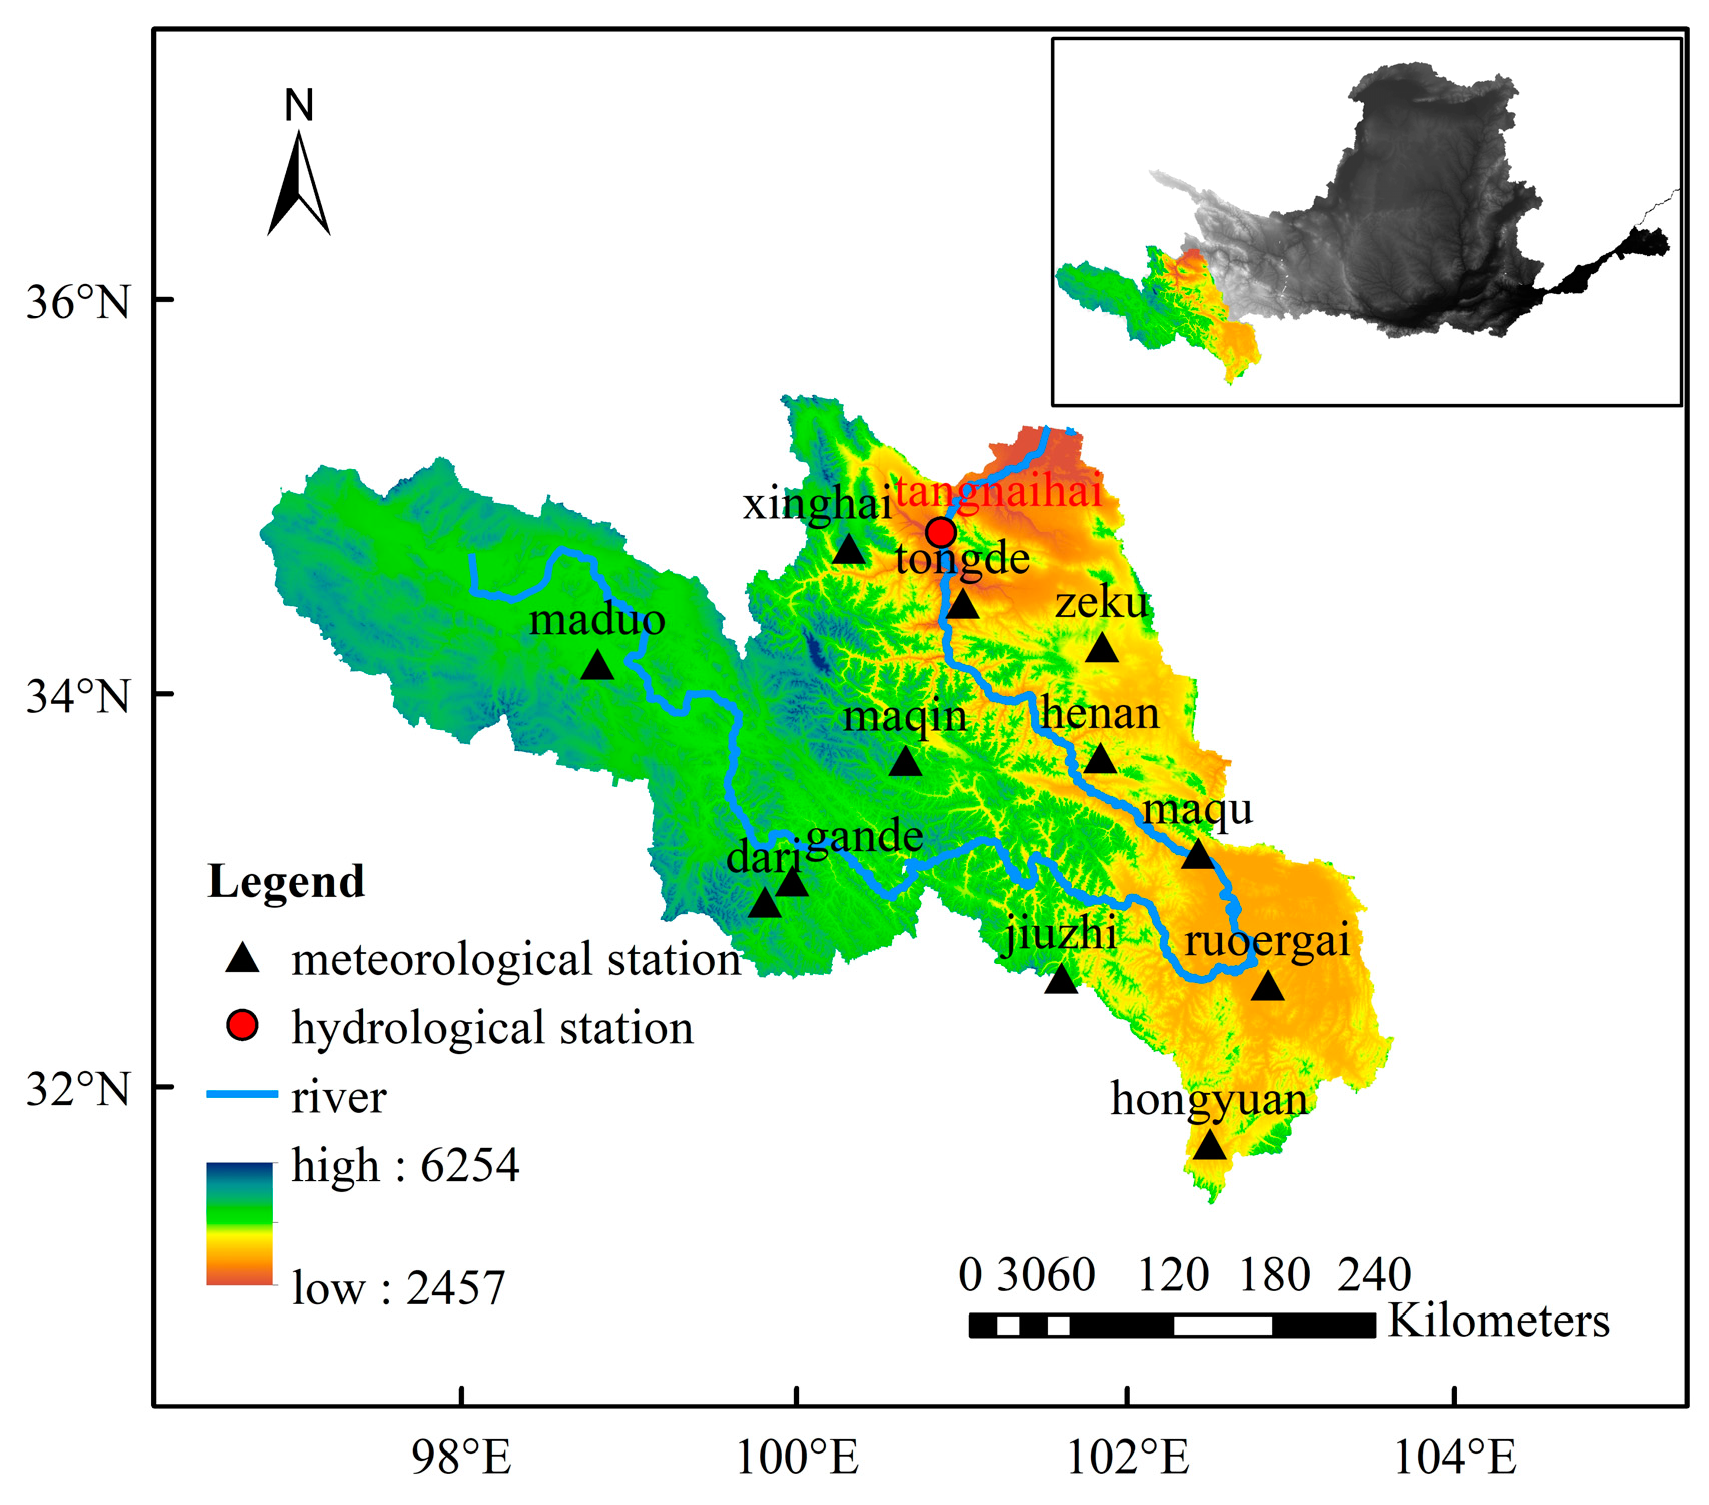
2.1. Study Area
2.2. Data
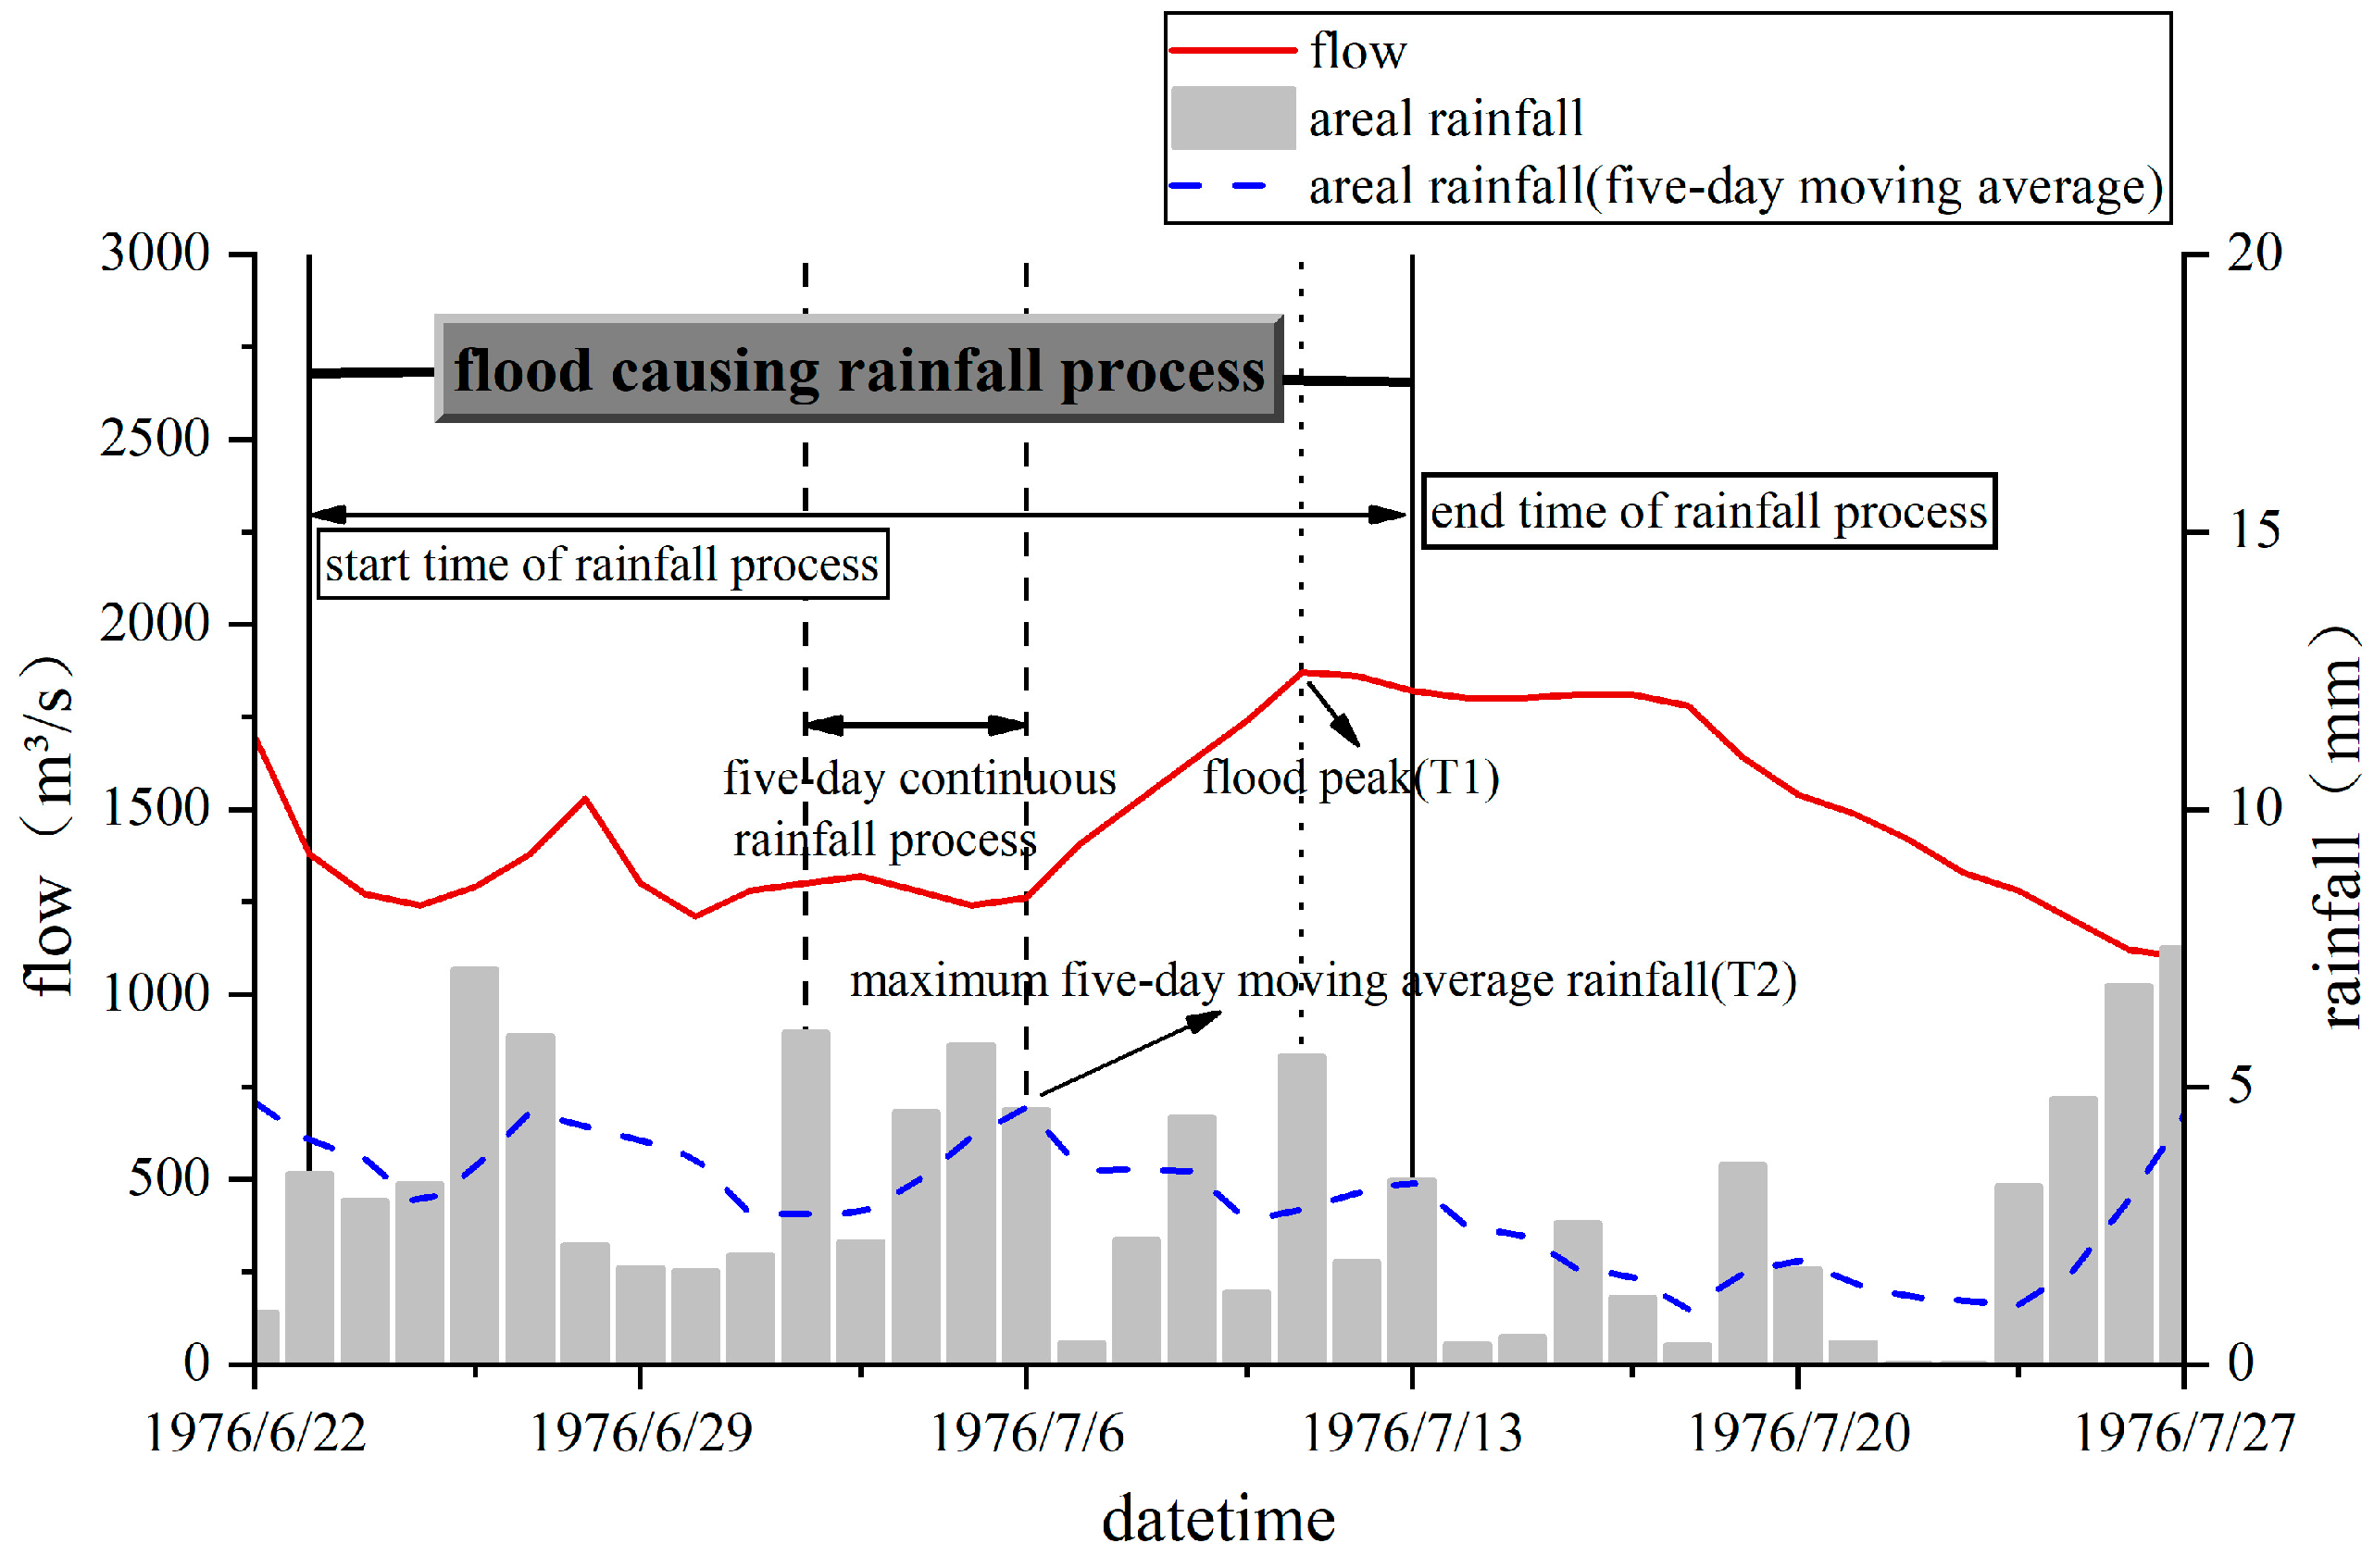
2.3. Definition of Flood
2.4. Definition of Rainfall Process
2.5. Methods
3. Results
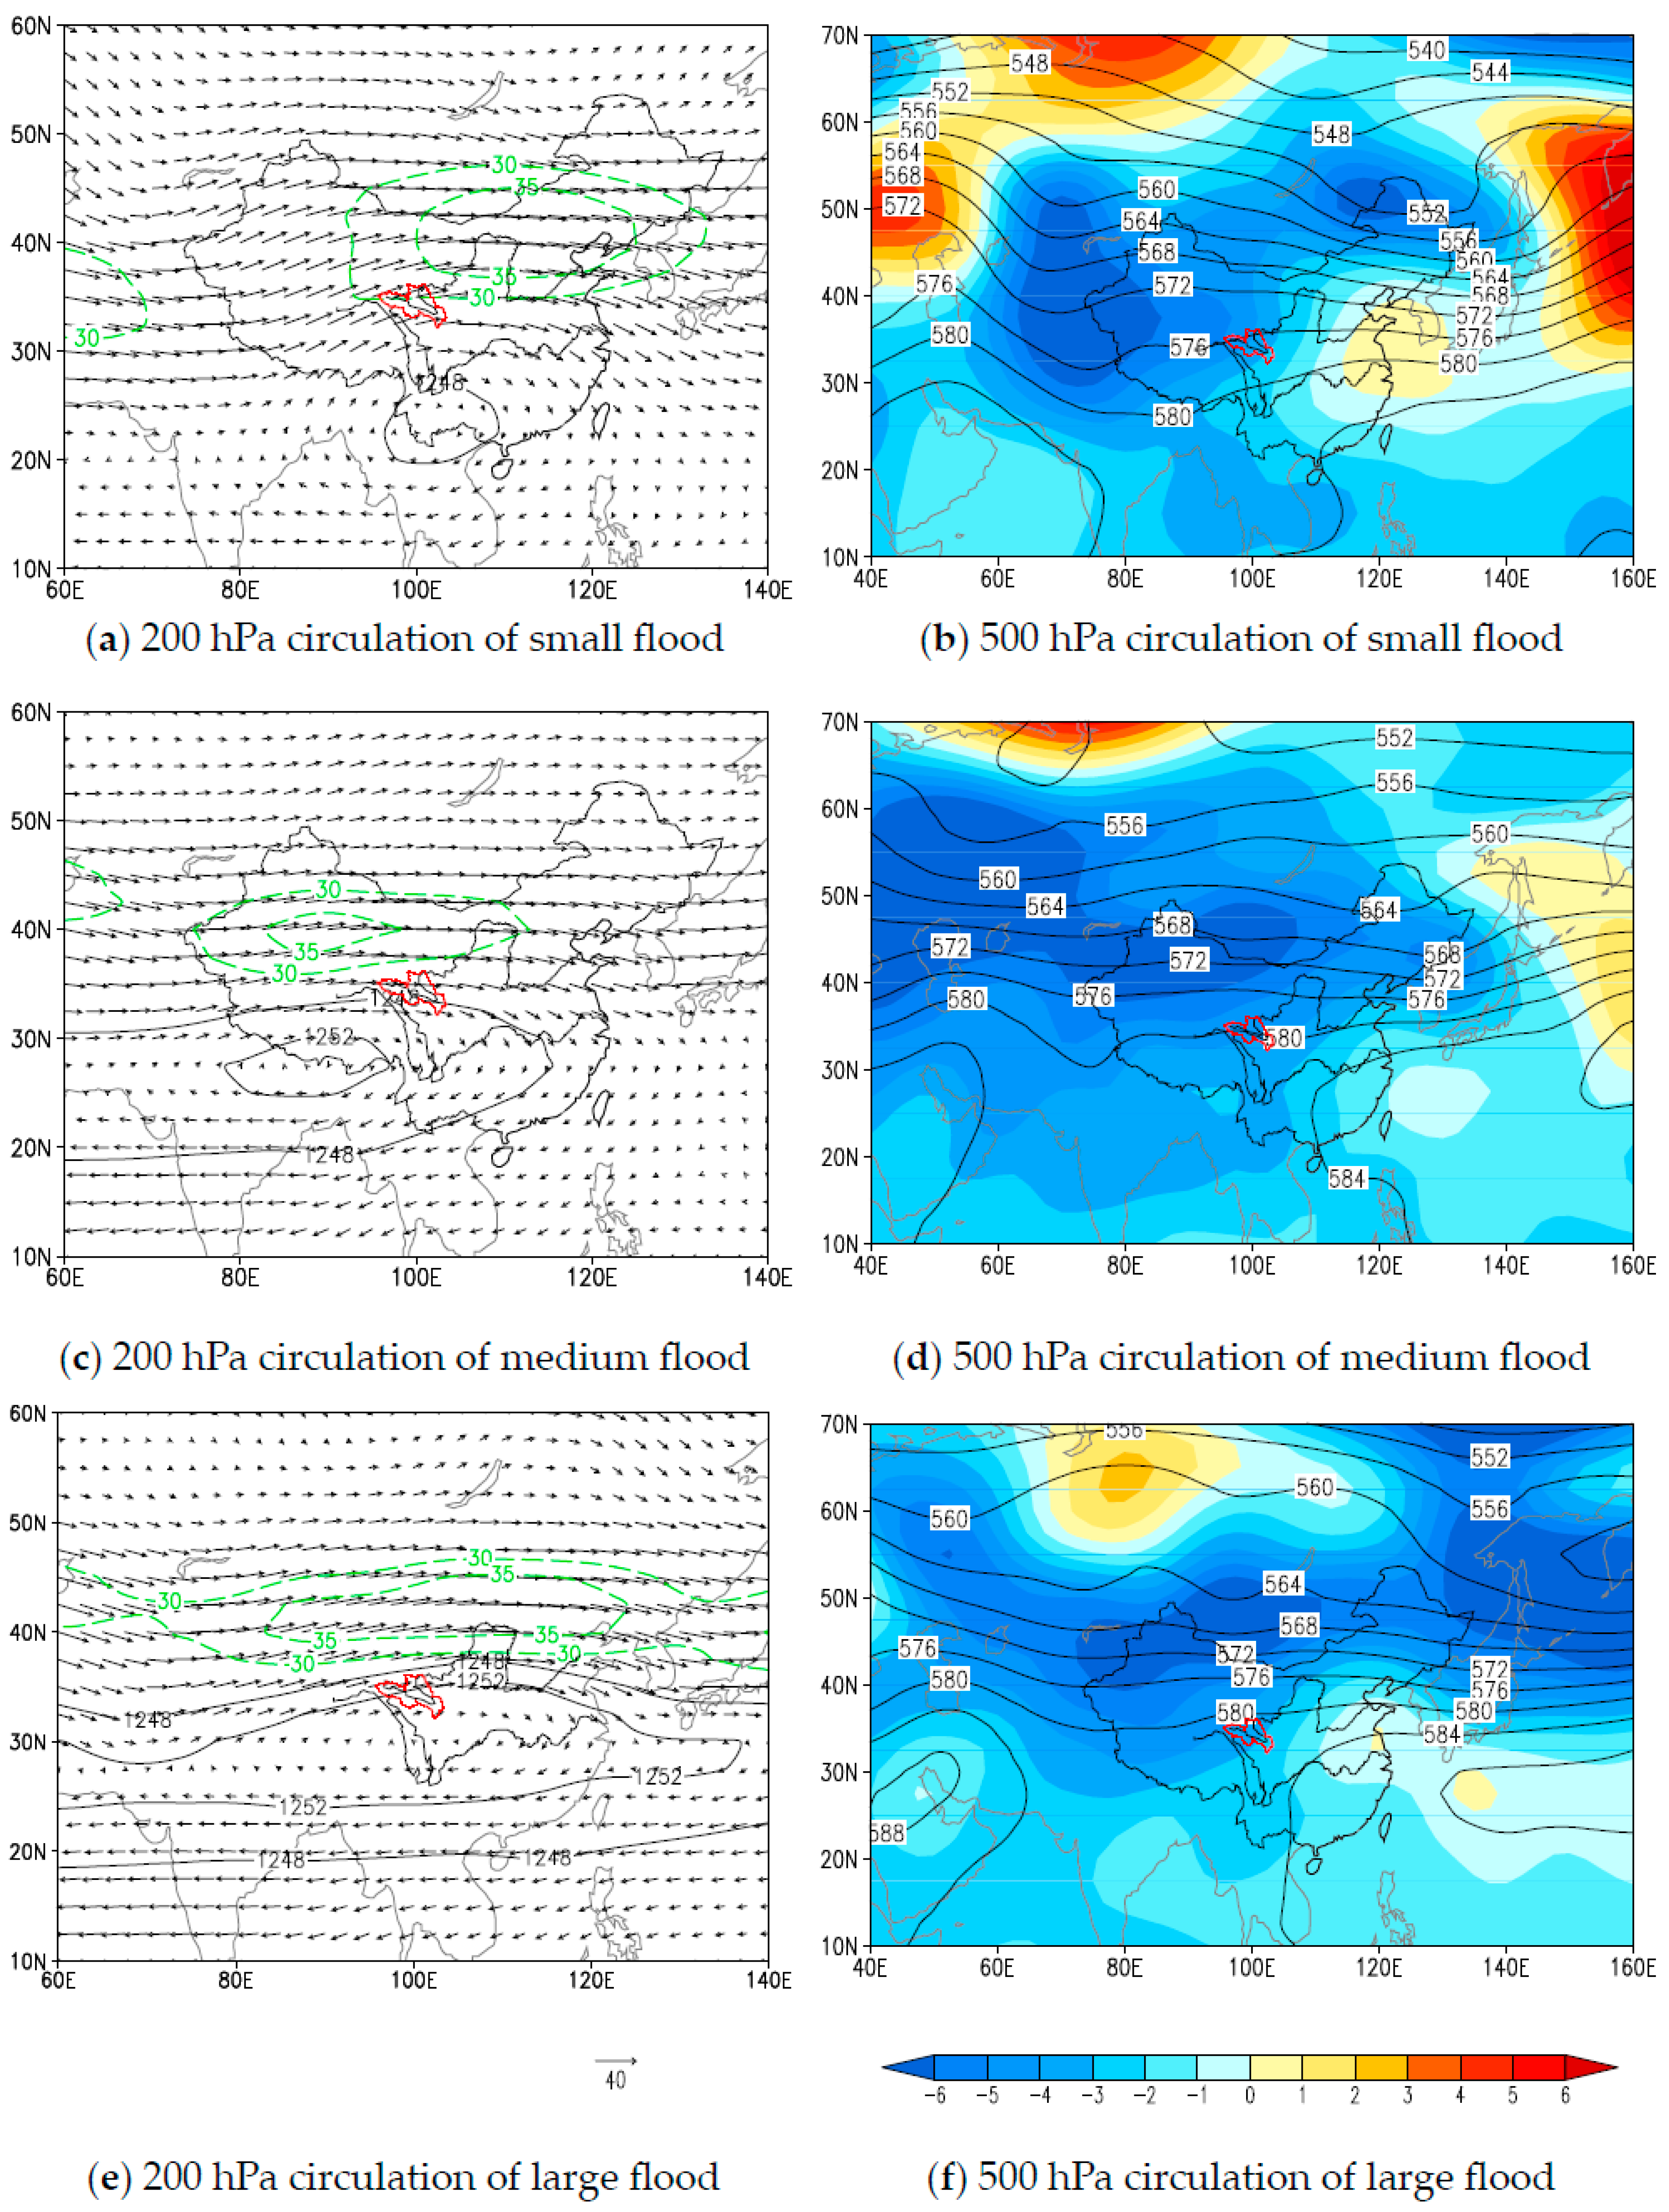
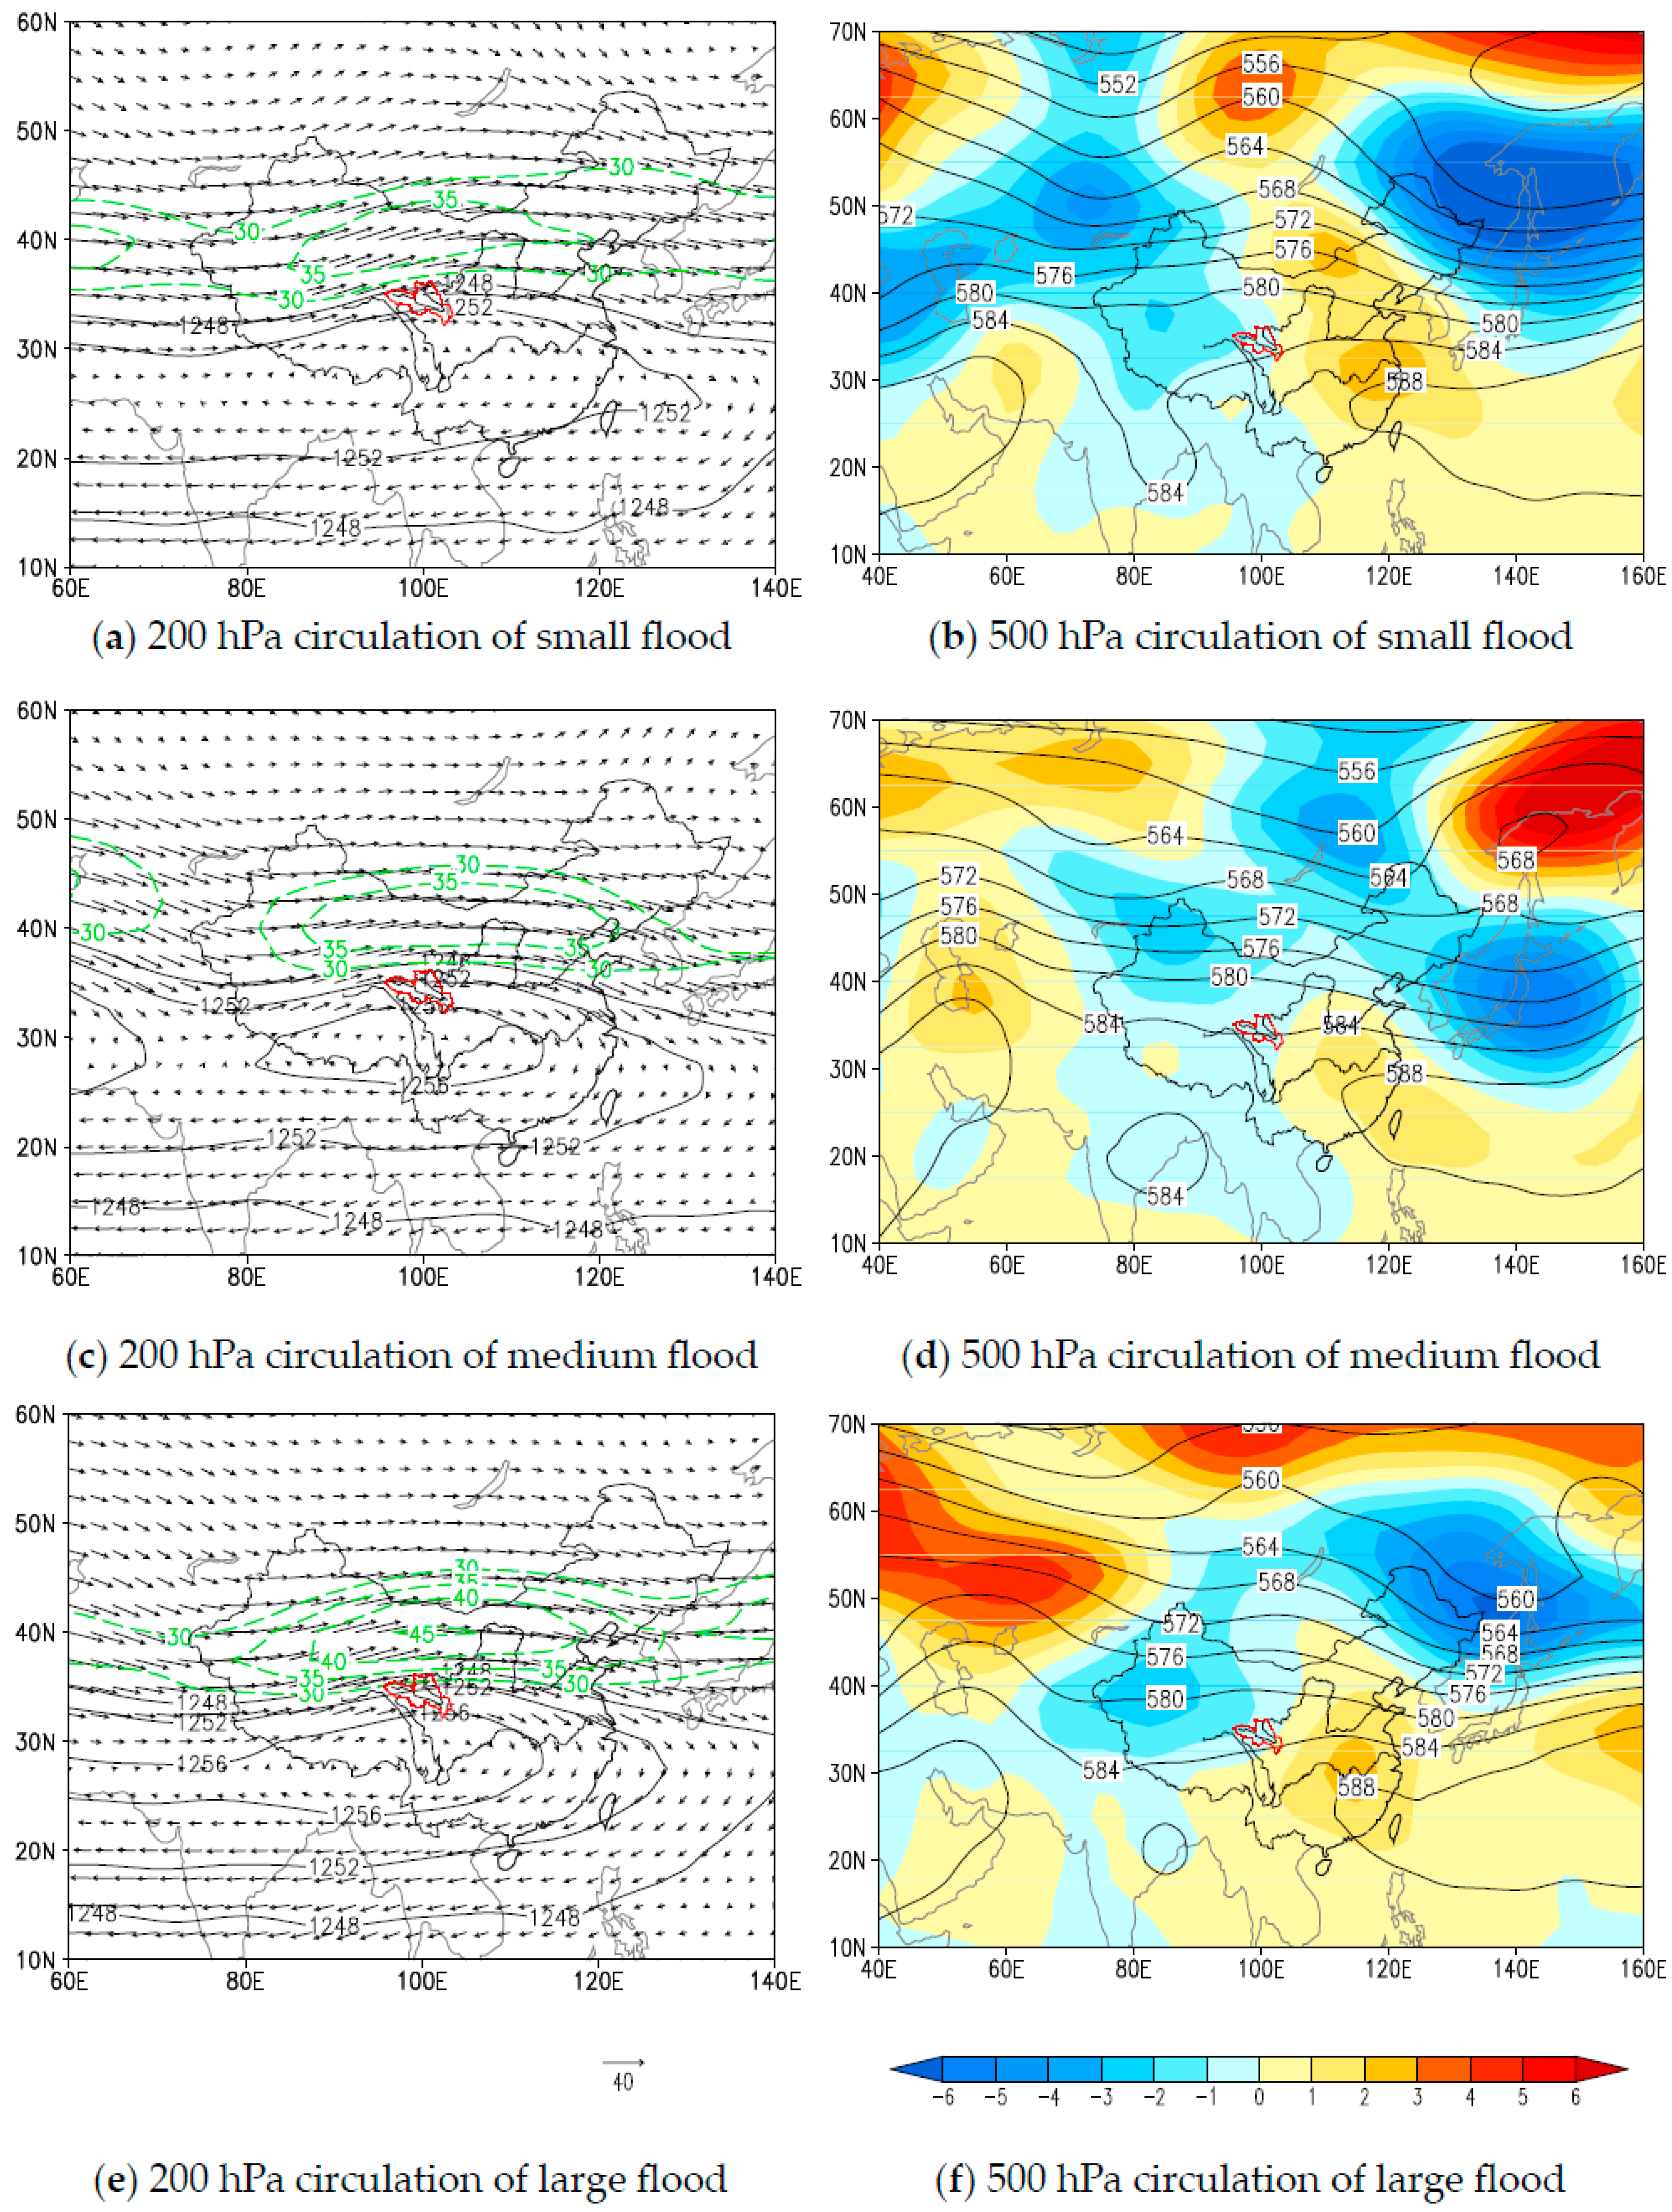
3.1. Circulation Background of Three Weather Types
3.1.1. Westerly Trough Type (Type I)
3.1.2. Low Vortex Shear Type (Type II)
3.1.3. Subtropical High Southwest Flow Type (Type Ⅲ)
3.2. Characteristics of Physical Quantity of Three Weather Types
3.3. Synoptic Model of Flood-Causing Rainfall
3.4. Flood Characteristics of Three Weather Types
4. Discussion
5. Conclusions
- The flood-causing rainfall in the SAYR can be classified into westerly trough type (type I), low vortex shear type (type II) and subtropical high southwest flow type (type III). In type I, the circulation is relatively flat and fluctuating at the mid- and high-latitudes, and the Indo-Myanmar depression is relatively strong, causing the warm and wet flow to be transported into the SAYR, where it converges with cold air to form continuous rainfall. In type II, the high-pressure ridge near the Ural Mountains and the Sea of Okhotsk and the low trough over Lake Balkhash, which is between the two highs, are stronger than in other types in the same period of the year. The low vortex is generated at the lower levels and is accompanied by the shear line. The shear line moves eastwards to cause rainfall in the SAYR. In type III, the Balkhash Lake trough is strong, and the northerly wind behind the trough leads the cold air to converge with the southwesterly warm and wet flow around the WPSH periphery, producing heavy rainfall. In the three types, the SAH is stronger and extends more eastward than the other types in the same period of the year, the upper-level jet expands northward, the WPSH in the type II and type III is stronger and extends more westward than the other types in the same period of the year, but that is eastward in type I, and the effect is not obvious.
- After statistical analysis of the physical quantities, it is found that the dynamic, water vapor, and thermal conditions of the three weather types are favorable. Heavy rainfall occurs in areas with low-level convergence, high-level negative vorticity, low-level positive vorticity, convergent water vapor flux in the whole layer, a certain atmospheric precipitable water, and low-level cold advection. The water vapor condition and dynamic condition of the large flood are better than those of the medium and small floods, but the thermal condition is insufficient, which only shows certain indicative significance at specific levels.
- From the perspective of flow increase and process flood volume, type I has a long duration and relatively small flood volume, and the flood peak and cumulative flood volume corresponding to small flood are the smallest among all weather types. Type II has a short duration and large flood volume. Type III also shows the characteristics of a short duration, with the mean flood peak and cumulative flood volume of the large flood being the largest of all weather types.
Author Contributions
Funding
Data Availability Statement
Acknowledgments
Conflicts of Interest
References
- Wang, M.; Hu, C.; Liu, Y.; Li, L.; Xie, S.; Johnson, K. Precipitation in eastern China over the past millennium varied with large-scale climate patterns. Commun. Earth Environ. 2022, 3, 321. [Google Scholar] [CrossRef]
- Wan, L.; Bento, V.A.; Qu, Y.; Qiu, J.; Song, H.; Zhang, R.; Wu, X.; Xu, F.; Lu, J.; Wang, Q. Drought characteristics and dominant factors across China: Insights from high-resolution daily SPEI dataset between 1979 and 2018. Sci. Total Environ. 2023, 901, 166362. [Google Scholar] [CrossRef]
- Xu, F.; Qu, Y.; Bento, V.A.; Song, H.; Qiu, J.; Qi, J.; Wan, L.; Zhang, R.; Miao, L.; Zhang, X. Understanding climate change impacts on drought in China over the 21st century: A multi-model assessment from CMIP6. npj Clim. Atmos. Sci. 2024, 7, 32. [Google Scholar] [CrossRef]
- Zhang, R.; Bento, V.A.; Qi, J.; Xu, F.; Wu, J.; Qiu, J.; Li, J.; Shui, W.; Wang, Q. The first high spatial resolution multi-scale daily SPI and SPEI raster dataset for drought monitoring and evaluating over China from 1979 to 2018. Big Earth Data 2023, 7, 860–885. [Google Scholar] [CrossRef]
- Hirabayashi, Y.; Mahendran, R.; Koirala, S.; Konoshima, L.; Yamazaki, D.; Watanabe, S.; Kim, H.; Kanae, S. Global flood risk under climate change. Nat. Clim. Chang. 2013, 3, 816–821. [Google Scholar] [CrossRef]
- Kundzewicz, Z.W.; Kanae, S.; Seneviratne, S.I.; Handmer, J.; Nicholls, N.; Peduzzi, P.; Mechler, R.; Bouwer, L.M.; Arnell, N.; Mach, K. Flood risk and climate change: Global and regional perspectives. Hydrol. Sci. J. 2014, 59, 1–28. [Google Scholar] [CrossRef]
- Mukherjee, S.; Aadhar, S.; Stone, D.; Mishra, V. Increase in extreme precipitation events under anthropogenic warming in India. Weather Clim. Extrem. 2018, 20, 45–53. [Google Scholar] [CrossRef]
- Rosenberg, E.A.; Keys, P.W.; Booth, D.B.; Hartley, D.; Burkey, J.; Steinemann, A.C.; Lettenmaier, D.P. Precipitation extremes and the impacts of climate change on stormwater infrastructure in Washington State. Clim. Change 2010, 102, 319–349. [Google Scholar] [CrossRef]
- Wu, X.; Zhang, R.; Bento, V.A.; Leng, S.; Qi, J.; Zeng, J.; Wang, Q. The effect of drought on vegetation gross primary productivity under different vegetation types across China from 2001 to 2020. Remote Sens. 2022, 14, 4658. [Google Scholar] [CrossRef]
- Zhang, R.; Qi, J.; Leng, S.; Wang, Q. Long-term vegetation phenology changes and responses to preseason temperature and precipitation in Northern China. Remote Sens. 2022, 14, 1396. [Google Scholar] [CrossRef]
- Devitt, L.; Neal, J.; Coxon, G.; Savage, J.; Wagener, T. Flood hazard potential reveals global floodplain settlement patterns. Nat. Commun. 2023, 14, 2801. [Google Scholar] [CrossRef]
- Tellman, B.; Sullivan, J.A.; Kuhn, C.; Kettner, A.J.; Doyle, C.S.; Brakenridge, G.R.; Erickson, T.A.; Slayback, D.A. Satellite imaging reveals increased proportion of population exposed to floods. Nature 2021, 596, 80–86. [Google Scholar] [CrossRef] [PubMed]
- Blöschl, G.; Hall, J.; Viglione, A.; Perdigão, R.A.; Parajka, J.; Merz, B.; Lun, D.; Arheimer, B.; Aronica, G.T.; Bilibashi, A. Changing climate both increases and decreases European river floods. Nature 2019, 573, 108–111. [Google Scholar] [CrossRef] [PubMed]
- Fang, G.; Yang, J.; Li, Z.; Chen, Y.; Duan, W.; Amory, C.; De Maeyer, P. Shifting in the global flood timing. Sci. Rep. 2022, 12, 18853. [Google Scholar] [CrossRef] [PubMed]
- Wang, F.; Wang, Z.; Yang, H.; Zhao, Y.; Zhang, Z.; Li, Z.; Hussain, Z. Copula-based drought analysis using Standardized Precipitation Evapotranspiration Index: A case study in the Yellow river basin, China. Water 2019, 11, 1298. [Google Scholar] [CrossRef]
- Xu, Z.; Zhang, S.; Yang, X. Water and sediment yield response to extreme rainfall events in a complex large river basin: A case study of the Yellow River Basin, China. J. Hydrol. 2021, 597, 126183. [Google Scholar] [CrossRef]
- Han, Z.; Zuo, Q.; Wang, C.; Gan, R. Impacts of Climate Change on Natural Runoff in the Yellow River Basin of China during 1961–2020. Water 2023, 15, 929. [Google Scholar] [CrossRef]
- Liang, K.; Liu, S.; Bai, P.; Nie, R. The Yellow River basin becomes wetter or drier? The case as indicated by mean precipitation and extremes during 1961–2012. Theor. Appl. Climatol. 2015, 119, 701–722. [Google Scholar] [CrossRef]
- Su, J.; Lü, H.; Wang, J.; Sadeghi, A.; Zhu, Y. Evaluating the applicability of four latest satellite-gauge combined precipitation estimates for extreme precipitation and streamflow predictions over the upper yellow river basins in China. Remote Sens. 2017, 9, 1176. [Google Scholar] [CrossRef]
- Wu, X.; Guo, S.; Yin, J.; Yang, G.; Zhong, Y.; Liu, D. On the event-based extreme precipitation across China: Time distribution patterns, trends, and return levels. J. Hydrol. 2018, 562, 305–317. [Google Scholar] [CrossRef]
- Yuan, F.; Berndtsson, R.; Zhang, L.; Uvo, C.B.; Hao, Z.; Wang, X.; Yasuda, H. Hydro climatic trend and periodicity for the source region of the Yellow River. J. Hydrol. Eng. 2015, 20, 05015003. [Google Scholar] [CrossRef]
- Lan, Y.; Zhao, G.; Zhang, Y.; Wen, J.; Liu, J.; Hu, X. Response of runoff in the source region of the Yellow River to climate warming. Quat. Int. 2010, 226, 60–65. [Google Scholar] [CrossRef]
- Liu, Y.; Liu, L.; Li, L.; Li, H.; Xu, H.; Yang, J.; Tao, S.; Zhu, B. Changes in Runoff in the Source Region of the Yellow River Basin Based on CMIP6 Data under the Goal of Carbon Neutrality. Water 2023, 15, 2457. [Google Scholar] [CrossRef]
- Tian, H.; Lan, Y.; Wen, J.; Jin, H.; Wang, C.; Wang, X.; Kang, Y. Evidence for a recent warming and wetting in the source area of the Yellow River (SAYR) and its hydrological impacts. J. Geogr. Sci. 2015, 25, 643–668. [Google Scholar] [CrossRef]
- Wang, J.; Chi, Y.; Shi, B.; Yuan, Q.; Wang, X.; Shen, L. Long-term spatiotemporal variability of precipitation and its linkages with atmospheric teleconnections in the Yellow River Basin, China. J. Water Clim. Chang. 2023, 14, 900–915. [Google Scholar] [CrossRef]
- Yang, J.; Zhang, Q.; Yue, P.; Wang, P.; Duan, X.; Zhang, J.; Liang, Z.; Lu, G.; Sun, X.; Wang, X. Characteristics of warming and humidification in the Yellow River’s upper reaches and their impact on surface water resources. Int. J. Climatol. 2023, 43, 7667–7681. [Google Scholar] [CrossRef]
- Jiang, P.; Yu, Z.; Yuan, F.; Acharya, K. The multi-scale temporal variability of extreme precipitation in the source region of the Yellow River. Water 2019, 11, 92. [Google Scholar] [CrossRef]
- Kang, Y.; Peng, X.; Wang, S.; Dong, C.; Shang, K.; Zhao, Y. Statistical characteristics and synoptic situations of long-duration heavy rainfall events over North China. Earth Space Sci. 2020, 7, e2019EA000923. [Google Scholar] [CrossRef]
- Zhao, F.; Xu, Z.; Huang, J. Long-term trend and abrupt change for major climate variables in the upper Yellow River Basin. Acta Meteorol. Sin. 2007, 21, 204. [Google Scholar]
- Yang, H.; Shen, H.; Ma, Y.; Yang, Y.; Wang, X.; Feng, G. Research on the Characteristics and Influence Factors of Autumn Continuous Rain in Qinghai Province. Front. Earth Sci. 2022, 10, 801075. [Google Scholar] [CrossRef]
- Li, Q.; Wei, F.; Li, D. Interdecadal variation of East Asian summer monsoon and drought/flood distribution over eastern China in the last 159 years. J. Geogr. Sci. 2011, 21, 579–593. [Google Scholar] [CrossRef]
- Peng, D.; Zhou, T. Why was the arid and semiarid northwest China getting wetter in the recent decades? J. Geophys. Res. Atmos. 2017, 122, 9060–9075. [Google Scholar] [CrossRef]
- Yuan, F.; Yasuda, H.; Berndtsson, R.; Bertacchi Uvo, C.; Zhang, L.; Hao, Z.; Wang, X. Regional sea-surface temperatures explain spatial and temporal variation of summer precipitation in the source region of the Yellow River. Hydrol. Sci. J. 2016, 61, 1383–1394. [Google Scholar] [CrossRef]
- Liu, Y.; Zhu, Y.; Ren, L.; Singh, V.P.; Yong, B.; Jiang, S.; Yuan, F.; Yang, X. Understanding the spatiotemporal links between meteorological and hydrological droughts from a three-dimensional perspective. J. Geophys. Res. Atmos. 2019, 124, 3090–3109. [Google Scholar] [CrossRef]
- Nalley, D.; Adamowski, J.; Biswas, A.; Gharabaghi, B.; Hu, W. A multiscale and multivariate analysis of precipitation and streamflow variability in relation to ENSO, NAO and PDO. J. Hydrol. 2019, 574, 288–307. [Google Scholar] [CrossRef]
- Liu, Y.; Chen, H.; Hu, X. The unstable relationship between the precipitation dipole pattern in the Tibetan Plateau and summer NAO. Geophys. Res. Lett. 2021, 48, e2020GL091941. [Google Scholar] [CrossRef]
- Wang, J.; Shi, B.; Pan, X.; Liu, L. Multi-scale Characteristics of Precipitation and Its Relationship with ENSO and AO. J. Coast. Res. 2020, 104, 23–28. [Google Scholar] [CrossRef]
- Jin, L.; Liu, G.; Wei, X.; Zhang, T.; Feng, Y. Joint Contribution of Preceding Pacific SST and Yunnan-Guizhou Plateau Soil Moisture to September Precipitation over the Middle Reaches of the Yellow River. Atmosphere 2022, 13, 1737. [Google Scholar] [CrossRef]
- Tao, J.; Qiao, W.; Li, H.; Qu, X.; Gan, R. Spatial and temporal evolution characteristics and causes of drought and flood in the Henan section of the Yellow River. Nat. Hazards 2022, 113, 997–1016. [Google Scholar] [CrossRef]
- Zhang, Y.; Huang, C.C.; Pang, J.; Zha, X.; Zhou, Y.; Gu, H. Holocene paleofloods related to climatic events in the upper reaches of the Hanjiang River valley, middle Yangtze River basin, China. Geomorphology 2013, 195, 1–12. [Google Scholar] [CrossRef]
- Yuan, F.; Wang, B.; Shi, C.; Cui, W.; Zhao, C.; Liu, Y.; Ren, L.; Zhang, L.; Zhu, Y.; Chen, T. Evaluation of hydrological utility of IMERG Final run V05 and TMPA 3B42V7 satellite precipitation products in the Yellow River source region, China. J. Hydrol. 2018, 567, 696–711. [Google Scholar] [CrossRef]
- Hu, Y.; Maskey, S.; Uhlenbrook, S.; Zhao, H. Streamflow trends and climate linkages in the source region of the Yellow River, China. Hydrol. Process. 2011, 25, 3399–3411. [Google Scholar] [CrossRef]
- Xu, S.; Yu, Z.; Yang, C.; Ji, X.; Zhang, K. Trends in evapotranspiration and their responses to climate change and vegetation greening over the upper reaches of the Yellow River Basin. Agric. For. Meteorol. 2018, 263, 118–129. [Google Scholar] [CrossRef]
- Kalnay, E.; Kanamitsu, M.; Kistler, R.; Collins, W.; Deaven, D.; Gandin, L.; Iredell, M.; Saha, S.; White, G.; Woollen, J. The NCEP/NCAR 40-year reanalysis project. In Renewable Energy; Routledge: London, UK, 2018; pp. Vol1_146–Vol141_194. [Google Scholar]
- Ministry of Water Resources of the People’s Republic of China. Provisions on Flood Numbering of Major Rivers in the Country; Ministry of Water Resources of the People’s Republic of China: Beijing, China, 2019; pp. 3–4. (In Chinese)
- Havens, K.; Paerl, H.; Phlips, E.; Zhu, M.; Beaver, J.; Srifa, A. Extreme weather events and climate variability provide a lens to how shallow lakes may respond to climate change. Water 2016, 8, 229. [Google Scholar] [CrossRef]
- Zhang, Q.; Yang, J.; Duan, X.; Ma, P.; Lu, G.; Zhu, B.; Liu, X.; Yue, P.; Wang, Y.; Liu, W. The eastward expansion of the climate humidification trend in northwest China and the synergistic influences on the circulation mechanism. Clim. Dyn. 2022, 59, 2481–2497. [Google Scholar] [CrossRef]
- Choi, H.-Y.; Ha, J.-H.; Lee, D.-K.; Kuo, Y.-H. Analysis and simulation of mesoscale convective systems accompanying heavy rainfall: The Goyang case. Asia-Pac. J. Atmos. Sci. 2011, 47, 265–279. [Google Scholar] [CrossRef]
- Houze, R.A., Jr. Mesoscale convective systems. Rev. Geophys. 2004, 42, 4. [Google Scholar] [CrossRef]



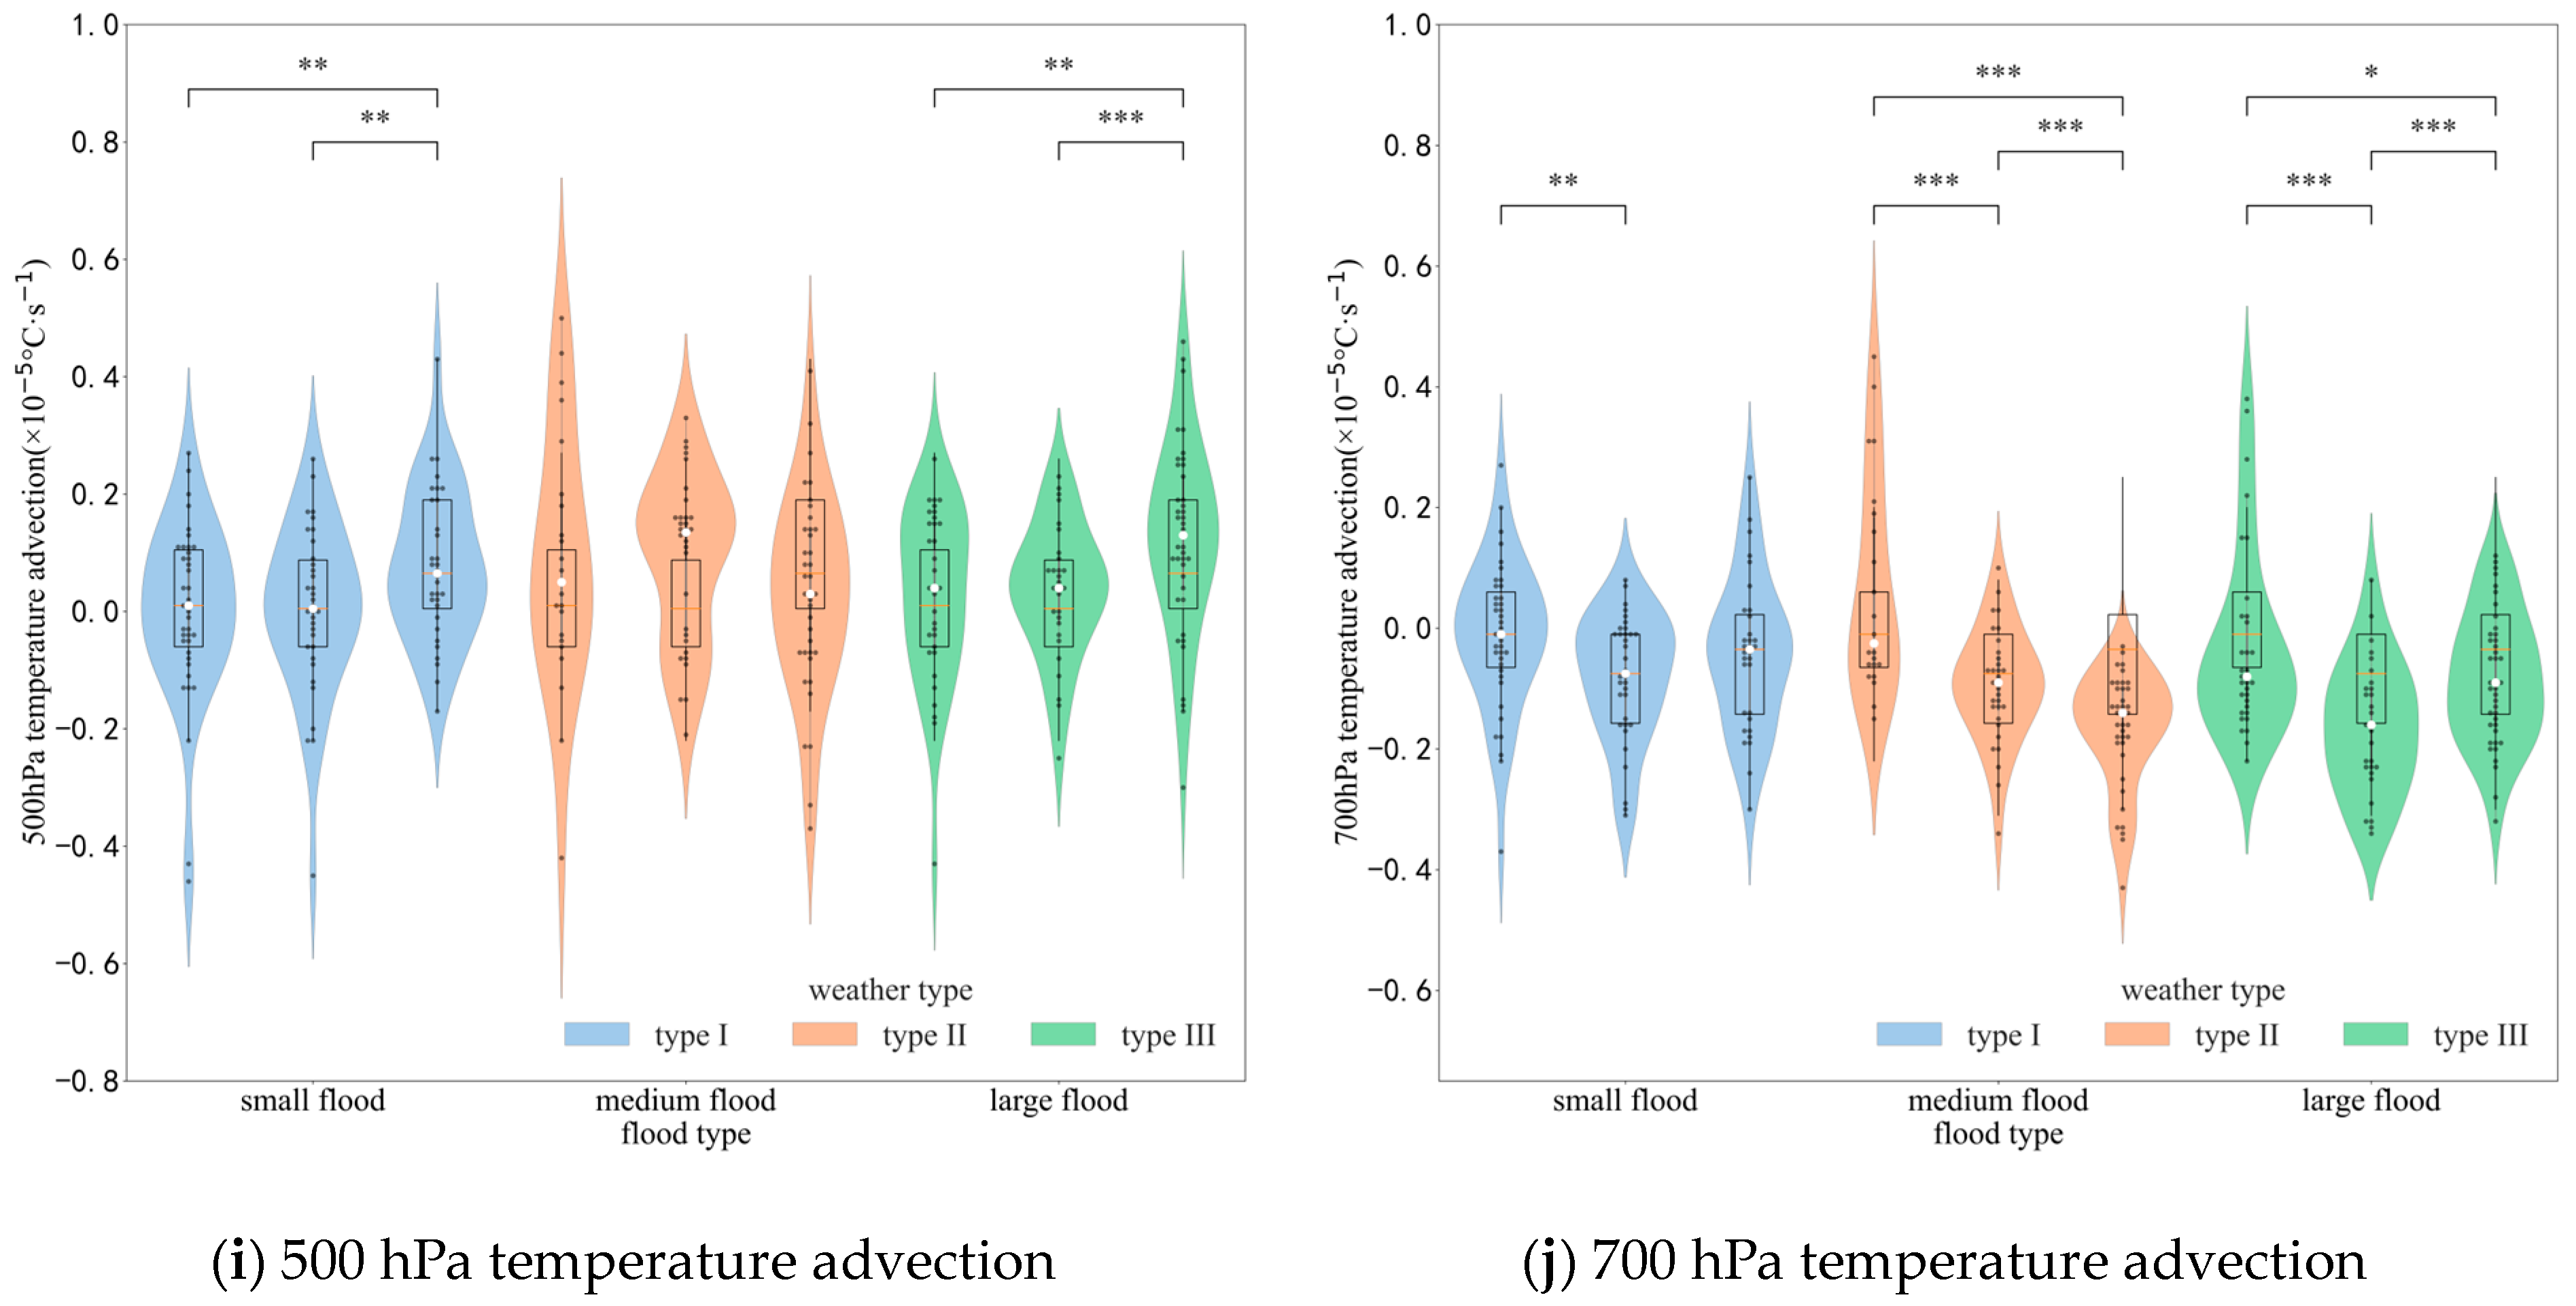

| Div200 (×10−6 s−1) | Div500 (×10−6 s−1) | Div700 (×10−6 s−1) | Vor200 (×10−6 s−1) | Vor500 (×10−6 s−1) | Vor700 (×10−6 s−1) | VF (×10−8 g·cm−2·hPa−1·s−1) | PW (mm) | T500 (×10−5 °C·s−1) | T700 (×10−5 °C·s−1) | ||
|---|---|---|---|---|---|---|---|---|---|---|---|
| Type I | Small flood | - | - | −3.66 | −22.18 | - | 4.31 | - | 1.07 | - | - |
| Medium flood | - | - | −4.19 | −25.80 | - | 1.39 | - | 1.08 | - | - | |
| Large flood | - | - | −3.23 | −30.59 | - | 2.15 | −0.08 | 1.36 | - | - | |
| Type II | Small flood | - | - | −1.83 | −9.03 | - | 0.31 | - | 1.18 | - | −0.01 |
| Medium flood | - | - | −3.64 | −21.31 | −3.40 | - | −1.86 | 1.05 | - | −0.04 | |
| Large flood | - | - | −1.98 | −27.78 | - | 2.62 | −2.78 | 1.74 | - | −0.10 | |
| Type III | Small flood | 1.18 | - | −4.15 | −29.24 | - | 3.28 | −2.79 | 1.36 | - | −0.03 |
| Medium flood | 1.17 | - | −3.49 | −26.98 | - | 2.57 | −2.90 | 1.46 | - | −0.10 | |
| Large flood | 0.28 | - | −5.20 | −32.63 | - | 4.94 | −4.10 | 1.44 | 0.03 | −0.01 |
| Flood Peak (m3/s) | Process Flood Increase (m3/s) | Process Flood Volume (×108 m3) | Maximum 3 Day Flood Volume (×108 m3) | Maximum 5 Day Flood Volume (×108 m3) | Duration (days) | ||
|---|---|---|---|---|---|---|---|
| Type I | Small flood | 1521 | 801 | 11.7 | 3.6 | 5.8 | 13 |
| Medium flood | 2102 | 811 | 16.2 | 5.1 | 8.1 | 12 | |
| Large flood | 2709 | 1500 | 22.2 | 6.8 | 10.7 | 13 | |
| Type II | Small flood | 1645 | 492 | 13.0 | 4.1 | 6.5 | 10 |
| Medium flood | 2203 | 906 | 14.6 | 5.4 | 8.4 | 10 | |
| Large flood | 2762 | 1086 | 23.7 | 6.7 | 10.5 | 13 | |
| Type III | Small flood | 1643 | 615 | 12.0 | 4.1 | 6.4 | 10 |
| Medium flood | 2211 | 1065 | 20.0 | 5.3 | 8.4 | 12 | |
| Large flood | 2827 | 1505 | 20.2 | 6.8 | 10.5 | 12 |
Disclaimer/Publisher’s Note: The statements, opinions and data contained in all publications are solely those of the individual author(s) and contributor(s) and not of MDPI and/or the editor(s). MDPI and/or the editor(s) disclaim responsibility for any injury to people or property resulting from any ideas, methods, instructions or products referred to in the content. |
© 2024 by the authors. Licensee MDPI, Basel, Switzerland. This article is an open access article distributed under the terms and conditions of the Creative Commons Attribution (CC BY) license (https://creativecommons.org/licenses/by/4.0/).
Share and Cite
Jin, L.; Yan, C.; Yuan, B.; Liu, J.; Liu, J. Synoptic Analysis of Flood-Causing Rainfall and Flood Characteristics in the Source Area of the Yellow River. Water 2024, 16, 857. https://doi.org/10.3390/w16060857
Jin L, Yan C, Yuan B, Liu J, Liu J. Synoptic Analysis of Flood-Causing Rainfall and Flood Characteristics in the Source Area of the Yellow River. Water. 2024; 16(6):857. https://doi.org/10.3390/w16060857
Chicago/Turabian StyleJin, Lijun, Changsheng Yan, Baojun Yuan, Jing Liu, and Jifeng Liu. 2024. "Synoptic Analysis of Flood-Causing Rainfall and Flood Characteristics in the Source Area of the Yellow River" Water 16, no. 6: 857. https://doi.org/10.3390/w16060857
APA StyleJin, L., Yan, C., Yuan, B., Liu, J., & Liu, J. (2024). Synoptic Analysis of Flood-Causing Rainfall and Flood Characteristics in the Source Area of the Yellow River. Water, 16(6), 857. https://doi.org/10.3390/w16060857


