Abstract
The instability of geological slopes in mining environments poses a significant challenge to the safety and efficiency of operations. Waste Dump#2 at the Ziluoyi Iron Mine in China is a notable case study that highlights the challenges associated with sizable base slopes and large step heights. To address hidden hazards in the mine and the above issues, an inclusive investigation is carried out to examine the physical and mechanical properties of the soil–rock slope through indoor testing and analyze the deformation mechanisms of the slope using numerical simulations, taking various factors into account. The study reveals that the stability of Waste Dump#2 is deeply affected by weight, groundwater conditions, earthquake loading, and rainfall. To this end, the cohesion and internal friction parameters of the soil–rock slope are first determined through direct shear tests, which show a cohesion of 6.215 kPa at the top of the slope and an internal friction angle of 34.12°. By adopting GEO-SLOPE, 3D Mine, and AutoCAD software, stability calculations of the slope are performed, which give stability coefficients of 1.547 under normal conditions, 1.276 in rainfall, and 1.352 in seismic conditions. These results meet safety standards and ensure the safe and efficient operation of the mine.
1. Introduction
With the continued expansion of open-pit mining operations, excavation depths have gradually deepened, leading to the creation of many distinct topographical features in the form of excavations in mining sites. These excavations continue up to several hundred meters in terms of the slope height of the mine. The existence of such mining slopes poses significant challenges, as their excessive deformations can lead to slope instability and, in extreme cases, geological disasters, which remarkably affect the safety and economic aspects of mining operations [1].
Slope stability analyses mainly use quantitative and qualitative approaches [2], because both aspects affect slope stability. Qualitative analysis requires a comprehensive assessment of the various factors influencing slope instability, allowing rapid assessment of slope stability and future trends. Qualitative factors include aspects such as the failure pattern exhibited by the slope, structural characteristics of rock and soil mass, joint conditions, rock properties, groundwater, and qualitative classification of rock and soil mass [3]. Commonly, quantitative methods rely on precise mathematical or numerical models, including limit equilibrium, finite element, finite difference, and discrete element approaches. The geomechanical and geological factors associated with the quantitative analyses include parameters such as rock cohesion, internal friction angles, slope height, pore water pressure, slope angle, and unit weight of rock and soil, among others [4,5]. The limit equilibrium method (LEM) is often employed in quantitative analysis because it provides a convenient approach to calculating slope safety factors using available data. The LEM is a simple but potentially powerful approach, whose reliability depends on how the input data implemented in the modeling have been derived and selected, as well as the way in which the LEM analysis is employed [6]. However, it should be noted that despite the widespread acceptance of the LEM as the theoretical basis for various assumptions underlying analytical theories and methods, slope stability analyses do not consistently yield the same results in terms of accuracy [7,8]. The choice of slope stability analysis methods depends on several factors such as the level of detail required, data availability, and available resources. In general, a combination of quantitative and qualitative factors is employed for the slope stability analysis, providing a more comprehensive assessment [9,10].
Until now, many research works have been devoted to addressing the challenge of mine slope stability. For instance, Yuan et al. [11] used the finite element method as well as the discrete element method to analyze the stability of three distinct rock slopes and determine the safety factor of the slope section. Rui [12] introduced a computer-based approach for stability analysis of complex soil slopes. A C++ language code was developed to perform stability analysis of complex soil slopes, which led to a gradual enhancement of the accuracy of slope calculations. Yu et al. [13] proposed a numerical simulation approach to evaluate the stability of roadway slopes via ADINA finite element analysis software. The analysis of calculated results revealed that the approach employed to assess slope stability was both simpler and more reasonable in determining highway slope stability. Sun et al. [14] developed a comprehensive fuzzy assessment and analysis model of slope stability and determined its classification index. The obtained results indicated that the model can evaluate regional slope stability and the evaluation results are reasonable. Yin et al. [15] used a combination of numerical simulation, slope ratio method, and other methods to evaluate slope stability, especially for artificial slopes that combine soil and rock. Xie et al. [16] employed Midas GTS 3D software, a finite element-based package, to construct an appropriate complex 3D geological model of slope topography, internal fault, and weak slope structural plane. By taking specific treatments, they were able to overcome the complex geological modeling of the slope such that the software calculation results were reasonably realistic and could provide a useful reference for slope engineering. Guo et al. [17] analyzed the primary factors affecting the stability of the open slope and established the GM (1, N) model based on the Xingshan open-pit design and provided an effective approach to evaluate the stability of the open-pit slope. Guanhua [18] assessed the stability coefficient of stepped slopes in inhomogeneous and anisotropic soils based on the limit analysis methodology as well as the strength reduction method and showed a noticeable effect of the ratio of slope width to slope height (B/H) on the slope stability. Li et al. [19] proposed a simplified method considering the inhomogeneous shear strength of the soil to evaluate slope stability, complementing the existing evaluations of undrained and unreinforced clay slopes. Huang et al. [20] developed a novel methodology to evaluate the three-dimensional stability of frame beam anchor plate (FBAP)-reinforced unsaturated soil slopes, which exhibited a noteworthy improvement in slope stability of about 29–52% using FBAP. Shu et al. [21] proposed a three-dimensional approach that was fully capable of considering the spatial variations of soil properties. The developed approach relied on the plastic limit analysis upper-bound theorem. The obtained results emphasized the substantial influence of nonstationarity and coefficient of shear strength variation on the slope damage width, while also highlighting the linkage among the failure mechanisms, slope inclination, and soil strength.
In addition, Li et al. [22] investigated the stress distribution, strain characteristics, and stability of a 30 m loess slope with a 45° inclination subjected to the action of a power transmission tower. Their findings highlighted that the stability is essentially influenced by factors such as the initial stress state, elastic modulus, Poisson’s ratio, strength, and shape, as well as the structure and load conditions. Ma et al. [23] implemented the finite difference approach and the unified strength theory to analyze the influence of intermediate principal stress on slope stability. The results revealed that the effect of intermediate principal stress on the slope stability in the presence of the joint flow and non-joint flow conditions was equivalent. Zhang et al. [24] considered five slope models with different slope shapes and performed the time-history analysis based on the Newmark scheme to assess the seismic stability of the established slope models with various amplitudes. The results indicated that the orders of seismic stability of slopes with different shapes subjected to identical amplitudes were almost broken line slope, concave slope, linear slope, broken line slope, and convex slope from high to low. Gasmo et al. [25] implemented a numerical model to study the effect of rainfall intensity on slope infiltration and the consequential effect on slope stability, indicating that the infiltration was the highest at the top of the slope. Wang et al. [26] developed a three-dimensional slope stress calculation model and examined the effect of seepage and tailings pressure on slope stability. The results showed that tailings pressure increases the safety factor of the slope stability, while seepage incorporates into the reduction of its safety factor. Liu et al. [27] established a bedding rock slope model by FLAC3D and evaluated its dynamic stability via the quasi-static method, dynamic time history method, and dynamic strength reduction method. The achieved results indicated that the slope stability lessens with the increase in the rock layer inclination and slope angle. Jiang and Zhang [28] utilized the strength reduction method to adjust the elastic parameters to calculate the slope stability. The numerical results indicate that adjusting the elastic parameters has little effect on the stability, but the influence on the slope displacement is more apparent. Xu and Yang [29] calculated the three-dimensional static and seismic stability of a heterogeneous soil slope based on the limit analysis method and the results showed that the triangular distribution pattern had the best effect on strengthening the slope stability followed by the uniform distribution pattern and upwardly strong triangular distribution pattern. Kang et al. [30] employed the generalized Hoek-Brown criterion to evaluate the slope stability of the Chaarat gold mine project, and the results showed that the slope stability is mostly affected by the change of the geological strength index related to the scale effect. Zhao and Jia [31] deeply investigated the change law of the safety factor of slope stability subjected to fluctuating water level conditions, and the results showed that the safety factor of slope stability increases with the rise of water level. Wang et al. [32] introduced the transient saturation-unsaturated seepage states to the finite element-based model to examine the effect of rainfall intensity on slope stability. The achieved results from the research indicated that the intensity of rainfall has little effect on slope stability within 6 h after the rainfall. If the rainfall intensity becomes low, the slope safety factor would be relatively high and vice versa. By combining the finite element method and the shear strength reduction method, Yang [33] proceeded with examining the effect of the initial gravity field on the slope stability analysis as a function of slope height, slope angle, and soil bulk density. The calculation results revealed that the initial gravity field has a great impact on the slope displacement and shear stress, but it almost exhibits no relationship with the slope height, slope angle, or soil bulk density and thereby has little effect on the slope stability safety factor.
Most of the above-mentioned research works were limited to two-dimensional analyses. To generalize the investigation of the problem, Han et al. [34] proposed a slope stability methodology for anisotropic and heterogeneous slopes in the presence of three-dimensional loading conditions according to the upper bound theorem of the limit analysis method, and the results showed that this method is suitable for pure cohesive soil treatment and frictional cohesive soil, isotropic and anisotropic, homogeneous and heterogeneous, loaded and unloaded. Xiao et al. [35] developed a numerical model for slope stability analysis via Midas/GTS to examine the changing trend of loose bulk accumulation on the base slope safety factor, indicating that the upper and lower slopes change respectively. The simulation results compared the effect of slope deformation with the upper slope safety factor. The deformation of the slope also led to the reduction of the slope safety factor, which is more obvious. Sun et al. [36] established a novel slope analysis model (Y-slope W) to assess the stability of the reservoir slope in the presence of the water-rock coupling effect, and the results showed that the fluctuation of the reservoir water level has a remarkable influence on the slope stability, and rapid drawdown is the most unfavorable conditions for slope stability. Rajabian and Shukla [37] established an analytical expression based on the friction circle method by which the safety factor of anchor-reinforced slopes can be predicted via Taylor stability diagrams. A comparison between the factor of safety estimated by the Taylor diagrams and that of the limit equilibrium method using SLIDE indicated a reasonably good agreement between them. Zou et al. [38] applied particle swarm optimization (PSO) as a method for inverting the mechanical parameters of the bank slope. Subsequently, a real-time stability analysis approach was developed to provide high accuracy using constant observed displacements. The results indicated that the PSO effectively retrieves mechanical factors and predicts slope stability in real-time via a combination of observed displacements and numerical simulations.
The body of knowledge in this field has shown that slope instability usually occurs in specific geological contexts and is often caused by various factors, including heavy rainfall and seismic activity. For example, rainfall is able to affect factors such as soil suction, groundwater levels, soil strength, and surface erosion, as well as the interactions among the slope, vegetation, and atmosphere to rule and control the stress-strain state in the slope [39], which ultimately contribute to slope instability. Likewise, the forces generated by the earthquake loading are able to cause landslides [40,41]. In light of these challenges, our study focuses on developing a comprehensive methodology to examine the stability of deep open-pit mine slopes under various conditions, including normal circumstances, rainfall events, and seismic scenarios. Our approach involves integrating the limit equilibrium analysis method with GeoStudio 2021.4, 3D Mine 2023.06, and AutoCAD 2020 software. The accuracy of these calculations is critical in reducing slope failures, which is capable of resulting in noticeable costs and safety risks. A case study conducted on the Waste Dump#2 of Ziluoyi Iron Mine serves as a practical application of our approach. Through this case study, we performed a detailed stability analysis of a Waste Dump#2 slope, elucidated the instability mechanism, and identified the key influencing factors. Furthermore, our research attempts to fill the current gap in slope stability analysis by providing a comprehensive method that considers the influence of geological and environmental factors.
2. Experiments and Methods
The mining method of Ziluoyi Iron Mine of Xinjiang Congling Energy Co., Ltd. follows an open-pit approach. The slope height of the existing station varies in the range of 100 and 200 m, while there are two abandoned waste dumps, each between 100 and 200 m high. In addition, the eastern dry selection station waste dump has a height of 78 m. To proactively mitigate safety risks and prevent incidents that could jeopardize the well-being of teams and mining enterprises, we conducted a stability analysis for Waste Dump#2 (see Figure 1). This analysis was carried out with the aim of clarifying the instability mechanisms and factors affecting the slope stability, thereby ensuring the safe and efficient operation of the mine.
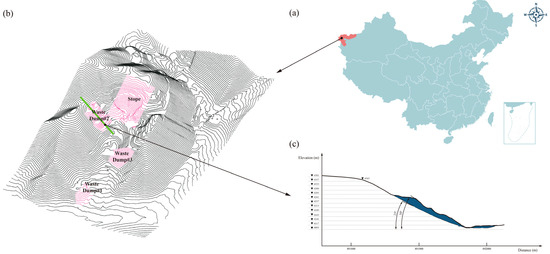
Figure 1.
(a) Location of Ziluoyi Iron Mine; (b) various main parts of the understudied iron mine; (c) cross-sectional profile of Waste Dump#2.
In the inner part of the mining area, the layer structure and hydrogeological conditions are simple, and the hydrologic type in this area is mainly characterized by deep bedrock fracture water. The surface lithology is mostly gravel and bedrock, affected by topography and landform. Atmospheric precipitation and other main recharge cannot constitute the formation conditions of groundwater, and no groundwater was found during the investigation.
A section for our analysis was considered along the direction of material discharge within Waste Dump#2, which provides the profile shape illustrated in Figure 1. The height of the slope is 159 m, with an average slope angle of 30° and an average base angle of 25°.
2.1. Sampling Preparation and Pretesting
Evaluation of both the soil mechanical properties and the strength parameters serves as a basis for establishing effective slope control measures. To determine the strength of the soil in the slope under study and to obtain a comprehensive understanding of the mechanical properties of the soil in Waste Dump#2, representative soil samples were collected at the site. After that, various mechanical properties, including the shear strength, internal friction angle, and cohesion, were evaluated through laboratory tests.
Both the surface disturbance and in-depth soil sampling approaches were employed to collect samples. The samples were collected from the location shown in Figure 2a, i.e., the bottom and top of Waste Dump#2 (No. PTC-2-1). After collecting the samples, each soil sample was quickly sealed with plastic film and labeled with the necessary details, including the soil layer position, sample serial number, sampling location, and depth.
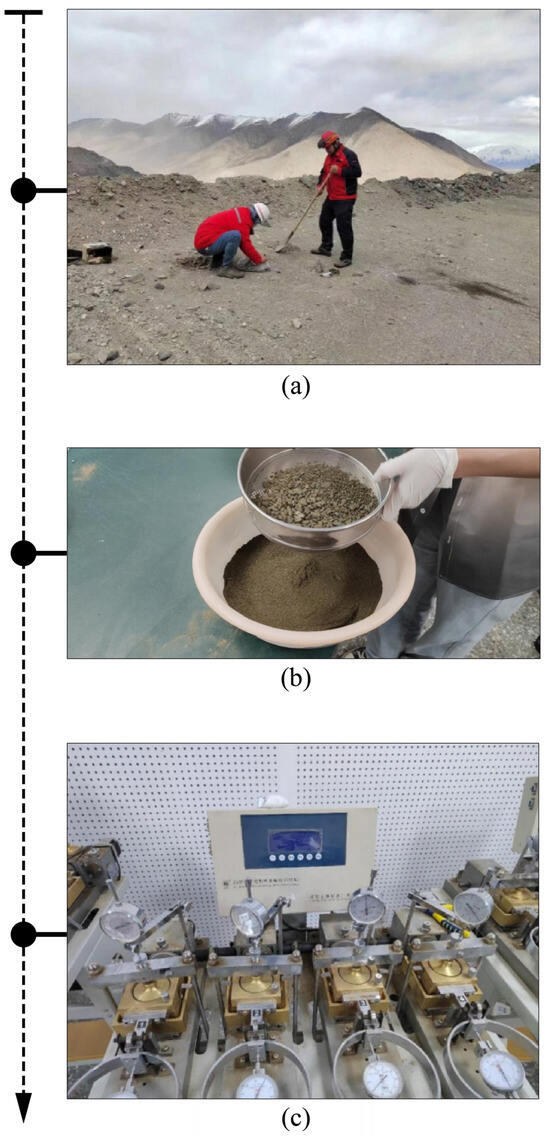
Figure 2.
Sample preparation and testing process in Waste Dump #2: (a) soil sampling, (b) sample sieving, and (c) direct shear testing.
Soil samples were set aside for particle analysis, while the rest were sieved using a 5 mm sieve. The obtained results for the particle size distribution of both the dry and wet soil samples taken from the bottom and top of Waste Dump#2 are demonstrated in Figure 3. Additionally, our further analyses on the dry and wet samples led to the following results for the percentage values of gravel, sand, silt, and clay for the bottom and top samples taken, as presented in Table 1.
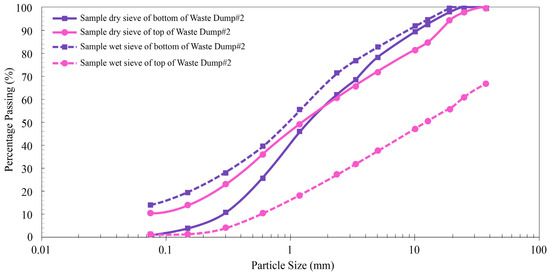
Figure 3.
Particle size distribution curves.

Table 1.
Percentages of various main ingredients of soil in the tested samples.
In addition, some samples sieved through a 2 mm sieve were selected for direct shear testing, as indicated in Figure 2b.
2.2. Experimental Procedure
The experimental approach employed in the present investigation includes direct shear tests, as presented in Figure 2c. A representative air-dried sample, passed through a sieve with a 2 mm hole, exhibited a mass of 1200 g. The amount of air-dried sand required for each sample was measured based on the specific dry density, with an accuracy of 0.1 g. Four samples were selected for each group of tests, and shear tests were performed in the presence of vertical pressures of 100, 200, 300, and 400 kPa, respectively. The test was carried out by starting the stopwatch and performing shear at a speed of 0.8 mm/min to 1.2 mm/min. The runner rotated at a constant speed of 4 to 6 rpm. The samples were subjected to shear damage within 3 to 5 min as the shear deformation reached 4 mm. If the shear stress reading continued to increase, the shear deformation would reach 6 mm with each turn of the wheel. The load sensor or dynamometer reading was measured along with the vertical displacement reading if needed until the shear failure occurred. The shear stress and shear displacement for each sample can be calculated by utilizing Equations (1) and (2):
—shear stress (unit: kPa);
—shear displacement (unit: 0.01 mm);
—calibration coefficient of the measuring force of the ring (unit: kPa/0.01 mm);
—the measuring force ring micrometer reading (unit: 0.01 mm);
—the shear displacement of the rotating wheel to turn a revolution (unit: 0.001 mm);
—the number of revolutions of the rotating wheel.
By plotting the τ − ∆L relationship curve, the peak value or stable value on the curve of shear stress (τ) as a function of the shear displacement (ΔL) is selected as the shear strength of soil ().
By depicting the τ − σ relationship curve, the cohesion (c) and the internal friction angle (φ) are obtained according to the τ − σ relation curve.
The experimental instruments and pieces of equipment for sample testing are provided in Table 2.
Table 2.
Experimental instruments and pieces of equipment.
2.3. Theoretical Foundation
The waste dump classification criteria are detailed in Table 3 (“Standard for waste dump design of nonferrous metal mines” (China National Standard, GB50421-2018)) [42], which presents the waste grading scale. In cases where the main slope of the waste dump exceeded 24°, the waste grade was set at a higher level. In evaluating the stability of the waste dump slope, three distinct working conditions were considered, as depicted in Figure 4.
Table 3.
Classification of waste dumps in terms of volume and height [42].
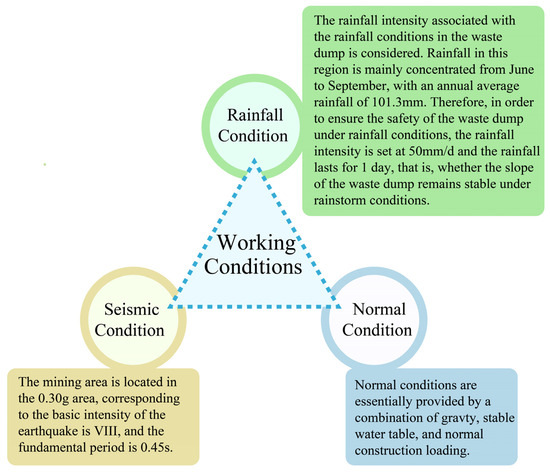
Figure 4.
Considered working conditions in the slope stability analysis.
In the present investigation, a limit equilibrium analysis was meticulously conducted to assess the slope stability. For a simple circular sliding surface, the fundamental principle of such a concept in conjunction with the Bishop–Morgenstern approach is briefly outlined later (see Figure 5).
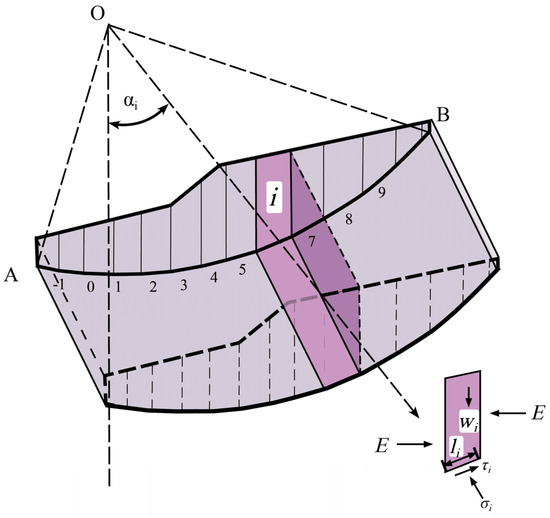
Figure 5.
Sketch of the slope limit equilibrium analysis using the Bishop–Morgenstern (B–M) solution for the case of circular sliding surface.
Assuming that the whole slope is a homogeneous medium and the shear strength obeys the Mohr–Coulomb criterion:
where represents the effective cohesion of the medium, is the effective internal friction angle of the medium, and denotes the effective normal stress on the shear surface.
In the case of considering a circular sliding surface, the safety factor associated with each arc can be simply calculated as follows. Let us divide the sliding body into N vertical bars, assuming that there are no interaction forces between each two adjacent bars [43]. According to the equilibrium scheme used for the arc plane (hereinafter referred to as the equilibrium of forces), we employ Bishop’s simplified method of slices based on the Morgenstern approach, the so-called Bishop–Morgenstern (B-M) solution [38], to assess the factor of safety of the waste dump slope. By this virtue, the factor of safety for circular sliding surfaces can be readily calculated as:
where represents the arc length of the shear surface of the i-th block, is the weight of the i-th block, ui is the pore pressure of the i-th block, denotes the angle between the shear surface of the i-th block and the horizontal surface, Mr is the resistance moment, and Mo denotes the overturning moment.
The above explanations aim to provide a simple pictorial vision of our numerical analysis of safety factors of slopes with circular sliding surfaces. However, to investigate slope stability for general sliding surfaces (i.e., non-circular) and arrive at more rational results, we also utilize the Morgenstern–Price (M–P) method whose wide analytical formulations and corresponding details have been not provided here for the purpose of conciseness.
2.4. Software Selection
This study has been conducted by using a combination of GEO-SLOPE, 3D Mine, and AutoCAD software to assess slope stability. The specific calculation steps are illustrated in Figure 6.
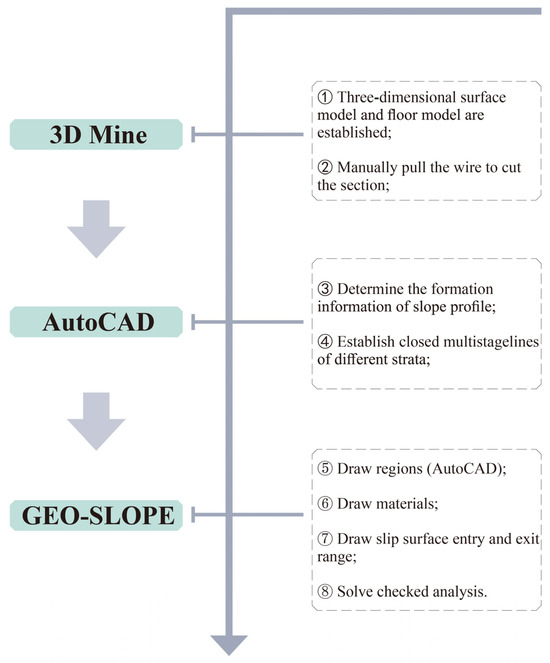
Figure 6.
Various steps of performed calculations via different software development models.
To establish safety and stability standards, the determination takes into account the waste dump grade and the calculated working conditions. Under normal conditions, general safety and stability standards for waste dumps should follow the guidelines specified in Table 4 (“Standard for waste dump design of nonferrous metal mines” (China National Standard, GB50421-2018)) [42].
Table 4.
Safety factor reserve standard for various grades [42].
A general discussion on the failure process of the slopes with granular materials, including temporal and spatial failures, has been now provided in Appendix A and Appendix B.
3. Results and Discussion
3.1. Direct Shear Test Results
Soil samples for the direct shear test were selected from the top of the slope of Waste Dump#2. Comparative tests were performed on various samples in the presence of various vertical pressures. To this end, 12 representative soil samples were selected and divided into three groups (specified by PTC-2-1-1, PTC-2-1-2, and PTC-2-1-3), and four samples were taken from each group. The shear tests of various soil groups were performed under vertical pressures of 100, 200, 300, and 400 kPa.
Figure 7 and Figure 8 illustrate the τ − ∆L and the τ-σ relationship curves obtained by direct shear test and numerical simulation, respectively. From the τ − ∆L relationship curves, it can be seen that the shear strength of different samples changes slightly with the increase of vertical pressure in the initial stage of loading. With continuous loading, especially at the end of the loading period, the shear strength of the specimen increases obviously with the growth of the vertical pressure. According to the τ-σ relationship plots, it can be seen that the stress–strain curves measured by each sample have similar change laws and all of them vary linearly. According to the direct shear test results, the cohesion of Waste Dump#2 is in the range of 4.15–7.40 kPa, and the internal friction angle is placed in the interval of 31.20°–36.95°.
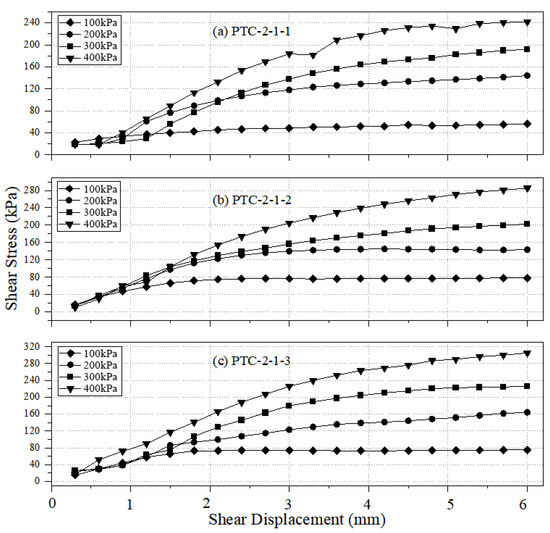
Figure 7.
τ − ∆L plots of various soil samples of Waste Dump#2.
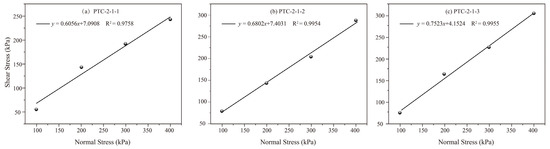
Figure 8.
τ − σ plots of various soil samples of Waste Dump#2.
The slope stratigraphy consists of quartz schist and discharged material and is reported as calculated using the RMR engineering rock evaluation method and the Hoek–Brown criterion. The finalized quartz schist has a bulk density of 26.0 kN/m3, cohesion of 530 kPa, and an internal friction angle of 15.0°. The discharged material has a bulk dry density of 11.23 kN/m3, an average cohesive force of 6.215 kPa, and an average angle of internal friction of 34.12°.
In addition, the average natural moisture content and the specific gravity of the materials of Waste Dump#2 from the performed tests are obtained as: w = 0.34 and Gs = 2.247. Therefore, the void ratio can be calculated as e = 0.963, and the wet and saturated unit weights can be rationally estimated by: kN/m3 and kN/m3.
3.2. Evaluation of the Waste Dump Slope Stability
Let us consider Waste Dump#2 with a height of 159 m; the slope angle is 25°, and the degree of waste dump is Level 1. In accordance with the requirements of the standard specifications, the reserve safety factor is 1.25–1.30.
The main assumptions utilized in the stability analysis of the problem, which somehow reflects the limitations of the present study, are as follows:
- The discharge material (in our case study, Ziluoyi Iron Mine, Waste Dump#2) is both homogenous and isotropic.
- No sizeable cracks exist in the body of the discharge material.
- In the mechanical modeling of the problem, the quartz schist medium underneath the discharge material is assumed to be rigid.
- The strength of the material and the mechanical behavior of the discharge material are mainly modeled based on the Mohr–Coulomb criterion (see Equation (4)).
- The failure surface fully occurs in the discharge material, which has a lower strength than the underlying quartz schist.
- Three distinct conditions (i.e., normal, rainfall, and seismic conditions) have been considered in the stability analysis of the understudied slope and their potential interactions have been not taken into account.
The previously created two-dimensional profiles were imported into the GeoStudio software using AutoCAD, the relevant parameters were assigned to each rock layer, and the input and output of the slip surface were artificially considered to perform calculations and judge the stability of the slope.
We assume that the consisting materials of the slop are homogeneous and thereby, under steady-state conditions, the equation of water surface (H) can be expressed as: . By imposing the appropriate boundary conditions at the top and bottom of the slope according to the considering rainfall, considering the groundwater surface at the bottom of the slope as the appropriate value of H at the bottom, we can easily arrive at the water profile under rainfall conditions. To analyze the water surface, we perform an analysis via GeoStudio. To examine the pseudo-static analysis of slope stability under rainfall conditions, we used B-P and M-P approaches in conjunction with the following relation to assess the slope stability of the understudied Waste Dump#2 [44]:
where the values of Aest and Best introduced in this relation have been defined in Ref. [44] and displayed with more details in the following section.
We perform a pseudo-static analysis to consider the effect of seismic loading on the potential stability. It should be noted that for rotational failure of the slope in the presence of seismic loading based on the pseudo-static approach, we have used the B–M and M–P methods in conjunction with the following formula to examine slope stability for unsaturated soil slopes (see Ref. [44]):
where Kh represents the horizontal pseudo-static seismic coefficient.
In addition, the values of Aest and Best can be determined from the following relations:
where β signifies the slope angle.
The 2000 seismic ground motion zonation map of China [45], as illustrated in Figure 9, exhibits seven levels. These are: (i) <0.05 g, (ii) 0.05 g, (iii) 0.10 g, (iv) 0.15 g, (v) 0.20 g, (vi) 0.30 g, and (vii) >0.40 g, according to the seismic peak ground acceleration (PGA) in each region and the 10% of probability of exceedance in the class (medium hard) site over 50 years.
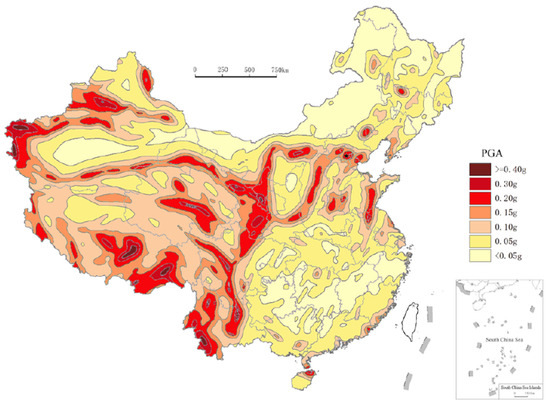
Figure 9.
Seismic ground motion parameter zonation map of China [45].
According to the map provided in Figure 9, the PGA of the understudied site is 0.20 g. It is worth mentioning that the process of selecting an appropriate seismic coefficient is the most crucial and difficult aspect of a pseudo-static stability analysis. In theory, the values of seismic coefficients depend on the measurement of the amplitude of the inertial force that is induced in the slope by the dynamic forces generated during an earthquake. However, since soil slopes are not rigid and the peak acceleration generated during an earthquake lasts for a very short period of time, seismic coefficients used in practice generally correspond to acceleration values well below the predicted peak ground accelerations (as pointed out by Kramer [46]). Nevertheless, the choice of coefficients used in the slope stability analysis is very subjective and lacks a clear rationale.
Hynes-Griffin and Franklin [47] recommended that Kh = 0.5 × PHA, where PHA stands for the peak horizontal acceleration of the earthquake in g’s, while Corps of Engineers [48] suggested Kh = 0.1 for major earthquakes and Kh = 0.15 for great ones. Further, an investigation by Marcuson and Franklin [49] displayed the reasonable value for Kh places in the range of [PHA/3, PHA/2]. For a factor of safety values of the slope greater than 1.15, Seed [50] examined the stability of granular-based slopes and suggested the interval of [0.1–0.2] for Kh.
Based on the above research works, herein we considered the average value of the proposed interval for Kh by Marcuson and Franklin [49], namely Kh = 0.586×PHA and considering PHA = PGA/g, arriving at Kh = 0.117 by considering PHA = PGA/g. In addition, with regard to the rank of the seismic zone of the understudied location, 5 out of 7, almost indicating a major earthquake. As explained above, the suggested Kh by the Corps of Engineers [48] for earthquake levels ranging from major to great is Kh = 0.1–0.15; hence, for our study case, choosing a value closer to 0.1 would be a rational consideration. Based on these two clarifications, herein we have considered Kh = 0.12 as the coefficient of horizontal pseudo-static seismic load.
Using GEO-SLOPE 2021.4 based on the B–M and M–P methods through analyzing various sliding surfaces, the obtained safety factors’ cloud map of various slip surfaces under seismic conditions (pseudo-static seismic loading) based on the above value of Kh is presented in Figure 10.
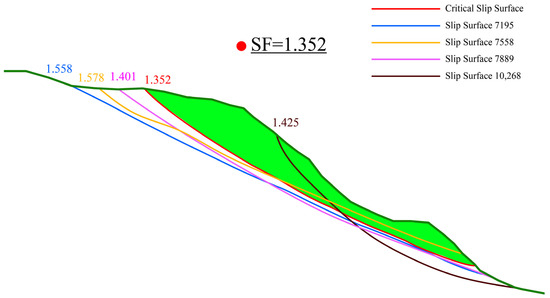
Figure 10.
Contour map of safety factors of various slip surfaces under seismic conditions (Kh = 0.12) (note: the domains with light-green color in order represent the slope prone to failure).
As is seen from Figure 10, through recalculating the safety factor of the slope under seismic conditions, we can arrive at the critical value of SF = 1.352 amongst various values for different surfaces. As is seen, the predicted safety factor for the Waste Dump#2 slope under seismic conditions is about 12.6% lower than that under normal conditions, but both of them satisfy the minimum values of safety factors of “Waste Dump Grade Level 1” (i.e., 1.25~1.3) according to Table 4.
The above-provided graphs are also available for natural and rainfall conditions, which yielded SF = 1.547 and SF = 1.276, but for the sake of brevity, the corresponding graphs have been not presented here.
As illustrated in Figure 11a–c, the critical factors of safety (SFs) of Waste Dump#2 were obtained as 1.547 under normal conditions, 1.276 under rainfall conditions, and 1.352 under seismic conditions, all of which conform to the safety standard.
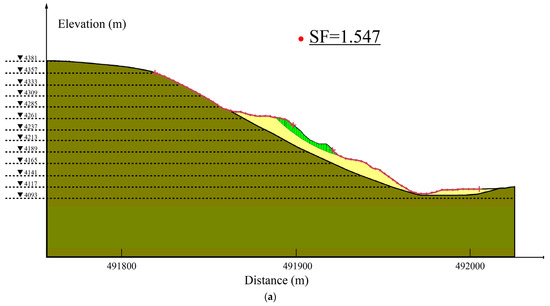
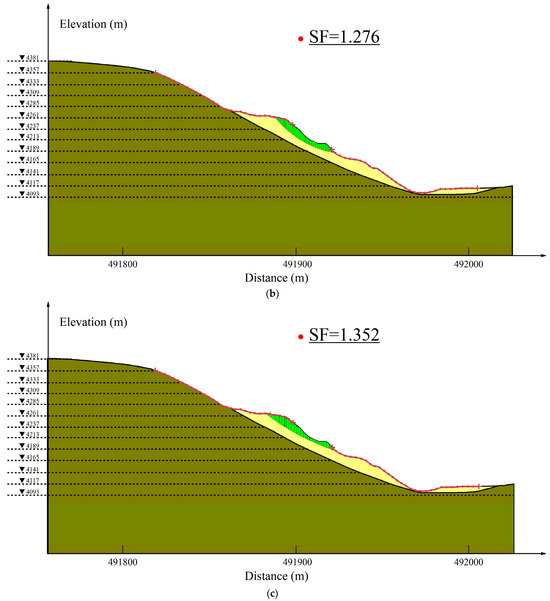
Figure 11.
Slope stability analyses in Waste Dump#2 profile under: (a) normal, (b) rainfall, and (c) seismic conditions (note: the domains with dark-green, yellow, and light-green colors in order represent the quartz schist, discharged material, and slope prone to failure).
As our investigations were centered around the case study of Ziluoyi Iron Mine’s Waste Dump#2, we did not conduct a direct comparison study on the predicted results relevant to slope stability analysis. However, we carried out thorough indoor tests and utilized the measured geotechnical and geomechanical data to make a more accurate prediction of slope failure and stability.
3.3. Slope Problems and Control Measures
3.3.1. Disaster Prevention and Control Measures of Waste Dump#2
By examining the progressive failure mode of the slope, it was found that the slope of Waste Dump#2 in Ziluoyi Iron Mine can be essentially affected by weight, groundwater, seismicity, and rainfall, and thereby reasonable disaster prevention and suitable control measures should be provided.
- Timely mapping of the zone of sliding deformation cracks in the waste dump to master the extent of the deformation area is required. The monitoring points are set in the deformation zone to more effectively capture the deformation state of the slope. If sliding deformation appears to increase, the production operations in the deformation zone must be stopped immediately and personnel and equipment must be evacuated to a safe place.
- The top of the waste dump and safety platform is set with a 3% inward reverse slope to prevent the sloping roof from collapsing during the discharge process, which would cause personnel and vehicles to roll off. The design of the waste dump unloading platform is set up about 10 m away from the edge of the safety mine truck. The mining truck is made of piles of waste rock, and the height of the staff is 1/2 the height of the wheel platform of the vehicle.
- The cracks caused by subsidence and deformation of the waste dump should be filled and compacted in time to prevent the penetration of a large amount of rainwater and the stability of the slope. Low-lying areas formed by compaction or water should be filled in time to prevent rainwater accumulation and infiltration to form landslides.
3.3.2. Providing Instructions for Slope Displacement Monitoring of Waste Dump#2
The mine safety facility design report pointed out the need to monitor the horizontal and vertical displacement of the slope to rationally understand the slope stability. The existing mine slope monitoring approach is the traditional geodetic method and the main monitoring tool is a GTS-102 n-type total station.
Horizontal displacement observation adopts a triangulation method for observation, and the plane control grid (triangulation grid) is first established in the measurement area. The triangular grid consists of several working base points in the measurement area, and the displacement observation points around the pit are set and connected according to the spacing required by the specifications. In observation, we utilized a steel ruler or infrared range finder to measure the starting edge of the triangle along the control grid (baseline), and the total station was employed to observe the interior angle of the triangle according to the accuracy of the fourth triangular precision observation. The displacement of any point can be calculated by internally organizing the results of external observations. The base point of work on the site is determined according to the rock stability of the mining slope.
Vertical monitoring reference networks and horizontal displacement monitoring reference networks are effectively adopted for synchronized observation. The measurement of vertical settlement should be designed as a closed-level network precision measurement using the triangular elevation measurement method. The main aims are to increase the number of measurements and to optimize the leveling method to enhance the observation accuracy. The project performs external observations, as well as internal calculations and analyses based on the second-level measurement standard. Combined with the data measured by the horizontal displacement monitoring network, in order to ensure the validity and accuracy of the observation data, this allows use to observe whether the data is stable in time.
After the establishment of the vertical monitoring point, monitoring is carried out during the production period once a week, and the monitoring is encrypted if there is any abnormality in the variables. At the end of each monitoring period, monitoring records are made and if there is any abnormality, the main person should be informed immediately.
In summary, the slope monitoring tools available in the mine are single and the monitoring data are one-sided.
The slope stability of the waste dump should be monitored using a global navigation satellite system (GNSS) and real aperture radar (RAR) among others for slope surface displacements.
The working principles of RAR and GNSS are schematically presented in Figure 12.
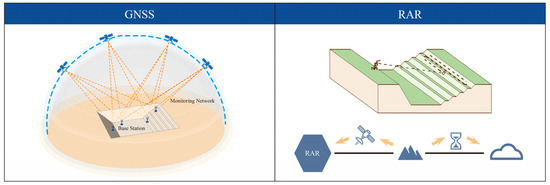
Figure 12.
Slope stability monitoring system used for the waste dump.
RAR is a set of intelligent systems used to monitor slope stability in open-pit mines. It continuously and repeatedly covers a large area of the slope by transmitting high-frequency electromagnetic waves through a large dish antenna to obtain information about the displacement as well as the rate of change of the rock body in time series and 3D dynamic cloud maps that can be captured in real time. Through the 3D dynamic cloud map, the abnormal deformation area can be directly and quickly identified. The whole deformation process of the slope rock body can be dynamically tracked and monitored, and the non-contact, long-distance, wide-area, full-time, and high-precision space–time measurements can be made to achieve the purpose of accurately predicting and forecasting the geologic hazards such as slice gangs and landslides, ensuring safe production at open-pit mines.
The GNSS slope detection system mainly works through the satellite positioning system to perform comprehensive monitoring of the slope of the open-pit mine, and the system is capable of performing real-time monitoring of the monitoring points with the help of internet technology, high-precision satellite navigation, pseudo-dynamic algorithms, and other technologies in practical application. After the detailed knowledge and examination of the surrounding environment of the open-pit mine, several distinct monitoring points are set up according to the displacement monitoring network on the slope of the open-pit mine. After making sure that the monitoring points are able to realize the output of the original data of the satellite navigation, the output data information is transmitted to the data processing and control server through the wireless network. Through the server, the data changes are transformed and presented in the form of three-dimensional coordinate changes, thus real-time monitoring and management of slope monitoring points are appropriately realized.
The main advantages of the GNSS slope monitoring system in open-pit mine slope monitoring are reflected in the following aspects: First, the monitoring function can be realized without the need to pass between each GNSS station, which reduces the time and energy consumed by relevant personnel moving the station and substantially improves the application effect of the GNSS slope detection system in complex environments. Second, the GNSS system is capable of receiving data from more than 30 satellites simultaneously, ensuring the accuracy of detection results even in various harsh environmental conditions. Third, the GNSS slope monitoring system is also able to realize data acquisition, transmission, storage, interpretation, and other functions in a practical application, which is able to ensure the accuracy of the monitoring results and automate the system operation.
4. Conclusions
This study dealt with complex aspects of waste dump slope behavior in the context of an open-pit mine. The investigation essentially led to several insights into the progressive failure mode, temporal evolution, and spatial evolution of the understudied waste dump slope. Waste Dump#2, which is located at a height of 159 m and has a slope angle of 25°, is classified as Level 1 according to the waste dump grading standard outlined in GB50421-2018 “Standard for waste dump design of nonferrous metal mines” [42]. This classification is critical to determine the reserve standard of the safety factor, which according to the standard requirements is in the range of 1.25–1.30. Through an in-depth analysis of the slope behavior and slope stability analysis, the crucial obtained results can be summarized as follows:
- The direct shear tests on soil samples from Waste Dump#2 provided valuable visions into its geotechnical properties. The cohesion range was obtained in an interval of 4.15–7.40 kPa, with an internal friction angle between 31.20° and 36.95°. The average of these values, resulting in a cohesion of 6.215 kPa and an internal friction angle of 34.12°, were effectively employed in the complementary analyses.
- The slope stability assessment was carried out through numerical simulations involving various environmental conditions, including normal, rainfall, and seismic scenarios, using appropriate software and formulations in the existing literature. The results were reassuring because the actual slope stability factor of Waste Dump#2 acted upon by normal conditions was measured to be 1.547. In the presence of rainfall, this factor slightly decreased to 1.276, which is still within the safety standard. Even under seismic conditions, the slope remained stable with a safety factor of 1.352, indicating its resilience against external forces.
- Understanding the progressive failure behavior of waste dump slopes in open-pit coal mines and implementing appropriate control measures is also critical to ensure the safety of personnel, equipment, and the environment. The insights and recommendations presented in this study significantly help to improve risk management and prevent possible disasters in open-pit mining operations.
Stability analysis in geotechnical engineering is crucial for preventing unwanted consequences such as soil erosion, landslides, and other natural disasters. With the latest advancements in dataset collection as well as machine learning (ML) and artificial intelligence (AI) algorithms [51,52,53,54,55,56,57], geotechnical engineers can appropriately control these tools to enhance their slope stability optimally [58,59]. These innovative technologies allow engineers to collect and analyze large amounts of data and make more accurate predictions about the potential risks associated with a given slope in an optimal manner. As a result, the use of AI- and ML-based algorithms and dataset collection as an essential part of modern geotechnical engineering optimal practices is highly recommended for near-future research works.
Author Contributions
Conceptualization, Z.Y.; methodology, X.D. and X.L.; validation, Z.Y. and A.W.; formal analysis, Z.A.; investigation, X.D.; resources, V.S.B.; data curation, Y.T.; writing—original draft preparation, Z.Y. and Z.A.; writing—review and editing, Z.L. and G.L.; visualization, P.M. All authors have read and agreed to the published version of the manuscript.
Funding
This paper was supported by the National Natural Science Foundation of China (52174131).
Informed Consent Statement
Informed consent was obtained from all subjects involved in the study.
Data Availability Statement
Data are contained within the article.
Acknowledgments
The authors thank the Ziluoyi Iron Mine for providing a research base for this paper.
Conflicts of Interest
Author Penglin Ma was employed by the company Qingdao Teld New Energy Technology Co., Ltd. The remaining authors declare that the research was conducted in the absence of any commercial or financial relationships that could be construed as a potential conflict of interest.
Appendix A. A Discussion of the Failure Process
Landslide damage is a progressive process of continuous development of local damage. The external influence and the change in the internal stress state of the landslide incorporate into a specific phenomenon, the so-called local imbalance. When the landslide develops to a certain stage, the rock and soil body inside the landslide are deformed, more local instability occurs, and the local stress state of the landslide is transferred to the adjacent locations so that the failure state will move from local to global. The failure surface continuously accumulates and moves to the entire body until the whole landslide passes through it and the entire landslide slips. A more detailed investigation of the delayed collapse cut slopes can be found in Ref. [60]. The progressive failure stress states of the slope, as illustrated in Figure A1a–d, can be explained as follows:
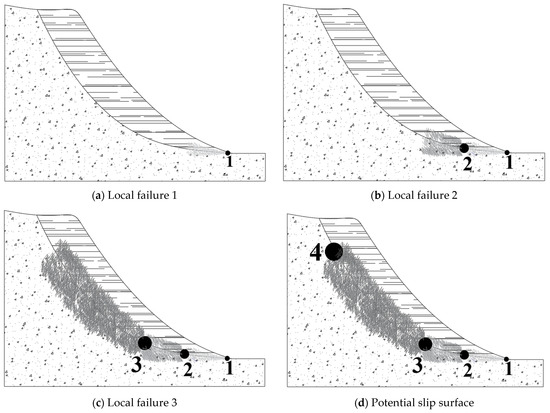
Figure A1.
Various stages of the progressive failure stress state.
- Rainfall, excavation, embankment, or a combination of these factors that affect the k0 (coefficient of earth pressure at rest) of the soil [39] are incorporated into the stress concentration in the toe of the slope Zone 1, and the shear strength in the region of stress concentration alters from peak strength to residual strength. The occurrence of local deformation yields a change in the stress state, causing stress adjustment in the area adjacent to the geotechnical body, stress release, stress transfer, and stress redistribution in a certain range.
- Due to the discrepancies in the disturbances and differences in the structure and geological conditions of the slopes themselves, a specific direction in the change of the stresses in Zone 1 is configured. This fact leads to a difference in the degree and speed of the advance of the damage forward or backward, affecting the triggering stress concentration in the adjacent Zone 2. It should be also noticed that the relationship between the material state and slope stability is crucial, and it is also primarily governed by the fundamental factor k0. However, it is important to note that the stress state in the slope could also be affected by the slope geometry and the actions it undergoes, leading to a heterogeneity of stress states.
- Under the influence of the change of the stress state in Zone 1, Zone 2 also exceeds the shear strength and suffers damage, turns into residual strength, and again undergoes stress release, transfer, and redistribution, which in turn causes Zone 3 to reach maximum strength.
- Repetition of this process of stress transfer, triggering stress concentration, and the development of the plasticity surfaces leads to the gradual development of the slope failure zone, with the extension of the rupture surface, transfer, and progressive penetration along the potential sliding surface until it extends to Zone 4.
As illustrated in Figure A2, the progressive failure development process of the slope may lead to two consequences: one is that the slope body is able to slide due to the tight interactions between the failure surface and the slope. The sliding force exceeds the anti-sliding force, leading to a landslide disaster with sharp displacement and acceleration. Another one is that after the failure area of the slope has developed to a certain position, the state of the rock and soil mass in the adjacent area against the slope does not exceed the shear strength, and it cannot pass the critical state. Hence, the expansion of the failure stops, the overall sliding force of the slope does not exceed the sliding resistance, and the slope is generally stable.
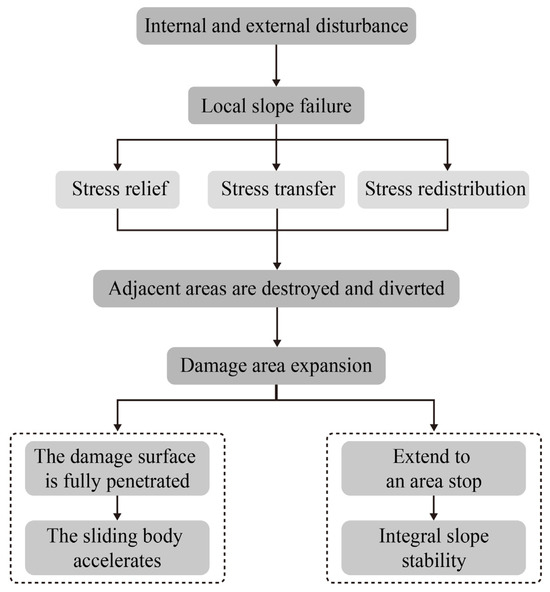
Figure A2.
Schematic diagram of the progressive slope failure process.
Appendix B. Temporal and Spatial Evolution of the Progressive Slope Failure
Appendix B.1. Time Evolution of the Progressive Slope Failure
The collapse of an open-pit mine, which is driven by the mechanical mechanism of progressive slope failure, is a continuous process of initial deformation, deformation development, and overall failure. This exhibits a three-stage creep evolution law that is similar to the creep curve of rock and soil mass.
The general evolution of slope deformation follows the three-stage law, as illustrated in Figure A3.
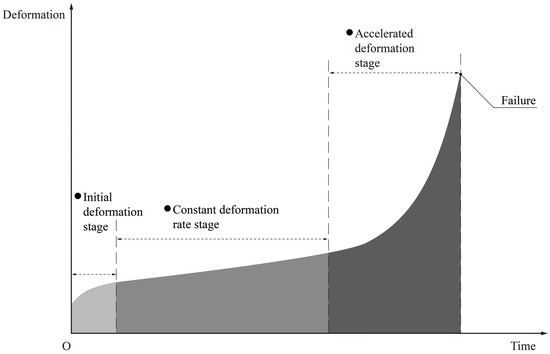
Figure A3.
Schematic representation of the three-stage evolution of landslide time-deformation [61].
- Initial deformation stage
In the initial stage of deformation of the gradient body, obvious cracks appear in the gradient body. The deformation curve initially exhibits a relatively large gradient. Over time, the deformation will gradually return to a normal state, and the gradient of the curve decreases, exhibiting the characteristics of the decelerated deformation.
- 2.
- Constant deformation rate stage
When the deformation of the slope body begins, under the action of gravity, it continues to deform with an equal rate of development process. Although the deformation curve may fluctuate at this stage due to the interference and influence of external factors, the overall trend is a tilted straight line and the average strain rate essentially remains unchanged.
- 3.
- Accelerated deformation stage
When the deformation of the slope body continues for a certain period of time, the deformation rate will gradually increase. As time goes on, the rate of deformation continues to increase. The deformation curve is almost steep and the tangent angle is close to 90°.
When the evolution of slope deformation enters the stage of accelerated deformation, it indicates that a landslide is about to occur. At this time, a timely warning should be carried out to start the disaster prevention plan.
Appendix B.2. Spatial Evolution of the Progressive Slope Failure
The formation of landslides is the result of the combined action of internal and external factors. The internal factors are the source of landslides and sliding conditions, and external factors are the driving factors for the occurrence of landslides, and both are indispensable.
The internal factors include topographic and geomorphological conditions, stratigraphic lithology conditions, geological and tectonic conditions, and hydrogeological conditions. The external generating factors are mainly reflected by the loading effect on the landslide ground, the horizontal external force generally includes seismic force and water pressure, and the vertical external force is the loading effect of the project abandonment, avalanche, and construction. Additionally, the external contributing factors include insufficient slip resistance due to the chipping of the slide in the slip-resistant section. Further, among the external causative factors, we can mention the lack of resistance against sliding due to the chipping of the slide in the anti-slip section.
Taking the slope of a waste dump as an example, the failure process can be divided into four stages: integral compaction → crack formation → extrusion dislocation → integral slip.
- Integral compaction stage
As presented in Figure A4a, in the formation process of the slope of the discharging site, in addition to the compression and settlement of the discharging soil itself, the loss of its base system is also subjected to compression and deformation of the settlement.
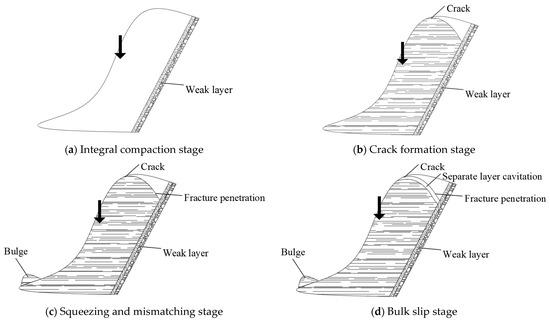
Figure A4.
Four-stage destruction process of slopes in open-pit iron mine waste dump.
- 2.
- Crack formation stage
As illustrated in Figure A4b, tension cracks first appear on the surface of the upper part of the slope of the discharge site. Then, discontinuous cracks with reasonable regularity also appear in the soil body of the discharge, and at the same time, the weak foundation layer is clearly stressed.
- 3.
- Squeezing and mismatching stage
As shown in Figure A4c, the main sliding section of the waste dump slope is penetrated by internal cracks and gradually extends along the weak layer towards the transition section. The front edge of the sliding body is extruded from the weak under-extrusion layer of the rear part, and the front surface of the sliding body is in an uplifting state.
- 4.
- Bulk slip stage
As presented in Figure A4d, because the main slip section continuously pushes the weak layer, the frontal uplift is intensified, and the “separation” or “cavitation” of the weak layer also increases. In continuing, triangular cracks appear on the back of the uplift, and the overall slip of the sliding slope initiates. At this time, the whole structure of the slip zone is basically not a serious failure.
References
- Tian, Y.; Jiskani, I.M.; Lu, X.A.; Zhou, W.; Liu, F.M.; Zhang, C.W.; Cai, Q.X. Control mechanism of end-slope deformation in open pit mine based on discrete-continuous coupling method. Comput. Part. Mech. 2023, 10, 951–963. [Google Scholar] [CrossRef]
- Xu, C.Y.; Liu, Q.S.; Tang, X.H.; Sun, L.; Deng, P.H.; Liu, H. Dynamic stability analysis of jointed rock slopes using the combined finite-discrete element method (FDEM). Comput. Geotech. 2023, 160, 105556. [Google Scholar] [CrossRef]
- Luan, B.Y.; Zhou, W.; Jiskani, I.M.; Wang, Z.M. An improved machine learning approach for optimizing dust concentration estimation in open-pit mines. Int. J. Environ. Res. Public Health 2023, 20, 1353. [Google Scholar] [CrossRef]
- Wang, G.J.; Zhao, B.; Wu, B.S.; Zhang, C.; Liu, W.L. Intelligent prediction of slope stability based on visual exploratory data analysis of 77 in situ cases. Int. J. Min. Sci. Technol. 2023, 33, 47–59. [Google Scholar] [CrossRef]
- Sari, M. Evaluation of rock slopes susceptible to circular failures using logistic and multiple regression models. Arab. J. Geosci. 2020, 13, 61. [Google Scholar] [CrossRef]
- Tagarelli, V.; Cotecchia, F. Deep movements in clayey slopes relating to climate: Modeling for early warning system design. In Geotechnical Research for Land Protection and Development: Proceedings of CNRIG 2019; Springer: Berlin/Heidelberg, Germany, 2020; Volume 7, pp. 205–214. [Google Scholar]
- Ding, X.H.; Ao, Z.C.; Li, X.S.; Xiao, S.S.; Wu, M.; Xing, B.K.; Ge, R.H.; Zhang, D.H. The mechanism of plugging open-pit mine cannon holes and the modification of plugging materials. Sustainability 2023, 15, 4257. [Google Scholar] [CrossRef]
- Wang, Z.M.; Zhou, W.; Jiskani, I.M.; Ding, X.H.; Luo, H.T. Dust pollution in cold region surface mines and its prevention and control. Environ. Pollut. 2022, 292, 118293. [Google Scholar] [CrossRef] [PubMed]
- Sun, L.; Grasselli, G.; Liu, Q.S.; Tang, X.H.; Abdelaziz, A. The role of discontinuities in rock slope stability: Insights from a combined finite-discrete element simulation. Comput. Geotech. 2022, 147, 104788. [Google Scholar] [CrossRef]
- Sari, M. Stability analysis of cut slopes using empirical, kinematical, numerical, and limit equilibrium methods: Case of old Jeddah–Mecca Road (Saudi Arabia). Environ. Earth Sci. 2019, 78, 621. [Google Scholar] [CrossRef]
- Yuan, W.B.; Ye, C.M.; Yao, J.; Wang, L.D. Stability analysis of mountain slope based on finite element and discrete element. Appl. Mech. Mater. 2012, 170–173, 1087–1090. [Google Scholar] [CrossRef]
- Rui, P. Study on Stability Analysis Theory of Complicated Soil Slope and Computer Realization. In Proceedings of the 1st International Conference on Sustainable Construction and Risk Management, Chongqing, China, 12–14 June 2010; pp. 1390–1394. [Google Scholar]
- Yu, A.; Liu, J.; Yang, D.D.; Cao, H.F.; Yang, X.P. A road slope stability analysis. Adv. Mater. Res. 2012, 594–597, 642–646. [Google Scholar] [CrossRef]
- Sun, S.G.; Miao, Z.Z.; Dong, Y.F.; He, Y.Y. The slope stability evaluation of open-pit mine based on GIS. In Proceedings of the International Conference on Architectural, Civil and Hydraulics Engineering (ICACHE), Guangzhou, China, 28–29 November 2015; pp. 403–408. [Google Scholar]
- Yin, Y.J.; Xu, G.H.; Qian, Y.M. Analysis about Stability of a Slope. In Proceedings of the 4th International Conference on Civil Engineering, Architecture and Building Materials (CEABM), Haikou, China, 24–25 May 2014; pp. 152–155. [Google Scholar]
- Xie, X.F.; Liu, Y.L.; Han, J.Y.; Xing, L. 3D Finite element numerical analysis for stability calculation of high steep rock slope. Appl. Mech. Mater. 2014, 580–583, 532–538. [Google Scholar] [CrossRef]
- Guo, J.; Gan, D.Q.; Zhang, Y.; Zhang, W.H. Application of GM (1, N) model on slope stability analysis in open pit mine. Appl. Mech. Mater. 2011, 84–85, 729–732. [Google Scholar] [CrossRef]
- Guanhua, Q. Stability analysis of nonhomogeneous and anisotropic stepped slopes under the influence of earthquakes. Heliyon 2023, 9, e15057. [Google Scholar] [CrossRef]
- Li, Y.Q.; Goh, A.T.C.; Zhang, R.H.; Zhang, W.G. Stability charts for undrained clay slopes considering soil anisotropic characteristics. Bull. Eng. Geol. Environ. 2023, 82, 52. [Google Scholar] [CrossRef]
- Huang, A.P.; Zhu, Y.P.; Wang, L.; Ye, S.H.; Fang, G.W. Three-dimensional stability of unsaturated soil slopes reinforced by frame beam anchor plates. Int. J. Geomech. 2023, 23, 04023068. [Google Scholar] [CrossRef]
- Shu, S.; Ge, B.; Wu, Y.X.; Zhang, F. Probabilistic assessment on 3D stability and failure mechanism of undrained slopes based on the kinematic approach of limit analysis. Int. J. Geomech. 2023, 23, 06022037. [Google Scholar] [CrossRef]
- Li, B.; Hu, Y.R.; Zhang, W.H.; Chen, J.; Zhou, B. Safety distance analysis about electricity transmission tower set on the loess high slope. In Proceedings of the 2nd Global Conference on Civil, Structural and Environmental Engineering (GCCSEE 2013), Shenzhen, China, 28–29 September 2013; pp. 710–717. [Google Scholar]
- Ma, Z.Y.; Liao, H.J.; Yu, M.H. Slope stability analysis using unified strength theory. In Proceedings of the SREE Workshop on Applied Mechanics and Civil Engineering (AMCE), Macau, China, 17–18 December 2011; pp. 59–64. [Google Scholar]
- Zhang, Z.P.; Chang, C.Y.; Zhao, Z.Y. Influence of the slope shape on seismic stability of a slope. Adv. Civ. Eng. 2020, 2020, 1–8. [Google Scholar] [CrossRef]
- Gasmo, J.M.; Rahardjo, H.; Leong, E.C. Infiltration effects on stability of a residual soil slope. Comput. Geotech. 2000, 26, 145–165. [Google Scholar] [CrossRef]
- Wang, S.; Xie, X.Y.; Mei, G.D.; Lu, X.Q.; Li, K.; Wang, Y.L.; Publishing, I.O.P. Three-dimensional stability analysis of considering seepage effect on complex loose slope. In Proceedings of the 6th International Conference on Energy Materials and Environment Engineering (ICEMEE), Tianjin, China, 24–26 April 2020. [Google Scholar]
- Liu, X.R.; Liu, Y.Q.; Lu, Y.M.; Li, X.W.; Li, P. Numerical analysis of evaluation methods and influencing factors for dynamic stability of bedding rock slope. J. Vibroeng. 2017, 19, 1937–1961. [Google Scholar] [CrossRef]
- Jiang, P.; Zhang, M.S. Elastic parameters adjusted in soil slope stability and displacement analysis. In Proceedings of the International Conference on Sensors, Measurement and Intelligent Materials (ICSMIM 2012), Guilin, China, 26–27 December 2012; pp. 2889–2892. [Google Scholar]
- Xu, J.S.; Yang, X.L. Seismic and static stability analysis for 3D reinforced slope in nonhomogeneous and anisotropic soils. Int. J. Geomech. 2018, 18, 04018065. [Google Scholar] [CrossRef]
- Kang, K.; Fomenko, I.K.; Wang, J.; Nikolskaya, O.V. Probabilistic assessment of rock slope stability in open pit mine chaarat using the generalized hoek-brown criterion. J. Min. Sci. 2020, 56, 732–740. [Google Scholar] [CrossRef]
- Zhao, E.P.; Jia, X.B. Research on the slope stability under the condition of water level fluctuation. In Proceedings of the 2nd International Conference on Civil Engineering and Transportation (ICCET 2012), Guilin, China, 27–28 October 2012; pp. 350–353. [Google Scholar]
- Wang, W.T.; Song, T.; Liu, Z.R. Stability analysis of high filling slope affected by precipitation intensity. In Proceedings of the 2nd International Conference on Civil Engineering, Architecture and Building Materials (CEABM 2012), Yantai, China, 25–27 May 2012; pp. 1174–1178. [Google Scholar]
- Yang, P. Iop: Analysis of the influence of initial gravity field on the stability analysis of soil slope. In Proceedings of the International Conference on Civil, Architecture and Disaster Prevention, Hefei, China, 19 October–4 November 2018. [Google Scholar]
- Han, C.Y.; Chen, J.J.; Xia, X.H.; Wang, J.H. Three-dimensional stability analysis of anisotropic and non-homogeneous slopes using limit analysis. J. Cent. South Univ. 2014, 21, 1142–1147. [Google Scholar] [CrossRef]
- Xiao, Y.J.; Mao, X.S.; Li, J. The Slope shape of loose accumulation body effect analysis of subgrade slope stability. In Proceedings of the 5th International Conference on Frontiers of Manufacturing Science and Measuring Technology (FMSMT), Taiyuan, China, 24–25 June 2017; pp. 718–721. [Google Scholar]
- Sun, L.; Tang, X.H.; Abdelaziz, A.; Liu, Q.S.; Grasselli, G. Stability analysis of reservoir slopes under fluctuating water levels using the combined finite-discrete element method. Acta Geotech. 2023, 18, 5403–5426. [Google Scholar] [CrossRef]
- Rajabian, A.; Shukla, S.K. Stability analysis of anchor-reinforced soil slopes with Taylor’s stability chart. Int. J. Geomech. 2023, 23, 04022278. [Google Scholar] [CrossRef]
- Zou, J.Q.; Chen, H.; Jiang, Y.; Zhang, W.; Liu, A.H. An effective method for real-time estimation of slope stability with numerical back analysis based on particle swarm optimization. Appl. Rheol. 2023, 33, 20220143. [Google Scholar] [CrossRef]
- Tagarelli, V.; Cotecchia, F. The effects of slope initialization on the numerical model predictions of the slope-vegetation-atmosphere interaction. Geosciences 2020, 10, 85. [Google Scholar] [CrossRef]
- Wang, Z.M.; Zhou, W.; Jiskani, I.M.; Luo, H.T.; Ao, Z.C.; Mvula, E.M. Annual dust pollution characteristics and its prevention and control for environmental protection in surface mines. Sci. Total Environ. 2022, 825, 153949. [Google Scholar] [CrossRef] [PubMed]
- Shen, Z.Y.; Ao, Z.C.; Wang, Z.M.; Yang, Y.Q. Study on crust-shaped dust suppressant in non-disturbance area of open-pit coal mine-A Case Study. Int. J. Environ. Res. Public Health 2023, 20, 934. [Google Scholar] [CrossRef] [PubMed]
- GB50421-2018; Standard for Waste Dump Design of Nonferrous Metal Mines. China National Standard: Beijing, China, 2018.
- Das, B.M.; Sobhan, K. Principles of Geotechnical Engineering, 8th ed.; Cengage Learning Publisher: Stamford, CT, USA, 2013. [Google Scholar]
- Huang, W. Stability of Unsaturated Soil Slopes under Rainfall and Seismic Loading. Ph.D. Thesis, Nanyang Technological University, Singapore, 2018. [Google Scholar]
- GB18306-2001; China Earthquake Administration: Seismic Ground Motion Parameter Zonation Map of China. China Standards Press: Beijing, China, 2001.
- Kramer, S.L. Geotechnical Earthquake Engineering; Prentice-Hall, Inc.: Upper Saddle River, NJ, USA, 1996; pp. 434–437. [Google Scholar]
- Hynes-Griffin, M.E.; Franklin, A.G. Rationalizing the Seismic Coefficient Method; Miscellaneous Paper GL-84-13; U.S. Army Corps of Engineers Waterways Experiment Station: Vicksburg, MS, USA, 1984; 21p. [Google Scholar]
- Corps of Engineers. Slope Stability Manual EM-1110-2-1902; Department of the Army, Office of the Chief of Engineers: Washington, DC, USA, 1982. [Google Scholar]
- Marcuson, W.F.; Franklin, A.G. Seismic Design, Analysis, and Remedial Measures to Improve the Stability of Existing Earth Dams—Corps of Engineers Approach. In Seismic Design of Embankments and Caverns; Howard, T.R., Ed.; ASCE: New York, NY, USA, 1983. [Google Scholar]
- Seed, H.B. Considerations in the earthquake-resistant design of earth and rockfill dams. Géotechnique 1979, 29, 215–263. [Google Scholar] [CrossRef]
- Zhou, C.; Shi, Q.; He, D.; Tu, B.; Li, H.; Plaza, A. Spectral-spatial sequence characteristics-based convolutional transformer for hype spectral change detection. CAAI Trans. Intell. Technol. 2023, 8, 1237–1257. [Google Scholar] [CrossRef]
- Cao, H.; Wu, Y.; Bao, Y.; Feng, X.; Wan, S.; Qian, C. UTrans-Net: A model for short-term precipitation prediction. Artif. Intell. Appl. 2023, 1, 106–113. [Google Scholar] [CrossRef]
- Du, H.; Du, S.; Li, W. Probabilistic time series forecasting with deep non-linear state space models. CAAI Trans. Intell. Technol. 2023, 8, 3–13. [Google Scholar] [CrossRef]
- Luo, C. KELL: A kernel-embedded local learning for data-intensive modeling. Artif. Intell. Appl. 2024, 2, 38–44. [Google Scholar] [CrossRef]
- Luo, X.; Wen, X.; Li, Y.; Li, Q. Pruning method for dendritic neuron model based on dendrite layer significance constraints. CAAI Trans. Intell. Technol. 2023, 8, 308–318. [Google Scholar] [CrossRef]
- Yusuf, A.; Kiri, A.A.; Lawal, L.; Kiri, A.I. A hybrid conjugate gradient algorithm for nonlinear system of equations through conjugacy condition. Artif. Intell. Appl. 2023. [Google Scholar] [CrossRef]
- Tien Bui, D.; Moayedi, H.; Gör, M.; Jaafari, A.; Foong, L.K. Predicting slope stability failure through machine learning paradigms. ISPRS Int. J. Geo-Inf. 2019, 8, 395. [Google Scholar]
- Moayedi, H.; Tien Bui, D.; Kalantar, B.; Kok Foong, L. Machine-learning-based classification approaches toward recognizing slope stability failure. Appl. Sci. 2019, 9, 4638. [Google Scholar] [CrossRef]
- Lin, S.; Zheng, H.; Han, C.; Han, B.; Li, W. Evaluation and prediction of slope stability using machine learning approaches. Front. Struct. Civ. Eng. 2021, 15, 821–833. [Google Scholar] [CrossRef]
- Potts, D.M.; Kovacevic, N.; Vaughan, P.R. Delayed collapse of cut slopes in stiff clay. Géotechnique 1997, 47, 953–982. [Google Scholar] [CrossRef]
- Xu, Q.; Tang, M.G.; Xu, K.X.; Huang, X. Research on space-time evolution laws and early warning-prediction of landslides. Chin. J. Rock Mech. Eng. 2008, 27, 1104–1112. [Google Scholar]
Disclaimer/Publisher’s Note: The statements, opinions and data contained in all publications are solely those of the individual author(s) and contributor(s) and not of MDPI and/or the editor(s). MDPI and/or the editor(s) disclaim responsibility for any injury to people or property resulting from any ideas, methods, instructions or products referred to in the content. |
© 2024 by the authors. Licensee MDPI, Basel, Switzerland. This article is an open access article distributed under the terms and conditions of the Creative Commons Attribution (CC BY) license (https://creativecommons.org/licenses/by/4.0/).