
Many-Objective Hierarchical Pre-Release Flood Operation Rule Considering Forecast Uncertainty


Abstract
1. Introduction
- (1)
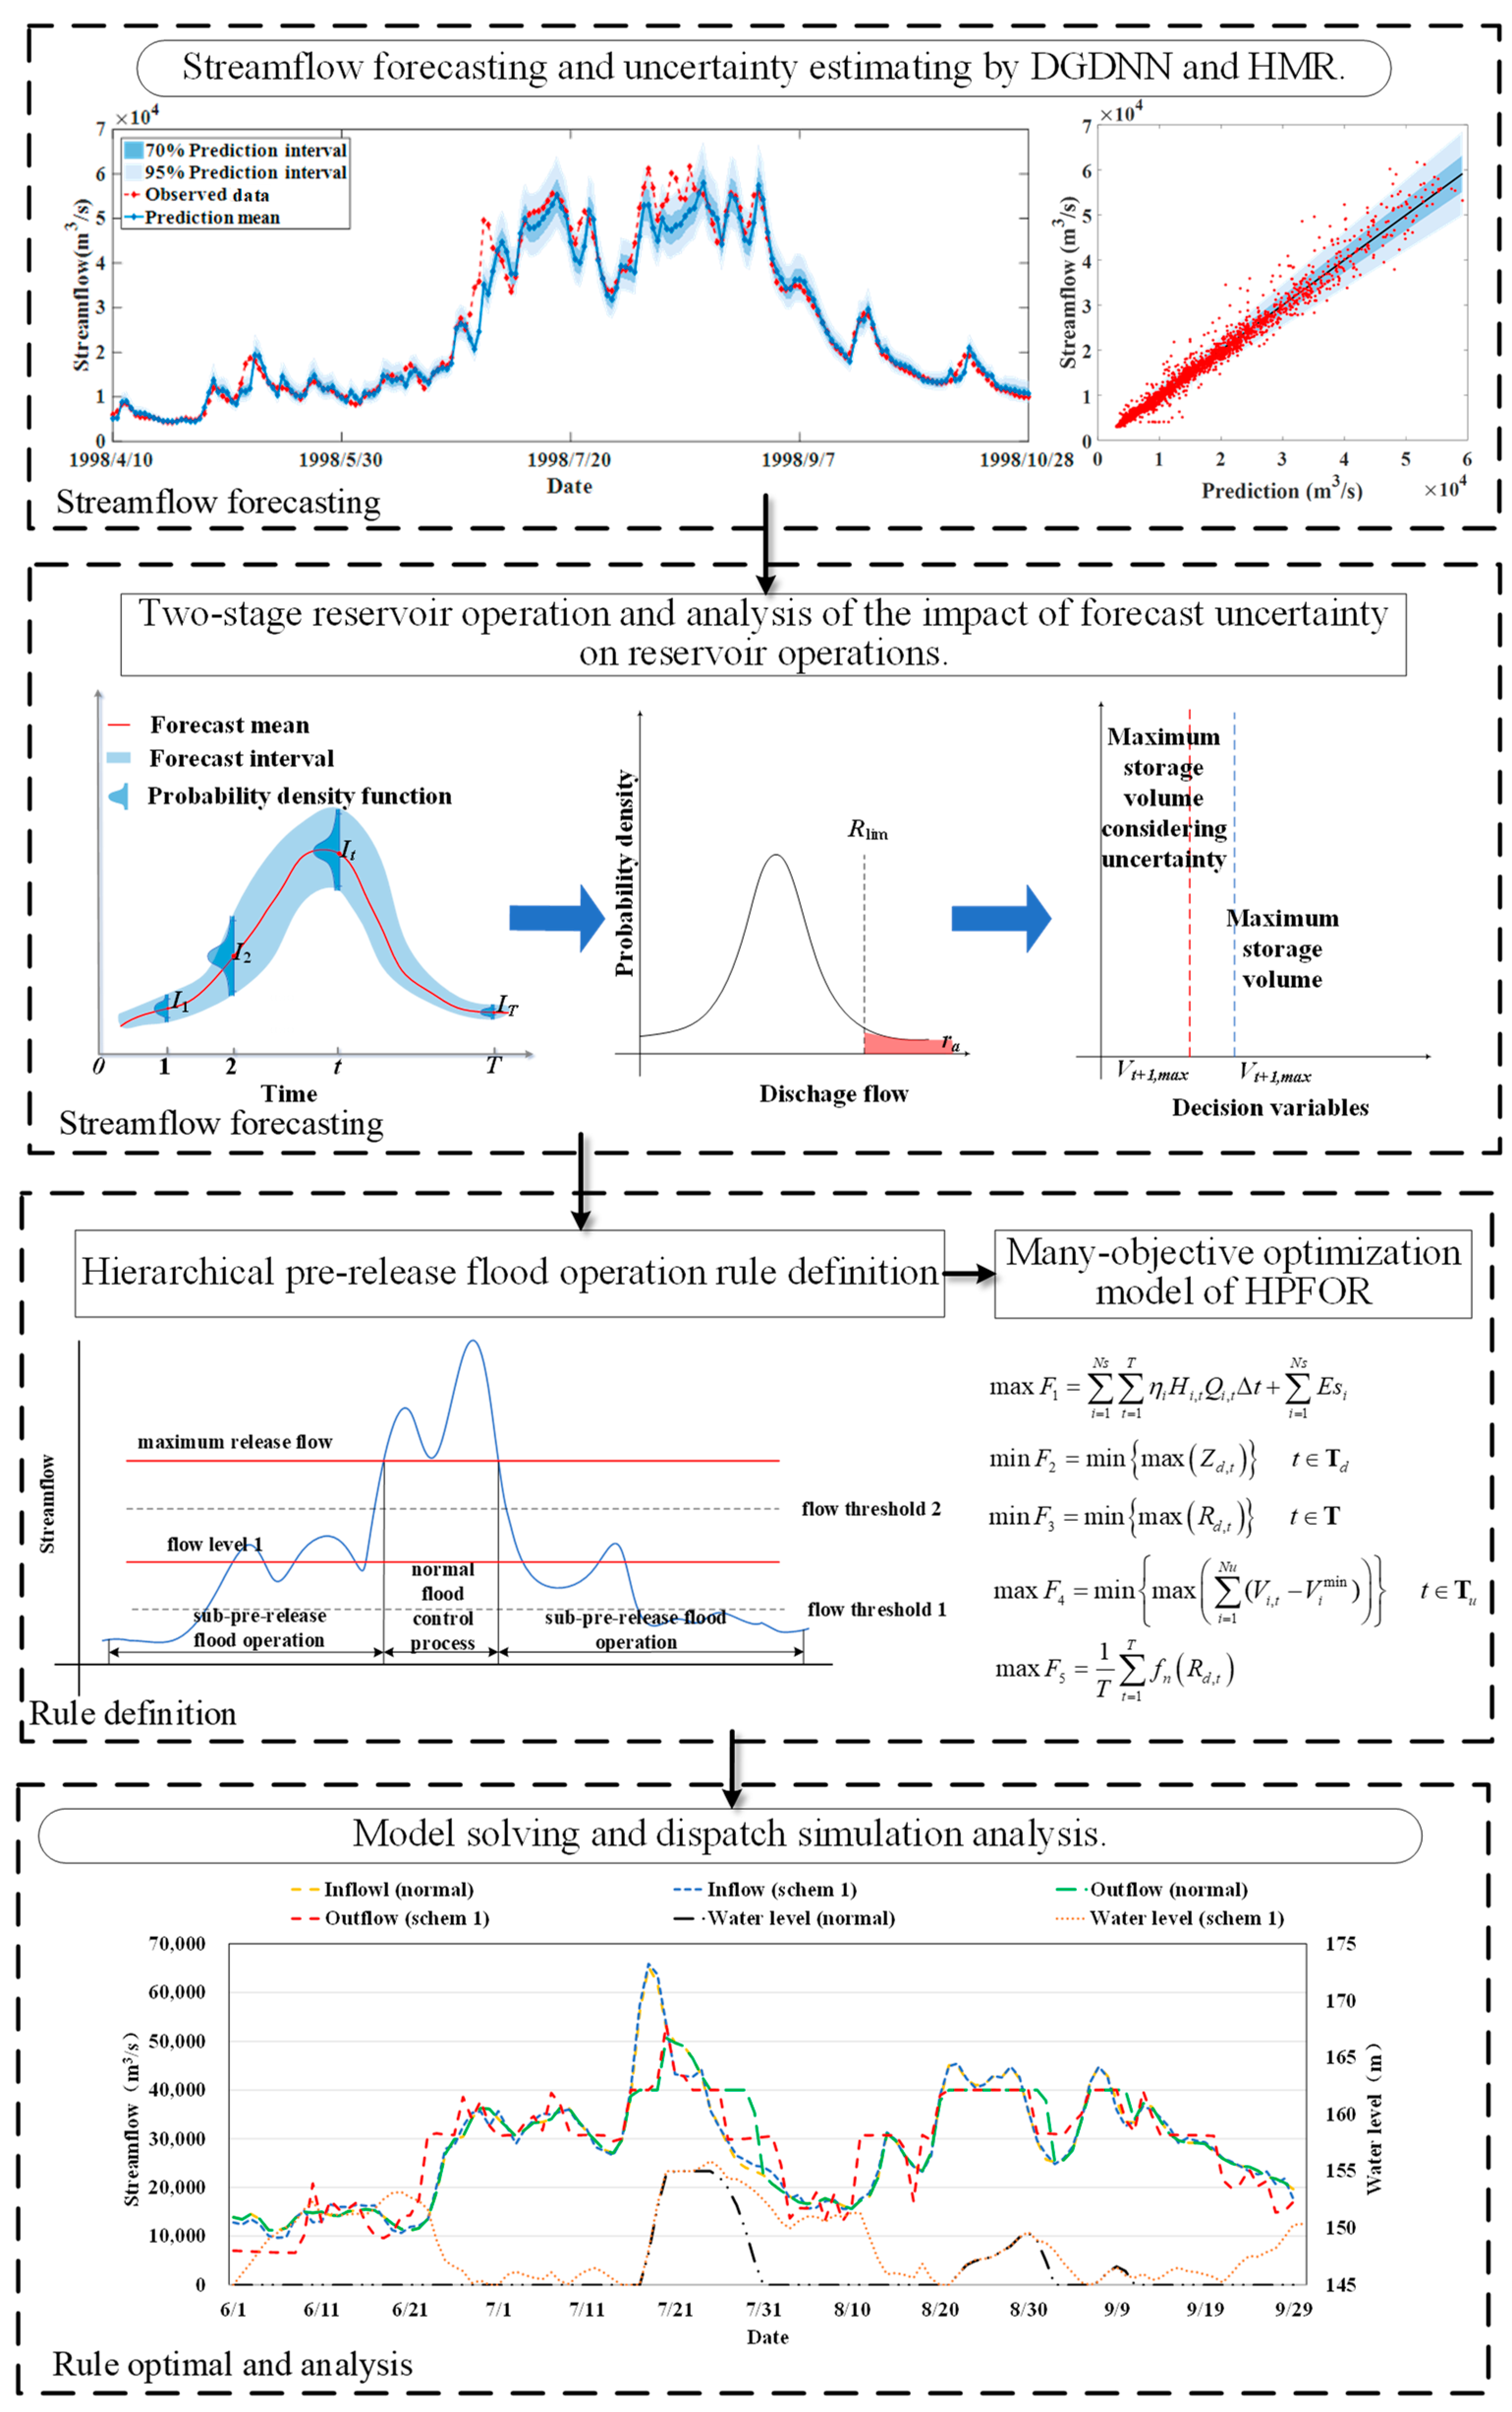
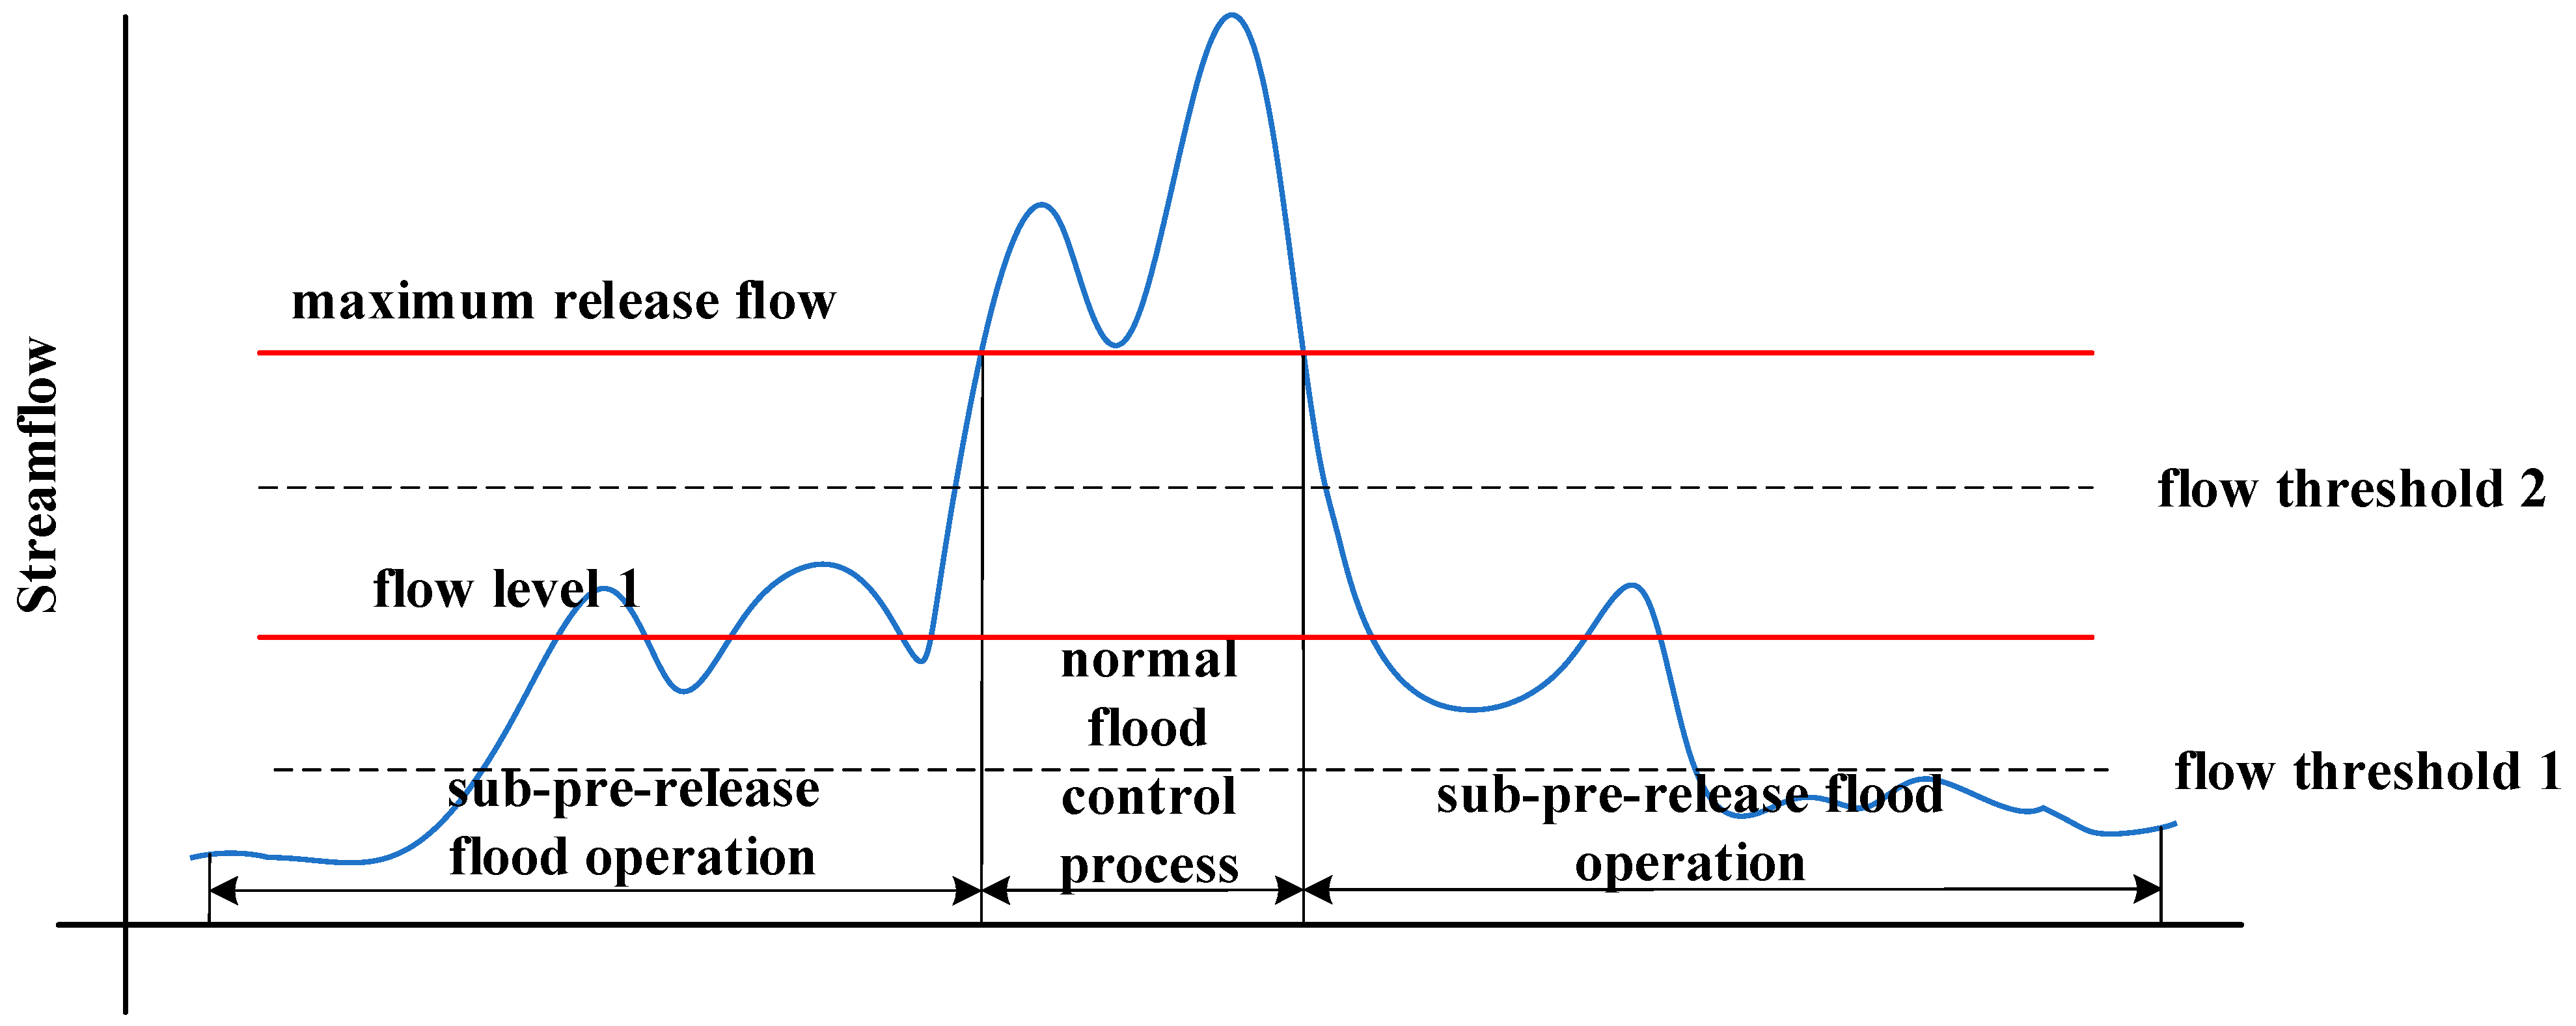
- First and foremost, the two-stage reservoir operation model and the impact of forecast uncertainty on the model are analyzed. Then, the HPFOR is defined by multiple flow thresholds under the maximum release flow and sub-pre-release flood operation rules between each flow level.
- (2)
- Many-objective optimization models of the HPFOR with a power generation objective, flood control objective, and navigation objective are established. Furthermore, a constrained RSEA is applied to solve the many-objective optimization model of HPFOR.
- (3)
- The comparison of three state-of-the-art algorithms with RSEA is shown to demonstrate the performance of the RSEA. The comparison of conventional flood control rules, HFOR, and HPFOR is shown to prove the advantages of the proposed HPFOR.
2. Methodology
2.1. Probabilistic Streamflow Forecasting Model
2.2. Hierarchical Pre-Release Flood Control Operation Rule
2.2.1. Two-Stage Reservoir Operation Model
- (1)
- Discharge flow constraint in the decision-making stage:
- (2)
- Discharge flow constraint in the forecasting stage:
- (3)
- Storage volume constraint in the forecasting stage:
- (4)
- Water balance constraint:
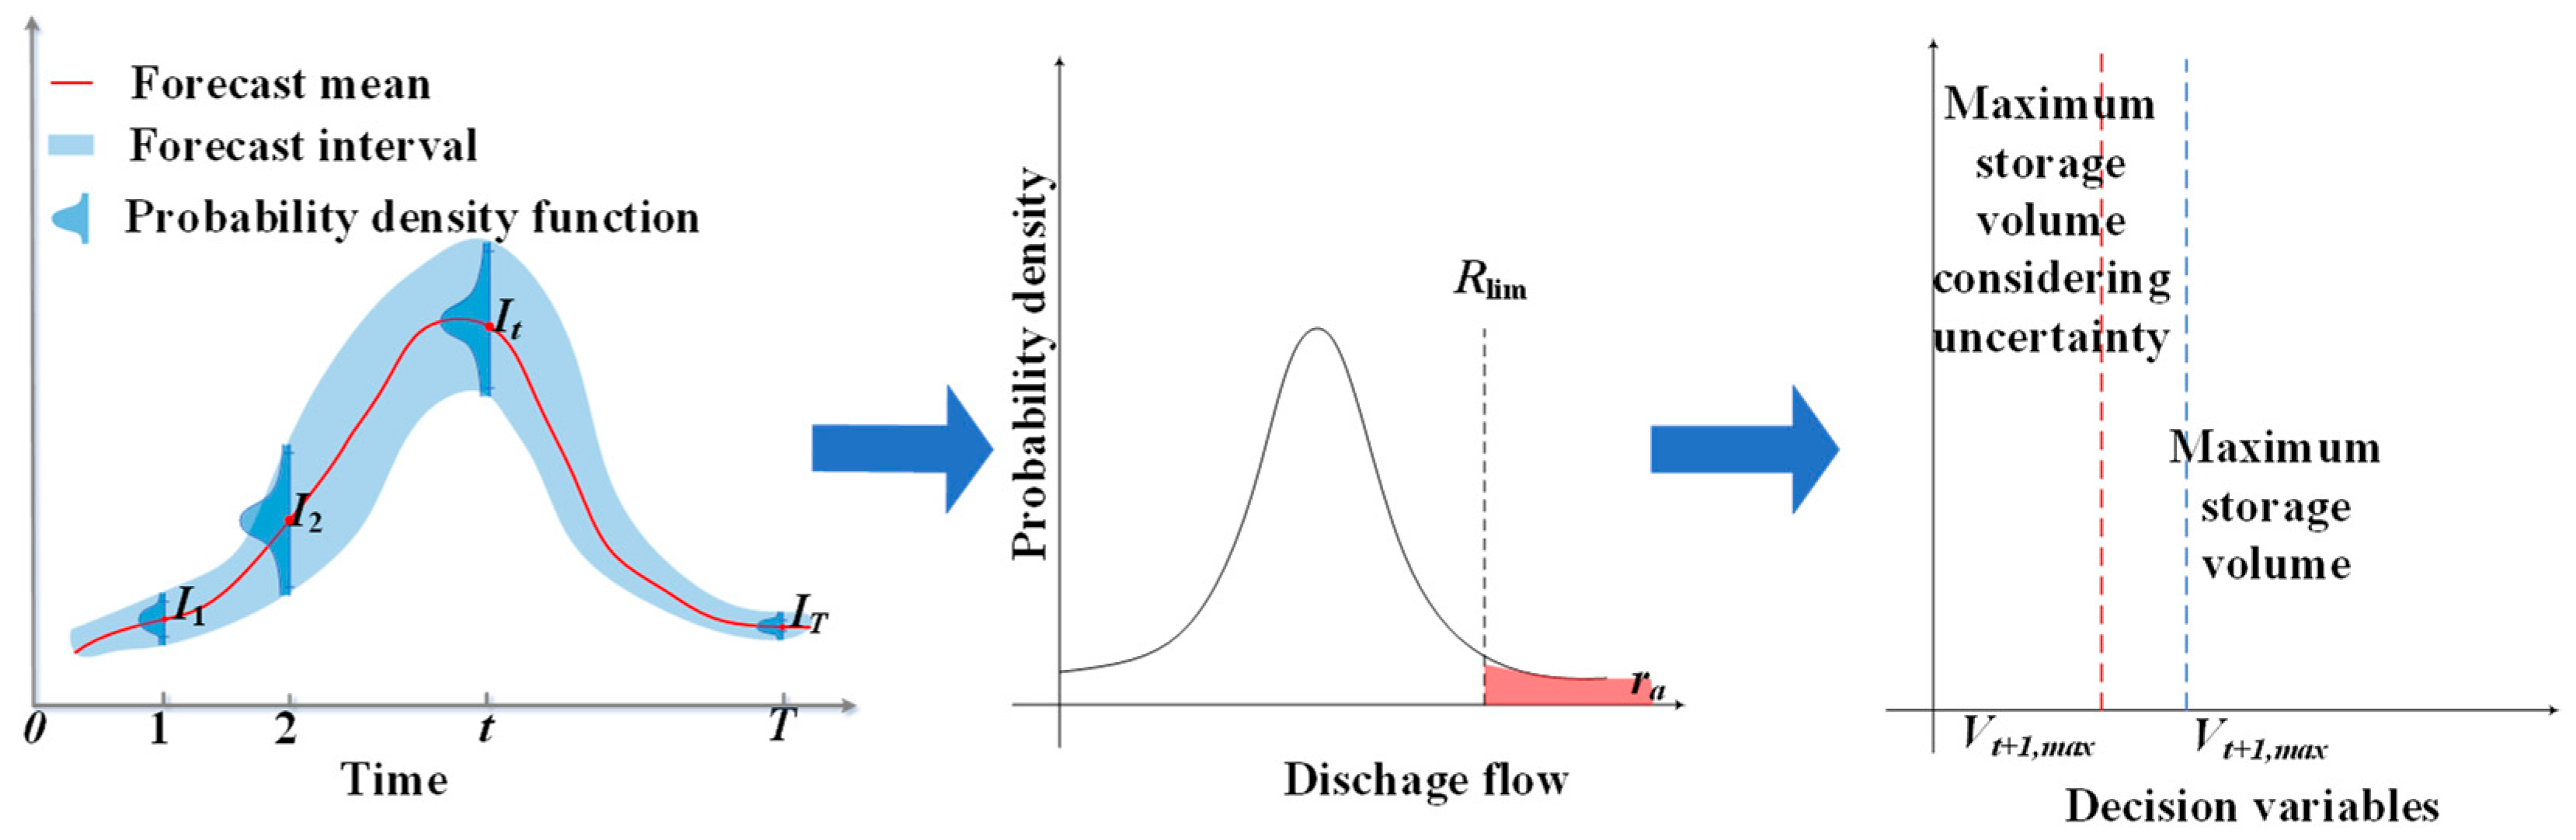
2.2.2. Impact of Forecast Uncertainty on Reservoir Operation
2.2.3. Hierarchical Pre-Fill and Pre-Release Strategy
2.3. Many-Objective Optimization Model of the HPFOR
2.3.1. Objective Function
2.3.2. Constraints
2.4. Region Search Evolutionary Algorithm
| Algorithm 1: Framework of the RSEA |
| (λ1, λ2,…, λN) = InitializeWeights() E = InitializeNeighborhood() P = InitializePopulation() z* = InitializeIdealPoint(P) znad = InitializeNadirPoint(P) while termination criteria is not satisfied do for each subproblem i = 1, 2, …, N do xc = Reproduction(MP) // xc is an offspring z* = UpdateIdealPoint(xc) znad = UpdateNadirPoint(xc) Normalize(P, xc, z∗, znad) P = UpdtaePopulation(MP, xc) end for end while |
3. Case Study
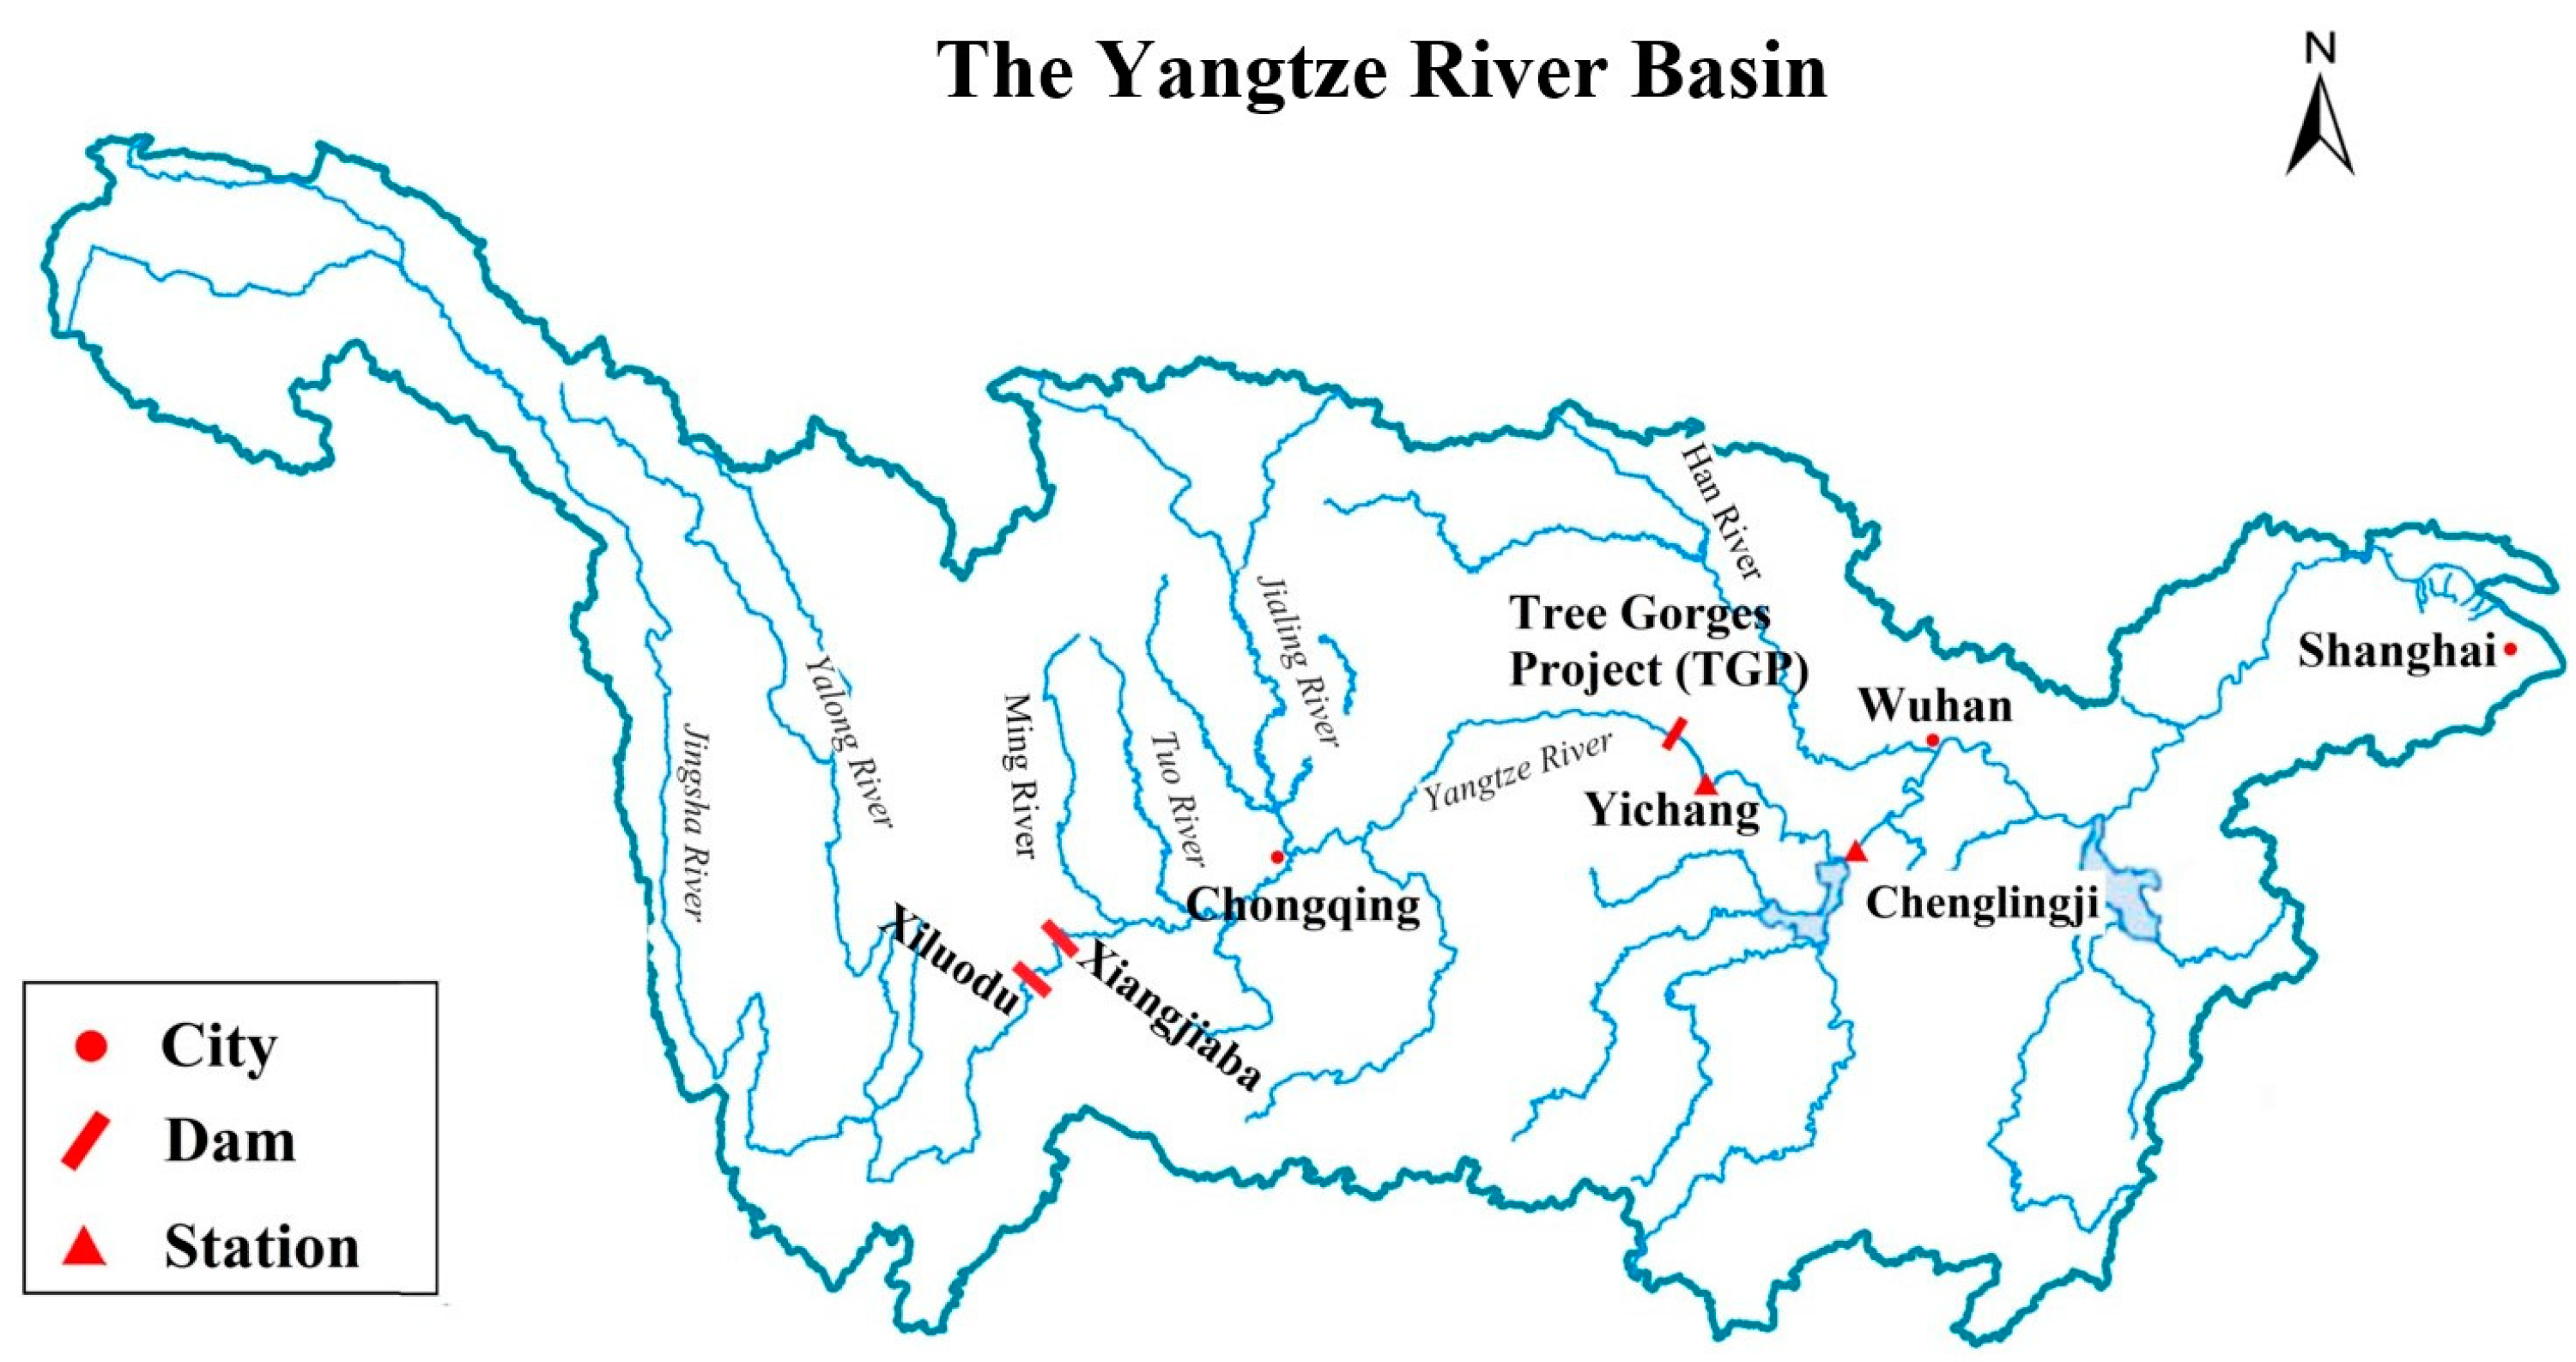
3.1. Study Area
3.2. Encoding and Constraints
3.2.1. Individual Encoding
3.2.2. Constraint Handling
3.3. Results and Discussion
3.3.1. Algorithm Performance Analysis
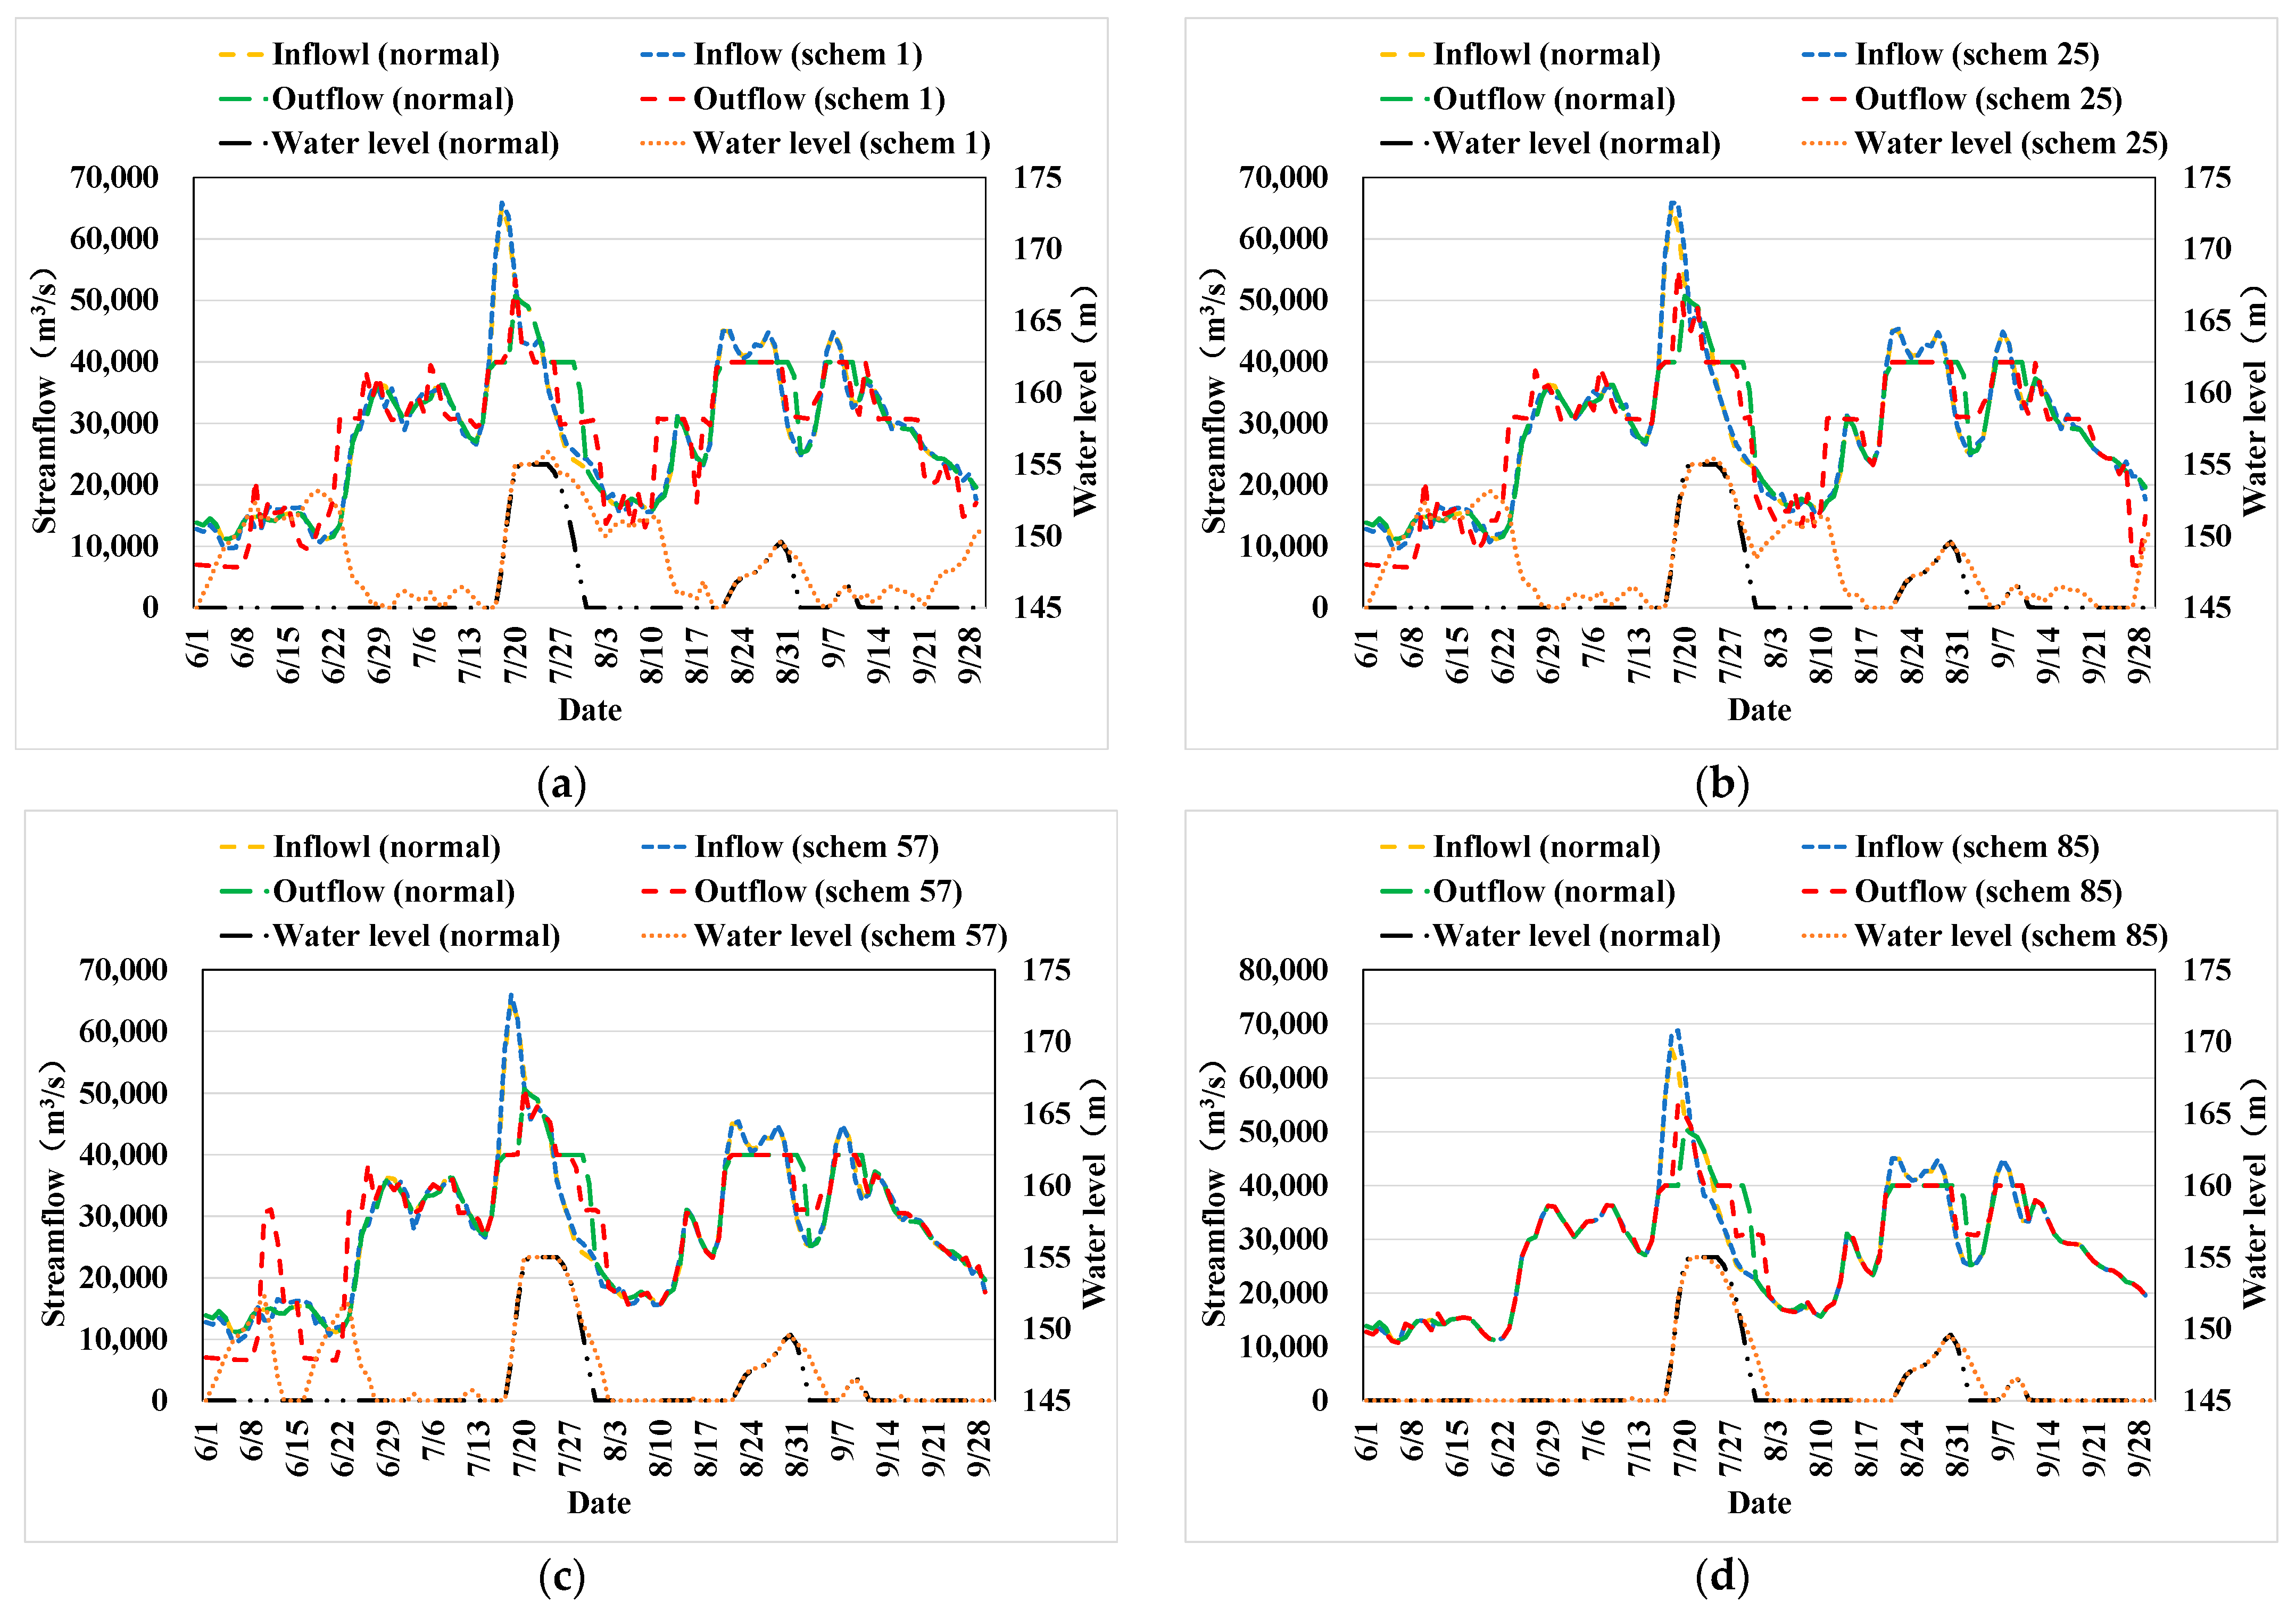
3.3.2. Operation Process Analysis
3.3.3. Comparison with Other Studies
4. Conclusions
Author Contributions
Funding
Data Availability Statement
Conflicts of Interest
References
- Towfiqul Islam, A.R.M.; Talukdar, S.; Mahato, S.; Kundu, S.; Eibek, K.U.; Pham, Q.B.; Kuriqi, A.; Thuy Linh, N.T. Flood susceptibility modelling using advanced ensemble machine learning models. Geosci. Front. 2021, 12, 101075. [Google Scholar] [CrossRef]
- Costache, R. Flash-flood Potential Index mapping using weights of evidence, decision Trees models and their novel hybrid integration. Stoch. Environ. Res. Risk Assess. 2019, 33, 1375–1402. [Google Scholar] [CrossRef]
- Alexander, K.; Hettiarachchi, S.; Ou, Y.; Sharma, A. Can integrated green spaces and storage facilities absorb the increased risk of flooding due to climate change in developed urban environments? J. Hydrol. 2019, 579, 124201. [Google Scholar] [CrossRef]
- Xu, L.; Wang, X.; Liu, J.; He, Y.; Tang, J.; Nguyen, M.; Cui, S. Identifying the trade-offs between climate change mitigation and adaptation in urban land use planning: An empirical study in a coastal city. Environ. Int. 2019, 133, 105162. [Google Scholar] [CrossRef]
- Pan, Z.; Chen, L.; Teng, X. Research on joint flood control operation rule of parallel reservoir group based on aggregation–decomposition method. J. Hydrol. 2020, 590, 125479. [Google Scholar] [CrossRef]
- Oliveira, R.; Loucks, D.P. Operating rules for multireservoir systems. Water Resour. Res. 1997, 33, 839–852. [Google Scholar] [CrossRef]
- Huang, A.; Gao, G.; Yao, L.; Yin, S.; Li, D.; Do, H.X.; Fu, B. Spatiotemporal variations of inter- and intra-annual extreme streamflow in the Yangtze River Basin. J. Hydrol. 2024, 629, 130634. [Google Scholar] [CrossRef]
- Howard, R.A. Dynamic Programming. Manag. Sci. 1966, 5, 317–348. [Google Scholar] [CrossRef]
- Deb, K.; Pratap, A.; Agarwal, S.; Meyarivan, T. A fast and elitist multiobjective genetic algorithm: NSGA-II. IEEE Trans. Evol. Comput. 2002, 6, 182–197. [Google Scholar] [CrossRef]
- Huang, W.C.; Wu, C.M. Diagnostic Checking in Stochastic Dynamic Programming. J. Water Resour. Plan. Manag. 1993, 119, 490–494. [Google Scholar] [CrossRef]
- Suiadee, W.; Tingsanchali, T. A combined simulation–genetic algorithm optimization model for optimal rule curves of a reservoir: A case study of the Nam Oon Irrigation Project, Thailand. Hydrol. Process. 2007, 21, 3211–3225. [Google Scholar] [CrossRef]
- Yang, P.; Ng, T.L. Fuzzy Inference System for Robust Rule-Based Reservoir Operation under Nonstationary Inflows. J. Water Resour. Plan. Manag. 2017, 143, 04016084. [Google Scholar] [CrossRef]
- Feng, Z.; Niu, W.; Zhang, R.; Wang, S.; Cheng, C. Operation rule derivation of hydropower reservoir by k-means clustering method and extreme learning machine based on particle swarm optimization. J. Hydrol. 2019, 576, 229–238. [Google Scholar] [CrossRef]
- Liu, Y.; Qin, H.; Zhang, Z.; Yao, L.; Wang, Y.; Li, J.; Liu, G.; Zhou, J. Deriving reservoir operation rule based on Bayesian deep learning method considering multiple uncertainties. J. Hydrol. 2019, 579, 124207. [Google Scholar] [CrossRef]
- Chen, L.; McPhee, J.; Yeh, W.W.G. A diversified multiobjective GA for optimizing reservoir rule curves. Adv. Water Resour. 2007, 30, 1082–1093. [Google Scholar] [CrossRef]
- Chang, L.; Chang, F. Multi-objective evolutionary algorithm for operating parallel reservoir system. J. Hydrol. 2009, 377, 12–20. [Google Scholar] [CrossRef]
- Gomes, M.D.G.; Maia, A.G.; Medeiros, J.D.F.D. Reservoir operation rule in semiarid areas: The quantity-quality approach. J. Hydrol. 2022, 610, 127944. [Google Scholar] [CrossRef]
- Moeini, R.; Hadiyan, P.P. Hybrid methods for reservoir operation rule curve determination considering uncertain future condition. Sustain. Comput. Inform. Syst. 2022, 35, 100727. [Google Scholar] [CrossRef]
- Jiang, Z.; Liu, P.; Ji, C.; Zhang, H.; Chen, Y. Ecological flow considered multi-objective storage energy operation chart optimization of large-scale mixed reservoirs. J. Hydrol. 2019, 577, 123949. [Google Scholar] [CrossRef]
- Liu, Y.; Qin, H.; Mo, L.; Wang, Y.; Chen, D.; Pang, S.; Yin, X. Hierarchical Flood Operation Rules Optimization Using Multi-Objective Cultured Evolutionary Algorithm Based on Decomposition. Water Resour. Manag. 2019, 33, 337–354. [Google Scholar] [CrossRef]
- Ahmadianfar, I.; Kheyrandish, A.; Jamei, M.; Gharabaghi, B. Optimizing operating rules for multi-reservoir hydropower generation systems: An adaptive hybrid differential evolution algorithm. Renew. Energy 2021, 167, 774–790. [Google Scholar] [CrossRef]
- He, S.; Guo, S.; Zhang, J.; Liu, Z.; Cui, Z.; Zhang, Y.; Zheng, Y. Multi-objective operation of cascade reservoirs based on short-term ensemble streamflow prediction. J. Hydrol. 2022, 610, 127936. [Google Scholar] [CrossRef]
- Bourdin, D.R.; Fleming, S.W.; Stull, R.B. Streamflow Modelling: A Primer on Applications, Approaches and Challenges. Atmosphere-Ocean 2012, 50, 507–536. [Google Scholar] [CrossRef]
- Liu, Y.; Ye, L.; Qin, H.; Ouyang, S.; Zhang, Z.; Zhou, J. Middle and Long-Term Runoff Probabilistic Forecasting Based on Gaussian Mixture Regression. Water Resour. Manag. 2019, 33, 1785–1799. [Google Scholar] [CrossRef]
- Wu, C.L.; Chau, K.W.; Li, Y.S. Predicting monthly streamflow using data-driven models coupled with data-preprocessing techniques. Water Resour. Res. 2009, 45, W08432. [Google Scholar] [CrossRef]
- Ye, L.; Zhou, J.; Gupta, H.V.; Zhang, H.; Zeng, X.; Chen, L. Efficient estimation of flood forecast prediction intervals via single- and multi-objective versions of the LUBE method. Hydrol. Process. 2016, 30, 2703–2716. [Google Scholar] [CrossRef]
- You, J.; Cai, X. Hedging rule for reservoir operations: 1. A theoretical analysis. Water Resour. Res. 2008, 44, W01415. [Google Scholar] [CrossRef]
- You, J.; Cai, X. Hedging rule for reservoir operations: 2. A numerical model. Water Resour. Res. 2008, 44, W01416. [Google Scholar] [CrossRef]
- Zhao, T.; Zhao, J.; Lund, J.R.; Yang, D. Optimal Hedging Rules for Reservoir Flood Operation from Forecast Uncertainties. J. Water Resour. Plan. Manag. 2014, 140, 04014041. [Google Scholar] [CrossRef]
- Ding, W.; Zhang, C.; Peng, Y.; Zeng, R.; Zhou, H.; Cai, X. An analytical framework for flood water conservation considering forecast uncertainty and acceptable risk. Water Resour. Res. 2015, 51, 4702–4726. [Google Scholar] [CrossRef]
- Tan, Q.; Wang, X.; Wang, H.; Wang, C.; Lei, X.H.; Xiong, Y.S.; Zhang, W. Derivation of optimal joint operating rules for multi-purpose multi-reservoir water-supply system. J. Hydrol. 2017, 551, 253–264. [Google Scholar] [CrossRef]
- Mohammad Ashrafi, S. Two-Stage Metaheuristic Mixed Integer Nonlinear Programming Approach to Extract Optimum Hedging Rules for Multireservoir Systems. J. Water Resour. Plan. Manag. 2021, 147, 04021070. [Google Scholar] [CrossRef]
- Liu, Y.; Hou, G.; Huang, F.; Qin, H.; Wang, B.; Yi, L. Directed graph deep neural network for multi-step daily streamflow forecasting. J. Hydrol. 2022, 607, 127515. [Google Scholar] [CrossRef]
- Liu, Y.; Ye, L.; Qin, H.; Hong, X.; Ye, J.; Yin, X. Monthly streamflow forecasting based on hidden Markov model and Gaussian Mixture Regression. J. Hydrol. 2018, 561, 146–159. [Google Scholar] [CrossRef]
- Liu, Y.; Qin, H.; Zhang, Z.; Yao, L.; Wang, C.; Mo, L.; Shuo, Q.; Jie, L. A region search evolutionary algorithm for many-objective optimization. Inf. Sci. 2019, 488, 19–40. [Google Scholar] [CrossRef]
- Li, X.; Guo, S.; Liu, P.; Chen, G. Dynamic control of flood limited water level for reservoir operation by considering inflow uncertainty. J. Hydrol. 2010, 391, 124–132. [Google Scholar] [CrossRef]
- Zhang, Q.; Li, H. MOEA/D: A Multiobjective Evolutionary Algorithm Based on Decomposition. IEEE Trans. Evol. Comput. 2007, 11, 712–731. [Google Scholar] [CrossRef]
- Deb, K.; Jain, H. An Evolutionary Many-Objective Optimization Algorithm Using Reference-Point-Based Nondominated Sorting Approach, Part I: Solving Problems With Box Constraints. IEEE Trans. Evol. Comput. 2014, 18, 577–601. [Google Scholar] [CrossRef]
- Yuan, Y.; Xu, H.; Wang, B.; Yao, X. A New Dominance Relation-Based Evolutionary Algorithm for Many-Objective Optimization. IEEE Trans. Evol. Comput. 2016, 20, 16–37. [Google Scholar] [CrossRef]
- Liu, Y.; Zhan, X.; Lyu, H.; Qin, H. Region search evolutionary algorithm with constraint handling for multi-objective short-term wind-solar-hydro-thermal scheduling. E3S Web Conf. 2021, 233, 01018. [Google Scholar] [CrossRef]
- Li, K.; Deb, K.; Zhang, Q.; Kwong, S. An Evolutionary Many-Objective Optimization Algorithm Based on Dominance and Decomposition. IEEE Trans. Evol. Comput. 2015, 19, 694–716. [Google Scholar] [CrossRef]


| Reservoir Name | Normal Water Level (m) | Flood Control Limit Level (m) | Dead Water Level (m) | Firm Power Output (MW) | Installation Capacity (MW) |
|---|---|---|---|---|---|
| Xiluodu | 600 | 560 | 560 | 3395 | 13,860 |
| Xiangjiaba | 380 | 370 | 370 | 2009 | 6000 |
| Three Gorges | 175 | 145 | 145 | 4990 | 22,400 |
| Parameters | RSEA | MOEA/D | NSGA-III | θ-DEA |
|---|---|---|---|---|
| population size N | 85 | 85 | 86 | 86 |
| neighborhood size T | 20 | 20 | - | - |
| penalty parameter θ | - | 5 | - | 5 |
| crossover probability pc | - | 1.0 | 1.0 | 1.0 |
| crossover distribution index ηc | - | 30 | 30 | 30 |
| mutation probability pm | 1/n | 1/n | 1/n | 1/n |
| mutation distribution index ηm | 20 | 20 | 20 | 20 |
| Algorithm | HV Value |
|---|---|
| MOEA/D | 1.02782 |
| NSGA-III | 1.37412 |
| θ-DEA | 1.43363 |
| RSEA | 1.44494 |
| N | F1 (108 kWh) | F2 (m) | F3 (m3/s) | F4 (108 m3) | F5 (%) | N | F1 (108 kWh) | F2 (m) | F3 (m3/s) | F4 (108 m3) | F5 (%) |
|---|---|---|---|---|---|---|---|---|---|---|---|
| - | 885.56 | 149.95 | 41,132 | 1.97 | 77.44 | 43 | 901.23 | 150.02 | 41,006 | 0.75 | 74.92 |
| 1 | 913.31 | 150.28 | 41,297 | 2.31 | 73.32 | 44 | 901.23 | 150.04 | 40,903 | 1.15 | 75.11 |
| 2 | 913.14 | 150.29 | 41,325 | 2.28 | 73.30 | 45 | 901.22 | 150.02 | 40,804 | 2.12 | 75.69 |
| 3 | 912.35 | 150.37 | 41,411 | 0.98 | 73.33 | 46 | 901.00 | 150.01 | 41,074 | 1.47 | 74.69 |
| 4 | 912.35 | 150.37 | 41,413 | 0.96 | 73.34 | 47 | 900.92 | 149.98 | 40,782 | 2.51 | 75.98 |
| 5 | 912.04 | 150.25 | 41,314 | 2.09 | 73.39 | 48 | 900.85 | 150.09 | 40,840 | 1.90 | 74.18 |
| 6 | 911.96 | 150.27 | 41,549 | 0.70 | 73.30 | 49 | 900.73 | 150.07 | 40,544 | 2.39 | 75.42 |
| 7 | 911.40 | 150.34 | 41,566 | 0.87 | 73.36 | 50 | 900.57 | 150.10 | 41,362 | 0.01 | 72.64 |
| 8 | 911.13 | 150.21 | 41,382 | 1.96 | 73.44 | 51 | 900.46 | 150.08 | 41,218 | 0.74 | 76.29 |
| 9 | 910.85 | 150.22 | 41,089 | 2.33 | 72.58 | 52 | 899.58 | 150.08 | 40,634 | 2.43 | 76.66 |
| 10 | 910.79 | 150.30 | 41,625 | 0.21 | 73.32 | 53 | 899.57 | 150.06 | 40,482 | 2.43 | 76.68 |
| 11 | 910.58 | 150.17 | 41,440 | 0.69 | 73.43 | 54 | 899.50 | 150.05 | 40,475 | 2.43 | 76.68 |
| 12 | 910.17 | 150.23 | 41,130 | 1.79 | 72.49 | 55 | 899.49 | 150.05 | 40,572 | 2.43 | 76.68 |
| 13 | 910.12 | 150.24 | 41,215 | 1.54 | 72.47 | 56 | 899.26 | 149.96 | 41,065 | 1.36 | 75.01 |
| 14 | 909.76 | 150.21 | 41,875 | 0.19 | 73.42 | 57 | 899.08 | 149.96 | 40,936 | 2.40 | 75.16 |
| 15 | 909.55 | 150.25 | 41,636 | 0.92 | 73.43 | 58 | 898.46 | 150.04 | 40,621 | 2.42 | 76.63 |
| 16 | 909.04 | 150.19 | 41,424 | 0.48 | 72.85 | 59 | 898.03 | 150.11 | 40,716 | 1.93 | 76.50 |
| 17 | 908.69 | 150.16 | 41,094 | 2.63 | 73.78 | 60 | 897.90 | 149.96 | 41,419 | 1.26 | 75.54 |
| 18 | 908.67 | 150.20 | 41,713 | 0.50 | 73.53 | 61 | 897.77 | 149.94 | 41,052 | 2.70 | 76.31 |
| 19 | 907.97 | 150.21 | 41,839 | 0.13 | 73.52 | 62 | 897.69 | 149.94 | 41,028 | 2.55 | 76.33 |
| 20 | 907.66 | 150.15 | 41,051 | 2.63 | 73.92 | 63 | 897.62 | 149.95 | 41,476 | 1.48 | 75.48 |
| 21 | 907.13 | 150.11 | 41,428 | 2.05 | 72.79 | 64 | 897.57 | 150.02 | 41,336 | 0.05 | 74.65 |
| 22 | 907.01 | 150.15 | 41,176 | 1.70 | 71.81 | 65 | 897.41 | 149.97 | 41,454 | 1.54 | 75.84 |
| 23 | 906.99 | 150.20 | 41,539 | 0.98 | 73.67 | 66 | 896.98 | 150.00 | 41,004 | 1.38 | 76.53 |
| 24 | 906.58 | 150.14 | 41,791 | 0.38 | 72.23 | 67 | 896.76 | 150.00 | 41,516 | 0.58 | 74.88 |
| 25 | 906.12 | 150.15 | 41,298 | 1.36 | 71.70 | 68 | 896.60 | 149.97 | 41,196 | 1.17 | 76.01 |
| 26 | 905.58 | 150.11 | 41,275 | 1.58 | 71.92 | 69 | 896.42 | 149.87 | 40,828 | 2.28 | 75.25 |
| 27 | 905.07 | 150.12 | 41,180 | 2.15 | 73.05 | 70 | 896.16 | 150.00 | 41,233 | 0.53 | 76.76 |
| 28 | 904.53 | 150.16 | 41,933 | 0.30 | 72.86 | 71 | 895.93 | 149.94 | 41,353 | 2.12 | 77.14 |
| 29 | 904.48 | 150.13 | 41,986 | 0.28 | 72.85 | 72 | 895.36 | 149.97 | 41,255 | 0.51 | 76.98 |
| 30 | 904.39 | 150.12 | 41,957 | 0.40 | 72.72 | 73 | 895.02 | 149.96 | 41,447 | 0.40 | 77.45 |
| 31 | 903.98 | 150.07 | 41,164 | 1.87 | 73.06 | 74 | 894.97 | 149.89 | 40,931 | 2.01 | 75.30 |
| 32 | 903.97 | 150.07 | 41,129 | 1.62 | 72.01 | 75 | 894.90 | 150.03 | 41,261 | 0.46 | 76.66 |
| 33 | 903.54 | 150.12 | 41,584 | 1.05 | 73.47 | 76 | 894.37 | 149.88 | 40,776 | 2.29 | 77.18 |
| 34 | 903.12 | 150.09 | 41,063 | 1.33 | 74.38 | 77 | 893.85 | 149.91 | 40,872 | 2.39 | 77.23 |
| 35 | 903.11 | 150.18 | 41,590 | 0.24 | 73.56 | 78 | 892.55 | 149.95 | 41,216 | 1.08 | 76.94 |
| 36 | 903.05 | 150.14 | 41,853 | 0.57 | 73.86 | 79 | 892.49 | 149.98 | 41,423 | 0.24 | 76.92 |
| 37 | 902.52 | 150.08 | 40,970 | 1.51 | 74.23 | 80 | 892.20 | 149.90 | 40,922 | 2.21 | 77.31 |
| 38 | 902.41 | 150.15 | 41,776 | 0.76 | 73.21 | 81 | 891.19 | 149.96 | 41,083 | 1.34 | 77.26 |
| 39 | 902.23 | 150.02 | 40,817 | 2.12 | 74.53 | 82 | 890.69 | 149.92 | 40,875 | 1.90 | 76.60 |
| 40 | 901.94 | 150.10 | 41,054 | 1.27 | 74.36 | 83 | 889.73 | 149.92 | 40,982 | 1.18 | 77.33 |
| 41 | 901.93 | 150.12 | 41,495 | 0.07 | 72.56 | 84 | 889.56 | 149.94 | 41,171 | 0.28 | 77.35 |
| 42 | 901.61 | 150.03 | 41,060 | 1.62 | 74.58 | 85 | 888.65 | 149.94 | 41,389 | 0.22 | 77.29 |
Disclaimer/Publisher’s Note: The statements, opinions and data contained in all publications are solely those of the individual author(s) and contributor(s) and not of MDPI and/or the editor(s). MDPI and/or the editor(s) disclaim responsibility for any injury to people or property resulting from any ideas, methods, instructions or products referred to in the content. |
© 2024 by the authors. Licensee MDPI, Basel, Switzerland. This article is an open access article distributed under the terms and conditions of the Creative Commons Attribution (CC BY) license (https://creativecommons.org/licenses/by/4.0/).
Share and Cite
Liu, Y.; Hou, G.; Wang, B.; Xu, Y.; Tian, R.; Wang, T.; Qin, H. Many-Objective Hierarchical Pre-Release Flood Operation Rule Considering Forecast Uncertainty. Water 2024, 16, 785. https://doi.org/10.3390/w16050785
Liu Y, Hou G, Wang B, Xu Y, Tian R, Wang T, Qin H. Many-Objective Hierarchical Pre-Release Flood Operation Rule Considering Forecast Uncertainty. Water. 2024; 16(5):785. https://doi.org/10.3390/w16050785
Chicago/Turabian StyleLiu, Yongqi, Guibing Hou, Baohua Wang, Yang Xu, Rui Tian, Tao Wang, and Hui Qin. 2024. "Many-Objective Hierarchical Pre-Release Flood Operation Rule Considering Forecast Uncertainty" Water 16, no. 5: 785. https://doi.org/10.3390/w16050785
APA StyleLiu, Y., Hou, G., Wang, B., Xu, Y., Tian, R., Wang, T., & Qin, H. (2024). Many-Objective Hierarchical Pre-Release Flood Operation Rule Considering Forecast Uncertainty. Water, 16(5), 785. https://doi.org/10.3390/w16050785