Article

Development of Daily Flow Expansion Regression and Web GIS-Based Pollutant Load Evaluation System

1
EM Research Institute, Chuncheon-si 24341, Republic of Korea
2
National Institute of Environmental Research (NIER), Chuncheon-si 22689, Republic of Korea
3
Department of Agricultural Civil Engineering, Kyungpook National University, Daegu 41566, Republic of Korea
4
Department of Environmental Engineering, Andong National University, Andong 760749, Republic of Korea
5
Department of Agricultural and Biological Engineering, University of Illinois at Urbana-Champaign, Champaign, IL 61820-5711, USA
6
Department of Regional Infrastructure Engineering, Kangwon National University, Chuncheon-si 24341, Republic of Korea
*
Author to whom correspondence should be addressed.
Water 2024, 16(5), 744; https://doi.org/10.3390/w16050744
Submission received: 5 January 2024 / Revised: 19 February 2024 / Accepted: 27 February 2024 / Published: 29 February 2024
(This article belongs to the Section Hydrology)

Abstract

:
This study accounted for the importance of daily expansion flow data in compensating for insufficient flow data in a watershed. In particular, the 8-day interval flow measurement data (intermittent monitoring data) could cause uncertainty in the high- or low-flow conditions that have been used to estimate the flow duration curve (FDC) and the load duration curve (LDC) used in Total Maximum Daily Load (TMDL) evaluation in Korea. Thus, this study developed a method to expand the 8-day interval flow data (missing data) to daily flow data in order to evaluate the Total Maximum Daily Load (TMDL) appropriately in a watershed. We employed the machine learning technique (the gradient descent method provided by the Google TensorFlow package) to develop a regression for expanding the 8-day interval flow data. The method was applied in the Nakdong River basin located in Korea to collect the 8-day interval and daily flow data from a number of gauging stations. The results of the expanded daily flow were evaluated through the RMSE, MAE, IOA, and NSE, and the valid expanded daily flow data were obtained for the 29 TMDL gauging stations (IOA 0.84~0.99, NSE −0.18~0.99). A good performance in the creation of daily flow data (continuous data) from the 8-day interval flow data (intermittent data) was shown using the proposed method. In addition, the Web GIS-based pollutant load assessment system was developed to evaluate the TMDL; it included the daily data expansion method and provided the pollution load characteristics objectively and intuitively. This system will help decision makers, such as environmental regulators, researchers, and the general public, and support their decision making for pollution source management with accessible and efficient tools for understanding and addressing water quality issues.

1. Introduction

The health of a stream ecosystem is negatively impacted by both point and nonpoint source pollution. Restoring the health of the stream often involves effectively managing and addressing pollution loads and sources. Streamflow characteristics, including volume, rate, and timing, vary specifically within each watershed [1]. In numerous U.S. states, the Total Maximum Daily Load (TMDL) program has been widely developed and implemented to enhance water quality in streams, with the aim of reducing pollutant loads from both point and nonpoint sources [2]. However, TMDL often represents an average daily pollutant load under typical long-term flow conditions, limiting its effectiveness in addressing specific issues. Without a comprehensive understanding of the problems within a watershed, it becomes challenging to identify and implement appropriate solutions. Therefore, there is a growing emphasis on conducting water quality characterizations for various flow conditions, rather than relying solely on a single parameter such as the average daily flow value of the stream/watershed, to ensure a more effective restoration of water quality [3]. In Korea, the water quality in rivers has been regulated by the establishment of emission limits (concentrations) for domestic sewage, industrial wastewater, and other sources [4]. However, since the amount of pollutants flowing into rivers has increased, the Ministry of Environment (MOE) has established and implemented the management of the TMDL, which is a load-oriented stream management system [5]. It establishes the target water quality of streams to be managed and estimates the allowable load of water pollutants to achieve and maintain the target water quality. Based on the target water quality, it regulates or manages the pollutant load (amount of discharge) discharged from the watershed so that the amount is less than the allowable total amount. To evaluate the achievement of the target water quality in TMDLs, the water quality data measured at an average of 8-day intervals for a certain period are averaged and compared with the target water quality. Also, the flow duration curve (FDC) and the load duration curve (LDC) have been used to evaluate the achievement, which was developed in the US Environmental Protection Agency (EPA) to establish a total pollution management plan [4,6,7]. Recently, in a total water pollution management system at a tributary, the LDC tool has been widely used for managing the total pollutant load in watersheds. The LDC analyses the excess rate of the measured water quality against the target according to the flow conditions and visualizes the relationship between the flow rate and the pollutant load in an easy-to-understand manner.
Although the use of daily flow data is recommended when using the LDC [8], the flow and water quality are simultaneously measured at 8-day intervals in the stations of the total water pollution load monitoring network in Korea. Monitoring at 8-day intervals helps to detect and track these variations, allowing the identification of water quality changes during specific periods or environmental events. Monitoring water quality more frequently can be resource-intensive and costly. However, the discontinuous flow data can cause a limitation in the reflection of the annual flow conditions in streams due to the lack of information, especially in high-flow conditions. In particular, according to the study in [9], the excess pollutant loads in high-flow conditions could be influenced by nonpoint pollution sources, and those in low-flow conditions are likely to be affected by point pollution sources. When the LDC could not accurately reflect the annual flow characteristics, its analysis caused uncertainty in the pollutant load analysis in relation to the flow conditions (e.g., high, mid, low, and dry).
In order to solve this problem, many studies have used the FDC to evaluate the pollutant loads for various flow conditions by using the daily flow data simulated by watershed-scale hydrological models that calibrate the simulated results using the average 8-day interval measurement data of the monitoring network [10,11,12,13]. Table 1 shows the advantages and limitations related to daily flow expansion that have been suggested in previous similar studies.
However, due to the construction of various artifacts, such as weirs, reservoirs, and agricultural waterways, the hydrological modeling is facing difficulties that result in uncertainties. Thus, a study on the development of the daily flow expansion regression equations employing the 8-day interval measurement data in the monitoring networks has been implemented to evaluate the annual pollutant load characteristics for flow conditions [7]. However, the regression equations of the daily flow expansion developed through previous studies have disadvantages due to the fact that these equations do not accurately reflect the continuously changing streamflow characteristics. This is because it is an analysis of the correlation between the flow data measured at the different monitoring stations for the 8-day interval measurements (total water pollution load monitoring network, Korea) and the flow data for the daily flow measurements for a certain period.
In addition, according to Cleland [23], streamflow classification is based on the magnitude of flow, where 0 to 10 percent is categorized as high-flow conditions, 10 to 40 percent as moist conditions, 40 to 60 percent as mid-range conditions, 60 to 90 percent as dry conditions, and 90 to 100 percent as low-flow conditions. The US EPA provides directions for pollutant reduction and management based on pollution load exceedances for each streamflow condition; primarily, it uses the categories of high-flow and moist conditions for nonpoint source pollution management and dry conditions and low-flow conditions for point source pollution management. While the existing load duration curve (LDC) analysis systems have been developed, there is a need to incorporate correction or expansion techniques for unmeasured or discontinuous flow data. Users also require a system that can objectively and intuitively assess the characteristics of a river’s pollution load. Also, the existing studies have developed the web-based systems that generate FDC/LDC [4]. However, for more precise TMDL evaluation, a tool that can compensate for missing data is needed, and a system that can present actual pollution source analysis rather than simply generating FDC/LDC graphs is needed.
Thus, the objectives of this study are (1) to expand the 8-day interval flow data to daily flow data that can reflect continuously changing flow characteristics periodically by developing the daily flow expansion system and (2) to develop the Web GIS-based pollution load evaluation system to reflect the flow characteristics in streams.
Through the daily flow expansion methodology developed in this study, when evaluating TMDL this study aims to secure high-resolution time series data and to reduce flow prediction uncertainty in high- and low-flow conditions. Also, by integrating GIS capabilities, this research seeks to develop a comprehensive and user-friendly system that facilitates pollution load assessments and management (Web GIS-based automated pollution load assessment system). The overarching goal is to provide stakeholders, including environmental regulators, researchers, and the general public, with accessible and efficient tools for understanding and addressing water quality issues.
This paper consists of the four sections. Section 2 describes the research method and includes Section 2.1 Study Area, Section 2.2 Daily Flow Expansion Method, Section 2.3 Pollution Load Evaluation Method, and Section 2.4 Development of a Web GIS-based System. Section 3 comprises the results of the research method, and Section 4 comprises the conclusion.

2. Materials and Methods

The primary objective of this study is to derive a daily flow expansion regression equation using flow data measured at 8-day intervals, utilizing Google’s machine learning library, TensorFlow (https://www.tensorflow.org/). For this purpose, we analyzed flow measurement sites with 8-day interval data and nearby sites, or sites within the same sub-basin, with daily flow data. We selected daily flow measurement sites that could be correlated with the 8-day interval flow sites and validated the correlation of the regression equations derived through TensorFlow. This led us to develop the final daily flow expansion regression equation.
By applying this newly developed daily flow expansion regression equation, we constructed a “Web GIS-based Pollutant Load Assessment System”, which allows the analysis of pollutant loads that reflect the annual flow characteristics within the Total Maximum Daily Load (TMDL) system at each designated monitoring site that measures flow at 8-day intervals (Figure 1).

2.1. Study Area

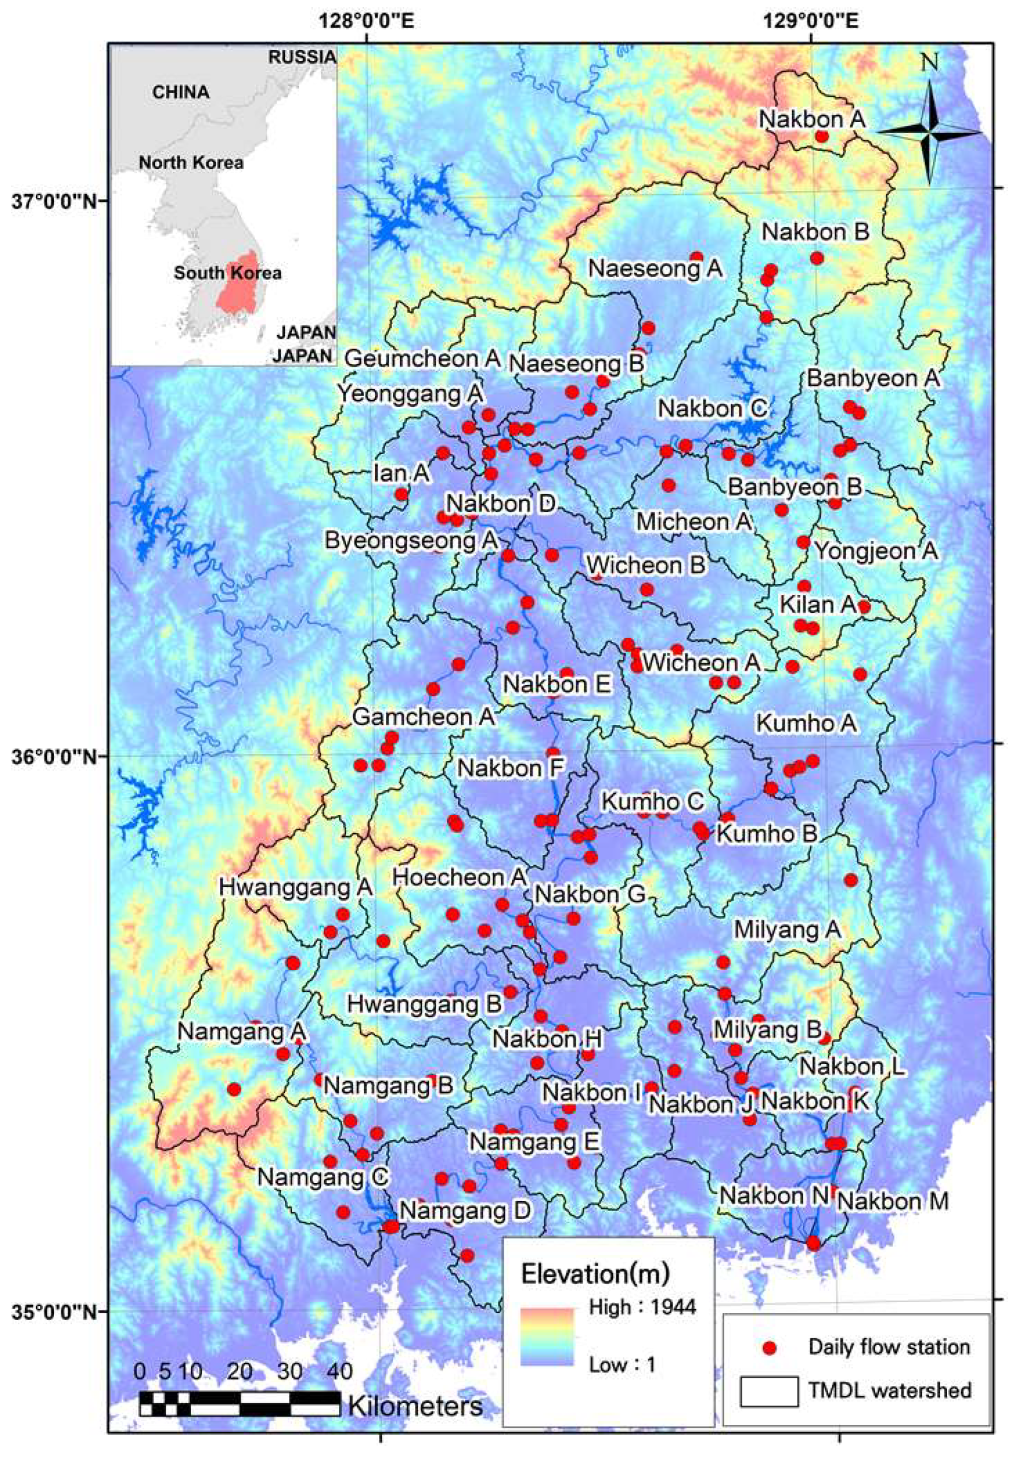
The Nakdong River basin in Korea was selected as the case study for the daily flow expansion system and the pollutant load evaluation system developed in this study. The basin area is 23,690 km2 and is the second largest watershed in Korea. The basin features 25 weather stations with an average temperature of 13.3 °C and an annual rainfall of 1280.2 mm. Hilly and mountainous soils are extensively distributed. Alluvial soils are spread along riverbanks and agricultural lands, while well-drained sedimentary soils are found in certain areas of fields or forested lands at higher elevations. The Nakdong River basin has been experiencing various social and environmental problems, such as massive green algae and algal blooms and deteriorating water quality [24]. In the Nakdong River basin, the social issues are particularly concentrated due to the occurrence of green algae; thus, it is important to manage and analyze the pollution sources for river management. The basin is subdivided into 41 TMDL watersheds, in which 161 flow stations are operated. In this study, the daily flow expansion system was developed based on a machine learning technique using 8-day interval (http://water.nier.go.kr (accessed on 1 May 2023)) and daily flow measurement data (http://wamis.go.kr (accessed on 1 May 2023)) collected from monitoring stations located in the Nakdong River basin (Figure 2).

2.2. Development of Daily Flow Expansion System at 8-Day Interval Measurement Stations

2.2.1. Selection of Monitoring Stations for 8-Day Intervals and Daily Flow Measurement and Development of Regression Equation

Recently, machine learning, a technique that enables computers to learn vast amounts of data and predict outputs, has been applied to a variety of research fields. It builds algorithms that learn, predict, and improve performance on the basis of empirical data, and it plays a key role in artificial intelligence (AI) [25]. In this study, the gradient descent method (provided by the Google TensorFlow package) was used among the various learning methods provided by the linear regression models (Equation (1)) and TensorFlow. The gradient descent method optimizes an algorithm by repeatedly updating parameters so that the slope of the error function becomes the minimum value. The error function utilizes Equation (2), which is similar to the mean square error (MSE).
y _ d a t a s i m = a × x _ d a t a + b
E F = 1 2 n i = 1 n ( y _ d a t a s i m , n y _ d a t a o b s , n ) 2
where y _ d a t a s i m is the predicted daily flow at the 8-day interval measurement stations; x _ d a t a is the measured daily flow at the daily measurement stations; a is the weight variable; b is the bias variable; n is the total number of data points; and y _ d a t a o b s is the measured flow at the 8-day interval measurement stations.
The minimization of the error function (EF) is performed by repeatedly updating the parameter towards the lowering of the error function by partially differentiating the parameters a and b (Equations (3) and (4)).
a u p d a t e d = a α 1 n i = 1 n ( y _ d a t a s i m , n y _ d a t a o b s , n ) x
b u p d a t e d = b α 1 n i = 1 n ( y _ d a t a s i m , n y _ d a t a o b s , n )
where a u p d a t e d is the updated parameter a; b u p d a t e d is the updated parameter b; and a is the learning coefficient.
In this study, the measured flow data for the 3 years from 2014 to 2016 at all the national flow monitoring stations in the TMDL watersheds were classified as missing or error data (less than 0.1) and learning data (more than 0.1) by the supervised method provided by TensorFlow. In turn, the daily flow monitoring stations indicating the best learning effect (minimized EF) were selected as the related stations for the 8-day intervals and daily flow measurements to derive the regression equations.

2.2.2. Validation of the Correlation between Monitoring Stations for 8-Day Interval and Daily Flow Measurement

The correlation between the monitoring stations for the 8-day interval and daily flow measurements was validated using the RMSE (root mean square error), MAE (mean absolute error), IOA (index of agreement), and NSE (Nash–Sutcliffe model efficiency coefficient) (Equations (5)–(8)).
The closer the RMSE and MAE are to “0”, the closer the IOA and NSE are to “1”, which means that the observed and predicted values are similar [26,27].
R M S E = 1 N i = 1 n ( P i O i ) 2
M A E = 1 n i = 1 n P i O i
IOA = 1 i = 1 n ( P i O i ) 2 i = 1 n ( P i O ¯ + O i O ¯ ) 2
N S E = 1 i = 1 n ( O i P i ) 2 i = 1 n ( O i O i ¯ ) 2
where N is the number of data points, P is the predicted value, O is the measured value, and O ¯ is the averaged measurement.

2.2.3. Comparison of the Expanded Daily Flow Using Machine Learning and Specific Discharge Measurement Method

The expanded daily flow data generated by the regression equations developed through machine learning were compared with the results of a specific discharge measurement method which is widely used for the prediction of flow data in ungauged watersheds. The specific discharge measurement method estimates the flow rate by considering the unit area after selecting the representative station when the flow measurement is difficult in the field. This method assumes that if the temporal and spatial characteristics are similar in the watershed, then the flow rate is directly proportional to the area. The method is an approach for estimating runoff in ungauged watersheds, where experiences from other regions are utilized; however, consideration is given to the area of the target region through the assigning of weights. This method is commonly employed when trying to apply runoff data from other regions with similar terrain or climatic characteristics to an ungauged watershed. Based on the similarity assessment, weights are assigned to account for the area of each region. Typically, adjustments are made to the weights if the ungauged watershed has a larger or smaller area compared to the reference regions. However, the difference in spatial conditions such as rainfall, stream order, etc., between an ungauged watershed and a representative watershed considerably influences the reliability of the flow prediction in the specific discharge measurement method. In order to reduce the uncertainty that might be caused by the difference in spatial conditions, the upper watershed of Nakdong River was selected as the study area. In order to evaluate the accuracy of the daily flow estimates through machine learning, we selected an 8-day interval flow monitoring station (“A station”) and a nearby daily flow monitoring station (“B station”) and developed a daily flow expansion regression equation by applying the 8-day interval flow data from A station to the daily flow from B station. Then, we compared the flow calculated through the daily flow expansion regression equation with the flow estimated using the specific discharge measurement method used for the A station.
In this study, we chose the Nakbon A and Yeonggang A stations as the “A” monitoring stations and the Jangseong and Jeomchon stations as the “B” monitoring stations to compare and evaluate the daily flow expansion regression equation and the specific discharge measurement method. When applying the flow duration curve method, the area ratio used was 1.59 for Nakbon A-Jangseong and 1.50 for Yeonggang A-Jeomchon.

2.2.4. Development of Periodic Updating System for Daily Flow Expansion

In Korea, the government has begun to open public data, aiming at innovation of the private utilization of public data since the year 2012. In each public institution, a web-based data-retrieval system was constructed to allow users to easily search and retrieve data. In addition, a standardized ‘Application Programming Interface’ (API) is provided so that users can directly develop services without accessing the homepage. The MOE provides the Open API for collecting weather data, water level, flow rate, and water quality. In this study, the periodic updating system was developed to automatically retrieve data by using the Open API and to update the daily flow expansion relation derived through TensorFlow.

2.3. Pollutant Load Evaluation Methods

2.3.1. Flow Duration Curve(FDC)/Load Duration Curve (LDC)

The LDC has advantages in the analysis of the level of water pollution representing the pollutant load characteristics according to flow conditions. Also, it can be useful because the level of the excess of target water quality and the pollutant load amount to be reduced in watersheds can be easily understood. The LDC is generated by applying the target water quality to the flow duration curve, generating the reference load duration curve, and comparing the loads calculated from the measured flow rate and water quality data (Equation (9)). The FDC used in the LDC is created by plotting the flow data in order from the maximum flow to the minimum flow and visualizing the calculation results of the number of days exceeding a specific flow rate as a percentage.
L o a d k g d a y = F l o w ( m 3 / s ) × W Q S ( m g L ) × 86.4
where Load means daily pollution load, Flow means daily flow rate, and WQS means water quality concentration.
The flow data are classified according to the flow conditions: 0~10% is flood flow conditions (high-flow), 10~40% is moist conditions, 40~60% is mid-range conditions, 60~90% is classified as dry conditions, and 90 to 100% is classified as low-flow conditions (Equation (10)).
P e r c e n t   o f   D a y s   F l o w   E x c e e d e d   % = R a n k N u m b e r   o f   d a t a × 100
In this study, the averaged flow and water quality measured at 8-day intervals and the expanded daily flow were used to create the LDC for the pollutant load evaluation.
The flow and water quality data measured at the 8-day intervals were applied as they were, and the interpolation concept was applied for the data of the flow deficit. This is because there is a difference between the expanded flow rate and the measured flow rate value due to the application of the expansion relation. This difference is propagated in the pollutant load evaluation, resulting in a difference in the calculation of the load and an increase in the uncertainty. Therefore, in this study, the pollutant loads were evaluated by interpolating only the flow rate for the missing data based on the pollutant load calculated using measured flow and water quality.

2.3.2. Q-L Rating Curve

The streamflow(Q)-load rating curve (QLRC) is a method for evaluating the pollution load characteristics of rivers objectively and intuitively by comparing the standard LDC (plotted through daily flow and target water quality) and the observed LDC (plotted through daily flow and actual water quality data). The QLRC can be easily understood with regard to the target and level of the load to be reduced in the watershed, and it is produced by nonlinear correlation analysis [28,29,30]. In QLRC, four types (CASE I, CASE II, CASE III, and CASE IV) are classified according to the characteristics and type of pollution load of the watershed (Figure 3). CASE I means ‘clean area’ because it satisfies all of the pollutant loads of the target water quality in all the flow conditions. CASE II means ‘contaminated area’ because it exceeds both the target water quality and the pollutant load in all the flow conditions. CASE III is ‘point pollution management area’ because it exceeds the pollutant load of the target water quality in low-flow conditions. Finally, CASE IV signifies ‘nonpoint pollution management area’ because it exceeds the pollutant load of the target water quality in high-flow conditions (Table 2) [29].

2.4. Development of the Web GIS-Based Pollutant Load Evaluation System

Open source software, such as GeoExt (3.0.0), OpenLayers (3.0), GeoServer (2.8.4), PostgreSQL (9.0), and HighCharts (4.2.6), was used to develop the web GIS-based pollutant load assessment system by applying the developed daily flow expansion regression equations based on the machine learning. GeoExt is an OpenLayers-based web mapping toolkit that displays maps and GIS layers on a web browser as an open-source library. GeoServer (2.8.4) is open-source GIS software that publishes GIS data on a web browser and enables users to access it directly [31]. PostgreSQL is an open-source database management system that supports geographical information as well as a general text format and is widely used to build various web-based GIS analysis systems [32]. Finally, the pollution load assessment results were visualized through the Highchart open-source library.

3. Results

This section is divided into two subsections. It provides a concise and precise description of the experimental results and their interpretation, as well as the experimental conclusions that can be drawn.

3.1. Derivation of Daily Flow Expansion Regression Equation

3.1.1. Analysis of Learning Effect Using Machine Learning

In this study, the machine learning was individually trained by applying the measurement data obtained from the daily flow stations and the 8-day interval measurement stations within the 41 TMDL watersheds. A total of 161 individual learning sessions were performed and 70 of them were found to be valid; for 36 out of 41 TMDL watersheds, one or more daily flow stations had learning effects (Table 3). The lack of a learning effect means that there is no correlation between the daily flow measurement data and the 8-day interval measurement data. This is due to the location, spatial characteristics, and data quality management of the daily flow stations.

3.1.2. Results of Selection of Daily Flow Stations Affiliated with TMDL Stations and Development of Regression Equations

This study used an error function that is similar to MSE. However, although the smallest error function is the most relevant flow station, there is a limitation in that the relative difference of the error function can be misinterpreted depending on the number or the magnitude of the measurement data to be compared. In order to resolve this problem, the station with the lowest error function value and the coefficient of determination (R2) of 0.5 or greater was determined to be the most relevant daily flow station. In conclusion, the daily flow expansion equations for the 29 TMDL watersheds, which is about 71% of the total of 41 TMDL watersheds in the Nakdong River, were developed (Table 4). As described above, Nakbon F, Nakbon G, Nakbon I, Nakbon M, and Nakbon N were excluded because those stations showed no learning effects. Additionally, the stations with an R2 of less than 0.5 (Kilan A, Nakbon H, Nakbon J, Namgang C, Naeseong A, Milyang A, and Ian A) were excluded.

3.1.3. Verification of Daily Flow Expansion Equations

The daily flow expansion equations derived through TensorFlow were verified by comparing the measurement data of the 8-day interval stations and the daily flow data estimated by the expansion equations using RMSE, MAE, and IOA (Table 5). The estimated flow data from the daily flow expansion equations and the measurement data were similar, showing an IOA of 0.8 or greater for all the TMDL watersheds. Among the 29 TMDL watersheds, Nakbon K and Nakbon L, located in the lower Nakdong River basin, had relatively higher values of RMSE and MAE. This is because, at the stations with a large streamflow, such as Nakbon K and Nakbon L, the TMDL stations and the daily flow stations utilize different flow measurement methods, which can cause the uncertainty. Additionally, these two stations have relatively higher streamflow than the other stations; thus, the RMSE and MAE of these stations show higher values than those of the other stations.
The NSE of Nakbon L was negative, and the estimated flow results calculated from the daily flow expansion equation were very different in the high-flow conditions. As the square of the error is included in the formula of the NSE, the NSE is greatly influenced by the high flow. The main stream in the Nakbon L unit watershed is Yangsan River (the tributary of Nakdong River), but the measurement station is located in Nakdong River. Due to the fact that the target stream that the two stations are observing is different, it is assumed that the Nakbon L station indicated a very poor correlation with the daily flow station. To improve these limitations, it is necessary to further study the derivation of the daily flow expansion equation when considering multiple daily flow stations.
Except for Nakbon L, the NSE of Milyang was the lowest at 0.36, and it is assumed that the uncertainty of the expansion result of the high-flow conditions is increased because most of the measurement data used to derive the daily flow expansion equation are relatively distributed in the low-flow conditions rather than in the high-flow conditions. In other words, as mentioned above, the NSE is considered to be susceptible to a high-flow value.

3.1.4. Evaluation of the Results of Daily Flow Expansion by Machine Learning and the Specific Discharge Measurement Method

The expanded daily flow data generated by the daily flow expansion equations (derived from this study) at Nakbon A and Yeonggang A, which are located in the upper watershed and have an IOA and NSE greater than 0.9 (verification result; see Section 3.1.3), were evaluated by comparing with the daily flow data estimated by the specific discharge measurement method. The average 8-day interval flow and the measured daily flow data from the year 2014 to the year 2016 were applied. The daily flow stations that correlated with Nakbon A and Yeonggang A were Jangseong and Jeomchon, and their area ratios (used for the specific discharge measurement method) were 1.59 and 1.50, respectively.
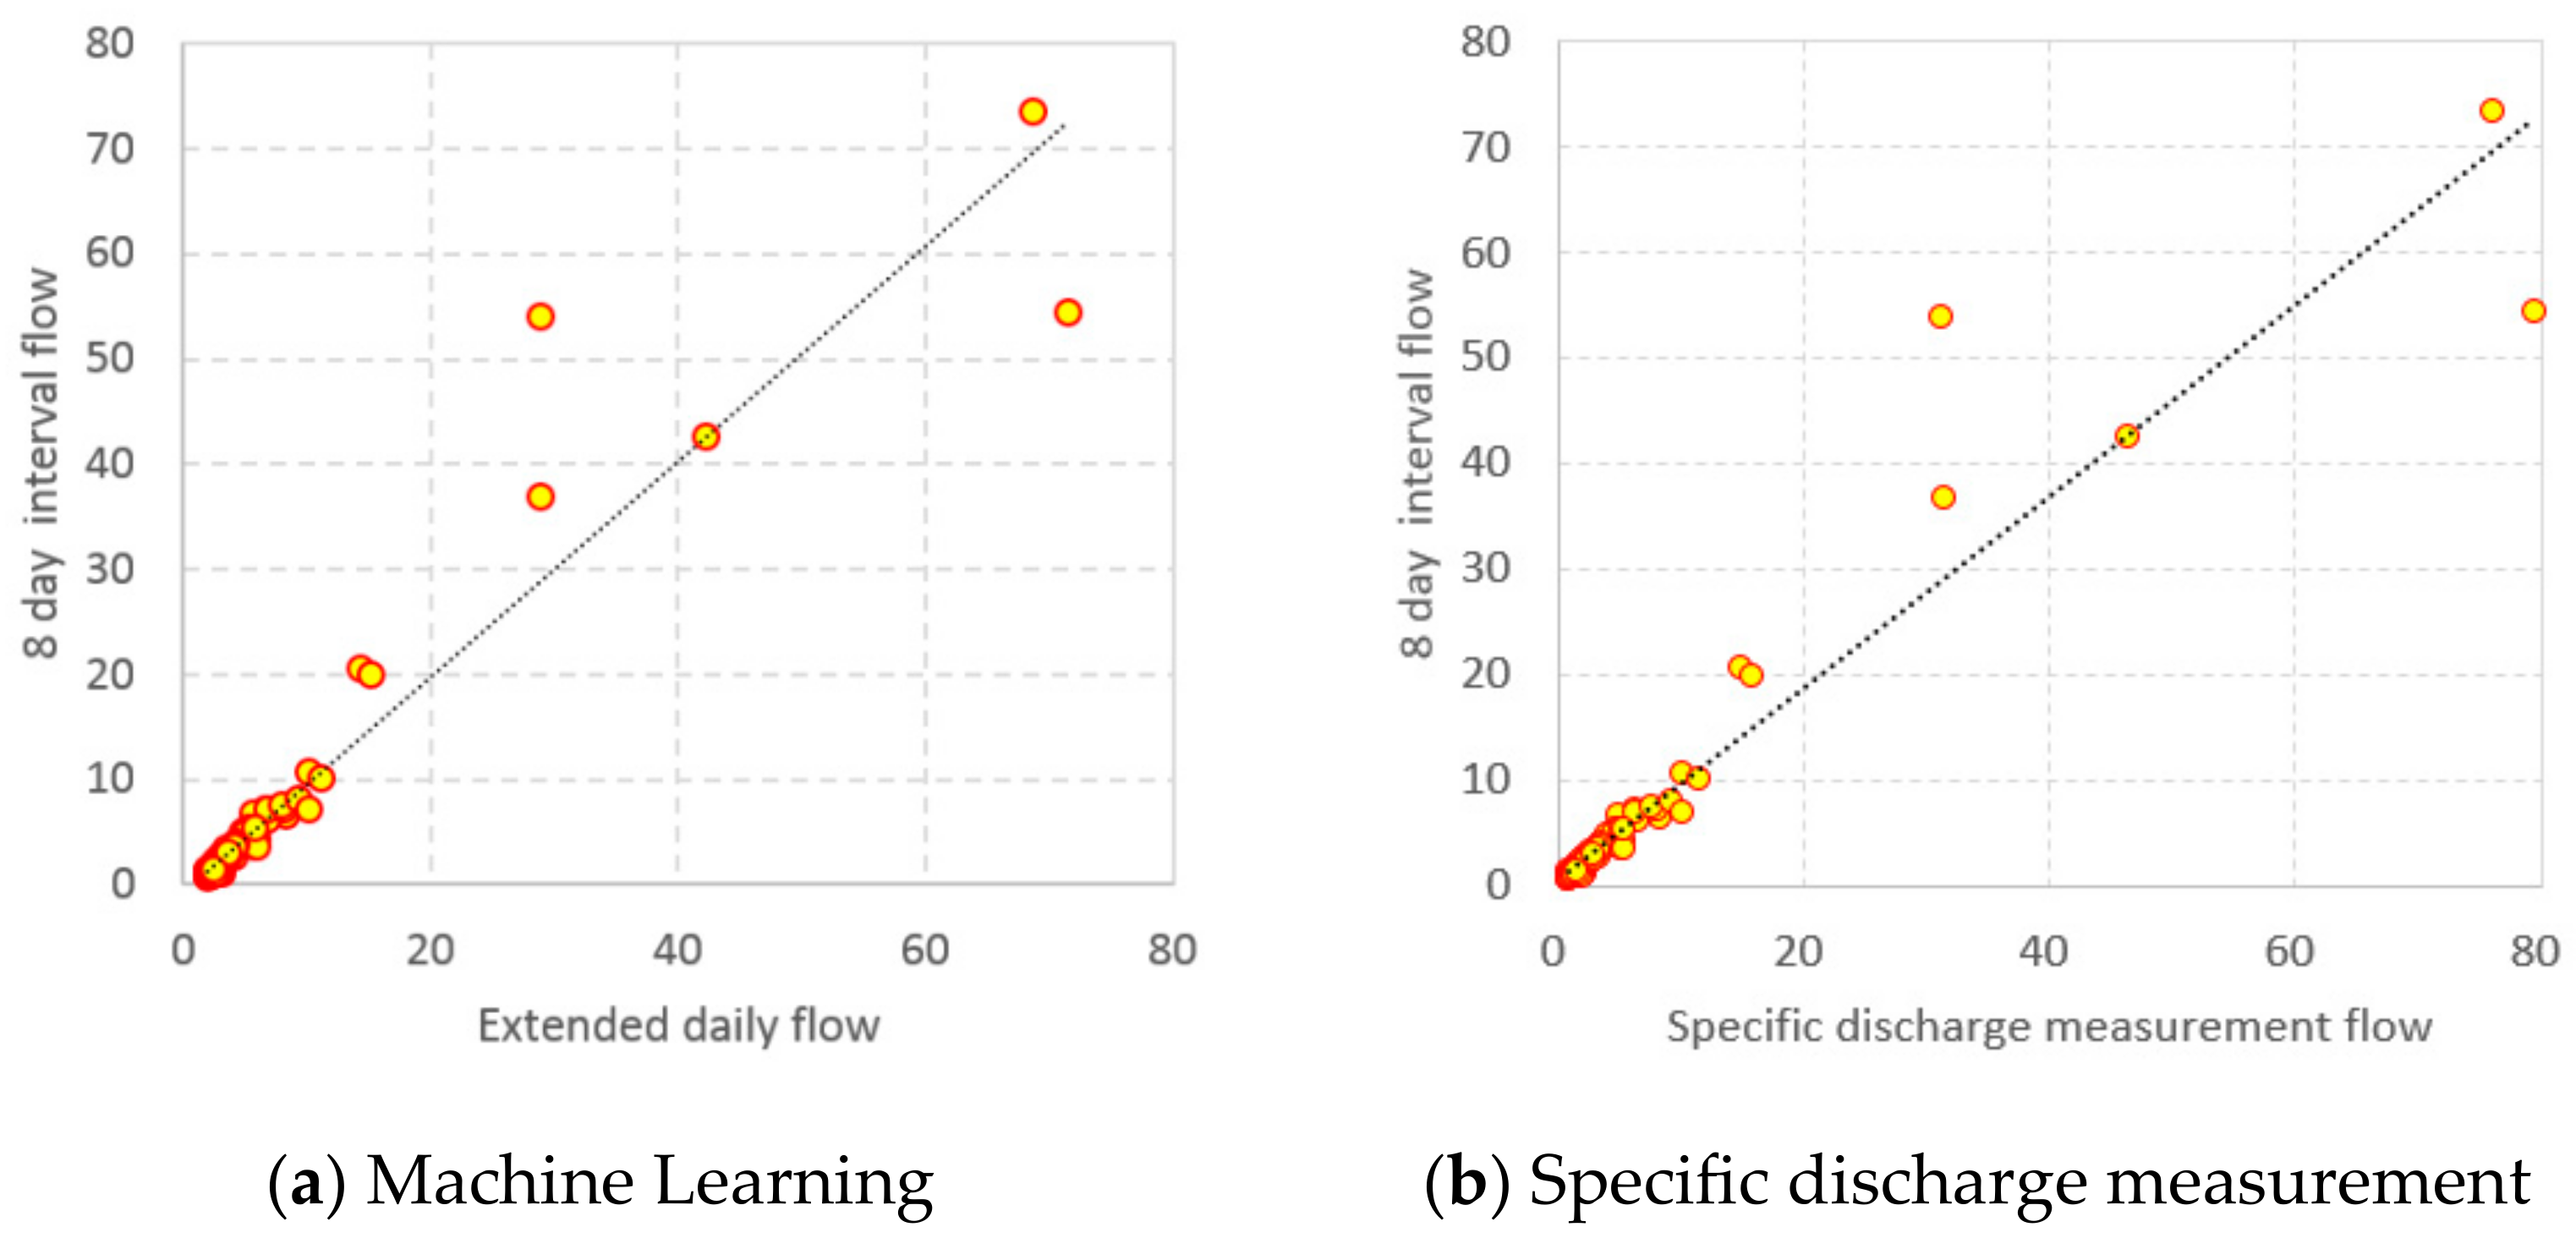
In Nakbon A, the R2 and NSE between the measured daily flow data and the results of the specific discharge measurement method were 0.91 and 0.90 and showed no significant difference from the daily flow data derived by the daily flow expansion equations (Figure 4). On the other hand, while the R2 of the flow data generated by the specific discharge measurement of Yeonggang A was 0.98, the NSE was low at −0.4, which showed that the specific discharge measurement overvalued the flow data (Figure 5). Based on these results, it was observed that using the specific discharge measurement method to estimate daily flow data based on the watershed’s area ratio is more applicable when the rainfall–runoff characteristics within the watershed are similar (Figure 4 and Figure 5). However, the analysis showed that its applicability diminishes when applied to watersheds with diverse rainfall–runoff characteristics beyond the watershed area. Therefore, the machine learning-based regression equation for the daily flow expansion proposed in this study yielded more stable results.

3.1.5. Periodic Updating System Establishment for the Daily Flow Expansion Equations

The Open API of the Ministry of Land, Infrastructure and Transport (MOLIT) provides the results with the observation date and the flow measurement data as the receiving parameters when the results are requested through the transmission parameters of the station code, the observation year, and the result format. Similarly, the MOE’s Open API also provides the results of the observation date and flow measurement data, as well as the water quality measurements, as receiving parameters when the results are requested through the transmission parameters of the station code and the observation year and month. In this study, a module was configured to retrieve the newly updated measurement results and to store them in PostgreSQL, utilizing the Open API of MOLIT and MOE. In addition, a system to periodically improve the daily flow expansion equations was established by linking Google TensorFlow and PostgreSQL.

3.2. Development of Web GIS-Based Pollutant Load Evaluation System

The main screen of the pollution load evaluation system consists of the Layer Panel, which is used to activate the GIS data, the Map Panel, which visualizes spatial information, and the Control Panel, which the selects water quality item and pollution load analysis period and inputs the target water quality (Figure 6a).
After inputting the water quality item, analysis period, and target quality in the Control Panel, when a user clicks the TMDL stations activated on the Map Panel, the pop-up window displays the point information, water quality items, target water quality, and analysis period and then forwards to the pollution load evaluation screen to check the information. The pollution load evaluation screen consists of a tab-type Graph Panel and a load analysis result Grid Panel and an extended daily flow data and TMDL water quality data Grid Panel. The Graph Panel provides FDC, LDC, and QLRC. In addition, the results of the pollutant load statistical analysis by flow regimes, such as maximum value, minimum value, average value, 25 percentile, 75 percentile, 90 percentile, etc., were expressed as lines and boxplots to visualize the pollution load characteristics in each flow regime. In the two Grid Panels, the flow and water quality measurement data used for LDC and the results of the LDC and QLRC analysis are presented in a tabulated form. Using the Web GIS-based pollution load evaluation system, the results of the evaluation of the BOD (Biochemical Oxygen Demand) pollution load characteristics at the Namgang E site (showing the highest correlation between daily flow and 8-day interval flow) from 2014 to 2017 revealed that the total pollution load for the entire flow period was 1,607,963.4 kg. The BOD pollution load that exceeded the target water quality of 2.5 mg/L was 580,981.9 kg. In particular, the analysis of each flow condition showed that as the flow decreased from high-flow conditions to low-flow conditions, the rate of the exceeding pollution load increased. This indicates that the need for the management of point pollution sources is higher than that of the nonpoint pollution sources. The percentages of pollution load exceedance by the flow conditions were 28.7%, 33.1%, 40.0%, 54.4%, and 89.8% for the high-flow conditions, moist conditions, mid-range-flow conditions, dry conditions, and low-flow conditions, respectively (Figure 6b).
Furthermore, the QLRC analysis also indicated that from high-flow to low-flow conditions, the measured QLRC line exceeded the standard QLRC line. This was defined as QLRC Case III (Table 2), which suggests that the area requires point source pollution management (Figure 6c,d).

4. Conclusions

In applying the LDC to the Korean watersheds, the absence of continuous flow measurement data could induce uncertainty when analyzing the flow regimes; thus, to compensate for this problem, daily flow data were generated using watershed-scale hydrological models. However, the parameter optimization of the hydrological models has intrinsic uncertainty due to the limited flow measurement data and the hydraulic structures in the watersheds. Therefore, this study developed the daily flow expansion regression equations for each TMDL watershed in the Nakdong River basin through TensorFlow, a Google machine learning library. Based on the error function and the coefficient of determination, the daily flow expansion equations for 29 TMDL watersheds were derived. As a result of the evaluation of the accuracy of the expanded daily flow data based on the RMSE, MAE, IOA, and NSE, the NSE of the Nakbon L station was significantly less correlated with negative values because the hydrologic characteristics of the TMDL watershed (Nakbon L) and the daily flow measurement station (Gasan) were very different. Milyang B had a low NSE as the uncertainty in the high-flow conditions of the expanded daily flow data increased.
In addition, the expanded daily flow data produced by the machine learning and specific discharge measurements in Nakbon A and Younggang A were compared. The results were found to be not significantly different between both sets of data at Nakbon A, while the specific discharge measurements tended to overestimate the daily flow data at Younggang A. These results suggest that the specific discharge measurement, which assumes that the streamflow is in proportion to the watershed area, is less applicable when it is applied to a watershed with distinct rainfall–runoff characteristics. On the other hand, machine learning is able to derive reliable results because it takes into account a variety of conditions in addition to the area ratio between watersheds, which is used in the specific discharge measurements.
In conclusion, the web GIS-based pollutant load assessment system was developed for a total of 29 TMDL watersheds in Nakdong river basin, and this system can be effectively employed to establish regulatory standards for the specific flow regimes in order to implement the TMDL program because the system is beneficial in identifying the characteristics of the pollutants. In order to expand this study to other TMDL watersheds in other river basins, including those of Nakdong River, it is necessary to expand the spatial and temporal scope of the associated station analysis for the stations of all the watersheds in the Nakdong River basin where the daily flow expansion regression equations were not derived. In addition, this study employed a simple machine learning technique (the gradient descent method provided by the Google TensorFlow package), which showed a good performance, but not at all the stations. Recently, the machine learning technique has been developing; so, it is anticipated that applying more advanced machine learning techniques in the future could lead to even more accurate solutions.

Author Contributions

Conceptualization, J.K. and K.J.L.; methodology, J.R.; investigation, D.K. and J.H.; writing—original draft preparation, D.K.; writing—review and editing, Y.S. and J.J.; supervision, J.K. All authors have read and agreed to the published version of the manuscript.

Funding

This research was funded by the Ministry of Environment of Korea as The SS (Surface Soil conservation and management) projects [2019002820003].

Data Availability Statement

Publicly available datasets were analyzed in this study. This data(8-day interval and daily flow) can be found here: [http://water.nier.go.kr; http://wamis.go.kr].

Conflicts of Interest

Author Donghyuk Kum was employed by the company EM Research Institute. The remaining authors declare that the research was conducted in the absence of any commercial or financial relationships that could be construed as a potential conflict of interest.

References

  1. Elshorbagy, A.; Ramesh, S.V.; Lindell, O. Total Maximum Daily Load (TMDL) Approach to Surface Water Quality Management: Concepts, Issues, and Applications. Can. J. Civ. Eng. 2005, 32, 442–448. [Google Scholar] [CrossRef]
  2. Mostaghimi, S.; Benham, B.; Brannan, K.; Dillaha, T.; Wynn, J.; Yagow, G.; Zeckoski, R. Total Maximum Daily Load Development for Lincille Creek: Bacteria and General Standard (Benthic) Impairments. Biol. Syst. Eng. Dep. Va. Tech Blacksbg. Va. 2003. Available online: http://www.deq.state.va.us/tmdl/tmdlrpts.html (accessed on 18 February 2024).
  3. Cleland, B. TMDL Development from the “Bottom Up”—Part II: Using Duration Curves to Connect the Pieces. America’s Clean Water Foundation. In Proceedings of the National TMDL Science and Policy 2002—WEF Specialty Conference, Phoenix, AZ, USA, 15 August 2002. [Google Scholar]
  4. Kim, J.G.; Engel, B.A.; Park, Y.S.; Theller, L.; Chaubey, I.; Kong, D.S.; Lim, K.J. Development of Web-based Load Duration Curve system for analysis of total maximum daily load and water quality characteristics in a waterbody. J. Environ. Manag. 2012, 97, 46–55. [Google Scholar] [CrossRef] [PubMed]
  5. Ministry of Environment (MOE). Total Maximum Daily Loads Handbook; GP2019-010; Ministry of Environment (MOE), National Institute of Environmental Research (NIER): Sejong, Republic of Korea, 2019; pp. 1–69. (In Korean)
  6. Cheong, E.J.; Kim, H.T.; Kim, Y.S.; Shin, D.S. Application of the Load Duration Curve (LDC) to Evaluate the Rate of Achievement of Target Water Quality in the Youngsan·Tamjin River Watersheds. J. Korean Soc. Water Environ. 2016, 32, 349–356. (In Korean) [Google Scholar] [CrossRef]
  7. Park, J.D.; Oh, S.Y. Methodology for the Identification of Impaired Waters Using LDC for the Management of Total Maximum Daily Loads. J. Korean Soc. Water Environ. 2012, 28, 693–703. (In Korean) [Google Scholar]
  8. Park, J.D.; Park, J.H.; Oh, S.Y.; Ahn, G.H.; Choi, Y.H. Development of Long Term Flow Duration Curves for the Management of TMDLs. Natl. Inst. Environ. Res. (NIER) NEIR-RP 2012, 220, 1–37. (In Korean) [Google Scholar]
  9. Hwang, H.S.; Yoon, C.G.; Kim, J.T. Application Load Duration Curve for Evaluation of Impaired Watershed at TMDL Unit Watershed in Korea. J. Korean Soc. Water Qual. 2010, 26, 903–909. (In Korean) [Google Scholar]
  10. Jung, J.; Cho, S.; Lim, B.; Oh, T.; Ham, S.; Kim, K. Evaluation of the Possibility of Daily Flow Data Generation from 8-Day Interval Measured Flow Data using SWAT-CUP. J. Korean Soc. Water Environ. 2012, 28, 595–600. (In Korean) [Google Scholar]
  11. Kang, H.W.; Ryu, J.C.; Choi, J.W.; Moon, J.P.; Choi, J.D.; Lim, K.J. Enhancement and Application of SWAT Auto-Calibration using Korean Ministry of Environment 8-Day Interval Flow/Water Quality data. J. Korean Soc. Water Environ. 2012, 28, 247–254. (In Korean) [Google Scholar]
  12. Kim, S.; Kang, D.K.; Kim, M.S.; Shin, H.S. The Possibility of Daily Flow Data Generation from 8-Day Intervals Measured Flow Data for Calibrating Watershed Model. J. Korean Soc. Water Environ. 2007, 23, 64–71. (In Korean) [Google Scholar]
  13. National Institute of Environment Research (NIER). The Study on the Optimum Assessment Methods for Achievement of Target Water Quality and Estimation of Allocation Loads Using a Dynamic Model. Natl. Inst. Environ. Res. NIER-RP 2013, 274, 1–31. (In Korean) [Google Scholar]
  14. Baek, K.O.; Yim, D.H. Extension techniques of 8 day interval recorded stream-flow data to daily one. J. Korea Water Resour. Assoc. 2012, 45, 91–99. [Google Scholar] [CrossRef]
  15. Kim, S.; Lee, K.H.; Kim, H.S. Low flow estimation for river water quality models using a long-term runoff hydrologic model. J. Korean Soc. Water Environ. 2005, 21, 575–583. [Google Scholar]
  16. Kim, C.G.; Kim, N.W. Derivation of continuous pollutant loadograph using distributed model with 8-day measured flow and water quality data of MOE. J. Korean Soc. Water Environ. 2009, 25, 125–135. [Google Scholar]
  17. Smakhtin, V.U. Estimating daily flow duration curves from monthly streamflow data. Waster SA, 1 January 2000. pp. 13–18. Available online: http://www.wrc.org.za (accessed on 18 February 2024).
  18. Rebora, N.; Silvestro, F.; Rudari, R.; Herold, C.; Ferraris, L. Downscaling stream flow time series from monthly to daily scales using an auto-regressive stochastic algorithm: StreamFARM. J. Hydrol. 2016, 537, 297–310. [Google Scholar] [CrossRef]
  19. Freeman, M.C.; Bestgen, K.R.; Carlisle, D.; Frimpong, E.A.; Franssen, N.R.; Gido, K.B.; Irwin, E.; Kanno, Y.; Luce, C.; Kyle McKay, S.; et al. Toward improved understanding of streamflow effects on freshwater fishes. Fisheries 2022, 47, 290–298. [Google Scholar] [CrossRef]
  20. Reichl, F.; Hack, J. Derivation of flow duration curves to estimate hydropower generation potential in data-scarce regions. Water 2017, 9, 572. [Google Scholar] [CrossRef]
  21. John, A.; Fowler, K.; Nathan, R.; Horne, A.; Stewardson, M. Disaggregated monthly hydrological models can outperform daily models in providing daily flow statistics and extrapolate well to a drying climate. J. Hydrol. 2021, 598, 126471. [Google Scholar] [CrossRef]
  22. Slaughter, A.R.; Retief, D.C.H.; Hughes, D.A. A method to disaggregate monthly flows to daily using daily rainfall observations: Model design and testing. Hydrol. Sci. J. 2015, 60, 1896–1910. [Google Scholar] [CrossRef]
  23. Cleland, B. TMDL Development From the “Bottom Up”—Part III: Duration Curves and Wet-Weather Assessments. In Proceedings of the National TMDL Science and Policy 2003—WEF Specialty Conference, Chicago, IL, USA, 15 September 2003. [Google Scholar]
  24. Yoo, M.H.; Youn, S.H.; Park, K.W.; Kim, A.R.; Yoon, S.C.; Suh, Y.S. The Characteristics of Spatio-Temporal Distribution on Phytoplankton in the Nakdong River Estuary, during 2013–2015. J. Korean Soc. Mar. Environ. Saf. 2016, 22, 738–749. (In Korean) [Google Scholar] [CrossRef]
  25. Mitchell, T.M. Machine Learning, McGraw-Hill; Science/Engineering/Math: New York, NY, USA, 1997; pp. 1–432. [Google Scholar]
  26. Willmott, C.J. Some comments on the evaluation of model performance. Bull. Am. Meteorol. Soc. 1982, 63, 1309–1313. [Google Scholar] [CrossRef]
  27. Mebane, V.J.; Day, R.L.; Hamlett, J.M.; Watson, J.E.; Roth, G.W. Validating the FAO AquaCrop Model for Rainfed Maize in Pennsylvania. Agron. J. 2012, 105, 419–427. [Google Scholar] [CrossRef]
  28. Kang, H.W.; Ryu, J.C.; Shin, M.H.; Choi, J.D.; Choi, J.W.; Shin, D.S.; Lim, K.J. Application of Web-based Load Duration Curve System to TMD L Watersheds for Evaluation of Water Quality and Pollutant Loads. J. Korean Soc. Water Qual. 2011, 27, 689–698. (In Korean) [Google Scholar]
  29. Park, J.H. A Study of Waterbody Health Diagnosis Method. Master’s Thesis, Kyungpook National University, Daegu, Republic of Korea, 2010; pp. 1–87. (In Korean). [Google Scholar]
  30. Shin, K.Y. A Development and Assessment of Load Duration Curve for Total Water Pollution Loading System. Ph.D. Thesis, Kangwon National University, Daegu, Republic of Korea, 2013; pp. 1–144. (In Korean). [Google Scholar]
  31. Singh, H.; Bhatia, T.; Litoria, P.; Pateriya, B. Web GIS Development using Open Source Leaflet and Geoserver Toolkit. Int. J. Comput. Sci. Technol. 2018, 9, 29–33. [Google Scholar]
  32. Moyon, E.S.; Morales, E.M.O.; Jayoma, J.M. Design and Development of a Web GIS-Based Visualization and Analytical Platform for Farm-to-Market Road Projects of the Philippines’ Department of Agriculture. In Proceedings of the 2021 IEEE 13th International Conference on Humanoid, Nanotechnology, Information Technology, Communication and Control, Environment, and Management (HNICEM), Manila, Philippines, 28–30 November 2021; pp. 1–6. [Google Scholar] [CrossRef]
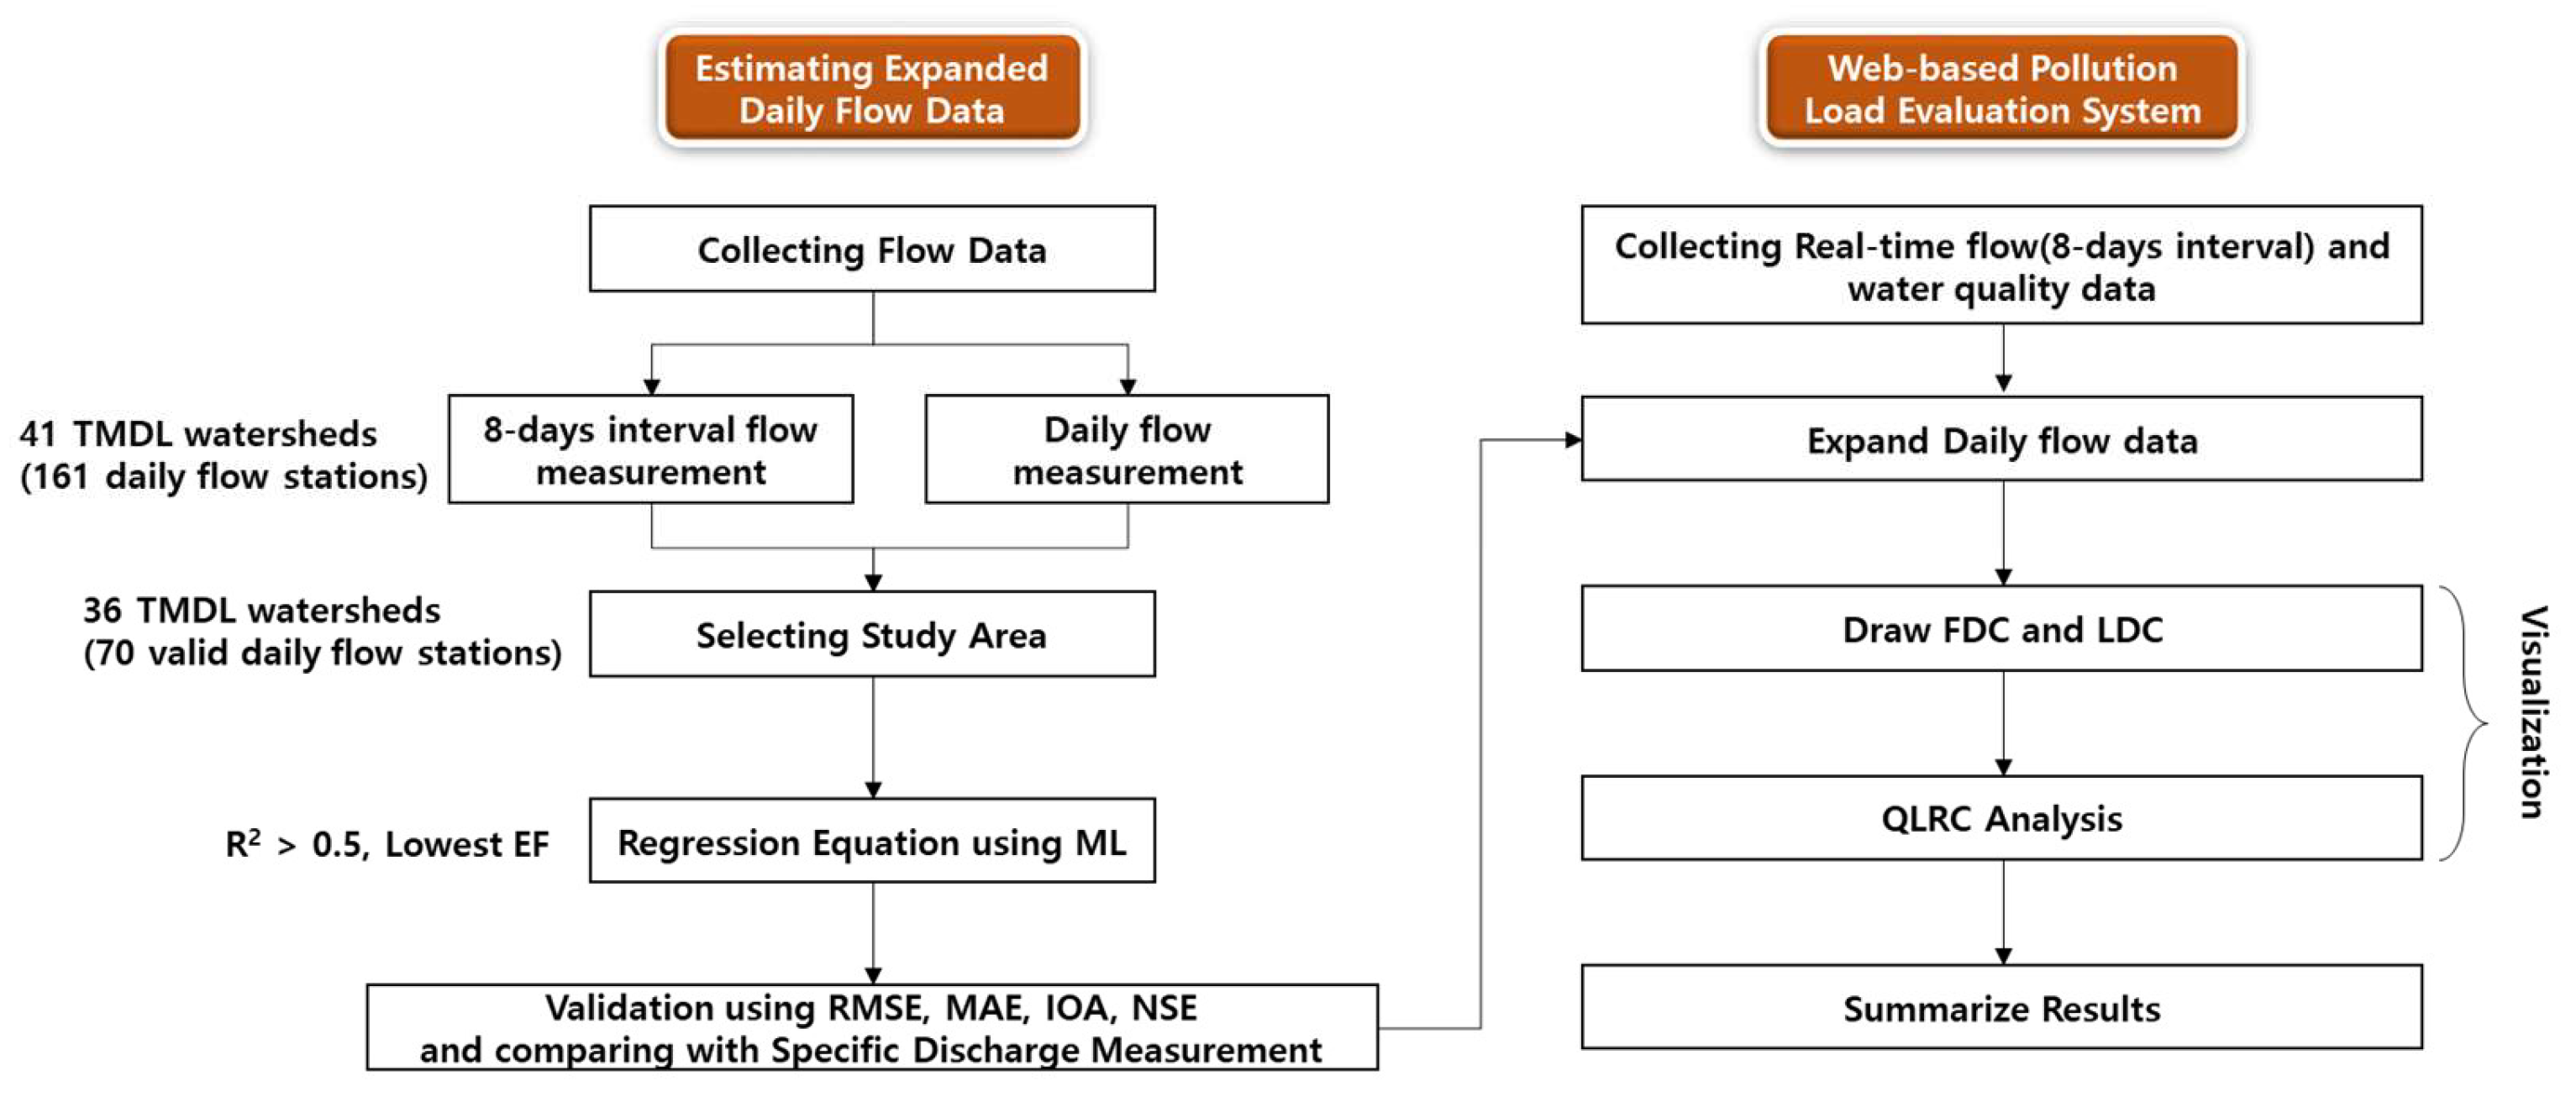
Figure 1. Flow chart of this study.
Water 16 00744 g001
Figure 2. Locations of daily flow stations and TMDL watersheds in Nakdong River basin.
Water 16 00744 g002
Figure 3. Evaluation method suggested for TMDL using Q-L rating curve (Q: streamflow; L: load).
Water 16 00744 g003
Figure 4. Comparison of flow estimation between method using machine learning (a) and method using specific discharge measurement (b) of Nakbon A watershed.
Water 16 00744 g004
Figure 5. Comparison of flow estimation between method using machine learning (a) and method using specific discharge measurement (b) of Yeonggang A watershed.
Water 16 00744 g005
Figure 6. Results of pollutant load assessment using the Web GIS-based system for Namgang E station.
Water 16 00744 g006
Table 1. Summary of literature related to daily flow data expansion.
ReferencesAdvantagesLimitations
[14]Insufficient data updated using the daily data at a nearby, hydrologically similar gauging stationInsufficient evaluation of hydrologically similar observation points
[12,15]Flow data estimated using TANK model with respect to sampling frequencyEstimated data affected by various artifacts (e.g., a dam) located near the study area
[10,16]Extended daily flow data from 8-day interval flow data using SWAT modelHigh-flow regime faces high uncertainty due to scarce high-flow measurements
[17,18,19,20,21,22]Emphasizes the advantages of daily discharge data for constructing FDCs and the importance of daily timestep hydrological information for water resource management
Table 2. Pollution management classifications based on QLRC cases (O: need to be managed; X: do not need to be managed).
QLRC CasePoint SourceNonpoint SourceClassification
IXXNatural
IIOOPolluted
IIIOXPoint Source Management
IVXONonpoint Source Management
Table 3. Number of valid daily flow stations in TMDL watersheds for machine learning application.
TMDL
Watershed
Valid Daily Flow StationTMDL
Watershed
Valid Daily Flow StationTMDL
Watershed
Valid Daily Flow Station
Banbyeon A3Milyang A1Nakbon K1
Banbyeon B3Milyang B5Nakbon L3
Byeongseong A4Naeseong A3Nakbon M-
Gamcheon A2Naeseong B5Nakbon N-
Geumcheon A1Nakbon A1Namgang A4
Hoecheon A5Nakbon B5Namgang B3
Hwanggang A2Nakbon C1Namgang C2
Hwanggang B3Nakbon D3Namgang D4
Ian A2Nakbon E1Namgang E2
Kilan A1Nakbon F-Wicheon A5
Kumho A5Nakbon G-Wicheon B3
Kumho B2Nakbon H1Yeonggang A3
Kumho C5Nakbon I-Yongjeon A1
Micheon A2Nakbon J2
Table 4. Summary of regression equations for daily extended flow for 29 stream gauging stations in TMDL watersheds.
TMDL
Watershed
Stream
Gauging Station
abError
Function
R2
Banbyeon ASingu2.77238−3.571697.390.74
Banbyeon BImha1.12563−13.6108107.170.66
Byeongseong ADongmun1.483082.1448331.860.68
Gamcheon AJipum3.14825−0.3876386.80.88
Geumcheon ASanyang1.003971.163472.270.95
Geumho AGeumho0.97793−0.5577304.570.82
Geumho BAmnyang7.738686.79683306.930.98
Geumho CSeongseo0.5532420.5551281.680.92
Hoecheon ASsangnim3.120281.35586105.010.97
Hwanggang AGeochang13.30469−8.14735300.830.9
Hwanggang BJukgo1.34013−5.022587.530.83
Micheon AUnsan0.522570.144178.120.87
Miryang BDaeri2.352589.96011529.860.57
Naeseong BHyangseok1.91505−9.4416173.660.99
Nakbon AJangseong1.409071.2095510.270.91
Nakbon BYangsam0.97026−1.4723615.260.96
Nakbon CGudam1.03267−3.7072723.190.99
Nakbon DDalji2.0566755.00833106.030.93
Nakbon ESeonsan7.069496.725276617.50.86
Nakbon KHwaseong9.26286−160.52877,645.80.79
Nakbon LGasan24.2514−573.166156,2130.74
Namgang BSancheong1.81337−12.58081274.710.92
Namgang DDeokgok1.302490.44271353.570.95
Namgang AAnui3.197897.8389569.590.96
Namgang EGeoryonggang0.949663.1190136.971.00
Wicheon AMuseong1.005260.86205154.020.77
Wicheon BYonggok0.7242.0463737.710.96
Yeonggang AJeomchon0.694710.9149615.840.98
Yongjeon ACheongson1.84608−5.70204323.450.82
Table 5. Validation results for extended daily flow with various criteria in the TMDL watersheds.
TMDL WatershedRMSEMAEIOANSE
Banbyeon A15.896.150.920.66
Banbyeon B8.363.390.890.61
Byeongseong A5.642.250.890.52
Gamcheon A9.323.880.970.86
Geumcheon A1.481.100.980.92
Geumho A17.454.440.950.78
Geumho B17.437.430.990.98
Geumho C16.7412.560.980.91
Hoecheon A10.253.400.990.97
Hwanggang A16.936.770.970.88
Hwanggang B9.357.490.930.79
Micheon A2.851.120.960.85
Miryang B22.0010.720.860.36
Naeseong B12.807.131.000.99
Nakbon A3.211.420.980.90
Nakbon B14.168.120.990.95
Nakbon C4.753.631.000.99
Nakbon D49.4429.310.990.94
Nakbon E73.3750.320.970.86
Nakbon K276.96159.220.940.73
Nakbon L394.87259.090.84-0.18
Namgang A15.856.670.990.95
Namgang B35.7019.210.980.91
Namgang D18.8012.080.990.94
Namgang E6.083.531.001.00
Wicheon A12.364.370.930.70
Wicheon B6.142.460.990.95
Yeonggang A3.961.521.000.98
Yongjeon A13.914.380.950.77
Disclaimer/Publisher’s Note: The statements, opinions and data contained in all publications are solely those of the individual author(s) and contributor(s) and not of MDPI and/or the editor(s). MDPI and/or the editor(s) disclaim responsibility for any injury to people or property resulting from any ideas, methods, instructions or products referred to in the content.