Abstract
Excessive sedimentation in sand-laden rivers significantly hinders the normal operation and overall effectiveness of reservoirs. This is observed particularly in plain-type sand-laden reservoirs where weak hydraulic conditions in the reservoir area contribute to sediment deposition. Water–sediment regulation is essential in reducing sedimentation and prolonging the lifespan of such reservoirs. Taking the plain-type reservoir of the primary stream of the Yellow River—Haibowan Reservoir as an example, based on a two-dimensional shallow water equation, a two-dimensional mathematical model of water and sediment in the reservoir area is established, the corresponding boundary conditions are improved, and the reliability of the model is verified. Under the premise of ensuring the flood control safety of the reservoir dam, considering the impact on the power generation of the reservoir and the downstream river, and maintaining the long-term large effective storage capacity of the reservoir as the basic principle, the water–sediment regulation scheme is proposed. A two-dimensional kinetic model of sediment transport and representative water–sediment series are employed to simulate the erosion and sedimentation processes in the reservoir under different schemes. The optimisation and comparison of multiple schemes reveal that the sediment-flushing scheme, which lowers the water level to 1072 m above sea level when the inflow discharge is 1500–2760 m3/s and inflow sediment concentration is 5–10 kg/m3, can yield an effective reservoir capacity of 97 million m3 and an average annual hydropower generation of 389.5 million kWh after 15 years of operation. This scheme outperforms the existing sediment-flushing scheme and is recommended as an optimised approach for water–sediment regulation in reservoirs. The results of this study provide technical support for the application of water–sediment regulation in the Haibowan Reservoir and may be useful in the exploration and management of water–sediment regulation for plain-type reservoirs on sand-laden rivers.
1. Introduction
The construction of reservoirs on river channels inevitably disrupts the original water–sediment balance [1]. After reservoir impoundment, the water level in front of a dam rises, resulting in reduced flow velocity and sediment-carrying capacity. Sediment is trapped and deposited within the reservoir, causing numerous adverse effects. As of 2018, the average sedimentation rate in Chinese reservoirs was 11.27%, with a particularly high rate of 36.76% in the Yellow River basin. Such excessive sedimentation severely undermines flood control and disaster resilience in reservoirs [2]. For instance, the Aswan High Dam in Egypt experienced a 12% reduction in storage capacity because of sediment deposition between 1964 and 2013, which obstructed river navigation and diminished the flood discharge capacity of the dam [3]. Similarly, sediment accumulation in reservoirs in the United States from the late 1980s to 2021 resulted in a decrease in the total storage capacity from 850 Gm3 to 810 Gm3, causing pressure on water supply and management [4]. The Hirakud Reservoir in India lost approximately 22% of its effective storage capacity because of sedimentation, leading to reduced water storage capacity and increased flood risk [5]. At the same time, the construction of reservoir dams inevitably brings ecological problems, such as changing the landform characteristics [6] and runoff distribution [7] of the downstream river, reducing the diffusion capacity of pollutants in the reservoir area, and easily producing water eutrophication [8]. These examples highlight the global issue of the effect of sedimentation on reservoirs.
For reservoirs on sand-laden rivers, reducing sediment deposition is a major but challenging task. Water–sediment regulation is an important approach for controlling sedimentation and maintaining long-term effective storage capacity. Compared with sediment interception and artificial sediment excavation, water–sediment regulation is a highly efficient non-engineering measure that requires less investment, yields results rapidly, and is easier to implement [9]. Unlike that in water regulation, the decision-making process in water–sediment regulation for reservoir operation aims to achieve optimal benefits in terms of sediment reduction and hydropower generation and considers scientific and rational water allocation in the reservoir while addressing the operational requirements of upstream and downstream reservoirs. In addition to reducing sediment deposition in the reservoir area, sediment deposition in downstream river channels should be minimised by utilising the regulatory function of the reservoir.
Studies on water–sediment regulation in reservoirs primarily focus on two aspects. First, joint optimisation models are established for multiple objectives, including sediment flushing and benefits. For instance, Jin et al. [10] developed a multi-objective scheduling model for cascaded reservoirs on the upper Yellow River, considering sediment flushing, water supply, and hydropower generation. Hajiabadi et al. [11] employed the non-dominated sorting genetic algorithm for multi-objective optimisation in the Sefid-Rud Reservoir in northern Iran, resulting in a 37-million-ton increase in sediment scouring. Chen et al. [12] introduced new objective functions into the optimisation model to address severe sedimentation issues in the Sanmenxia–Xiaolangdi cascaded reservoirs on the Yellow River. However, the current challenge lies in the need for a comprehensive selection of scheduling objectives. Although economic benefits are partially considered, the description of reservoir conditions often relies on simple water balance equations and reservoir capacity relationships, which lack sufficient linkage with sediment-flushing mechanisms. Second, existing sediment-flushing schedules are improved by utilising the kinetic model of sediment transport, providing an understanding of the physical processes involved in erosion and sedimentation. Huang et al. [13] simulated sediment scouring in the Paonia Reservoir in the mountainous area of Colorado using the SRH-1D sediment transport model. Zulfan et al. [14] established a coupled hydrodynamic sediment transport model for the Pandanduri Reservoir, employing the MIKE21(2014)FM software to analyse changes in sediment deposition under different operating schemes. Faghihirad et al. [15] explored water–sediment transport processes in the Hamidieh Reservoir using a three-dimensional turbulence-improved water–sediment model to investigate operation schemes involving various intakes and sluice gates. However, most of the research objects involved are gorge-type reservoirs, but there are few related studies on water–sediment regulation in plain-type reservoirs. Compared with gorge-type reservoirs, plain-type reservoirs have shallow water depths and large storage areas. During the storage period, they are less likely to generate density currents. Moreover, the hydraulic conditions for sediment scouring downstream during flood discharge and sediment-flushing periods are relatively weak. Because of these factors, inflowing sediment cannot be completely transported out of reservoir areas. How to realise the combined operation of water and sediment in plain reservoirs has become a difficult problem in research.
Therefore, water–sediment regulation approaches for plain-type reservoirs require further investigation. The plain-type reservoir of Haibowan on the upper reaches of the Yellow River is taken as an example in this study, and its water–sediment regulation approach is optimised, with the primary goals of extending the reservoir’s lifespan and effectively alleviating sediment deposition in downstream river channels. First, water–sediment regulation schemes are proposed to reduce reservoir sedimentation and enhance sediment transport capacity in downstream river channels. Second, a two-dimensional (2D) kinetic model of sediment transport is used to analyse the morphological changes and sediment deposition in each scheme. Finally, comprehensive comparisons of effective storage capacity and hydropower generation among different schemes are conducted, leading to an optimised water–sediment regulation approach for the reservoir. The flow of water–sediment regulation in Haibowan Reservoir is shown in Figure 1. The results of this study provide essential support for water–sediment regulation in the Haibowan Reservoir and offer valuable insights into water–sediment regulation practices in similar plain-type reservoirs.
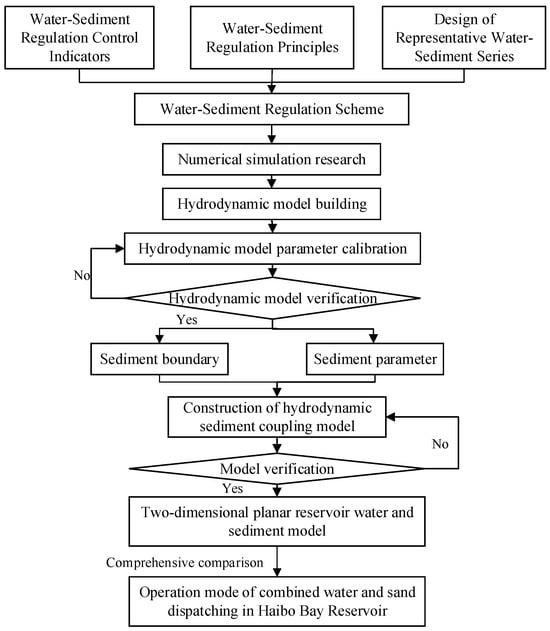
Figure 1.
Flow chart of water–sediment regulation in Haibowan Reservoir.
2. Study Area and Data Sources
2.1. Reservoir Overview
The Haibowan Reservoir is located in Wuhai Prefecture, Inner Mongolia, along the upstream section of the Yellow River (Figure 2). It began operating in April 2014. Its primary functions include ice flood control and hydropower generation, with additional considerations for water supply, sediment reduction, and other comprehensive benefits. Its total storage capacity is 487 million m3, with a dead water level of 1069 m and a normal storage level of 1076 m. The corresponding water surface area is 92.4 km2, and the terminal position of the backwater is approximately 33–36 km downstream from the dam. The reservoir can be divided into two sections based on its morphology. The upper section extends from the backwater terminal to the Wuda Bridge. The longitudinal slope is approximately 0.83. The riverbed is stable, cross sections are steep and narrow, and the river width is 0.4–0.5 km. The lower section spans approximately 18 km from the Wuda Bridge to the dam site, with a longitudinal slope of approximately 0.16. The cross sections are wide and shallow, and the river width is 2–4 km. No tributaries are present on either side of the reservoir. The left bank is bordered by the Ulan Buh Desert for 18 km above the dam site. The average annual windblown sand inflow is approximately 2 million tons [16]. The inflow hydrological station is located at Shizuishan, approximately 50 km upstream of the reservoir. No tributaries exist within this interval.
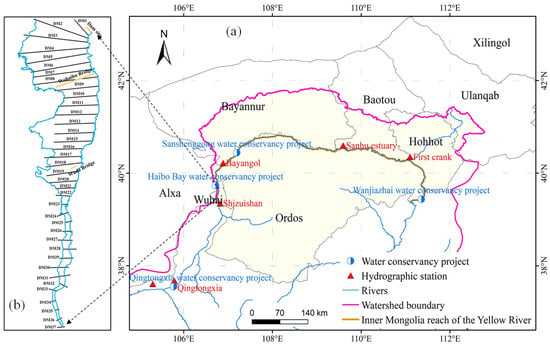
Figure 2.
Overview of the study area. (a) Inner Mongolia section of the Yellow River; (b) Haibowan reservoir section.
The reservoir has 16 gated spillways, with a discharge capacity of 13,600 m3/s at the 1076 m water level. The power station is designed with a reliability of 90% and an efficiency coefficient of 8.6. The turbines have a rated head of 8 m and a head loss of 0.41 m. Four intakes exist for the generators, and five sediment-flushing outlets are located in the lower part of the reservoir. The installed capacity is 90 MW (4 × 22.5 MW), with an average annual hydropower generation of 381.7 GWh.
2.2. Data Sources
The topographic data of the reservoir are essential for establishing the water–sediment numerical model. Based on the terrain characteristics of the Haibowan Reservoir, 37 sediment-monitoring sections are established along the reservoir axis from the dam site to approximately 31 km upstream (Figure 2b). These sections are positioned close to the original topographic monitoring sections and are labelled as DM1, DM2 … DM37. The section locations range from 0.65 km to 1.13 km apart, with an average spacing of 0.86 km.
Field surveys of the reservoir topography were conducted in November 2020 and 2021. These included both onshore and underwater surveys. The starting point distances and elevations for the onshore surveys were determined using dynamic CORS-RTK technology. Because of the extensive exposure of the reservoir bed, a single-beam echo sounder mounted on a Huawei No. 4 unmanned boat was used for bathymetric measurements in deep-water areas (Figure 3). The boat was 1.2 m long, weighed 9 kg, and had a draft of 10 cm. This ensured that most of the reservoir area was surveyed. Shallow areas were surveyed using a sounding rod. Depth calibration of the unmanned boat measurements was performed using the sounding rod, with the maximum error not exceeding 10 cm, thus satisfying the required measurement accuracy.
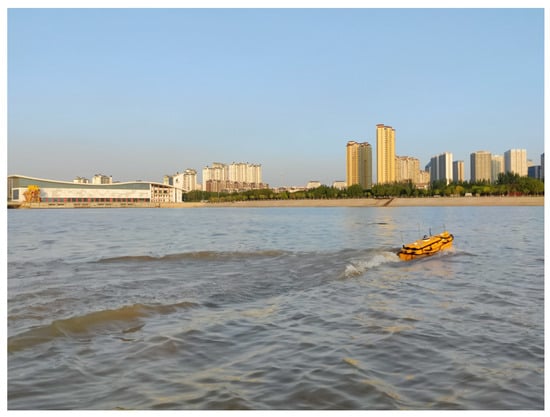
Figure 3.
Unmanned boat survey site photos.
In addition, actual topographic data from the 37 fixed measurement sections of the Haibowan Reservoir were collected in March 2014, July 2016, March 2019, and November 2019. Data on reservoir operation and scheduling, daily water levels in front of the dam, daily precipitation and evaporation in the reservoir area from 2014 to 2021, intake information, preliminary design reports, and scheduling regulations were obtained. All the data were sourced from the Career Development Centre at the Yellow River Haibowan Water Conservancy Hub. Furthermore, daily measured water and sediment data from Shizuishan station for the period of 1960–2021 were collected from the Hydrological Yearbook of the People’s Republic of China (Volume 4).
2.3. Inflow Water, Sediment, and Sedimentation Changes in the Reservoir
2.3.1. Inflow Water and Sediment
The average annual runoff and sediment transport at Shizuishan station from 1960 to 2021 were 27.5 billion m3 and 94.2 million tons, respectively (Table 1). During the operation period of the Haibowan Reservoir from 2014 to 2021, the average annual inflow water volume was 30.28 billion m3, with a sediment load of 58.1 million tons. Compared with the long-term data from 1960 to 2021, the water volume was relatively high, whereas the sediment load was relatively low. The average water volume during the flood season was 14.72 billion m3, accounting for 47% of the annual total volume. The average sediment load during the flood season was 37.4 million tons, representing 59% of the annual total load. The highest inflow water volume was recorded in 2020, whereas the highest sediment load was recorded in 2018. The sediment transport coefficient indicates the ratio of the unit sediment content to the discharge, reflecting the water and sediment mix in the river. The larger the sediment transport coefficient indicates, the more likely the river is to be silted and the more unfavourable the water and sediment mix conditions are. The low sediment concentration and sediment transport coefficient indicate a high susceptibility to scouring during this period.

Table 1.
Variation of water and sediment characteristic values at Shizuishan Station.
2.3.2. Reservoir Sediment Accumulation
The sediment accumulation in the Haibowan Reservoir from 2014 to 2021 was examined by using a cross-sectional topography method [17]. The results are presented in Table 2. Overall, the sediment accumulation in the reservoir has increased annually since its operation. Specifically, only 46 million m3 of sediment accumulated during 2014–2016, mainly owing to the relatively low inflowing sediment load, accounting for only one-third of the inflowing sediment load from 1960 to 2021. The highest sediment accumulation was recorded during 2016–2019, reaching 145 million m3. This increase can be attributed to the high sediment load during 2018 and 2019, with a total inflowing sediment load of 227 million tons. This indicates a close correlation between sediment accumulation in the reservoir and inflowing sediment load. The least sediment accumulation was recorded during 2019–2020, primarily because of the low-water-level sediment flushing and artificial sediment excavation measures implemented in 2020. As of 2021, the accumulated sediment deposition in the reservoir had reached 212 million m3 of storage capacity, accounting for approximately 43.5% of the total storage capacity. The reservoir has suffered significant storage capacity loss because of sedimentation.

Table 2.
Sediment accumulation of Haibowan Reservoir from 2014 to 2021.
3. Methodology
3.1. Reservoir Runoff Regulation and Electrical Energy Calculation
The reservoir runoff regulation was implemented by using the time-series tabulation method, which provides the variations over time in factors such as storage volume, spillage volume, and water level after regulation. It is a concise and intuitive method that considers complex water usage processes, water loss, and other influencing factors. The calculation formula is as follows:
where Vi and Vi+1 are the water demand of the reservoir at the start and end of the i-th period, respectively; Winflow is the inflow volume to the reservoir during the i-th period; Wuse is the total water usage by different sectors during the i-th period; Wloss is the total water loss from the reservoir during the i-th period.
The electrical energy of the reservoir is calculated using the following formula:
where η is the efficiency coefficient of the hydroelectric generator; W is the water volume (m3); Hnet is the net water head (m), which is equal to the upstream water level minus the downstream water level and the head loss; E is the electrical energy (MWh).
3.2. Reservoir Water and Sediment Model
3.2.1. Basic Equations
As the Haibowan Reservoir has relatively shallow water depth and small variations in flow velocity and sediment concentration in the vertical direction, the 2D shallow water equations can be used for calculations.
Continuity equation:
X-direction momentum equation:
Y-direction momentum equation:
where t is time; x and y are spatial horizontal coordinates; η is the bed elevation; d is the still-water depth; h = η + d is the total water depth; u and v are the velocity components in the x and y directions, respectively; f is the Coriolis force coefficient; g is the acceleration of gravity; ρ is the density of water; ρ0 is the relative density of water; Pa is the local atmospheric pressure; sxx, sxy, syx, and syy are the radiation stress components; S is the point source intensity; us and vs are the velocity components of the point source; τb and τs are the bed shear and surface shear stresses of the fluid, respectively.
The sediment transport equation can be expressed as [18] follows:
where c is the volume sediment concentration; z is the vertical coordinate; u, v, and w are the velocities in the x, y, and z directions, respectively; ε is the turbulent diffusion coefficient; ω is the settling velocity of suspended sediment.
3.2.2. Model Simulation Scope
The area corresponding to the normal storage level of the Haibowan Reservoir was selected for the simulation. Based on the characteristics of reservoir topography, computational accuracy, and simulation duration, the computational domain was meshed into orthogonal curvilinear and unstructured triangular grids. The non-structured triangular grids had a minimum allowed angle of 26°, and the orthogonal curvilinear grids had a grid size of 400 m in the flow direction and 200 m in the vertical direction. The reservoir area was discretised into 7772 grid cells, as shown in Figure 4a. The terrain points were interpolated into the grids using the Natural Neighbour interpolation technique to generate the underwater terrain elevation of the reservoir, as shown in Figure 5.
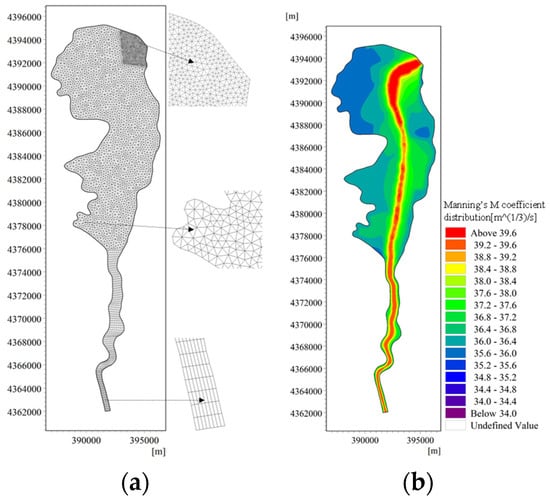
Figure 4.
Grid division and Manning coefficient distribution map of Haibowan reservoir: (a) meshing; (b) Manning coefficient distribution.
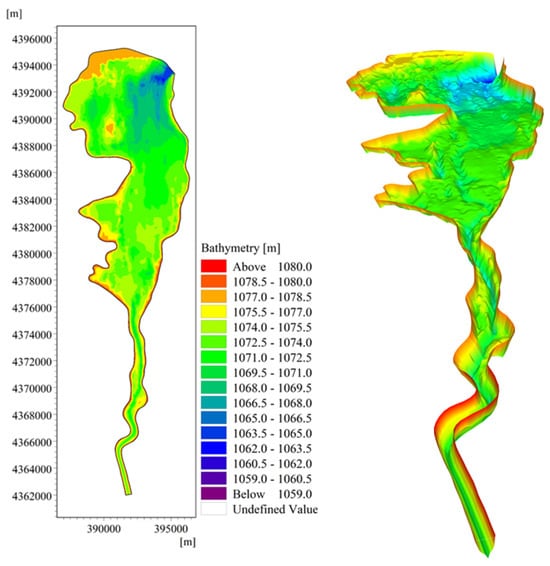
Figure 5.
Topographic map of Haibowan Reservoir, March 2019.
Definite Conditions
(1) Simulation time: The simulation period was from 1 March to 15 November 2019, a total of 260 days. The time step of the simulation was determined based on the Courant–Friedrichs–Lewy condition of the explicit difference scheme and was set to 60 s.
(2) Bed friction: Based on the field investigation results of the reservoir and the distribution of terrain, distribution of main swales, and vegetation coverage in the reservoir area, different roughness values were defined for different regions of the reservoir, as shown in Figure 4b. The Manning coefficient was used to represent the roughness, with values ranging from 34 m3/s to 40 m3/s, which closely matched the actual conditions.
(3) Precipitation and evaporation: As a long-term storage area, the reservoir is significantly influenced by precipitation and evaporation. Based on measured data, precipitation, and evaporation rates were added to the model and expressed in mm/day.
(4) Source–sink terms: No tributaries are present within the reservoir area. Based on information on the water intakes of the reservoir, 53 intakes were distributed within the reservoir area, with an average annual water diversion of approximately 188 million m3 accompanied by sediment diversion. These intakes were abstracted as a source–sink term in the model and named ‘sources1’. The Gaussian plane coordinates for ‘sources1’ were X = 395,504.7 and Y = 4,386,881.6, with a daily water diversion rate of −6 m3/s and a sediment concentration of −3370 g/m3. Moreover, seepage occurs inevitably after reservoir impoundment. Based on the geological survey results at the dam site as per the initial design report, the worst-case scenario of seepage from the dam foundation and around the dam was considered, with a daily seepage rate of 1 m3/s. This seepage was also abstracted as a source and named ‘sources2’. The Gaussian plane coordinates for ‘sources2’ were X = 395,198.3 and Y = 4,393,406.5, with a constant value of −1 m3/s.
(5) Initial conditions: The initial conditions of the hydrodynamic model were based on the assumption that the reservoir was in a static state, with zero velocities in the u and v directions. On 1 March 2019, the initial water level was set to the average water level, which was 1074 m. The initial condition for the sediment transport model was the initial suspended sediment concentration in the simulation area, which was 1900 g/m3.
(6) Boundary conditions: Two open boundaries were set in the model, one at the inflow boundary of the reservoir tail-water and the other at the outflow boundary of the dam site. The inflow boundary was provided with daily average inflow discharge and sediment concentration, whereas the outflow boundary was provided with daily average water level at the dam site. The remaining areas were treated as closed boundaries, and the wet–dry cell discrimination method was used to handle changing states in the cells.
(7) Sediment transport parameters: The sediment transport model adopted the unsteady sand transport mode under the assumption of pure water flow, using the Engelund–Hansen total load formula [19]. Based on the grain size test results of bed sediment in the initial design report and repeated model calibrations, the median grain size of the bed sediment, d50, was selected as 0.011 mm for the calculation of erosion and deposition in the model. The sediment size distribution curve is shown in Figure 6.
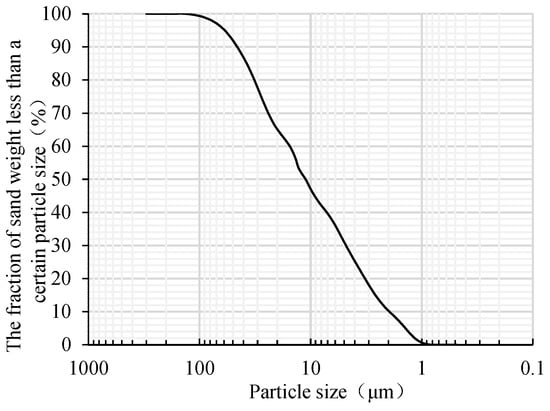
Figure 6.
The sediment size distribution curve.
3.2.3. Model Verification
- (1)
- Water level verification
The simulated water level at the dam site was compared with the measured values, as shown in Figure 7. Notably, the simulated values are consistent with the measured values, with a maximum error of only 0.05 m, indicating good performance of the water level simulation by the model.
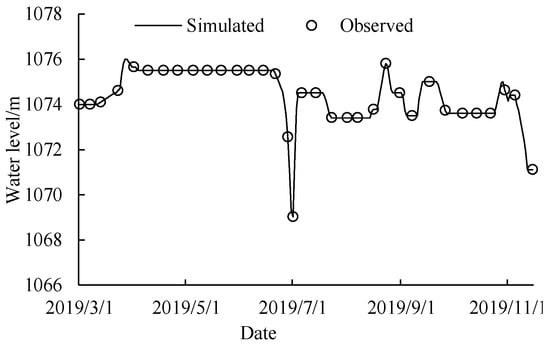
Figure 7.
Hydrodynamic model water level verification.
- (2)
- Flow velocity verification
The flow velocity at DM36 was estimated using flow velocity data from Shizuishan station. DM36 is located 29.88 km from the dam site, outside the backwater zone and unaffected by backwater. The river channel from the station to DM36 is straight. To compare the morphologies of the two cross sections, DM36 was shifted 10 m along the positive y-axis and 100 m along the positive x-axis, as shown in Figure 8. The morphologies of the two cross sections are similar, with a difference in cross-sectional area of only 13.64%. Therefore, the flow velocity at the Shizuishan cross section can be used as a substitute for the flow velocity at DM36. The simulated flow velocity at DM36 is extracted from the model results, as shown in Figure 9. The measured values closely match the simulated values. The relative error is only 4%, falling within the acceptable range.
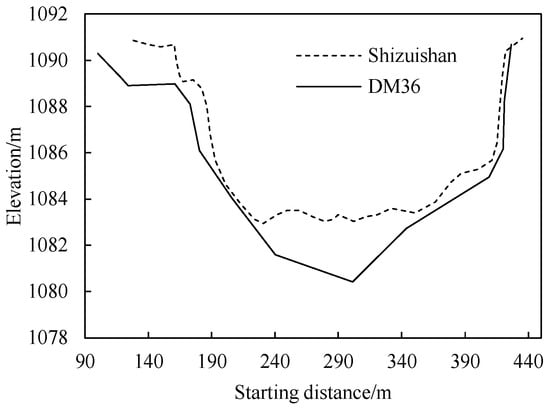
Figure 8.
Comparison of sectional morphology between Shizuishan and DM36 in 2019.
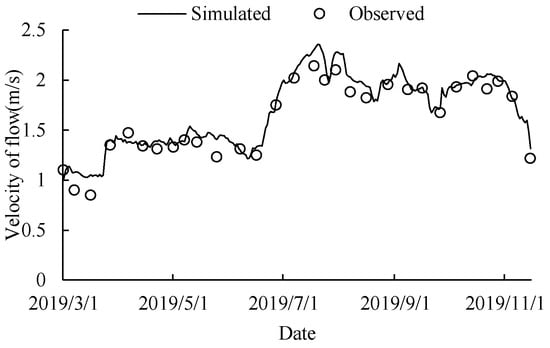
Figure 9.
Hydrodynamic model flow velocity verification.
The good agreement between the measured and simulated data for water level and flow velocity indicates that the hydrodynamic model accurately reflects the actual hydrodynamic conditions of the reservoir, enabling subsequent numerical experiments of the water–sediment transport model.
- (3)
- Sediment transport verification
The simulated terrain elevation profiles of the 37 cross sections of the reservoir were compared with the measured terrain data from November 2019. The differences in the area between the measured and simulated values ranged from 2.58% to 11.84%, suggesting that the morphologies of the simulated profiles were consistent with those of the measured profiles, as exemplified by DM8 and DM19 (Figure 10).
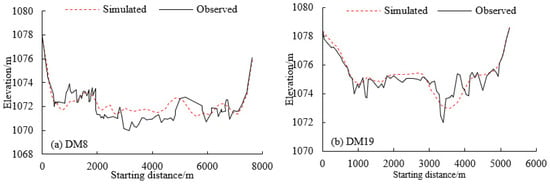
Figure 10.
Cross-sectional verification of water–sand model.
The Surfer12 software was employed to extract the X, Y, and Z data of the terrain points from the simulation results, and contour maps were generated through Kriging interpolation. After the grid nodes were densified and data whitening was performed, the simulated reservoir volume at the water level of 1076 m was found to be 295.4 million m3, which is only 0.06 million m3 different from the calculated volume of 296 million m3 based on the measured data. This indicates that the model provides a high level of accuracy in simulating the reservoir conditions.
In summary, the results of the foregoing analysis reveal that the water–sediment model of the Haibowan Reservoir can effectively simulate the processes of sediment erosion and deposition.
4. Results
4.1. Water–Sediment Regulation Control Indicators
Since its establishment and operation, the Haibowan Reservoir has generally followed the practice of controlling low-water levels during the flood season. Therefore, when determining the sediment-flushing period for the reservoir, a period with high inflow discharge or sediment load should be chosen for operation at low water levels. Although the reservoir does not have a specific sediment reduction task for the downstream river channel, efforts should be made to ease the aggravation of erosion and sedimentation in the downstream river channel caused by reservoir operation. The regulation of water and sediment should be determined depending on the relationship between inflow runoff and sediment. Based on the aforementioned principles, the following three key control indicators have been identified.
4.1.1. Regulation Time
Upstream of the Haibowan Reservoir, other reservoirs such as Longyangxia, Liujiaxia, and Qingtongxia have been constructed. The Longyangxia and Liujiaxia reservoirs generally operate below the flood limit water level from July to September [20]. The sediment-flushing operation of the Qingtongxia Reservoir is performed in July and August by combining sand peak ‘through-flow’ and sediment flushing at the end of the flood season. Based on the propagation of upstream flood peaks and sediment peaks, the Haibowan Reservoir should lower its water level for sediment flushing, and the timing of sediment flushing should be kept consistent with the upstream reservoirs.
Figure 11 displays the statistics on the daily flow and sediment discharge at Shizuishan station from July to September for the period during 1987–2021. The data reveal a relatively flat distribution of flow but significant fluctuations in sediment discharge, especially in August. In that month, the average sediment discharge amounts to 6.0 t/s, which is noticeably higher than in other months. Failure to timely flush the sediment during this period would accelerate reservoir sedimentation. Therefore, August should be considered a key period for sediment flushing in the reservoir.
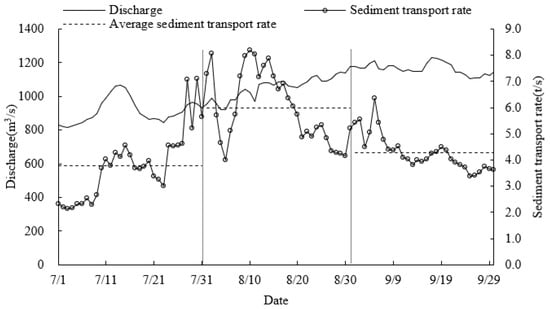
Figure 11.
The annual average process of water and sediment inflow in Haibowan Reservoir from July to September.
Based on the foregoing analysis, the sediment-flushing timing of upstream cascade reservoirs, and the intra-year distribution characteristics of inflow water and sediment, the sediment-flushing period for the Haibowan Reservoir was determined to be from July to September.
4.1.2. Outflow Discharge
Bed-forming discharge is a characteristic flow that is essential in shaping river channels [21]. The bed-forming discharge in the Bayangol–Toudaoguai segment of the Yellow River has been approximately 2620 m3/s from 2010 to 2019 [22]. Fuqin proposed a minimum ecological flow of 300 m3/s for the Inner Mongolia section of the Yellow River [23]. The flood control discharge at the Sanshenggong–Toudaoguai segment, as proposed by the Yellow River Conservancy Commission, is considered a control indicator with a discharge of 5900 m3/s [24]. Therefore, during the sediment-flushing process in the Haibowan Reservoir, a maximum outflow discharge limit of 2620 m3/s is considered to avoid over-bank flooding in the downstream river channel and the discharge should not exceed 5900 m3/s. A minimum outflow discharge limit of 300 m3/s is set for ecological purposes.
4.1.3. Water–Sediment Regulation Volume
To determine the flow and sediment concentration levels for water–sediment regulation, the inflow water and sediment data from 1987 to 2021 were classified into different levels based on the selected sediment-flushing period of July to September.
- (1)
- Sediment-flushing discharge levels
The inflow sediment data were classified into different levels based on intervals of 500 m3/s, as shown in Table 3. Low levels, i.e., below 1500 m3/s, have high frequencies, considerable proportions of water volume, and small sediment concentrations. These levels are suitable for hydropower generation and water supply purposes. High levels, i.e., those exceeding 1500 m3/s, occur less frequently but have high sediment concentrations. Failure to timely flush the sediment during these levels can lead to reservoir sedimentation. In addition, high levels are associated with large flood flows and can be used for flushing the reservoir area to restore storage capacity. Therefore, when the inflow exceeds 1500 m3/s, the reservoir should lower its water level for sediment flushing.

Table 3.
Statistics of water and sediment in Haibowan reservoir.
The bed-forming discharge at Shizuishan station was 2760 m3/s from 2010 to 2019 [22], indicating a strong scouring effect in the reservoir at that flow rate. The bed formation function of the reservoir is not only affected by water and sediment processes but also closely related to the operational mode of the reservoir [25]. Thus, further control measures should be implemented for flow rates that exceed 1500 m3/s. When the inflow discharge exceeds 2760 m3/s, the reservoir should perform open spillage sediment flushing.
- (2)
- Sediment-flushing concentration levels
The inflow sediment data were classified into different concentration intervals, as presented in Table 4. The levels below 3 kg/m3 have the highest frequency of occurrence, corresponding to the largest water volume, accounting for 52.8%, and a relatively lower sediment load, accounting for 26.2%. The levels that exceed 3 kg/m3 have a higher sediment load, accounting for 73.8%.

Table 4.
Statistics of sediment level in Haibowan reservoir.
Based on the hydropower generation benefits, the sediment-flushing concentration levels were determined as follows: when the inflow sediment concentration is lower than 3 kg/m3, the reservoir should utilise the water volume to maintain high water levels for power generation. When the inflow sediment concentration exceeds 3 kg/m3, the reservoir should lower its water level for sediment flushing, with normal storage water level as the benchmark. Specifically, when the sediment concentration ranges from 3 kg/m3 to 5 kg/m3, both water and sediment have a significant proportion. In this case, the reservoir water level should be reduced by 1–4 m for sediment flushing, while ensuring power generation. When the sediment concentration ranges from 5 kg/m3 to 10 kg/m3, the sediment has a high proportion. In this case, the reservoir should lower its water level by 3–5 m for sediment flushing. When the sediment concentration exceeds 10 kg/m3, the reservoir enters a critical period for water–sediment regulation and should open all sluices for sediment flushing.
4.2. Water–Sediment Regulation Scheme
4.2.1. Regulation Principles
- (1)
- Hydropower generation and regulation principles
At the hydropower station at the Haibowan Reservoir, water discharge regulation has precedence over the power generation schedule. No consideration is given to peak load regulation. Each generating unit has a rated flow of 318.2 m3/s, and the full generation capacity of the four units is 1272.8 m3/s. To maximise hydropower generation, when the inflow discharge is less than 1272.8 m3/s, priority is given to discharging water through the power station. When the inflow discharge exceeds 1272.8 m3/s, priority is given to opening the sediment-flushing outlets of the power station. If the inflow discharge exceeds the sum of the required generation discharge and the sediment-flushing discharge (approximately 1600 m3/s), the sluices are opened. When the reservoir operates at a water level of 1069 m for sediment flushing, the power station ceases power generation and simultaneously opens the sediment-flushing outlets.
- (2)
- Downstream irrigation requirements
The agricultural irrigation season in the downstream Yellow River irrigation districts of the Haibowan Reservoir extends from May to October each year. Because of the large water diversion flow, the downstream Sanshenggong conservancy hub has no regulation capacity. To ensure an uninterrupted water supply for irrigation in the downstream districts, the daily outflow discharge from the reservoir should be maintained uniformly to the extent possible.
- (3)
- Flood control regulation principle
The Haibowan Reservoir has a small effective storage capacity, whereas the flood volume of the Yellow River is significant. Therefore, the reservoir does not have a flood control task, and flood control measures during the flood season are primarily aimed at ensuring the safety of the project.
- (4)
- Sediment-flushing regulation principle
When the inflow sediment discharge is low, the reservoir operates at a high water level to maximise hydropower benefits. When the inflow sediment discharge is high, the reservoir operates at a low water level, simultaneously releasing water for power generation and sediment flushing, aiming to minimise reservoir sedimentation and maximise the regulated storage capacity.
4.2.2. Scheduling Scheme
The sediment-flushing ratio increases as the water level decreases in front of the dam [26]. However, the operating water level range for the Haibowan Reservoir is only 7 m, i.e., from 1069 m to 1076 m. After considering the reservoir scheduling principles and the water–sediment regulation control indicators, the operating mode can only be optimised by adjusting the water level within a small range. Thus, the different water levels for July to September were controlled. Based on this, the following schemes for sediment flushing and operation of the reservoir were presented.
Scheme 1: For the Haibowan Reservoir, when the daily inflow discharge from July to September is less than 1500 m3/s or the inflow sediment concentration is less than 3 kg/m3, the reservoir operates at a water level of 1076 m. When the daily inflow discharge ranges between 1500 and 2760 m3/s, the inflow sediment concentration is categorised, and specific water level adjustments are made. For sediment concentrations in the range of 3 kg/m3 to 5 kg/m3, the water level is reduced to 1075 m in July and September and to 1072 m in August. For sediment concentrations in the range of 5 kg/m3 to 10 kg/m3, the water level is reduced to 1073 m in July and September, and to 1071 m in August. From July to September, when the inflow sediment concentration is equal to or exceeds 10 kg/m3, or the inflow discharge is equal to or exceeds 2760 m3/s, the water level is reduced to 1069 m by opening sluices for sediment flushing. The outflow discharge should be controlled uniformly from July to September and should not exceed 2620 m3/s.
Schemes 2 and 3 are similar to Scheme 1 in terms of regulation principles and control methods. However, when the inflow discharge ranges between 1500 m3/s and 2760 m3/s and the inflow sediment concentration ranges from 5 kg/m3 to 10 kg/m3, the water level in front of the dam are adjusted to 1072 and 1071 m, respectively. The details of the regulation schemes are presented in Table 5.

Table 5.
Water–sediment regulation scheme of Haibowan Reservoir.
4.3. Design of Representative Water–Sediment Series
The representative water–sediment series for the Haibowan Reservoir are selected based on the following principles: (1) preference should be given to using measured water–sediment series as they effectively align with the actual reservoir operation during regulation calculations; (2) measured water–sediment series after 1986 should be prioritised, owing to the significant impacts of the Longyangxia and Liujiaxia reservoirs on the downstream river channel [27]. In particular, the regulation effect on water and sediment in the Inner Mongolia section of the Yellow River is noticeable after reservoir impoundment. In the meantime, water usage in the upstream Yellow River has been increasing, rendering the post-1986 riverbed conditions sufficiently representative of the current situation. (3) The design of the representative water–sediment series should include years with abundant, average, and low water–sediment conditions. Notably, similar water–sediment volumes should be obtained during the flood season and similar sediment volumes should be obtained during the non-flood season, with a large error margin for water volumes.
The P-III-type frequency curve was used to analyse the runoff and sediment discharge data from 1987 to 2021 at Shizuishan station via curve fitting, Cv is the coefficient of variation, Cs is the coefficient of skewness, and Cs/Cv was adjusted to obtain the optimal design values for water–sediment series, as presented in Table 6. Based on the selection principles for the representative series, the measured water–sediment processes from 1987 to 2001 at Shizuishan station were selected through comprehensive analysis. Moreover, the sand transported by wind from the Ulan Buh Desert, estimated at 2 million t/a, was included in the sediment inflow to the reservoir, resulting in a 15-year representative water–sediment series.

Table 6.
Annual water and sediment frequency calculation results at Shizuishan Station.
4.4. Runoff Regulation and Power Calculation
Based on the regulation principles of the Haibowan Reservoir and the proposed water–sediment regulation schemes, three schemes were designed to regulate the inflow runoff series over 15 years. The reservoir was adjusted to account for the effects of reducing the water level during the flood season on power generation while ensuring the requirements for flood control, irrigation, ecological flow, and riverbed flow downstream. The water level was adjusted between normal and dead storage levels. The daily reservoir water level profiles for each scheme are shown in Figure 12.
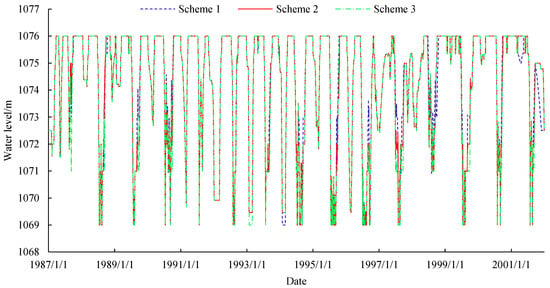
Figure 12.
Running water level of Haibowan Reservoir under different application schemes.
Based on the aforementioned hydropower generation regulation principles, the operational mode of the power station at the reservoir is as follows: From July to September, all four generating units are put into operation. When the outflow discharge is less than 1272.8 m3/s, the generation discharge is equal to the outflow discharge. When the outflow discharge exceeds 1272.8 m3/s, the generation discharge is fixed at 1272.8 m3/s. For the remaining months, two to three generating units are put into operation. Table 7 presents the power generation calculation based on the runoff regulation results.

Table 7.
Comparison of effective storage capacity and power generation of Haibowan Reservoir.
4.5. Model Simulation Results
The calibrated two-dimensional (2D) kinetic model of sediment transport in the Haibowan Reservoir was used, and the designed water–sediment series from 1987 to 2001 and the results of regulating the reservoir water level for runoff were input into the model boundary. The sediment erosion and deposition of the reservoir were evaluated on an hourly basis. The sediment accumulation pattern based on Scheme 2 is shown in Figure 13. The specific results of sediment accumulation calculations are presented in Table 7.
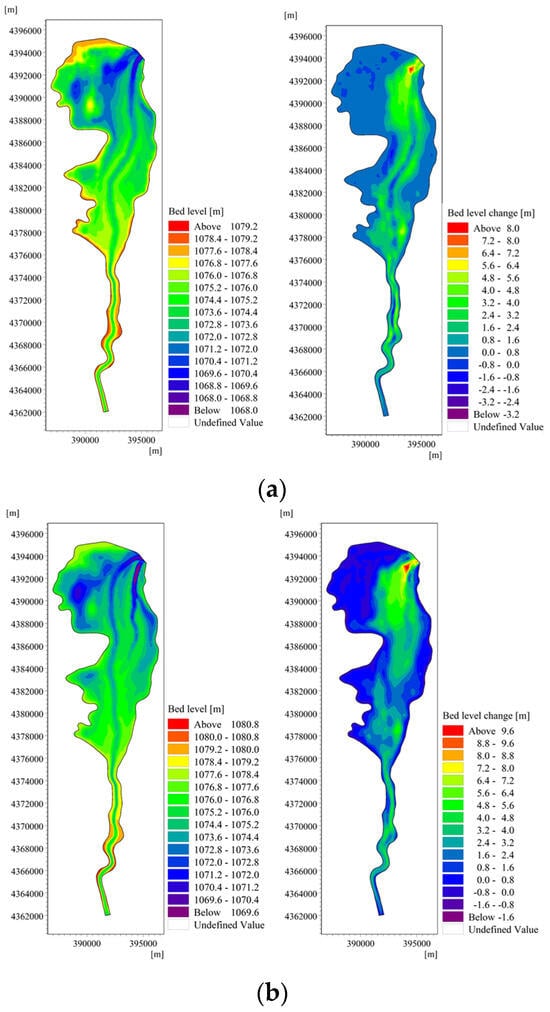
Figure 13.
Operation result of Scheme 2. (a) 5 years of topographic changes; (b) 15 years of terrain change.
Over time, a significant amount of sediment accumulated in the reservoir, gradually forming wide floodplains and a narrow primary channel. After 15 years of operation, the width of the primary channel was approximately 0.4 km to 0.5 km, demonstrating an accumulation pattern characterised by ‘patch-like sedimentation and linear erosion’. During these 15 years, the primary channel experienced both erosion and sedimentation, whereas the floodplains gradually rose in elevation. After the sand-laden water flowed over the floodplains, because of the different flow velocities between the floodplains and primary channel at the same cross section, variations in sediment exchange occurred between the floodplains, primary channel, and sand-laden water flow. The riverbed of the Haibowan Reservoir area is prone to sediment deposition and erosion. During peak flow or peak sediment conditions, noticeable variations in sediment erosion and deposition occur because of the lateral exchange of water and sediment along the floodplains and primary channel. The floodplains and primary channels influence the simultaneous movement of water and sediment differently. The low flow velocity on the floodplains causes sediment to deposit there first as the sand-laden water flow progresses. With increasing reservoir operation time, the floodplains experience significant sediment deposition, resulting in an overall increase in the elevation of the entire riverbed.
Specifically, after five years of reservoir operation, sediment accumulation in the reservoir area is primarily concentrated within approximately 6 km from the dam, characterised by ‘sedimentation in both the floodplains and primary channel’. The average sediment accumulation thickness exceeds 4 m. In particular, the thickness reaches 7–8 m within the 1–2 km range from the dam. In the range of 6–31 km from the dam, sedimentation is observed as ‘erosion in the primary channel and sedimentation on the floodplains’, with floodplain sediment thickness ranging from 1 m to 3 m. The primary channel of the reservoir experiences overall erosion, with its position remaining relatively stable and not undergoing significant deviation. Upstream inflows split into two branches approximately 10 km from the dam, with the right branch having a steeper longitudinal slope than the left. The sand-laden water flow follows the original sediment transport channel toward the dam. After 15 years of reservoir operation, the reservoir area exhibits an overall pattern of ‘sedimentation in both the floodplains and primary channel’. The floodplain sediment continues to rise within approximately 6 km from the dam, with an average sediment accumulation thickness exceeding 5 m. Sedimentation intensifies closer to the dam, with the most severe accumulation occurring within the 2 km range in front of the dam, where the riverbed elevation ranges only from 1067 m to 1069 m. Under all schemes, the primary channel swings towards the left, with the original primary channel becoming silted up approximately 10 km from the dam. The water flow breaks through the floodplain lips and creates a new primary channel in the left branch of the river. Because of the presence of a large backwater zone in the left branch, the water flow intensity is relatively low, ranging from 0.13 m/s to 0.72 m/s. After the sand-laden water flow enters this new channel, a significant amount of sediment accumulates on the floodplains, forming a stable new primary channel in the reservoir. In the tail section of the reservoir under all schemes, erosion ranges from 0 m to 0.8 m, indicating that even after an additional 15 years of operation, the Haibowan Reservoir is unlikely to face the upstream extension of reservoir sedimentation.
5. Discussion
5.1. Analysis of Simulation Results
The distribution of reservoir sedimentation is closely related to inflow water–sediment characteristics, underwater topography, and water level variations in front of the dam. The Liujiaxia [28], Qingtongxia, Wanjiazhai [29], Tianqiao [30], Sanmenxia [31], and Xiaolangdi reservoirs [32] are located on the primary stream of the Yellow River, exhibiting similar inflow sediment characteristics to the Haibowan Reservoir. All of them have relatively high sediment concentrations during the flood season.
The Qingtongxia and Tianqiao reservoirs are low-head reservoirs with a planar distribution characterised by an ‘upper wide, lower narrow’ pattern. The longitudinal slope of the Qingtongxia Reservoir area does not vary significantly, whereas the longitudinal slope of the Tianqiao Reservoir area is steeper in the upper section than in the lower section. This leads to different patterns of sediment deposition in the two reservoirs: scouring dominates the front of the dam of the Qingtongxia Reservoir, whereas the area of the Tianqiao Reservoir is the primary sediment deposition area. At the same time, the sediment accumulation at the end of the reservoir did not extend. The Haibowan Reservoir also operates at a low head and exhibits a similar planar distribution with a steeper upper slope than the lower slope. The sediment simulation results show significant sediment deposition in front of the dam. There is no upstream extension of reservoir deposits, which is similar to the siltation distribution of the Tianqiao reservoir.
The Liujiaxia, Wanjiazhai, Sanmenxia, and Xiaolangdi reservoirs have large ranges of water level fluctuations, and the plane terrain distribution of the Xiaolangdi Reservoir is ‘upper narrow, lower wide’, while the plane terrain distribution of the other three reservoir reservoirs is ‘equal widths between upper and lower parts’. The sediment deposition is mainly distributed in the area in front of the dam, but the overall performance of the Xiaolangdi Reservoir is ‘erosion in the primary channel and sedimentation on the floodplains’. The other three reservoirs showed ‘sedimentation in both the floodplains and primary channel’. This is similar to the Haibowan Reservoir, which also has an ‘upper narrow, lower wide’ planar shape, with sediment deposition primarily occurring in front of the dam, and the performance is ‘equal widths between upper and lower parts’.
The comprehensive analysis demonstrates that the simulation results of the Haibowan Reservoir water–sediment model are reasonably accurate.
5.2. Recommended Optimal Scheme
During the preliminary design stage of the Haibowan Reservoir, the measured water–sediment data from Shizuishan station for the period of 1992–2002 were selected as the representative water–sediment series for reservoir sediment erosion and deposition calculations. Two years after impounding the reservoir, the design inflow water–sediment process from Shizuishan station for the periods of 1968–2006 and 1956–1966 were selected [33] to calculate the sediment erosion and deposition process in the reservoir. The remaining effective reservoir capacities for each year are presented in Table 7.
The different schemes were comprehensively compared. In terms of maintaining the effective reservoir capacity, Schemes 1, 2, and 3 had higher effective capacities than the initial design scheme. Unlike Scheme 1, Schemes 2 and 3 had higher effective capacities than the existing achieved scheme, rendering them more proactive in maximising the comprehensive benefits of the reservoir. In terms of hydropower generation benefits, Scheme 1 had the highest average annual hydropower generation, followed by Schemes 2 and 3. All schemes had average annual hydropower generation values greater than that of the preliminary design but slightly lower than the existing achieved hydropower generation. As the effective reservoir capacity tends to be larger than the existing achieved results after 20 years of operation, a slight loss in hydropower generation in the short term can ensure the continuous operation of the power station and maintain the long-term economic benefits of the reservoir.
The important principles for recommending the optimal scheme are to maintain the effective reservoir capacity in the long term and maximise the hydropower generation benefits. Scheme 1 achieved the best hydropower generation benefits but had a small effective capacity. After 20 years of operation, the difference in effective capacity was not significant compared with the initial design and was smaller than the existing achieved results, posing a certain risk during periods of low water inflow. Schemes 2 and 3 had larger remaining effective capacities than Scheme 3, which sacrificed some hydropower generation benefits. Scheme 2 satisfied the requirements for hydropower generation benefits but also maintained a larger effective reservoir capacity. Therefore, implementing Scheme 2 is recommended for the water–sediment regulation of the Haibowan Reservoir.
5.3. Limitations of Water–Sediment Regulation in Plain-Type Sand-Laden Reservoirs
The limitations of water–sediment regulation in plain-type sand-laden reservoirs are threefold. First, the storage period is usually to complete the task of water supply and power generation. Plain-type reservoirs are shallow, with a large amount of sediment flood into the reservoir congestion area, it is difficult to form a density difference with the reservoir water, resulting in less chance of heterogeneous flow, if there is sediment in the reservoir that is basically silted in the reservoir. Secondly, in order to fulfil a certain power generation or water supply task, the sand discharge period usually should not be too long. Plain-type reservoirs have a small topographic longitudinal ratio drop and limited water level changes in front of the dam, so the scouring effect of along-track scouring and backwater scouring is poorer, especially for plain-type reservoirs located on rivers, which are not able to empty the reservoir, and the scouring effect is further weakened. Third, soil and water conservation measures on both sides of the reservoir, such as vegetation cover, wind and sand, and slope erosion, also have an impact on sedimentation.
In summary, plain-type sand-laden reservoirs are easy to silt and difficult to scour. Therefore, when water and sand scheduling, it is recommended to maintain the low water level and high flow rate operation as far as possible during the period of big water and big sand, especially during the coordination period of water and sand peaks and emergence, to control the water flow not to roam the beach and avoid the loss of reservoir capacity in the beach, and to organise water–sediment regulation in time to increase the ratio of sand discharged from the reservoirs, to increase the effective capacity of the reservoir area, and to slow down the rate of siltation of the reservoirs. At the same time, increase the vegetation cover on both sides of the bank and lining slopes, reduce the amount of wind or gravity erosion into the reservoir sand; if necessary, supplemented by artificial sand dredging or human-made means of disturbing the sand discharge, etc., to increase the capacity of the main channel in the reservoir, scouring to control the depth of the main channel rushing and pulling the width of the reservoir, to extend the service life of the reservoir.
In the future, the Heishanxia Reservoir will be established about 350km upstream of the Haibowan Reservoir. The normal storage level of the Heishanxia reservoir in the first-level development plan is 1380m, the original storage capacity is 11.03 billion m3, and the long-term effective regulation storage capacity is about 5.90 billion m3. The primary task of the reservoir is to regulate the discharge during the flood season, solve the problem of flood prevention in the Inner Mongolia River section, coordinate the relationship between the water and sediment of the Yellow River, and improve the channel form so as to create conditions for flood control and flood prevention in the Yellow River. After the completion, it is bound to change the evolution trend of erosion and deposition of Haibowan Reservoir and downstream river and affect the process of water and sediment in the reservoir. Therefore, the study of water and sediment control in the Haibowan Reservoir is still in the initial stage, and the change of water and sediment conditions in the Haibowan Reservoir and its response to the evolution of erosion and deposition need to be further explored and practiced.
6. Conclusions
This study presented a water–sediment regulation scheme for reducing sedimentation in plain-type reservoirs and mitigating downstream channel sedimentation. A 2D kinetic model of sediment transport was established, and simulations were conducted using the Haibowan Reservoir as a case study. The main conclusions are as follows:
- (1)
- The 2D kinetic model of sediment transport for the Haibowan Reservoir was consistent with the measured data and could effectively demonstrate the changes in sediment erosion and deposition in the reservoir area in real time.
- (2)
- The water–sediment regulation scheme for the Haibowan Reservoir was taken as an example, and the characteristics of inflow water–sediment, downstream channel erosion and sedimentation, and scheduling of sediment flushing from upstream reservoirs were analysed. Operational control indicators for reservoir scheduling were proposed, and an optimised scheme that maximised the comprehensive benefits of the reservoir and reduced downstream sedimentation was recommended. The calculation results showed that Scheme 2 had an effective reservoir capacity of 97 million m3 and an average annual hydropower generation of 389.5 million kWh, both exceeding the values of the preliminary design. Therefore, Scheme 2 is recommended for the water–sediment regulation and operation of the Haibowan Reservoir.
- (3)
- From the scientific point of view, the combined water and sediment dispatching model of plain-type reservoir can effectively take into account the benefits of reservoir area, power generation, and river in the operation of sandy rivers, which reflects the rationality and adaptability of the model. From the perspective of engineering application, it is completely possible to make good use of the sediment discharge process of the reservoir, properly discharge sediment, and extend the service life of the sandy river reservoir on the premise of maintaining the middle water channel in the downstream river, and the existing Haibowan reservoir water–sediment regulation scheme still has the potential to be further improved.
Author Contributions
Conceptualization, X.L.; Methodology, X.L.; Software, K.W.; Validation, T.L.; Formal analysis, W.W.; Investigation, W.W.; Data curation, T.L.; Writing—original draft, K.W.; Writing—review & editing, X.L.; Supervision, T.L.; Funding acquisition, X.L. All authors have read and agreed to the published version of the manuscript.
Funding
This work was supported by the Major Science and Technology Projects of Inner Mongolia Autonomous Region 2020ZD0009-4; The National Natural Science Foundation of China 52169016, 51969021; The Nature Foundation of Inner Mongolia Autonomous Region 2021MS05042.
Data Availability Statement
The data that support the findings of this study are available from [Career Development Centre, the Yellow River Haibowan Water Conservancy Hub, the Hydrological Yearbook of the People’s Republic of China (Volume 4)], but restrictions apply to the availability of these data, which were used under license for the current study, and so are not publicly available.
Conflicts of Interest
The authors declare no conflict of interest.
References
- Schleiss, A.J.; Franca, M.J.; Juez, C.; De Cesare, G. Reservoir sedimentation. J. Hydraul. Res. 2016, 54, 595–614. [Google Scholar] [CrossRef]
- Deng, A.; Chen, J.; Hu, H.; Zhang, G. Analysis of reservoir siltation in China. J. Hydraul. Eng. 2022, 53, 325–332. [Google Scholar]
- El-Shazli, A.; Hoermann, G. Development of storage capacity and morphology of the Aswan High Dam Reservoir. Hydrol. Sci. J. 2016, 61, 2639–2648. [Google Scholar] [CrossRef]
- Randle, T.J.; Morris, G.L.; Tullos, D.D.; Weirich, F.H.; Kondolf, G.M.; Moriasi, D.N.; Annandale, G.W.; Fripp, J.; Minear, J.T.; Wegner, D.L. Sustaining United States reservoir storage capacity: Need for a new paradigm. J. Hydrol. 2021, 602, 126686. [Google Scholar] [CrossRef]
- Dutta, S.; Sen, D. Sediment distribution and its impacts on Hirakud Reservoir (India) storage capacity. Lakes Reserv. Res. Manag. 2016, 21, 245–263. [Google Scholar] [CrossRef]
- Ngor, P.B.; Legendre, P.; Oberdorff, T.; Lek, S. Flow alterations by dams shaped fish assemblage dynamics in the complex Mekong-3S river system. Ecol. Indic. 2018, 88, 103–114. [Google Scholar] [CrossRef]
- Gillespie, B.R.; Desmet, S.; Kay, P.; Tillotson, M.; Brown, L. A critical analysis of regulated river ecosystem responses to managed environmental flows from reservoirs. Freshw. Biol. 2015, 60, 410–425. [Google Scholar] [CrossRef]
- Buta, B.; Wiatkowski, M.; Gruss, Ł.; Tomczyk, P.; Kasperek, R. Spatio-temporal evolution of eutrophication and water quality in the Turawa dam reservoir, Poland. Sci. Rep. 2023, 13, 9880. [Google Scholar] [CrossRef]
- Miao, C.; Kong, D.; Wu, J.; Duan, Q. Functional degradation of the water–sediment regulation scheme in the lower Yellow River: Spatial and temporal analyses. Sci. Total. Environ. 2016, 551-552, 16–22. [Google Scholar] [CrossRef]
- Jin, W.; Chang, J.; Wang, Y.; Bai, T. Long-term water-sediment multi-objectives regulation of cascade reservoirs: A case study in the Upper Yellow River, China. J. Hydrol. 2019, 577, 123978. [Google Scholar] [CrossRef]
- Hajiabadi, R.; Zarghami, M. Multi-Objective Reservoir Operation with Sediment Flushing; Case Study of Sefidrud Reservoir. Water Resour. Manag. 2014, 28, 5357–5376. [Google Scholar] [CrossRef]
- Chen, L.; Ge, L.; Wang, D.; Zhong, W.; Zhan, T.; Deng, A. Multi-objective water-sediment optimal operation of cascade reservoirs in the Yellow River Basin. J. Hydrol. 2022, 609, 127744. [Google Scholar] [CrossRef]
- Huang, J.; Greimann, B.; Kimbrel, S. Simulation of Sediment Flushing in Paonia Reservoir of Colorado. J. Hydraul. Eng. 2019, 145, 06019015. [Google Scholar] [CrossRef]
- Zulfan, J.; Ginting, B.M.; Rimawan, R. Assessment of Reservoir Sedimentation and Mitigation Measures using 2D Hydrodynamic Modeling: Case Study of Pandanduri Reservoir, Indonesia. In IOP Conference Series: Earth and Environmental Science; IOP Publishing: Bristol, UK, 2023; Volume 1135, p. 012018. [Google Scholar] [CrossRef]
- Faghihirad, S.; Lin, B.; Falconer, R.A. Application of a 3D Layer Integrated Numerical Model of Flow and Sediment Transport Processes to a Reservoir. Water 2015, 7, 5239–5257. [Google Scholar] [CrossRef]
- Yue, Z.; Yuan, X.; Cao, L.; Tian, F.; Han, C.; Zhang, H. Characteristics and variation law of wind-blown sand delivered to the Ningxia–Inner Mongolia reach of the Yellow River under a changing environment. Int. J. Sediment Res. 2022, 37, 188–201. [Google Scholar] [CrossRef]
- An, C.H.; Lu, J.; Qian, Y.; Luo, Q.S.; Cui, Z.H. Spatial-temporal distribution characteristic and course of sedimentation in the Ningxia-InnerMongolia reaches of the Yellow River. J. Hydraul. Eng. 2018, 49, 195–206+215. [Google Scholar]
- Galapatti, R. A depth integrated model for suspended transport. J. Hydraul. Res. 1983, 24, 53–67. [Google Scholar] [CrossRef]
- Lu, X.; Wang, X.; Ban, X.; Singh, V.P. Transport characteristics of non-cohesive sediment with different hydrological durations and sediment transport formulas. J. Hydrol. 2020, 591, 125489. [Google Scholar] [CrossRef]
- Xu, J. Complex response of channel fill–scour behavior to reservoir construction: An example of the upper Yellow River, China. River Res. Appl. 2013, 29, 593–607. [Google Scholar] [CrossRef]
- Gao, Y.; Chen, L.; Zhang, W.; Li, X.; Xu, Q. Spatiotemporal variations in characteristic discharge in the Yangtze River downstream of the Three Gorges Dam. Sci. Total. Environ. 2021, 785, 147343. [Google Scholar] [CrossRef]
- Wang, K.Z.; Liu, X.M.; Zhang, H.W.; Zhang, X.H. Variation of Bed-forming Discharge and Its Influencing Factors in the Inner Mongolia Reach of the Yellow River. J. Chang. River Sci. Res. Inst. 2023, 40, 8–15. [Google Scholar]
- Lu, S.; Cai, W.; Shao, W.; Taghizadeh-Hesary, F.; Faisal, M.; Zhang, H.; Xue, Y. Ecological Water Requirement in Upper and Middle Reaches of the Yellow River Based on Flow Components and Hydraulic Index. Int. J. Environ. Res. Public Health 2021, 18, 10956. [Google Scholar] [CrossRef]
- Yellow River Commission; Ministry of Water Resources. Yellow River Basin Comprehensive Planning; Ministry of Water Resources: Beijing, China, 2013; pp. 40–41.
- Tan, G.; Chen, P.; Deng, J.; Xu, Q.; Tang, R.; Feng, Z.; Xiong, Y. Estimations and changes of the dominant discharge in Three Gorges Reservoir channel. Arab. J. Geosci. 2019, 12, 82. [Google Scholar] [CrossRef]
- Dahal, S.; Crosato, A.; Omer, A.Y.A.; Lee, A.A. Validation of Model-Based Optimization of Reservoir Sediment Releases by Dam Removal. J. Water Resour. Plan. Manag. 2021, 147, 04021033. [Google Scholar] [CrossRef]
- Su, T.; Wang, S.; Mei, Y.; Shao, W. Comparison of channel geometry changes in Inner Mongolian reach of the Yellow River before and after joint operation of large upstream reservoirs. J. Geogr. Sci. 2015, 25, 930–942. [Google Scholar] [CrossRef]
- Li, J.Q.; Shen, D.; Wang, A.J.; Zhang, Y.S. Analysis of inflow design flood for Liujiaxia reservoir under dynamic operation of flood limited water level for ten-day period. Appl. Mech. Mater. 2012, 212, 725–730. [Google Scholar] [CrossRef]
- Ren, Z.; Wang, T.; Wang, Y.; Qu, S. A study on the characteristics and influencing factors of reservoir sedimentation in Wanjiazhai Reservoir. MATEC Web Conf. 2018, 246, 01046. [Google Scholar] [CrossRef]
- Zhao, G.; Mu, X.; Jiao, J.; An, Z.; Klik, A.; Wang, F.; Jiao, F.; Yue, X.; Gao, P.; Sun, W. Evidence and Causes of Spatiotemporal Changes in Runoff and Sediment Yield on the Chinese Loess Plateau. Land Degrad. Dev. 2017, 28, 579–590. [Google Scholar] [CrossRef]
- Chen, J.; Zhou, W.; Han, S.; Sun, G. Influences of retrogressive erosion of reservoir on sedimentation of its downstream river channel—A case study on Sanmenxia Reservoir and the Lower Yellow River. Int. J. Sediment Res. 2017, 32, 373–383. [Google Scholar] [CrossRef]
- Lu, M.; Zhao, Q.; Ding, S.; Wang, S.; Hong, Z.; Jing, Y.; Wang, A. Hydro-geomorphological characteristics in response to the water-sediment regulation scheme of the Xiaolangdi Dam in the lower Yellow River. J. Clean. Prod. 2022, 335, 130324. [Google Scholar] [CrossRef]
- Wei, S.T.; Liang, Y.J.; Chen, C.X.; Chinese Society of Dam Engineering. High Quality Construction and Green Development of Reservoir DAMS—China Dam Engineering Society; Yellow River Water Conservancy Press: Zhengzhou, China, 2018; p. 11. [Google Scholar]
Disclaimer/Publisher’s Note: The statements, opinions and data contained in all publications are solely those of the individual author(s) and contributor(s) and not of MDPI and/or the editor(s). MDPI and/or the editor(s) disclaim responsibility for any injury to people or property resulting from any ideas, methods, instructions or products referred to in the content. |
© 2024 by the authors. Licensee MDPI, Basel, Switzerland. This article is an open access article distributed under the terms and conditions of the Creative Commons Attribution (CC BY) license (https://creativecommons.org/licenses/by/4.0/).