
Three Decades of Groundwater Drought Research: Evolution and Trends

 ,
,  ,
,  ,
,  and
and
Abstract
1. Introduction
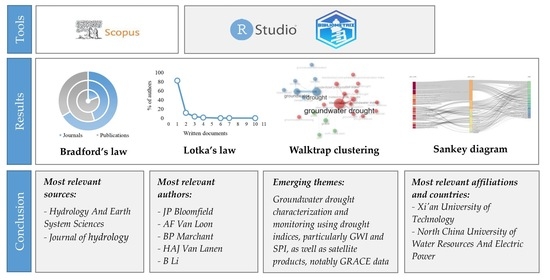
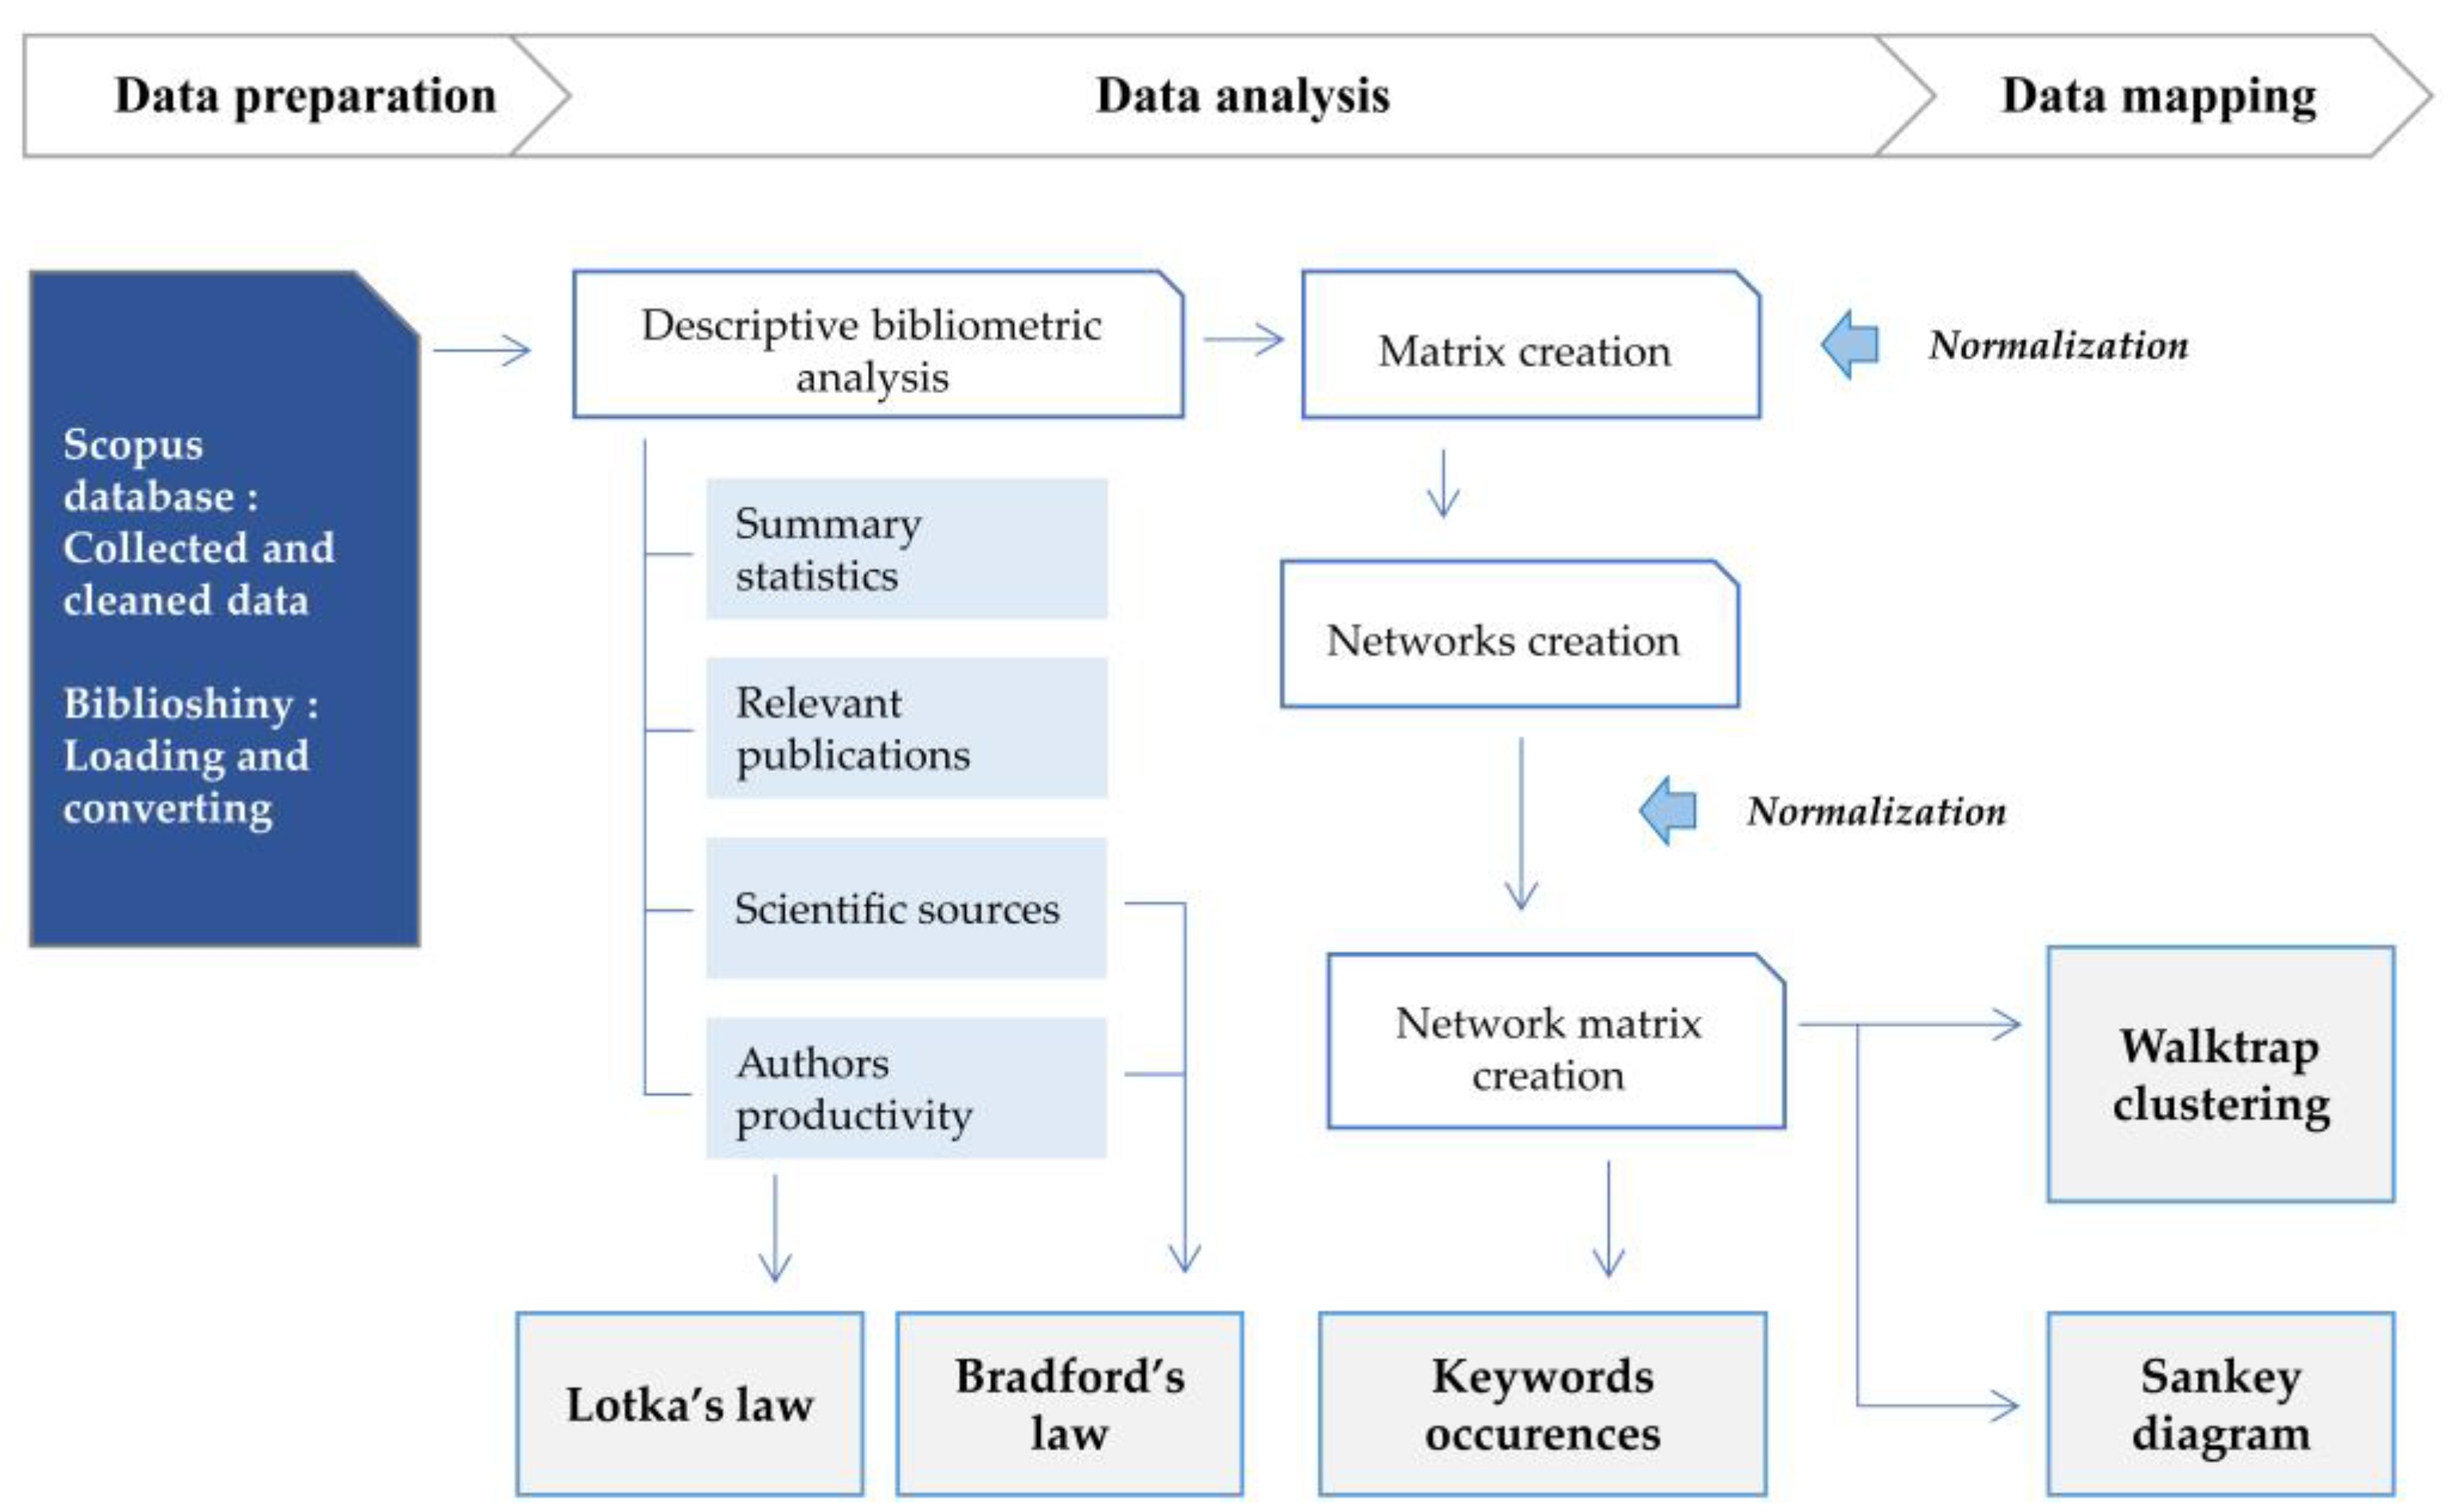
2. Materials and Methods
3. Results
3.1. Bradford’s Law
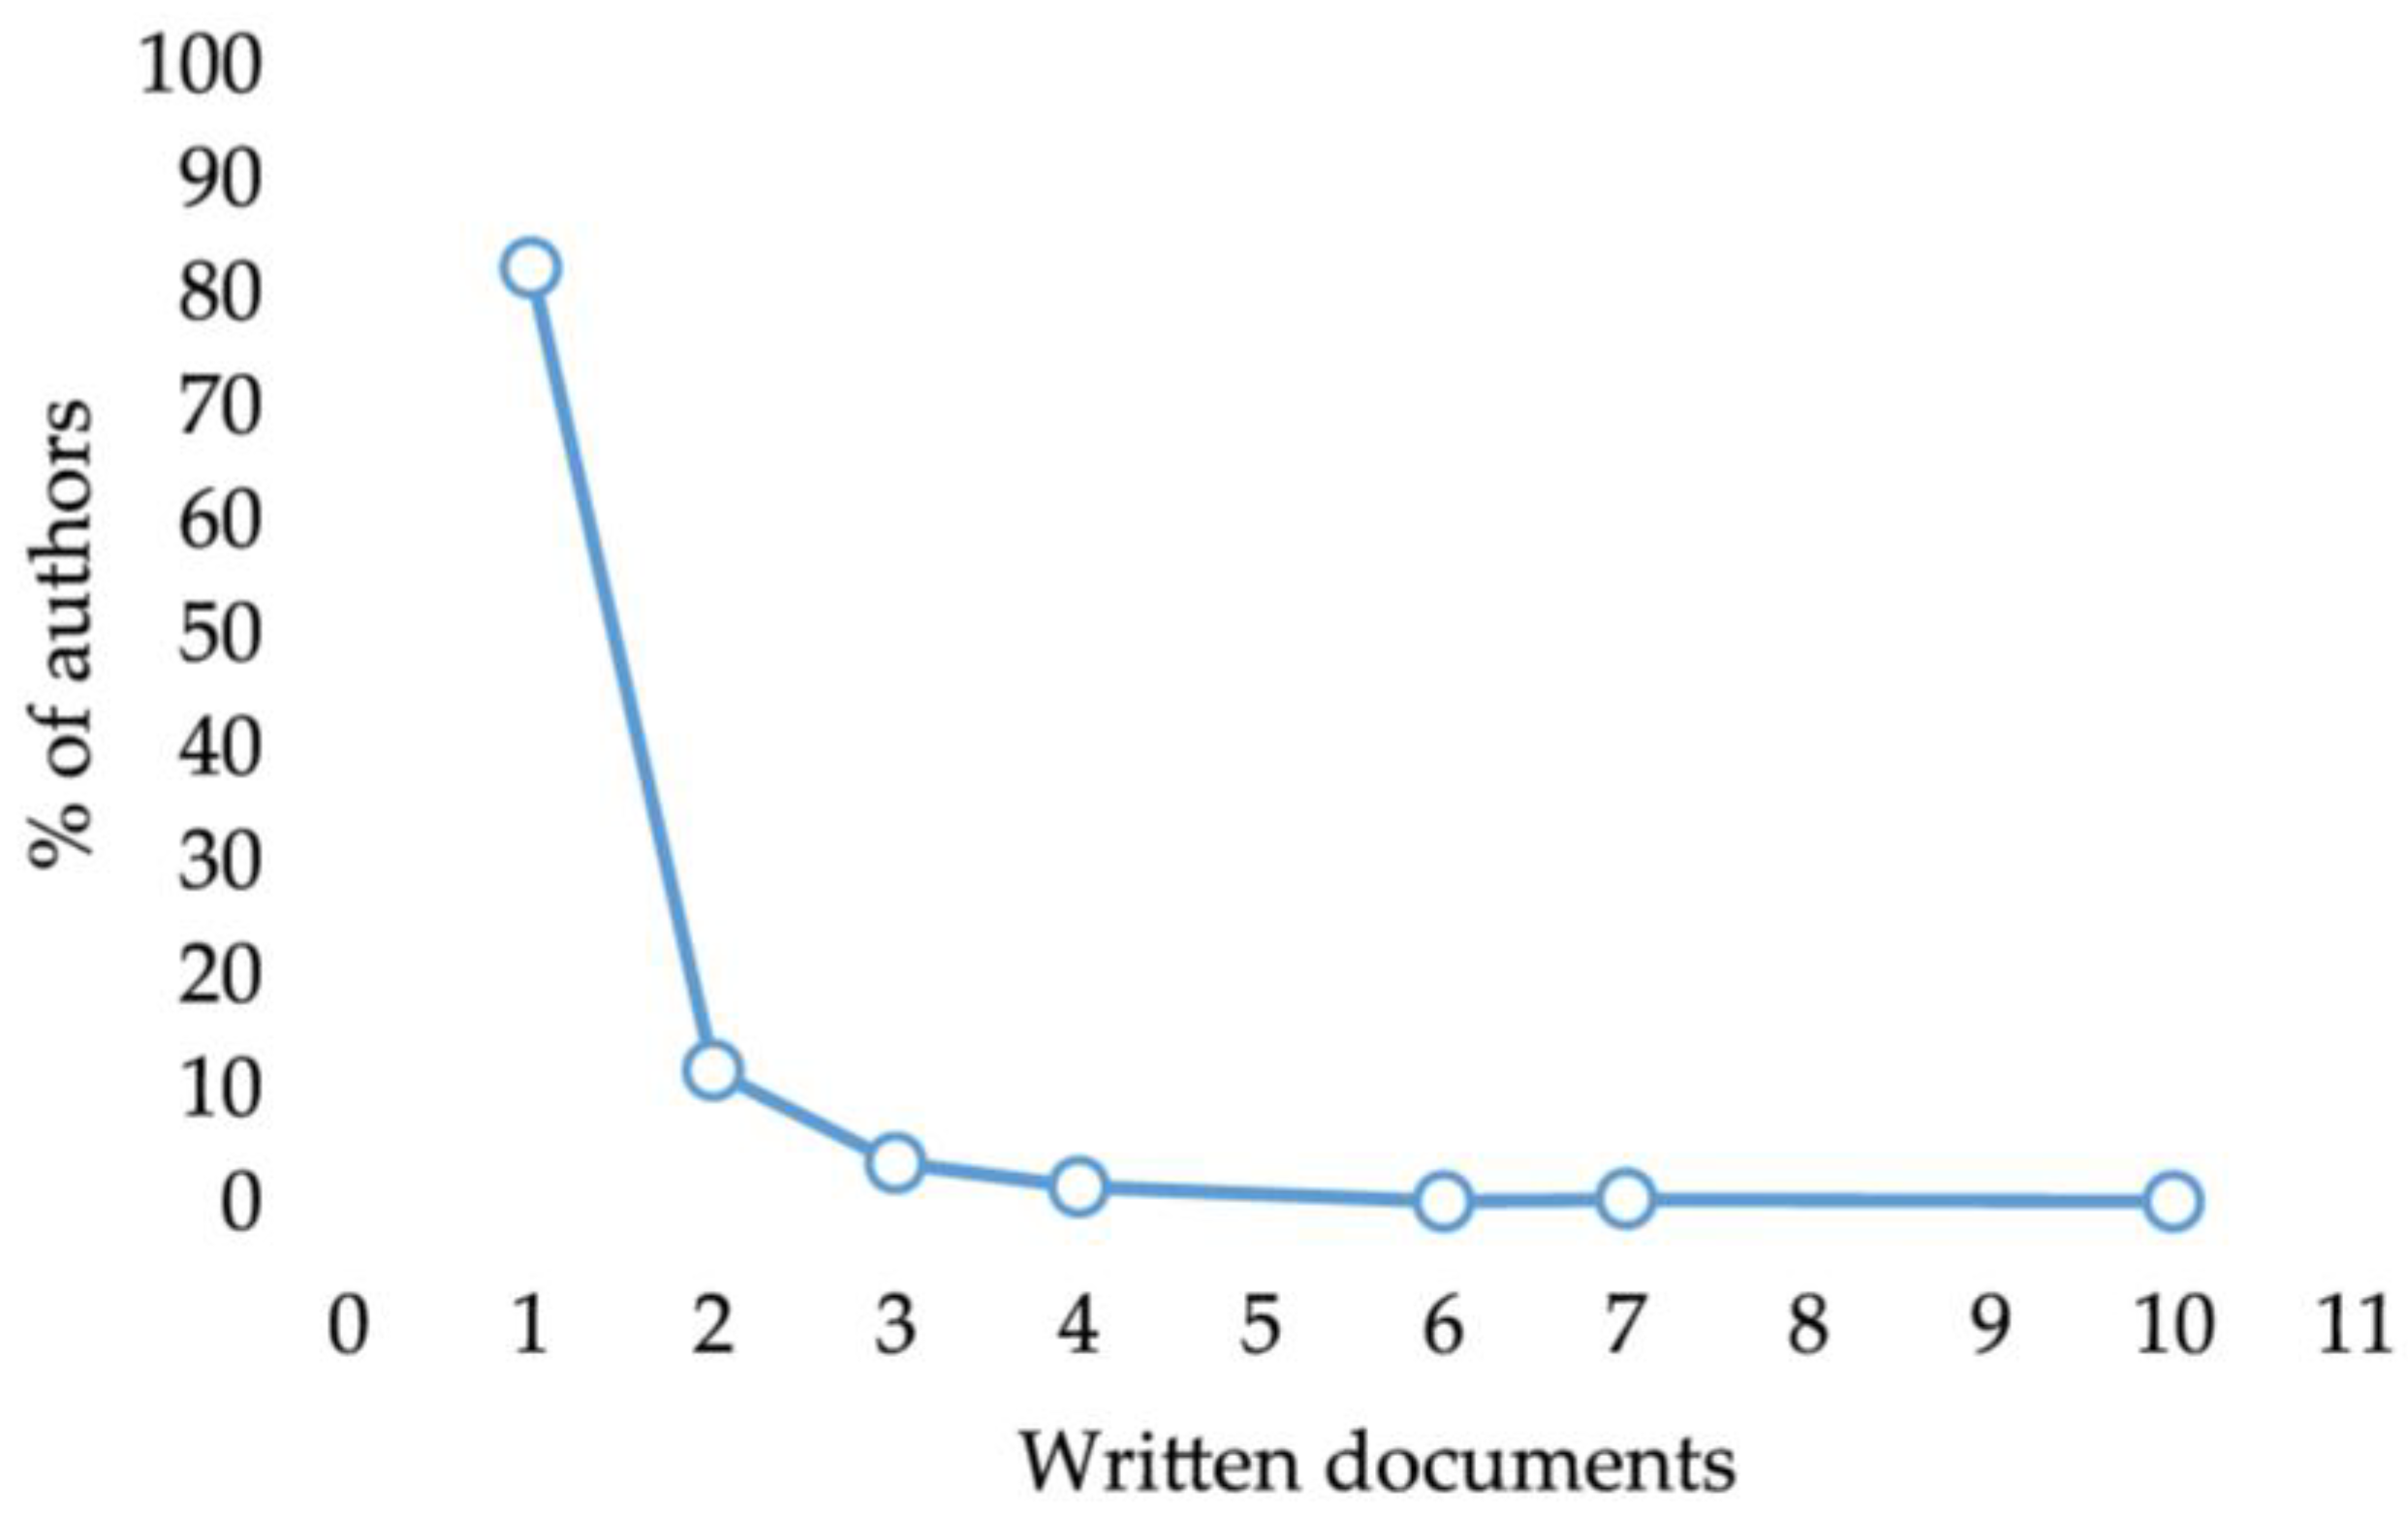
3.2. Lotka’s Law
3.3. Word Occurrences and Walktrap Clustering Algorithm
3.4. Most Relevant Publications
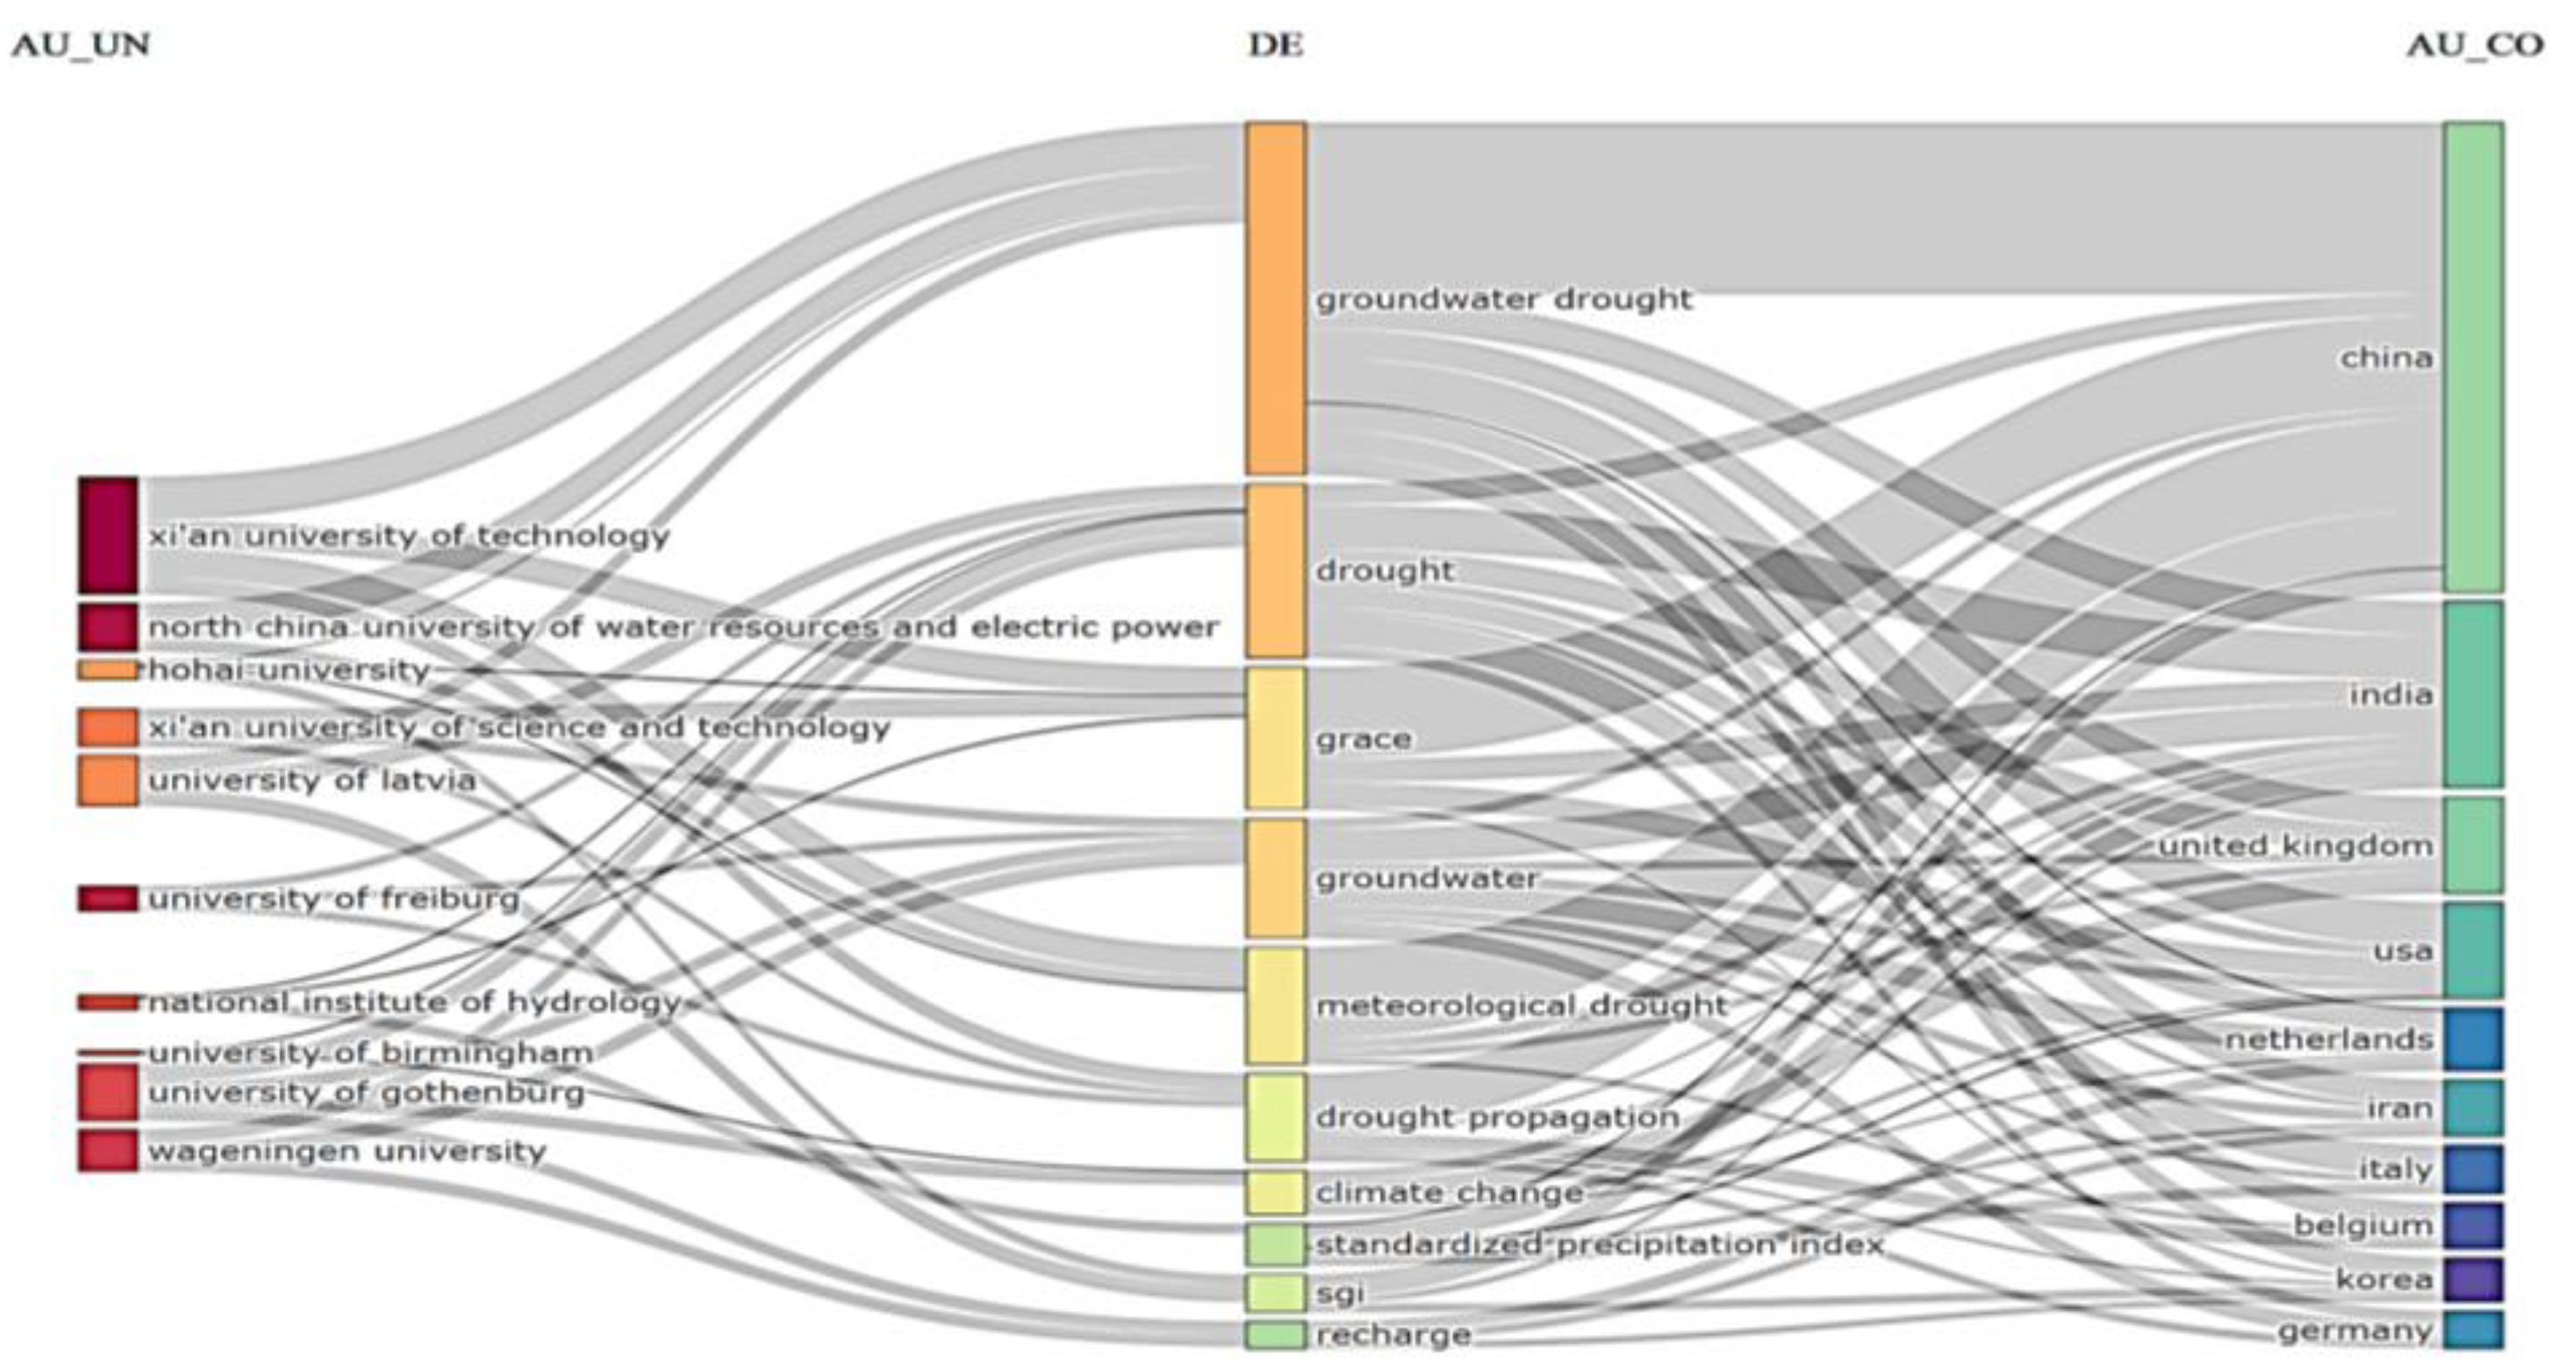
3.5. Analysis of Sankey Diagram
4. Discussion
5. Conclusions
Author Contributions
Funding
Data Availability Statement
Conflicts of Interest
References
- Najmi, A.; Igmoullan, B.; Namous, M.; El Bouazzaoui, I.; Ait-Brahim, Y.; El Khalki, E.M.; Saidi, M.E. Evaluation of PERSIANN-CCS-CDR, ERA5, and SM2RAIN-ASCAT rainfall products for rainfall and drought assessment in a semi-arid watershed, Morocco. J. Water Clim. Change 2023, 14, 1569–1584. [Google Scholar] [CrossRef]
- MacDonald, A.M.; Bonsor, H.C.; Dochartaigh, B.É.Ó.; Taylor, R.G. Quantitative maps of groundwater resources in Africa. Environ. Res. Lett. 2012, 7, 024009. [Google Scholar] [CrossRef]
- Dalin, C.; Wada, Y.; Kastner, T.; Puma, M.J. Groundwater depletion embedded in international food trade. Nature 2017, 543, 700–704. [Google Scholar] [CrossRef]
- El Bouazzaoui, I.; Ait Brahim, Y.; El Khalki, E.M.; Najmi, A.; Bougadir, B. A Summary Analysis of Groundwater Vulnerability to Climate Variability and Anthropic Activities in the Haouz Region, Morocco. Sustainability 2022, 14, 14865. [Google Scholar] [CrossRef]
- Van Lanen, H.; Peters, E. Definition, Effects and Assessment of Groundwater Droughts. In Drought and Drought Mitigation in Europe; Advances in Natural and Technological Hazards, Research; Vogt, J.V., Somna, F., Eds.; Kluwer Academic Publisher: Dordrecht, The Netherlands, 2000. [Google Scholar] [CrossRef]
- Mishra, A.K.; Singh, V.P. A review of drought concepts. J. Hydrol. 2010, 391, 202–216. [Google Scholar] [CrossRef]
- Goodarzi, M.; Heidarpour, M.; Safavi, H. Development of a New Drought Index for Groundwater and Its Application in Sustainable Groundwater Extraction. J. Water Resour. Plan. Manag. 2016, 142, 04016032. [Google Scholar] [CrossRef]
- Bloomfield, J.; Marchant, B. Analysis of groundwater drought building on the standardised precipitation index approach. Hydrol. Earth Syst. Sci. 2013, 17, 4769–4787. [Google Scholar] [CrossRef]
- Rossi, J.B.; Ruhoff, A.; Fleischmann, A.S.; Laipelt, L. Drought Propagation in Brazilian Biomes Revealed by Remote Sensing. Remote Sens. 2023, 15, 454. [Google Scholar] [CrossRef]
- Thomas, B.; Famiglietti, J.; Landerer, F.; Wiese, D.; Molotch, N.; Argus, D. GRACE Groundwater Drought Index: Evaluation of California Central Valley groundwater drought. Remote Sens. Environ. 2017, 198, 384–392. [Google Scholar] [CrossRef]
- Van Loon, A.F.; Van Huijgevoort, M.H.J.; Van Lanen, H.A.J. Evaluation of drought propagation in an ensemble mean of large-scale hydrological models. Hydrol. Earth Syst. Sci. 2012, 16, 4057–4078. [Google Scholar] [CrossRef]
- Peters, E.; Torfs, P.J.J.F.; Van Lanen, H.A.J.; Bier, G. Propagation of drought through groundwater—A new approach using linear reservoir theory. Hydrol. Process. 2003, 17, 3023–3040. [Google Scholar] [CrossRef]
- Hellwig, J.; Liu, Y.; Stahl, K.; Hartmann, A. Drought Propagation in Space and Time: The Role of Groundwater Flows. Environ. Res. Lett. 2022, 17, 094008. [Google Scholar] [CrossRef]
- Bloomfield, J.P.; Marchant, B.P. Analysis of groundwater drought using a variant of the Standardised Precipitation Index. Hydrol. Earth Syst. Sci. Discuss. 2013, 10, 7537–7574. [Google Scholar] [CrossRef]
- Calow, R.C.; Robins, N.S.; Macdonald, A.M.; Macdonald, D.M.J.; Gibbs, B.R.; Orpen, W.R.G.; Mtembezeka, P.; Andrews, A.J.; Appiah, S.O. Groundwater Management in Drought-prone Areas of Africa. Int. J. Water Resour. Dev. 1997, 13, 241–262. [Google Scholar] [CrossRef]
- Crocker, J.; Bartram, J. Comparison and Cost Analysis of Drinking Water Quality Monitoring Requirements versus Practice in Seven Developing Countries. Int. J. Environ. Res. Public Health 2014, 11, 7333–7346. [Google Scholar] [CrossRef]
- Zwerts, J.A.; Stephenson, P.J.; Maisels, F.; Rowcliffe, M.; Astaras, C.; Jansen, P.A.; van der Waarde, J.; Sterck, L.E.H.M.; Verweij, P.A.; Bruce, T.; et al. Methods for wildlife monitoring in tropical forests: Comparing human observations, camera traps, and passive acoustic sensors. Conserv. Sci. Pract. 2021, 3, e568. [Google Scholar] [CrossRef]
- Prabhakar, K.; Rama, S.V. Implications of Regional Droughts and Transboundary Drought Risks on Drought Monitoring and Early Warning: A Review. Climate 2022, 10, 124. [Google Scholar] [CrossRef]
- Gullacher, A.; Allen, D.M.; Goetz, J.D. Early Warning Indicators of Groundwater Drought in Mountainous Regions. Water Resour. Res. 2023, 59, e2022WR033399. [Google Scholar] [CrossRef]
- Guler, A.T.; Waaijer, C.J.F.; Mohammed, Y.; Palmblad, M. Automating bibliometric analyses using Taverna scientific workflows: A tutorial on integrating Web Services. J. Informetr. 2016, 10, 830–841. [Google Scholar] [CrossRef]
- Rostaing, H. La Bibliométrie et Ses Techniques; Outils et méthodes; Sciences de la Société; Centre de Recherche Rétrospective de Marseille: Marseille, France, 1996; ISBN 1168-1446. [Google Scholar]
- Moppett, I.K.; Hardman, J.G. Bibliometrics of anaesthesia researchers in the UK. BJA Br. J. Anaesth. 2011, 107, 351–356. [Google Scholar] [CrossRef][Green Version]
- Jeanneaux, P.; Aznar, O.; Mareschal, S.D. Une analyse bibliométrique pour éclairer la mise à l’agenda scientifique des «services environnementaux». VertigO 2012, 12, 3. [Google Scholar] [CrossRef]
- Aria, M.; Cuccurullo, C. bibliometrix: An R-tool for comprehensive science mapping analysis. J. Informetr. 2017, 11, 959–975. [Google Scholar] [CrossRef]
- Lamhour, O.; Safaa, L.; Perkumienė, D. What Does the Concept of Resilience in Tourism Mean in the Time of COVID-19? Results of a Bibliometric Analysis. Sustainability 2023, 15, 9797. [Google Scholar] [CrossRef]
- Wang, L.; Stuart, M.E.; Bloomfield, J.P.; Butcher, A.S.; Gooddy, D.C.; McKenzie, A.A.; Lewis, M.A.; Williams, A.T. Prediction of the arrival of peak nitrate concentrations at the water table at the regional scale in Great Britain. Hydrol. Process. 2012, 26, 226–239. [Google Scholar] [CrossRef]
- Adisa, O.M.; Masinde, M.; Botai, J.O.; Botai, C.M. Bibliometric Analysis of Methods and Tools for Drought Monitoring and Prediction in Africa. Sustainability 2020, 12, 6516. [Google Scholar] [CrossRef]
- Yildirim, G.; Rahman, A.; Singh, V.P. A Bibliometric Analysis of Drought Indices, Risk, and Forecast as Components of Drought Early Warning Systems. Water 2022, 14, 253. [Google Scholar] [CrossRef]
- De Natale, F.; Alilla, R.; Parisse, B.; Nardi, P. A bibliometric analysis on drought and heat indices in agriculture. Agric. For. Meteorol. 2023, 341, 109626. [Google Scholar] [CrossRef]
- Ma, Q.; Zhang, Y. Global Research Trends and Hotspots on Submarine Groundwater Discharge (SGD): A Bibliometric Analysis. Int. J. Environ. Res. Public Health 2020, 17, 830. [Google Scholar] [CrossRef]
- Cobo, M.; López-Herrera, A.G.; Herrera-Viedma, E.; Herrera, F. SciMAT: A new science mapping analysis software tool. J. Am. Soc. Inf. Sci. Technol. 2012, 63, 1609–1630. [Google Scholar] [CrossRef]
- Mokhnacheva, Y.V.; Tsvetkova, V.A. Development of Bibliometrics as a Scientific Field. Sci. Tech. Inf. Proc. 2020, 47, 158–163. [Google Scholar] [CrossRef]
- Kalantari, A.; Kamsin, A.; Kamaruddin, H.S.; Ale Ebrahim, N.; Gani, A.; Ebrahimi, A.; Shamshirband, S. A bibliometric approach to tracking big data research trends. J. Big Data 2017, 4, 30. [Google Scholar] [CrossRef]
- Gutiérrez-Salcedo, M.; Martínez, M.Á.; Moral-Munoz, J.A.; Herrera-Viedma, E.; Cobo, M.J. Some bibliometric procedures for analyzing and evaluating research fields. Appl. Intell. 2018, 48, 1275–1287. [Google Scholar] [CrossRef]
- Krishnappa, M.; Khandelwal, J. A Bibliometric Study on Bioinformatics: An Analytical Study. Int. J. Res. Libr. Sci. 2022, 8, 83. [Google Scholar] [CrossRef]
- Havemann, F.; Scharnhorst, A. Bibliometric Networks. arXiv 2012, arXiv:1212.5211. [Google Scholar]
- Leydesdorff, L. On the Normalization and Visualization of Author Co-Citation Data: Salton’s Cosine versus the Jaccard Index. J. Am. Soc. Inf. Sci. Technol. 2008, 59, 77–85. [Google Scholar] [CrossRef]
- Burnham, J.F. Scopus database: A review. Biomed. Digit. Libr. 2006, 3, 1. [Google Scholar] [CrossRef]
- Haunschild, R.; Bornmann, L.; Marx, W. Climate Change Research in View of Bibliometrics. PLoS ONE 2016, 11, e0160393. [Google Scholar] [CrossRef] [PubMed]
- Cooper, I.D. Bibliometrics basics. J. Med. Libr. Assoc. 2015, 103, 217–218. [Google Scholar] [CrossRef]
- Zhang, J.; Yu, Q.; Zheng, F.; Long, C.; Lu, Z.; Duan, Z. Comparing keywords plus of WOS and author keywords: A case study of patient adherence research. J. Assoc. Inf. Sci. Technol. 2016, 67, 967–972. [Google Scholar] [CrossRef]
- Ali, J.; Jusoh, A.; Idris, N.; Airij, A.G.; Chandio, R. Wearable Devices in Healthcare Services. Bibliometrix Analysis by using R Package. Int. J. Online Biomed. Eng. 2022, 18, 61–86. [Google Scholar] [CrossRef]
- Kumar, A.; Mohindra, R. Bibliometric Analysis on Knowledge Management Research. Int. J. Inf. Dissem. Technol. 2015, 5, 106–113. [Google Scholar]
- Kushairi, N.; Ahmi, A. Flipped classroom in the second decade of the Millenia: A Bibliometrics analysis with Lotka’s law. Educ. Inf. Technol. 2021, 26, 4401–4431. [Google Scholar] [CrossRef]
- Patra, S.K.; Bhattacharya, P.; Verma, N. Bibliometric Study of Literature on Bibliometrics. DESIDOC Bull. Inf. Technol. 2006, 26, 27–32. [Google Scholar] [CrossRef]
- Friedman, A. The Power of Lotka’s Law through the Eyes of R. Rom. Stat. Rev. 2015, 63, 69–77. [Google Scholar]
- Guo, X. A Bibliometric Analysis of Child Language during 1900–2021. Front. Psychol. 2022, 13, 862042. [Google Scholar] [CrossRef] [PubMed]
- Pons, P.; Latapy, M. Computing communities in large networks using random walks. J. Graph Algorithms Appl. 2006, 10, 191–218. [Google Scholar] [CrossRef]
- Samadbeik, M.; Bastani, P.; Fatehi, F. Bibliometric analysis of COVID-19 publications shows the importance of telemedicine and equitable access to the internet during the pandemic and beyond. Health Inf. Libr. J. 2022, 40, 390–399. [Google Scholar] [CrossRef]
- Alfonzo, P.; Sakraida, T.; Hastings-Tolsma, M. Bibliometrics: Visualizing the Impact of Nursing Research. Online J. Nurs. Inform. OJNI 2014, 18, 1. [Google Scholar]
- Bloomfield, J.P.; Marchant, B.P.; Bricker, S.H.; Morgan, R.B. Regional analysis of groundwater droughts using hydrograph classification. Hydrol. Earth Syst. Sci. 2015, 19, 4327–4344. [Google Scholar] [CrossRef]
- Bloomfield, J.P.; Williams, R.J.; Gooddy, D.C.; Cape, J.N.; Guha, P. Impacts of climate change on the fate and behaviour of pesticides in surface and groundwater—A UK perspective. Sci. Total Environ. 2006, 369, 163–177. [Google Scholar] [CrossRef]
- Bloomfield, J.P.; Williams, A.T. An empirical liquid permeability—Gas permeability correlation for use in aquifer properties studies. Q. J. Eng. Geol. Hydrogeol. 1995, 28, S143–S150. [Google Scholar] [CrossRef]
- Van Loon, A.F.; Van Lanen, H.A.J. A process-based typology of hydrological drought. Hydrol. Earth Syst. Sci. 2012, 16, 1915–1946. [Google Scholar] [CrossRef]
- Van Loon, A.F.; Van Lanen, H.A.J. Making the distinction between water scarcity and drought using an observation-modeling framework. Water Resour. Res. 2013, 49, 1483–1502. [Google Scholar] [CrossRef]
- Van Loon, A.F. Hydrological drought explained. WIREs Water 2015, 2, 359–392. [Google Scholar] [CrossRef]
- Van Loon, A.F.; Laaha, G. Hydrological drought severity explained by climate and catchment characteristics. J. Hydrol. 2015, 526, 3–14. [Google Scholar] [CrossRef]
- Van Loon, A.F.; Gleeson, T.; Clark, J.; Van Dijk, A.I.; Stahl, K.; Hannaford, J.; Di Baldassarre, G.; Teuling, A.J.; Tallaksen, L.M.; Uijlenhoet, R. Drought in the Anthropocene. Nat. Geosci. 2016, 9, 89–91. [Google Scholar] [CrossRef]
- Van Loon, A.F.; Stahl, K.; Di Baldassarre, G.; Clark, J.; Rangecroft, S.; Wanders, N.; Gleeson, T.; Van Dijk, A.I.; Tallaksen, L.M.; Hannaford, J. Drought in a human-modified world: Reframing drought definitions, understanding, and analysis approaches. Hydrol. Earth Syst. Sci. 2016, 20, 3631–3650. [Google Scholar] [CrossRef]
- Van Loon, A.F.; Tijdeman, E.; Wanders, N.; Van Lanen, H.A.J.; Teuling, A.J.; Uijlenhoet, R. How climate seasonality modifies drought duration and deficit. J. Geophys. Res. Atmos. 2014, 119, 4640–4656. [Google Scholar] [CrossRef]
- Marchant, B.P.; Norbury, J.; Sherratt, J.A. Travelling wave solutions to a haptotaxis-dominated model of malignant invasion. Nonlinearity 2001, 14, 1653. [Google Scholar] [CrossRef]
- Marchant, B.P. Time–frequency analysis for biosystems engineering. Biosyst. Eng. 2003, 85, 261–281. [Google Scholar] [CrossRef]
- Van Lanen, H.A.; Wanders, N.; Tallaksen, L.M.; Van Loon, A.F. Hydrological drought across the world: Impact of climate and physical catchment structure. Hydrol. Earth Syst. Sci. 2013, 17, 1715–1732. [Google Scholar] [CrossRef]
- Li, B.; Rodell, M.; Beaudoing, H.; Getirana, A.; Zaitchik, B.; Goncalves, L.; Cossetin, C.; Bhanja, S.; Mukherjee, A.; Tian, S.; et al. Global GRACE Data Assimilation for Groundwater and Drought Monitoring: Advances and Challenges. Water Resour. Res. 2019, 55, 7564–7586. [Google Scholar] [CrossRef]
- Li, B.; Rodell, M.; Zaitchik, B.F.; Reichle, R.H.; Koster, R.D.; van Dam, T.M. Assimilation of GRACE terrestrial water storage into a land surface model: Evaluation and potential value for drought monitoring in western and central Europe. J. Hydrol. 2012, 446, 103–115. [Google Scholar] [CrossRef]
- Li, B.; Rodell, M. Evaluation of a model-based groundwater drought indicator in the conterminous U.S. J. Hydrol. 2015, 526, 78–88. [Google Scholar] [CrossRef]
- Li, B.; Rodell, M. Spatial variability and its scale dependency of observed and modeled soil moisture over different climate regions. Hydrol. Earth Syst. Sci. 2013, 17, 1177–1188. [Google Scholar] [CrossRef]
- Li, B.; Rodell, M.; Sheffield, J.; Wood, E.; Sutanudjaja, E. Long-term, non-anthropogenic groundwater storage changes simulated by three global-scale hydrological models. Sci. Rep. 2019, 9, 10746. [Google Scholar] [CrossRef] [PubMed]
- Li, B.; Rodell, M.; Famiglietti, J.S. Groundwater variability across temporal and spatial scales in the central and northeastern US. J. Hydrol. 2015, 525, 769–780. [Google Scholar] [CrossRef]
- Li, B.; Toll, D.; Zhan, X.; Cosgrove, B. Improving estimated soil moisture fields through assimilation of AMSR-E soil moisture retrievals with an ensemble Kalman filter and a mass conservation constraint. Hydrol. Earth Syst. Sci. 2012, 16, 105–119. [Google Scholar] [CrossRef]
- Hannah, D.M.; Demuth, S.; van Lanen, H.A.; Looser, U.; Prudhomme, C.; Rees, G.; Stahl, K.; Tallaksen, L.M. Large-scale river flow archives: Importance, current status and future needs. Hydrol. Process. 2011, 25, 1191–1200. [Google Scholar] [CrossRef]
- Shamsudduha, M.; Taylor, R.G. Groundwater storage dynamics in the world’s large aquifer systems from GRACE: Uncertainty and role of extreme precipitation. Earth Syst. Dyn. 2020, 11, 755–774. [Google Scholar] [CrossRef]
- Shahid, S.; Hazarika, M. Groundwater Drought in the Northwestern Districts of Bangladesh. Water Resour. Manag. 2010, 24, 1989–2006. [Google Scholar] [CrossRef]
- Balacco, G.; Alfio, M.R.; Fidelibus, M.D. Groundwater Drought Analysis under Data Scarcity: The Case of the Salento Aquifer (Italy). Sustainability 2022, 14, 707. [Google Scholar] [CrossRef]
- Hong, T.; Heo, Y. Spatio-temporal data analysis for development of microclimate prediction models. In Proceedings of the 2021 Building Simulation Conference, Bruges, Belgium, 1 September 2021. [Google Scholar]
- Tuygun, G.T.; Salgut, S.; Elçi, A. Long-term spatial-temporal monitoring of eutrophication in Lake Burdur using remote sensing data. Water Sci. Technol. 2023, 87, 2184–2194. [Google Scholar] [CrossRef]
- Seo, K.-W.; Wilson, C.R.; Famiglietti, J.S.; Chen, J.L.; Rodell, M. Terrestrial water mass load changes from Gravity Recovery and Climate Experiment (GRACE). Water Resour. Res. 2006, 42, 5. [Google Scholar] [CrossRef]
- Rodell, M.; Famiglietti, J.S. An analysis of terrestrial water storage variations in Illinois with implications for the Gravity Recovery and Climate Experiment (GRACE). Water Resour. Res. 2001, 37, 1327–1339. [Google Scholar] [CrossRef]
- Kumar, S.V.; Zaitchik, B.F.; Peters-Lidard, C.D.; Rodell, M.; Reichle, R.; Li, B.; Jasinski, M.; Mocko, D.; Getirana, A.; De Lannoy, G. Assimilation of gridded GRACE terrestrial water storage estimates in the North American Land Data Assimilation System. J. Hydrometeorol. 2016, 17, 1951–1972. [Google Scholar] [CrossRef]
- Ouma, Y.O.; Aballa, D.O.; Marinda, D.O.; Tateishi, R.; Hahn, M. Use of GRACE time-variable data and GLDAS-LSM for estimating groundwater storage variability at small basin scales: A case study of the Nzoia River Basin. Int. J. Remote Sens. 2015, 36, 5707–5736. [Google Scholar] [CrossRef]
- Nie, W.; Zaitchik, B.F.; Rodell, M.; Kumar, S.V.; Arsenault, K.R.; Li, B.; Getirana, A. Assimilating GRACE Into a Land Surface Model in the Presence of an Irrigation-Induced Groundwater Trend. Water Resour. Res. 2019, 55, 11274–11294. [Google Scholar] [CrossRef]
- Huang, J.; Cao, L.; Wang, L.; Liu, L.; Yu, B.; Han, L. Identification and Spatiotemporal Migration Analysis of Groundwater Drought Events in the North China Plain. Atmosphere 2023, 14, 961. [Google Scholar] [CrossRef]
- Zhu, R.; Zheng, H.; Jakeman, A.J.; Chiew, F.H.S. Multi-timescale Performance of Groundwater Drought in Connection with Climate. Water Resour. Manag. 2023, 37, 3599–3614. [Google Scholar] [CrossRef]
- Wang, F.; Wang, Z.; Yang, H.; Di, D.; Zhao, Y.; Liang, Q. Utilizing GRACE-based groundwater drought index for drought characterization and teleconnection factors analysis in the North China Plain. J. Hydrol. 2020, 585, 124849. [Google Scholar] [CrossRef]
- Dharpure, J.K.; Goswami, A.; Patel, A.; Kulkarni, A.V.; Meloth, T. Drought characterization using the Combined Terrestrial Evapotranspiration Index over the Indus, Ganga and Brahmaputra river basins. Geocarto Int. 2022, 37, 1059–1083. [Google Scholar] [CrossRef]
- Nigatu, Z.M.; Fan, D.; You, W.; Melesse, A.M.; Pu, L.; Yang, X.; Wan, X.; Jiang, Z. Soil Moisture and Groundwater Depletion Causes and Impact in the Nile River Basin Based on Multi-Source Satellite and Hydrological Data. 2021. Available online: https://papers.ssrn.com/abstract=3977570 (accessed on 30 January 2024).


| Description | Results |
|---|---|
| Timespan | 1989 to 5 August 2023 |
| Sources (Journals, Books, etc.) | 76 |
| Documents | 151 |
| Annual Growth Rate % | 7.01 |
| Document Average Age | 5.41 |
| Average Citations Per Doc | 22.38 |
| References | 7586 |
| Keywords Plus | 1085 |
| Author’s Keywords | 385 |
| Authors | 469 |
| Authors of Single-Authored Docs | 7 |
| Single-Authored Docs | 7 |
| Co-Authors Per Doc | 4.01 |
| International Co-Authorships % | 22.52 |
| Element | Publisher | h_ Index | g_ Index | m_ Index | TC 1 | NP 2 | PY_ Start 3 |
|---|---|---|---|---|---|---|---|
| Journal of Hydrology | Elsevier | 11 | 17 | 0.48 | 494 | 17 | 2001 |
| Hydrology and Earth System Sciences | European Geosciences Union (EGU) | 11 | 13 | 0.92 | 876 | 13 | 2012 |
| Hydrogeology Journal | Springer | 2 | 6 | 0.18 | 69 | 6 | 2013 |
| Sustainability (Switzerland) | MDPI (Multidisciplinary Digital Publishing Institute) | 5 | 5 | 0.83 | 65 | 5 | 2018 |
| Water (Switzerland) | MDPI (Multidisciplinary Digital Publishing Institute) | 4 | 5 | 0.5 | 58 | 5 | 2016 |
| Water Resources Management | Springer | 4 | 5 | 0.28 | 184 | 5 | 2010 |
| Rank | Authors | Field | Affiliation | h_ Index | g_ Index | m_ Index | TC | NP | PY_ Start |
|---|---|---|---|---|---|---|---|---|---|
| 1 | JP Bloomfield [8,14,51,52,53] | Groundwater science | British Geological Survey, Nottingham, United Kingdom. | 8 | 10 | 0.381 | 473 | 10 | 2003 |
| 2 | AF Van Loon [11,54,55,56,57,58,59,60] | Drought Risk | Institute for Environmental Studies, Vrije Universiteit Amsterdam, Netherlands. | 6 | 7 | 0.5 | 438 | 7 | 2012 |
| 3 | BP Marchant [61,62] | Statistics | British Geological Survey, Nottingham, United Kingdom. | 5 | 7 | 0.455 | 396 | 7 | 2013 |
| 4 | HAJ Van Lanen [5,63] | Environmental Sciences | Wageningen University and Research. | 5 | 6 | 0.217 | 329 | 6 | 2001 |
| 5 | B Li 1 [64,65,66,67,68,69,70] | Hydrological Sciences | Earth System Science Interdisciplinary Center, University of Maryland. | 2 | 2 | 0.222 | 254 | 2 | 2015 |
| DM Hannah 2 [71] | Physical geography | University of Birmingham, UK. | 4 | 4 | 1 | 59 | 4 | 2020 |
| Rank | Title | Authors | Year | Source | Total Citations | TC per Year |
|---|---|---|---|---|---|---|
| 1 | “Analysis of Groundwater Drought Building on the Standardised Precipitation Index Approach.” [8] | JP Bloomfield and BP Marchant | 2013 | Hydrology and Earth System Sciences | 234 | 21.27 |
| 2 | “A Process-Based Typology of Hydrological Drought.” [54] | AF Van Loon and HAJ Van Lanen | 2012 | Hydrology and Earth System Sciences | 222 | 18.50 |
| 3 | “GRACE Groundwater Drought Index: Evaluation of California Central Valley groundwater drought.” [10] | BF Thomas et al. | 2017 | Remote Sensing of Environment | 162 | 23.14 |
| 4 | “Global GRACE Data Assimilation for Groundwater andDrought Monitoring: Advances and Challenges.” [64] | B Li et al. | 2019 | Water Resources Research | 154 | 30.80 |
| 5 | “Groundwater Drought in the Northwestern Districts of Bangladesh.” [73] | S Shahid et M.K Hazarika | 2010 | Water Resources Management | 154 | 11.00 |
Disclaimer/Publisher’s Note: The statements, opinions and data contained in all publications are solely those of the individual author(s) and contributor(s) and not of MDPI and/or the editor(s). MDPI and/or the editor(s) disclaim responsibility for any injury to people or property resulting from any ideas, methods, instructions or products referred to in the content. |
© 2024 by the authors. Licensee MDPI, Basel, Switzerland. This article is an open access article distributed under the terms and conditions of the Creative Commons Attribution (CC BY) license (https://creativecommons.org/licenses/by/4.0/).
Share and Cite
El Bouazzaoui, I.; Lamhour, O.; Ait Brahim, Y.; Najmi, A.; Bougadir, B. Three Decades of Groundwater Drought Research: Evolution and Trends. Water 2024, 16, 743. https://doi.org/10.3390/w16050743
El Bouazzaoui I, Lamhour O, Ait Brahim Y, Najmi A, Bougadir B. Three Decades of Groundwater Drought Research: Evolution and Trends. Water. 2024; 16(5):743. https://doi.org/10.3390/w16050743
Chicago/Turabian StyleEl Bouazzaoui, Imane, Oumaima Lamhour, Yassine Ait Brahim, Adam Najmi, and Blaïd Bougadir. 2024. "Three Decades of Groundwater Drought Research: Evolution and Trends" Water 16, no. 5: 743. https://doi.org/10.3390/w16050743
APA StyleEl Bouazzaoui, I., Lamhour, O., Ait Brahim, Y., Najmi, A., & Bougadir, B. (2024). Three Decades of Groundwater Drought Research: Evolution and Trends. Water, 16(5), 743. https://doi.org/10.3390/w16050743