

Micro-Catchments, Macro Effects: Natural Water Retention Measures in the Kylldal Catchment, Germany

 ,
,
Abstract
1. Introduction
2. Methods
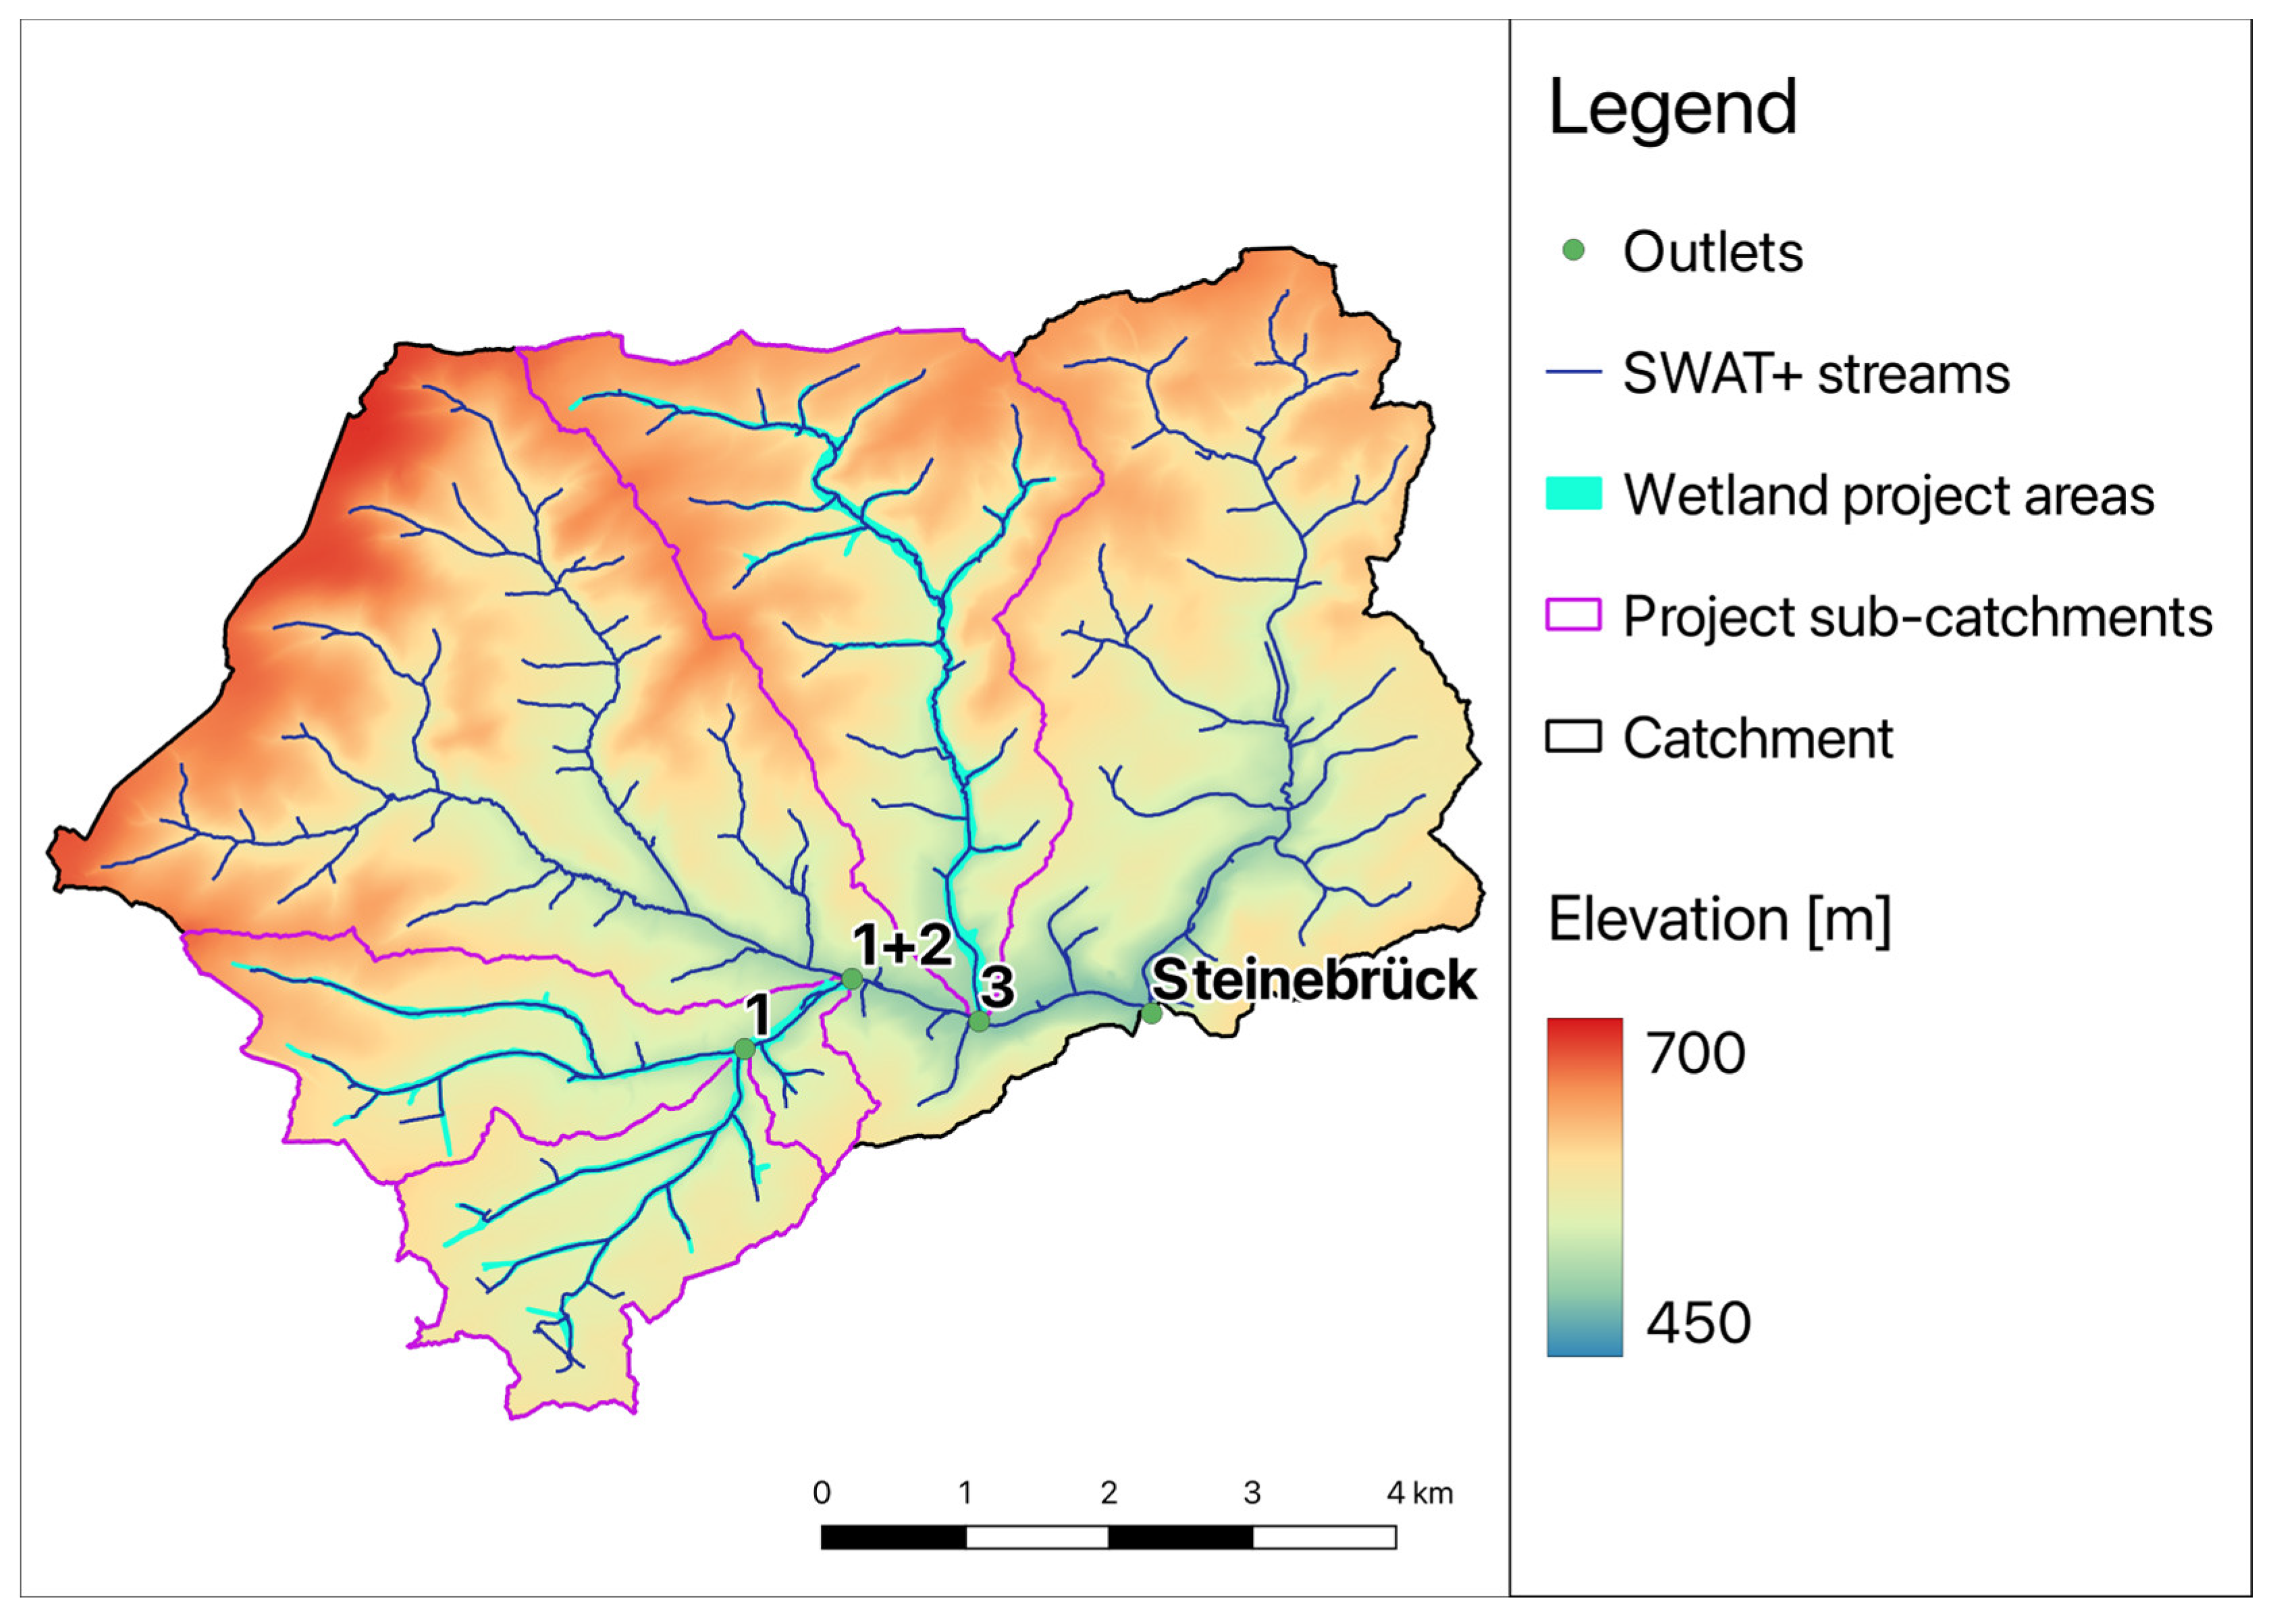
2.1. Study Area
2.1.1. Elevation and Slope
2.1.2. Soil Data
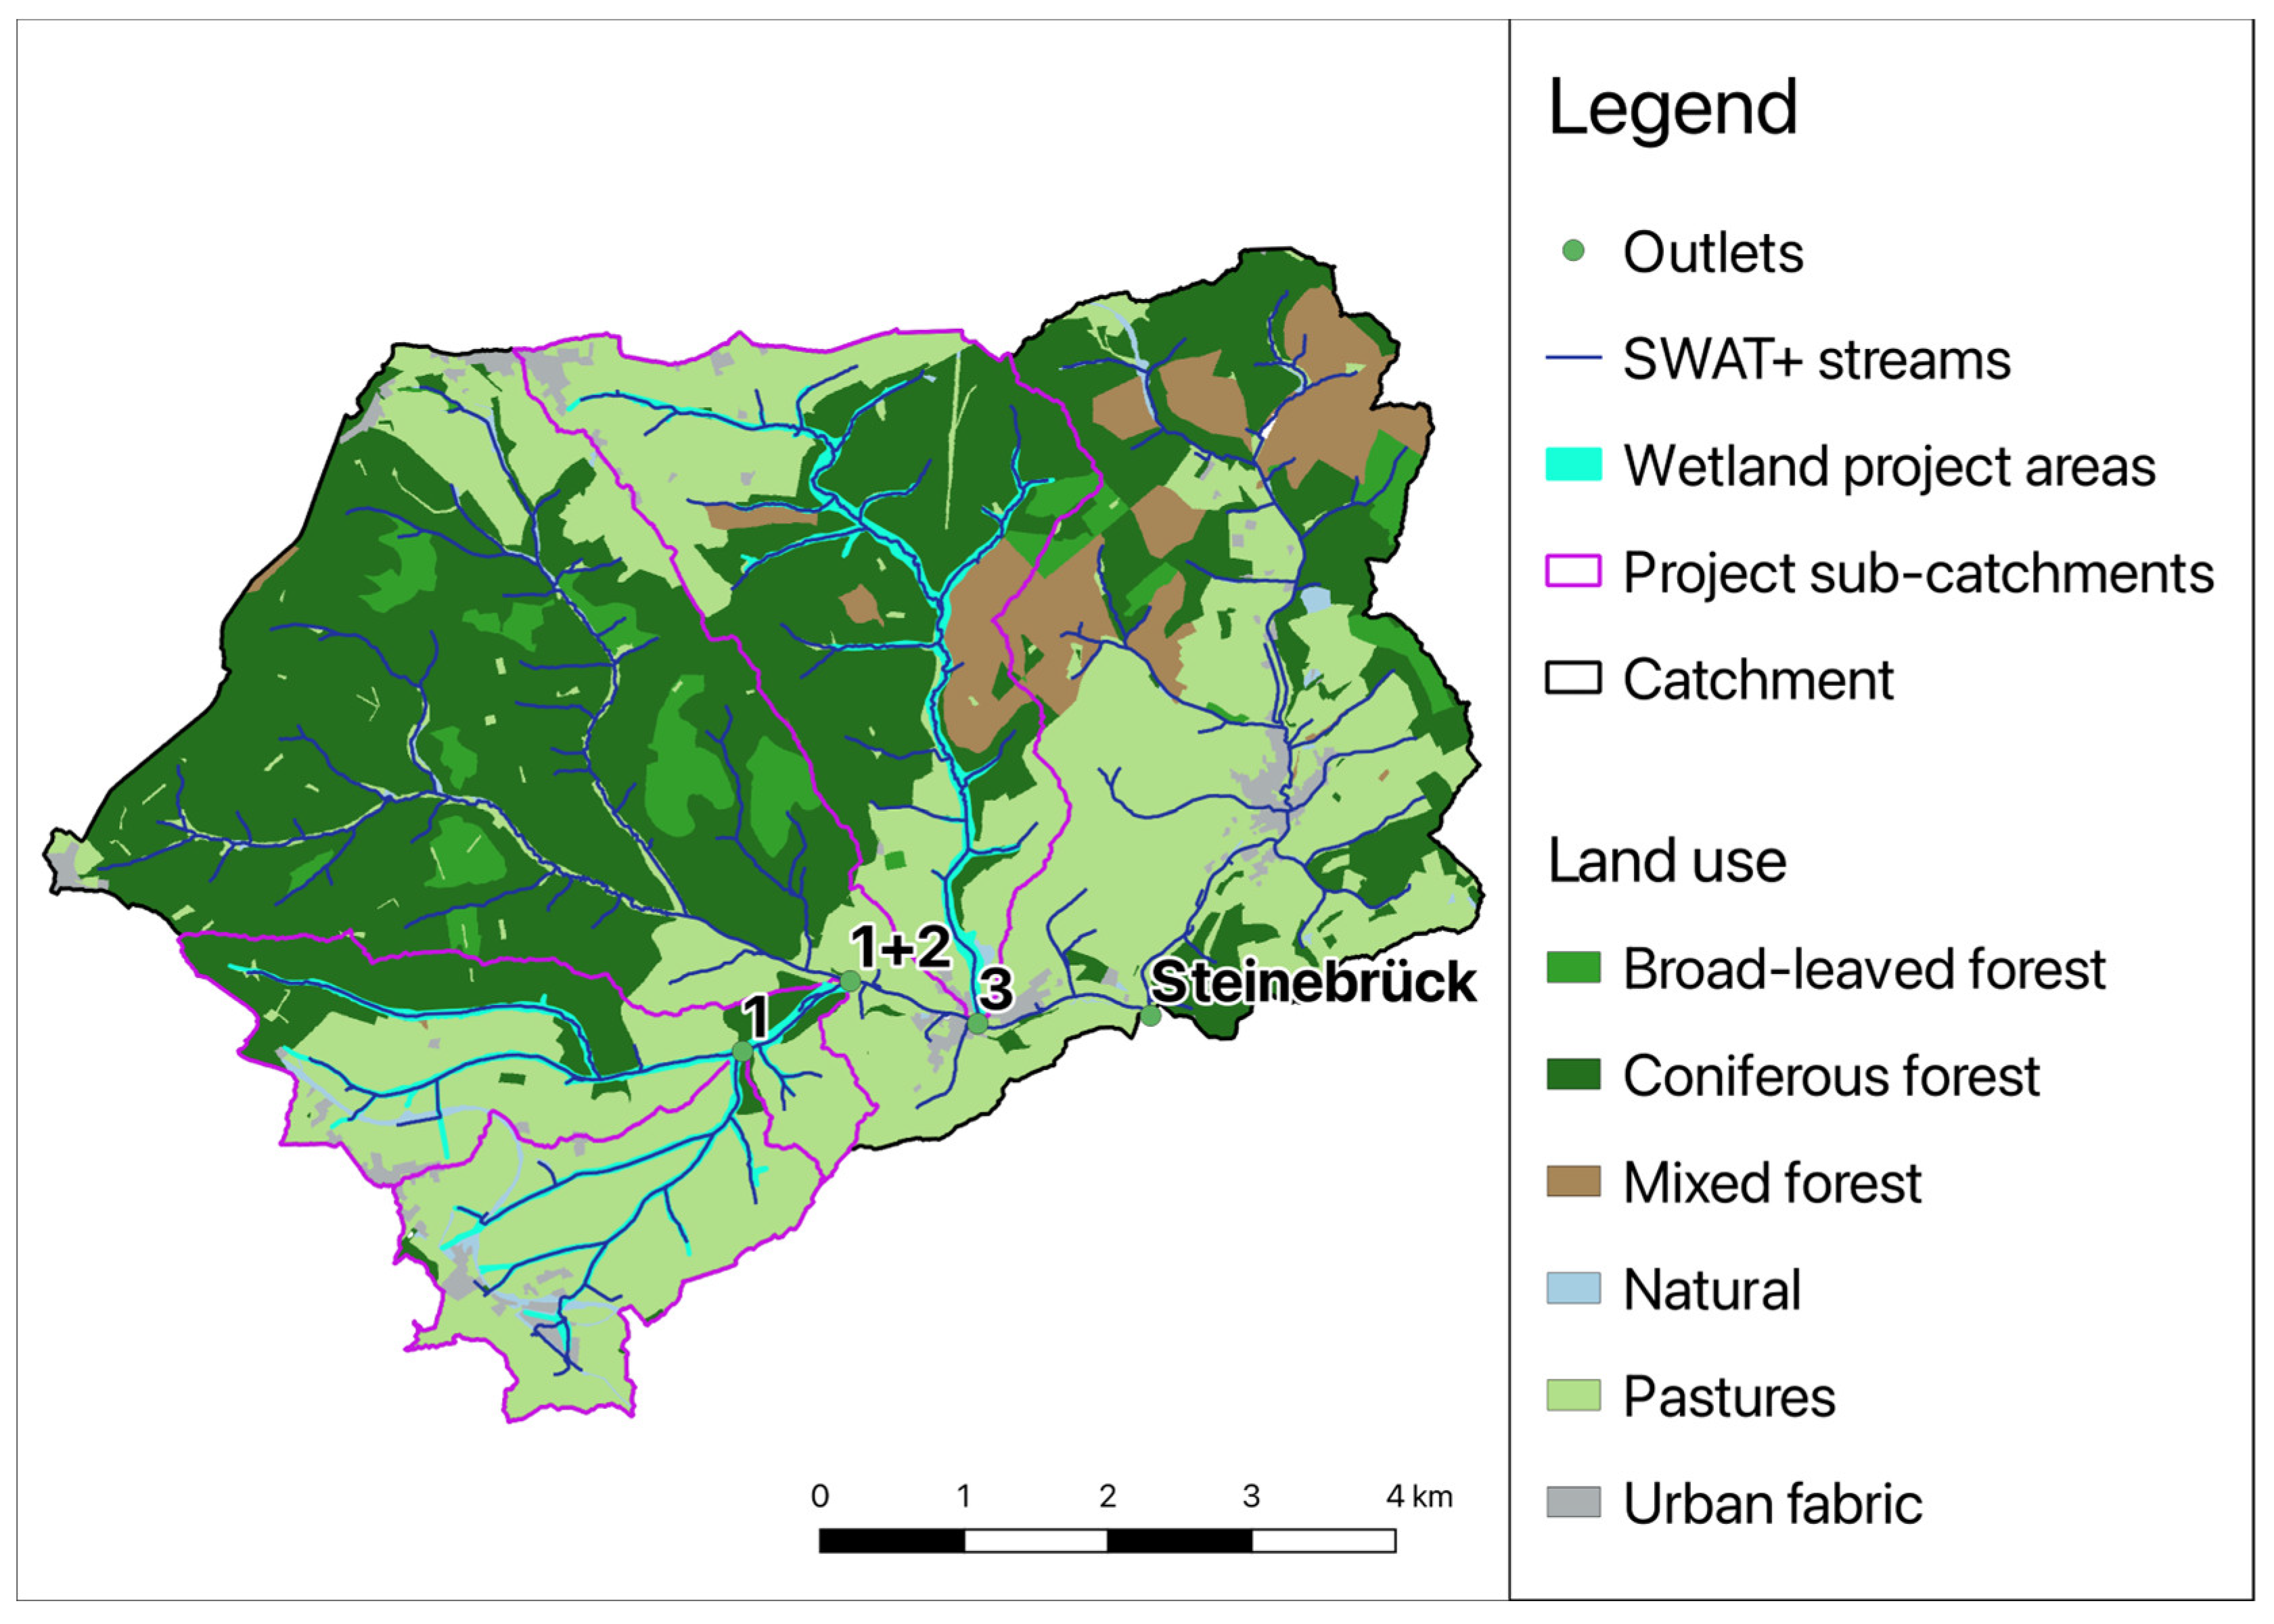
2.1.3. Land Use
2.1.4. Meteorology
2.1.5. Manure and Fertiliser Use
2.2. Model
2.2.1. SWAT+ Model Set-Up
2.2.2. Model Calibration
3. Results
3.1. Model Calibration and Validation
3.2. Hydrological Effects
3.2.1. Annual Water Balance
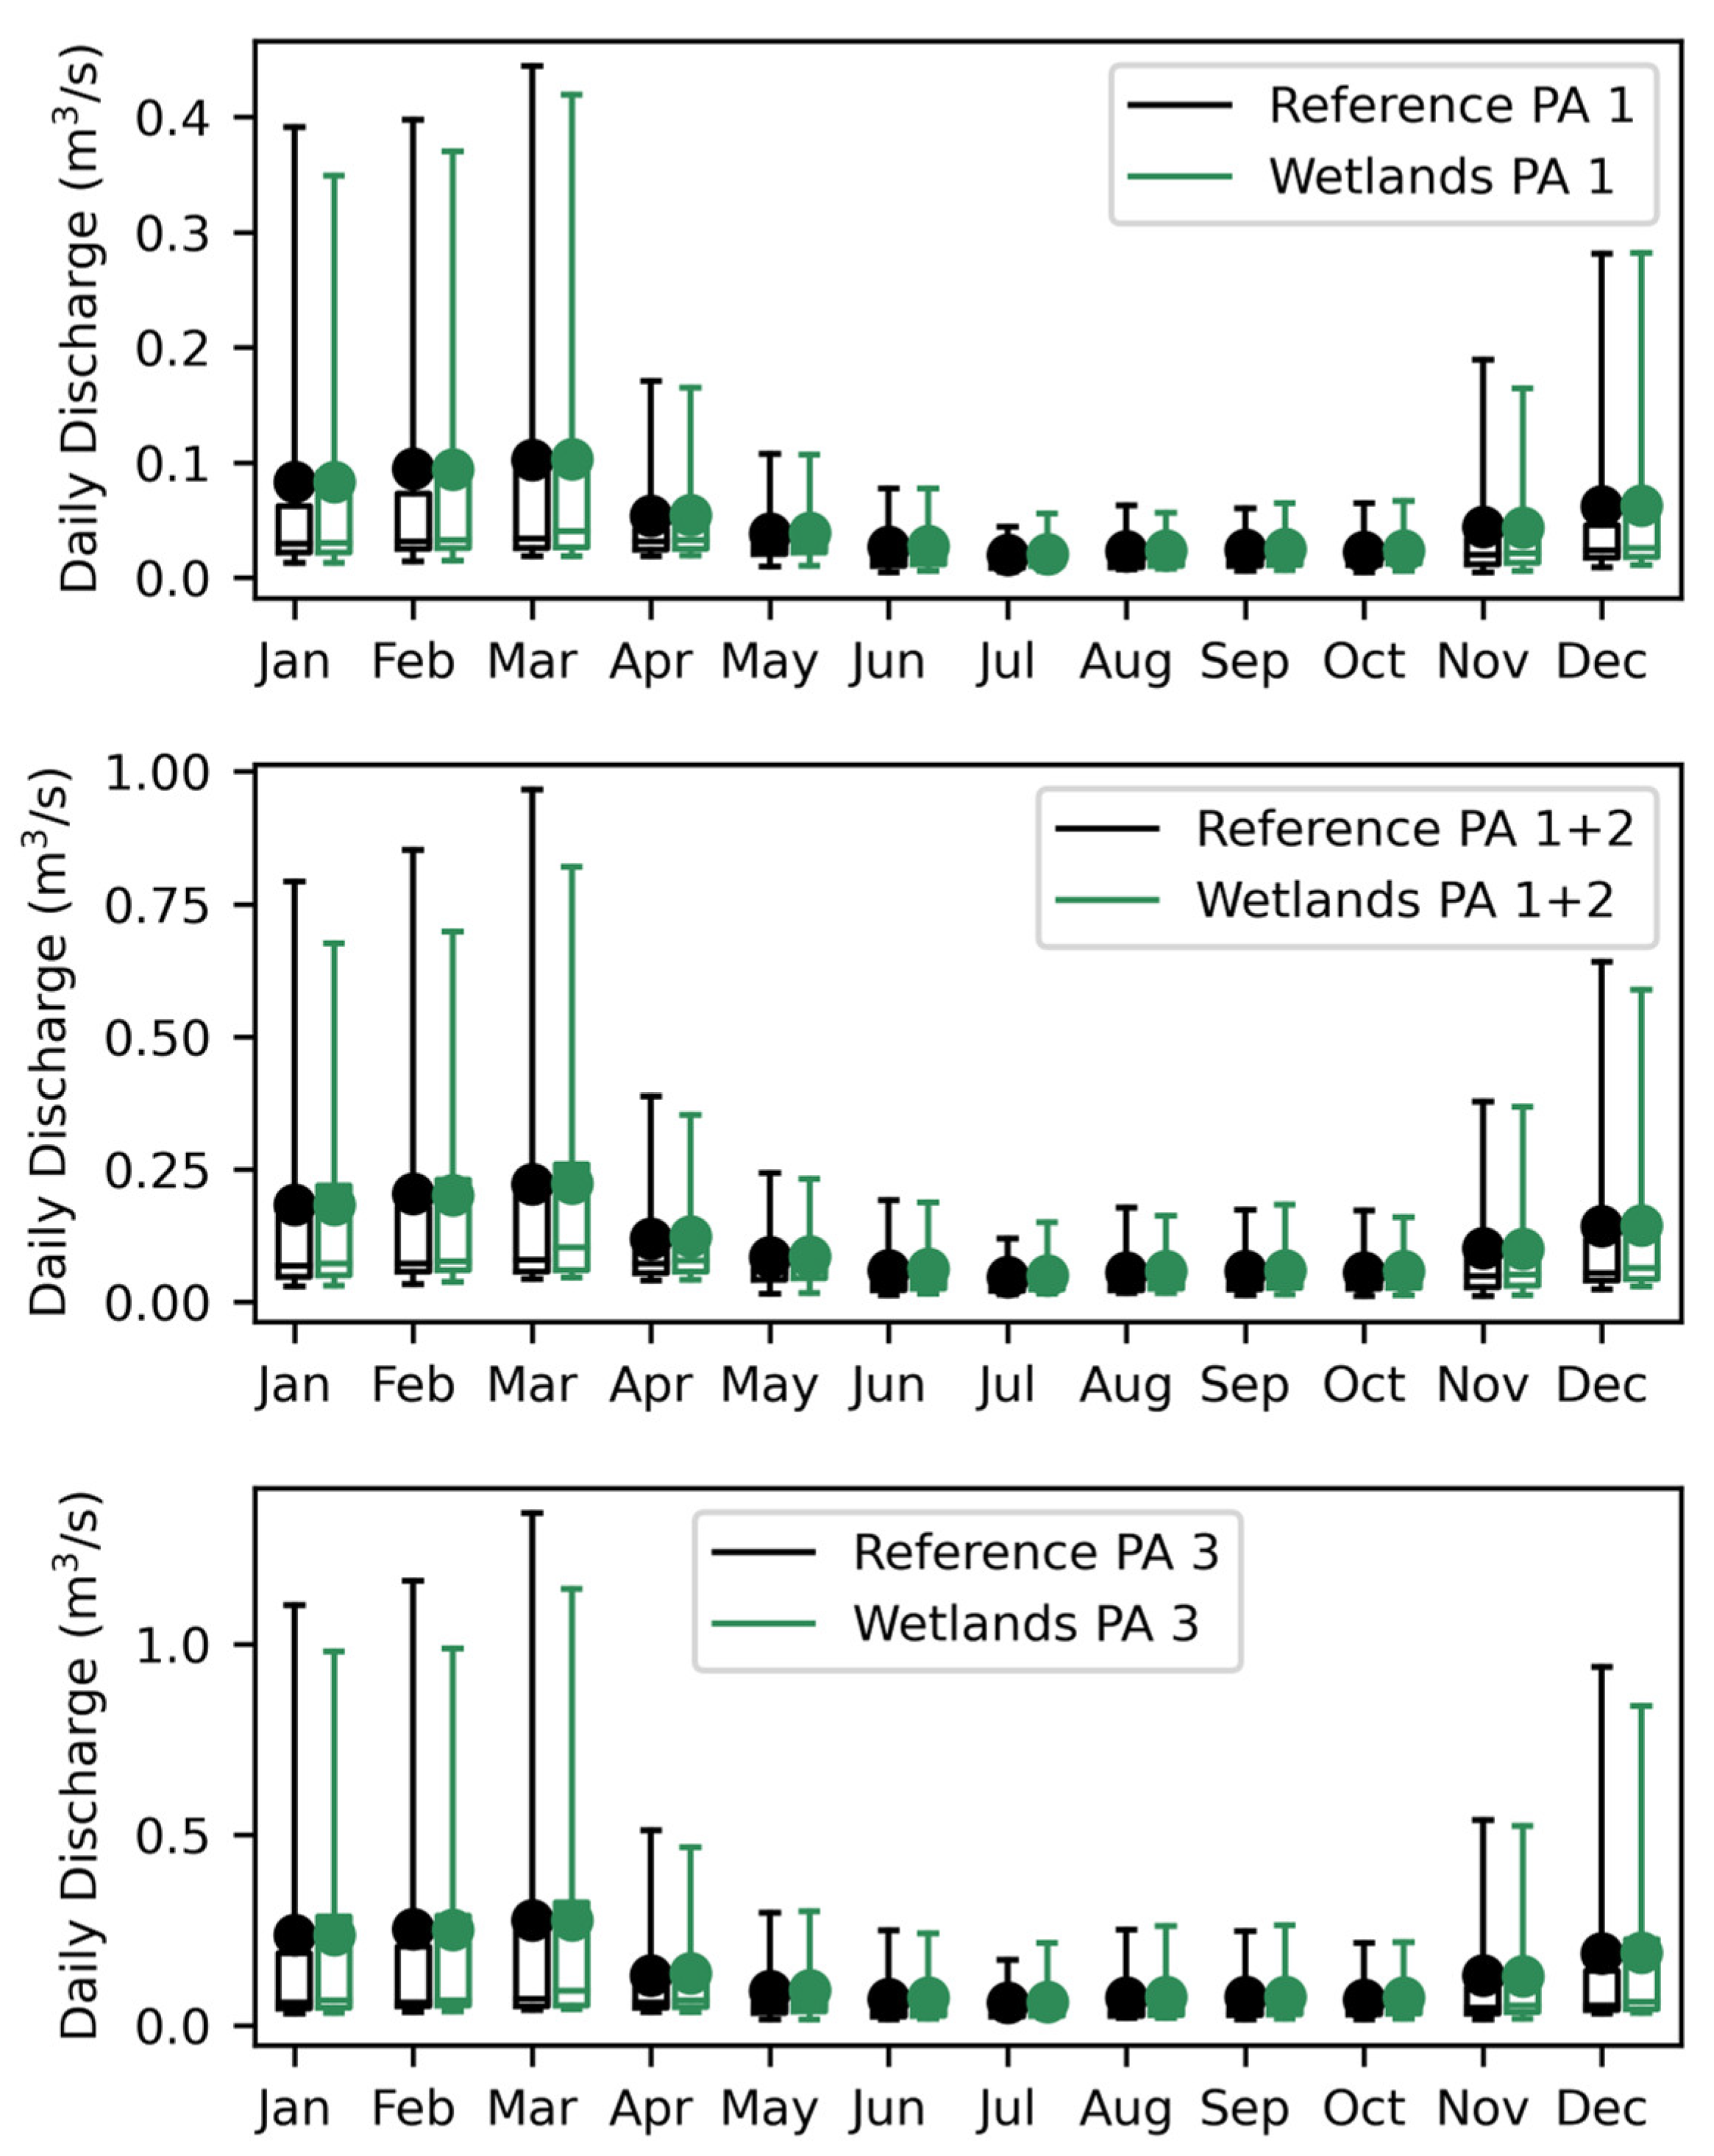
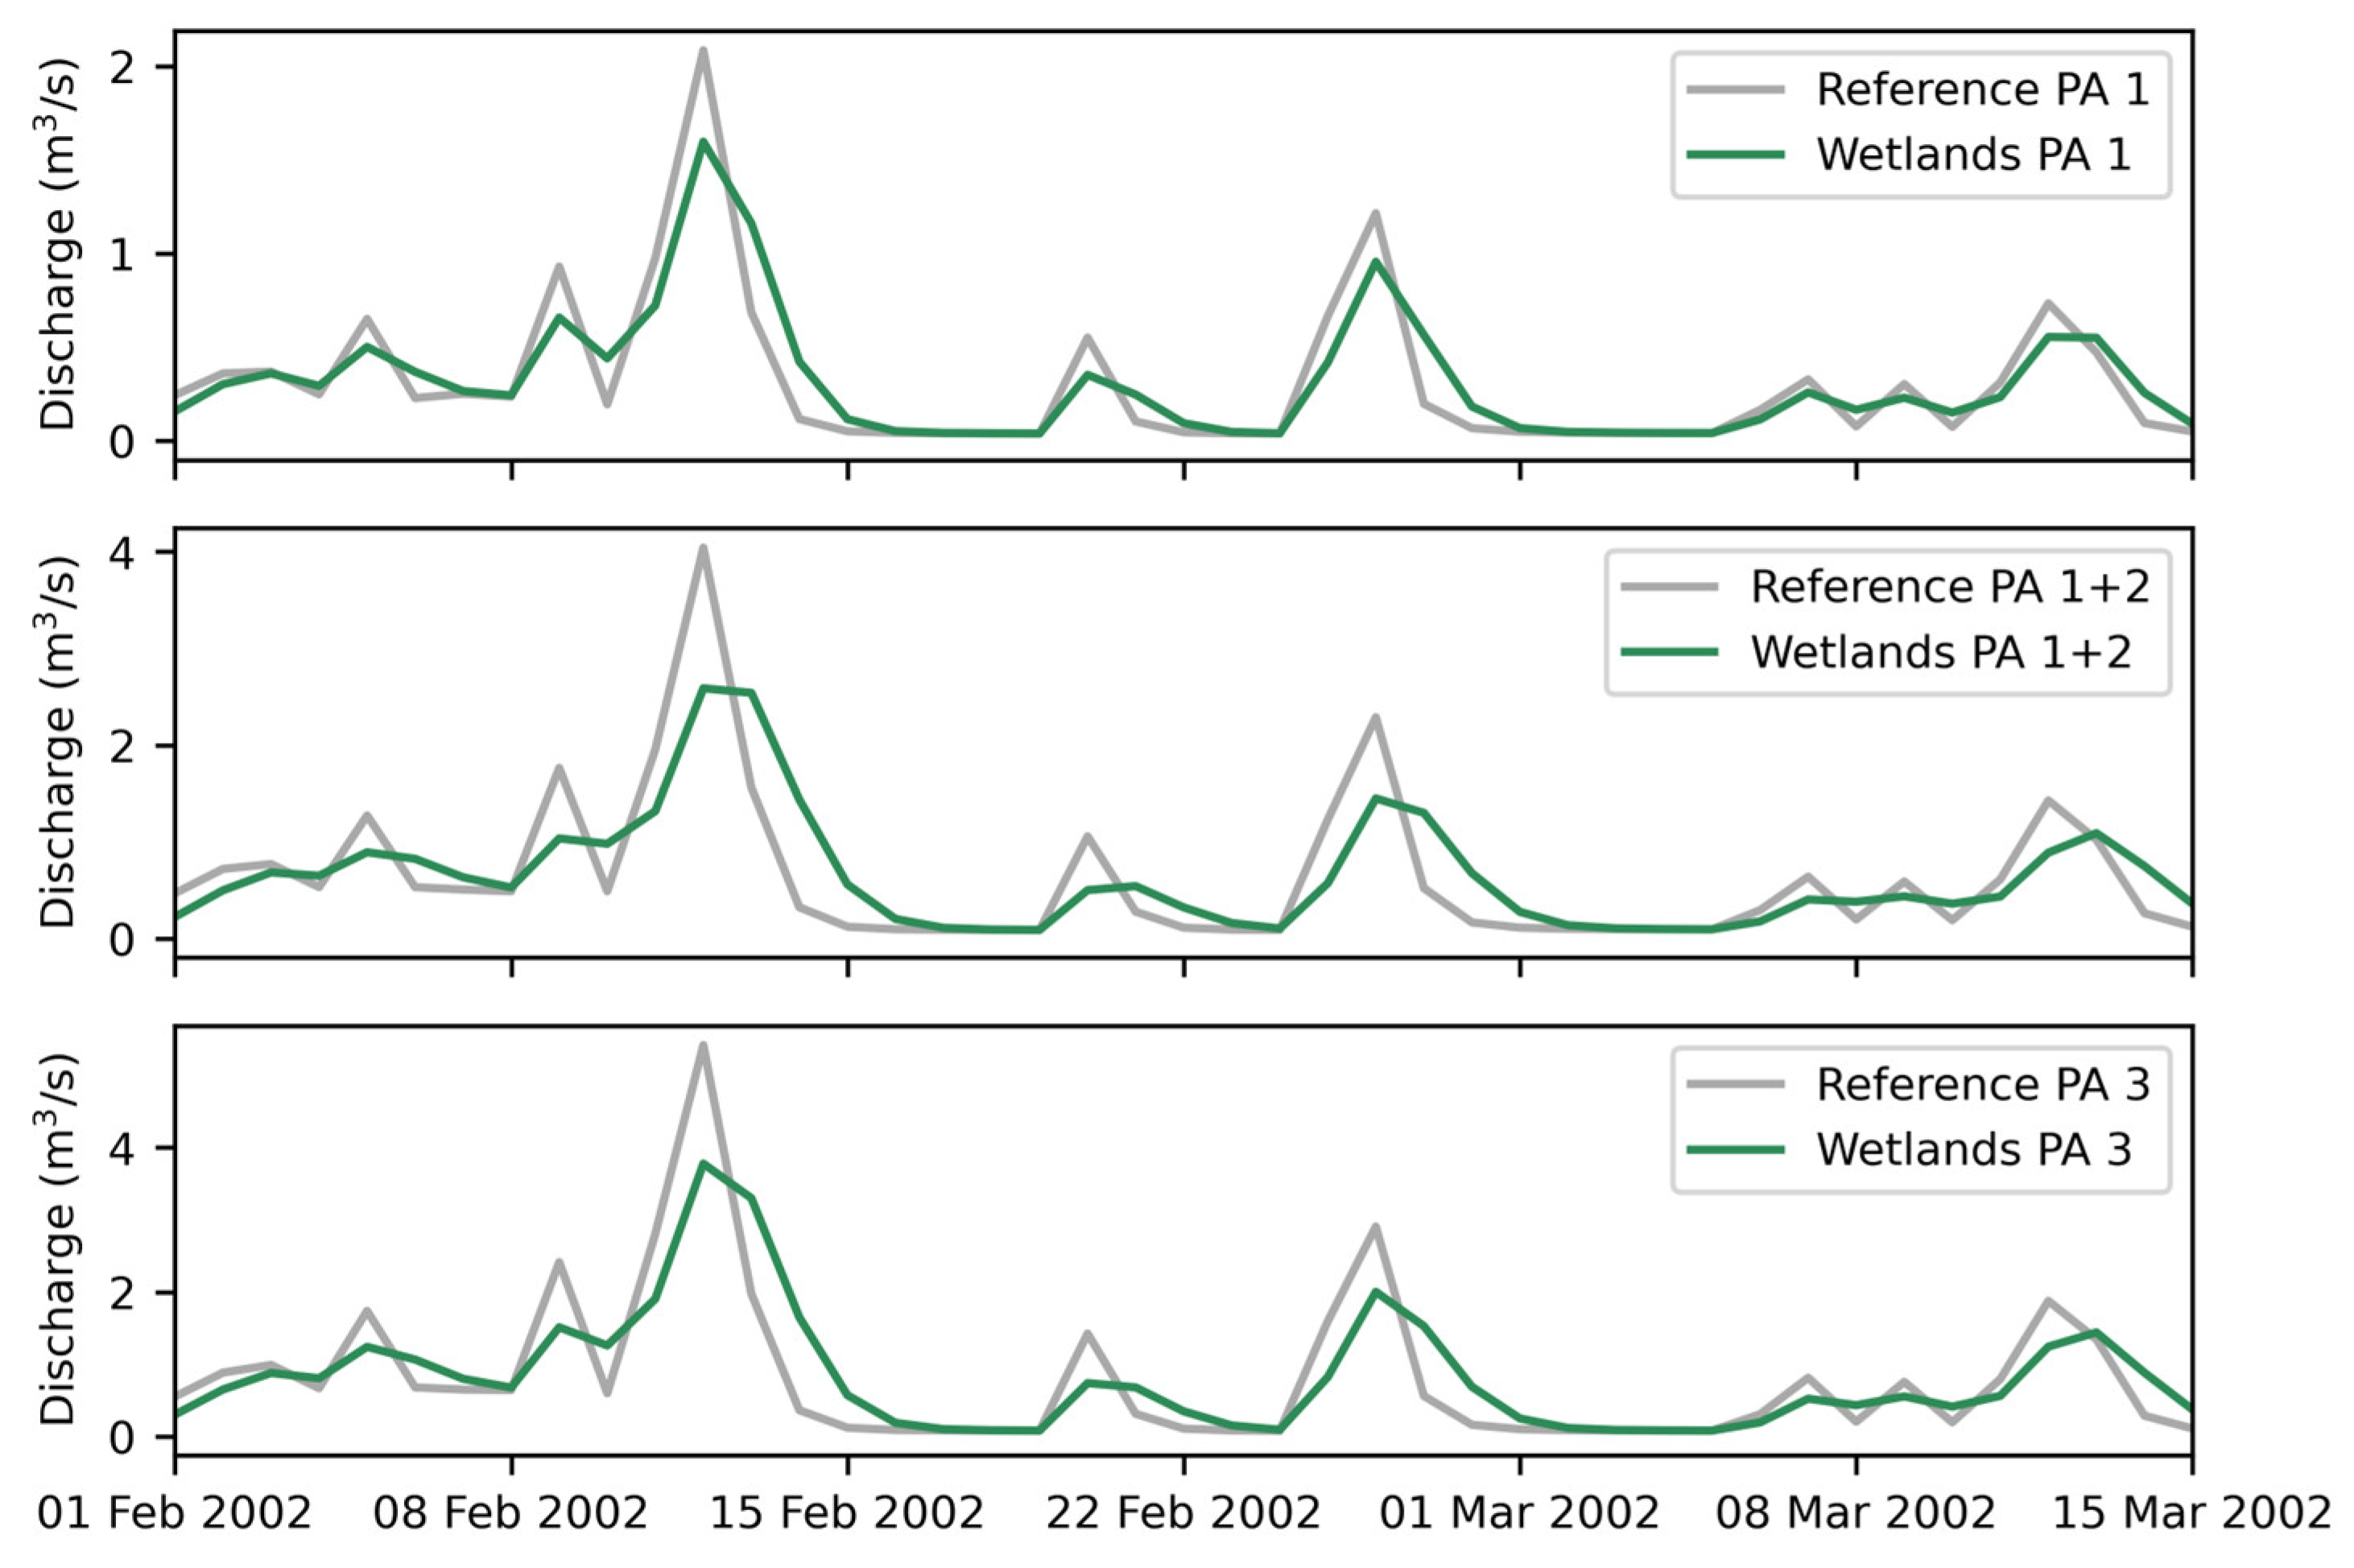
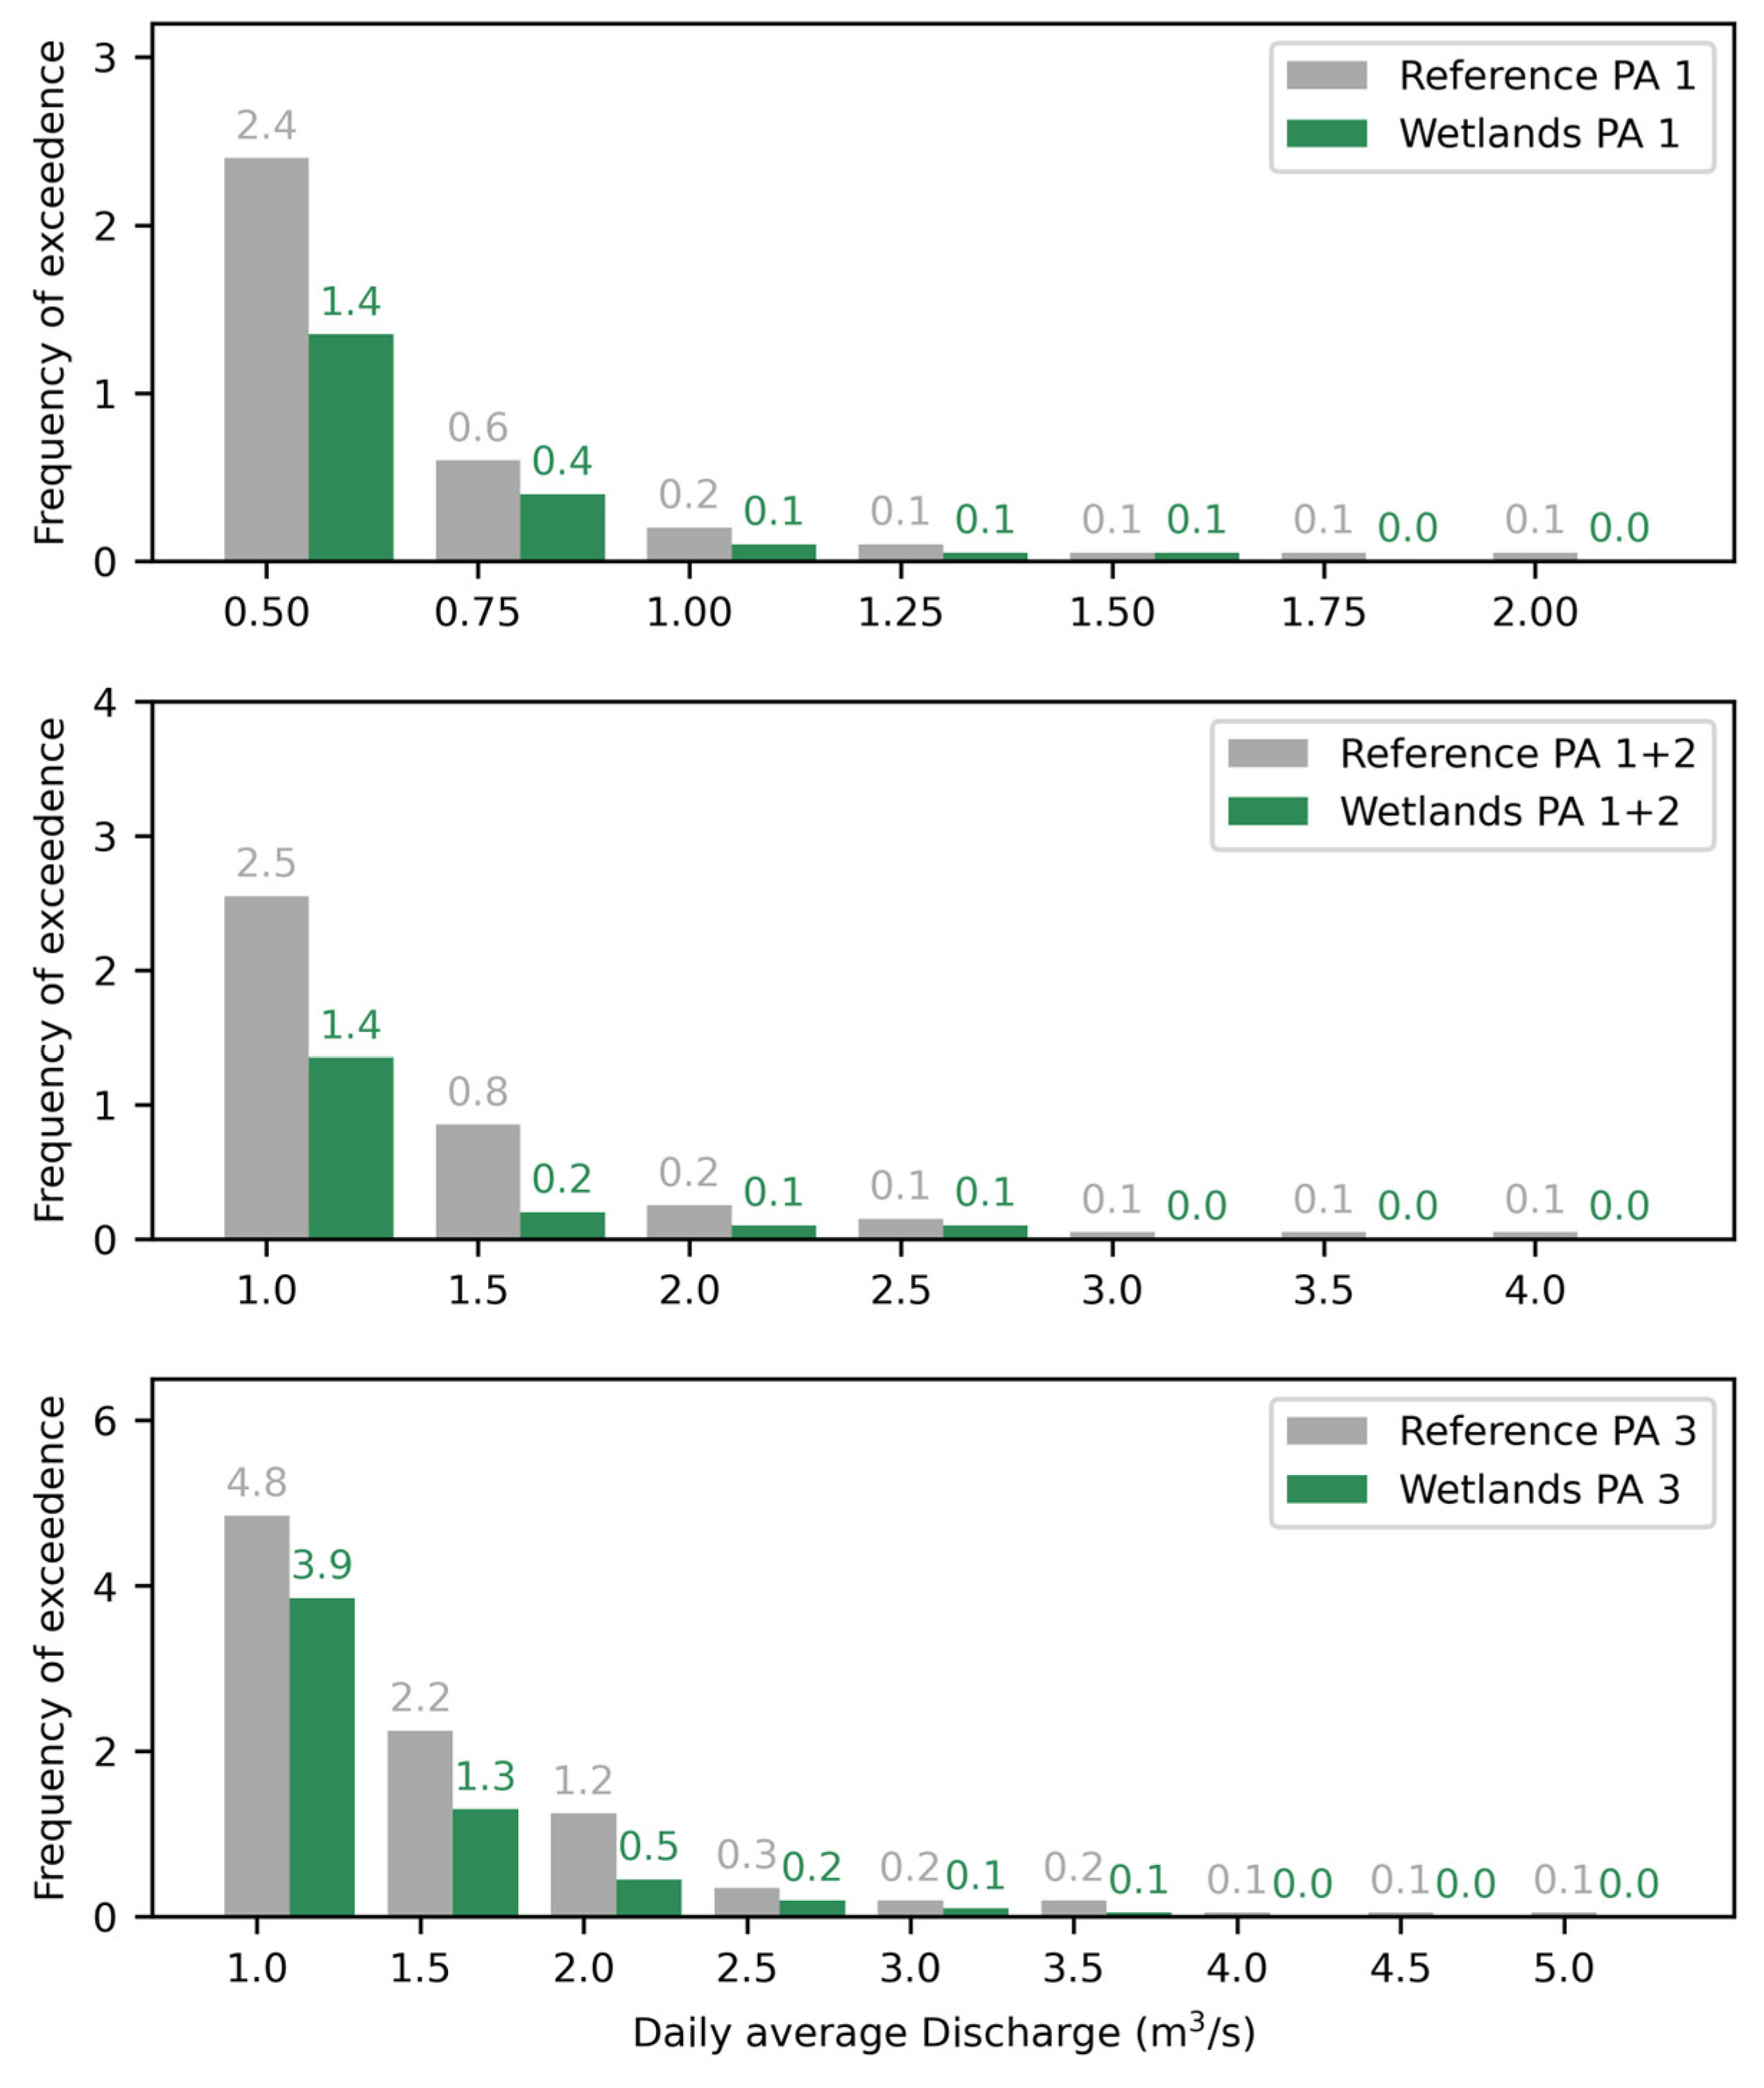
3.2.2. Impact on Streamflow
3.3. Water Quality Effects
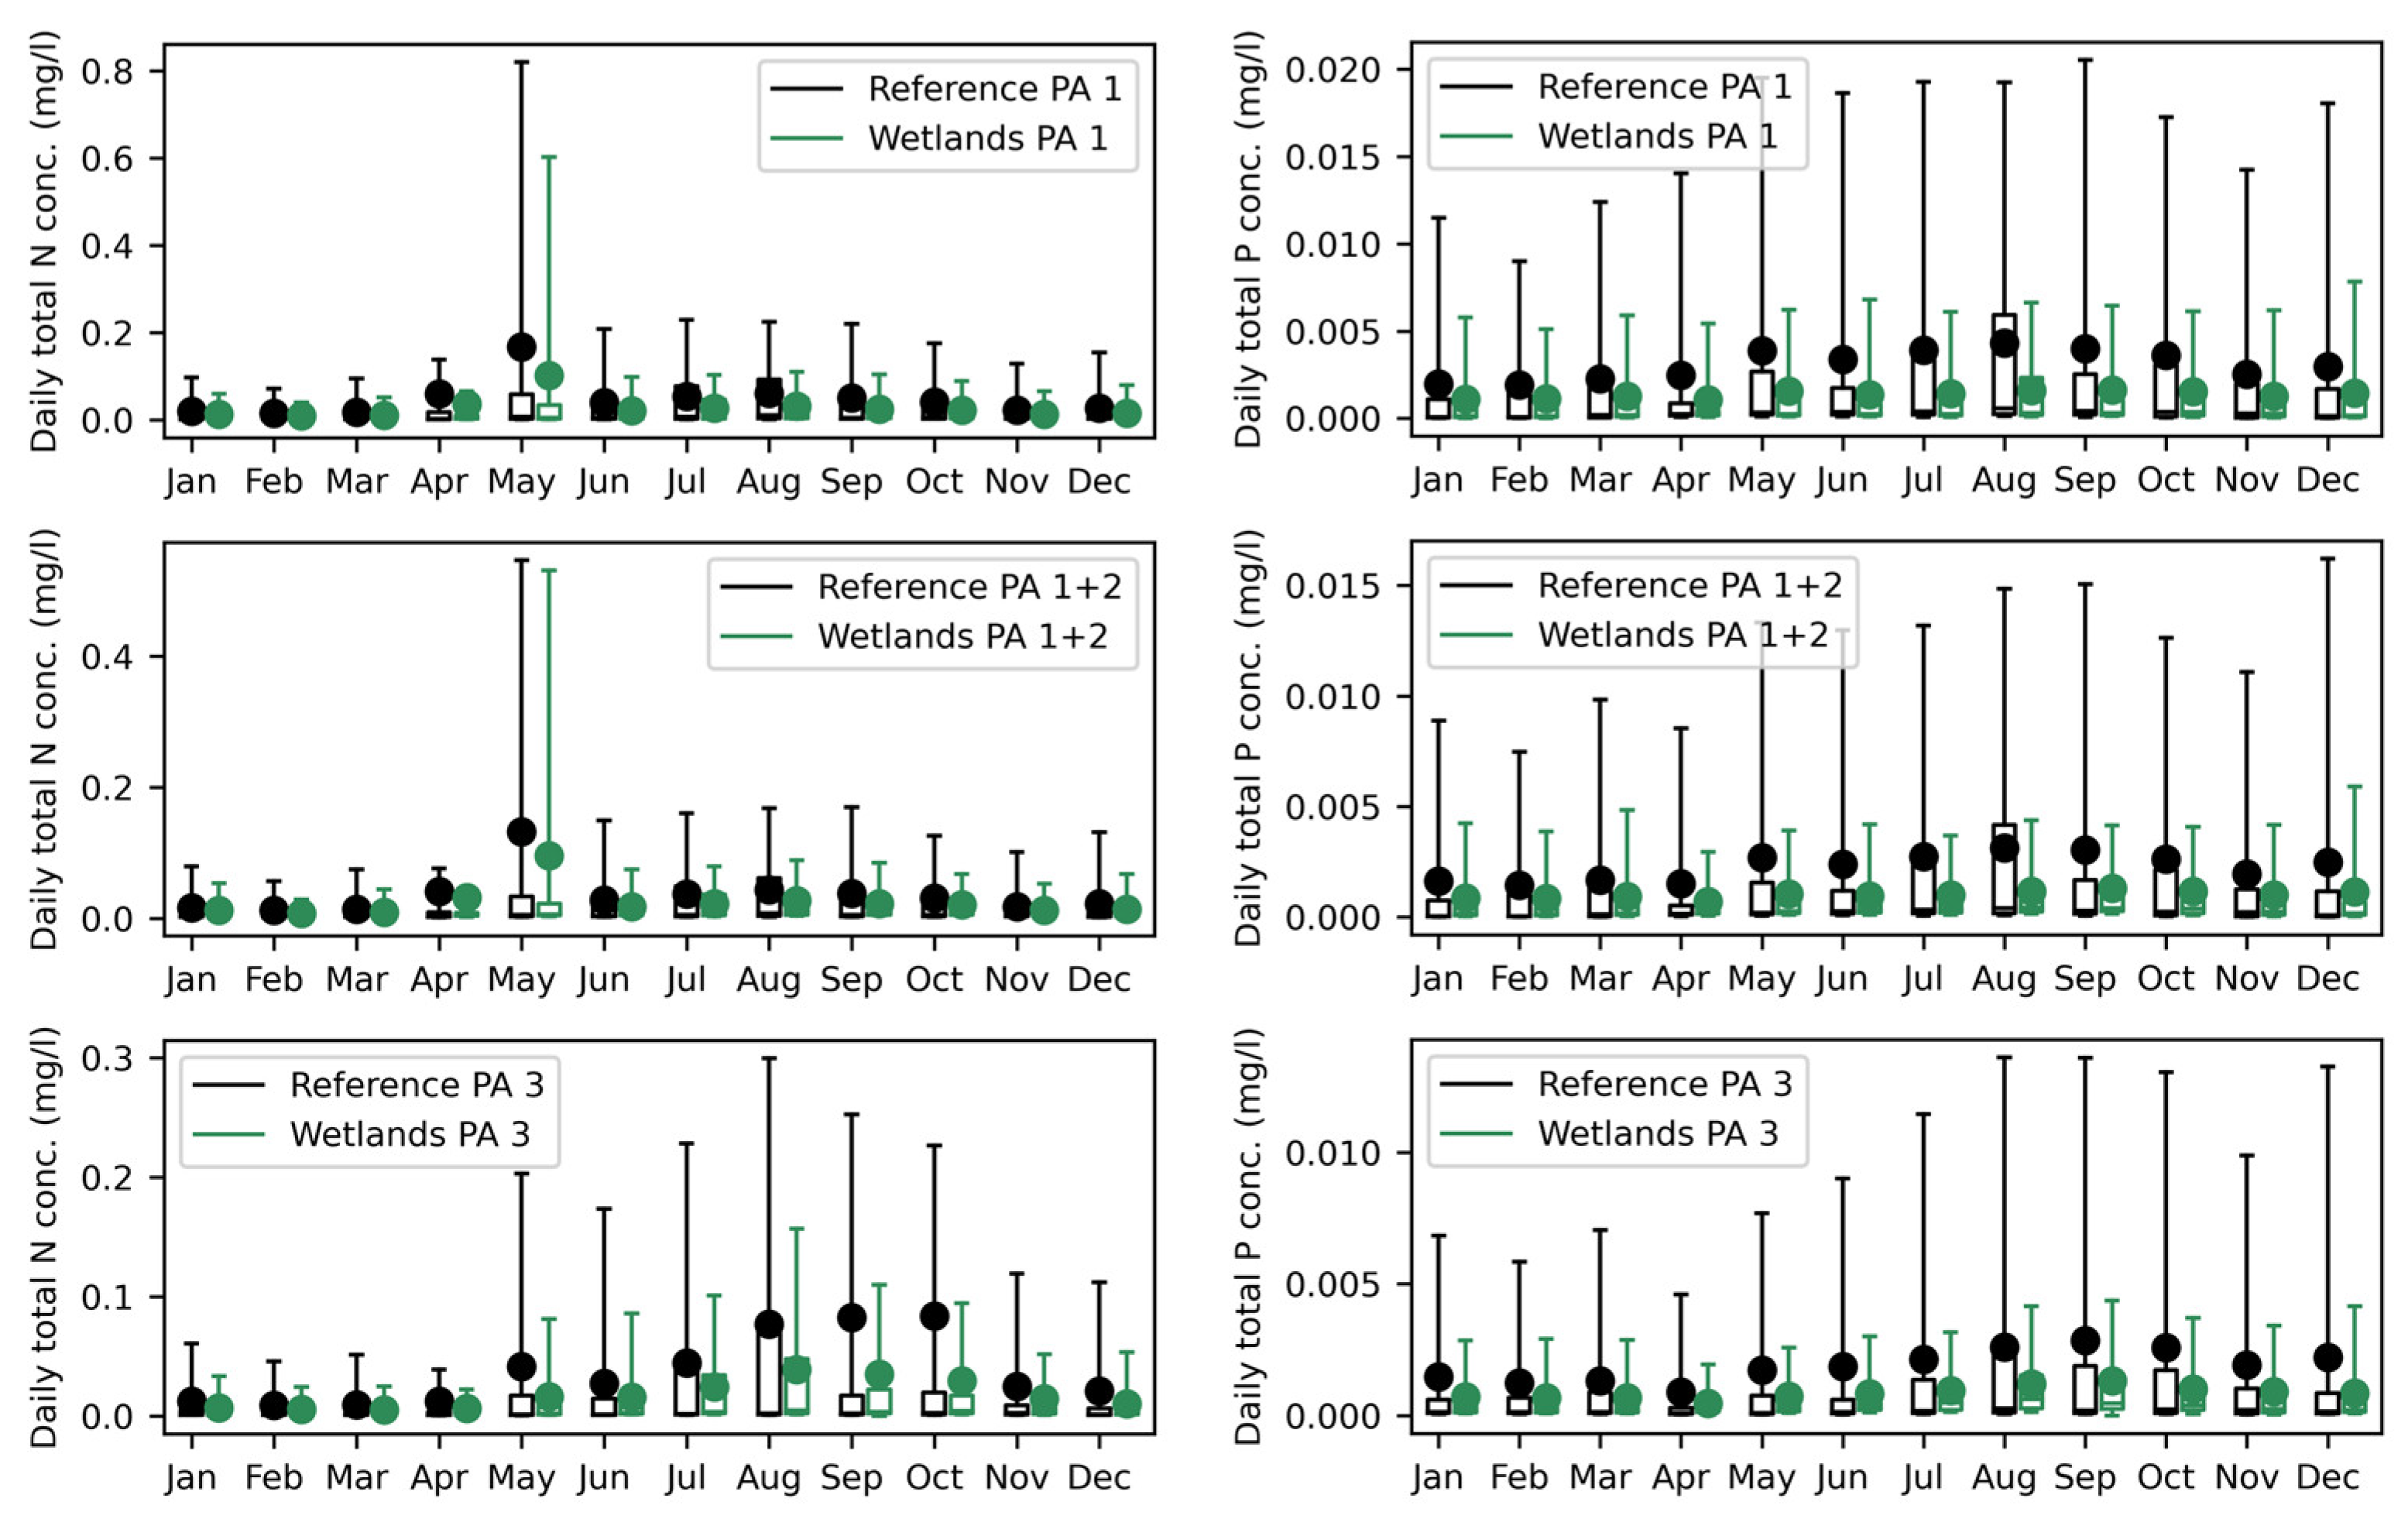
3.3.1. Nutrient Concentration
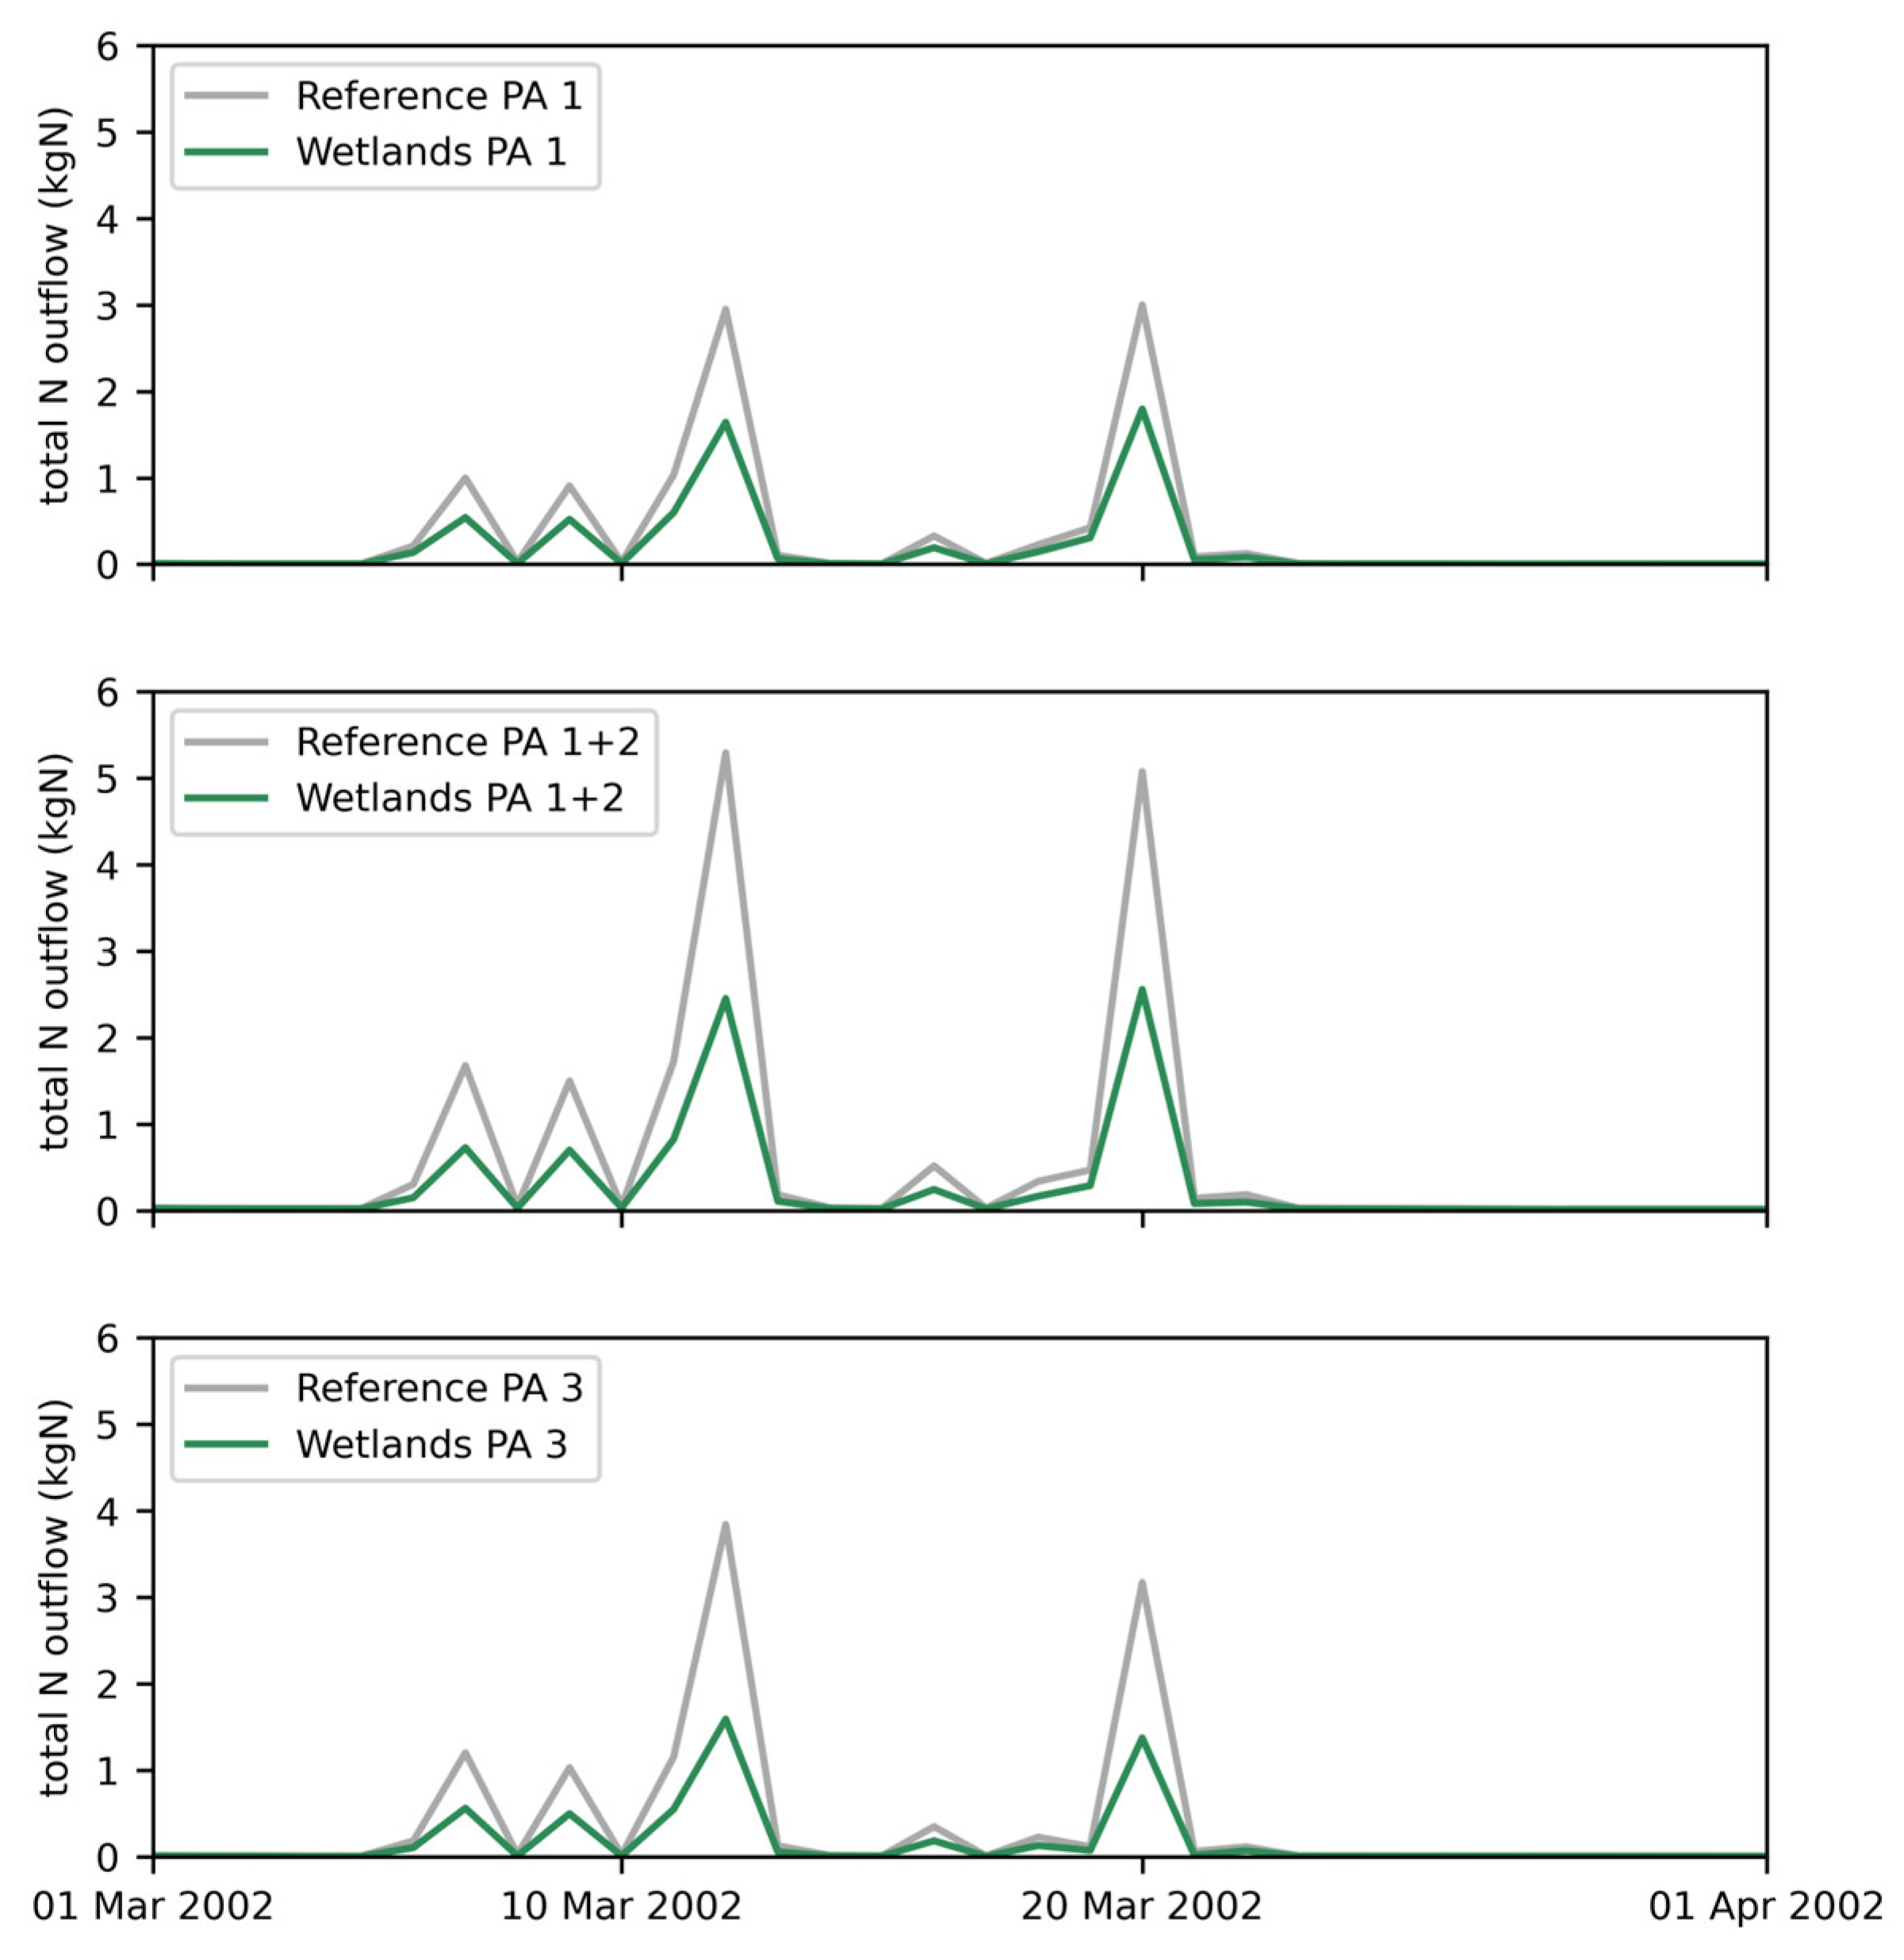
3.3.2. Nutrient Loads
4. Discussion
5. Conclusions
Author Contributions
Funding
Data Availability Statement
Conflicts of Interest
References
- Dottori, F.; Mentaschi, L.; Bianchi, A.; Alfieri, L.; Feyen, L. Adapting to Rising River Flood Risk in the EU under Climate Change; Joint Research Centre (JRC): Luxembourg, 2020. [Google Scholar]
- Collentine, D.; Futter, M.N. Realising the Potential of Natural Water Retention Measures in Catchment Flood Management: Trade-Offs and Matching Interests. J. Flood Risk Manag. 2018, 11, 76–84. [Google Scholar] [CrossRef]
- Cornwall, W. Europe’s Deadly Floods Leave Scientists Stunned|Science|AAAS. Science 2021, 373, 372–373. [Google Scholar] [CrossRef] [PubMed]
- Ludwig, P.; Ehmele, F.; Franca, M.J.; Mohr, S.; Caldas-Alvarez, A.; Daniell, J.E.; Ehret, U.; Feldmann, H.; Hundhausen, M.; Knippertz, P.; et al. A Multi-Disciplinary Analysis of the Exceptional Flood Event of July 2021 in Central Europe—Part 2: Historical Context and Relation to Climate Change. Nat. Hazards Earth Syst. Sci. 2023, 23, 1287–1311. [Google Scholar] [CrossRef]
- European State of the Climate 2021 Summary|Copernicus. Available online: https://climate.copernicus.eu/european-state-climate-2021-summary (accessed on 5 February 2024).
- Economic Losses from Weather- and Climate-Related Extremes in Europe. Available online: https://www.eea.europa.eu/en/analysis/indicators/economic-losses-from-climate-related (accessed on 5 February 2024).
- Kahraman, A.; Kendon, E.; Chan, S.; Fowler, H. Quasi-Stationary Intense Rainstorms Spread Across Europe under Climate Change. Geophys. Res. Lett. 2021, 48, e2020GL092361. [Google Scholar] [CrossRef]
- Vörösmarty, C.J.; McIntyre, P.B.; Gessner, M.O.; Dudgeon, D.; Prusevich, A.; Green, P.; Glidden, S.; Bunn, S.E.; Sullivan, C.A.; Liermann, C.R.; et al. Global Threats to Human Water Security and River Biodiversity. Nature 2010, 467, 555–561. [Google Scholar] [CrossRef] [PubMed]
- Grizzetti, B.; Pistocchi, A.; Liquete, C.; Udias, A.; Bouraoui, F.; van de Bund, W. Human Pressures and Ecological Status of European Rivers. Sci. Rep. 2017, 7, 205. [Google Scholar] [CrossRef] [PubMed]
- Wilken, R.-D. The Recovered Rhine and Its History. In The Rhine; The Handbook of Environmental Chemistry; Springer: Berlin/Heidelberg, Germany, 2005; Volume 5L. [Google Scholar]
- Tanneberger, F.; Appulo, L.; Ewert, S.; Lakner, S.; O’Brolchain, N.; Peters, J.; Wichtmann, W. The Power of Nature-Based Solutions: How Peatlands Can Help Us to Achieve Key EU Sustainability Objectives. Adv. Sustain. Syst. 2020, 5. [Google Scholar] [CrossRef]
- Zemke, J.J. Anthropogenically Altered Runoff Processes in a Waterlogged Headwater Catchment within the National Park Hunsrück-Hochwald, Germany. ERDE—J. Geogr. Soc. Berl. 2018, 149, 102–116. [Google Scholar]
- Wu, Y.; Sun, J.; Hu, B.; Zhang, G.; Rousseau, A.N. Wetland-Based Solutions against Extreme Flood and Severe Drought: Efficiency Evaluation of Risk Mitigation. Clim. Risk Manag. 2023, 40, 100505. [Google Scholar] [CrossRef]
- Bourke, M.; Wilkinson, M.; Srdjevic, Z. Nature-Based Solutions for Flow Reduction in Catchment Headwaters. In Spatial Flood Risk Management: Implementing Catchment-Based Retention and Resilience on Private Land; Elgar: Northampton, MA, USA, 2022; pp. 13–32. ISBN 978-1-80037-952-7. [Google Scholar]
- van Vliet, M.T.H.; Franssen, W.H.P.; Yearsley, J.R.; Ludwig, F.; Haddeland, I.; Lettenmaier, D.P.; Kabat, P. Global River Discharge and Water Temperature under Climate Change. Glob. Environ. Chang. 2013, 23, 450–464. [Google Scholar] [CrossRef]
- Directorate-General for Environment (European Commission). EU Policy Document on Natural Water Retention Measures: By the Drafting Team of the WFD CIS Working Group Programme of Measures (WG PoM); Publications Office of the European Union: Luxembourg, 2014; ISBN 978-92-79-44497-5. [Google Scholar]
- van Deursen, W.; van Winden, A.; Braakhekke, W. Possibilities for Storage? Stores of Possibilities! Carthago Consultancy; Stroming BV: Rotterdam, The Netherlands, 2013; p. 25. [Google Scholar]
- Gao, H.; Sabo, J.L. Understand the Impacts of Wetland Restoration on Peak Flow and Baseflow by Coupling Hydrologic and Hydrodynamic Models. In American Geophysical Union, Fall Meeting 2016; 2016; Abstract #GC31B-1120. Available online: https://ui.adsabs.harvard.edu/abs/2016AGUFMGC31B1120G/abstract (accessed on 5 February 2024).
- Dalzell, B.J.; Gassman, P.W.; Kling, C. Wetland Restoration as a Tool for Peak Flow Mitigation: Combining Watershed Scale Modeling with a Genetic Algorithm Approach. In American Geophysical Union, Fall Meeting 2015; 2015; Abstract id. H11K-05. Available online: https://ui.adsabs.harvard.edu/abs/2015AGUFM.H11K..05D/abstract (accessed on 5 February 2024).
- Javaheri, A.; Babbar-Sebens, M. On Comparison of Peak Flow Reductions, Flood Inundation Maps, and Velocity Maps in Evaluating Effects of Restored Wetlands on Channel Flooding. Ecol. Eng. 2014, 73, 132–145. [Google Scholar] [CrossRef]
- Evenson, G.R.; Jones, C.N.; McLaughlin, D.L.; Golden, H.E.; Lane, C.R.; DeVries, B.; Alexander, L.C.; Lang, M.W.; McCarty, G.W.; Sharifi, A. A Watershed-Scale Model for Depressional Wetland-Rich Landscapes. J. Hydrol. X 2018, 1, 100002. [Google Scholar] [CrossRef] [PubMed]
- Evenson, G.R.; Golden, H.E.; Christensen, J.R.; Lane, C.R.; Rajib, A.; D’Amico, E.; Mahoney, D.T.; White, E.; Wu, Q. Wetland Restoration Yields Dynamic Nitrate Responses across the Upper Mississippi River Basin. Environ. Res. Commun. 2021, 3, 095002. [Google Scholar] [CrossRef] [PubMed]
- Arnold, J.G.; Moriasi, D.N.; Gassman, P.W.; Abbaspour, K.C.; White, M.J.; Srinivasan, R.; Santhi, C.; Harmel, R.D.; van Griensven, A.; van Liew, M.W.; et al. SWAT: Model Use, Calibration and Validation. Trans. ASABE 2012, 55, 1491–1508. [Google Scholar] [CrossRef]
- Åhlén, I.; Thorslund, J.; Hambäck, P.; Destouni, G.; Jarsjö, J. Wetland Position in the Landscape: Impact on Water Storage and Flood Buffering. Ecohydrology 2022, 15, e2458. [Google Scholar] [CrossRef]
- Van Stempvoort, D.R.; MacKay, D.R.; Collins, P.; Brown, S.J.; Koehler, G. Influence of Wetlands on Nutrients in Headwaters of Agricultural Catchments. Hydrol. Process. 2023, 37, e14866. [Google Scholar] [CrossRef]
- Acreman, M.; Holden, J. How Wetlands Affect Floods. Wetlands 2013, 33, 773–786. [Google Scholar] [CrossRef]
- Lane, C.R.; Leibowitz, S.G.; Autrey, B.C.; LeDuc, S.D.; Alexander, L.C. Hydrological, physical, and chemical functions and connectivity of non-floodplain wetlands to downstream waters: A review. J. Am. Water Resour. Assoc. 2018, 54, 346–371. [Google Scholar] [CrossRef]
- Kadykalo, A.N.; Findlay, C.S. The Flow Regulation Services of Wetlands. Ecosyst. Serv. 2016, 20, 91–103. [Google Scholar] [CrossRef]
- Fisher, J.; Acreman, M.C. Wetland Nutrient Removal: A Review of the Evidence. Hydrol. Earth Syst. Sci. 2004, 8, 673–685. [Google Scholar] [CrossRef]
- Lemke, A.M.; Kirkham, K.G.; Wallace, M.P.; VanZomeren, C.M.; Berkowitz, J.F.; Kovacic, D.A. Nitrogen and Phosphorus Removal Using Tile-Treatment Wetlands: A 12-Year Study from the Midwestern United States. J. Environ. Qual. 2022, 51, 797–810. [Google Scholar] [CrossRef]
- Bieger, K.; Arnold, J.G.; Rathjens, H.; White, M.J.; Bosch, D.D.; Allen, P.M.; Volk, M.; Srinivasan, R. Introduction to SWAT+, A Completely Restructured Version of the Soil and Water Assessment Tool. JAWRA J. Am. Water Resour. Assoc. 2017, 53, 115–130. [Google Scholar] [CrossRef]
- Bieger, K.; Arnold, J.G.; Rathjens, H.; White, M.J.; Bosch, D.D.; Allen, P.M. Representing the Connectivity of Upland Areas to Floodplains and Streams in SWAT+. JAWRA J. Am. Water Resour. Assoc. 2019, 55, 578–590. [Google Scholar] [CrossRef]
- Ekström, E. Flood Mitigation at Catchment Scale: Assessing the Effectiveness of Constructed Wetlands. Master’s Thesis, KTH Royal Instiutute of Technology, Stockholm, Sweden, 2023. [Google Scholar]
- van Winden, A.; Overmars, W.; Braakhekke, W. Storing Water near the Source; Stroming BV: Nijmegen, The Netherlands, 2004; p. 18. [Google Scholar]
- Otterman, E.; Braakhekke, W.; van Winden, A.; van Deursen, W.; Zeitler, F.; Silver, W.; Roels, B.; Schoch, D. Restoration of the Marshes in the Valleys of the Middle Mountains of the Rhine Basin for Flood and Drought Risk Reduction—‘The Sponges Approach’; Stroming BV; Carthago BV; Udata GMBH; Wetlands International; WWF Netherlands: Nijmegen, The Netherlands, 2017; p. 68. [Google Scholar]
- Digitales Geländemodell Gitterweite 1 m. Available online: https://gdz.bkg.bund.de/index.php/default/digitale-geodaten/digitale-gelandemodelle/digitales-gelandemodell-gitterweite-1-m-dgm1.html (accessed on 5 February 2024).
- IMA GDI Nordrhein-Westfalen Home|Geoportal. Available online: https://www.geoportal.nrw/home (accessed on 2 October 2020).
- Ballabio, C.; Panagos, P.; Monatanarella, L. Mapping Topsoil Physical Properties at European Scale Using the LUCAS Database. Geoderma 2016, 261, 110–123. [Google Scholar] [CrossRef]
- Dobos, E. Albedo. In Atmosphere and Climate; CRC Press: Boca Raton, FL, USA, 2020; ISBN 978-0-429-44098-4. [Google Scholar]
- Copernicus LMS CLC 2018—Copernicus Land Monitoring Service. Available online: https://land.copernicus.eu/pan-european/corine-land-cover/clc2018 (accessed on 2 October 2020).
- Deutscher Wetterdienst Meteorological Data Repository Germany. Available online: https://opendata.dwd.de/climate_environment/CDC/observations_germany/climate/daily/ (accessed on 2 October 2020).
- Dienstleistungszentrum Ländlicher Raum (DLR). Informationen für Ackerbau und Grünland. Neue Düngeverordnung 2020.
- Fritsch, F. Informationen für Ackerbau und Grünland. Neue Düngeverordnung 2020, 2020.
- Fritsch, F. Düngung\Ackerbau und Grünland\Ackerbau und Grünland. Available online: https://www.dlr.rlp.de/Internet/global/inetcntr.nsf/dlr_web_full.xsp?src=KWI71C21G0&p1=4W1H8283HY&p3=4H0SJ5100N&p4=6T14Z53D9J (accessed on 29 October 2020).
- Fritsch, F.; Thiex, C. Informationen für Ackerbau und Grünland. Stickstoff-Düngebedarfsermittlung für Grünland 2020.
- Chow, V.T. Open Channel Hydraulics; McGraw-Hill Civil Engineering: London, UK, 1959. [Google Scholar]
- Henderson, F.M. Open-Channel Flow; Macmillan series in civil engineering; Mac-Millan Publishing Co., Inc.: New York, NY, USA, 1966. [Google Scholar]
- Arcement, G.J.; Schneider, V.R. Guide for Selecting Manning’s Roughness Coefficients for Natural Channels and Flood Plains; U.S. G.P.O.; For sale by the Books and Open-File Reports Section; U.S. Geological Survey: Reston, VA, USA, 1989.
- USDA-NRCS. Wetland Restoration, Enhancement, or Creation. In Engineering Field Handbook; Department of Agriculture (USDA); Natural Resources Conservation Service (NRCS): Washington, DC, USA, 2008; Volume Part 650.13, p. 150. [Google Scholar]
- Yen, H.; Park, S.; Arnold, J.G.; Srinivasan, R.; Chawanda, C.J.; Wang, R.; Feng, Q.; Wu, J.; Miao, C.; Bieger, K.; et al. IPEAT+: A Built-In Optimization and Automatic Calibration Tool of SWAT+. Water 2019, 11, 1681. [Google Scholar] [CrossRef]
- McCuen, R.H.; Knight, Z.; Cutter, A.G. Evaluation of the Nash–Sutcliffe Efficiency Index. J. Hydrol. Eng. 2006, 11, 597–602. [Google Scholar] [CrossRef]
- Rheinland-Pfalz Auskunftssystem Geoportal. Wasser. Available online: http://www.gda-wasser.rlp.de/GDAWasser/client/gisclient/index.html?applicationId=54045 (accessed on 13 November 2020).
- Hankin, B.; Page, T.; McShane, G.; Chappell, N.; Spray, C.; Black, A.; Comins, L. How Can We Plan Resilient Systems of Nature-Based Mitigation Measures in Larger Catchments for Flood Risk Reduction Now and in the Future? Water Secur. 2021, 13, 100091. [Google Scholar] [CrossRef]
- Chiu, Y.-Y.; Wu, Y.-H.; Fu, K.-L.; Lai, T.-C.; Chen, H.-E.; Chen, S.-C. Nature-Based Solutions for Disaster Reduction and Improving Ecosystem Services in the Hutoubi Watershed, Taiwan. Water 2023, 15, 2527. [Google Scholar] [CrossRef]
- Tollan, A. Land-Use Change and Floods: What Do We Need Most, Research or Management? Water Sci. Technol. 2002, 45, 183–190. [Google Scholar] [CrossRef] [PubMed]
- Ruangpan, L.; Vojinovic, Z.; Di Sabatino, S.; Leo, L.S.; Capobianco, V.; Oen, A.M.P.; McClain, M.E.; Lopez-Gunn, E. Nature-Based Solutions for Hydro-Meteorological Risk Reduction: A State-of-the-Art Review of the Research Area. Nat. Hazards Earth Syst. Sci. 2020, 20, 243–270. [Google Scholar] [CrossRef]
- Robinson, M.; Cognard-Plancq, A.-L.; Cosandey, C.; David, J.; Durand, P.; Führer, H.-W.; Hall, R.; Hendriques, M.O.; Marc, V.; McCarthy, R.; et al. Studies of the Impact of Forests on Peak Flows and Baseflows: A European Perspective. For. Ecol. Manag. 2003, 186, 85–97. [Google Scholar] [CrossRef]
- Filoso, S.; Bezerra, M.O.; Weiss, K.C.B.; Palmer, M.A. Impacts of Forest Restoration on Water Yield: A Systematic Review. PLoS ONE 2017, 12, e0183210. [Google Scholar] [CrossRef] [PubMed]
- Mohr, S.; Ehret, U.; Kunz, M.; Ludwig, P.; Caldas-Alvarez, A.; Daniell, J.E.; Ehmele, F.; Feldmann, H.; Franca, M.J.; Gattke, C.; et al. A Multi-Disciplinary Analysis of the Exceptional Flood Event of July 2021 in Central Europe. Part 1: Event Description and Analysis. Hazards Earth Syst. Sci. Discuss. 2023, 23, 1287–1311. [Google Scholar] [CrossRef]
- Waterloo, M.J.; Gevaert, A.I. Stroomgebied De Geul. Effectiviteit van Natuur-Gerelateerde Maatregelen ter Vermindering van Overstromingsrisico’s; Acacia Water: Gouda, The Netherlands, 2023; p. 100. [Google Scholar]
- Hey, D.L.; Philippi, N.S. Flood Reduction through Wetland Restoration: The Upper Mississippi River Basin as a Case History. Restor. Ecol. 1995, 3, 4–17. [Google Scholar] [CrossRef]
- Wassen, M.J.; Grootjans, A.P. Ecohydrology: An Interdisciplinary Approach for Wetland Management and Restauration. Vegetatio 1996, 126, 1–4. [Google Scholar] [CrossRef]
- Bowden, W.B.; Fahey, B.D.; Ekanayake, J.; Murray, D.L. Hillslope and Wetland Hydrodynamics in a Tussock Grassland, South Island, New Zealand. Hydrol. Process. 2001, 15, 1707–1730. [Google Scholar] [CrossRef]
- Middleton, B.A. Flood Pulsing in Wetlands: Restoring the Natural Hydrological Balance; John Wiley & Sons: Hoboken, NJ, USA, 2002; ISBN 978-0-471-42323-2. [Google Scholar]
- Acreman, M.C.; Riddington, R.; Booker, D.J. Hydrological Impacts of Floodplain Restoration: A Case Study of the River Cherwell, UK. Hydrol. Earth Syst. Sci. Discuss. 2003, 7, 75–85. [Google Scholar] [CrossRef]
- Olde Venterink, H.; Wassen, M.; Verkroost, A.W.M.; Ruiter, P. Species Richness-Productivity Patterns Differ between N-, P-, and K-Limited Wetlands. Ecology 2003, 84, 2191–2199. [Google Scholar] [CrossRef]
- Zedler, J.B. Wetlands at Your Service: Reducing Impacts of Agriculture at the Watershed Scale. Front. Ecol. Environ. 2003, 1, 65–72. [Google Scholar] [CrossRef]
- Mitsch, W.J.; Day, J.W. Restoration of Wetlands in the Mississippi–Ohio–Missouri (MOM) River Basin: Experience and Needed Research. Ecol. Eng. 2006, 26, 55–69. [Google Scholar] [CrossRef]
- Coops, H.; Van Geest, G.J. Ecological Restoration of Wetlands in Europe; Significance for Implementing the Water Framework Directive in the Netherlands; WL/Delft Hydraulics: Delft, The Netherlands, 2007. [Google Scholar]
- Yao, Y.; Wang, L.; Lv, X.; Yu, H.; Li, G. Changes in Stream Peak Flow and Regulation in Naoli River Watershed as a Result of Wetland Loss. Available online: https://www.hindawi.com/journals/tswj/2014/209547/abs/ (accessed on 3 January 2020).
- Kleimeier, C.; Liu, H.; Rezanezhad, F.; Lennartz, B. Nitrate Attenuation in Degraded Peat Soil-Based Constructed Wetlands. Water 2018, 10, 355. [Google Scholar] [CrossRef]
- USDA-NRCS. Scenarios for Wetland Restoration; USDA—Natural Resources Conservation Service: Washington, DC, USA, 2011; p. 33.
- Wondie, A. Ecological Conditions and Ecosystem Services of Wetlands in the Lake Tana Area, Ethiopia. Ecohydrol. Hydrobiol. 2018, 18, 231–244. [Google Scholar] [CrossRef]
- Blanchette, M.; Rousseau, A.N.; Foulon, É.; Savary, S.; Poulin, M. What Would Have Been the Impacts of Wetlands on Low Flow Support and High Flow Attenuation under Steady State Land Cover Conditions? J. Environ. Manag. 2019, 234, 448–457. [Google Scholar] [CrossRef] [PubMed]
- Gunnell, K.; Mulligan, M.; Francis, R.A.; Hole, D.G. Evaluating Natural Infrastructure for Flood Management within the Watersheds of Selected Global Cities. Sci. Total Environ. 2019, 670, 411–424. [Google Scholar] [CrossRef] [PubMed]
- Richardson, C.J.; Flanagan, N.E.; Ho, M.; Pahl, J.W. Integrated Stream and Wetland Restoration: A Watershed Approach to Improved Water Quality on the Landscape. Ecol. Eng. 2011, 37, 25–39. [Google Scholar] [CrossRef]
- Moore, T.R.; Roulet, N.T. Methane Flux: Water Table Relations in Northern Wetlands. Geophys. Res. Lett. 1993, 20, 587–590. [Google Scholar] [CrossRef]
- Richey, J.E.; Melack, J.M.; Aufdenkampe, A.K.; Ballester, V.M.; Hess, L. Outgassing from Amazonian Rivers and Wetlands as a Large Tropical Source of Atmospheric CO2. Nature 2002, 416, 617–620. [Google Scholar] [CrossRef]
- van Huissteden, J. Methane Emission from Northern Wetlands in Europe during Oxygen Isotope Stage 3. Quat. Sci. Rev. 2004, 23, 1989–2005. [Google Scholar] [CrossRef]
- Whalen, S.C. Biogeochemistry of Methane Exchange between Natural Wetlands and the Atmosphere. Environ. Eng. Sci. 2005, 22, 73–94. [Google Scholar] [CrossRef]
- Wit, F. Methane Emissions from Converted Agricultural Wetlands and Lakes. Master’s Thesis, VU University, Amsterdam, The Netherlands, 2009. [Google Scholar]
- Fennessy, S.M.; Lei, G. Wetland Restoration for Climate Change Resilience; Ramsar Convention: Gland, Switzerland, 2018. [Google Scholar]
- Thiere, G.; Stadmark, J.; Weisner, S.E.B. Nitrogen Retention versus Methane Emission: Environmental Benefits and Risks of Large-Scale Wetland Creation. Ecol. Eng. 2011, 37, 6–15. [Google Scholar] [CrossRef]


| Land Use | PA 1 [%] | PA 1+2 [%] | PA 3 [%] | Catchment [%] |
|---|---|---|---|---|
| Broad-leaved forest | 0 | 0 | 2 | 4 |
| Coniferous forest | 2 | 22 | 49 | 44 |
| Mixed forest | 0 | 0 | 8 | 6 |
| Natural | 4 | 3 | 1 | 1 |
| Pastures | 88 | 72 | 38 | 42 |
| Urban fabric | 6 | 4 | 2 | 2 |
| Total area [km2] | 3.9 km2 | 8.7 km2 | 9.5 km2 | 48.3 km2 |
| Project Area | Floodplain [km2] | Floodplain [%] | Upslope [km2] | Upslope [%] | Total [km2] |
|---|---|---|---|---|---|
| PA 1 | 0.19 | 4.9 | 3.68 | 95.1 | 3.87 |
| PA 1+2 | 0.51 | 6.0 | 8.14 | 94.0 | 8.65 |
| PA 3 | 0.63 | 6.7 | 8.84 | 93.3 | 9.47 |
| Parameter | Name | Change Value | Calibrated Value * |
|---|---|---|---|
| cn2 | Curve number | −83% | N.A. |
| ovn | Manning ‘n’ | 33% | N.A. |
| esco | Soil evaporation compensation | 73% | 1.0 |
| epco | Plant uptake compensation factor | −95% | 0.05 |
| awc | Available water capacity | −20% | N.A. |
| k | Saturated hydraulic conductivity | 64% | N.A. |
| surlag | Surface runoff lag coefficient | 9.1 [-] | 13.1 |
| alpha | Baseflow factor | 0.08 [-] | 0.13 |
| flo_min | Minimum aquifer storage to allow return flow | 75% | 5.2 |
| revap_min | Threshold for revap or percolation to occur | −13% | 4.4 |
| Water Balance Component | Reference Amounts [mm y−1] |
|---|---|
| Precipitation | 1207 |
| Potential evapotranspiration | 598 |
| Actual evapotranspiration | 549 |
| Streamflow | 500 |
| Overland flow | 403 |
| Lateral flow | 13 |
| Percolation to groundwater | 280 |
| Area | N Export Ref [kg ha−1 y−1] | N Export Wet [kg ha−1 y−1] | P Export Ref [kg ha−1 y−1] | P Export Wet [kg ha−1 y−1] |
|---|---|---|---|---|
| PA 1 | 0.60 | 0.38 | 0.05 | 0.03 |
| PA 1+2 | 0.48 | 0.26 | 0.04 | 0.01 |
| PA 3 | 0.29 | 0.15 | 0.03 | 0.01 |
| Steinebrück | 0.31 | 0.24 | 0.03 | 0.02 |
Disclaimer/Publisher’s Note: The statements, opinions and data contained in all publications are solely those of the individual author(s) and contributor(s) and not of MDPI and/or the editor(s). MDPI and/or the editor(s) disclaim responsibility for any injury to people or property resulting from any ideas, methods, instructions or products referred to in the content. |
© 2024 by the authors. Licensee MDPI, Basel, Switzerland. This article is an open access article distributed under the terms and conditions of the Creative Commons Attribution (CC BY) license (https://creativecommons.org/licenses/by/4.0/).
Share and Cite
Nauta, S.M.; Waterloo, M.J.; Gevaert, A.I.; de Bijl, J.; Brotherton, P. Micro-Catchments, Macro Effects: Natural Water Retention Measures in the Kylldal Catchment, Germany. Water 2024, 16, 733. https://doi.org/10.3390/w16050733
Nauta SM, Waterloo MJ, Gevaert AI, de Bijl J, Brotherton P. Micro-Catchments, Macro Effects: Natural Water Retention Measures in the Kylldal Catchment, Germany. Water. 2024; 16(5):733. https://doi.org/10.3390/w16050733
Chicago/Turabian StyleNauta, Silke M., Maarten J. Waterloo, Anouk I. Gevaert, Jos de Bijl, and Paul Brotherton. 2024. "Micro-Catchments, Macro Effects: Natural Water Retention Measures in the Kylldal Catchment, Germany" Water 16, no. 5: 733. https://doi.org/10.3390/w16050733
APA StyleNauta, S. M., Waterloo, M. J., Gevaert, A. I., de Bijl, J., & Brotherton, P. (2024). Micro-Catchments, Macro Effects: Natural Water Retention Measures in the Kylldal Catchment, Germany. Water, 16(5), 733. https://doi.org/10.3390/w16050733