

Evaluation of Fenton, Photo-Fenton and Fenton-like Processes in Degradation of PE, PP, and PVC Microplastics

 , , , ,
  and
and 
Abstract
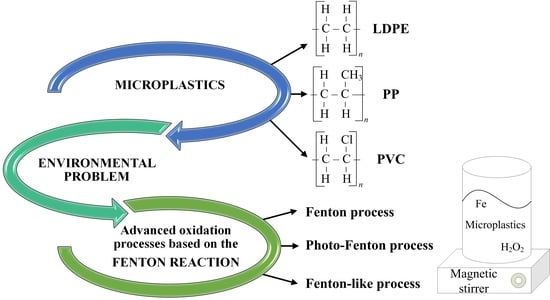
1. Introduction
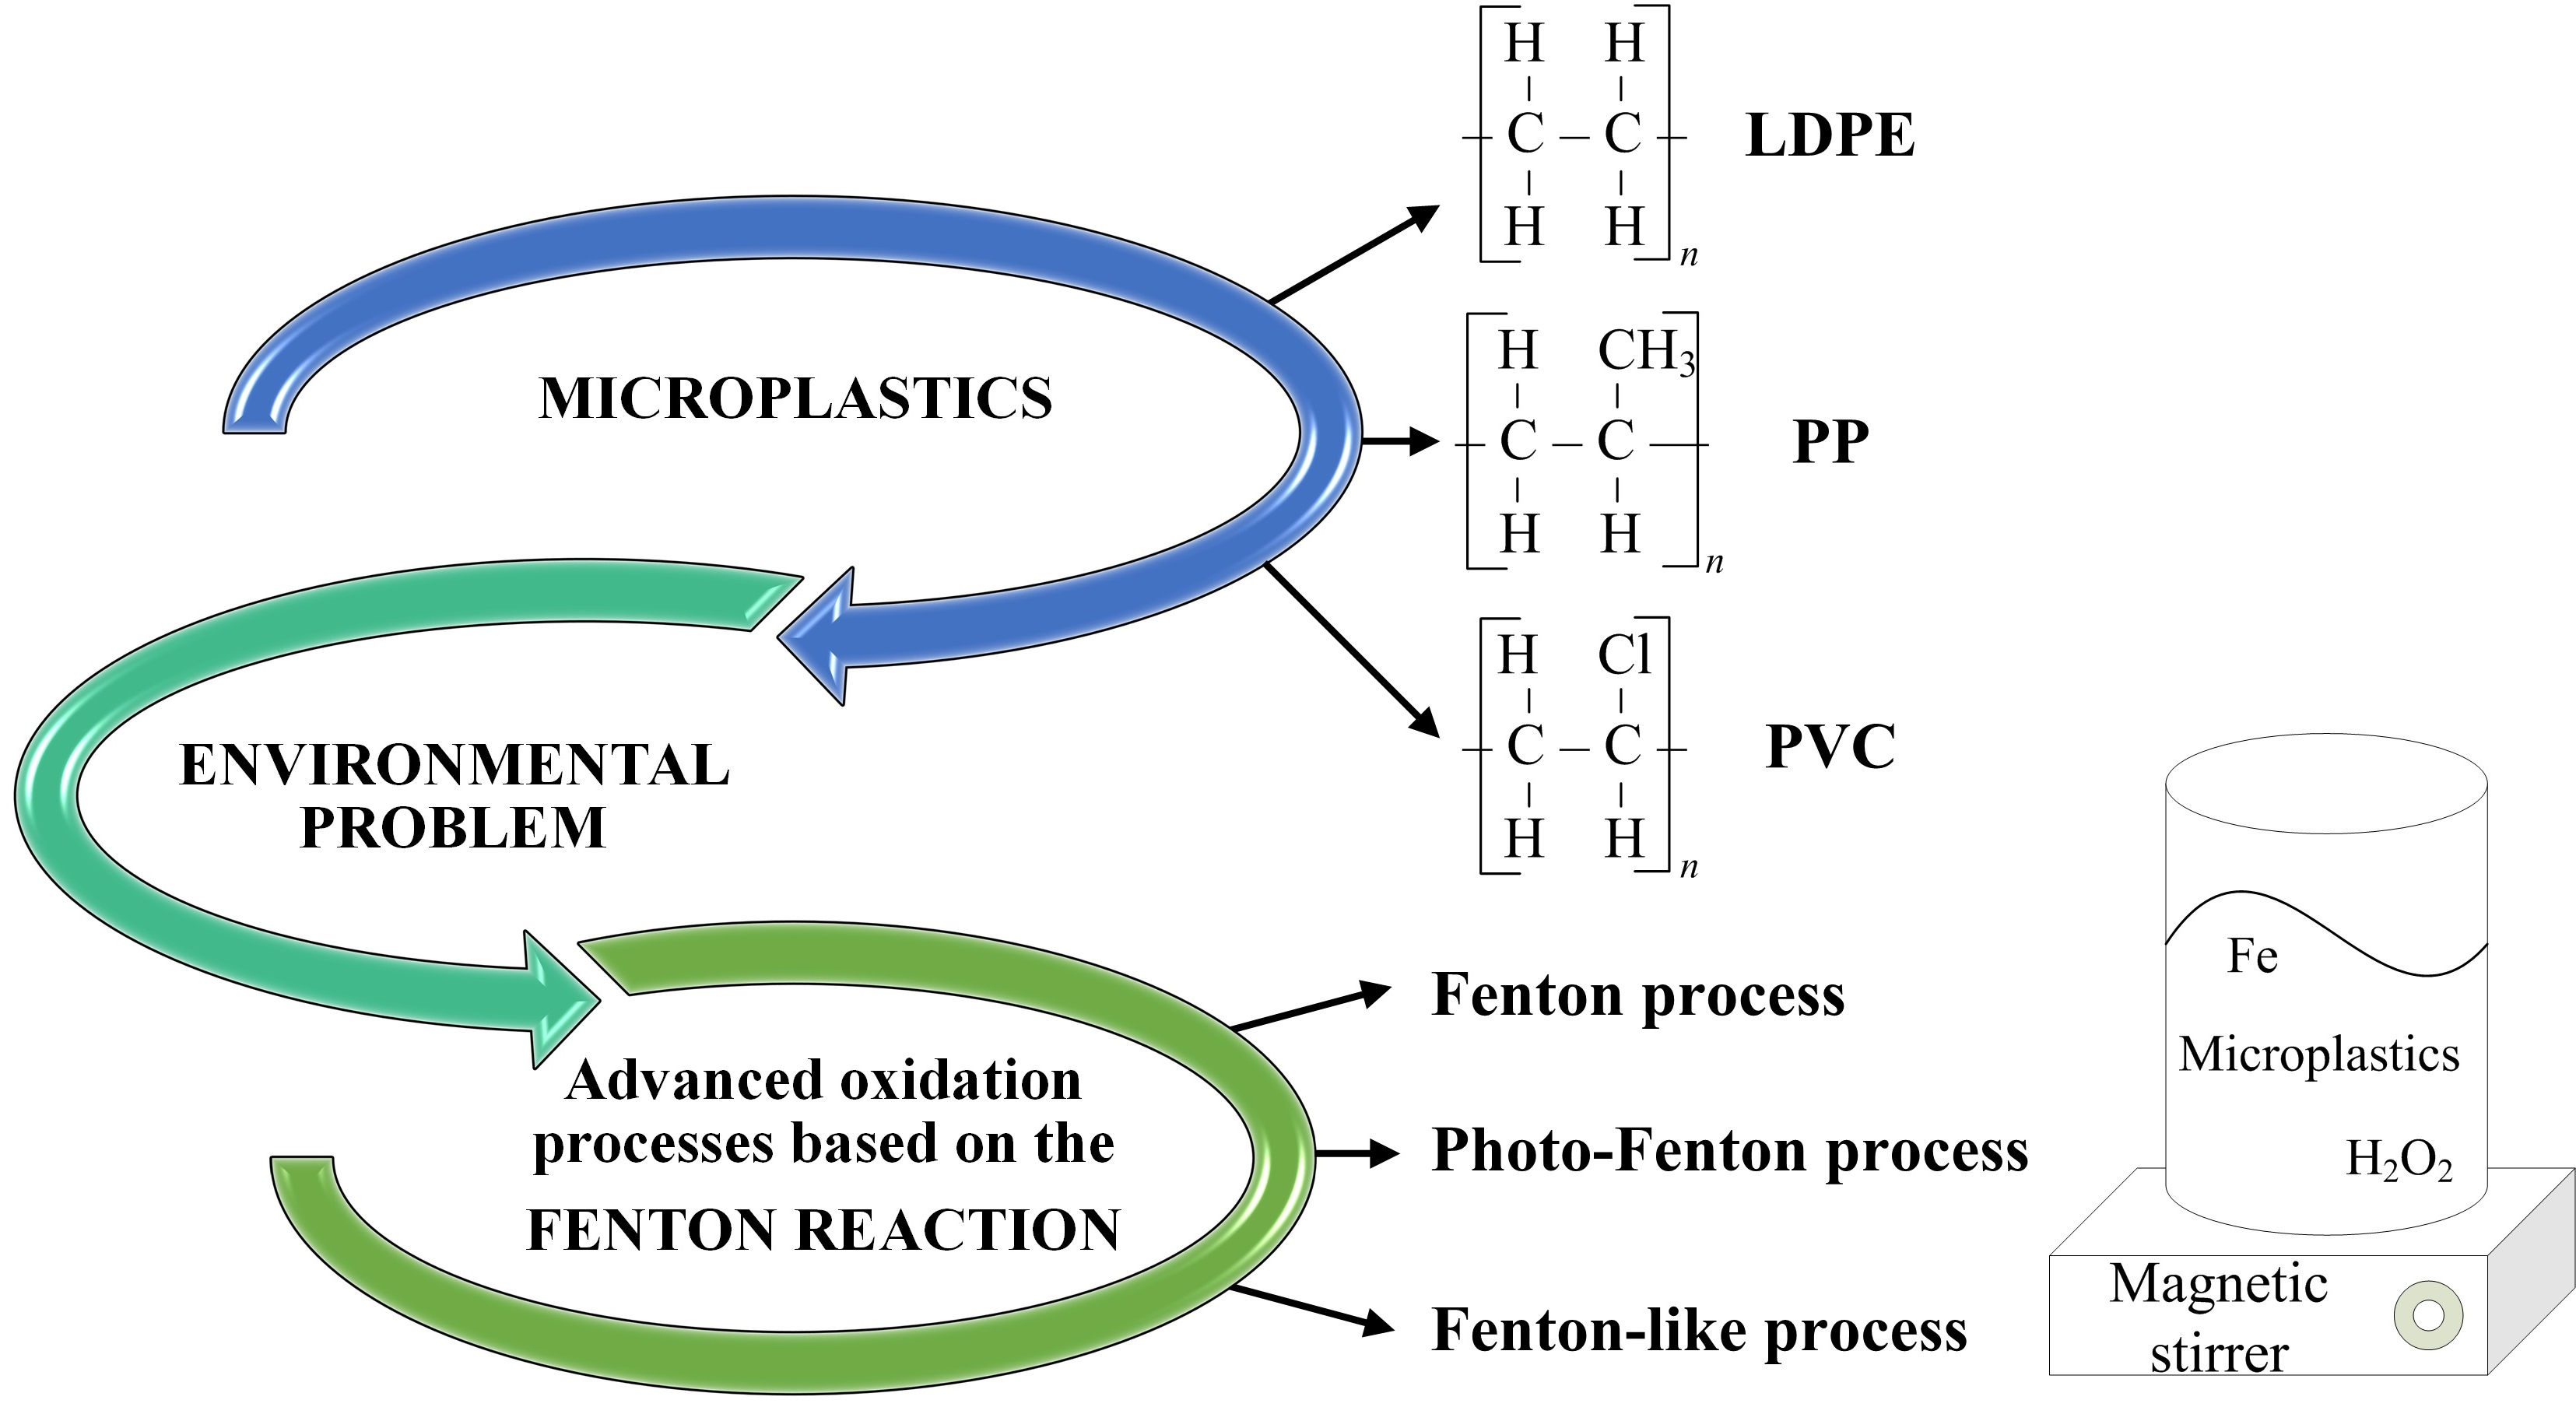
2. Fenton-Based Processes
3. Materials and Methods
3.1. Reagents and Solutions
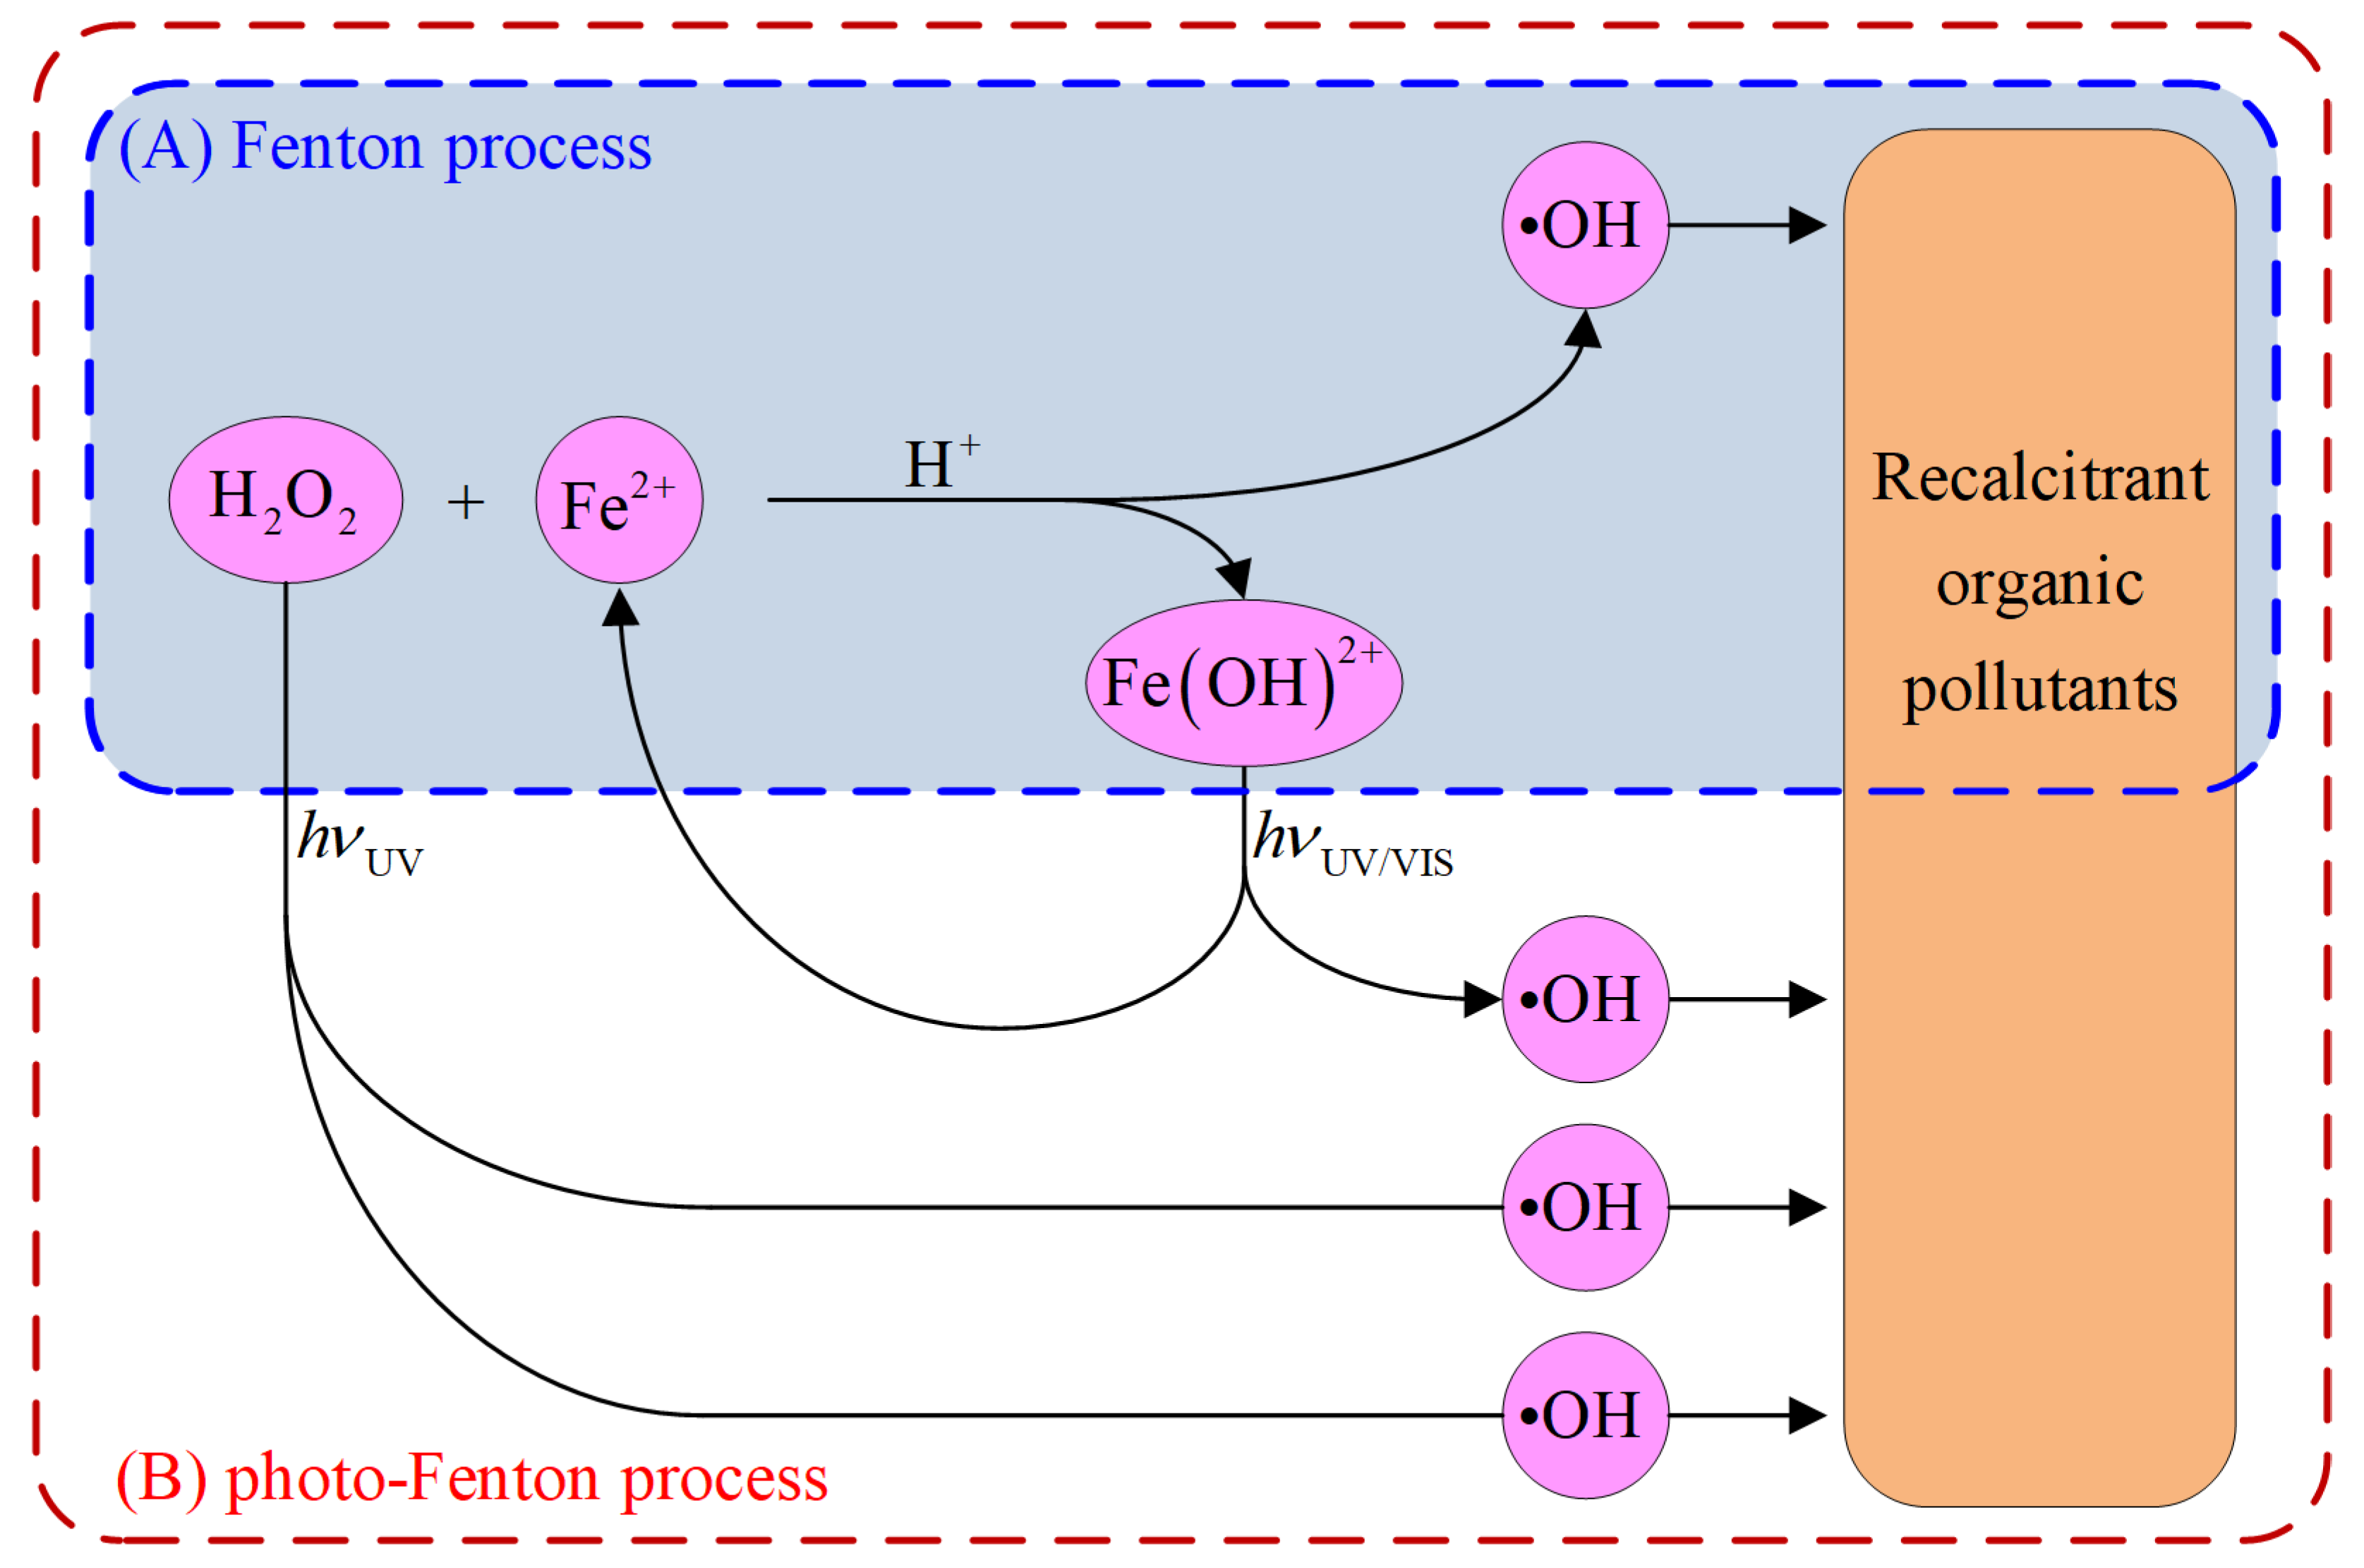
3.2. Preparation and Characterisation of Microplastics
3.3. AOP Treatments
3.4. Determination of Optimal Conditions
4. Results and Discussion
5. Conclusions
Author Contributions
Funding
Data Availability Statement
Conflicts of Interest
References
- Finch, C.E. Evolution of the human lifespan and diseases of aging: Roles of infection, inflammation, and nutrition. Proc. Natl. Acad. Sci. USA 2010, 107, 1718–1724. [Google Scholar] [CrossRef]
- Blagosklonny, M.V. Why human lifespan is rapidly increasing: Solving “longevity riddle” with “revealed-slow-aging” hypothesis. Aging 2010, 2, 177–182. [Google Scholar] [CrossRef] [PubMed]
- United Nations Population Fund, World Population Trends. Available online: https://www.unfpa.org/world-population-trends#readmore-expand (accessed on 20 February 2023).
- Ukaogo, P.O.; Ewuzie, U.; Onwuka, C.V. Environmental pollution: Causes, effects, and the remedies. In Microorganisms for Sustainable Environment and Health; Chowdhary, P., Raj, A., Verma, D., Akhter, Y., Eds.; Elsevier: Chennai, India, 2020; pp. 419–429. [Google Scholar] [CrossRef]
- Martinez, J.L. Environmental pollution by antibiotics and by antibiotic resistance determinants. Environ. Pollut. 2009, 157, 2893–2902. [Google Scholar] [CrossRef] [PubMed]
- Chen, J.; Wu, J.; Sherrell, P.C.; Chen, J.; Wang, H.; Zhang, W.-x.; Yang, J. How to Build a Microplastics-Free Environment: Strategiesfor Microplastics Degradation and Plastics Recycling. Adv. Sci. 2022, 9, 2103764. [Google Scholar] [CrossRef] [PubMed]
- Erceg, M.; Tutman, P.; Vojanić Varezić, D.; Bobanović, A. Karakterizacija mikroplastike u sedimentu plaže Prapratno. Kem. Ind. 2020, 69, 253–260. [Google Scholar] [CrossRef]
- Gasperi, J.; Wright, S.L.; Dris, R.; Collard, F.; Mandin, C.; Guerrouache, M.; Langlois, V.; Kelly, F.J.; Tassin, B. Microplastics in air: Are we breathing it in? Curr. Opin. Environ. Sci. Health 2018, 1, 1–5. [Google Scholar] [CrossRef]
- Boots, B.; Russell, C.W.; Green, D.S. Effects of Microplastics in Soil Ecosystems: Above and Below Ground. Environ. Sci. Technol. 2019, 53, 11496–11506. [Google Scholar] [CrossRef] [PubMed]
- Scherer, C.; Weber, A.; Stock, F.; Vurusic, S.; Egerci, H.; Kochleus, C.; Arendt, N.; Foeldi, C.; Dierkes, G.; Wagner, M.; et al. Comparative assessment of microplastics in water and sediment of a large European river. Sci. Total Environ. 2020, 738, 139866. [Google Scholar] [CrossRef]
- Akhbarizadeh, R.; Moore, F.; Keshavarzi, B. Investigating microplastics bioaccumulation and biomagnification in seafood from the Persian Gulf: A threat to human health? Food Addit. Contam. A 2019, 36, 1696–1708. [Google Scholar] [CrossRef]
- Yuan, Z.; Nag, R.; Cummins, E. Human health concerns regarding microplastics in the aquatic environment—From marine to food systems. Sci. Total Environ. 2022, 823, 153730. [Google Scholar] [CrossRef]
- Miller, M.E.; Hamann, M.; Kroon, F.J. Bioaccumulation and biomagnification of microplastics in marine organisms: A review and meta-analysis of current data. PLoS ONE 2020, 15, e0240792. [Google Scholar] [CrossRef] [PubMed]
- Covernton, G.A.; Cox, K.D.; Fleming, W.L.; Buirs, B.M.; Davies, H.L.; Juanes, F.; Dudas, S.E.; Dower, J.F. Large size (>100 μm) microplastics are not biomagnifying in coastal marine food webs of British Columbia, Canada. Ecol. Appl. 2022, 32, e2654. [Google Scholar] [CrossRef] [PubMed]
- Cui, W.; Gao, P.; Zhang, M.; Wang, L.; Sun, H.; Liu, C. Adverse effects of microplastics on earthworms: A critical review. Sci. Total Environ. 2022, 850, 158041. [Google Scholar] [CrossRef]
- Zolotova, N.; Kosyreva, A.; Dzhalilova, D.; Fokichev, N.; Makarova, O. Harmful effects of the microplastic pollution on animal health: A literature review. PeerJ 2022, 10, e13503. [Google Scholar] [CrossRef]
- Lei, L.; Liu, M.; Song, Y.; Lu, S.; Hu, J.; Cao, C.; Xie, B.; Shi, H.; He, D. Polystyrene (nano)microplastics cause size-dependent neurotoxicity, oxidative damage and other adverse effects in Caenorhabditis elegans. Environ. Sci. Nano 2018, 5, 2009–2020. [Google Scholar] [CrossRef]
- Rubio-Armendáriz, C.; Alejandro-Vega, S.; Paz-Montelongo, S.; Gutiérrez-Fernández, Á.J.; Carrascosa-Iruzubieta, C.J.; Hardisson-de la Torre, A. Microplastics as Emerging Food Contaminants: A Challenge for Food Safety. Int. J. Environ. Res. Public Health 2022, 19, 1174. [Google Scholar] [CrossRef]
- Bule Možar, K.; Miloloža, M.; Martinjak, V.; Cvetnić, M.; Kušić, H.; Bolanča, T.; Kučić Grgić, D.; Ukić, Š. Potential of Advanced Oxidation as Pretreatment for Microplastics Biodegradation. Separations 2023, 10, 132. [Google Scholar] [CrossRef]
- Poerio, T.; Piacentini, E.; Mazzei, R. Membrane Processes for Microplastic Removal. Molecules 2019, 24, 4148. [Google Scholar] [CrossRef]
- Lupu, G.-I.; Orbeci, C.; Bobirică, L.; Bobirică, C.; Pascu, L.F. Key Principles of Advanced Oxidation Processes: A Systematic Analysis of Current and Future Perspectives of the Removal of Antibiotics from Wastewater. Catalysts 2023, 13, 1280. [Google Scholar] [CrossRef]
- Volke-Sepúlveda, T.; Saucedo-Castañeda, G.; Gutiérrez-Rojas, M.; Manzur, A.; Favela-Torres, E. Thermally treated low density polyethylene biodegradation by Penicillium pinophilum and Aspergillus niger. J. Appl. Polym. Sci. 2002, 83, 305–314. [Google Scholar] [CrossRef]
- Esmaeili, A.; Pourbabaee, A.A.; Alikhani, H.A.; Shabani, F.; Esmaeili, E. Biodegradation of low-density polyethylene (LDPE) by mixed culture of Lysinibacillus xylanilyticus and Aspergillus niger in soil. PLoS ONE 2013, 8, e71720. [Google Scholar] [CrossRef]
- Ortiz, D.; Munoz, M.; Nieto-Sandoval, J.; Romera-Castillo, C.; de Pedro, Z.M.; Casas, J.A. Insights into the degradation of microplastics by Fenton oxidation: From surface modification to mineralization. Chemosphere 2022, 309, 136809. [Google Scholar] [CrossRef]
- Lang, M.; Yu, X.; Liu, J.; Xia, T.; Wang, T.; Jia, H.; Guo, X. Fenton aging significantly affects the heavy metal adsorption capacity of polystyrene microplastics. Sci. Total Environ. 2020, 722, 137762. [Google Scholar] [CrossRef] [PubMed]
- Piazza, V.; Uheida, A.; Gambardella, C.; Garaventa, F.; Faimali, M.; Dutta, J. Ecosafety Screening of Photo-Fenton Process for the Degradation of Microplastics in Water. Front. Mar. Sci. 2022, 8, 791431. [Google Scholar] [CrossRef]
- Miao, F.; Liu, Y.; Gao, M.; Yu, X.; Xiao, P.; Wang, M.; Wang, S.; Wang, X. Degradation of polyvinyl chloride microplastics via an electro-Fenton-like system with a TiO2/graphite cathode. J. Hazard. Mater. 2020, 399, 123023. [Google Scholar] [CrossRef] [PubMed]
- Liu, X.; Sun, P.; Qu, G.; Jing, J.; Zhang, T.; Shi, H.; Zhao, Y. Insight into the characteristics and sorption behaviours of aged polystyrene microplastics through three type of accelerated oxidation processes. J. Hazard. Mater. 2021, 407, 124836. [Google Scholar] [CrossRef] [PubMed]
- Amelia, D.; Karamah, E.F.; Mahardika, M.; Syafri, E.; Rangappa, S.M.; Siengchin, S.; Asrofi, M. Effect of advanced oxidation process for chemical structure changes of polyethylene microplastics. Mater Today Proc. 2021, 52, 2501–2504. [Google Scholar] [CrossRef]
- Wang, Q.; Chen, M.; Min, Y.; Shi, P. Aging of polystyrene microplastics by UV/sodium percarbonate oxidation: Organic release, mechanism, and disinfection by-product formation. J. Hazard. Mater. 2024, 464, 132934. [Google Scholar] [CrossRef]
- de Aragão Belé, T.G.; Neves, T.F.; Cristale, J.; Prediger, P.; Constapel, M.; Dantas, R.F. Oxidation of microplastics by O3 and O3/H2O2: Surface modification and adsorption capacity. J. Water Process Eng. 2021, 41, 102072. [Google Scholar] [CrossRef]
- Ouyang, Z.; Li, S.; Zhao, M.; Wangmu, Q.; Ding, R.; Xiao, C.; Guo, X. The aging behavior of polyvinyl chloride microplastics promoted by UV-activated persulfate process. J. Hazard. Mater. 2022, 424, 127461. [Google Scholar] [CrossRef]
- Kang, J.; Zhou, L.; Duan, X.; Sun, H.; Ao, Z.; Wang, S. Degradation of cosmetic microplastics via functionalized carbon nanosprings. Matter 2019, 1, 745–758. [Google Scholar] [CrossRef]
- Luo, H.; Zeng, Y.; Zhao, Y.; Xiang, Y.; Li, Y.; Pan, X. Effects of advanced oxidation processes on leachates and properties of microplastics. J. Hazard. Mater. 2021, 413, 125342. [Google Scholar] [CrossRef] [PubMed]
- Zhou, L.; Wang, T.; Qu, G.; Jia, H.; Zhu, L. Probing the aging processes and mechanisms of microplastic under simulated multiple actions generated by discharge plasma. J. Hazard. Mater. 2020, 398, 122956. [Google Scholar] [CrossRef] [PubMed]
- Kastanek, F.; Spacilova, M.; Krystynik, P.; Dlaskova, M.; Solcova, O. Fenton Reaction–Unique but Still Mysterious. Processes 2023, 11, 432. [Google Scholar] [CrossRef]
- Deng, Y.; Zhao, R. Advanced oxidation processes (AOPs) in wastewater treatment. Curr. Pollut. Rep. 2015, 1, 167–176. [Google Scholar] [CrossRef]
- Hamd, W.; Daher, E.A.; Tofa, T.S.; Dutta, J. Recent Advances in Photocatalytic Removal of Microplastics: Mechanisms, Kinetic Degradation, and Reactor Design. Front. Mar. Sci. 2022, 9, 885614. [Google Scholar] [CrossRef]
- Mohammed Bello, M.; Abdul Raman, A.A.; Asghar, A. A review on approaches for addressing the limitations of Fenton oxidation for recalcitrant wastewater treatment. Process Saf. Environ. Prot. 2019, 126, 119–140. [Google Scholar] [CrossRef]
- Armstrong, D.A.; Huie, R.E.; Koppenol, W.H.; Lymar, S.V.; Merényi, G.; Neta, P.; Ruscic, B.; Stanbury, D.M.; Steenken, S.; Wardman, P. Standard electrode potentials involving radicals in aqueous solution: Inorganic radicals (IUPAC Technical Report). Pure Appl. Chem. 2015, 87, 1139–1150. [Google Scholar] [CrossRef]
- Kovacic, M.; Kusic, H.; Loncaric Bozic, A.; Dionysiou, D.D. Advanced Oxidation Processes. In Encyclopedia of Water: Science, Technology, and Society; Maurice, P.A., Ed.; Wiley: Hoboken, NJ, USA, 2019; Volume 4, pp. 1925–1940. [Google Scholar] [CrossRef]
- Garcia-Costa, A.L.; Casas, J.A. Intensification strategies for thermal H2O2-based advanced oxidation processes: Current trends and future perspectives. Chem. Eng. J. Adv. 2022, 9, 100228. [Google Scholar] [CrossRef]
- Xu, M.; Wu, C.; Zhou, Y. Advancements in the Fenton Process for Wastewater Treatment. In Advanced Oxidation Processes—Applications, Trends, and Prospects; Bustillo-Lecompte, C., Ed.; IntechOpen: Rijeka, Croatia, 2020; pp. 1–17. [Google Scholar] [CrossRef]
- Patel, D.; Wu, J.; Chan, P.; Upreti, S.; Turcotte, G.; Ye, T. Surface modification of low density polyethylene films by homogeneous catalytic ozonation. Chem. Eng. Res. Des. 2012, 90, 1800–1806. [Google Scholar] [CrossRef]
- Ameta, R.; Chohadia, A.K.; Jain, A.; Punjabi, P.B. Fenton and Photo-Fenton Processes. In Advanced Oxidation Processes for Waste Water Treatment: Emerging Green Chemical Technology; Ameta, S.C., Ameta, R., Eds.; Academic Press: Chennai, India, 2018; pp. 49–87. [Google Scholar] [CrossRef]
- Wang, N.; Zheng, T.; Zhang, G.; Wang, P. A review on Fenton-like processes for organic wastewater treatment. J. Environ. Chem. Eng. 2016, 4, 762–787. [Google Scholar] [CrossRef]
- Ribas Fargas, D. In Situ Groundwater Remediation Treatments: Natural Denitrification Study and Nano Zero Valent Iron Production. Ph.D. Thesis, Universitat Politècnica de Catalunya, Barcelona, Spain, 2017. [Google Scholar]
- Jang, M.-H.; Lim, M.; Hwang, Y.S. Potential environmental implications of nanoscale zero-valent iron particles for environmental remediation. Environ. Health Toxicol. 2014, 29, e2014022. [Google Scholar] [CrossRef]
- Gacitua, M.; Pavez, L.; Escudey, M.; Antilén, M. Adsorption of Zerovalent Iron Nanoparticles in the Inorganic Fraction of Volcanic Soils. J. Soil Sci. Plant. Nutr. 2022, 22, 2392–2405. [Google Scholar] [CrossRef]
- Kušić, H.; Lončarić Božić, A.; Koprivanac, N. Fenton type processes for minimization of organic content in coloured wastewaters: Part I: Processes optimization. Dyes Pigment. 2007, 74, 380–387. [Google Scholar] [CrossRef]
- Fentons Reagent General Chemistry Using H2O2. Available online: https://www.h2o2.com/pages.aspx?pid=143&name=General-Chemistry-of-Fenton-s-Reagent (accessed on 7 July 2023).
- Eyjolfsson, R. Chapter One—Introduction. In Design and Manufacture of Pharmaceutical Tablets; Eyjolfsson, R., Ed.; Academic Press: London, UK, 2015; pp. 1–28. [Google Scholar] [CrossRef]
- Miloloža, M.; Ukić, Š.; Cvetnić, M.; Bolanča, T.; Kučić Grgić, D. Optimization of Polystyrene Biodegradation by Bacillus cereus and Pseudomonas alcaligenes Using Full Factorial Design. Polymers 2022, 14, 4299. [Google Scholar] [CrossRef]
- Bule Možar, K.; Miloloža, M.; Martinjak, V.; Cvetnić, M.; Ocelić Bulatović, V.; Mandić, V.; Bafti, A.; Ukić, Š.; Kučić Grgić, D.; Bolanča, T. Bacteria and Yeasts Isolated from the Environment in Biodegradation of PS and PVC Microplastics: Screening and Treatment Optimization. Environments 2023, 10, 207. [Google Scholar] [CrossRef]
- Cvetnic, M.; Ukic, S.; Kusic, H.; Bolanca, T.; Loncaric Bozic, A. Photooxidative Degradation of Pesticides in Water; Response Surface Modeling Approach. J. Adv. Oxid. Technol. 2017, 20, 20160172. [Google Scholar] [CrossRef][Green Version]
- Markic, M.; Cvetnic, M.; Ukic, S.; Kusic, H.; Bolanca, T.; Loncaric Bozic, A. Influence of process parameters on the effectiveness of photooxidative treatment of pharmaceuticals. J. Environ. Sci. Health A 2018, 53, 338–351. [Google Scholar] [CrossRef] [PubMed]
- Miloloža, M.; Bule, K.; Ukić, Š.; Cvetnić, M.; Bolanča, T.; Kušić, H.; Ocelić Bulatović, V.; Kučić Grgić, D. Ecotoxicological Determination of Microplastic Toxicity on Algae Chlorella sp.: Response Surface Modeling Approach. Water Air Soil Pollut. 2021, 232, 327. [Google Scholar] [CrossRef]
- Liu, X. Organic Chemistry I; Kwantlen Polytechnic University: Surrey, BC, Canada, 2021; p. 198. [Google Scholar]
- Celina, M.C.; Linde, E.; Martinez, E. Carbonyl Identification and Quantification Uncertainties for Oxidative Polymer Degradation. Polym. Degrad. Stab. 2021, 188, 109550. [Google Scholar] [CrossRef]
- Kumari, A.; Chaudhary, D.R.; Jha, B. Destabilization of polyethylene and polyvinylchloride structure by marine bacterial strain. Environ. Sci. Pollut. Res. 2019, 26, 1507–1516. [Google Scholar] [CrossRef]
- Subramani, M.; Sepperumal, U. FTIR analysis of bacterial mediated chemical changes in Polystyrene foam. Ann. Biol. Res. 2016, 7, 55–61. [Google Scholar]
- Lu, J.; Ma, S.; Gao, J. Study on the Pressurized Hydrolysis Dechlorination of PVC. Energy Fuels 2002, 16, 1251–1255. [Google Scholar] [CrossRef]
- Dobberphul, H. Organic Chemistry—MLC; Martin Luther College: New Ulm, MN, USA; p. 3.1.12.1. Available online: https://chem.libretexts.org/Courses/Martin_Luther_College/Organic_Chemistry_-_MLC/03%3A_Alcohols_Ethers_Thiols_Sulfides_and_Amines/3.01%3A_Alcohols_and_Phenols/3.1.12%3A_Spectroscopy_of_Alcohols_and_Phenols (accessed on 16 February 2024).
- Gaumet, S.; Gardette, J.-L. Photo-oxidation of poly(vinyl chloride): Part 2—A comparative study of the carbonylated products in photo-chemical and thermal oxidations. Polym. Degrad. Stab. 1991, 33, 17–34. [Google Scholar] [CrossRef]
- Ahmed, A.; El-Hiti, G.A.; Hadi, A.G.; Ahmed, D.S.; Baashen, M.A.; Hashim, H.; Yousif, E. Photostabilization of Poly(vinyl chloride) Films Blended with Organotin Complexes of Mefenamic Acid for Outdoor Applications. Appl. Sci. 2021, 11, 2853. [Google Scholar] [CrossRef]
- Zhang, Y.; Pedersen, J.N.; Eser, B.E.; Guo, Z. Biodegradation of polyethylene and polystyrene: From microbial deterioration to enzyme discovery. Biotechnol. Adv. 2022, 60, 107991. [Google Scholar] [CrossRef]
- Ainali, N.M.; Bikiaris, D.N.; Lambropoulou, D.A. Aging effects on low- and high-density polyethylene, polypropylene and polystyrene under UV irradiation: An insight into decomposition mechanism by Py-GC/MS for microplastic analysis. J. Anal. Appl. Pyrolysis 2021, 158, 105207. [Google Scholar] [CrossRef]
- Yousif, E.; Hasan, A. Photostabilization of poly(vinyl chloride)—Still on the run. J. Taibah Univ. Sci. 2015, 9, 421–448. [Google Scholar] [CrossRef]
- Payne, L.B. The Dehydrochlorination Mechanism of the Internal Allylic Chloride Structure in Poly(vinyl chloride). Ph.D. Thesis, College of William & Mary, Williamsburg, VA, USA, 2020. [Google Scholar] [CrossRef]
- Li, X.; Wang, J.; Rykov, A.I.; Sharma, V.K.; Wei, H.; Jin, C.; Liu, X.; Li, M.; Yu, S.; Sun, C.; et al. Prussian blue/TiO2 nanocomposites as a heterogeneous photo-Fenton catalyst for degradation of organic pollutants in water. Catal. Sci. Technol. 2015, 5, 504–514. [Google Scholar] [CrossRef]
- Kowalska, B.; Klepka, T.; Kowalski, D. Influence of chlorinated water on mechanical properties of polyethylene and polyvinyl chloride pipes. WIT Trans. Built Environ. 2016, 165, 63–74. [Google Scholar] [CrossRef]
- Jia, X.; Qin, C.; Friedberger, T.; Guan, Z.; Huang, Z. Efficient and selective degradation of polyethylenes into liquid fuels and waxes under mild conditions. Sci. Adv. 2016, 2, e1501591. [Google Scholar] [CrossRef]
- Burelo, M.; Hernández-Varela, J.D.; Medina, D.I.; Treviño-Quintanilla, C.D. Recent developments in bio-based polyethylene: Degradation studies, waste management and recycling. Heliyon 2023, 9, e21374. [Google Scholar] [CrossRef]
- Ul-Hamid, A.; Soufi, K.Y.; Al-Hadhrami, L.M.; Shemsi, A.M. Failure investigation of an underground low voltage XLPE insulated cable. Anti-Corros. Method. M. 2015, 62, 281–287. [Google Scholar] [CrossRef]
- Li, T.; Zhao, P.; Lei, M.; Li, Z. Understanding Hydrothermal Dechlorination of PVC by Focusing on the Operating Conditions and Hydrochar Characteristics. Appl. Sci. 2017, 7, 256. [Google Scholar] [CrossRef]
- Yaseen, A.A.; Yousif, E.; Al-Tikrity, E.T.B.; El-Hiti, G.A.; Kariuki, B.M.; Ahmed, D.S.; Bufaroosha, M. FTIR, Weight, and Surface Morphology of Poly(vinyl chloride) Doped with Tin Complexes Containing Aromatic and Heterocyclic Moieties. Polymers 2021, 13, 3264. [Google Scholar] [CrossRef]
- Kumari, P.; Kumar, A. ADVANCED OXIDATION PROCESS: A remediation technique for organic and non-biodegradable pollutant. Results Surf. Interfaces 2023, 11, 100122. [Google Scholar] [CrossRef]
- Ma, Y.-B.; Xie, Z.-Y.; Hamid, N.; Tang, Q.-P.; Deng, J.-Y.; Luo, L.; Pei, D.-S. Recent advances in micro (nano) plastics in the environment: Distribution, health risks, challenges and future prospects. Aquat. Toxicol. 2023, 261, 106597. [Google Scholar] [CrossRef] [PubMed]


| No. | pH | m(MPs):m(Fe) | m(H2O2):m(Fe) | No. | pH | m(MPs):m(Fe) | m(H2O2):m(Fe) | No. | pH | m(MPs):m(Fe) | m(H2O2):m(Fe) |
|---|---|---|---|---|---|---|---|---|---|---|---|
| 1 | 3.0 | 10:1 | 5:1 | 10 | 4.5 | 10:1 | 5:1 | 19 | 6.0 | 10:1 | 5:1 |
| 2 | 3.0 | 10:1 | 15:1 | 11 | 4.5 | 10:1 | 15:1 | 20 | 6.0 | 10:1 | 15:1 |
| 3 | 3.0 | 10:1 | 25:1 | 12 | 4.5 | 10:1 | 25:1 | 21 | 6.0 | 10:1 | 25:1 |
| 4 | 3.0 | 25:1 | 5:1 | 13 | 4.5 | 25:1 | 5:1 | 22 | 6.0 | 25:1 | 5:1 |
| 5 | 3.0 | 25:1 | 15:1 | 14 | 4.5 | 25:1 | 15:1 | 23 | 6.0 | 25:1 | 15:1 |
| 6 | 3.0 | 25:1 | 25:1 | 15 | 4.5 | 25:1 | 25:1 | 24 | 6.0 | 25:1 | 25:1 |
| 7 | 3.0 | 50:1 | 5:1 | 16 | 4.5 | 50:1 | 5:1 | 25 | 6.0 | 50:1 | 5:1 |
| 8 | 3.0 | 50:1 | 15:1 | 17 | 4.5 | 50:1 | 15:1 | 26 | 6.0 | 50:1 | 15:1 |
| 9 | 3.0 | 50:1 | 25:1 | 18 | 4.5 | 50:1 | 25:1 | 27 | 6.0 | 50:1 | 25:1 |
| Polymer | Treatment | ||
|---|---|---|---|
| Fenton | Photo-Fenton | Fenton-like | |
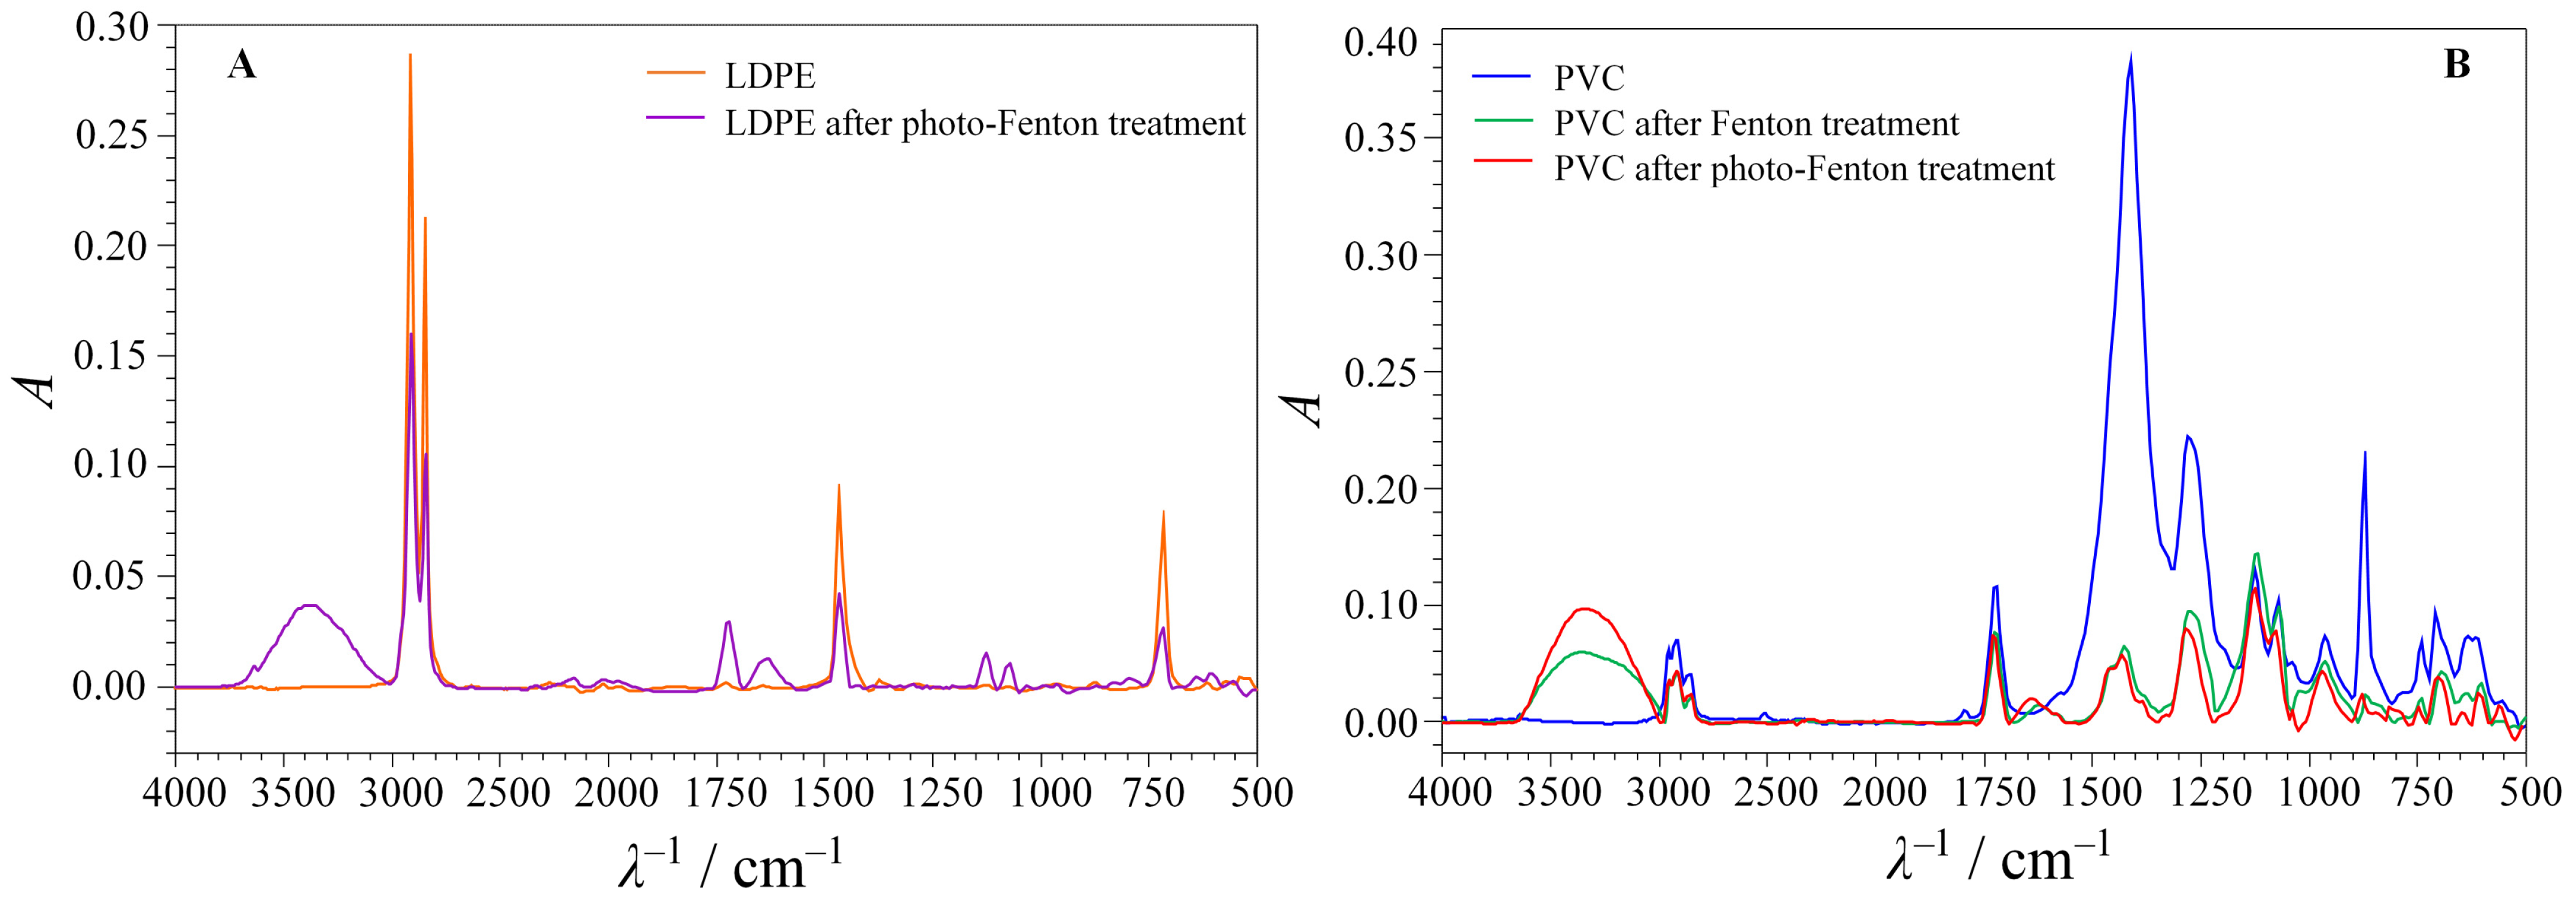
| LDPE | NO | YES | NO |
| PP | NO | NO | NO |
| PVC | YES | YES | NO |
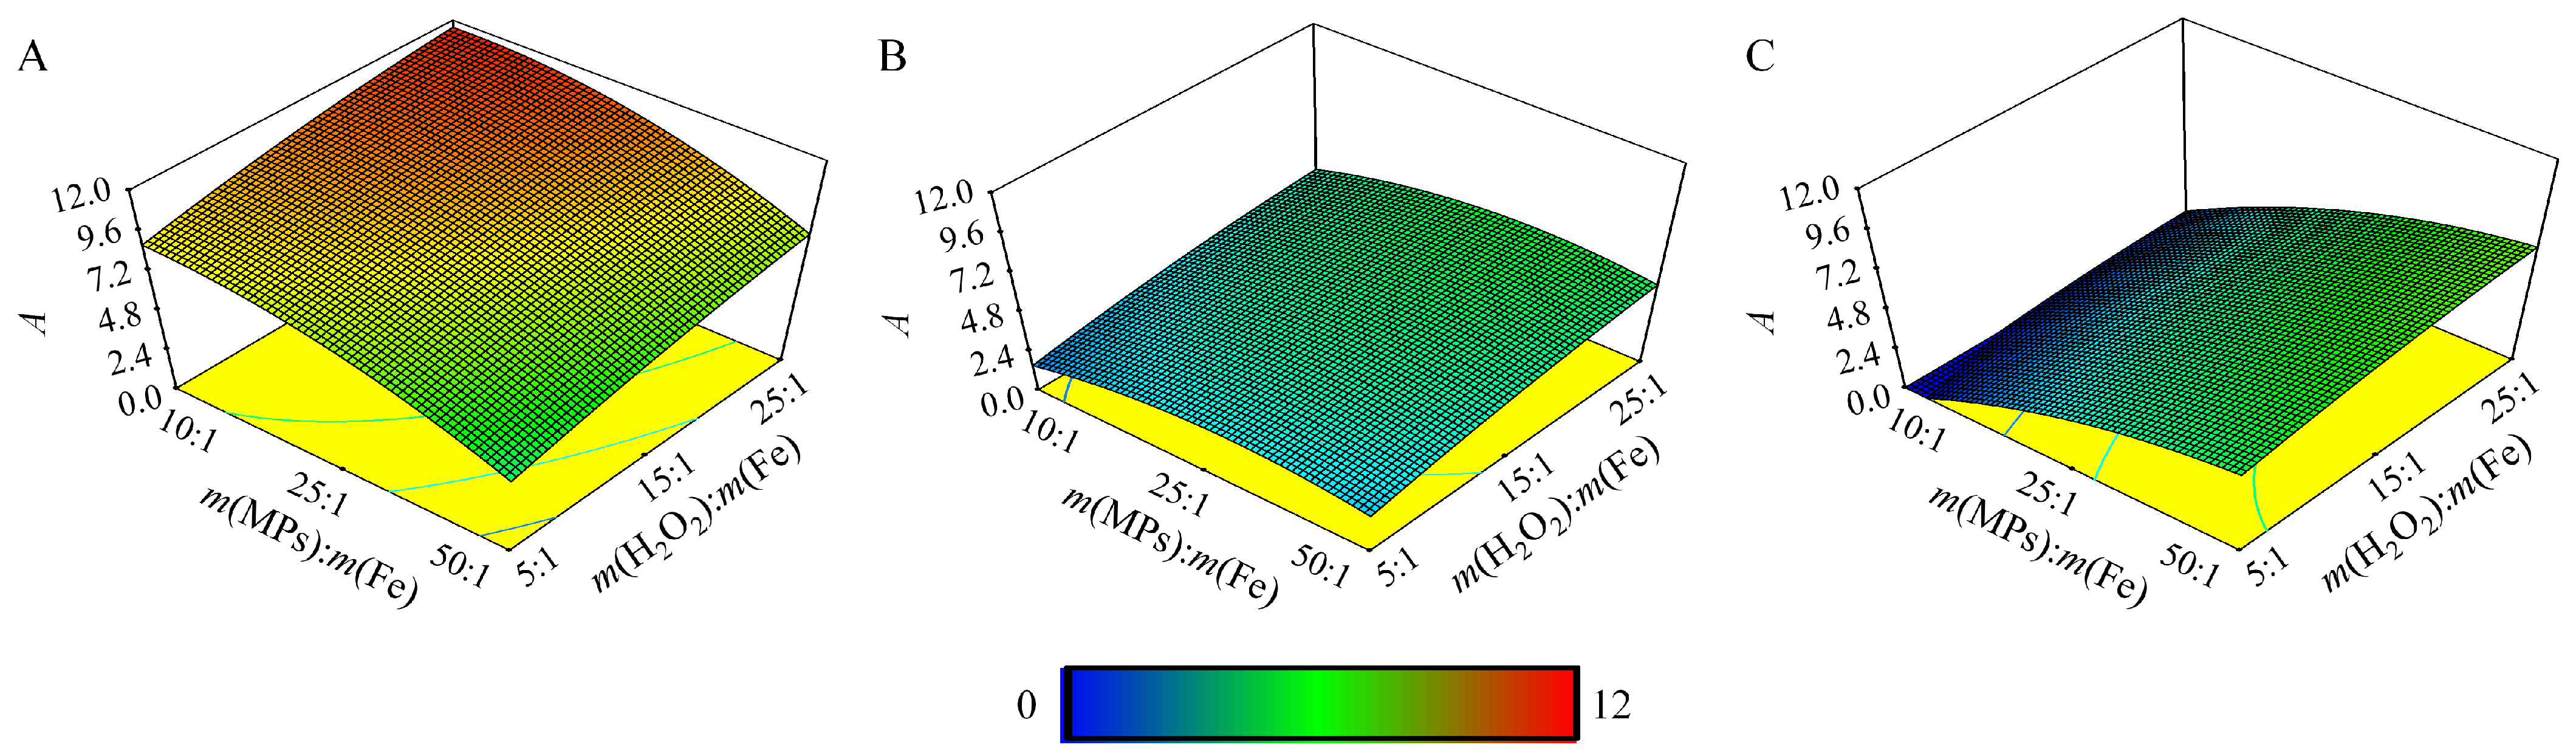
| Model | Coefficients | Influential Variables 1 | ||||||
|---|---|---|---|---|---|---|---|---|
| R2 | R2adj | F | p | Value | p | x1 | x2 | x3 |
| 0.8706 | 0.8021 | 12.71 | <0.0001 | a0 = 4.51 | - | |||
| a1 = −2.63 | <0.0001 | YES | ||||||
| a2 = 0.55 | 0.1534 | |||||||
| a3 = 1.14 | 0.0061 | YES | ||||||
| a4 = 2.52 | <0.0001 | YES | YES | |||||
| a5 = −0.30 | 0.5109 | |||||||
| a6 = 0.13 | 0.7692 | |||||||
| a7 = 2.51 | 0.0010 | YES | ||||||
| a8 = −1.02 | 0.1247 | |||||||
| a9 = −0.28 | 0.6640 | |||||||
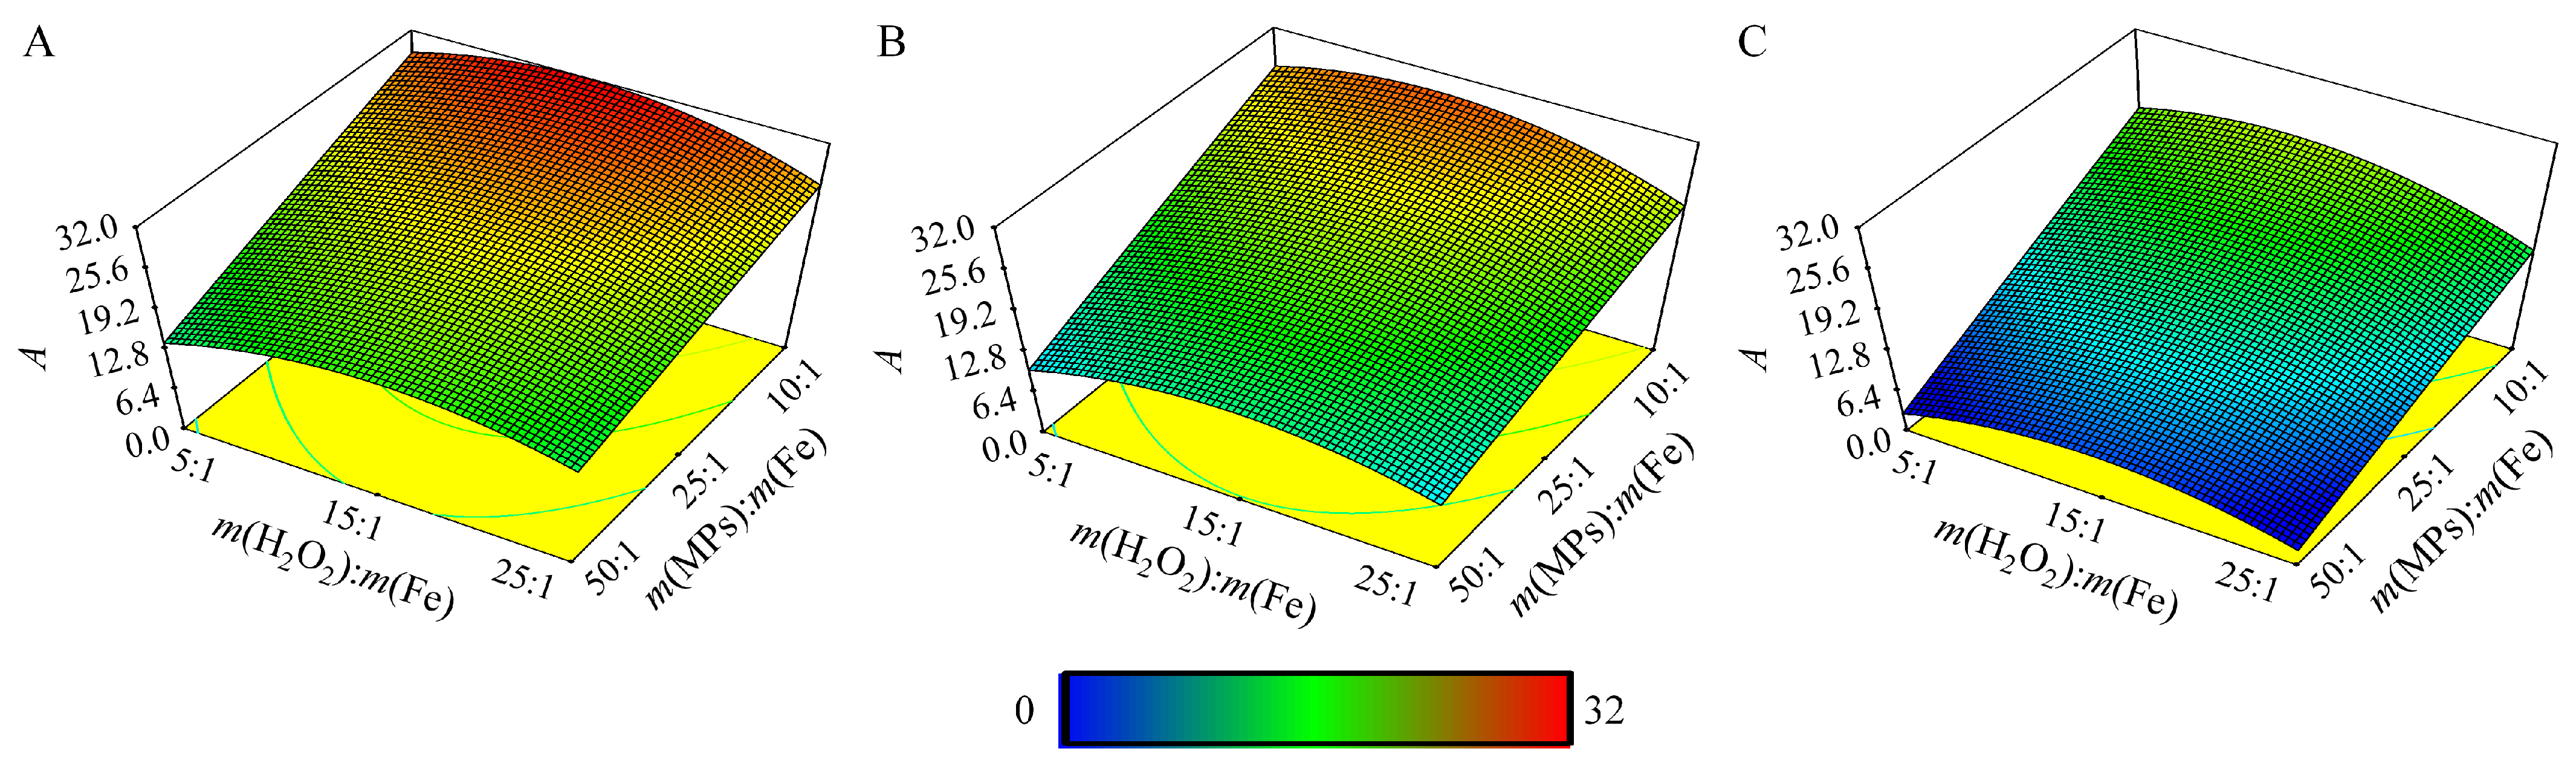
| Model | Coefficients | Influential Variables 1 | ||||||
|---|---|---|---|---|---|---|---|---|
| R2 | R2adj | F | p | Value | p | x1 | x2 | x3 |
| 0.8994 | 0.8462 | 16.89 | <0.0001 | a0 = 18.42 | - | |||
| a1 = −4.64 | <0.0001 | YES | ||||||
| a2 = −7.12 | <0.0001 | YES | ||||||
| a3 = −1.76 | 0.0289 | YES | ||||||
| a4 = 0.44 | 0.6347 | |||||||
| a5 = 0.64 | 0.4879 | |||||||
| a6 = 0.86 | 0.3531 | |||||||
| a7 = −1.70 | 0.2009 | |||||||
| a8 = 0.35 | 0.7878 | |||||||
| a9 = −3.90 | 0.0071 | YES | ||||||
| Model | Coefficients | Influential Variables 1 | ||||||
|---|---|---|---|---|---|---|---|---|
| R2 | R2adj | F | p | Value | p | x1 | x2 | x3 |
| 0.9340 | 0.8990 | 26.72 | <0.0001 | a0 = 22.29 | - | |||
| a1 = −5.35 | <0.0001 | YES | ||||||
| a2 = −7.00 | <0.0001 | YES | ||||||
| a3 = −0.76 | 0.2249 | |||||||
| a4 = −0.92 | 0.2265 | |||||||
| a5 = −0.43 | 0.5969 | |||||||
| a6 = 1.06 | 0.1690 | |||||||
| a7 = −1.80 | 0.1022 | |||||||
| a8 = −0.11 | 0.9185 | |||||||
| a9 = −4.25 | 0.0008 | YES | ||||||
| Polymer | Treatment | pH | m(MPs):m(Fe) | m(H2O2):m(Fe) |
|---|---|---|---|---|
| LDPE | Photo-Fenton | 3 | 12:1 | 25:1 |
| PVC | Fenton | 3 | 10:1 | 11:1 |
| Photo-Fenton | 3 | 10:1 | 15:1 |
Disclaimer/Publisher’s Note: The statements, opinions and data contained in all publications are solely those of the individual author(s) and contributor(s) and not of MDPI and/or the editor(s). MDPI and/or the editor(s) disclaim responsibility for any injury to people or property resulting from any ideas, methods, instructions or products referred to in the content. |
© 2024 by the authors. Licensee MDPI, Basel, Switzerland. This article is an open access article distributed under the terms and conditions of the Creative Commons Attribution (CC BY) license (https://creativecommons.org/licenses/by/4.0/).
Share and Cite
Bule Možar, K.; Miloloža, M.; Martinjak, V.; Radovanović-Perić, F.; Bafti, A.; Ujević Bošnjak, M.; Markić, M.; Bolanča, T.; Cvetnić, M.; Kučić Grgić, D.; et al. Evaluation of Fenton, Photo-Fenton and Fenton-like Processes in Degradation of PE, PP, and PVC Microplastics. Water 2024, 16, 673. https://doi.org/10.3390/w16050673
Bule Možar K, Miloloža M, Martinjak V, Radovanović-Perić F, Bafti A, Ujević Bošnjak M, Markić M, Bolanča T, Cvetnić M, Kučić Grgić D, et al. Evaluation of Fenton, Photo-Fenton and Fenton-like Processes in Degradation of PE, PP, and PVC Microplastics. Water. 2024; 16(5):673. https://doi.org/10.3390/w16050673
Chicago/Turabian StyleBule Možar, Kristina, Martina Miloloža, Viktorija Martinjak, Floren Radovanović-Perić, Arijeta Bafti, Magdalena Ujević Bošnjak, Marinko Markić, Tomislav Bolanča, Matija Cvetnić, Dajana Kučić Grgić, and et al. 2024. "Evaluation of Fenton, Photo-Fenton and Fenton-like Processes in Degradation of PE, PP, and PVC Microplastics" Water 16, no. 5: 673. https://doi.org/10.3390/w16050673
APA StyleBule Možar, K., Miloloža, M., Martinjak, V., Radovanović-Perić, F., Bafti, A., Ujević Bošnjak, M., Markić, M., Bolanča, T., Cvetnić, M., Kučić Grgić, D., & Ukić, Š. (2024). Evaluation of Fenton, Photo-Fenton and Fenton-like Processes in Degradation of PE, PP, and PVC Microplastics. Water, 16(5), 673. https://doi.org/10.3390/w16050673