Article

Ex-Ante Flooding Damages’ Monetary Valuation Model for Productive and Environmental Resources

by
Vincenzo Del Giudice
1,
Francesca Salvo
2,
Pierfrancesco De Paola
1,*,
Francesco Paolo Del Giudice
3 and
Daniela Tavano
2
1
Department of Industrial Engineering, University of Naples “Federico II”, Vincenzo Tecchio Sq. 80, 80125 Naples, Italy
2
Department of Environmental Engineering, University of Calabria, Pietro Bucci St., 87036 Rende, Italy
3
Department of Architecture and Design, University of Rome “Sapienza”, Borghese Sq. 9, 00186 Rome, Italy
*
Author to whom correspondence should be addressed.
Water 2024, 16(5), 665; https://doi.org/10.3390/w16050665
Submission received: 2 November 2023 / Revised: 19 February 2024 / Accepted: 22 February 2024 / Published: 24 February 2024
(This article belongs to the Special Issue Urban Flood Mitigation and Sustainable Stormwater Management)

Abstract

:
The floods caused by river flooding are increasingly at the center of public attention and government agencies. This is due to climate change, a higher risk consciousness of settled populations, as well as the deteriorating state of water basins caused by the persistent absence of appropriate controls on the use of mountain and hilly territories. In Italy, the risk of flooding is particularly high, posing a significant social problem due to the number of victims and the damage inflicted on properties, industries, and infrastructure. This paper aims to examine the principles and methods of evaluating the damage caused to the territory by river flooding. Two evaluation models are developed for the formal definition of the variation law of damage caused by flooding, considering the return period of the flood event. The first model allows the evaluation of damage to the productive part of the territory affected by floods, while the second considers damage related to the environmental aspects.

1. Introduction

The floods caused by river flooding are increasingly at the center of public attention and government agencies. This is attributed to the heightened cultural awareness and a more mature risk consciousness among settled populations, as well as the worsening state of disrepair of water basins resulting from the persistent absence of appropriate controls on the use of mountain and hilly territories.
In the Mediterranean area, an increasing number of floods are occurring, making both cities and rural areas more vulnerable [1,2,3]. Specifically, Italy is highly exposed to various geological hazards, leading to significant casualties each year. In this context, geohydrological disasters, encompassing all types of slope movements and floods, are undoubtedly among the most frequent and likely the most impactful on the built environment [4].
Factors such as urbanization and development contribute to accentuating the devastating effects of this natural disaster by reducing the soil’s capacity for water retention and increasing surface runoff [5]. Climate change, in turn, contributes to increasing the frequency and intensity of floods worldwide [6]. This combination of territorial, demographic, climatic, and unsustainable development factors threatens to intensify the risk of natural hazards, with even more worrying consequences for the environment and society, challenging the resilience of the latter to such dangers.
The European Union has sought to establish a strong regulatory framework to guide the prevention and risk planning policies of its member states. The Flood Directive 2007/60/EC (FD) has been adopted as a complement to the Water Framework Directive (WFD), acknowledging that Europe has experienced severe floods with devastating consequences and recognizes that extreme natural events are more often the result of climate change and intense urbanization. In particular, the FD aims to establish a framework for the assessment and management of flood risks, with the primary objective of reducing the negative effects on human health, the environment, cultural heritage, and economic activities connected with floods. The so-called “Piano di Gestione Rischio Alluvioni” (PGRA) is the operational tool provided for by Italian law, specifically Legislative Decree No. 49 of 2010, which implements the FD. PGRA covers all aspects of flood risk management, including flood prevention and risk protection, as well as flood forecasts and warning systems, taking into account the characteristics of the river basin.
One of the PGRA’s goals is the identification of measures to mitigate flood risk. Damage assessment is an essential condition for identifying the best strategies. It involves providing an early estimate of the economic damage suffered by the Public Administrations due to natural disasters, offering valuable technical support for decision-making in planning interventions, supporting the FD objectives (including the revision/updating of hazard maps and flood risk), and assessing the efficiency of defense or mitigation works to reduce hydrogeological risk. Regarding the latter point, a fundamental role in planning mitigation works for rivers, streams, and entire water basins is played by the monetary evaluation of flood damages. This evaluation is preliminary to the design of interventions since, in the absence of budget constraints, works must be sized so that the marginal variation of the potential damage or marginal benefit is equal to the marginal cost of implementation. It is also preliminary to the economic valuation of interventions since the measure of damage corresponds to the benefits obtained with the implementation of works, which are to be compared, in the analysis of feasibility, to the costs of implementation.
In general terms, damage assessment must be carried out ex-ante, i.e., to determine the extent of the prejudice that can be produced by a hypothetical event. Sometimes, however, it can be carried out ex-post, to ascertain the extent of the prejudice resulting from a real event, for the purpose of calculating, for example, compensation to be paid for the injury to a legally protected interest. In all cases, the assessment of flood damages must consider the multiplicity and heterogeneity of resources, both productive and environmental, affected by the event.
This study aims to examine the principles and methods of evaluating the damage caused to the territory by river flooding. The principles and methods considered aim at the monetary evaluation of flood damage to productive and environmental resources. The work is structured into five sections, some with theoretical–methodological purposes, others with applicative purposes. Preliminarily, a literature review concerning the types of flood damage and the methods of flood damage evaluation is outlined, distinguishing between the categories of productive resources (agricultural crops, business structures and plants, buildings, infrastructure, etc.) and environmental resources. First, a literature review is conducted about the types of flood damage and the method of evaluating flood damage. This review also examines the methodologies that could be used to assess indirect damages. A mathematical formulation of evaluative models follows this, which are then applied to a concrete case study. A discussion of the results and conclusions closes the work.

2. Principles of Flood Damage Valuation

2.1. Types of Flood Damages

Flood damages can broadly be classified into two fundamental categories (see Table 1): tangible and intangible damages [7,8,9]. Specifically, tangible damage can be quantified in monetary terms, whereas intangible damage cannot [10,11,12]. Translating intangible damage, such as the loss of ecosystem functions, is challenging due to the inability to readily assess its monetary value [13]. Flood damages can also be experienced in a direct or indirect manner [14]. Therefore, the tangible and intangible damages can be further divided into two subtypes, i.e., direct and indirect damages. Direct damages refer to the damage that resulted from the direct contact of flood water with individuals, properties, or any other asset, such as buildings and inventory items [9,15]. Indirect damages are caused by the flood’s impact and occur outside of the flooded area. In addition, it is sometimes necessary to distinguish between actual and potential damage [16,17]. Actual damage is the amount of damage that happened during a specific flood, while potential damage is the amount that would occur if there were no damage reduction measures in place. These damages are evaluated based on the type of data input, which may be real or hypothetical data [18]. Flood damages can also be classified into three levels: micro-scale, meso-scale, and macroscale [15]. This distinction is influenced by the spatial scope of damage assessment, the size of the study area, and the distinction between land use categories [19,20,21].
From an economic perspective, Meyer et al. (2013) categorize the impacts of disasters into direct, business interruption, and indirect costs [24]. Damages affecting humans, assets, properties, and any other objects in areas that had physical contact with the flood are considered direct [15,24]. Losses that occur to businesses directly affected by the disaster are termed business interruptions, often referred to as primary indirect damages because they happen when business activities are halted. Indirect losses are observed both within and outside the flooded area, as documented by Merz et al. (2010) and Messner et al. (2007) [15,21], and are attributed to direct expenses and/or business interruption expenses, as documented by Przyluski and Hallegatte (2011) [25]. The occurrence of indirect impacts is linked to the physical inventory of capital that is damaged, transmitted through the interconnections of economic systems [15,26], resulting in a disruption of economic flows [27,28].

2.2. Flood Damages to Productive Assets

Flood damages to productive resources are assessed based on the general principle that the amount of damage is proportional to the reduction in net income or the decrease in capital value resulting from the event [29,30,31].
From a methodological perspective, the damage assessment departs from the ordinary estimating principle. It is imperative that the assessment of the asset’s specific characteristics and its income-generating capabilities, as determined by the conditions in which it was discovered prior to the occurrence, be considered [32]. The assessment of flood damage also involves the preliminary definition of the intended uses and productive and infrastructural endowments of the areas affected by flooding. These areas require identification of the agricultural production arrangements, existing crops, fixed business investments, as well as the typological characteristics and consistency of urban settlements, network infrastructure, settlements, and industrial facilities.
The approaches to assess damages to agricultural products vary, with some models making a distinction only between damages to crops and damages to meadows [33], and others making a distinction between different types of crops [34,35]. The estimation is also influenced by the duration of the productive cycle of the damaged crops, which can be annual or multi-year, as well as the extent of the damage: partial or total [36].
The damage valuation to structures and business facilities departs from the conventional method of damage evaluation based on the diminution of income or capital value, given the impossibility of assigning a specific amount or income to these assets outside of the company’s overall context. Operationally, damage to structures and business facilities is measured based on relevant metrics that serve as proxy variables for the monetary measure of the damage. These metrics must be specified in relation to different damage scenarios: total damage, if the damaging event causes complete destruction of the structure or facility, and partial damage, if the event results in the loss of functionality and productive efficiency. The amount of damage caused by the total destruction of a commercial establishment can be compared to the diminished reconstruction expenditures associated with the building. The economic criterion employed is that of depreciated cost, used in estimating the replacement value of economic assets for which there are no market references [37].
The physical manifestations of flooding damage to buildings and urban areas are similar to those related to properties classified as business structures. The damage, in fact, involves the physical deterioration of various structures and materials of different kinds affected by flooding. Specifically:
  • For residential properties, including those designated for tourist–recreational purposes, the measure of damage can be determined in terms of a reduction in value or income, linked to the transition from the pre-event situation to the post-event situation.
  • For properties used for productive purposes generating business income, the damage is generally quantifiable through the decrease in net income resulting from the interruption of work phases, or the loss of goods and final services due to flooding. This general rule does not apply to industrial or commercial enterprises in the start-up or decline phase, as they may, in such cases, produce negative income or, in any case, limited positive income [38].

2.3. Damages to Environmental Resources and Contingent Valuation Method (CVM)

The contingent valuation method (CVM) can be employed to assess flood damages by gauging the economic value that individuals place on avoiding losses related to floods. This method involves posing hypothetical questions to individuals about how much they would be willing to pay to prevent flood damages. By analyzing the responses, researchers can determine the economic worth of flood damages and use these results to inform decision-making processes relating to flood management policies.
Generally, the CVM approach is widely used to monetize non-market goods and address issues by simulating actual market conditions [39]. Stated preference methods are survey-based approaches that seek to directly obtain people’s preferences using measures such as willingness to pay (WTP), to attain an environmental enhancement or to avoid an environmental degradation, or willingness to accept (WTA) compensation for reneging on an environmental enhancement. First used by Davis [40] to determine the value of recreational activities carried out within nature reserves, the CVM has found widespread applications for solving environmental problems, such as those related to air pollution [41], the protection and enhancement of the territory [42], and the management of water resources [43,44]. The CVM has been used in some cases for estimating the environmental impacts of natural hazards, especially floods. Markantonis et al. (2013) applied the CVM method in order to estimate the environmental costs associated with the extreme flood events in the Evros River during March–April 2006, including the impacts on soil, biodiversity, and the aesthetic environment of the flooded areas [45]. Messner et al. (2007) provided examples for the utilization of CVM, elucidated methods for monetizing environmental goods [21], and primarily based on the recommendations of Arrow et al. (1993), offered suggestions on the appropriate application of CVM techniques [46]. In another study, Daun and Clark (2000) utilized CVM to determine the WTP for the maintenance of current flood risk levels and/or the corresponding ecological enhancements in watersheds [47]. Furthermore, in the study conducted by Birol et al. (2006), a CVM was employed to determine the non-use values that are affected by droughts in the Cheimaditida wetland in Greece [48].
Designing a CVM survey requires several steps, with the most important, according to Hoevenagel (1994), being [49]: (a) defining the valuation problem and the hypothetical market; (b) selecting the sample; (c) designing the questionnaire—this step involves developing the basic structure of the questionnaire, selecting an appropriate elicitation format, and choosing an appropriate interview vehicle able to express a welfare measure, such as willingness to pay or to accept; (d) piloting the survey and consulting with relevant experts; (e) implementing the actual survey; (f) validating the WTP/WTA estimates; (g) analyzing the results.
Some limits of the CVM applications are due to a lack of comprehension in the questionnaire [50]. This leads to a response bias, as individuals are required to guess their WTP [51]. Another related issue is the so-called “embedding effect”, also known as “part–whole bias” [52]. Due to this effect, survey responses may be inconsistent [53]. A lack of motivation further contributes to a substantial number of non-responses, as individuals simply disregard the question because they are unable to comprehend the contingent valuation scenario [54]. One final issue arising from the hypothetical nature of the survey is that the responses of individuals may reflect factors other than their WTP [50].

2.4. Indirect Damages

Indirect damages can be estimated with different methodologies, such as post-event economic surveys [55,56,57], econometric models [58,59,60,61], input–output (I-O) models [62,63,64,65,66,67], and computable general equilibrium (CGE) models [68,69,70,71,72,73]. Each of these methodologies has multiple advantages and disadvantages. Specifically, post-event surveys and econometric models, if well-specified and based on good-quality data, can effectively quantify the indirect effects that damaging events can have on the national/local GDP. However, they are unable to describe sectoral interdependencies and thus identify the economic channels within the production system through which these effects propagate. In contrast, I-O and CGE models can analyze sectoral interdependencies in regional economies [74]. In I-O models, the production system is broken down into several sectors, and their interrelationships are expressed in terms of goods and services exchanged. CGE models can capture feedback effects on initially affected “markets” from the macroeconomic context [28]. They also, in principle, offer the possibility to simulate comparisons between what happened and what would have happened in the absence of the catastrophic event. However, CGE models have several limitations, as they assume perfect markets and cannot capture non-market values [71]. Another significant limitation of CGE models is their “coarse” unit of investigation, typically the country. This makes local analyses particularly challenging, especially for small and medium-sized disasters.
Due to the operational difficulties associated with the use of the above models, the assessment of indirect damages is typically conducted through empirical–argumentative procedures, leading to the evaluation of indirect damages in terms of percentage rates of direct damages [75].

3. Methods for Ex-Ante Flooding Damages’ Monetary Valuation

This section presents two evaluation models for formally defining the variation law of damage (D) caused by flooding as a function of the return period (T) of the flood event. Specifically, the first model (T-Dp) enables the assessment of damage to the productive resources of the territory affected by floods, while the second model (T-Da) focuses on damage related to the environmental resources.

3.1. Productive Resources

For productive resources, the extent of damage and the return period of the flood event need to be appropriately correlated, using the existing relationship among the variables involved in the study of flooding phenomena. The law to be defined (T-Dp) requires identifying: the relationship correlating the return period of the flood event to the flooded area (T-S law) and the function representing the variation of damage in relation to the flooded area (S-Dp law).
The function (T-Dp) is constructed by hypothesizing a linear function, assuming that capital and economic activities subject to the risk of flood are uniformly distributed across the territory. The deliberately general approach responds to the need to ensure that the law (S-Dp) is sufficiently adaptable to various manifestations of damages, the variability of conditions, and the structural and productive differences of the territories affected by floods [76].
The (T-Dp) law is developed with reference to the following graph or “path” (Figure 1), capable of configuring the relationships between the variables involved.
In Figure 1, the variables indicated by the nodes are: T, return period of the flood event; Qc, maximum flood discharge; Dw, flood volume; S, flooded area; Dp, amount of damage.
The graph arc connecting two generic nodes represents the correspondence law, or transfer function, that relates the associated variables. In general, it can be assumed that the graph arc connecting two non-consecutive nodes is obtained by composing the respective correspondences.
Assuming, therefore:
Q c = α T , D w = β Q c = γ D w , D p = δ S ,
for each flood event with an assigned return period, the corresponding amount of damage can be associated through the path outlined in Figure 1:
D p = δ { γ [ β ( α ( T ) ) ] } .
The amount of damage is uniquely determined if the correspondences composing (1) are functional and if set A = { x X f ( x ) Y } is non-empty with x, X, and Y, respectively, being a variable of set X, the definition set of f ( x ) , and the domain of g ( y ) , provided that they are:
x X f ( x )
and,
y Y g ( y )
two real functions that are components of the generic composite function g [ f ( x ) ] defined within (2).
The hydraulic data related to the flood event, such as maximum flood flow rate and flood volume, and the reference to the orographic structure of the flooded territory, that can be ascertained through the use of a digital elevation model (DEM) generated using topographic maps, contour data, and surveyed point elevation data, allow for the preliminary identification of the:
S = γ β α ( T )
relationship between the flooded area S and the return period T of the event, where α, β, and γ are functional correspondences to be specified based on the aforementioned hydraulic and orographic data.
Then, the specification of the correspondence law becomes an economic problem:
D p = δ S ,
which, in turn, expresses the relationship between the flooded area and the overall amount of damage caused in the territory during flood events.
A satisfactory estimate of the amount of damage can be conducted under the assumption of a uniform distribution of capital at risk, understood as economic activities and investments (agricultural resources, urban areas, infrastructure, etc.) present in the flooded areas. In this case, it can be assumed that (6) is linear and is as follows:
D p = d u S ,
where d u encompasses all direct damages caused to the existing productive resources on the territory. It is given by:
d u = d u a + d u u + d u i ,
with: d u a , unitary damage to agriculture (€/Ha); d u u , unitary damage to urban areas (€/Ha); d u i , unitary damage to infrastructure (€/Ha).
Then, (8) can also be expressed as:
d u = j d u j ,
where j is the category of capital.
Equation (9) must be defined in every territorial context subject to flooding characterized by a fairly uniform distribution of activities and assets at risk.
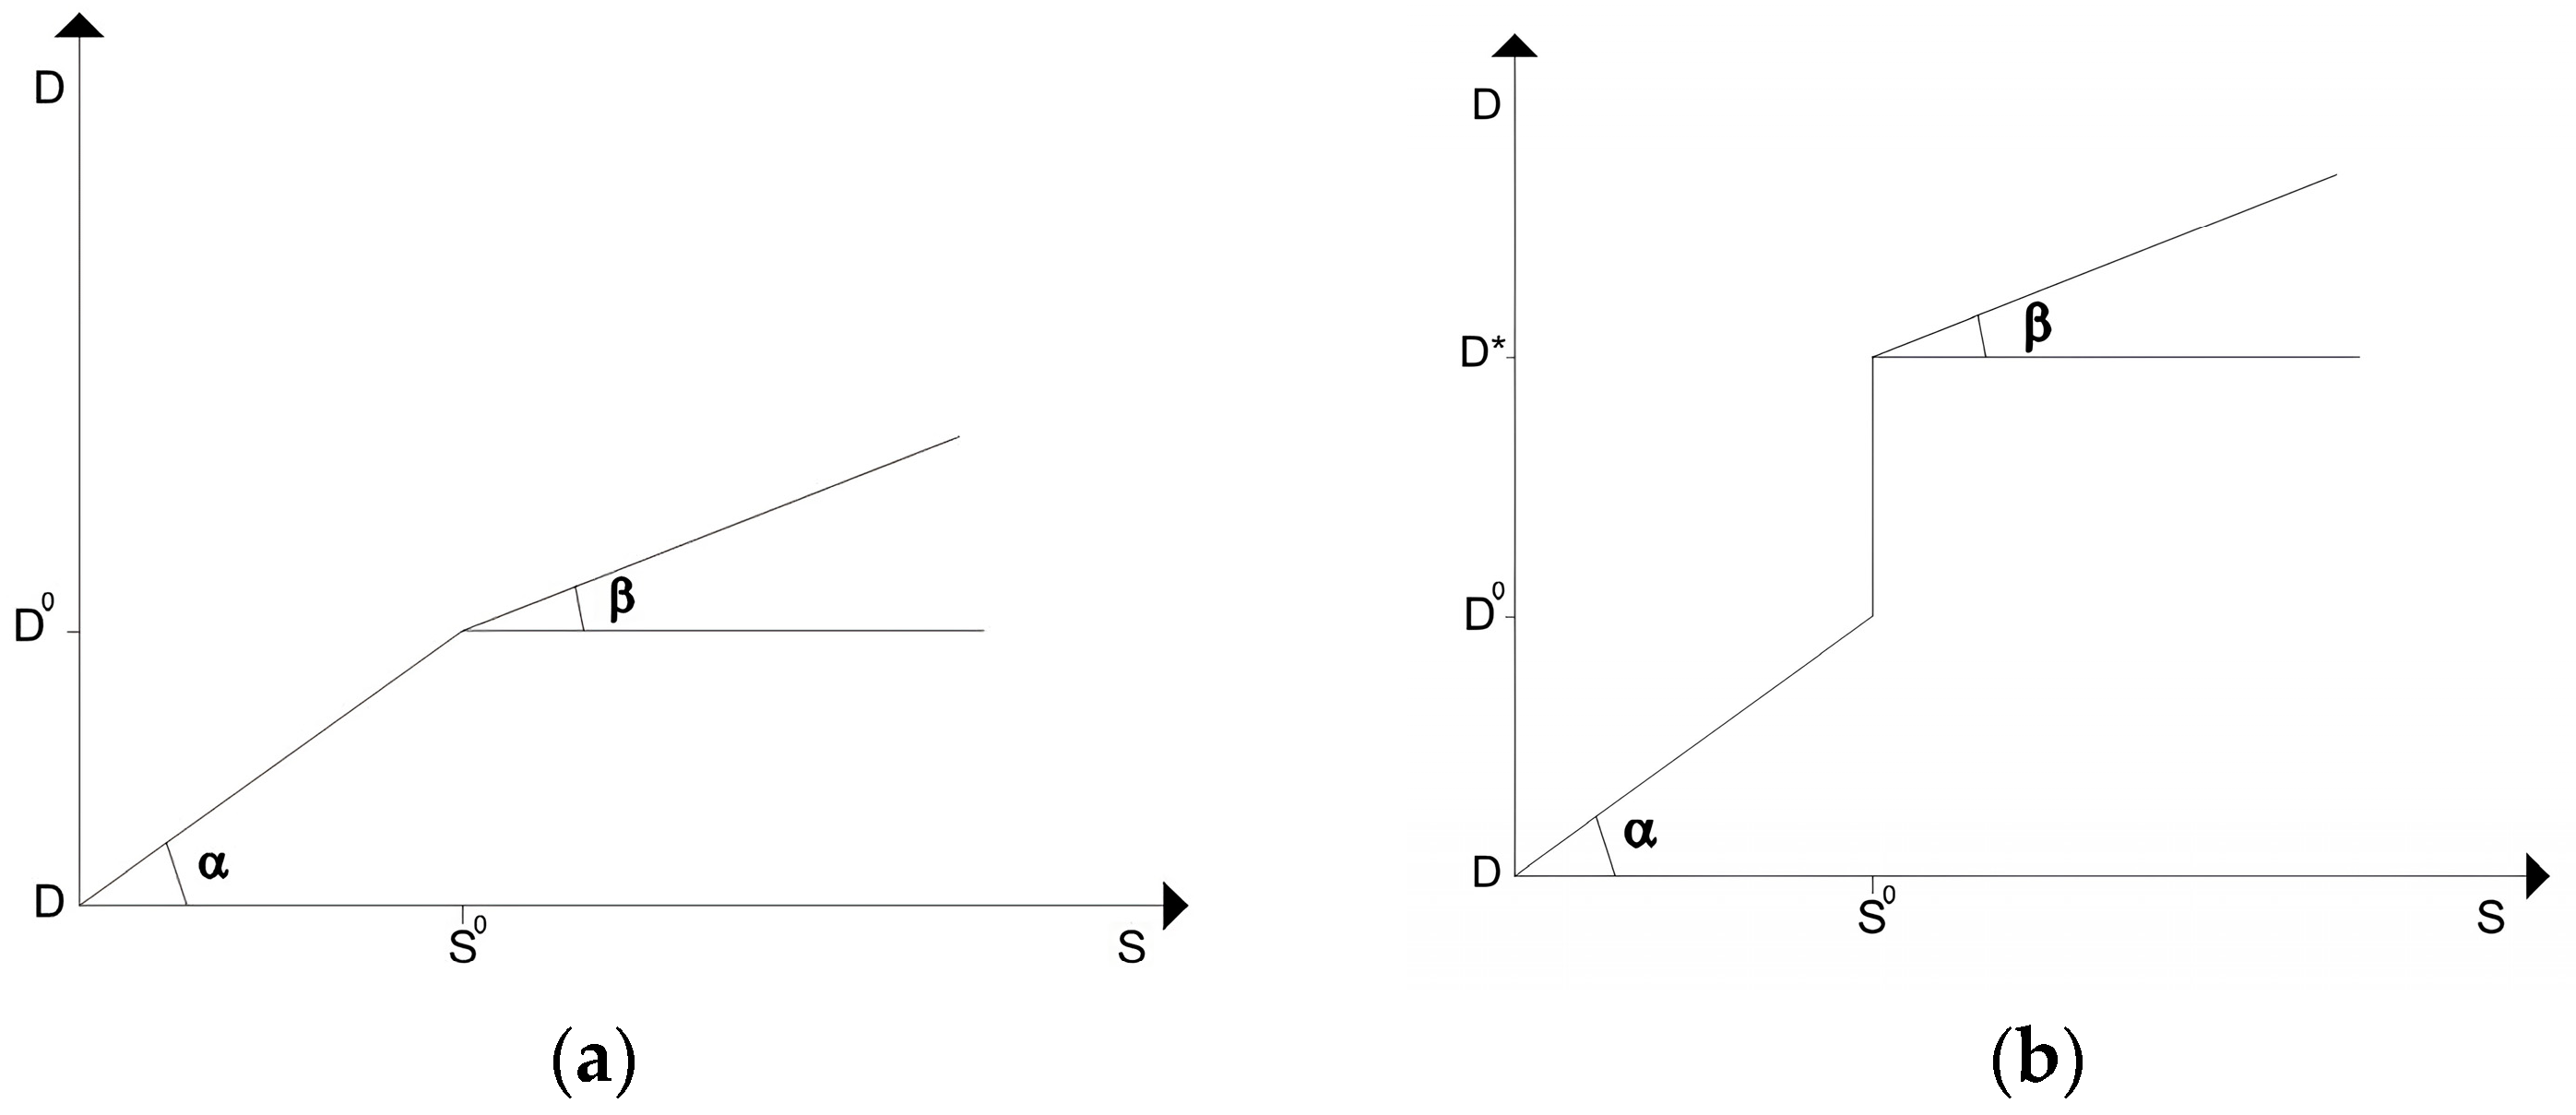
It follows that the slope of the line representing the amount of damage will vary whenever, as the flooded area increases, different categories of assets affected by the floods will result in different uniform distribution contexts. In this way, when all the categories identified in the investigation area are present in the S 0 context and, for example, the urban areas category is missing in the S - S 0 context, the law of variation of damage as a function of the flooded area takes the form:
D p = d u 1 S , for   0 S S 0
D p = d u 2 S S 0 + D 0 , for   S S 0
representable on the Cartesian plane (Figure 2a).
In Figure 2, D 0 is the amount of damage corresponding to the flooded area S 0 , and
α = arctg ( d u 1 ) = arctg ( d ua + d uu + d ui ) ;   β = arctg ( d u 2 ) = arctg ( d ua + d ui ) .
Similarly, the damage function is constructed when investments are punctually located on the territory and, therefore, constitute a discontinuity within the zones of uniform distribution of assets at risk subject to flooding. In these cases, the S-Dp law (Figure 2b) is expressed as follows:
D p = d u S , for   0 S S 0
D p = d u S S 0 + D * , for   S S 0
where D * D 0 is the increase in damage attributable to the structure located at S 0 , and β = arctg(du).
In general, it can be assumed that:
D p = d u 1 S , for   0 S < S 0
D p = d u 2 S S 0 + D * , for   S S 0
where d u 1 d u 2 , if the slope of the damage line varies for S > S 0 .
With the introduction of simple elements of matrix algebra, the proposed model can be extended to determine the individual characteristic variables of flooding phenomena as a function of the value assigned to one or more of them.

3.2. Environmental Resources

The mathematical law correlating environmental damages with the return period of flood events assumes that individuals’ willingness to pay equals the loss of collective well-being and corresponds to the decrease in value experienced by the environmental asset after the event. Consequently, this model is well-suited for implementing contingent valuation as a method to assess the cost of environmental damages [77,78].
Let E i i = 1 , 2 , 3 , . . . , p 1 , p be the generic event of maximum flood that can occur for the watercourse located in the investigation area.
Given a certain time horizon, associate to the event E i the corresponding return period T E i , such that T E j < T E j + 1 ( j = 1 , 2 , 3 , . . . p 1 ) .
For the event E i , with return period T E i , calculate the flooded area S E i according to the notation:
S E i = γ β α ( T E i ) ,
where α, β, and γ are functional correspondences to be specified based on hydraulic data (maximum flood flow rate and flood volume) and the orographic structure of the territory affected by the floods [79,80].
Under the assumption, generally satisfied, that the correspondences composing (16) are strictly monotone increasing functions, it is verified that S E j < S E j + 1 for T E j < T E j + 1 . Therefore, the flooded area S E i is uniquely associated with the event E i .
Let us identify the population P E i consisting of n E i individuals who use the environmental resources characterizing the S E i area. From the population P E i , a sample C E i is then extracted, consisting of m E i individuals ( m E i < n E i ) .
Through a survey conducted based on interviews (contingent valuation method, CVM), we proceed to determine, for the sample C E i , the average value of individual willingness to pay W T P E i s to avoid the compromise of the environmental resources located in S E i through the construction of appropriate flood control works. To this end, the following main formulas for solving the average willingness to pay can be used [78]:
W T P E i m e d = 1 m E i W T P E i s , C V M o p e n e n d e d
W T P E i m e d = 1 G x d x , C V M c l o s e e n d e d
where [ 1 G ( x ) ] = P r o b ( S I = 1 / x ) = P r o b ( x W T P ) expresses the probability that the interviewees agree to the donation, with G ( x ) being the cumulative frequency distribution (c.f.d.) of the discrete variable “yes/no” as a function of the monetary amounts indicated individually by the analyst during the interviews.
For the population P E i , the total willingness to pay value is then calculated as:
W T P E i = n E i W T P E i m e d ,
or also, as a precautionary measure, as:
W T P E i = η n E i W T P E i m e d ,
where η = m E i / m E i represents the effective success rate of the interviews, where m E i is the number of interviewed individuals who provided useful answers for the analysis.
The mathematical law that relates the different amounts of W T P E i to the flooded areas S E i defines the correspondence:
W T P E i = f S E i ,
which, in general, is a strictly monotone increasing function, with W T P E j + 1 > W T P E j for S E j + 1 > S E j being the usual case.
By substituting (16) into (21), we obtain:
W T P E i = f γ β α T E i = F T E i ,
where F is, in turn, a strictly increasing function as T E i varies.
By setting W T P E i equal to the account price D a E i of the damage caused to the resources existing in the S E i area, it follows from (22) that:
D a E i = F T E i ,
which, in formal terms, represents the function correlating the amount of environmental damage to the return period of flood events.
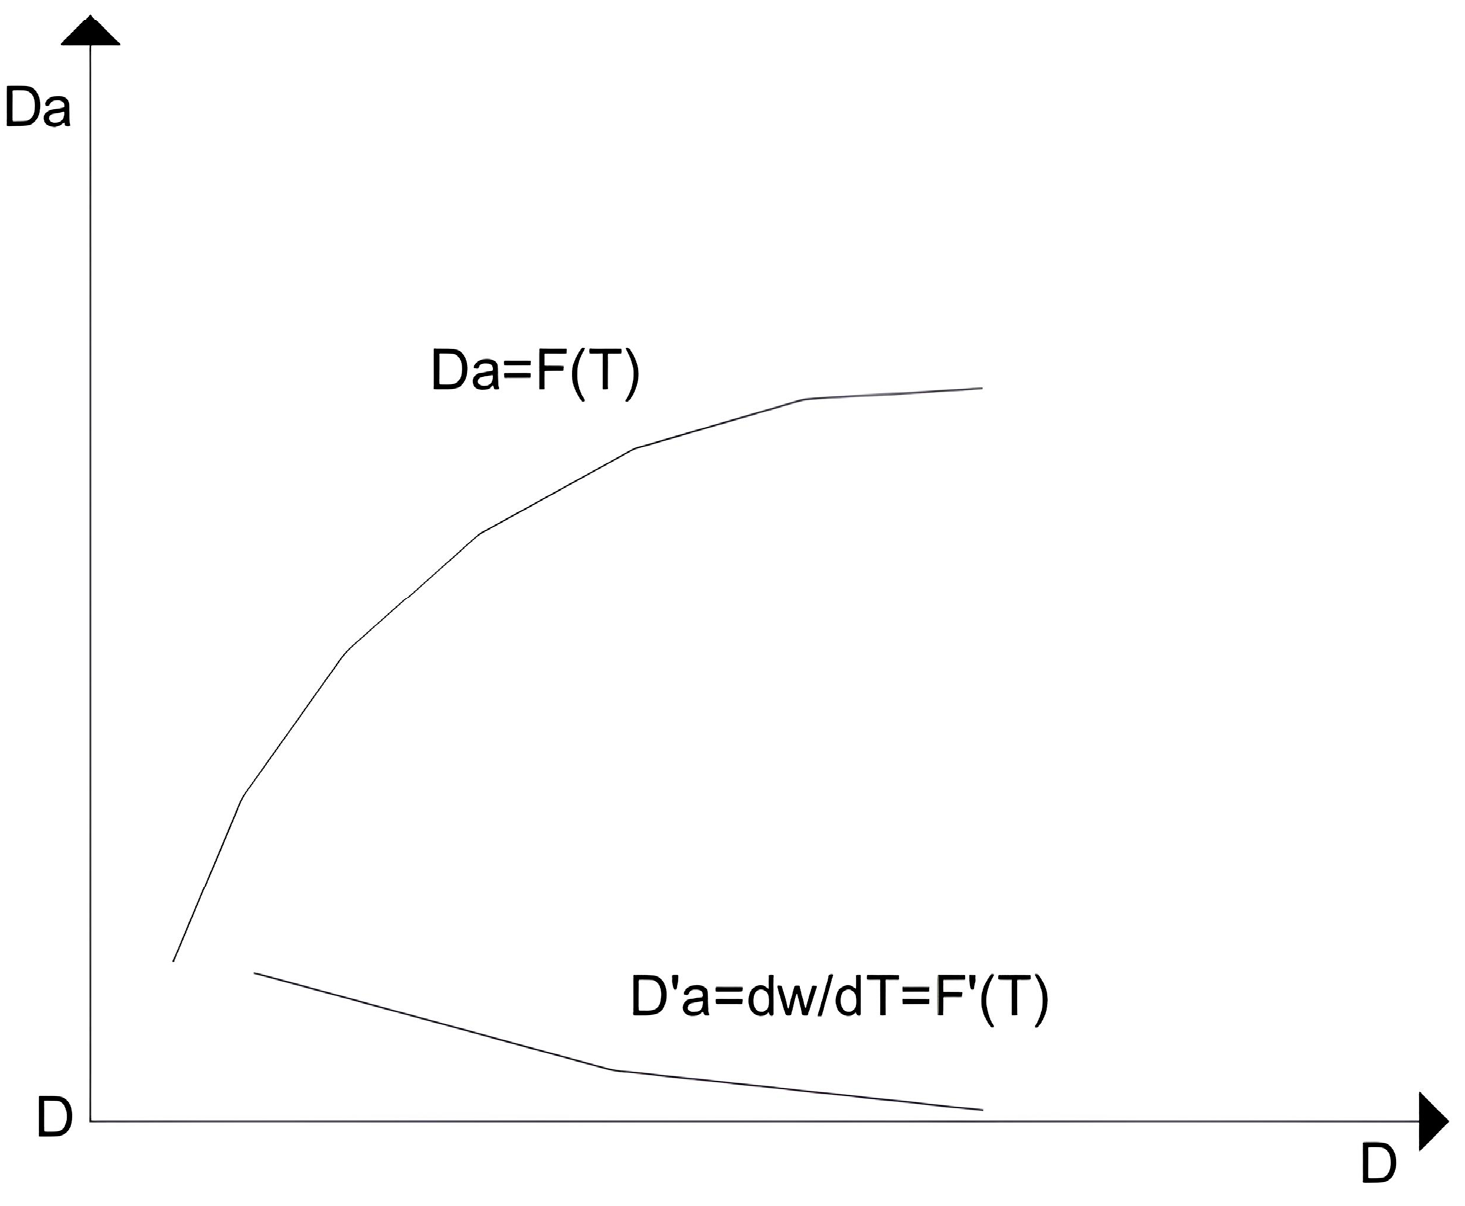
Assuming a continuous variation of the variables D a E i and T E i , and subject to the results of the statistical verification, the algebraic form of (23) can be assumed to be parabolic, corresponding to the qualitative trend of the curve shown in Figure 3.
In other words, it can be supposed that as the return period of the flood event increases, the amount of damage increases at a rate that is punctually decreasing. This is equivalent to asserting that the marginal willingness to pay ( W = d W / d T = F ), which is equal to the marginal rate of substitution between income and environmental protection levels, is a decreasing function of the return period of flood events (Figure 3), i.e., the compensated demand function for environmental resources is decreasing. This assertion not only reflects the theoretical assumption of decreasing marginal utilities but also indicates the logical circumstance that the community tends to assign less importance to events characterized by higher return periods, or lower probabilities of occurrence.

4. Case Study

The ex-ante monetary valuation of flooding damages has been applied to the watershed of the Sele River, situated in the central–western mountainous part of the Campania region in southern Italy. The study of the watershed involved identifying specific investigation areas and their corresponding flood zones for events with different return periods.
Covering an area of 3223 km2 and boating numerous tributaries, the Sele River watershed navigates between rocky walls or through the bottoms of narrow valleys. Only two areas within this watershed are prone to flooding issues: the plain of Vallo di Diano and the territory between the Sele and Calore Rivers just before their confluence.
All hydraulic parameters or those related to flood events are provided by local public entities involved in the management of water basins.

4.1. Investigation Areas

4.1.1. Vallo di Diano

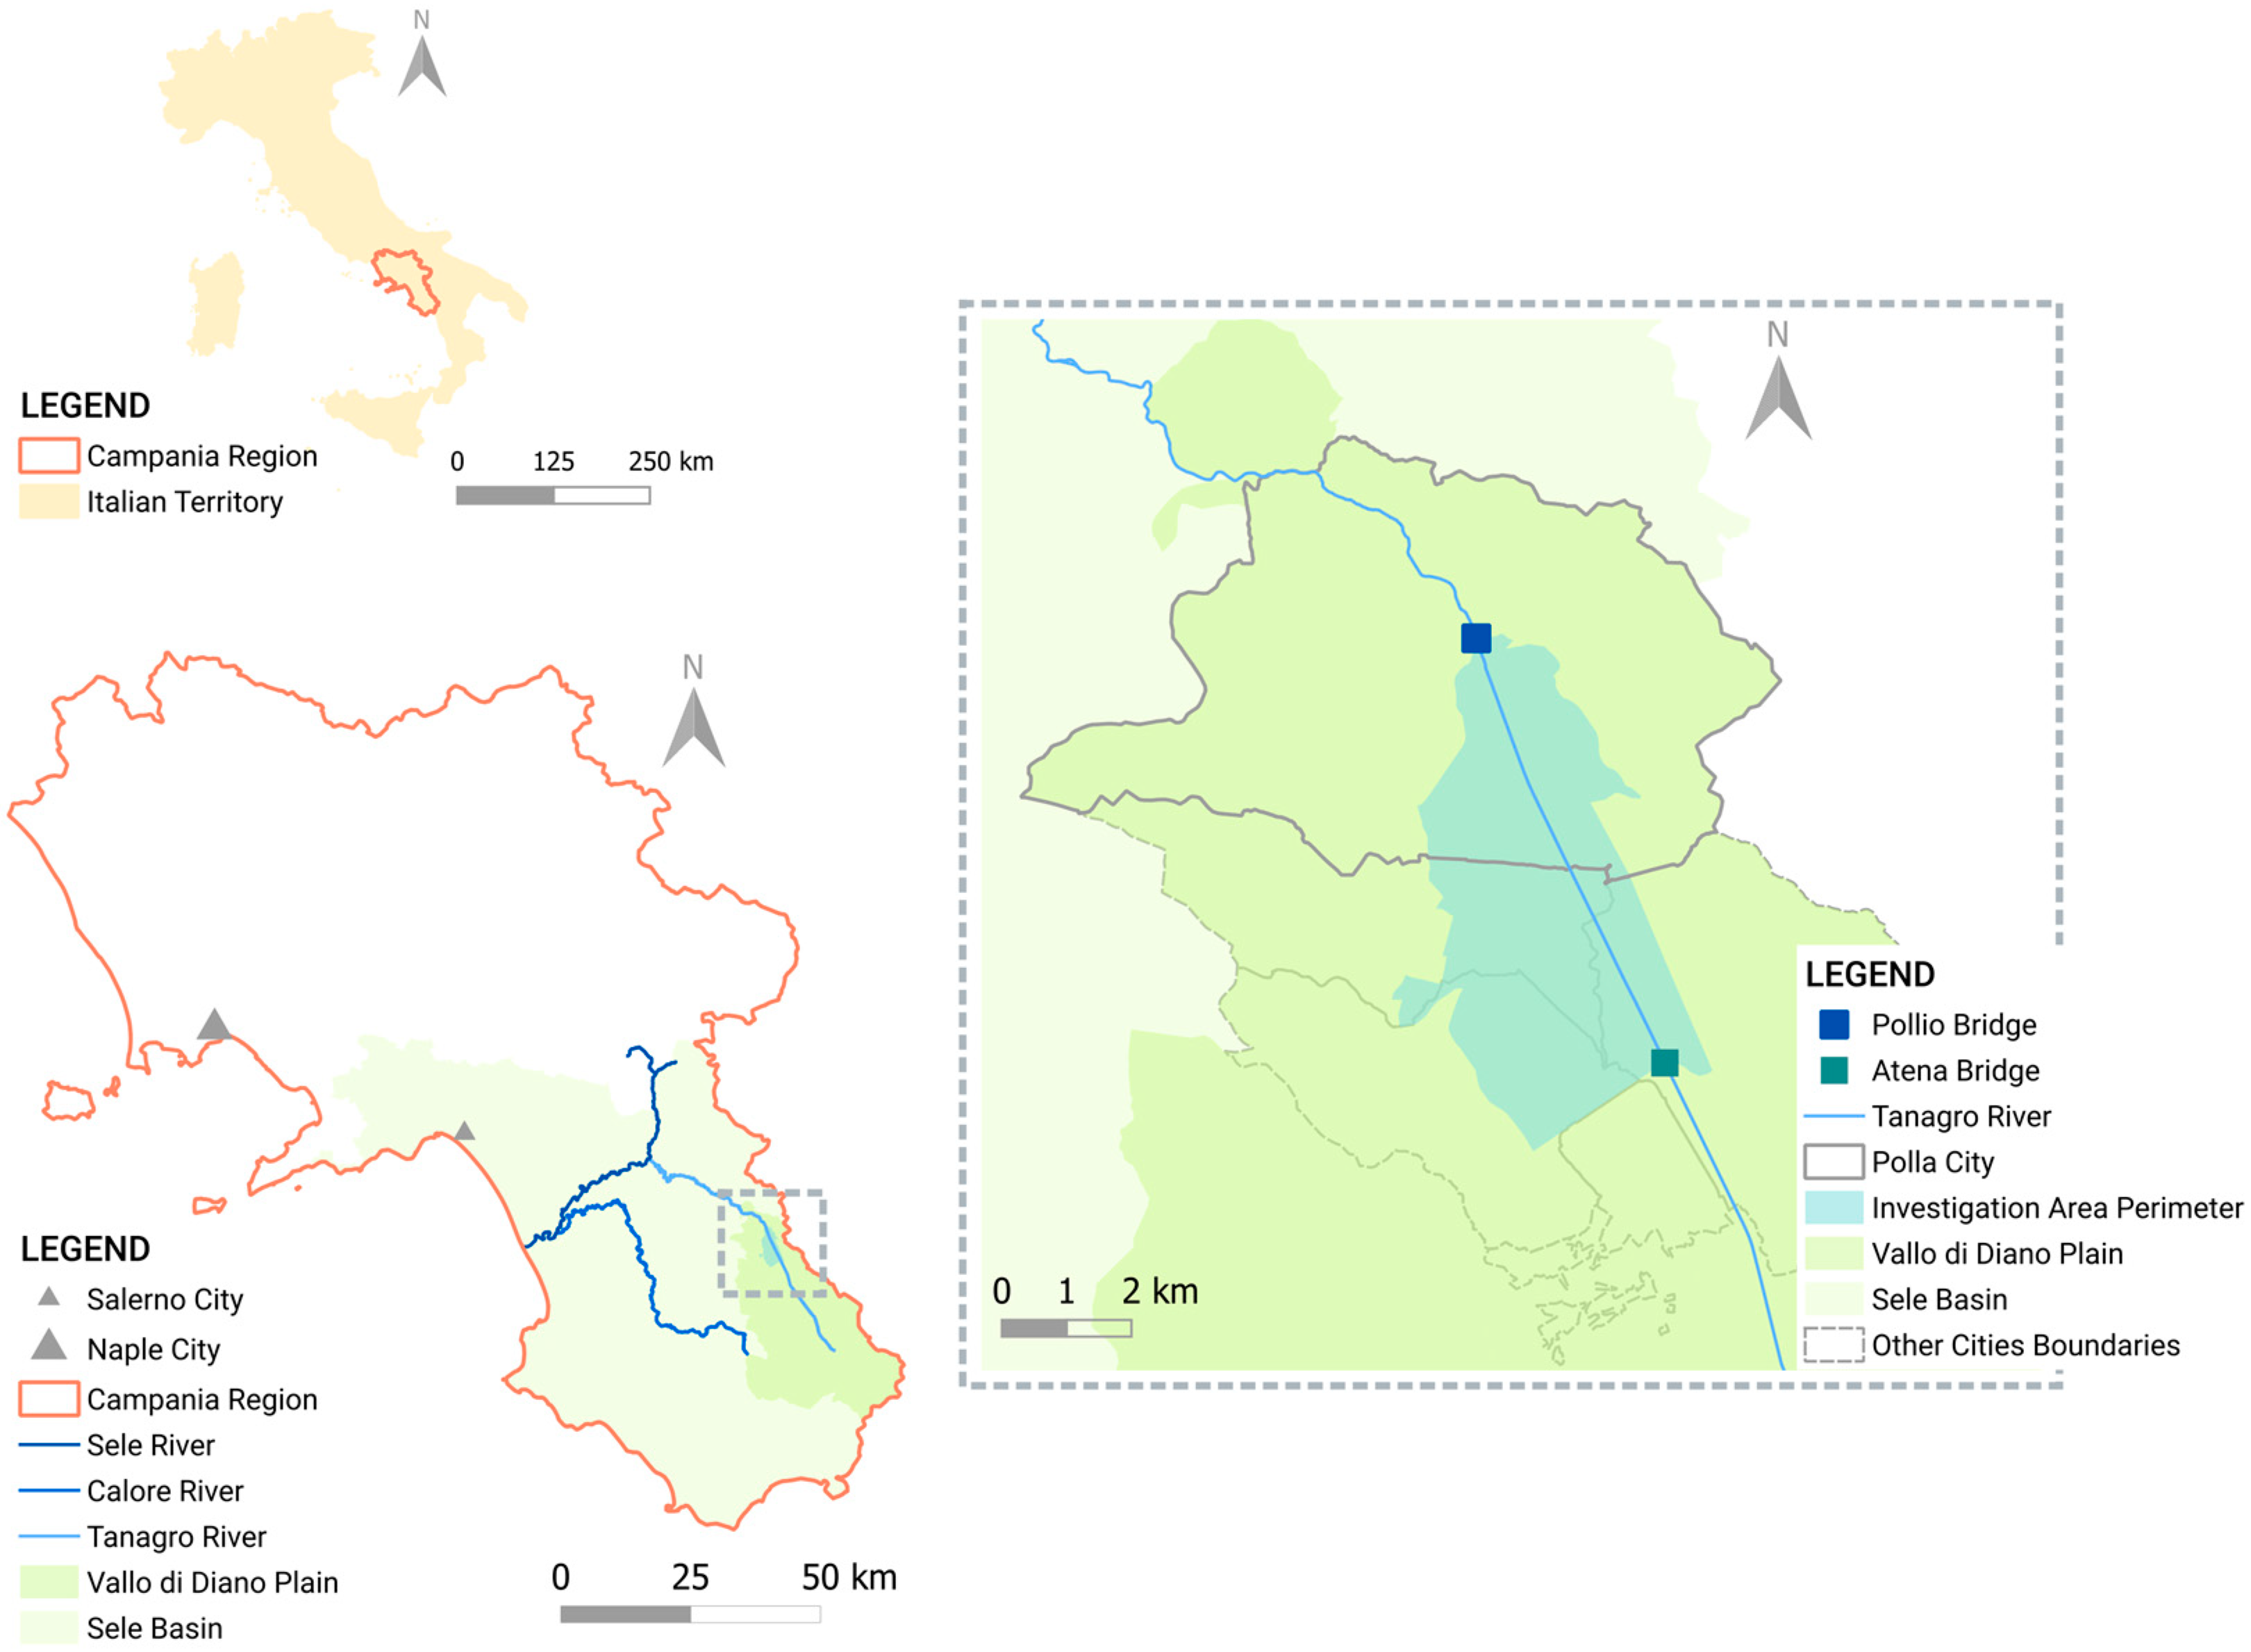
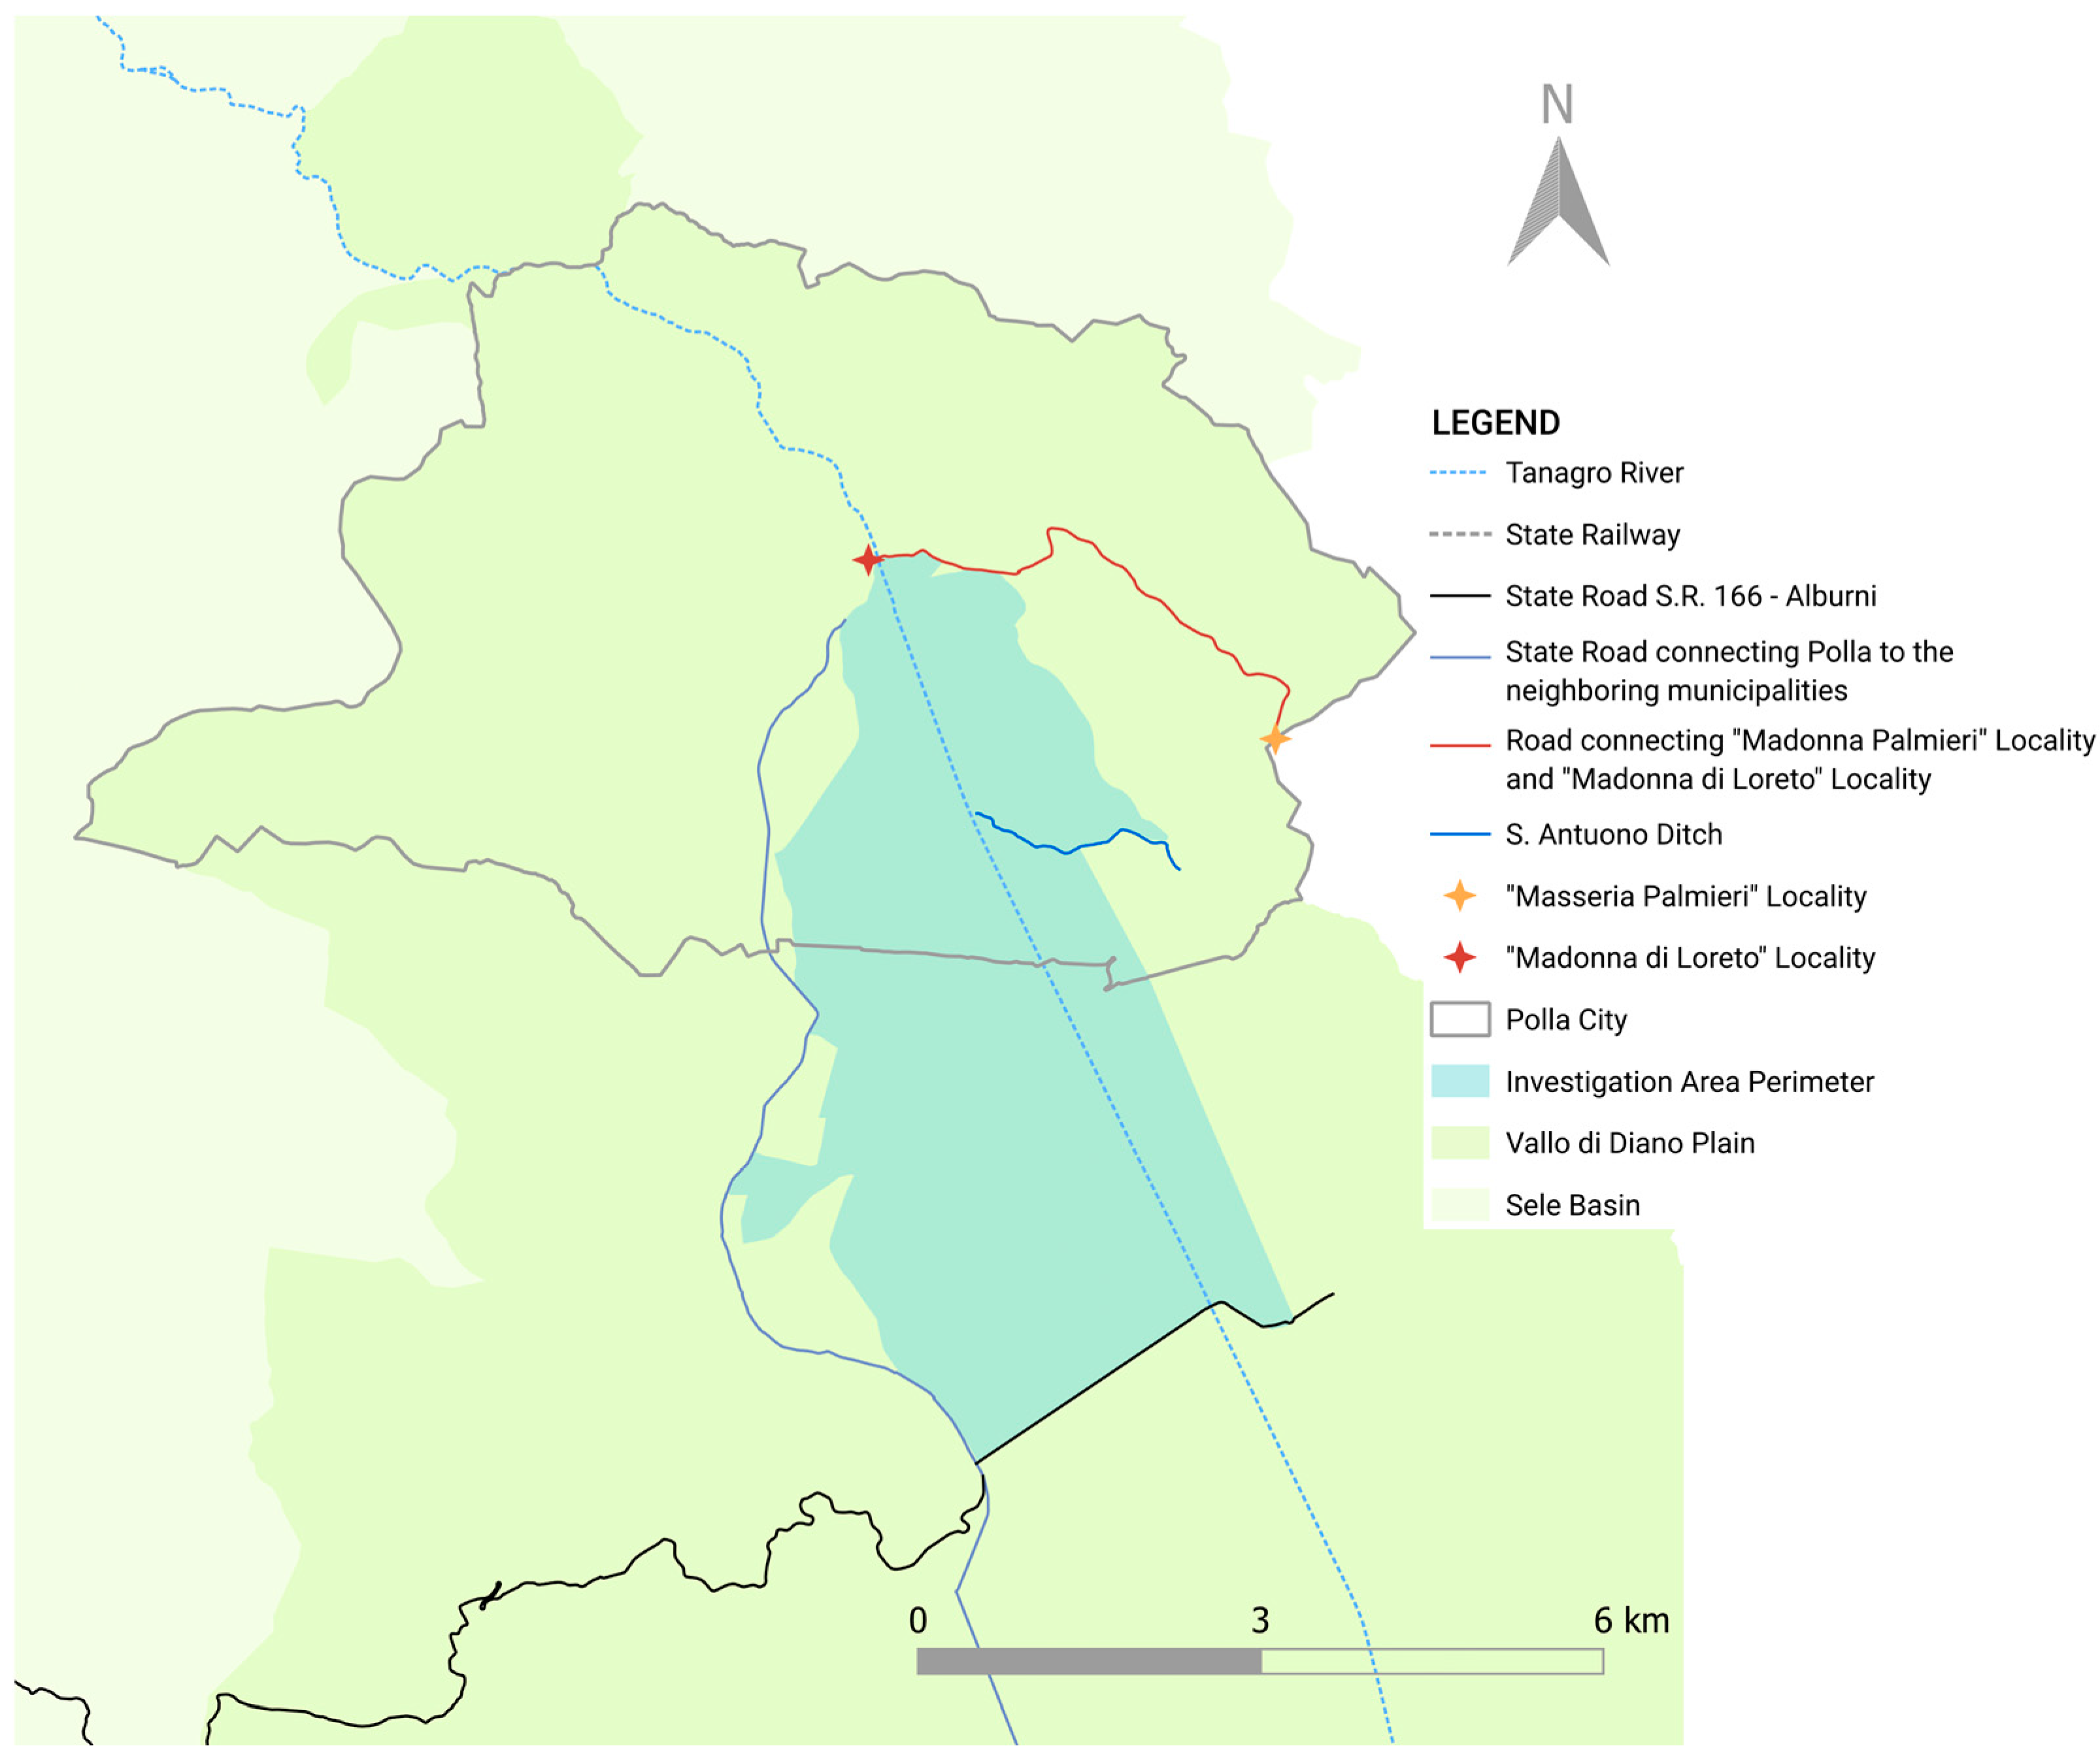
The plain of Vallo di Diano extends on both sides of the Tanagro River for approximately 20 km in the SSE–NNO direction. The area maintains relatively constant elevations transversely, averaging around 3 km. In terms of longitudinal terrain, there is a gradual ascent toward the mountains, starting from elevations of approximately 400 m above sea level in the immediate vicinity of Polla, reaching about 444.50 m above sea level near Atena Bridge, located roughly 7 km from Polla. The investigation area (Figure 4 and Figure 5) has been delineated to encompass all potential flooding zones. The topographic surface of the investigation area is equal to 2100 Ha, of which 36.7% falls within the municipality of Polla.
In Vallo di Diano, floods primarily occur during the autumn–winter period and at the beginning of the spring. The causes can be attributed to the regurgitation of streams, inadequacy of watercourses in the plains, or the breaching of embankments. As a result, the volumes of flooding exceed those generated by the peak of the flood wave.
Table 2 shows, for the Tanagro River, the maximum peak flows (Qc) for flood events with return periods (T) of five, ten, twenty, thirty, and fifty years, the corresponding volumes of water that flow into Vallo di Diano for such events (Dw), the length of flooding from Polio Bridge (l), and the surface area of flooding for an assumed average length of the plain equal to 3 km (S). The total duration of each flood can be assumed to be about 48 h. The ebb time of water from flooded surfaces can be estimated, considering the low slope of the plain terrain, to be 1 or 2 days for floods that occur following 5- and 10-year events, and 3–5 days for those that occur for 20-, 30-, and 50-year events.
Referring to flows of 300–400 m3/s, which correspond to water levels close to the minimum levels of the embankments, on average at 442 m above sea level, it is found that water flooding from the Tanagro River can occur following flood events with return periods even less than ten years. It is, therefore, evident that, in addition to fifty-, twenty-, and ten-year flood events, even floods of lesser magnitude than the maximum ten-year events are likely to cause damage and inconvenience in the area.
For flows greater than 400 m3/s, corresponding to flood events with return periods greater than 10 years, water overflow occurs for several kilometers, considering the substantial constancy of the crest levels of the embankments, although, as water levels increase during floods, overtopping may have begun only on short stretches that are disconnected due to the inevitable irregularity of the embankments.
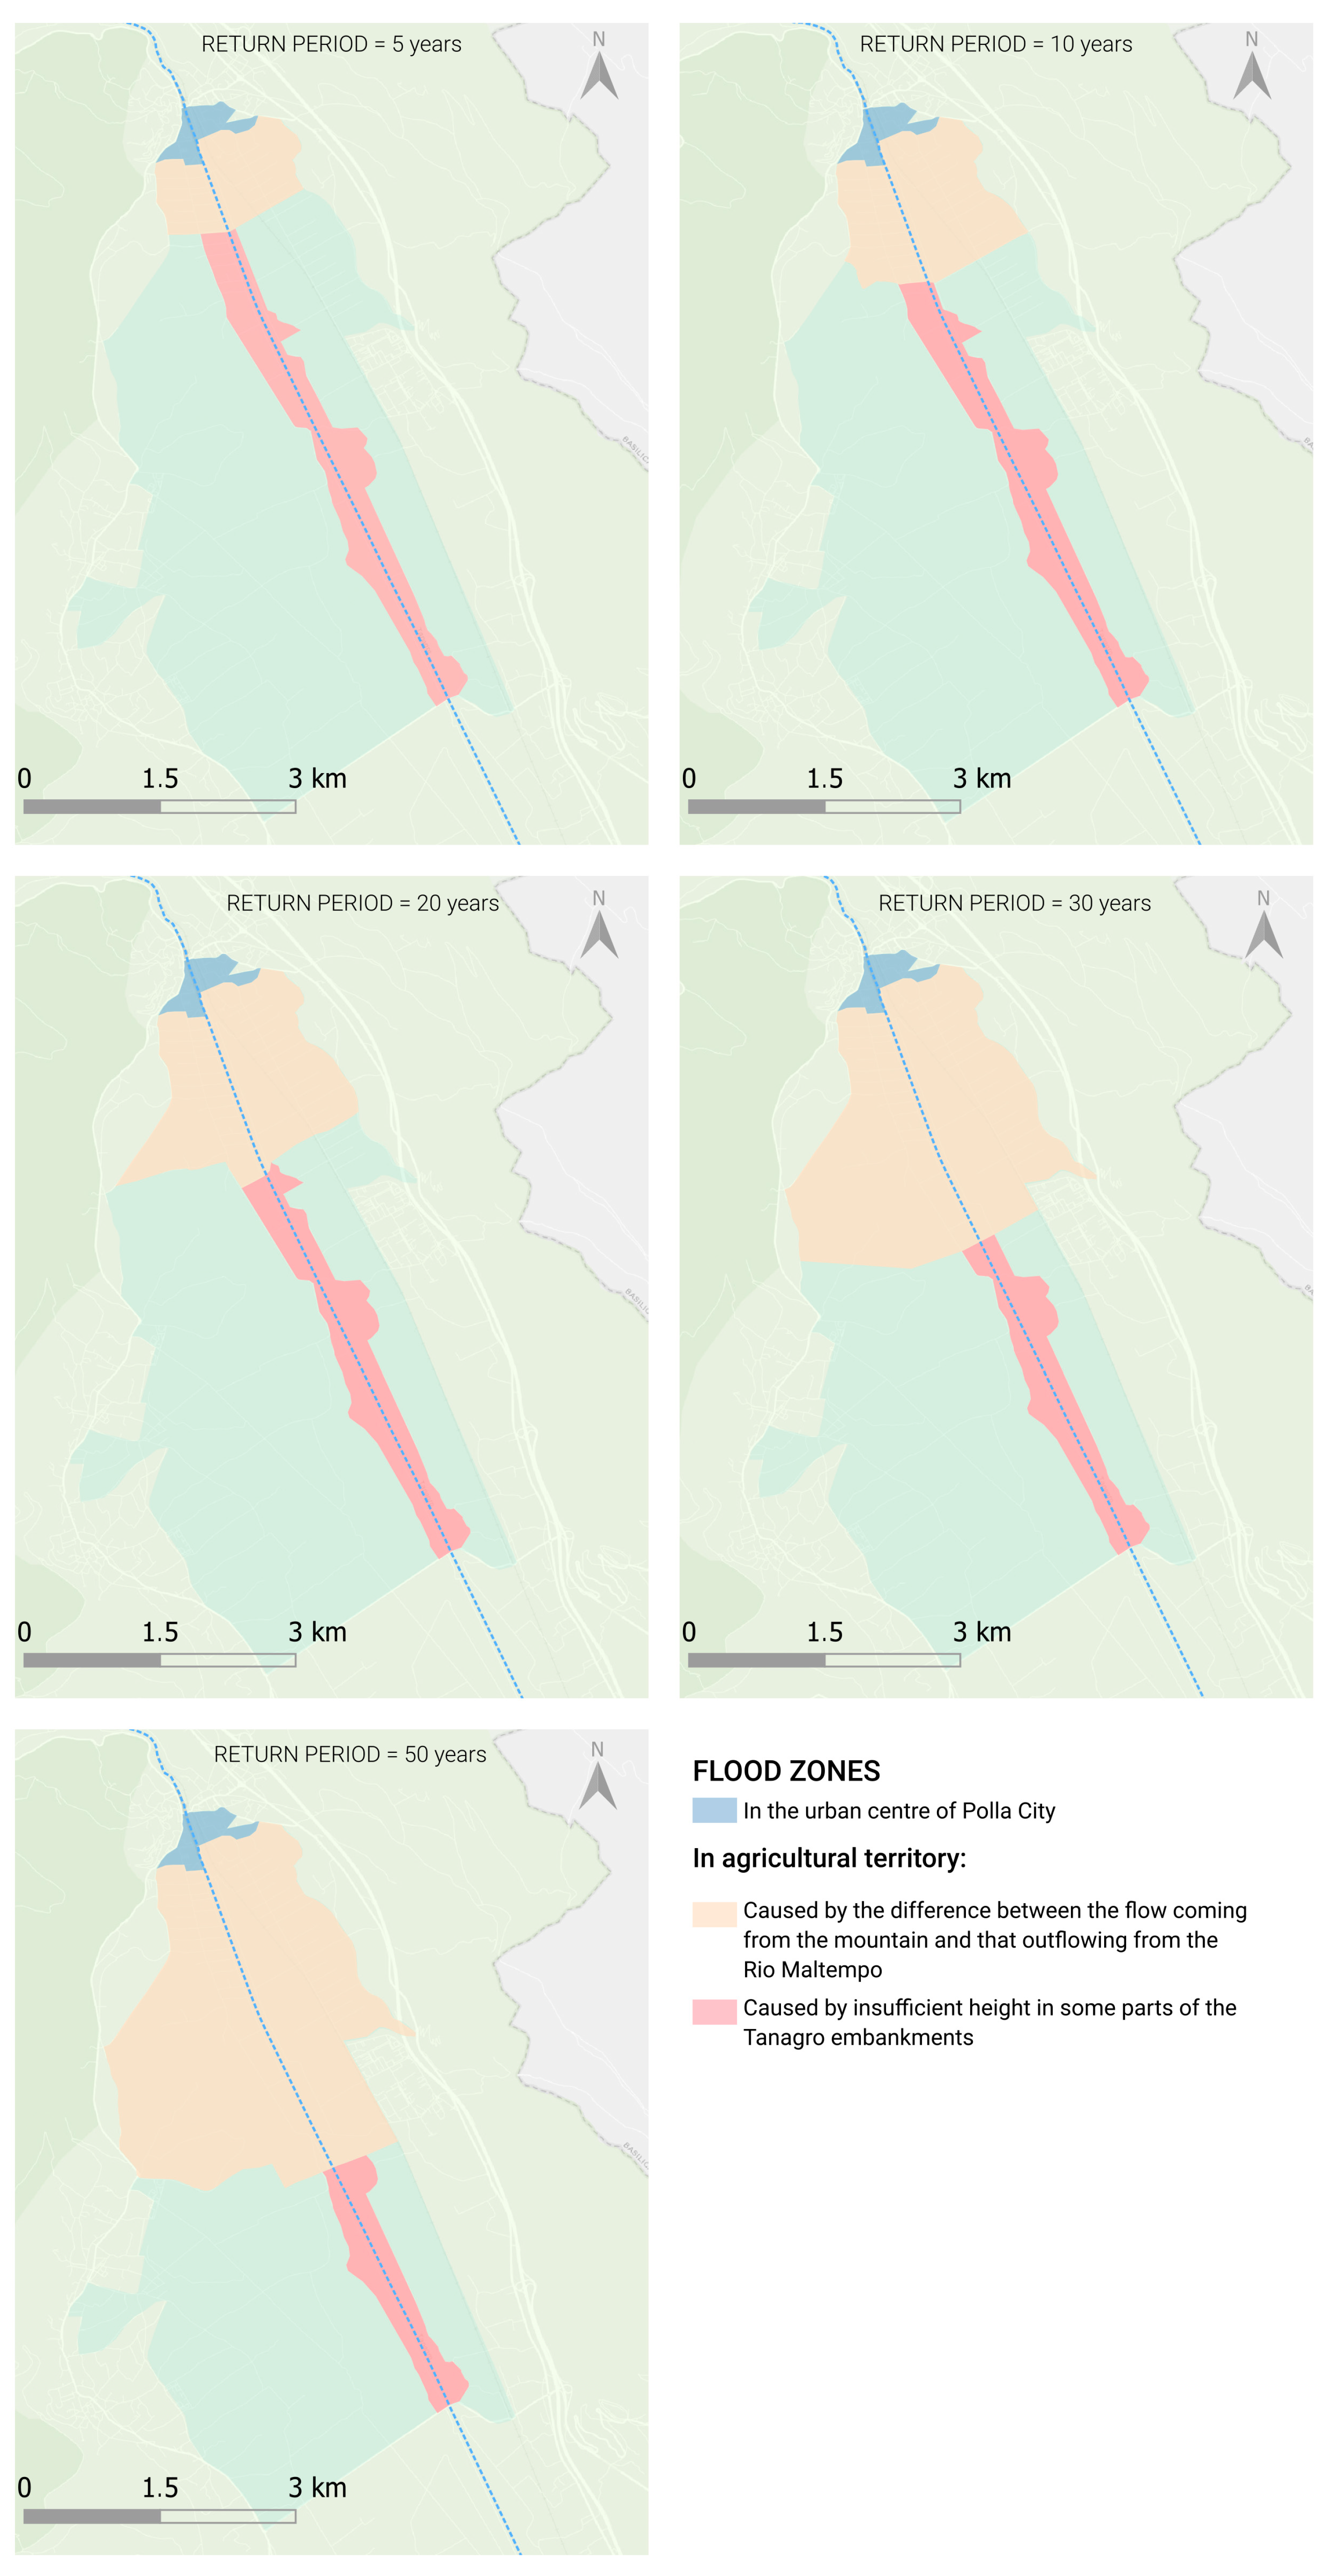
Based on the data contained in Table 2, relating to the volumes of flooding that occur during flood events, and in relation to the orographic layout of the area, the cartographic delimitation of the flood-prone areas for flood events with different return periods was carried out for Vallo di Diano (Figure 6).
Table 3 shows the topographic surface areas of flooded zones for flood events with different return periods, distinguished between those downstream and upstream of Polio Bridge, and the surface areas along the Tanagro River channel, subject to the risk of overflowing from embankment stretches of insufficient height. In addition, the data on the surface areas of agricultural land affected by flooding for each level of event are summarized.

4.1.2. Sele–Calore Rivers’ Confluence

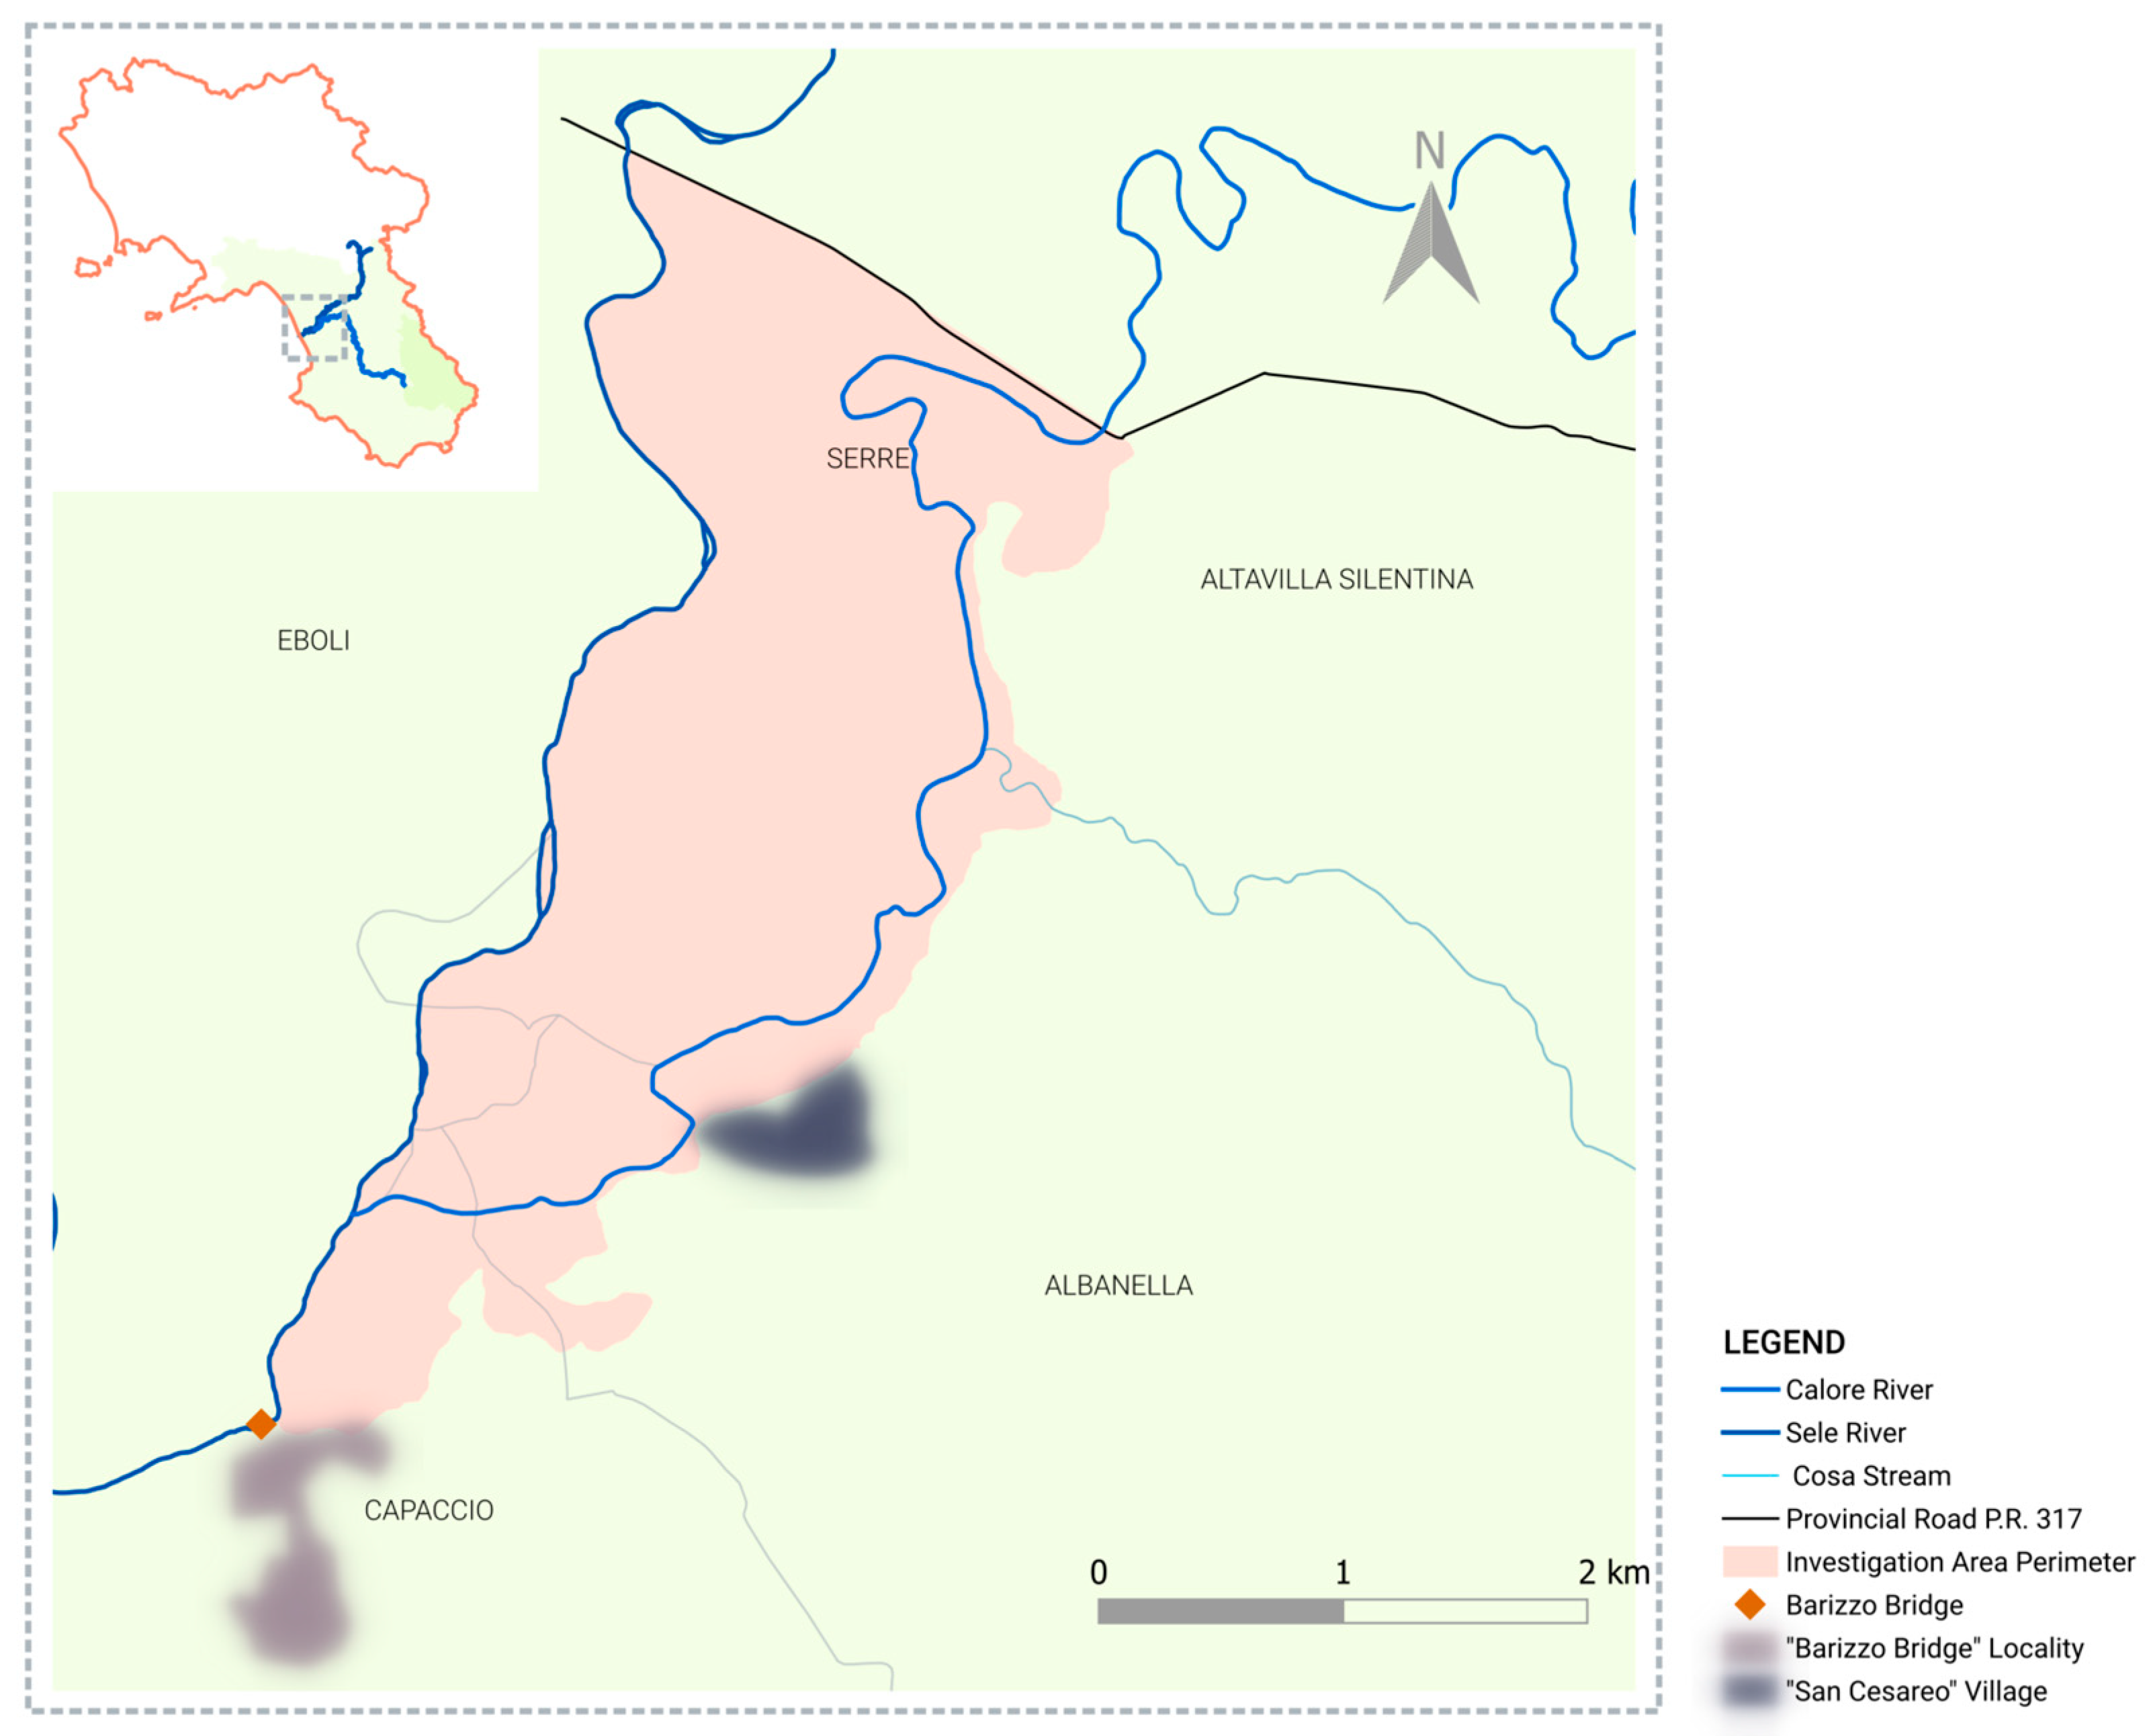
The geographical area, known as Sele–Calore Rivers’ confluence, is mostly flat, covering approximately 6400 hectares. The land elevations range between 10 and 15 m above sea level, with a total length of 5–6 km. The investigation area (Figure 7) has been delineated based on the areas affected by flooding, as outlined by the EC Flood Directive 2007/60. The topographical surface of the investigation area is equal to 765 hectares.
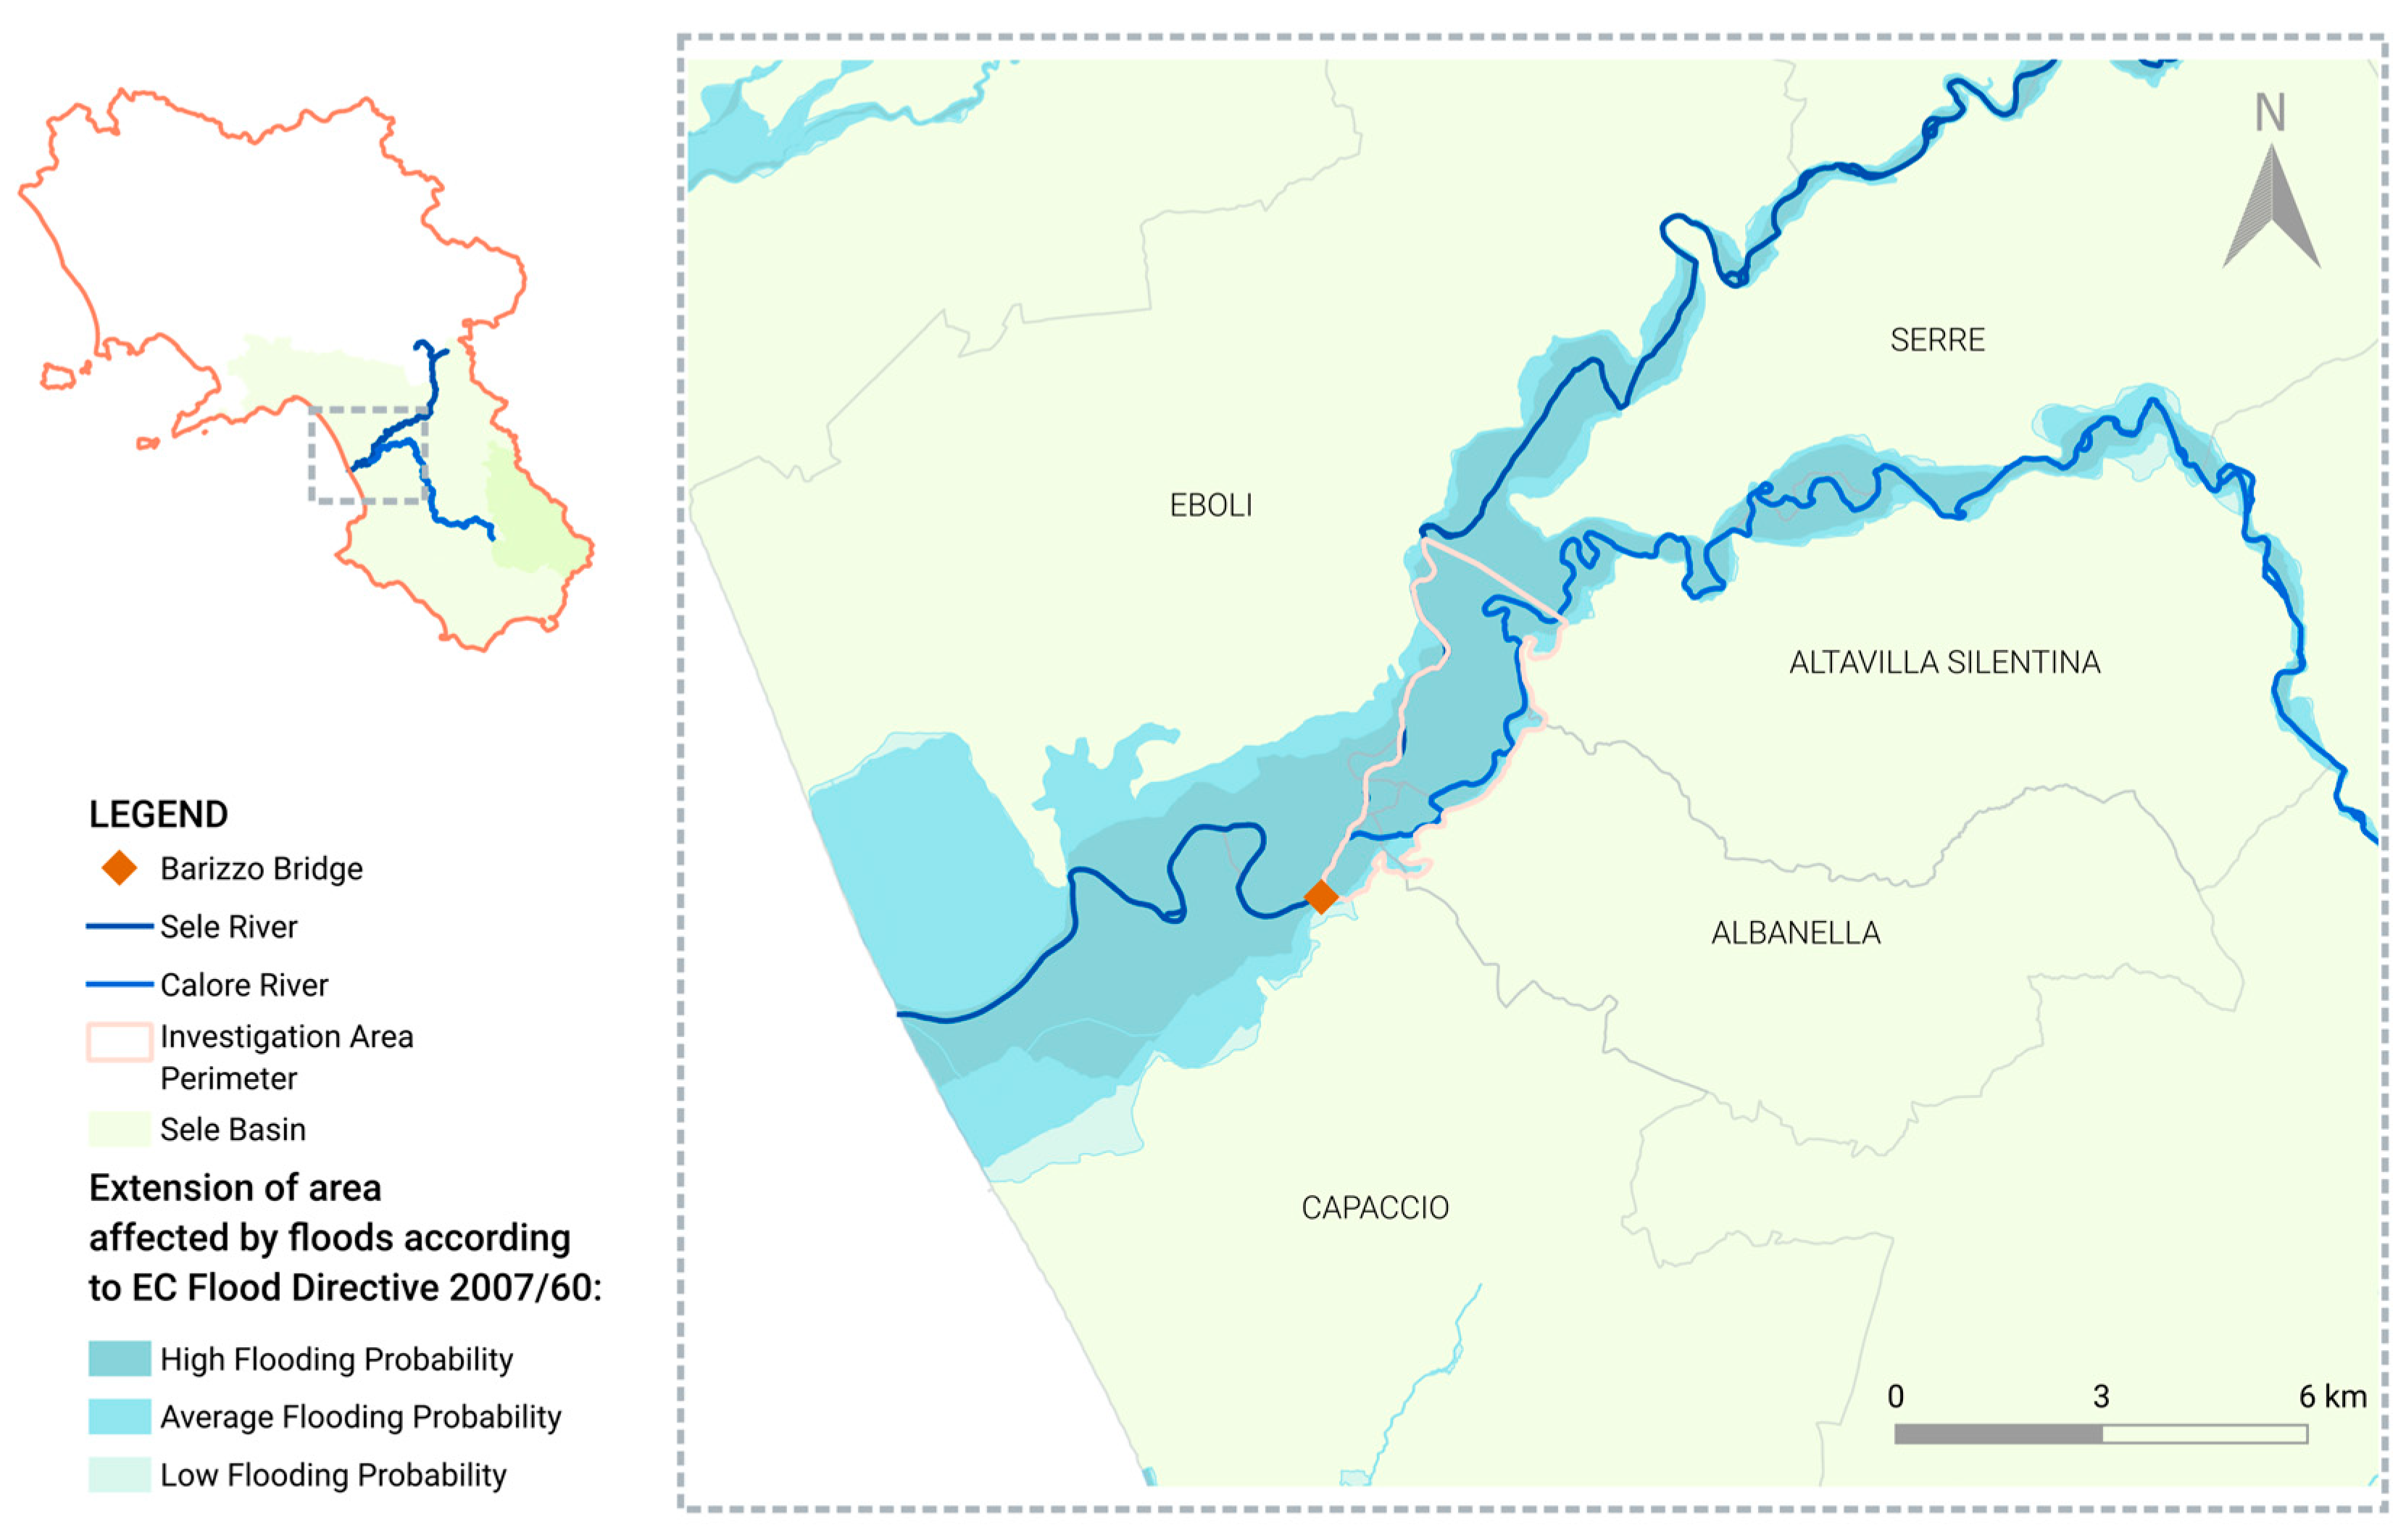
The orographic and geomorphological characteristics make the soils frequently and easily prone to flooding. Therefore, the discharge sections of the Calore River are insufficient to contain the maximum flood flows, just as the flood wave of the Sele River is hindered by the outflow of water into the Calore River, forming a backflow wave that travels up the Calore River and causes the water to overflow at points of insufficient section. The delimitation of the flood-prone areas was carried out in accordance with the EC Flood Directive 2007/60, indicating three possible scenarios related to the probability of a flood event: high, medium, and low (Figure 8).
Table 4 shows the parameters related to the maximum peak flows (Qc) and the average flooded area (S) for flood events with return periods (T) of five, ten, twenty, thirty, and fifty years for the Sele–Calore Rivers’ confluence. Table 5 shows the surface areas of flooded zones in the Sele–Calore confluence for each level of event.

4.2. Damages to Productive Resources

4.2.1. Damages to Agriculture

The damages caused by maximum flood events to the agriculture of flood-prone zones concern both company land investments and current crops at the time of the damaging event. Company land investments include rural buildings (farmhouses, warehouses, machine shelters, stables, etc.) and hydraulic land improvement works. The quantification of damages is attributable to the estimation of the cost to be incurred to restore the works damaged by the event. The estimation of damages to agricultural structures must be carried out by applying percentage rates to the value of the damaged parts. These rates proportionally assess the degradation caused by the events and are assumed as equivalent to the cost to be incurred to restore the damaged structures to normal physical and functional conditions. For the different categories of works assets and based on the damages historically occurred, the following floods in the investigation areas, and the following damage rates to be applied to the value of the structures, calculated as the construction cost depreciated at 1990 prices (at the time of estimation), have been fixed established: (a) farmhouses, 10%; (b) stables and other buildings, 5%; (c) corporate drainage network, 30% (Table 6). The unit costs used to quantify the depreciated construction cost are the following: (a) farmhouses, EUR 309.87/sqm; (b) stables, EUR 232.41/sqm; (c) warehouses, shelters, barns, etc., EUR 206.58/sqm; (d) drainage system, EUR 1.03/mL.
In relation to flood damages to crops in the investigated area, the affected periods are autumn–winter and spring. The duration of flooding in these areas can range from 1 to 5 days, depending on the events. Consulting the trade associations in the investigated area, the historical average damage per hectare of agricultural lands resulting from flooding for different crops has been elaborated with reference to: (a) value of production, (b) expenses not incurred as a result of the event (extra off-farm products and labor), (c) net product of any replacement crops, (d) replanting expenses, and (e) lost net product until maturity. Damages to the agricultural productions and structures of the flood-prone areas of the Vallo di Diano are summarized, for each degree of event, in Table 6.
Similarly, damages to the production systems present in the flood-prone areas of the Sele–Calore Rivers’ confluence, distinguished by degree of event, are described in Table 7. In the flood-prone areas of the Sele–Calore Rivers’ confluence, rural buildings are completely absent. Agricultural structures are, in fact, exclusively represented by the company drainage channels.

4.2.2. Damages to Urban Areas

There are no urban centers or developed areas within the flood-prone areas of Sele–Calore Rivers’ confluence. The urban areas exposed to flood risk are located in the town of Polla, which falls within the investigation area of Vallo di Diano. The value of the capital stock present in the flood-prone area of Polla, determined as the product of the size of each structure at risk by the unit construction cost, was not differentiated by the degree of event because the flooded area was almost the same for the different return periods of flooding events. The total value of the urban structures affected by flooding events from the Tanagro River amounts to 57,700.48 EUR·103 (Table 8).
The damages to urban areas must be estimated based on the type of property and the use of areas at risk. It was assumed that ground-level and semi-basement premises, basements of buildings and appurtenances, gardens, and green areas awaiting allocation are subject to damages.
The determination of damages was carried out by applying a percentage of the damage incidence to the value of the endangered structures related to the highest maintenance costs:
  • For buildings, damages were measured by the cost of restoring the external finishes of premises affected by flooding. Assuming an average value per premise of 413.16 EUR/m2, the unit damage was conservatively set at about 30% of that value, or about 123.94 EUR/m2. The unit damage to basement premises of structures was estimated at 25% of that amount, or about 30.99 EUR/m2.
  • For appurtenance areas of buildings, damages were estimated at an amount equal to the reconstruction costs of the wear layer, averaging 15.49 EUR/m2.
  • For gardens and green areas, a unit damage of 0.52 EUR/m2 and 0.026 EUR/m2, respectively, was assumed.
Table 9 shows the total amounts of damages distinguished by the category of area at risk.
Overall, the damage amounts to 17,118.38 EUR·103 and is independent of the return period of flood events due to the substantial invariability of the flooded areas with respect to the assumed event degrees.

4.2.3. Damages to Network Infrastructures

The value of each infrastructure, impacted by flooding events, was determined by multiplying its exposed area by the current unit construction cost. For estimation purposes, flood damages were assessed using the higher costs associated with regular and extraordinary maintenance of the facilities (personnel, equipment, etc.). The calculation involves applying percentages of degradation to the construction cost of the damaged infrastructure, reflecting the additional burden required to restore it to normal service. The degradation rates were defined based on data collected from comparable interventions: (a) roads, 4%; (b) aqueducts, 1%; (c) buried power lines, 4%; (d) buried telephone lines, 4%; (e) sewers, 0.5%; (f) sewer mains, 0.5%; (g) reclamation canals, 4%; (h) irrigation canals, 4%. The application of degradation rates to the cost value of network infrastructures in the flood-prone resulted in the damage amounts listed in Table 10 and Table 11 for the two investigated areas.

4.2.4. Total Damages

Once the flood damages to the two investigation areas were quantified for each sector (agriculture, urban areas, and network infrastructures) and for each degree of flood event, the total damage amounts were summarized, as in the subsequent tables, Table 12 and Table 13.

4.3. Implementation of the Damage Estimation Model

The relationship between the flood event’s return period (T) and the damage amount (D) was established through two consecutive steps:
  • Determination of the variation law of the flooded area based on the flood event’s return period,
  • Calculation of the damage per unit of flooded area and application of the relationship between the flooded area and the damage amount.
The law correlating the flood event’s return period with the flooded area was identified by interpolating data provided by hydraulic studies of local public entities involved in the management of water basins, using an exponential linear regression model.

4.3.1. Vallo di Diano

To calculate the flooded area S (expressed in hectares) for a given flood event with a return period T (expressed in years), the following function should be used (see Table 14):
370 ln T 596 = S ,
whose coefficient of determination is 98.5%.
The function (24) provides the extent assumed by the flood surface in recurrence of overflow resulting from flood events characterized by return periods greater than five years.
For return periods of 20 years, the function overestimates the extent of the flooded area by approximately 40% due to the deviation between the observed value and the theoretical value obtained from interpolation of the data.
To determine the law of variation of damage as a function of the flooded surface, it is assumed that, starting from the boundaries of the area that floods following five-year events, the territory of Vallo di Diano is characterized by a fairly uniform distribution of capital and economic activities subject to risk. This, moreover, can be assumed since the damages, within the area of interest, exclusively concern agricultural activities and network infrastructure. For this area, the unit damage to productive structures is estimated directly at 1.62 thousand EUR/Ha, an amount made up of damage rates related to agriculture (43%) and network infrastructure (57%).
Based on the unit damage parameter and function (24), the following relationship is obtained:
1626 · 370 ln T 716 + 17,725.83 = D ( EUR · 10 3 ) .
Equation (25) allows calculating the damage, D, resulting from flood events with return periods, T, greater than five years. The damage amounts calculated using Equation (25) are shown in Table 15.

4.3.2. Sele–Calore Rivers’ Confluence

Similar to the other area under investigation, for events with return periods not less than 20 years, the relationship between the flooded area and the return period of the flood event is outlined as follows (see Table 16):
S = 231,066 T 0.254
whose coefficient of determination between the variables is 96.1%.
Function (26) provides the extent assumed by the flooded surface in recurrence of overflow resulting from flood events characterized by return periods greater than five years. Based on the hydraulic data reported in Table 16, the flooded area corresponding to flood events with return periods between 10 and 20 years is assumed to be equal to that calculated using the previous function for 20-year return periods. To identify the functional relationship between the return period T and the corresponding damages D p , it can be assumed that, starting from the boundaries of the area of floods following twenty-year events, the capital and economic activities subject to risk are uniformly distributed throughout the Sele–Calore Rivers’ confluence territory. For this homogeneous area, the unit damage to productive structures ( d u ), estimated directly, resulted in 2164 EUR/Ha. In this amount, the agriculture sector and network infrastructure, respectively, account for 77% and 23%.
The parameter d u and function (26) allow deriving the relationship:
2164 ( 231,066 T 0.254 466 ) + 1,261,188 = D ( · 10 3 ) ,
which allows determining the amount of damage D p corresponding to flood events with return periods, T, not less than 20 years. The damage amounts calculated using Equation (27) for return periods of 10 years, 30 years, and 50 years are shown in Table 17.

4.4. Damages to Environmental Resources Using CVM

The evaluation of flood-induced damages to environmental resources was carried out using the CVM considering three distinct phases.
The first phase involved applying the CVM to an event with a defined periodicity or probability of occurrence, and included:
  • Cartographic delimitation within the investigation area of zones subject to the reference flooding event,
  • Defining a statistically representative sample of the population of “users” of environmental resources present in the zone subject to the considered flooding event,
  • Estimating the “average individual WTP” calculated on the sample, based on the amount that the user is willing to pay to avoid damages to the resources affected by the event; additionally, determining the “total WTP” calculated for the entire population of resource users corresponding to the “accounting price” of the environmental damage produced by the considered event.
The second phase involved estimating the damage for every other event with a different periodicity expected within a certain return period. Events with varying periodicities were derived from the study of flood volumes conducted for the design of hydraulic works for flood containment. In cases where environmental resources subject to flood risk are uniformly distributed across the territory, the evaluation for each event can be carried out using the damage measurement parameter obtained from the estimation conducted in the first phase. When individual zones are specifically characterized from an environmental perspective, the evaluation is instead conducted in relation to the unique resources that each flood zone possesses.
The third phase of the evaluation concerned the calculation of overall damage, corresponding to the accumulation, at the time of evaluation, of the estimated damage amounts for each individual event. It represents the total amount of damage that flooding can cause to the environmental resources of the territory over the period for which the estimation of the flood volumes was carried out. The accumulation should be performed in terms of either a financial sum or an arithmetic sum, depending on whether the quantization of the individual damage amounts is related to the return periods of the events or directly to the time of evaluation (present).
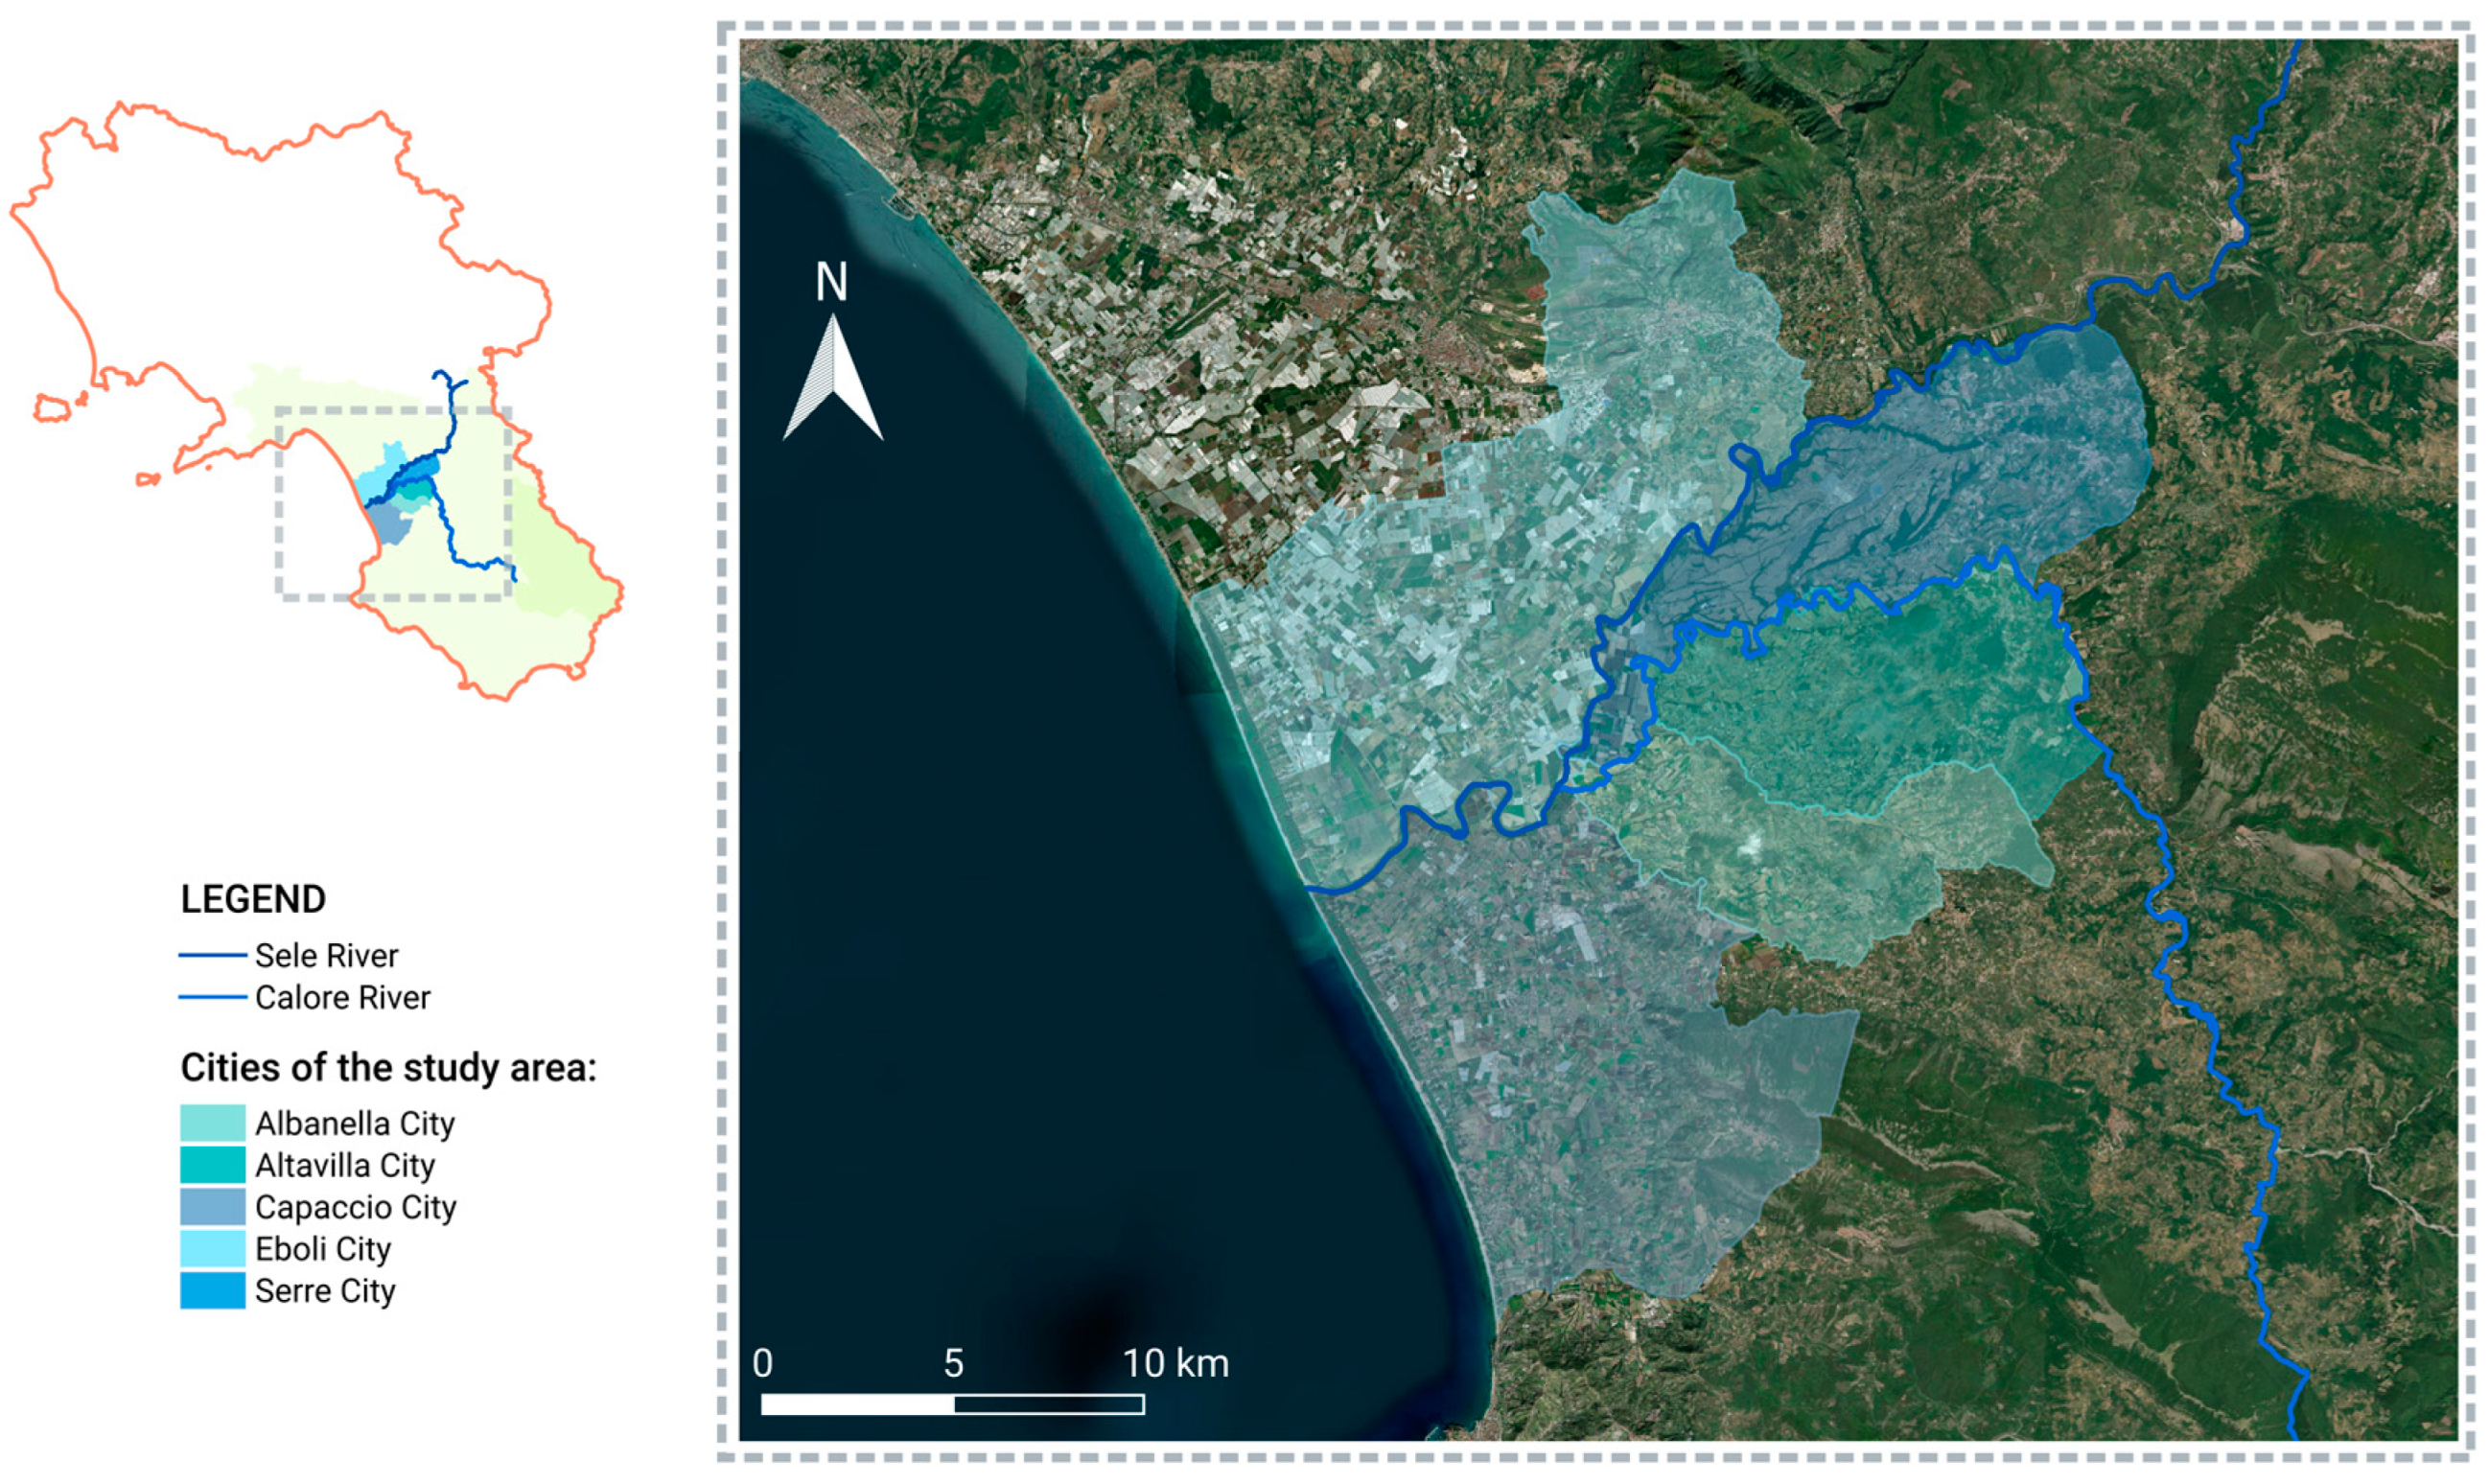
The geographical area of interest exhibits typical characteristics of anthropized regions with exclusively agricultural settlements. The vegetation cover in areas near the banks of the Sele and Calore Rivers consists of Mediterranean scrub and riparian forest, with widespread aquatic and hygrophilous plants. The territory lacks resources of significant historical, cultural, or architectural value, yet it serves as a focal point of attraction for populations from nearby cities. Potential environmental damages primarily stem from the impacts of flooding on use functions, posing a risk to natural tourism, and causing associated morphological modifications, such as avulsion, erosion, and sedimentation. In the case study, the application of the CVM was linked to a flood event with a return period of 50 years, covering an area of 763 hectares. This area encompasses all flood zones, intermittently inundated by events with return periods of less than fifty years. The sample of users of natural resources in the investigation area was defined based on the population residing in municipalities affected by flooding. The criterion for delimiting the user basin was “territorial contiguity” of subjects with the affected resources. Criteria such as “frequency of visits” were excluded due to the open accessibility of resources being evaluated, devoid of constraints and controls that could be subject to a measurement system of the resources’ relationship with users. Similar reasons prevented the quantitative differentiation of the user population among cities in the area. The study area included five cities: Albanella, Altavilla Silentina, Capaccio, Eboli, and Serre (Figure 9). The statistical sample was divided into five components of equal numerical size, each representing the resident population in each city.
Overall, 210 subjects were interviewed, randomly selected from each city in the study area. All the conducted interviews were valuable for statistical analysis. Table 18 summarizes the socioeconomic key characteristics of the selected interviewees.
The questionnaire developed and used to estimate the WTP was divided into three sections. The first section presented questions aimed at gauging the interviewee’s sensitivity to environmental issues, aiming to outline: (a) the inclination of the interviewee to acquire information on the subject of the investigation, (b) their willingness to financially contribute to environmental protection initiatives, and (c) their personal level of use of the resources within the scope of the evaluation. The second section described the effects that flooding has on the natural environment of the territory, including both transient effects (degradation of the territory and consequent prolonged impracticability of places) and permanent effects related to the irreversible modification of the landscape. The elicitation question was then posed directly to assess the importance that the interviewee attributes to the different types of benefits achievable from the natural environment considered. The elicitation question aimed to determine the interviewee’s willingness to pay a predefined amount (WTP), to be contributed to a hypothetical foundation that would use the funds collected to protect the affected environmental resources through the execution of hydraulic works or to promote scientific research and naturalistic education activities. The question was formulated in a way that the interviewee’s response provided the donation amount and, thus, the value of the resources to be safeguarded, referring to the time of estimation. The last part of the questionnaire gathered information about the socioeconomic characteristics of the interviewee (average annual income, educational level, sector of activity, number of people in the family, etc.). The trend of the responses (YES/NO) provided by the interviewees as the amount of the proposed donation in the questionnaire varied is described in Table 19.
Based on the obtained responses, the average individual WTP was carried out using the close-ended version of CVM, through the following equation:
W T P E m e d = 1 G x d x ,
where [ 1 G ( x ) ] expresses the probability that interviewees agree (i.e., respond affirmatively) to the donation x, and G ( x ) is the cumulative frequency distribution of the random variable W T P E .
To specify the function correlating the probabilities defined in the geometric space of both WTP and individual utilities, the following relationship was used:
1 G x = F η Δ V ,
where the cumulative distribution of the stochastic error η was solved through the logit model:
F Δ V = [ 1 + e x p ( Δ V ) ] 1 .
The functional correspondences considered to determine the variation in utility ( Δ V ) are:
Δ V = w u · χ ( mod .   I ) ,
Δ V = w u · l n ( 1 χ R ) ( mod .   II ) ,
Δ V = w u · ln χ ( mod .   III ) ,
where χ represents the proposed donation amount to the interviewee, and w and u are the models’ parameters. In particular, u represents the marginal utility of income (R). In model II, the income (R) was equal to the mean value of income in the analyzed statistical sample (EUR 6825.22). Model III approximates model II.
Parameters of the models were obtained through the maximum likelihood estimators method, and they had the expected signs and were all statistically significant (Table 20).
The values of the average individual WTP were calculated for the three examined models through numerical integration of the cumulative distribution function. The results were then divided by a constant K = ( P r o b W T P > 0 ) . The integration truncation level was set equal to the maximum value of the proposed donation to the interviewee ( X m a x = E U R 103.29 ) . This assumption was primarily based on the range of variation of the donations [81] and the evaluative practice, which attributes equal credibility to different truncation levels [82]. In this case, the assumption was supported by the general stability of the evaluation results, as reported in Table 21.
The total amount of WTP was finally calculated as follows:
W T P E i = η n E i W T P E i m e d
where η = m E i / m E i indicates the success rate of the interviews, considering that m E i is the number of interviewees who provided usable responses for the evaluation. The calculation was preceded by defining the number of households ( n E i ) comprising the statistical population of the investigated area.
The amounts of environmental damage generated by the event with a 50-year recurrence, taken as a reference for the estimation, were EUR 1,240,736 (model I), EUR 1,262,937 (model II), and EUR 990,652 (model III). The amounts of damage estimated with the linear algebraic model and the logarithmic model, expressed in the reciprocal of income, were of similar magnitude. The amounts obtained with the logarithmic model, representing the subjective appreciation of environmental benefits, appeared to be lower. However, the first two evaluation models are preferable to this model due to the lower reactivity of the results that can be obtained with them, as the truncation values of the numerical integration of the probability law of individual utilities vary.
Floods caused by river overflow, as periodic events, occur with a certain probabilistic regularity. At the confluence of the Sele–Calore Rivers, such events can occur every 5, 10, 20, 30, and 50 years. The 5-year events can occur 10 times in 50 years, the 10-year events 5 times, the 20-year events twice, and the 30-year and 50-year events only once, respectively. The floodable area has the maximum width in the fifty-year event recurrence and the minimum in the five-year event recurrence. Over the 50-year period, the total damage is calculated as the amount corresponding to the financial or arithmetic sum of the damage amounts that can be produced by the 19 events.
Starting from the damage determined for the fifty-year event, the damage amounts related to events with lower return periods, considering the uniform distribution of environmental resources in the investigated area, can be calculated using the following relationship:
D T E i 1 = D T E i S T E i · S T E i 1 ,
where T E i (with i = 1 , 2 , 3 , i 1 , i ) represents the return period of the generic flood event E i , and T E i coincides with the timeframe for which the estimation of the environmental damage is carried out.
Throughout the evaluation period, the total environmental damage can be obtained using the following relationship:
D = i n D T E i , n = T E i T E i
The values of the different calculation elements are shown in Table 22. The total environmental damage in the studied territory for the nineteen fifty-year recurrence events was approximately 12,900 EUR·103.
The estimation of damage for different return periods of the events suggests using the results in designing flood control works. This involves comparing the marginal costs of construction with the corresponding marginal benefits of avoided damages. The optimal design is achieved when the marginal costs equal the marginal benefits for events within the economic life of the work.

5. Discussion

The results obtained from the application of the two damage assessment procedures concerning productive resources led us to a natural comparison. By comparing the amounts carried out from the T-Dp model with those resulting from the direct appraisal approach, in both case studies, it emerged that the divergence never exceeded 5% (see Table 23 and Table 24), except the case of a return period of 10 years of the Sele–Calore Rivers’ confluence, where extra costs were probably covered. This circumstance strongly indicates the remarkable adaptation of the relationships (25) and (27) to express the estimated flood damage series, respectively, in the Vallo di Diano territory and in the Sele–Calore Rivers’ confluence territory.
The significant alignment between the calculated and estimated values further confirmed the suitability of the model for assessing damages arising from flood events characterized by return periods different from those considered thus far.
Starting from this insight, we can assume that a similar alignment could emerge with return periods different from those already treated. In the following, the damage amounts relative to the return periods analyzed for the two case areas are reported (see Table 25 and Table 26).
We can assume that the damage amounts reported in the Table 25 and Table 26 are a very probable prevision of the costs that the administrations would sustain in case of river floods with the analyzed return periods.

6. Conclusions

River floods represent a highly dangerous natural disaster affecting human health, the territory, assets, the environment, cultural heritage, and economic and social activities located in affected areas. These natural phenomena are closely linked to weather conditions, geological–morphological conformation, and hydrographic characteristics of the territory [79]. Human activities have intensified this phenomenon, contributing to its severity and increased frequency. The rising frequency and intensity of floods, coupled with high-density residential settlements concentrated in the exposed area, are the primary factors leading to increased economic losses [80]. This scenario leads to new challenges being faced.
The present work aimed to address the challenges that have arisen in the river floods context, providing a forecast of the economic damages in case of future events. The objective was to examine the principles and methods of evaluating the damage caused to the territory by river flooding, focusing especially on the monetary evaluation of flood damage to productive and environmental resources. With particular attention on the productive aspect of the damage, we followed two paths: the first was based on a direct appraisal approach, employing the economic criterion of the depreciated cost, used in estimating the replacement value of economic assets for which there are no market references; the second one, namely the T-Dp model, moved away from the analysis of previous events, trying to extrapolate the damage entity through the determination of a law that, in particular, involves the return period of the event. This approach was tested in two areas, namely, Vallo di Diano and Sele–Calore Rivers’ confluence, both located in Campania, a region of Southern Italy. We validated the results of the damage assessment carried out with the T-Dp model by comparing them with data obtained through direct appraisal and observed that the alignment degree between them was less than 5%. This last finding demonstrated that in both instances, there existed a precise correlation between the values obtained from the procedures, indicating that the adopted model is well suited to characterize the damage entity, even when considering return periods that differ from those analyzed.
The results shown here support the importance of the employment of quantitative assessment models that are crucial to evaluating potential flood damage [81], particularly those that provide a comprehensive estimate of total damage, considering different hazard parameters and all affected categories. The possibility of estimating the flood damage in monetary value for events with different return periods allows the decision- and policy-makers to adopt the best flood-preventive measures. In addition, the ex-ante knowledge of the flood damage could also establish new structural measures by evaluating the effectiveness of preventive investments with a cost–benefit analysis of the flood mitigation scenarios. The need for highly reliable models often faces challenges due to the lack of ex-post data on damage to resources in flooded areas [82,83,84,85,86,87,88]. Based on the results obtained from the case studies, it appears that continued efforts to collect data on past flood hazards and damage are necessary for further improvement and application of precise and reliable damage assessment models similar to those in this study, but in contexts different from those considered here.

Author Contributions

Conceptualization, methodology, validation, formal analysis, investigation, resources, data curation, writing—original draft preparation, writing—editing, visualization, V.D.G., F.S., P.D.P., F.P.D.G. and D.T.; review, P.D.P. and D.T. All authors have read and agreed to the published version of the manuscript.

Funding

This research was funded by the Ministry of University and Research of the Italian Republic, P.R.I.N. Project 2022: “INSPIRE—Improving Nature-Smart Policies through Innovative Resilient Evaluations”, Grant Number: 2022J7RWNF.

Data Availability Statement

Raw data are available upon request from the authors.

Conflicts of Interest

The authors declare no conflicts of interest.

References

  1. Cevasco, A.; Diodato, N.; Revellino, P.; Fiorillo, F.; Grelle, G.; Guadagno, F.M. Storminess and geo-hydrological events affecting small coastal basins in a terraced Mediterranean environment. Sci. Total Environ. 2015, 532, 208–219. [Google Scholar] [CrossRef]
  2. Diodato, N. Climatic fluctuations in southern Italy since the 17th century: Reconstruction with precipitation records at Benevento. Clim. Chang. 2007, 80, 411–431. [Google Scholar] [CrossRef]
  3. Knox, J.C. Large increase in flood magnitude in response to modest changes in climate. Nature 1993, 361, 430–432. [Google Scholar] [CrossRef]
  4. Vennari, C.; Parise, M.; Santangelo, N.; Santo, A. A database on flash flood events in Campania, southern Italy, with an evaluation of their spatial and temporal distribution. Nat. Hazards Earth Syst. Sci. 2016, 16, 2485–2500. [Google Scholar] [CrossRef]
  5. Pereira, P.; Barceló, D.; Panagos, P. Soil and water threats in a changing environment. Environ. Res. 2020, 186, 109501. [Google Scholar] [CrossRef] [PubMed]
  6. Keating, A.; Campbell, K.; Mechler, R.; Michel-Kerjan, E.; Mochizuki, J.; Kunreuther, H.; Bayer, J.; Hanger, S.; McCallum, I.; See, L.; et al. Operationalizing Resilience against Natural Disaster Risk: Opportunities, Barriers, and a Way Forward. Zurich Flood Resilience Alliance; IIASA: Zurich, Switzerland, 2014. [Google Scholar]
  7. Dutta, D.; Herath, S.; Musiake, K. A mathematical model for flood loss estimation. J. Hydrol. 2003, 277, 24–49. [Google Scholar] [CrossRef]
  8. Velasco, M.; Cabello, À.; Russo, B. Flood damage assessment in urban areas. Application to the Raval district of Barcelona using synthetic depth damage curves. Urban Water J. 2016, 13, 426–440. [Google Scholar] [CrossRef]
  9. Lekuthai, A.; Vongvisessomjai, S. Intangible flood damage quantification. Water Resour. Manag. 2001, 15, 343–362. [Google Scholar] [CrossRef]
  10. Parker, D.J.; Green, C.H.; Thompson, P.M. Urban Flood Protection Benefits: A Project Appraisal Guide; Gower Technical Press: Aldershot, UK, 1987. [Google Scholar]
  11. Smith, K.; Ward, R. Floods: Physical Processes and Human Impacts; John Wiley & Sons: Chichester, UK, 1998. [Google Scholar]
  12. Appelbaum, S.J. Determination of urban flood damages. J. Water Resour. Plan. Manag. 1985, 111, 269–283. [Google Scholar] [CrossRef]
  13. Sindhu, K.; Durga Rao, K.H.V. Hydrological and hydrodynamic modeling for flood damage mitigation in Brahmani–Baitarani River Basin, India. Geocarto Int. 2017, 32, 1004–1016. [Google Scholar]
  14. Eleuterio, J. Flood Risk Analysis: Impact of Uncertainty in Hazard Modelling and Vulnerability Assessments. Ph.D. thesis, University of Strasbourg, Strasbourg, France, 2012. [Google Scholar]
  15. Merz, B.; Kreibich, H.; Schwarze, R.; Thieken, A. Assessment of Economic Flood Damage. Nat. Hazards Earth Syst. Sci. 2010, 10, 1697–1724. [Google Scholar] [CrossRef]
  16. Smith, D.I. Flood damage estimation—A review of urban stagedamage curves and loss functions. Water Sa 1994, 20, 231–238. [Google Scholar]
  17. Gissing, A.; Blong, R. Accounting for Variability in Commercial Flood Damage Estimation. Aust. Geogr. 2004, 35, 209–222. [Google Scholar] [CrossRef]
  18. Aribisala, O.D.; Yum, S.G.; Adhikari, M.D.; Song, M.S. Flood Damage Assessment: A Review of Microscale Methodologies for Residential Buildings. Sustainability 2022, 14, 13817. [Google Scholar] [CrossRef]
  19. Pistrika, A.; Tsakiris, G.; Nalbantis, I. Flood DepthDamage Functions for Built Environment. Environ. Process. 2014, 1, 553–572. [Google Scholar] [CrossRef]
  20. Meyer, V.; Messner, F. National Flood Damage Evaluation Methods: A Review of Applied Methods in England, The Netherlands, the Czech Republic and Germany; UFZ-Umweltforschungszentrum Leipzig-Halle: Leipzig, Germany, 2005. [Google Scholar]
  21. Messner, F.; Penning-rowsell, E.; Green, C.; Meyer, V.; Tunstall, S.; Van Der Veen, A. Evaluating Flood Damages: Guidance and Recommendations on Principles and Methods; FLOODsite Project Deliverable D9.1; Helmholz Unweltforschungszentrum (UFZ): Wallingford, UK, 2007. [Google Scholar]
  22. Sulong, S.; Romali, N.S. Flood damage assessment: A review of multivariate flood damage models. Int. J. GEOMATE 2022, 22, 106–113. [Google Scholar] [CrossRef]
  23. Romali, N.S.; Yusop, Z.; Sulaiman, M.; Ismail, Z. Flood risk assessment: A review of flood damage estimation model for Malaysia. J. Teknol. 2018, 80, 145–153. [Google Scholar] [CrossRef]
  24. Meyer, V.; Becker, N.; Markantonis, V.; Schwarze, R.; van den Bergh, J.C.J.M.; Bouwer, L.M.; Bubeck, P.; Ciavola, P.; Genovese, E.; Green, C.; et al. Assessing the costs of natural hazards—State of the art and knowledge gaps. Nat. Hazards Earth Syst. Sci. 2013, 13, 1351–1373. [Google Scholar] [CrossRef]
  25. Przyluski, V.; Hallegatte, S. Indirect Costs of Natural Hazards—CONHAZ Report. 2011. Available online: https://climate-adapt.eea.europa.eu/en/metadata/guidances/indirect-costs-of-natural-hazards (accessed on 1 February 2024).
  26. Cochrane, H.C. Chapter 3. Indirect Losses from Natural Disasters: Measurement and Myth. In Modeling the Spatial and Economic Effects of Disasters; Okuyama, Y., Chang, S.E., Eds.; Springer: New York, NY, USA, 2004. [Google Scholar]
  27. Rose, A.; Liao, S.Y. Modeling Regional Economic Resilience to Disasters: A Computable General Equilibrium Analysis of Water Service Disruptions. J. Reg. Sci. 2005, 45, 75–112. [Google Scholar] [CrossRef]
  28. Rose, A. Economic Principles, Issues and Research Priorities in Hazard Loss Estimation. In Modeling the Spatial and Economic Effects of Disasters; Okuyama, Y., Chang, S.E., Eds.; Springer: New York, NY, USA, 2004. [Google Scholar]
  29. Pearce, D.W.; Smale, R. Appraising flood control investments in the UK. In Cost-Benefit-Analysis and Water Resource Management; Brouwer, R., Pearce, D.W., Eds.; Edward Elgar: Cheltenham, UK, 2005; pp. 71–92. [Google Scholar]
  30. Serpieri, A. Il Metodo di Stima dei Beni Fondiari; Tipografia Di Mariano Picci: Firenze, Italy, 1917. [Google Scholar]
  31. Brizi, A. Lezioni di Metodo dell’Estimo Agrario; Della Torre: Portici, Italy, 1936. [Google Scholar]
  32. Morano, N. Valutazione dei Danni da Piena; Consorzio Piano Bacino Sele: Napoli, Italy, 1991. [Google Scholar]
  33. Hoes, O.; Schuurmans, W. Flood Standards or Risk Analyses for Polder Management in the Netherlands. Irrig. Drain. 2006, 55, S113–S119. [Google Scholar]
  34. Citeau, J.M. A New Control Concept in the Oise Catchment Area: Definition and Assessment of Flood Compatible Agricultural Activities; FIG Working Week: Paris, France, 2003. [Google Scholar]
  35. Forster, S.; Kuhlmann, B.; Lindenschmidt, K.E.; Bronstert, A. Assessing flood risk for a rural detention area. Nat. Hazards Earth Syst. Sci. 2008, 8, 311–322. [Google Scholar] [CrossRef]
  36. Penning-Rowsell, E.C.; Chatterton, J.B. The Benefits of Flood Alleviation: A Manual of Assessment Techniques; Gower Technical Press: Aldershot, UK, 1977. [Google Scholar]
  37. Forte, F. Le Imposte Sulle Vendite e Sul Valore Aggiunto; Einaudi: Turin, Italy, 1973. [Google Scholar]
  38. Orefice, M. Estimo; UTET: Torino, Italy, 1984. [Google Scholar]
  39. Verlynde, N.; Voltaire, L.; Chagnon, P. Exploring the link between flood risk perception and public support for funding on flood mitigation policies. J. Environ. Plan. Manag. 2019, 62, 2330–2351. [Google Scholar] [CrossRef]
  40. Davis, R.K. The value of big game hunting in a private forest. In Proceedings of the Transactions of the Twenty-Ninth North American Wildlife and Natural Resources Conference, Las Vegas, NV, USA, 9–11 March 1964; Volume 29, pp. 393–403. [Google Scholar]
  41. Ridker, R.G. Economic Costs of Air Pollution; Praeger: New York, NY, USA, 1967. [Google Scholar]
  42. Boyle, K.J.; Bishop, R.C. Welfare measurements using contingent valuation: A comparison of techniques. Am. J. Agric. Econ. 1988, 70, 20–28. [Google Scholar] [CrossRef]
  43. Loomis, J.B. Balancing public trust resources of Mono Lake and Los Angeles’ water right: An economic approach. Water Resour. Res. 1987, 23, 1449–1456. [Google Scholar] [CrossRef]
  44. Shultz, S.D.; Lindsay, B.E. The willingness to pay for groundwater protection. Water Resour. Res. 1990, 26, 1869–1875. [Google Scholar] [CrossRef]
  45. Markantonis, V.; Meyer, V.; Lienhoop, N. Evaluation of the environmental impacts of extreme floods in the Evros River basin using Contingent Valuation Method. Nat. Hazards 2013, 69, 1535–1549. [Google Scholar] [CrossRef]
  46. Arrow, K.; Solow, R.; Portney, P.; Leamer, E.; Radner, R.; Schuman, H. Report of the NOAA Panel on Contingent Valuation; National Oceanic and Atmospheric Administration: Washington, DC, USA, 1993. [Google Scholar]
  47. Daun, C.M.; Clark, D. Flood Risk and Contingent Valuation Willingness to Pay Studies: A Methodological Review and Applied Analysis; Institute for Urban Environmental Risk Management, Marquette University: Milwaukee, WI, USA, 2000. [Google Scholar]
  48. Birol, E.; Karousakis, K.; Koundouri, P. Using economic valuation techniques to inform water resources management: A survey and critical appraisal of available techniques and an application. Sci. Total Environ. 2006, 365, 105–122. [Google Scholar] [CrossRef] [PubMed]
  49. Hoevenagel, R. The Contingent Valuation Method: Scope and Validity; Vrije University: Amsterdam, The Netherlands, 1994. [Google Scholar]
  50. Shavell, S. Contingent valuation of the nonuse value of natural resources: Implications for public policy and the liability system. Contrib. Econ. Anal. 1993, 220, 371–388. [Google Scholar]
  51. Diamond, P.A.; Hausman, J.A. Contingent valuation: Is some number better than no number? J. Econ. Perspect. 1994, 8, 45–64. [Google Scholar] [CrossRef]
  52. Kahneman, D.; Knetsch, J.L. Valuing public goods: The purchase of moral satisfaction. J. Environ. Econ. Manag. 1992, 22, 57–70. [Google Scholar] [CrossRef]
  53. Loomis, J.; Lockwood, M.; DeLacy, T. Some empirical evidence on embedding effects in contingent valuation of forest protection. J. Environ. Econ. Manag. 1993, 25, 45–55. [Google Scholar] [CrossRef]
  54. Whitehead, J.C. A practitioner’s primer on contingent valuation. In Handbook on Contingent Valuation; Alberini, A., Kahn, J.R., Eds.; Edward Elgar Publishing: Cheltenham, UK, 2006; Chapter 3; pp. 92–115. [Google Scholar]
  55. Kroll, C.A.; Landis, J.D.; Shen, Q.; Stryker, S. Economic Impacts of the Loma Prieta Earthquake: A Focus on Small Businesses; 1991. Available online: https://escholarship.org/uc/item/6s67g8mh (accessed on 1 February 2024).
  56. Molinari, D.; Menoni, S.; Aronica, G.T.; Ballio, F.; Berni, N.; Pandolfo, C.; Stelluti, M.; Minucci, G. Ex post damage assessment: An Italian experience. Nat. Hazards Earth Syst. Sci. 2014, 14, 901–916. [Google Scholar] [CrossRef]
  57. Pfurtscheller, C. Regional Economic Impacts of Natural Hazards—The Case of the 2005 Alpine flood event in Tyrol (Austria). Nat. Hazards Earth Syst. Sci. 2014, 14, 359–378. [Google Scholar] [CrossRef]
  58. Albala-Bertrand, J.M. Natural disaster situations and growth: A macroeconomic model for sudden disaster impacts. World Dev. 1993, 21, 1417–1434. [Google Scholar] [CrossRef]
  59. Cavallo, E.; Galiani, S.; Noy, I.; Pantano, J. Catastrophic Natural Disasters and Economic Growth. Rev. Econ. Stat. 2013, 95, 1549–1561. [Google Scholar] [CrossRef]
  60. Noy, I.; Nualsri, A. What do Exogenous Shocks Tell Us about Growth Theories? Working Paper, No. 07-16; University of California, Santa Cruz Institute for International Economics (SCIIE): Santa Cruz, CA, USA, 2007. [Google Scholar]
  61. Strobl, E. The Economic Growth Impact of Hurricanes: Evidence from U.S. Coastal Counties. Rev. Econ. Stat. 2010, 93, 575–589. [Google Scholar] [CrossRef]
  62. Hallegatte, S. An adaptive regional input-output model, and its application to the assessment of the economic cost of Katrina. Risk Anal. 2008, 28, 779–799. [Google Scholar] [CrossRef]
  63. Hallegatte, S.; Ranger, N.; Mestre, O.; Corfee-Morlot, P.D.J.; Herweijer, C.; Muir, R. Assessing climate change impacts, sea level rise and storm surge risk in port cities: A case study on Copenhagen. Clim. Chang. 2011, 104, 113–137. [Google Scholar] [CrossRef]
  64. Henriet, F.; Hallegatte, S.; Tabourier, L. Firm-network characteristics and economic robustness to natural disasters. J. Econ. Dyn. Control 2012, 36, 150–167. [Google Scholar] [CrossRef]
  65. Okuyama, Y. Disaster, and economic structural change: Case study on the 1995 Kobe earthquake. Econ. Syst. Res. 2014, 26, 37–41. [Google Scholar] [CrossRef]
  66. Okuyama, Y.; Hewings, G.D.; Sonis, M. Measuring Economic Impacts of Disasters: Interregional Input-Output Analysis Using Sequential Interindustry Model. In Modeling Spatial and Economic Impacts of Disasters; Okuyama, Y., Chang, S., Eds.; Springer Berlin Heidelberg: Berlin/Heidelberg, Germany, 2004; pp. 77–101. [Google Scholar]
  67. Ranger, N.; Hallegatte, S.; Bhattacharya, S.; Bachu, M.; Priya, S.; Dhore, K.; Corfee-Morlot, J. An assessment of the potential impact of climate change on flood risk in Mumbai. Clim. Chang. 2011, 104, 139–167. [Google Scholar] [CrossRef]
  68. Berrittella, M.; Hoekstra, A.Y.; Rehdanz, K.; Roson, R.; Tol, R.S.J. The economic impact of restricted water supply: A computable general equilibrium analysis. Water Res. 2007, 41, 1799–1813. [Google Scholar] [CrossRef] [PubMed]
  69. Haddad, E.A.; Teixeira, E. Economic impacts of natural disasters in megacities: The case of floods in São Paulo, Brazil. Habitat Int. 2015, 45, 106–113. [Google Scholar] [CrossRef]
  70. Jonkhoff, W. Flood risk assessment and policy in the Netherlands. Green Cities 2009, 220. [Google Scholar]
  71. Pauw, K.J.T.; Bachu, M.; Van Seventer, D.E. The economic costs of extreme weather events: A hydrometeorological CGE analysis for Malawi. Environ. Dev. Econ. 2011, 16, 177–198. [Google Scholar] [CrossRef]
  72. Rose, A.; Benavides, J.; Chang, S.E.; Szczesniak, P.; Lim, D. The Regional Economic Impact of an Earthquake: Direct and Indirect Effects of Electricity Lifeline Disruptions. J. Reg. Sci. 1997, 37, 437–458. [Google Scholar] [CrossRef]
  73. Tsuchiya, S.; Tatano, H.; Okada, N. Economic loss assessment due to railroad and highway disruptions. Econ. Syst. Res. 2007, 19, 147–162. [Google Scholar] [CrossRef]
  74. Okuyama, Y. Economic modeling for disaster impact analysis: Past, present, and future. Econ. Syst. Res. 2007, 19, 115–124. [Google Scholar] [CrossRef]
  75. Carrera, L.; Standardi, G.; Bosello, F.; Mysiak, J. Assessing direct and indirect economic impacts of a flood event through the integration of spatial and computable general equilibrium modelling. Environ. Model. Softw. 2015, 63, 109–122. [Google Scholar] [CrossRef]
  76. Mishan, E.J. The use of compensating and equivalent variations in cost-benefit analysis. Economica 1976, 43, 185–197. [Google Scholar] [CrossRef]
  77. Bishop, R.C.; Heberlein, T.A. Measuring values of extramarket goods: Are indirect measures biased? Am. J. Agric. Econ. 1979, 61, 926–930. [Google Scholar] [CrossRef]
  78. Signorello, G. La stima dei benefici di tutela di un’area naturale: Un’applicazione della Contingent Valuation. Genio Rural. 1990, 9, 21–35. [Google Scholar]
  79. Ietto, F.; Salvo, F.; Cantasano, N. The quality-of-life conditioning with reference to the local environmental management: A pattern in Bivona country (Calabria, Southern Italy). Ocean. Coast. Manag. 2014, 102, 340–349. [Google Scholar] [CrossRef]
  80. Cellerino, R. L’Italia delle alluvioni. In Un’analisi Economica; Franco Angeli: Milan, Italy, 2004. [Google Scholar]
  81. Molinari, D.; Aronica, G.T.; Ballio, F.; Berni, N.; Pandolfo, C. Le curve di danno quale strumento a supporto della direttiva alluvioni: Criticità dei dati italiani. In Proceedings of the XXXIII Convegno Nazionale di Idraulica e Costruzioni Idrauliche, Brescia, Italy, 10–15 September 2012. [Google Scholar]
  82. Schwarz, J.; Maiwald, H. Damage and loss prediction model based on the vulnerability of building types. In Proceedings of the 4th International Symposium on Flood Defence, Toronto, ON, Canada, 6–8 May 2008. [Google Scholar]
  83. Manganelli, B.; Vona, M.; De Paola, P. Evaluating the cost and benefits of earthquake protection of buildings. J. Eur. Real Estate Res. 2018, 11, 263–278. [Google Scholar] [CrossRef]
  84. Del Giudice, V.; De Paola, P. Undivided real estate shares: Appraisal and interactions with capital markets. Appl. Mech. Mater. 2014, 584–586, 2522–2527. [Google Scholar] [CrossRef]
  85. Forte, F.; Antoniucci, V.; De Paola, P. Immigration and the Housing Market: The Case of Castel Volturno, in Campania Region, Italy. Sustainability 2018, 10, 343. [Google Scholar] [CrossRef]
  86. Del Giudice, V.; De Paola, P.; Forte, F. The appraisal of office towers in bilateral monopoly’s market: Evidence from application of Newton’s physical laws to the directional centre of Naples. Int. J. Appl. Eng. Res. 2016, 11, 9455–9459. [Google Scholar]
  87. Del Giudice, V.; De Paola, P. The effects of noise pollution produced by road traffic of Naples Beltway on residential real estate values. Appl. Mech. Mater. 2014, 587–589, 2176–2182. [Google Scholar] [CrossRef]
  88. Del Giudice, V.; De Paola, P. Geoadditive models for property market. Appl. Mech. Mater. 2014, 584–586, 2505–2509. [Google Scholar] [CrossRef]
Figure 1. Graph of the (T-Dp) law.
Water 16 00665 g001
Figure 2. (a) S-Dp variation law as the assets affected by floods change. (b) Representation of the S-Dp law in the presence of punctually located investments.
Water 16 00665 g002
Figure 3. Total and marginal environmental damage curve as a function of time.
Water 16 00665 g003
Figure 4. Vallo di Diano localization.
Water 16 00665 g004
Figure 5. Delimitation of the investigation area related to Vallo di Diano.
Water 16 00665 g005
Figure 6. Cartographic delimitation of the flood-prone areas for flood events with different return periods—Vallo di Diano.
Water 16 00665 g006
Figure 7. Delimitation of the Sele–Calore Rivers’ confluence.
Water 16 00665 g007
Figure 8. Delimitation of the flood-prone areas for the Sele–Calore confluence.
Water 16 00665 g008
Figure 9. Geographical identification of the cities in which the interviewees resided.
Water 16 00665 g009
Table 1. Types of flood damages (adapted from [22,23]).
Damages CategoryTangibleIntangible
DirectDamage to building structures and their contents, infrastructures, agriculture (e.g., soil erosion/harvest destruction), business goods, livestock, and land and environment recoveries.Loss of life, injuries, psychological distress, cultural heritage damages, and negative effects on ecosystems.
IndirectBusiness interruption, public services/utility interruption (e.g., communication systems), induced production losses to companies outside the flooded area (e.g., suppliers of flooded companies), traffic disruption costs, and tax revenue losses due to migration of companies in the aftermath of a flood.Traumatic experiences, loss of trust in authorities, deteriorating health, and emotional damages.
Table 2. Tanagro River: parameters of flood events.
T (Years)Qc (m3/s)S (Ha)Dw (m3/s∙106)l (km)
5300120 1-0.4 2
10400240 1-0.8 2
205003601.41.2
306006604.62.2
507009009.23.0
Note(s): 1 Surface areas were calculated with the mathematical model described in Section 3.1. 2 Distance from Polio Bridge obtained as the ratio between the flooded surface area and the average width of the plain.
Table 3. Vallo di Diano: surface areas of flood-prone zones.
ItemsReturn Period of Events (Years)
510203050
Area of flood zones (Ha)
-
Downstream of Polio Bridge
6262626262
-
Upstream of Polio Bridge
-----
-
Due to the difference between the inflowing and outflowing flows in the Rio Maltempo
120240360660900
-
Due to overflowing from embankment stretches of insufficient height along the Tanagro River
245219201147117
Total:4275216238691.079
Urban areas, network infrastructure areas, watercourses, and drainage canals (Ha)120127131141151
Farm area (Ha)307394492728928
Areas occupied by rural buildings, farm and farm roads, ditches, and drains and installations serving agricultural activity (Ha)1824284455
Usable agricultural area (Ha)289370464684873
Table 4. Sele–Calore confluence: parameters of flood events.
T (Years)Qc (m3/s)S (Ha)
51300333 1
101700466 1
202000466
302300542
502700612
Note(s): 1 Surface areas were calculated with the mathematical model described in Section 3.1.
Table 5. Sele–Calore confluence: surface areas of flood-prone zones.
ItemsReturn Period of Events (Years)
510203050
Area of flood zones (Ha)333466542612-
Urban areas, network infrastructure areas, watercourses, and drainage canals (Ha)3346465262
Farm area (Ha)300420420490550
Areas occupied by rural buildings, farm and farm roads, ditches, and drains and installations serving agricultural activity (Ha)2030303540
Usable agricultural area (Ha)280390390455510
Table 6. Damages to agricultural productions and structures in the flooded areas of the Vallo di Diano.
Degrees of EventDamages to Agricultural Productions (EUR·103)Damages to Agricultural Structures (EUR·103)Total (EUR·103)
Five years251.16204.00455.16
Ten years340.61224.66565.27
Twenty years400.52246.35646.87
Thirty years578.14250.48828.62
Fifty years750.69254.611005.30
Table 7. Damages to agricultural productions and structures in the flooded areas of the Sele–Calore Rivers’ confluence.
Degrees of EventDamages to Agricultural Productions (EUR·103)Damages to Agricultural Structures (EUR·103)Total (EUR·103)
Five years817.044338821.37
Ten years1025.1760421031.21
Twenty years1025.1760421031.21
Thirty years1092.3169721099.28
Fifty years1265.8479021273.74
Table 8. Value of urban areas affected by the events.
ItemsSize (m2)Unit Cost (EUR/m2)Value (EUR·103)
Dwellings94,400361.5234,127.49
Commercial premises32,000516.4616,526.72
Basement rooms31,600118.783753.45
Appurtenances29,600103.293057.38
Gardens 120,0002.0641.20
Green areas 2112,0000.2629.12
Total: 57,506.34
Note(s): 1 The term “Gardens” refers to the areas pertaining to private residential settlements. 2 The term “Green areas” refers to the green spaces, not equipped, located in the urban context.
Table 9. Polla town: value of capital at risk in areas affected by events.
ItemsExposed Area (sqm)Unit Damage (EUR/sqm)Total Damage (EUR·103)
Dwellings94,400123.9511,700.88
Commercial premises32,000123.953966.40
Basement rooms31,60030.99979.28
Appurtenances29,60015.49458.50
Gardens20,0000.5210.40
Green areas112,0000.0262.92
Total: 17,118.38
Table 10. Vallo di Diano: damages to network infrastructures.
ItemsAmounts of Damages for Flood Event Degree (EUR·103)
510203050
Roads77.48141.51294.38362.04528.85
Aqueducts5.168.7817.0421.1729.95
Sewer mains5.688.2615.4920.1428.40
Sewers--1.031.552.06
Buried power lines1.032.585.167.7510.84
Buried telephone lines1.032.063.615.688.26
Reclamation canals61.97107.42149.77193.15264.42
Total:152.35260.71486.48611.48872.78
Table 11. Sele–Calore Rivers’ confluence: damages to network infrastructures.
ItemsAmounts of Damages for Flood Event Degree (EUR·103)
510203050
Roads82.12113.10113.10128.60150.81
Aqueducts1.031.031.031.031.03
Reclamation canals44.4263.5263.5271.7982.12
Irrigation network37.7052.1652.1660.9469.21
Total:165.27229.82229.82262.36303.16
Table 12. Vallo di Diano: total damages by sector and flood event degree.
SectorAmounts of Damages for Flood Event Degree (EUR·103)
510203050
Agriculture455.00565.00646.60828.401005.02
Urban areas17,118.4817,118.4817,118.4817,118.4817,118.48
Network infrastructures152.35270.62486.50611.48872.81
Total:17,725.8317,954.1018,251.5818,558.3619,002.31
Table 13. Sele–Calore Rivers’ confluence: total damages by sector and flood event degree.
SectorAmounts of Damages for Flood Event Degree (EUR·103)
510203050
Agriculture821.161031.211031.211099.281273.74
Network infrastructures165.27229.82229.82262.36303.16
Total:986.381261.191261.191361.381577.26
Table 14. Vallo di Diano: return period—flooded area.
Return Period of Flood Events (Years)Flooded Area (Ha)
5120 (*)
10240 (*)
20360
30660
50900
1001140
2001350
Note(s): (*) Value obtained by interpolation.
Table 15. Return period—amount of damage for Vallo di Diano.
Return Period of Flood Events (Years)Total Damage (EUR·103)
1017,946.88
2018,363.66
3018,607.94
5018,915.23
Table 16. Sele–Calore Rivers’ confluence: return period—flooded area.
Return Period of Flood Events (Years)Flooded Area (Ha)
5333
10466
20466
30542
50612
100759 (*)
Note(s): (*) Value obtained by interpolating data related to 20-year, 30-year, and 50-year events.
Table 17. Return period—amount of damage (Sele–Calore Rivers’ confluence).
Return Period of Flood Events (years)Total Damage (EUR·103)
101,046,858
301,335,557
501,499,791
Table 18. Socioeconomic key characteristics of the selected interviewees.
CharacteristicCategoryAlbanellaAltavilla SilentinaCapaccioEboliSerre
Number of Interviewees
Age0–1941533
20–34515111310
35–4915791015
50–6461112911
>65128573
GenderMale1518212119
Female2724212123
Education
Level
Bachelor’s degree42384
High school degree1017182118
Middle school degree151413818
Elementary degree139852
Literate00000
Illiterate00000
OccupationCraft, manual, or agricultural professions151314913
Professions with a low level of competence1720151922
Professions with a high–medium level of specialization7910127
Unemployed30320
Income
Level
<10,00000112
10,000–15,0001915221719
15,000–26,0008121059
26,000–55,0008107118
55,000–75,00074264
75,000–120,00001010
>120,00000010
Table 19. Relationship between the proposed donation amount and interviewee responses.
Donation Amount (EUR)Size of the Sub-SampleNumber of Responses
YESNO
2.5812111
5.1615132
10.3314122
12.911293
15.4914104
18.07963
20.6620125
25.821165
30.99945
36.1516610
41.32826
46.481028
51.641028
64.5524420
77.4716214
103.291019
Table 20. Results of the logit models.
VariableModel IModel IIModel III
Constant1.5852481.57868815.033495
Donation−0.00025
ln (1-donation/income) 321.959046
ln (donation) −1.405207
Table 21. Values of the average individual WTP (EUR).
Probability of Truncation of the Distribution
Prob. (Xmax) aProb. (0.100)Prob. (0.050)Prob. (0.010)
Model I43.9441.38442.82343.850
0.00043 *0.00043 *0.00043 *0.00043 *
35.930 **34.422 **35.539 **36.391 **
103.291 ***78.139 ***93.575 ***127.675 ***
Model II44.06942.29743.66244.700
0.00043 *0.00043 *0.00043 *0.00043 *
36.534 **35.064 **36.196 **37.056 **
103.291 ***79.578 ***95.215 ***129.632 ***
Model III35.10935.72141.10250.005
103.291 ***109.238 ***185.913 ***601.811 ***
Note(s): a Truncation probabilities at Xmax = EUR 103.291 were: 0.031 (Model I), 0.034 (Model II), and 0.107 (Model III). * Constant; ** value not normalized; *** amount corresponding to the probability of truncation.
Table 22. Calculation parameters of environmental damage.
T E i (Years) S T E i (Ha) D T E i (EUR·103) n i (N) n i · D T E i (EUR·103)
5333540.730105407.304
10466757.12653785.629
20466757.12621514.252
30542880.5591880.559
507631239.49611239.496
D = 12,827.240
Table 23. Results comparison between the T-Dp model and the direct appraisal: Vallo di Diano.
Return Period of Flood Events (years)Amount of Damage (EUR·103)Divergence (%)
T-Dp ModelDirect Appraisal
1017,946.8817,954.100.04
2018,363.6618,251.580.61
3018,607.9418,558.360.27
5018,915.2319,002.310.46
Table 24. Results comparison between the T-Dp model and the direct appraisal: Sele–Calore Rivers’ confluence.
Return Period of Flood Events (Years)Amount of Damage (EUR·103)Divergence (%)
T-Dp ModelDirect Appraisal
101,046,8581261.1920.47
301,335,5571361.381.93
501,499,7911577.265.17
Table 25. Return period—amount of damage: Vallo di Diano.
Return Period of Flood Events (Years)Amount of Damage (EUR·103)
1518,190.640
2518,497.950
3518,700.390
4018,780.950
4518,851.190
10019,332.010
20019,748.790
Table 26. Return period—amount of damage: Sele–Calore Rivers’ confluence.
Return Period of Flood Events (Years)Amount of Damage (EUR·103)
251281.846
351383.071
401425.421
451464.155
1001760.805
Disclaimer/Publisher’s Note: The statements, opinions and data contained in all publications are solely those of the individual author(s) and contributor(s) and not of MDPI and/or the editor(s). MDPI and/or the editor(s) disclaim responsibility for any injury to people or property resulting from any ideas, methods, instructions or products referred to in the content.