Article

Extreme Flood Flow Routing for Panchet and Maithan Reservoirs of India Using Modified Puls Technique

School of Water Resources Engineering, Jadavpur University, Kolkata 700032, India
*
Author to whom correspondence should be addressed.
Water 2024, 16(5), 663; https://doi.org/10.3390/w16050663
Submission received: 27 December 2023 / Revised: 13 February 2024 / Accepted: 22 February 2024 / Published: 24 February 2024
(This article belongs to the Special Issue Flood Risk Identification and Management)

Abstract

:
An important aspect of economic considerations is the routing and safety of hydraulic storage facilities such as dams for extreme probable water flooding. The routing of dam reservoirs requires more attention for determining the magnitude of extreme probable flooding. Apparently, the type of structure, importance, and economic development of the surrounding area guide the routing criteria for choosing the extreme flood magnitude. The Maithan and Panchet Dams in India have faced several major floods with diversified magnitudes since 1978. The present study aims to estimate the storage and routing of extreme probable floodings for these two dams based on real-time flood data like inflow, outflow, and elevation for the extreme flood years of 1978, 2009, and 2014. Reservoir storages at different elevations are calculated from the initial storage volumes. For both reservoirs, discharge equations are derived and calculated at given elevations during extreme floods. The Modified Puls technique is used for routing extreme floods. At the end of each extreme flood in 1978, 2009, and 2014, the variation in outflow discharges at different elevations and flood hydrographs is predicted. Finally, estimated outflow discharges are compared with the actual outflow discharges for the given inflows during extreme floods. Using this approach, extreme floods that occurred in 1978 are predicted with less than 10% error. Outcomes from this study may help in the future planning and routing of flood-control detention facilities and in predicting the variation in outflow discharges at different elevations. Based on this work, alternative studies and regional drainage planning can also be carried out.

1. Introduction

The technique of determining a flood hydrograph at a section of a river based on data of extreme flood flow at one or more upstream sections is known as extreme flood routing. By the process of extreme flood routing, hydraulic engineers can predict the change in flood behavior when passing through reservoirs and river channels and can also evaluate the effects of flood modification due to control or protection works, i.e., the installation of a reservoir or a levee system. When the tributaries discharge different quantities of outflow, they estimate the outlook of combined floods and solve many other vital problems in the planning, design, and operation of hydraulic engineering developments. Flood routing includes the hydrologic analysis of problems such as flood forecasting, flood protection, reservoir design, and spillway design.
Clark [1] clarified the inherent relationship between the unit hydrograph and the methods of flood routing by showing how this relationship can be used to derive accurate unit hydrographs for very short periods of initial runoff, which may accurately reflect the influence of the shape of the drainage area on the shape of the hydrograph. Chow [2] proposed a much simpler and more practical procedure of flood routing than previous routing methods because of their laboriousness and inaccuracies in basic data that do not fully justify their use in actual practice, whereas the proposed method was employed in an engineering office with very satisfactory results. Nash [3] discussed a method of flood routing when storage is a linear function of weighted inflow and outflow. He developed modified coefficients for the Muskingum equation that do not depend on the routing interval. Carter and Godfrey [4] discussed the reservoir-storage method, where storage was considered as a function of outflow discharge. Overton [5] showed that routing coefficients vary for each flood-routing trial using the Muskingum technique. Gill [6] applied the least squares method to determine linear Muskingum equation coefficients. Weinmann and Laurenson [7] discussed the limits of application for different groups of flood-routing models. Tung [8] applied both linear and nonlinear Muskingum models as an example of pronounced nonlinearity between storage and discharge. He found the nonlinear model to be superior. Becker and Kundzewicz [9] tried to show that multi-linear modeling is a means to describe nonlinear systems with a set of linear models. Ponce [10] explained the mathematical relationship to calculate the outflow from the reservoir with known inflow, initial conditions, reservoir characteristics and operational rules. To obtain detailed solutions for discharges and stages throughout the reservoir, the principles of mass and momentum conservation were used. Fenton [11] discussed an alternative form of routing equation in terms of the reservoir surface elevation having some advantages over the usual form involving storage volume. Bacchi et al. [12] proposed a calibration method to correlate flood peaks with volume. Khan [13] also used the Muskingum inflow flood-routing model to estimate coefficients.
Calver and Lamb [14] evaluated the flood frequencies simulating river flow. Hicks [15] tested the feasibility of a hydraulic flood-routing model for the River Peace in Canada, using limited available field data. Guo and Adams [16] derived a mathematical expression to determine the relationship of storage discharge. Choudhury et al. [17] simulated the flood flow in River Narmada networks using the Muskingum method. Gou [18] attempted to route the storage outflow curve using an inflow hydrograph. Blazkov and Beven [19] estimated flood frequency for a dam site to evaluate the overall behavioral models using a cumulative distribution of flood peaks for assessing the risk of a potential flood peak. Tewolde and Smithers [20], for flood routing, utilized the Muskingum Cunge method to estimate the stages or rates of flow along ungauged river reaches. Samani and Heydari [21] described a routing flow model through successive rock-fill dams considering the storage among them and their effects on each other. Sivapragasam et al. [22] demonstrated that the storage discharge relationship adopted for the non-linear Muskingum model is not adequate for routing flood hydrographs in natural channels, which are often characterized by multiple peaks. Singh and Durgunoglu [23] developed a new method to estimate future reservoir storage capacities by allowing sediment deposition and compaction; a reservoir sediment survey was conducted for 117 reservoirs over 60 years by the Illinois State Provincial Research Service, and the regional constant K was determined.
Requena et al. [24] considered different reservoir volumes and spillway lengths to investigate the influence of the dam and reservoir characteristics on the routing results. They showed that their methodology improves the design of flood hydrograph estimation and can be applied to assess the risk of dam overtopping. Tarpanelli et al. [25] described a methodology to estimate the discharge along rivers and proposed even poorly gauged ones, taking water level measurements derived from satellite altimetry. They proposed a method to estimate the flow conditions in a section of a river using only the water level at that location and monitoring the discharges in other upstream sections. Kim and Georgakakoset [26] showed that hydrologic routing functions indeed exhibit different mathematical forms in different areas of their active boundaries. Hossain [27] discussed that flood routing is a technique used to determine the flood hydrograph at a section of a river by using the flood flow data in one or more upstream sections. The hydrologic analysis of problems such as flood forecasting, flood protection, reservoir design, and spillway design invariably includes flood routing.
Bharali [28] used the flow data of the Dibang River watershed for various years to estimate the reservoir capacity. He used the residual mass curve to determine the storage capacity of the reservoir. Gioia [29] investigated the routing effect provided by an artificial reservoir to a double-peak flood with a certain return period. He presented a dimensionless model of the reservoir balance equation, which explains possible hydrologic hydraulic processes that may occur and allows for the estimation of reservoir-routing coefficients.
Zhu and Chen [30] investigated the hydrological uncertainty of NASH model parameters using ideal data used for Yanduhe catchment precipitation in China. They demonstrated the relationship between parameters k (storage discharge parameter of reservoirs) and n (regulation and storage capacity of that basin) of the NASH model. Balistrocchi et al. [31] discussed flood control reservoirs, which are widely recognized as effective structures for mitigating flood risk in natural watersheds. Husain [32] described the methodology for designing flood estimations and routing the flood for overflow gravity structures for the Kol Dam in Himachal Pradesh and Kakkadavu Dam in Kerala.
Pandey et al. [33] determined the parameters of the Muskingum method and compared the estimated results using graphical, least-square, and regression analysis approaches. Sane et al. [34] routed floods for the upstream Manantali Dam in Africa for the period 1961–2013 using linear Muskingum parameterization. They used the least-squares method and RMSE (root-mean-square error) to estimate the parameters. Husain [32] used the Modified Puls technique to route flood discharges through the Kol Dam in Himachal Pradesh and Kakkadavu Dam in Kerala for the period 1966 to 1994. Gutenson et al. [35] varied empirical coefficients for both reservoir-routing methods as part of a sensitivity analysis. Badanapuri [36] suggested that in the design of the dam project, where the safety of downstream residents is very important, the spillway should be designed for extreme floods. Many types of spillways can be considered concerning cost, topographic conditions, dam height, foundation geology, and hydrology.
The above works of literature confirm that several studies have been conducted to route extreme floods in reservoirs using linear and non-linear techniques, especially using the Muskingum approach. Few researchers pointed out the drawbacks and limitations of using the Muskingum model. Now, we will outline the research addressing how much flood-routing work has been conducted in the Damodar Valley Corporation (DVC) area in India.
Roy et al. [37] and Jana et al. [38,39] explained the performance of the DVC reservoir system in meeting the various demands in the basin and sought to derive guide curves. Chaudhuri [40] compared the development of the Damodar River Valley in India to the development of the Tennessee River Valley in the United States. Later, Chaudhuri [41] discussed the Maithan (or Maithon) Reservoir’s life based on past reservoir sedimentation trends and downstream demands for which the reservoir was built, where increased or projected demands were not considered. He observed declining reservoir storage, including the rise of reservoir bed levels in different projected years. He also observed that the sediment is filling the reservoir much faster than the designed life. Mani and Chakravorty [42] modeled the dam-break flooding of Panchet and Maithan under extreme probable flood conditions. They computed the maximum discharge, maximum stage, maximum flow velocity, and the flood’s time of occurrence.
Bhattacharya [43] conducted a comprehensive evaluation of Damodar’s lower reaches, where the inhabitants know about their land use in terms of flood events based on their knowledge of river stages, by applying the concept of flood zoning to the river bed. Chaudhuri [44] studied the performance of the Maithan Reservoir by evaluating different reservoir storage zones and reservoir operational parameters for the Maithan and Panchet Dams. Later, Chaudhuri and Banerjee [45] discussed reservoir sedimentation based on the reservoir’s active storage capacity, outlet sill elevation, and back-water conditions for the Panchet Reservoir. Sanyal et al. [46] routed high-magnitude floods by utilizing SRTM DEM (the Shuttle Radar Topography Mission Digital Elevation Model) and available topographical maps of the lower Damodar River but highlighted the uncertainty in model outputs.
Ghosh and Mistri [47] analyzed the capability and drawbacks of the DVC flood-controlling system with the help of quantitative measures to regulate the flood flow and emerging problems of flood risk in the lower Damodar River. Mukherjee et al. [48] studied the future storage capability of the Maithan Reservoir using surveyed capacity elevation data for 1956, 1965, 1971, 1979, 1987, 1994, 2002, and 2010. They presented a graphical relation for storage loss at different stages such as dead storage, live storage, flood storage level, and overall capacity loss. Chatterjee et al. [49] estimated that the projected flow for the future period of 2014–2025, over the corresponding baseline flow, increased in January and June and decreased in July and August for all sub-basins of Damodar River.
Biswas [50] calculated the recurrence interval through flood frequency analysis in the pre-dam period from 1934 to 1957 and the post-dam period from 1958 to 2007 wherein the post-dam period annual streamflow was reduced, and also, the discharge of the Damodar River was reduced in different recurrence interval years from 5 to 50 years. He discussed that the high magnitude of flood in the extreme flow season can be reduced by flood moderation and that DVC dams can reduce the high magnitude of the flood, which leads to an increase in the frequency of low-level floods. The IMD (India Meteorological Department) [51] modeled storms and floods for each sub-catchment of the Maithan Dam using the Hydrological Modeling System HEC-HMS software and assessed the extreme probable flood value. The IMD advised collecting project-specific short-term concurrent observed discharge and rainfall data for a few flood events for the derivation of the catchment response function. They modified the design flood study using one day and two days areal extreme probable flood and adopted a storm duration of 48 h. They adopted the value of 0.2 for the Muskingum routing parameter x. Islam and Sarkar [52] studied the nature of flood frequency for the Mayurakshi River Basin using the extreme value method of Gumbel and Log-Pearson type III (LP-III), with the results showing that for Tilpara barrage, the flood magnitude was the highest during 1957–2009 with return probability of 1.85%, and it was the lowest during 1956–1977 by the Bakreshwar weir with a return probability of 4.55%.
From the above literature study, it is clear that a number of studies have been conducted to route extreme floods in the reservoir using the Muskingum method specifically (which is a channel routing method), but hardly any research has been conducted to route extreme floods using the Modified Puls technique, which is a reservoir-routing method. Also, routing the extreme floods for Panchet and Maithan Reservoirs has not been performed before. Therefore, the main objective of the present study is to observe the characteristics and effect of the extreme floods entering the reservoirs and to predict the variation in outflow discharges at different elevations and flood hydrographs at the end of three extreme floods that occurred in the years 1978, 2009, and 2014. The extreme flood data of the Maithan and Panchet Reservoirs for the years 1978 (26 September 1978 to 30 September 1978), 2009 (5 September 2009 to 11 September 2009), and 2014 (14 August 2014 to 20 August 2014) are used for this purpose.
This study was carried out in the following parts—(a) to predict the storages at various given levels during the floods from the initial storage volume of both reservoirs; (b) to estimate discharges at given elevations during the floods by the discharge equations derived for both the reservoirs; and (c) to route the floods through the reservoirs using the Modified Puls technique and to obtain the outflow discharges at various elevations during the flood.

2. Study Area

Above the mean sea level at about 609.57 m, the Damodar rises in the Palamu Hills of Chhotanagpur in Jharkhand. About 50 km below Kolkata, it joins the River Hoogly after flowing generally in a south-easterly direction for 540 km. At the upstream of the Jharkhand–West Bengal border, its principal tributary, the Barakar, joins. It abruptly changes its course below Durgapur in West Bengal and then is divided into two channels—(i) the Damodar channel, which is known as the Amta channel, and (ii) the Kanka–Mundeshwari channel. The main channel ultimately joins the Bay of Bengal after meeting the Hoogly River. The total catchment area of the river is about 22,000 km2, which includes 19,000 km2 in upland and 3000 km2 in deltaic plains. It is irregular in shape and in the lower reach somewhere elongated.
The Maithan and the Panchet Dam projects were built across the Barakar and Damodar Rivers, respectively, in the Dhanbad district of Jharkhand state in India (Figure 1). The catchment area of the Barakar River is 6392 km2 up to the dam site. The Maithan Dam site is 6293 km2, and the catchment area of the Damodar River up to the Panchet Dam site is 10,966 km2. Both the dams are of earthen and concrete types. The overall length of the Maithan Dam is 4427 m, whereas the length of the Panchet Dam is 6777 m.
The part of the Ganges River basin in the states of Jharkhand and West Bengal in India spreads over an area of 23,370.98 km2, and the Damodar River Basin (DRB) is a sub-basin. In between 22°15′ to 24°30′ N latitude and 84°30′ to 88°15′ E longitude, the geographical extremity lies. By a flat alluvial plain in the southeast and eastward towards the Bay of Bengal, the Damodar River flows over a plateau in its upper reaches. Over five districts of West Bengal, including Purulia, Bankura, Burdwan, Hooghly, and Howrah, and six districts of Jharkhand, including Palamau, Hazaribagh, Giridih, Dhanbad, and Santhal Pargana, the river basin traverses conjointly.
Over the valley, the range of annual rainfall is 1000 mm–1800 mm. The annual rainfall of the upper and the middle parts of the Damodar basin is 1209 mm and 1329 mm for the lower valley. The escarpment rainfall increases to over 1500 mm per year above the main plateau. In the basin, the mean annual rainfall is 1300 mm. During the summer monsoon, about 80% of rain precipitates. The annual inflow into the four reservoirs at Maithan, Panchet, Konar, and Tilaya was as low as 0.0019 × 10⁶ m3 in the years 1966–1967, which was the poorest on record. With a peak flow of 18,405.95 cumec (650,000 cusec), the extreme flood was recorded in the pre-dam period from 6 to 12 August 1913. In September 1978, with a peak flow of 21,900 cumec, the worst flood was recorded in the valley.

3. Database and Methodology

This study improves the prediction of changes in reservoir storage and discharge with elevation, reservoir inflow, and reservoir outflow with time and elevation, which is the attenuation and change in flood waves through the reservoir. Reservoir structures, such as dams, require more consideration of flood conditions in their routing. This study proposes a methodology for extreme flood estimation and extreme flood identification for two dams that may help in flood risk management.
The flood data of 26 September 1978–30 September 1978, 5 September 2009–11 September 2009, and 14 August 2014–20 August 2014 of the Maithan and Panchet Dams were collected on three-hourly basis from the DVC office in Maithan. The capacity, with elevation data for the years 1978 and 2009, of Maithan Dam, and for the years 1978, 2009, and 2014 of Panchet Dam, were collected from the DVC office in Maithan. Initial storage levels with respect to the given levels in the flood data of 2009 and 2014 of the Maithan and Panchet Reservoirs were collected from the DVC office in Maithan. Type of spillway, spillway crest length (gross), spillway crest elevation, maximum head on the crest, types of gates, number of piers, number of gates, type of pier, types of abutments, and maximum head on the crest were collected from the reservoir characteristics data of both Maithan and Panchet Reservoirs, DVC.
The storage levels with respect to the given levels were calculated from the initial storage levels in the given flood data of 2009 and 2014 of the Maithan and Panchet Reservoirs. The initial storage levels of 1978 with respect to the given levels for both the Maithan and Panchet Dams were considered in terms of capacity, with elevation data. The project spillway is the most important structure for a dam. The spillway releases excess or flood water in a controlled or uncontrolled manner to ensure the safety of the dam. Both the Maithan and Panchet Reservoirs have gated ogee spillways (Figure 2).
Here, H or He is the total head, including the velocity head (Hs); P is the height of the spillway crest measured from the river bed; and Hd is the required design head. Discharge over the spillway is estimated from the basic Equation (1) as per clause 4.2.1 of IS 6934-1998 [53].
Q = 2 3 2 g C L H 3 2
where H = head of the overflow, C = non-dimensional discharge coefficient, and L’ = net length of overflow crest = (2/3)(2g)0.5C = Cd as per clause 4.2.2 of IS 6934-1998 [53].
The coefficient of the discharge, Cd depends on (i) the shape of the crest, (ii) the depth of overflow in relation to the design head, (iii) the depth of approach, (iv) the extent of submergence due to tailwater, and (v) the inclination of the upstream face. The value of Cd varies between 1.8 and 2.21 in the SI unit system. The discharge Equation (1) can be written as Equation (2).
Q = C d L H 3 2
Here, the Modified Puls technique has been used for routing of extreme floods attenuated in the Maithan and Panchet Reservoirs. The continuity Equation (3) has been used as the primary equation in all hydrological routing states that the inflow I and outflow Q difference is equal to the temporal rate of change of storage [54].
I Q = d S d t
where I = reservoir inflow rate, Q = reservoir outflow rate, and S = reservoir storage. In a small time interval ∆t, in a reach, the difference between the total inflow and outflow volume is equal to the change in storage (Equation (4)).
I ¯ Δ t Q ¯ Δ t = Δ S
where Ī = average reservoir inflow in time ∆t, Ǭ = average reservoir outflow in time ∆t, and ∆S = change in reservoir storage.
Considering I ¯ = ( I 1 + I 2 ) / 2 , Q ¯ = ( Q 1 + Q 2 ) / 2 , and ΔS = S2S1, Equation (4) can be written as Equation (5).
I 1 + I 2 2 Δ t Q 1 + Q 2 2 Δ t = S 2 S 1
Subsequently, Equation (4) can be rearranged as Equation (6).
I 1 + I 2 2 Δ t + S 1 Q 1 Δ t 2 = S 2 + Q 2 Δ t 2
In Equation (6), all terms on the left-hand side are known at the beginning of a time step ∆t.
Reservoir routing using the Modified Puls technique has been carried out in the following parts:
From the storage-elevation and discharge-elevation data, (S + Qt/2) versus elevation and discharge versus elevation curves are prepared.
The storage, elevation, and discharge at the start of routing are known, and (SQt/2) is determined.
Starting from this value of (SQt/2) and from Equation (6), the term (S + Qt/2) is determined at the end of the first time step ∆t.
From the discharge versus elevation and (S + Qt/2) versus elevation curves, water-surface elevation corresponding to (S + Qt/2) and outflow discharges are determined.
Deducting Qt from (S + Qt/2) of the previous step gives (SQt/2) for the beginning of the next time step.
The procedure is repeated until the entire outflow hydrograph is routed.
The peak or extreme elevation (Hp), storage (S + Q∆t/2)p, discharge (Qp), inflow (Ip) and time (Tp) attained in the routing are determined. Based on the available data for the Maithan and Panchet Dams, elevation, storage, discharge, inflow, and time are taken as variables with respect to their extreme values to form the non-dimensional values.

4. Results and Discussion

This section includes the storage calculation, determining the discharge equations based on the reservoir characteristics of two dams, and lastly, the reservoirs’ routing using the Modified Puls technique. Characteristics of extreme floods that occurred in 1978, 2009, and 2014 for Maithan and Panchet Reservoirs are comparatively observed between all such parameters.

4.1. Storage Calculation

For the extreme flood of Maithan during 5–11 September 2009, the storage volume after six hours of extreme flood (S6) is found to be 435 × 106 m3 using Δt equal to three hours, as obtained from flood data for Maithan. Using Equation (7), the calculated storage volume after nine hours (S9) is found to be 436.14 × 10⁶ m3, where I9 and O9 denote reservoir inflow and outflow at the ninth hour, respectively.
S 9 = S 6 + ( I 9 O 9 ) Δ t
For both the Maithan and Panchet Reservoirs, the same calculation was repeated with the different storage times until the 2009 and 2014 floods ended. For both the reservoirs, the initial storage volumes (S) at the beginning of the 1978 flood were not obtained from the flood data. However, for the years 1978, 2009, and 2014, the capacity change with elevation data are obtained for both the Maithan Reservoir and Panchet Reservoir. For both reservoirs, the initial storages at the beginning of the 1978 flood are calculated from the given data by applying the extrapolation method.

4.2. Determine Discharge Equations Based on Reservoir Characteristics

The coefficient of the discharge (Cd) depends upon the height of the ogee weir (P) to the design head over the weir (Hd). In general, the design head (Hd) is kept as 80 to 90 percent of the maximum head, as per clause 4.4 of IS 6934-1998 [53]. Here, we have chosen it as 85, which is the average of 80 and 90. If the height of the weir is more than 1.33 times the design head, the approach velocity has been found to have a negligible effect upon discharge, and as such, Hd becomes equal to He, or He/Hd = 0.10. In such a case, the Cd is taken as 2.2 in S.I units [36]. As the value of Cd generally varies from 1.80 to 2.21 for S.I. units, as per clause 4.2.2 of IS 6934-1998 [53], and since the inclination of the upstream face is vertical in the reservoir characteristic data, the maximum value of the Cd is taken as 2.21 from the graph of Cd versus P/Hd, as shown in the figure for the Cd varying with the Hd, as per clause 4.2.4 of IS 6934-1998 [53]. Here, the height of the spillway crest is measured from the river bed (P), which is equal to the spillway crest level (Figure 2).
Maithan Dam has 12 numbers of bays, each having a 12.19 m (40 ft) width. The net crest length L’ is 146.30 m. Spillways are of a concrete gravity ogee type. Spillway crest length (gross) and elevation are 188.37 m (618 ft) and 140.21 m (460 ft), respectively. A total of 12 radial gates and 11 pointed nose piers are located across this dam. Square abutments at 90° to the direction of flow are found. From the reservoir characteristics data of Maithan Dam, the maximum head on the crest (Hmax) is found 12.19 m. Therefore, Hd is taken 85% of Hmax, which is equal to 0.85 × 12.19 = 10.36 m. Hence, P/Hd is 140.21/10.36 = 13.53, which is much higher than 1.33. From discharge Equation (2), we determine Q = 323.33 × H3/2 for the Maithan Reservoir.
Similarly, Panchet Dam has 15 numbers of bays, each having a width of 12.19 m. Net crest length = L′ = 182.88 m. Here also, the type of spillway is concrete gravity ogee. The spillway crest length (gross) is 233.23 m (765 ft) and the spillway crest elevation is 123.40 m (405 ft). The maximum water level (MWL) is 135.63 m (445 ft). The maximum head on the crest is 12.19 m. It has 15 radial gates and 14 pointed nose piers. Abutments are of a square shape and positioned at 90⁰ to the flow direction. From the reservoir characteristics data of Panchet Dam, the maximum head on the crest (Hmax) is identified as equal to 12.19 m. Therefore, Hd = 85% of Hmax = 0.85 × 12.19 = 10.3615 m (as per clause 4.4 of IS 6934-1998 [53]). Hence, P/Hd = 123.40/10.36 = 11.0947 > 1.33. From the discharge Equation (2), the outflow equation for the Panchet Reservoir can be written as Q = 404.16 × H3/2.

4.3. Reservoir Routing by Modified Puls Technique

At the start of extreme flood routing, the initial storage and outflow discharges are known. All the terms on the left-hand side in Equation (5) are the initialization of the ∆t time step. Here, ∆t is selected as 3 h (≈0.01 × 10⁶ s) because the data availability is found at least 3-hour intervals. Here, S represents reservoir storage and Q represents outflow from the reservoirs. From the available data, a table presenting elevation, discharge, and (S + Qt/2) is prepared. Graphs of Q versus elevation and (S + Qt/2) versus elevation are prepared simultaneously.
During the 1978 extreme flood, an elevation of 146.014 m is found at the start of the routing of the extreme flood in Maithan. From the derived discharge equation of Maithan Dam, Q = 4521.56 m3/s and (SQt/2) = 467.11 × 10⁶ m³ are obtained. Now, starting from this value of (SQt/2), Equation (6) is used to obtain (S + Qt/2) at the end of the first time step of three hours as 468.57 × 10⁶ m³. From the elevation versus (S + Qt/2) curve, water-surface elevation corresponding to (S + Qt/2) = 468.57 × 10⁶ m³ is estimated as 145.50 m, and the corresponding outflow discharge Q is estimated as 3556.87 m³/s. In the next step, the initial value of (SQt/2) can be expressed as (S + Qt/2) + Qt, which becomes equal to 430.16 m³/s.
This process is repeated in a tabular form for the total duration of the extreme flood. In columns, by using the data such as time (h), elevation (m), and discharge Q (m³/s) from the outflow discharge table, the outflow hydrograph and the variation in reservoir elevation versus time are prepared. In such a manner, the extreme floods that occurred in 1978, 2009, and 2014 in Maithan and Panchet Reservoirs were routed.
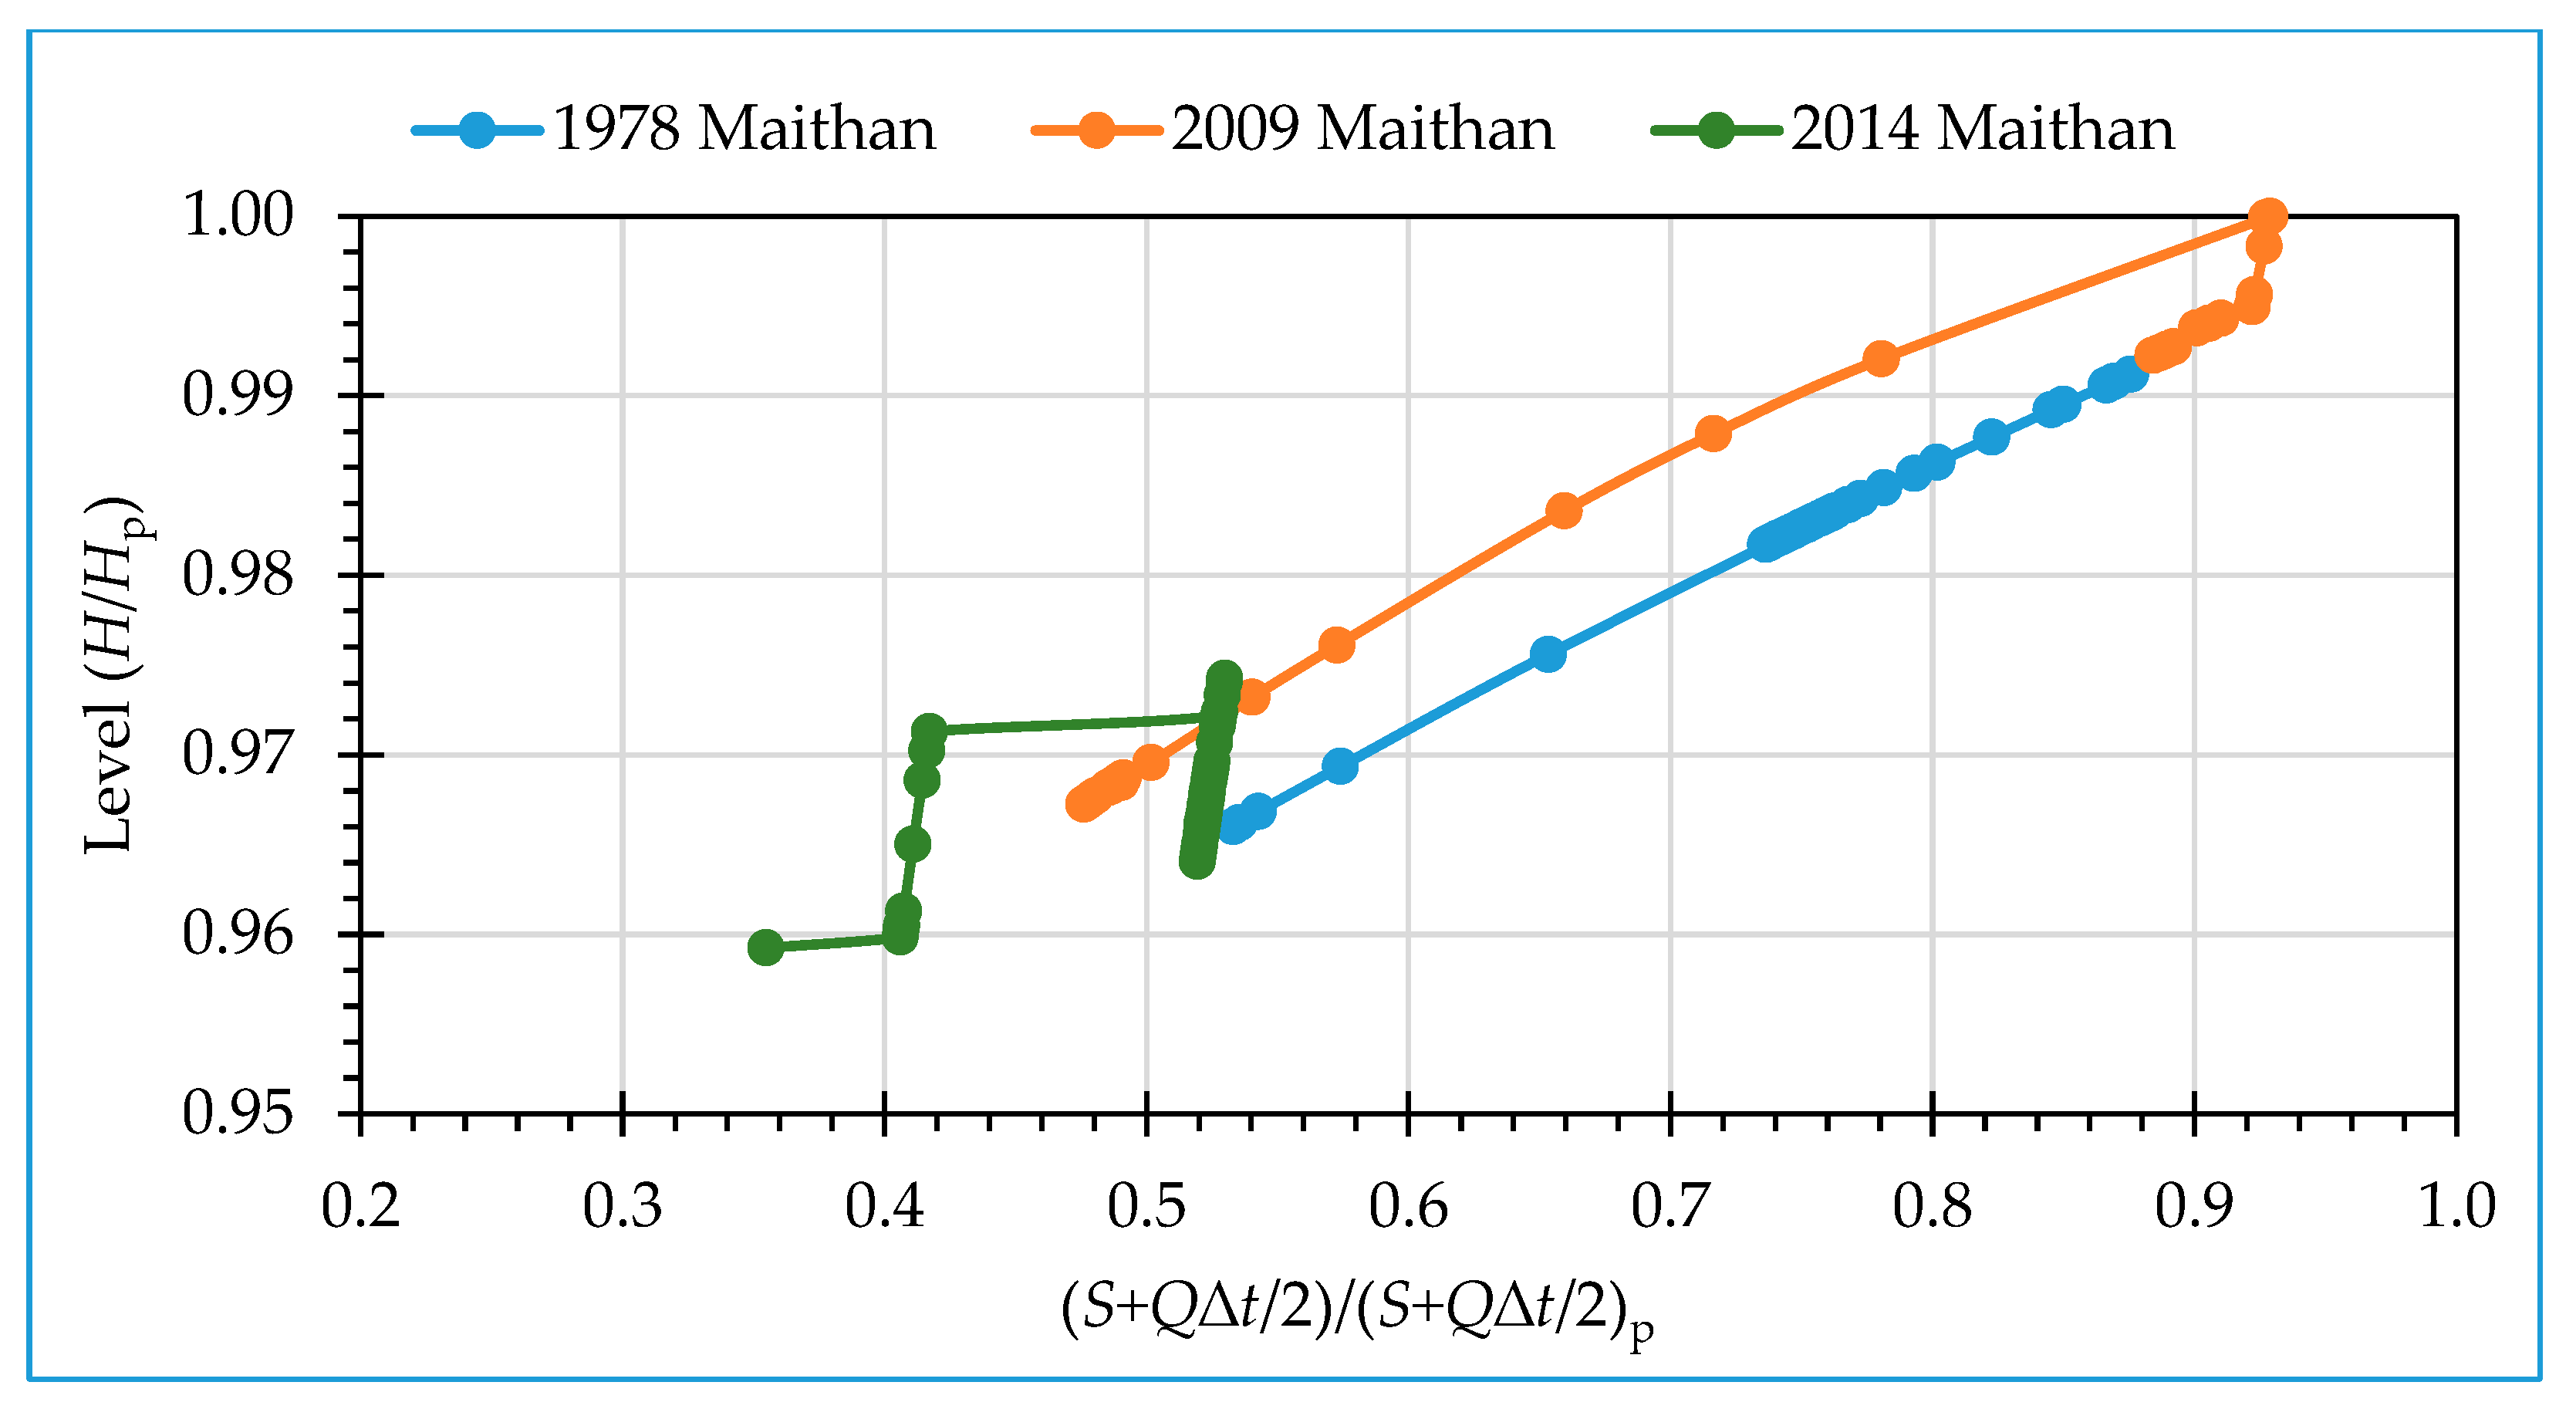
For Maithan, during the 1978 flood, the storage versus elevation curve is steep because the reservoir storage is found to be increasing gradually with the increase in reservoir elevation (Figure 3). During the extreme flood of 2009 in Maithan, the storage versus elevation curve becomes steeper at the beginning with the corresponding increase in reservoir storage, with a corresponding increase in reservoir elevation. However, it eventually decreases at the end due to the decrease in reservoir elevation corresponding to the reservoir storage. During the 2014 extreme flood, the reservoir storage first increased slightly with a slight increase in elevation. Then, it increases gradually with the gradual increase in elevation and becomes nearly flat at certain elevations.
It slightly increases again at higher elevations and ultimately decreases at the end as the storage decreases, with a corresponding decrease in elevations. Storage reaches the highest value corresponding to the highest elevation during the 2009 extreme flood, in comparison with the 1978 and 2014 extreme floods in the Maithan Reservoir.
For Panchet Reservoir, during the 1978 extreme flood, the storage versus elevation curve is found to be steeper because reservoir storage gradually increases with the increase in reservoir elevation (Figure 4). Also, during the 2009 extreme flood, the storage versus elevation curve becomes steep due to the increase in reservoir storage with a corresponding increase in reservoir elevation. During the 2014 extreme flood, the reservoir storage increases in the beginning with the increase in elevation. Then, it becomes flat at certain elevations and again slightly increases at higher elevations. It decreases as the storage decreases with the corresponding decrease in elevations. Again, it becomes flat and ultimately decreases with the corresponding reservoir elevation. Storage reaches the peak value (S + Qt/2)p during the 1978 extreme flood that occurred in Panchet Reservoir.
For the Maithan Reservoir, during the 1978 extreme flood, the discharge versus elevation curve is found to be steep because discharge increases gradually with the increase in reservoir elevation (Figure 5). Correspondingly, during the 2009 flood, the discharge versus elevation curve becomes steeper as the discharge increases with a corresponding increase in reservoir elevation. In the 2014 extreme flood, the discharge increases gradually with the increase in elevation. Peak discharge (Qp) reaches the highest elevation (Hp) during the 2009 extreme flood in the Maithan Reservoir.
For Panchet Reservoir, during the 1978 extreme flood, the discharge versus elevation curve is observed as steeper because with the increase in reservoir elevation, discharge increases gradually. Also, during the 2009 extreme flood, the discharge versus elevation curve becomes steep as the discharge increases, with a corresponding increase in reservoir elevation. In 2014 extreme flood, discharge gradually increases with the increase in elevation. Higher discharge is observed at the corresponding elevation during the 1978 extreme flood, as compared to the 2009 and 2014 extreme floods in Panchet Reservoir. Non-dimensional plots for all three years collapse nearly into the same curve (Figure 6), confirming a similar pattern of flood increase.
For the Maithan Reservoir, during the 1978 extreme flood at the beginning, the elevation is found to decrease with increasing time. Again, it increases with time, attaining its higher value, and then decreases with time at the end (Figure 7). During the 2009 extreme flood, the elevation also decreases at the beginning with time then again increases over time and decreases at the end. During the 2014 extreme flood, elevation abruptly decreases with time.
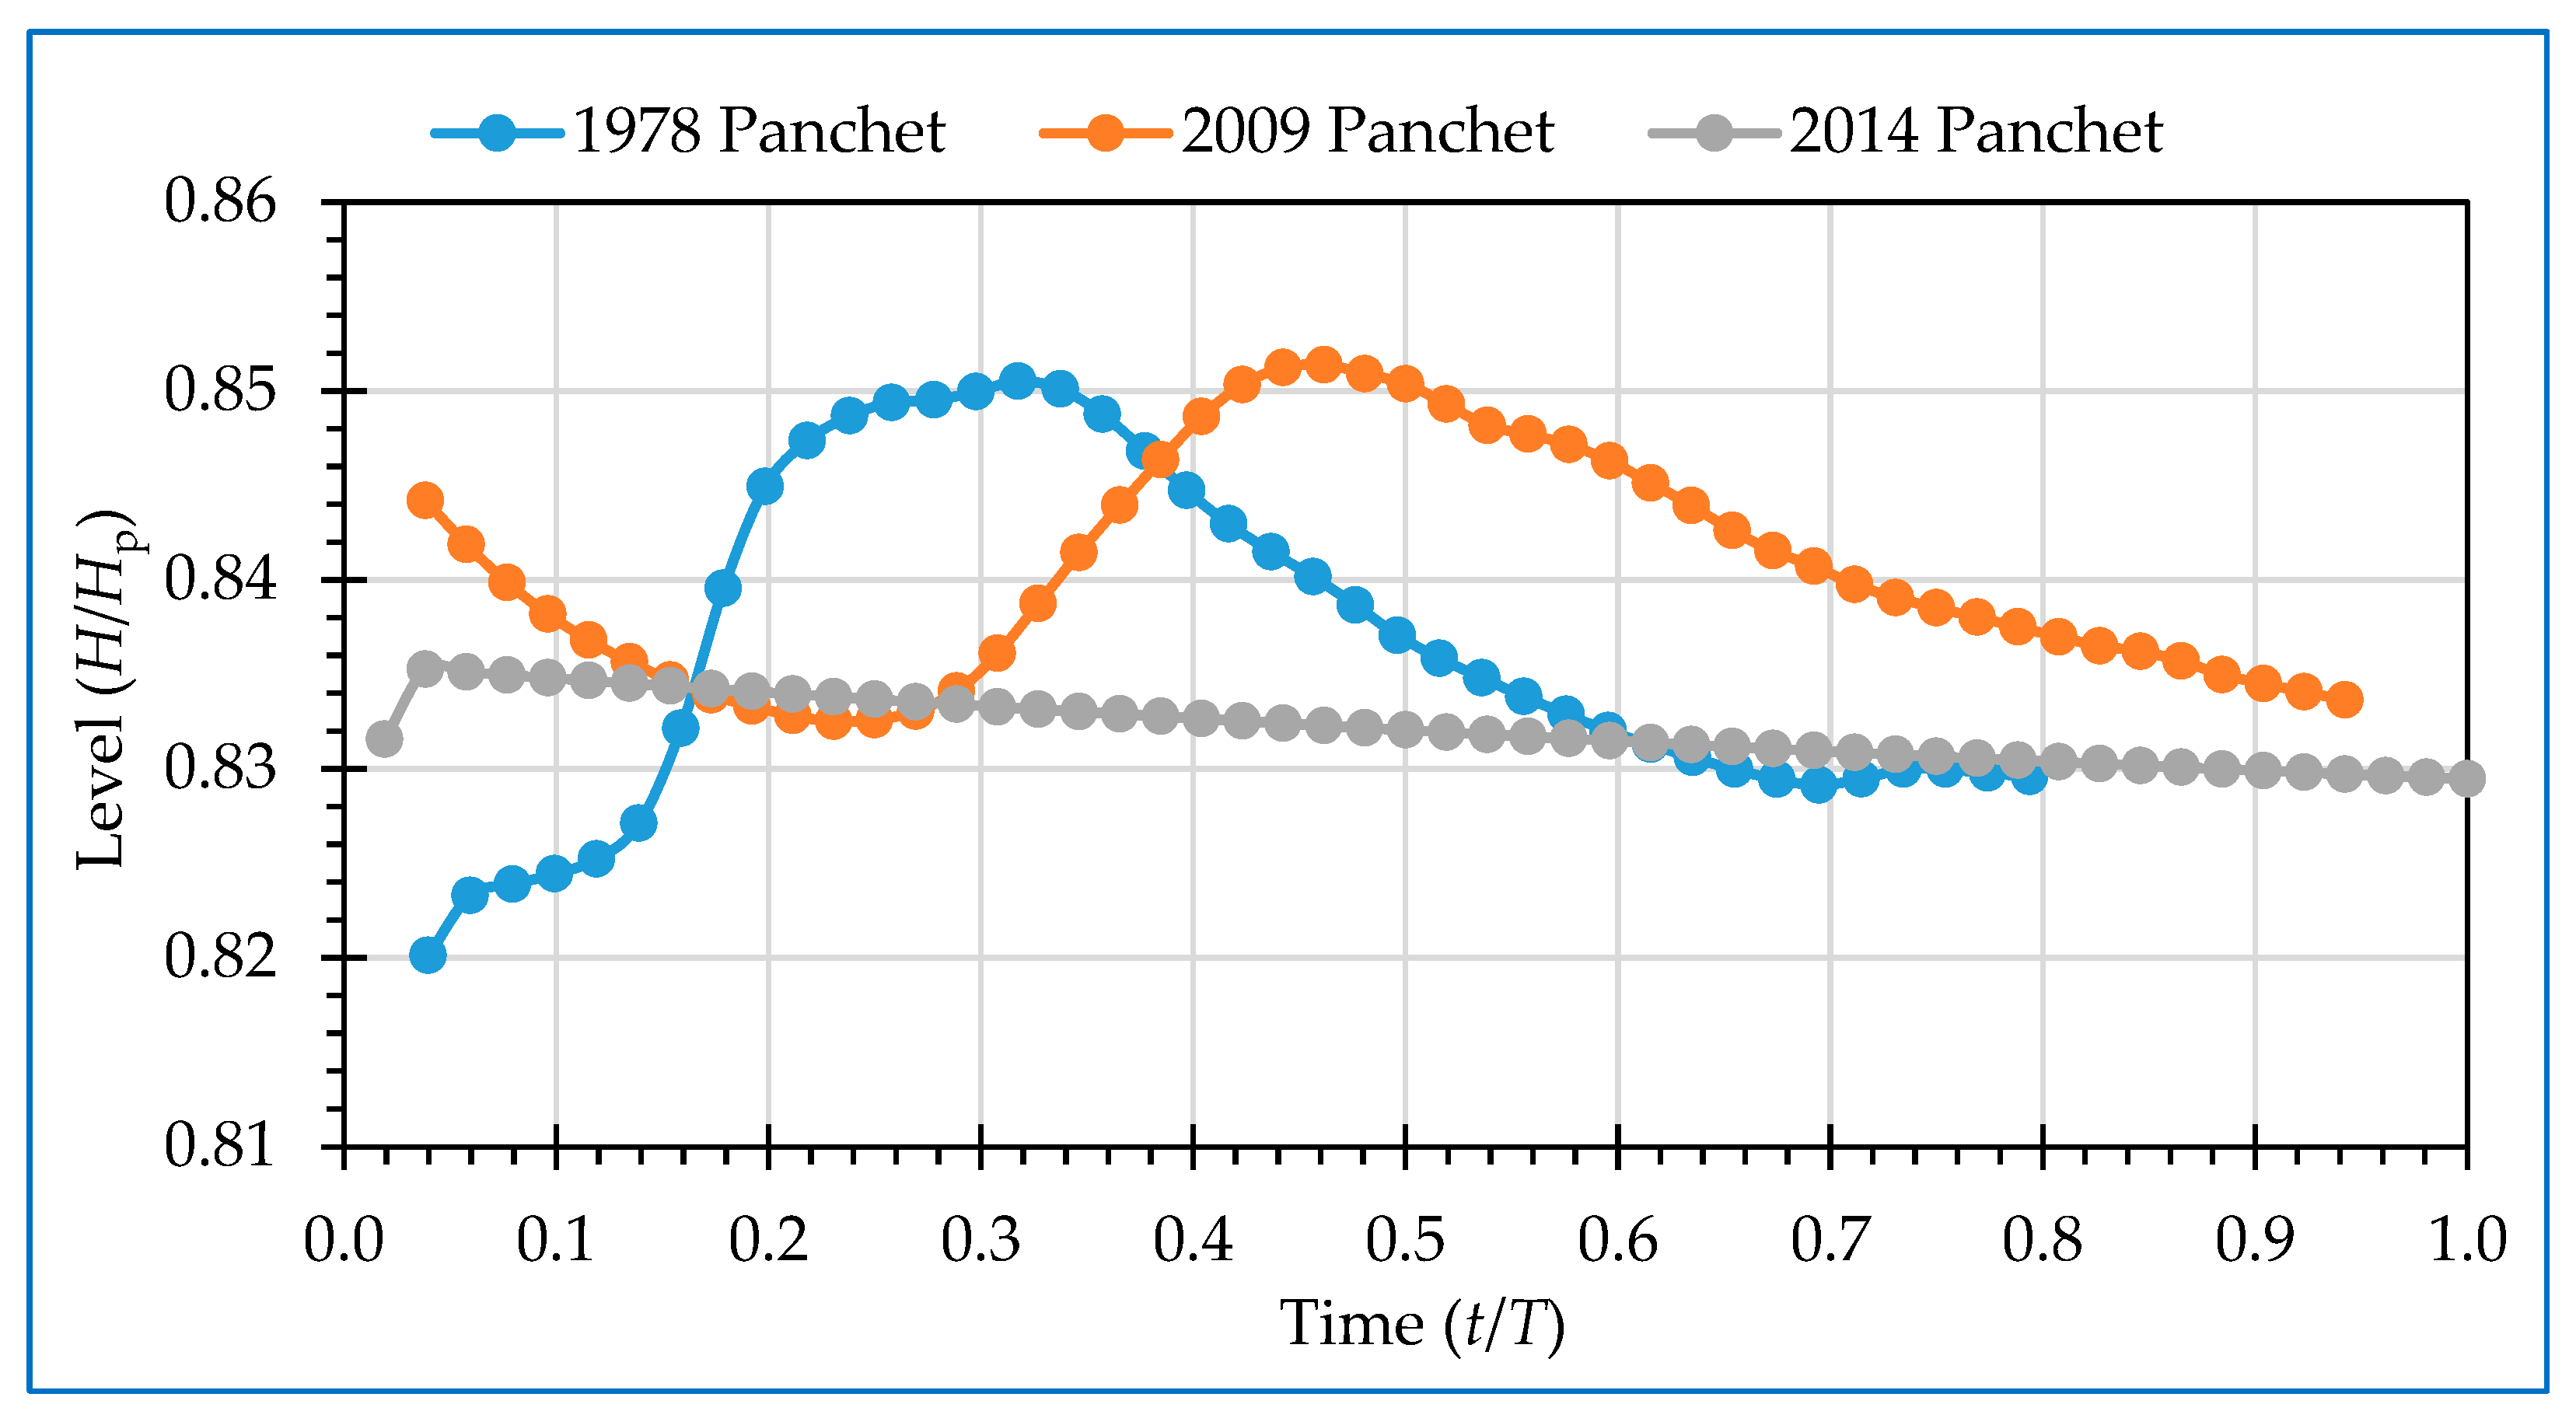
During the 1978 extreme flood in Panchet Reservoir, elevation increases with time at the beginning. It reaches its high value and then decreases with time at the end (Figure 8). During the 2009 extreme flood, elevation decreases with time at the beginning. Again, it increases with time and reaches a higher value. Finally, it decreases at the end. At the beginning of the 2014 extreme flood, elevation slightly increases with time and then decreases with a flat slope, since elevations do not change much with respect to the variation in time.
For the Maithan Reservoir during the 1978 extreme flood, outflow decreases at the beginning with increasing time. It increases again with time, attaining its high value, and finally decreases with time at the end (Figure 9). During the 2009 extreme flood, outflow also decreases with time in the beginning. The outflow increases again with time, reaching a higher value, and then decreases at the end of the flood. During the 2014 extreme flood, outflow slightly increases with increasing time at the beginning and then abruptly decreases with increasing time.
During the 1978 extreme flood in the Maithan Reservoir, at the beginning, the inflow curve is found slightly flat as the values of inflow do not change much with respect to time. Then, this curve becomes steep as the inflow gradually increases with the increase in time. Finally, it reaches its high value (Figure 10). Again, it decreases abruptly with time and becomes almost flat at the end. During the 2009 extreme flood, the inflow curve is found to be flat at the beginning; then, it becomes steep as inflow increases with time. It again starts decreasing for a short period of time. Then, it becomes steep as the inflow increases and falls as it decreases with time. Finally, it reaches the peak inflow (Ip). In the end, it decreases with respect to time. During the 2014 extreme flood, the inflow curve is found to be flat with respect to time as the inflow does not change with the variation in time.
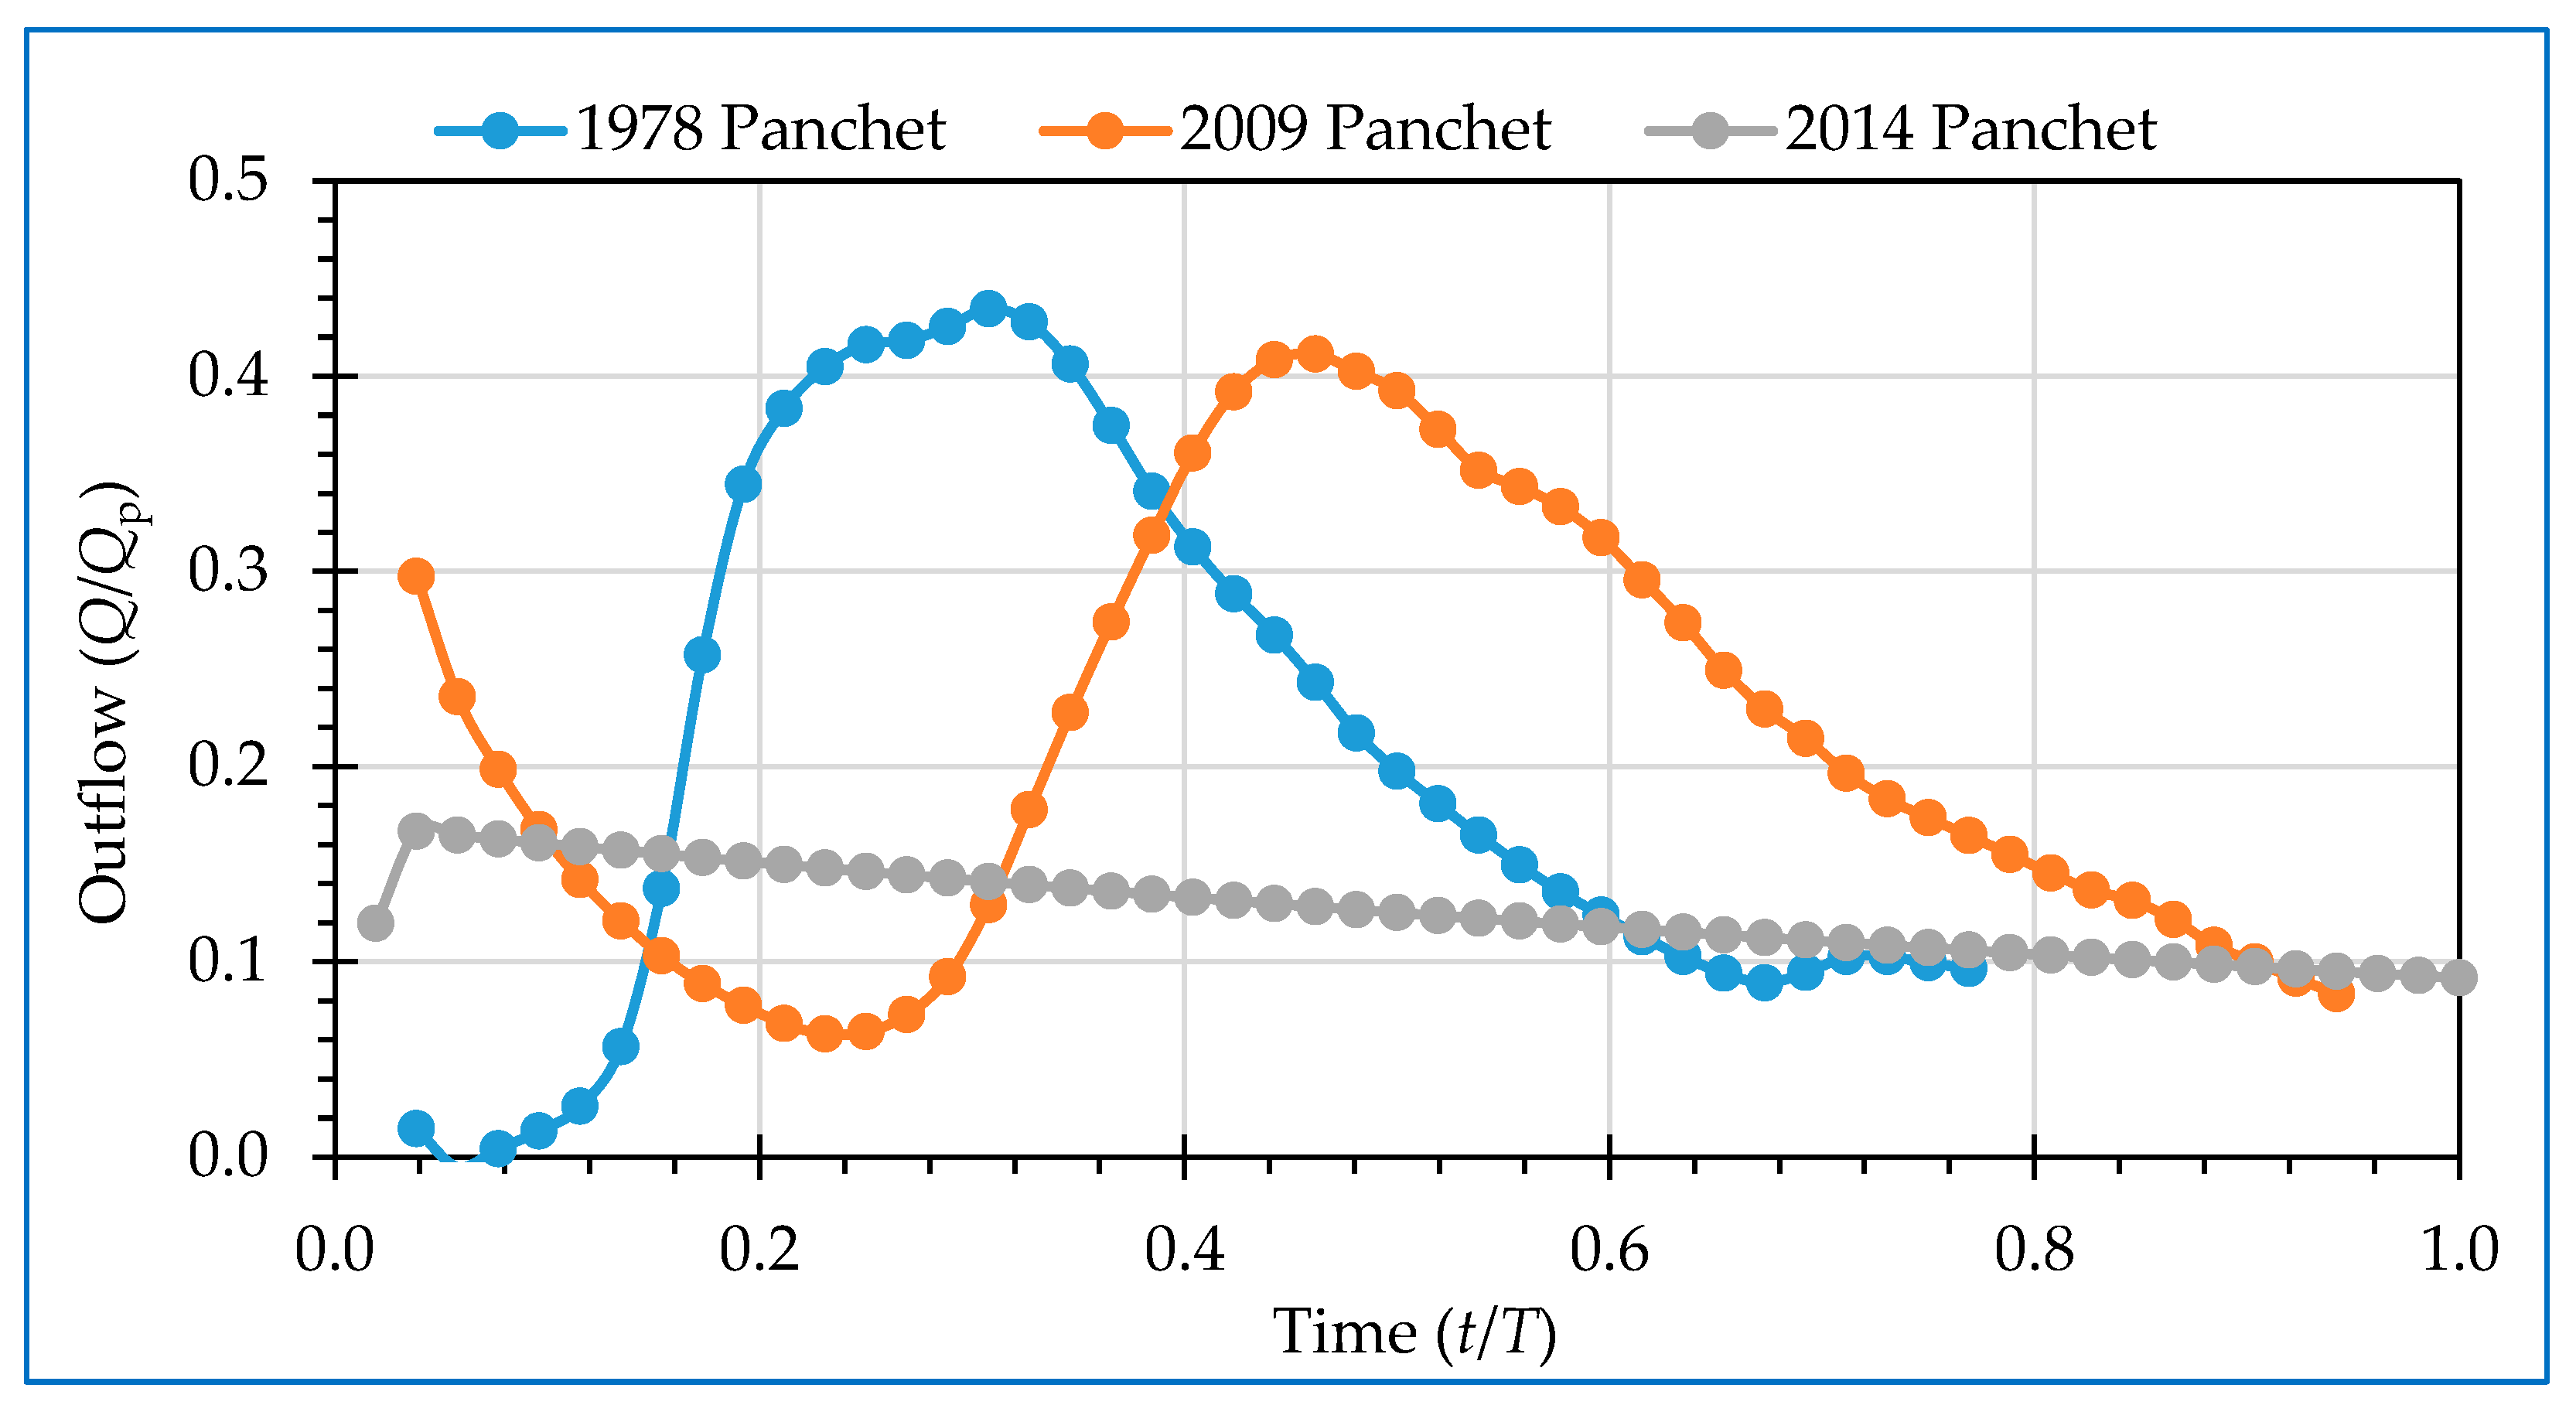
For Panchet Reservoir during the 1978 extreme flood, outflow slightly decreases at the beginning with time. Again, it gradually increases with time. After reaching its higher value, it finally decreases with time at the end (Figure 11). During the 2009 extreme flood, outflow also decreases with time at the beginning. After that, the outflow increases with time reaching a high value and finally decreasing at the end. During the 2014 extreme flood, outflow slightly increases with increasing time at the beginning and then decreases with increasing time.
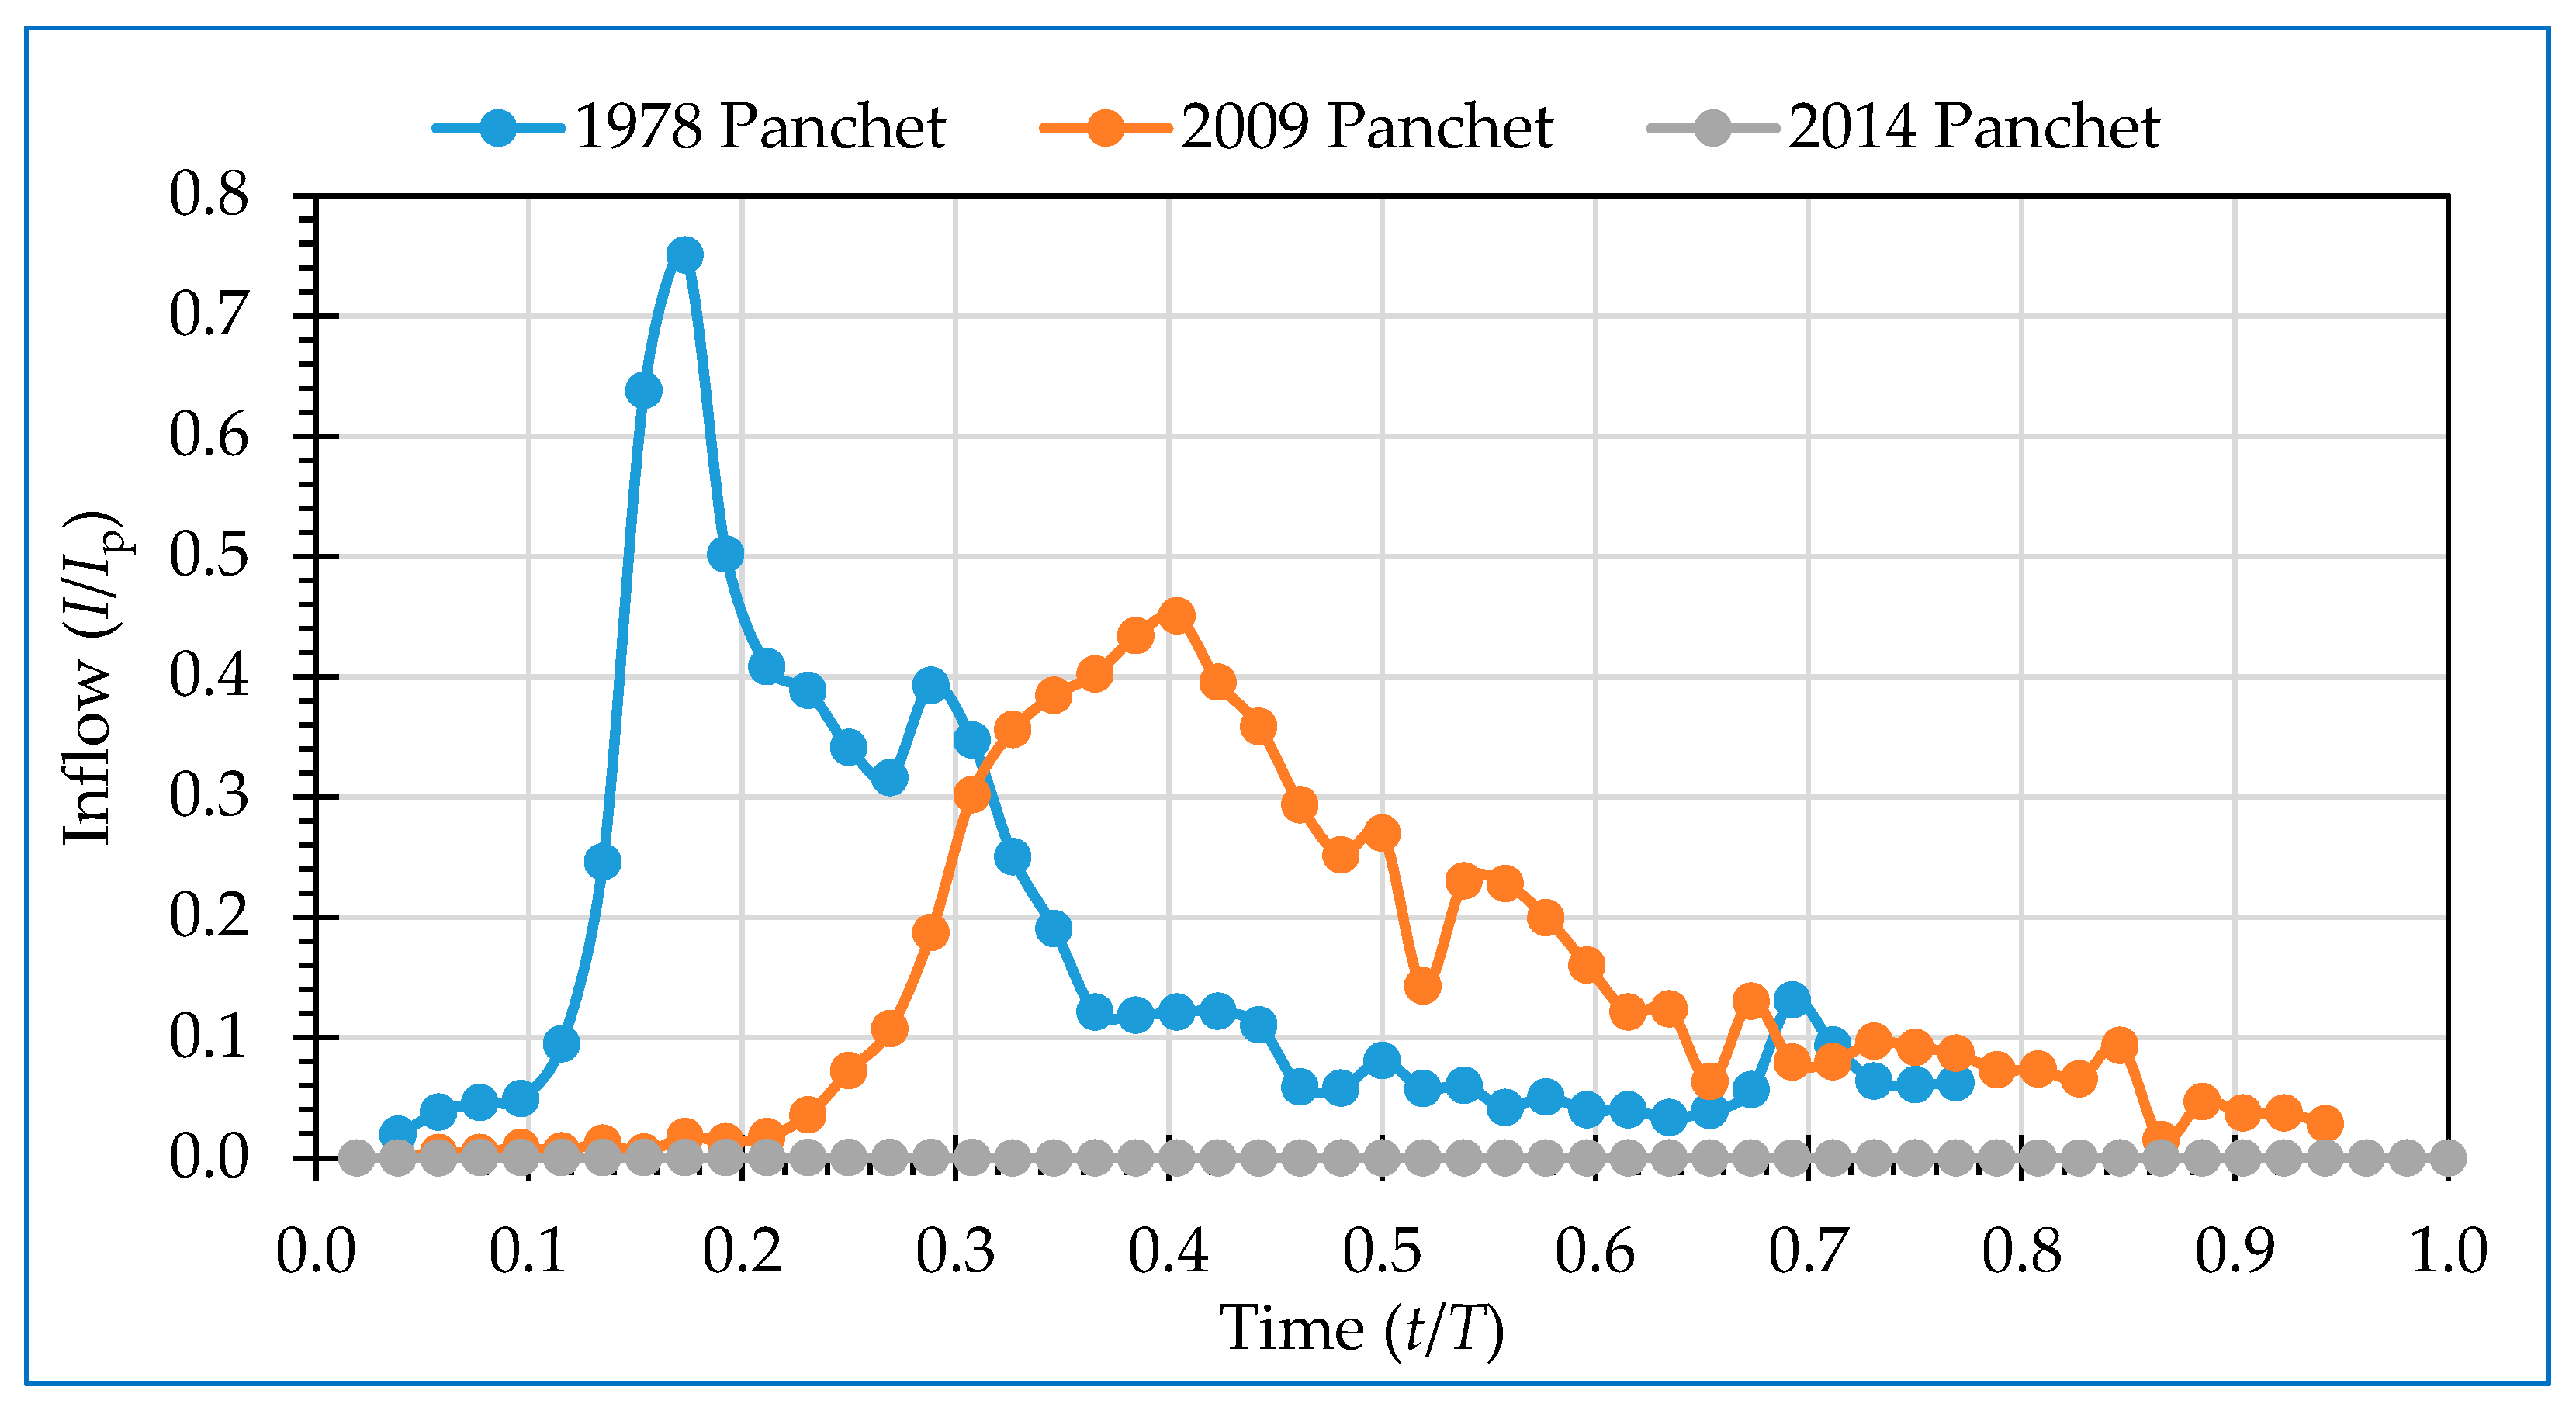
In the Panchet Reservoir, during the 1978 extreme flood, inflow increases with time at the beginning; then, the curve becomes steep as the inflow gradually increases with the increase in time. The inflow then reaches its higher value (Figure 12). Ultimately, it decreases with time at the end. During the 2009 extreme flood, the inflow curve is observed to be flat at the beginning; then, the inflow starts increasing in time increments. The inflow then reaches a high value, and again, it decreases at the end. During the 2014 extreme flood, the inflow curve is found to be flat with respect to time, like in the case of the 2009 curve, as the inflow was not found to change with the increase in time.
It can be noted that the reservoir sediments change the reservoir bed annually during each monsoon season, and there is a gap of 36 years between historical high flood events. Because of these sediments, the amount of water in the reservoir can vary significantly during this period and into the future. Therefore, the height of sediment deposited in Maithan Reservoir needs to be estimated for the years 2009 and 2014 based on the elevation and declined capacity curves given in [41,55]. However, there is no such curve in the literature for Panchet Reservoir. The revised universal soil-loss equation and satellite remote sensing can be used to empirically estimate the height of such sediments. However, this will be an average or approximate value. In the actual situation, during the extreme floods of 1978, 2009, and 2014, the height of the deposited sediment may be considerably different from the graphic or empirical estimates above. Therefore, a more detailed study and analysis re needed for extreme floods, taking into account the annual changes of the reservoir bed.
Current research only focuses on changes in reservoir levels, incoming flow, storage capacity, and discharge during extreme floods in 1978, 2009, and 2014. Reservoir discharge can vary due to human or automatic control by means of valves or spillway gates. Outflows from both the Maithan and Panchet Reservoirs are controlled by the ogee spillway with radial gates. In the case of reservoir routing, storage is a unique function of outflow discharge, but when the channel is routed, the storage becomes a function of both outflow and inflow discharges. When inflow and outflow discharges are available, work may be extended to route channels.
After routing, the estimated outflow is found to be 7.02% more than the actual outflow at the end of the 120 h flood in Maithan Reservoir in 1978. In the case of 146 h of flood in 2009, the estimated outflow is estimated to be 22.26% more than the actual outflow. However, in the 2014 extreme flood with a 154 h duration, the estimated outflow is found to be 59.78% more than the actual outflow. Simultaneously, after routing the three extreme floods into the Panchet Reservoir, actual and estimated outflows are compared. For the 120 h flood in 1978 in Panchet, the estimated outflow is found to be 0.53% less than the actual outflow. However, during the 2009 flood that occurred for 147 h, the estimated outflow is estimated to be 31.63% more than the actual outflow. However, for the 156 h of flooding in 2014 in Panchet, the estimated outflow is found to be 55.97% more than the actual outflow. These percentages show how alarming the rate of increase in extreme floods is. Reservoir flow prediction is very important for extreme flood control. In areas with poor rainfall records, lateral flow, which is difficult to predict during extreme floods, has a significant effect on water flow. This could be a possible reason for the significant difference between the calculated and actual flow rates. Therefore, if all the data required for the estimation of extreme floods are available, the estimated extreme outflow can be closer to the actual extreme outflow. The estimated extreme outflow variation within 20% of the actual extreme outflow is acceptable.

5. Conclusions

With the help of the Modified Puls reservoir-routing technique, here, the peak discharges and flood hydrograph patterns for three different extreme flood conditions are determined, which can help in flood forecasting. The location and the sizing capacity of the reservoirs can also be estimated using the reservoir-routing method. By knowing the volume-elevation characteristics of the reservoir, the variations in reservoir elevations and outflow discharges over time can be predicted. Using the outflow-elevation relationship for the spillways and also observing how the other outlet structures of the reservoir affect the flood wave entering the reservoir, this can be predicted. This is all demonstrated in this paper. Therefore, the flood hydrographs at the end of three extreme flood events in 1978, 2009, and 2014, which occurred at Maithan and Panchet Dams, are predicted. Non-dimensional variations of different parameters with respect to their extreme values are analyzed to show the nature of the flood wave for these three different flood events. Using this approach, the extreme floods of 1978 are predicted with an error of less than 10%. At the same time, it was found that the extreme flood prediction for 2009 and 2014 deviated from the actual extreme floods by more than 20%. These flood wave observations for different flood events are necessary for the estimation of future water levels and inflow in the reservoirs or flood forecasting. This involves making predictions for future extreme floods and enabling us to prepare for an extreme flood event.

Author Contributions

Data curation, computation, formal analysis, M.D.; conceptualization, methodology, writing—original draft, M.D. and S.D.; supervision, resources, review and editing, S.D. All authors have read and agreed to the published version of the manuscript.

Funding

This research received no external funding.

Data Availability Statement

Data of this study are available from the corresponding author upon reasonable request. The data are not publicly available due to the data purchasing policy.

Acknowledgments

We express our sincere thanks to Samir Kumar Maji, Former Deputy Chief Engineer (Civil), DVC, for providing some data required for this case study, and Debasri Roy, Former Associate Professor and Joint-Director, School of Water Resources Engineering, Jadavpur University, for her suggestions.

Conflicts of Interest

Authors declare no conflicts of interest.

References

  1. Clark, C.O. Storage and The Unit Hydrograph. Am. Soc. Civ. Eng. Trans. 1943, 110, 1419–1446. [Google Scholar] [CrossRef]
  2. Chow, V.T. A Practical Procedure of Flood Routing. In Civil Engineering Studies. Hydraulic Engineering Series No. 1, Civil Engineering and Public Works Review; CORE: London, UK, 1951; Volume 46. [Google Scholar]
  3. Nash, J.E. A note on the Muskingum flood-routing method. J. Geophys. Res. 1959, 64, 1053–1056. [Google Scholar] [CrossRef]
  4. Carter, R.W.; Godfrey, R.G. Storage and Flood Routing. In Manual of Hydrology: Part 3. Flood-Flow Techniques; Geological Survey Water-Supply: Washington, DC, USA, 1960; p. 1543-B. [Google Scholar] [CrossRef]
  5. Overton, D.E. Muskingum flood routing of upland streamflow. J. Hydrol. 1966, 4, 185–200. [Google Scholar] [CrossRef]
  6. Gill, M.A. Flood routing by the Muskingum method. J. Hydrol. 1978, 36, 353–363. [Google Scholar] [CrossRef]
  7. Weinmann, P.E.; Laurenson, E.M. Approximate Flood Routing Methods: A Review. J. Hydraul. Div. 1979, 105, 1521–1536. [Google Scholar] [CrossRef]
  8. Tung, Y.K. River Flood Routing by Nonlinear Muskingum Method. J. Hydraul. Eng. 1985, 111, 1460–1477. [Google Scholar] [CrossRef]
  9. Becker, A.; Kundzewicz, Z.W. Nonlinear flood routing with multilinear models. Water Resour. Res. 1987, 23, 1043–1048. [Google Scholar] [CrossRef]
  10. Ponce, V.M. Chapter of Reservoir Routing. In Engineering Hydrology; Prentice Hall: Englewood Cliffs, NJ, USA, 1989; pp. 252–260. [Google Scholar]
  11. Fenton, J.D. Reservoir routing. Hydrol. Sci. J. 1992, 37, 233–246. [Google Scholar] [CrossRef]
  12. Bacchi, B.; Brath, A.; Nath, K.T. Analysis of the relationships between flood peaks and flood volumes based on crossing properties of river flow processes. Water Resour. Res. 1992, 28, 2773–2782. [Google Scholar] [CrossRef]
  13. Khan, H.M. Muskingum flood routing model for multiple tributaries. Water Resour. Res. 1993, 29, 1057–1062. [Google Scholar] [CrossRef]
  14. Calver, A.; Lamb, R. Flood frequency estimation using continuous rainfall-runoff modelling. Phys. Chem. Earth 1995, 20, 479–483. [Google Scholar] [CrossRef]
  15. Hicks, F.E. Hydraulic flood routing with minimal channel data: Peace River, Canada. Can. J. Civil Eng. 1996, 23, 524–535. [Google Scholar] [CrossRef]
  16. Guo, Y.; Adams, B.J. An analytical probabilistic approach to sizing flood control detention facilities. Water Resour. Res. 1999, 35, 2457–2468. [Google Scholar] [CrossRef]
  17. Choudhury, P.; Shrivastava, R.K.; Narulkar, S.M. Flood Routing in River Networks Using Equivalent Muskingum Inflow. J. Hydrol. Eng. 2002, 7, 413–419. [Google Scholar] [CrossRef]
  18. Gou, J.C.Y. Hydrology-Based Approach to Storm Water Detention Basin Design Using New Routing Schemes. J. Hydrol. Eng. 2004, 9, 333–336. [Google Scholar] [CrossRef]
  19. Blazkov, S.D.; Beven, K. Flood frequency estimation by continuous simulation of subcatchment rainfalls and discharges with the aim of improving dam safety in a large basin in the Czech Republic. J. Hydrol. 2004, 292, 153–172. [Google Scholar] [CrossRef]
  20. Tewolde, M.H.; Smithers, J.C. Flood routing in ungauged catchments using Muskingum methods. Water SA 2006, 32, 379–388. [Google Scholar] [CrossRef]
  21. Samani, J.M.V.; Heydari, M. Reservoir Routing through Successive Rockfill Detention Dams. J. Agric. Sci. Technol. 2007, 9, 317–326. [Google Scholar]
  22. Sivapragasam, C.; Maheswaran, R.; Venkatesh, V. Genetic programming approach for flood routing in natural channels. Hydrol. Process. 2007, 22, 623–628. [Google Scholar] [CrossRef]
  23. Singh, K.P.; Durgunoglu, A. A new method for estimating future reservoir storage capacity. J. Am. Water Resour. Assoc. 2007, 25, 263–274. [Google Scholar] [CrossRef]
  24. Requena, A.I.; Mediero, L.; Garrot, L. A bivariate return period based on copulas for hydrologic dam design: Accounting for reservoir routing in risk estimation. Hydrol. Earth Syst. Sci. 2013, 17, 3023–3038. [Google Scholar] [CrossRef]
  25. Tarpanelli, A.; Barbetta, S.; Brocca, L.; Moramarco, T. River Discharge Estimation by Using Altimetry Data and Simplified Flood Routing Modeling. Remote Sens. 2013, 5, 4145–4162. [Google Scholar] [CrossRef]
  26. Kim, D.H.; Georgakakoset, A.P. Hydrologic routing using nonlinear cascaded reservoirs. Water Resour. Res. 2014, 50, 7000–7019. [Google Scholar] [CrossRef]
  27. Hossain, M.M. Analysis of Flood Routing. Dhaka Univ. J. Sci. 2015, 62, 69–73. [Google Scholar] [CrossRef]
  28. Bharali, B. Estimation of Reservoir Storage Capacity by using Residual Mass Curve. J. Civil Eng. Environ. Technol. 2015, 2, 15–18. [Google Scholar]
  29. Gioia, A. Reservoir Routing on Double-Peak Design Flood. Water 2016, 8, 553. [Google Scholar] [CrossRef]
  30. Zhu, Z.; Chen, X. Evaluating the Effects of Low Impact Development Practices on Urban Flooding under Different Rainfall Intensities. Water 2017, 9, 548. [Google Scholar] [CrossRef]
  31. Balistrocchi, M.; Roberto, R.; Stefano, O.; Baldassare, B. Flood Routing Efficiency Assessment: An Approach Using Bivariate Copulas. In Proceedings of the 13th International Conference on Hydroinformatics (HIC 2018), Palermo, Italy, 1–6 July 2018; Volume 3, pp. 1–8. [Google Scholar] [CrossRef]
  32. Husain, A. Flood Routing in Reservoir using Modified Puls Method. Int. J. Sci. Res. 2018, 7, 1187–1194. [Google Scholar]
  33. Pandey, R.; Kumar, V.; Pandey, R.D. Analysis of Flood Routing in Channels. Int. J. Eng. Dev. Res. 2018, 6, 11–18. [Google Scholar]
  34. Sane, M.L.; Sombou, S.; Leye, I.; Ndione, D.M.; Kane, S.; Tamba, S.; Diatta, M. A New Approach of the Estimation of the Parameters of the Linear Muskingum Model for River Flow Simulation. Moussé Land. Sane J. Eng. Res. Appl. 2018, 8, 20–27. [Google Scholar]
  35. Gutenson, J.L.; Tavakoly, A.A.; Wahl, M.D.; Follum, M.L. Comparison of Generalized Non-Data-Driven Reservoir Routing Models for Global-Scale Hydrologic Modeling. Hydrol. Earth Syst. Sci. 2019, 24, 2711–2729. [Google Scholar] [CrossRef]
  36. Badanapuri, V.R. Design Principles that are involved in the Design of Flow over an Ogee Crest Spillway. Int. J. Sci. Res. 2019, 8, 245–254. [Google Scholar]
  37. Roy, D.; Mukherjee, S.; Bose, B. Regulation of a multipurpose reservoir system: Damodar Valley, India. In Man’s Influence on Freshwater Ecosystems and Water Use; Proceedings of a Boulder Symposium; International Association of Hydrological Sciences: Montpellier, France, 1995. [Google Scholar]
  38. Jana, S.; Das, M.; Roy, D.; Das, S.; Mazumdar, A. Simulation of climate change impact in a river basin in Eastern India. Int. J. Hydrol. Sci. Technol. 2015, 5, 314–332. [Google Scholar] [CrossRef]
  39. Jana, S.; Dutta, S.; Das, S.; Roy, D. Uncertainty in Hydrologic Response of a River Basin in India to Changed Climate Scenario. Water Energy Int. 2018, 61, 68–75. [Google Scholar]
  40. Chaudhuri, D. Damodar River Valley: An Indian Parallel to The Tennessee River Valley. J. Hydraul. Eng. 2000, 126, 395–397. [Google Scholar] [CrossRef]
  41. Chaudhuri, D. Life of Maithon Reservoir on Ground of Sedimentation: Case Study in India. J. Hydraul. Eng. 2006, 132, 875–880. [Google Scholar] [CrossRef]
  42. Mani, P.; Chakravorty, B. Dam break flood simulation for Maithon and Panchet dams using NWS DAMBRK model and inundation mapping. J. Inst. Eng. 2008, 89, 16–19. [Google Scholar]
  43. Bhattacharyya, K. The Lower Damodar River India Understanding the Human Role in Changing Fluvial Environment; Springer: Dordrecht, The Netherlands; Berlin/Heidelberg, Germany; New York, NY, USA, 2012. [Google Scholar]
  44. Chaudhuri, D. Evaluation of Maithon Reservoir Performance. Master’s, Dissertation, Department of Hydrology, Indian Institute of Technology, Roorkee, India, 2012. [Google Scholar]
  45. Chaudhuri, D.; Banerjee, S. Reservoir Sedimentation and its Remedies. In Proceedings of the Conference India Water Week 2013, New Delhi, India, 8–12 April 2013; pp. 1–19. [Google Scholar]
  46. Sanyal, J.; Carbonneau, P.; Densmore, A.L. Hydraulic routing of extreme floods in a large ungauged river and the estimation of associated uncertainties: A case study of the Damodar River, India. Nat. Hazard. 2013, 66, 1153–1177. [Google Scholar] [CrossRef]
  47. Ghosh, S.; Mistri, B. Performance of D.V.C. in Flood Moderation of Lower Damodar River, India and Emergent Risk of Flood. East. Geogr. 2013, XIX, 55–66. [Google Scholar]
  48. Mukherjee, B.; Das, S.; Mazumdar, A. Mathematical analysis for the loss of future storage capacity at Maithon reservoir, India. ARPN J. Eng. Appl. Sci. 2013, 8, 841–845. [Google Scholar]
  49. Chatterjee, M.; Roy, D.; Das, S.; Mazumder, A. Assessment of Water Resources Under Climate Change: Damodar River Basin, India. ARPN J. Eng. Appl. Sci. 2014, 9, 2183–2191. [Google Scholar]
  50. Biswas, S.S. Multipurpose Projects Serve as a Flood Controller- Is this the Reality? A Study of DVC Projects of the Damodar River of West Bengal, India. J. Environ. Earth Sci. 2015, 5, 70–79. [Google Scholar]
  51. IMD. 2017. Available online: https://idup.gov.in/site/writereaddata/siteContent/IDUP-14-09-17/Maithon-Dam-Design-Flood-Estimation.pdf (accessed on 11 February 2023).
  52. Islam, A.; Sarkar, B. Analysing flood history and simulating the nature of future floods using Gumbel method and Log-Pearson Type III: The case of the Mayurakshi River Basin, India. Bull. Geogr. Phys. Geogr. Ser. 2020, 19, 43–69. [Google Scholar] [CrossRef]
  53. IS 6934-1998; Hydraulic Design of High Ogee Overflow Spillways—Recommendations. First Revision, Reaffirmed 2003. Bureau of Indian Standards: New Delhi, India, 1998.
  54. Subramanya, K. Engineering Hydrology, 4th ed.; McGraw Hill Education (India) Private Limited: New Delhi, India, 2013. [Google Scholar]
  55. Mukherjee, B.; Das, S.; Mazumdar, A. Environmental Study and Analysis of Silts Deposition at Maithon Reservoir. Indian J. Environ. Prot. 2015, 35, 177–187. [Google Scholar]
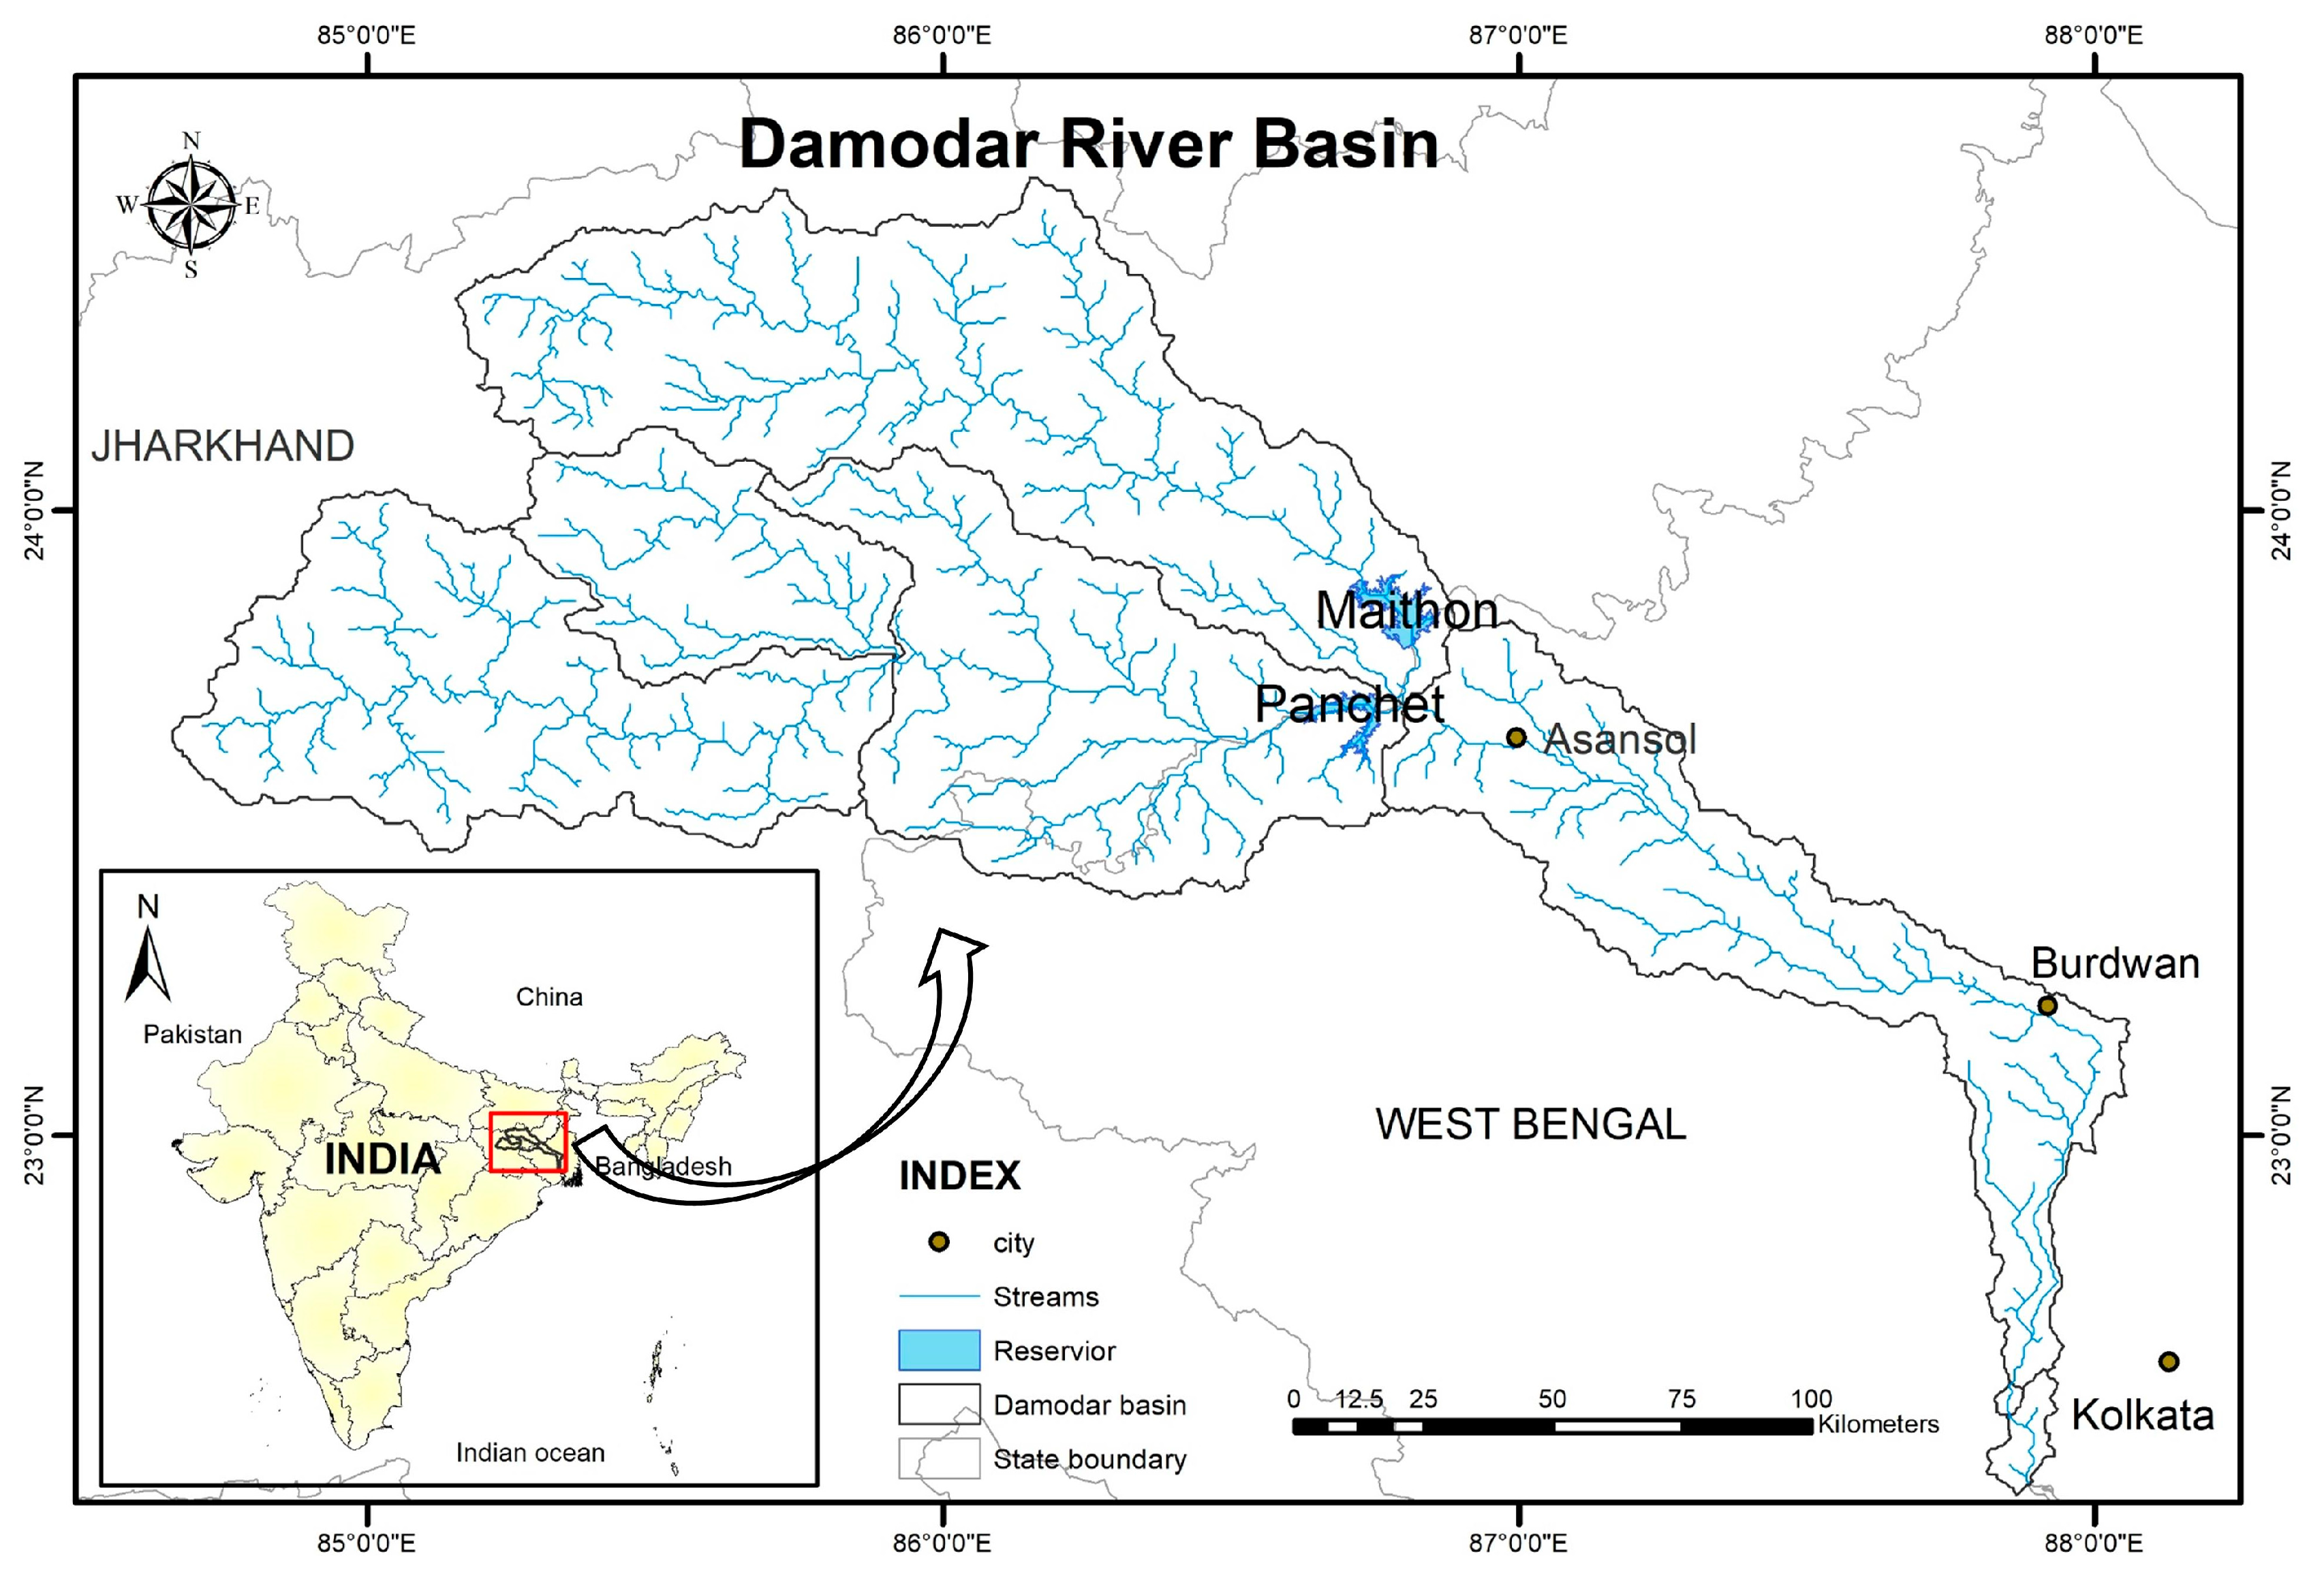
Figure 1. Location map of Damodar catchment showing Panchet and Maithan Reservoirs.
Water 16 00663 g001
Figure 2. Profile of a gated ogee spillway.
Water 16 00663 g002
Figure 3. Non-dimensional variation in reservoir storage with elevation or level of Maithan Dam.
Water 16 00663 g003
Figure 4. Non-dimensional variation in reservoir storage with elevation or level of Panchet Dam.
Water 16 00663 g004
Figure 5. Non-dimensional variation in reservoir discharge with elevation of Maithan Dam.
Water 16 00663 g005
Figure 6. Non-dimensional variation in reservoir discharge with elevation of Panchet Dam.
Water 16 00663 g006
Figure 7. Non-dimensional variation in reservoir elevation with time of Maithan Dam.
Water 16 00663 g007
Figure 8. Non-dimensional variation in reservoir elevation with time of Panchet Dam.
Water 16 00663 g008
Figure 9. Non-dimensional variation in reservoir outflow with time of Maithan Dam.
Water 16 00663 g009
Figure 10. Non-dimensional variation in reservoir inflow with time of Maithan Dam.
Water 16 00663 g010
Figure 11. Non-dimensional variation in reservoir outflow with time of Panchet Dam.
Water 16 00663 g011
Figure 12. Non-dimensional variation in reservoir inflow with time of Panchet Dam.
Water 16 00663 g012
Disclaimer/Publisher’s Note: The statements, opinions and data contained in all publications are solely those of the individual author(s) and contributor(s) and not of MDPI and/or the editor(s). MDPI and/or the editor(s) disclaim responsibility for any injury to people or property resulting from any ideas, methods, instructions or products referred to in the content.