1. Introduction
The infrastructure required to maintain our societies’ way of life is increasingly connected to cyber networks [
1,
2]. This is generally the result of the application of connected cyber control technology to infrastructure networks, such as water or electricity distribution systems [
3,
4]. This incorporation of technology has transformed these critical infrastructure networks into cyber–physical systems (CPSs)—complex interconnected physical and cyber networks (
Figure 1a) that continually exchange information and control [
5,
6,
7].
A key aspect of the function of CPSs, and what facilitates their interconnection, is the link between physical assets and cyber components. For example, in the case of water distribution systems, this could be a tank with a water level sensor and a router that will send that water level data to a pump, which will then turn on/off as a function of this level (
Figure 1b). Whilst this link improves the efficiency and automation of the operation of the physical system, it also exposes the physical infrastructure and its operations to cyber threats, in addition to existing physical threats [
8]. Not only have the cyber threats and vulnerabilities of CPSs become more prevalent and numerous over the past few years [
9,
10,
11,
12], the number of infrastructure systems exposed to these threats is also growing [
13,
14].
Figure 1.
The cyber–physical system, where (a) the cyber network (represented by common components such as a router, sensor, cloud, and workstation) and the physical network (represented by common infrastructure networks: water, manufacturing, and power generation) work together as a cyber–physical system (CPS). (b) An example water distribution system CPS incorporates a physical network (bottom) of pump, valve, and storage tank where arrows indicate the flow of water. The cyber network (top) depicts common components including sensors, actuators, router, Supervisory Control and Data Acquisition (SCADA) workstation, and their potential configuration where arrows represent flow of information/control.
Cyber threats to physical infrastructure systems are caused by attacks upon the cyber network that have an impact in the physical network, which are referred to as cyber–physical attacks (CPAs) [
15,
16] (
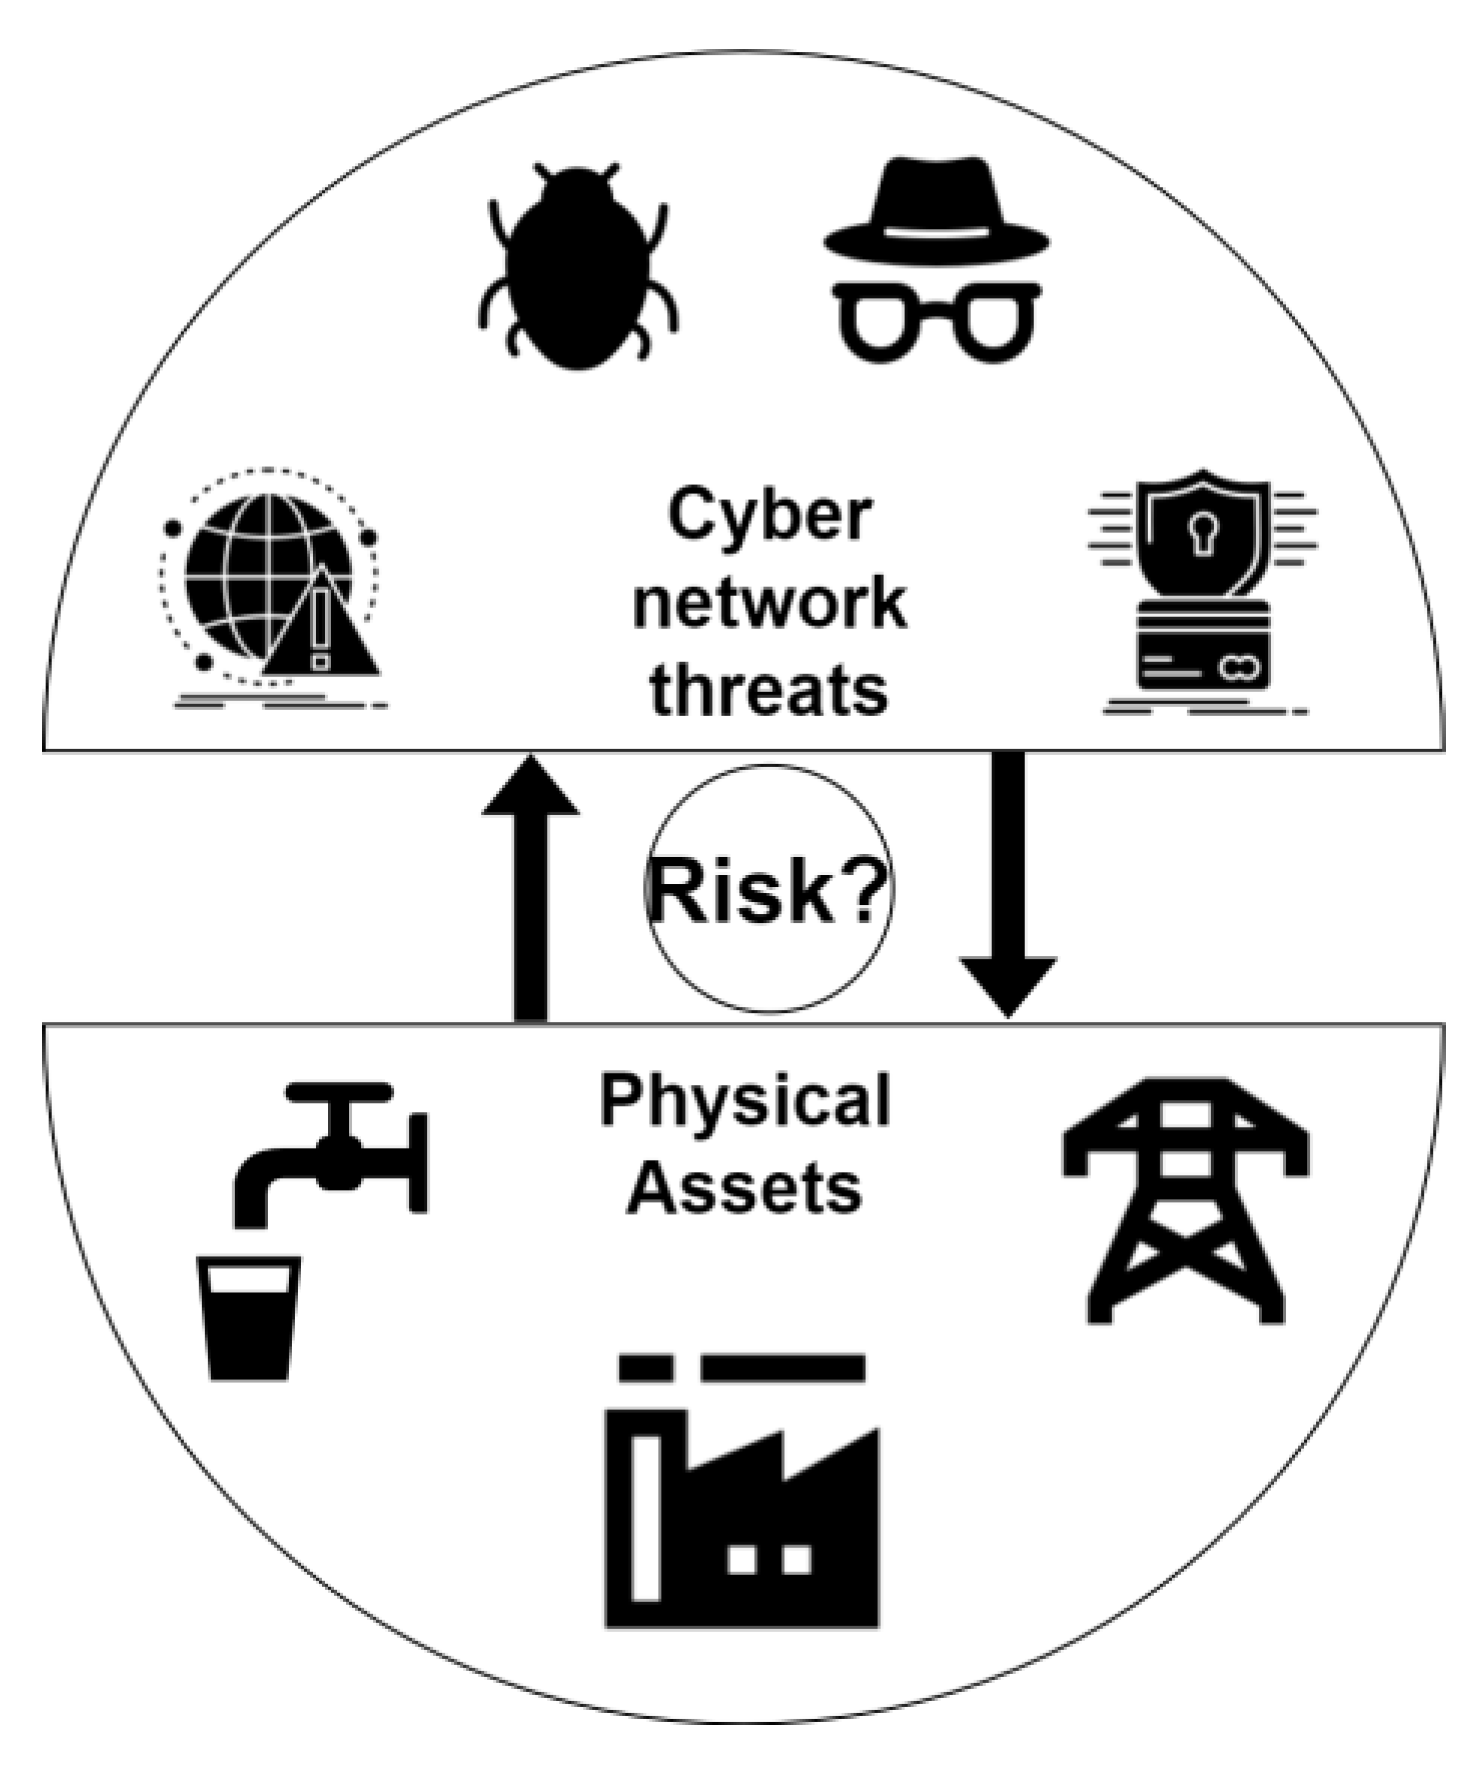
Figure 2). As a result, the need to safeguard physical assets against potential cyber-attacks has received increasing attention [
17,
18,
19,
20,
21]. However, common domain-specific approaches to quantifying associated risks, such as cyber-threat modelling [
22] or physical asset performance analysis [
23,
24,
25], fall short of providing a system-wide assessment of the actual cyber-risk of critical infrastructure. This is because they primarily focus either on the cyber or physical domains of CPSs, without bridging the gap between them, or focus on enterprise networks rather than the operational technology networks that directly control infrastructure operations [
8,
17,
26]. The small number of studies that do bridge the cyber–physical divide are “attack-focussed” [
17], which means that they only consider the impact of specific cyber-attacks. While this can allow for the stress testing of the systems in question (e.g., Nikolopoulos and Makropoulos [
27]), it generally does not provide a snapshot of the systemic risk of the combined CPS.
While there are existing approaches to assessing the system-wide risk of failure of physical assets (e.g., that the asset will not meet desired performance requirements, such as the inability of a water supply system to deliver water of suitable quality and pressure to customers), these are either attribute-based or performance-based, involving an assessment of factors such as the critical failure modes of the asset, its expected performance drop during failure, and the likelihood of this occurring based on historical data [
23]. However, the risk or vulnerability of failure of specific physical assets due to their connection to cyber systems is often ignored, with generalised network-wide impacts considered instead [
8,
17]. This is likely because all the other risk factors and failure modes originate in the physical system itself and can therefore be considered at any particular point relatively easily. In contrast, consideration of the risk CPAs pose to the ability to maintain the desired performance of a physical system requires the development of a method for translating risks in the cyber domain to those in the physical domain.
Similarly, while there are existing approaches for quantifying system-wide risk in cyber networks, these generally do not translate to risk in the physical domain. For example, security/vulnerability-based assessments, such as maturity models [
28], focus on assessing cyber-security attributes and the security policy of the cyber system, resulting in cyber-security policy recommendations that are silent on potential impacts on the physical assets of a CPS. In the same vein, threat-based assessments [
29,
30,
31,
32] focus on different approaches to simulating the behaviour of the attacker performing the CPA [
33] with the goal of identifying strategies that assist with protecting cyber assets from these attacks, without crossing the cyber–physical divide to quantify the risk to specific physical assets due to these attacks.
Another assessment method commonly utilised within the cyber domain to understand its level of risk is the assessment of vulnerabilities using the Common Vulnerability Scoring System (CVSS) [
34]. This scoring system is used to quantitatively score common vulnerabilities and exposures (CVEs), which are information system weaknesses that may be present in the cyber system [
34]. These CVSS scores range from zero to ten and incorporate an exploitability score and an impact score in an effort to quantify the severity of a vulnerability and are commonly used in industry to prioritise mitigation responses across managed cyber networks. The exploitability score is influenced by a series of exploitability metrics describing the “ease and technical means by which the vulnerability can be exploited” [
34]. The impact score and subsequent metrics reflect the consequences of the vulnerability being successfully exploited to either the primary cyber system or the downstream cyber systems. The most recent version of the CVSS (v4.0) also incorporates a safety metric, which identifies if the interconnected system may have an impact on the safety of human life. Whilst this again fails to cross the cyber–physical divide as it does not assess impact in the physical domain explicitly, nor provide a way to translate this vulnerability information to the physical domain, it does highlight an increased interest and desire for interconnected cyber–physical risk assessments.
As mentioned above, a common feature of all existing methods for quantifying system-wide risks in cyber networks is that they primarily provide an assessment of the security of the cyber domain of CPSs. This makes the implicit assumption that the most vulnerable components in the cyber domain have the largest impact in the physical domain. However, this is unlikely to be the case, highlighting the need for an approach that crosses the cyber–physical divide to enable the relative risk to physical assets due to components in the cyber network, as well as the relative influence of different components in the cyber network on this risk, to be quantified explicitly. This would not only provide a quantitative assessment of the actual risk of physical assets due to their cyber connectivity but would also provide the information needed to target and justify investment in mitigation measures in the cyber domain that result in the largest reduction in risk in the physical domain.
In order to address the shortcomings of existing approaches, the overarching aim of this paper is to introduce and assess the utility of a novel approach to assessing the relative systemic risk of cyber–physical systems by considering the interactions between the cyber and physical components of such systems explicitly. By crossing the cyber–physical divide, the proposed approach is able to quantify (i) the relative risk of physical assets due to cyber components and (ii) the relative influence of cyber components on physical asset risk (Objective 1). This enables physical asset managers to understand another aspect of the risk their assets face, namely the risk due to cyber threats, and enables the identification of the cyber components that have the largest influence on these risks, and hence the most effective risk reduction strategies.
Figure 2.
A divide exists in risk assessment, in which the systemic risk of cyber-attacks and threats originating in the cyber network are not necessarily assessed for physical assets.
Figure 2.
A divide exists in risk assessment, in which the systemic risk of cyber-attacks and threats originating in the cyber network are not necessarily assessed for physical assets.
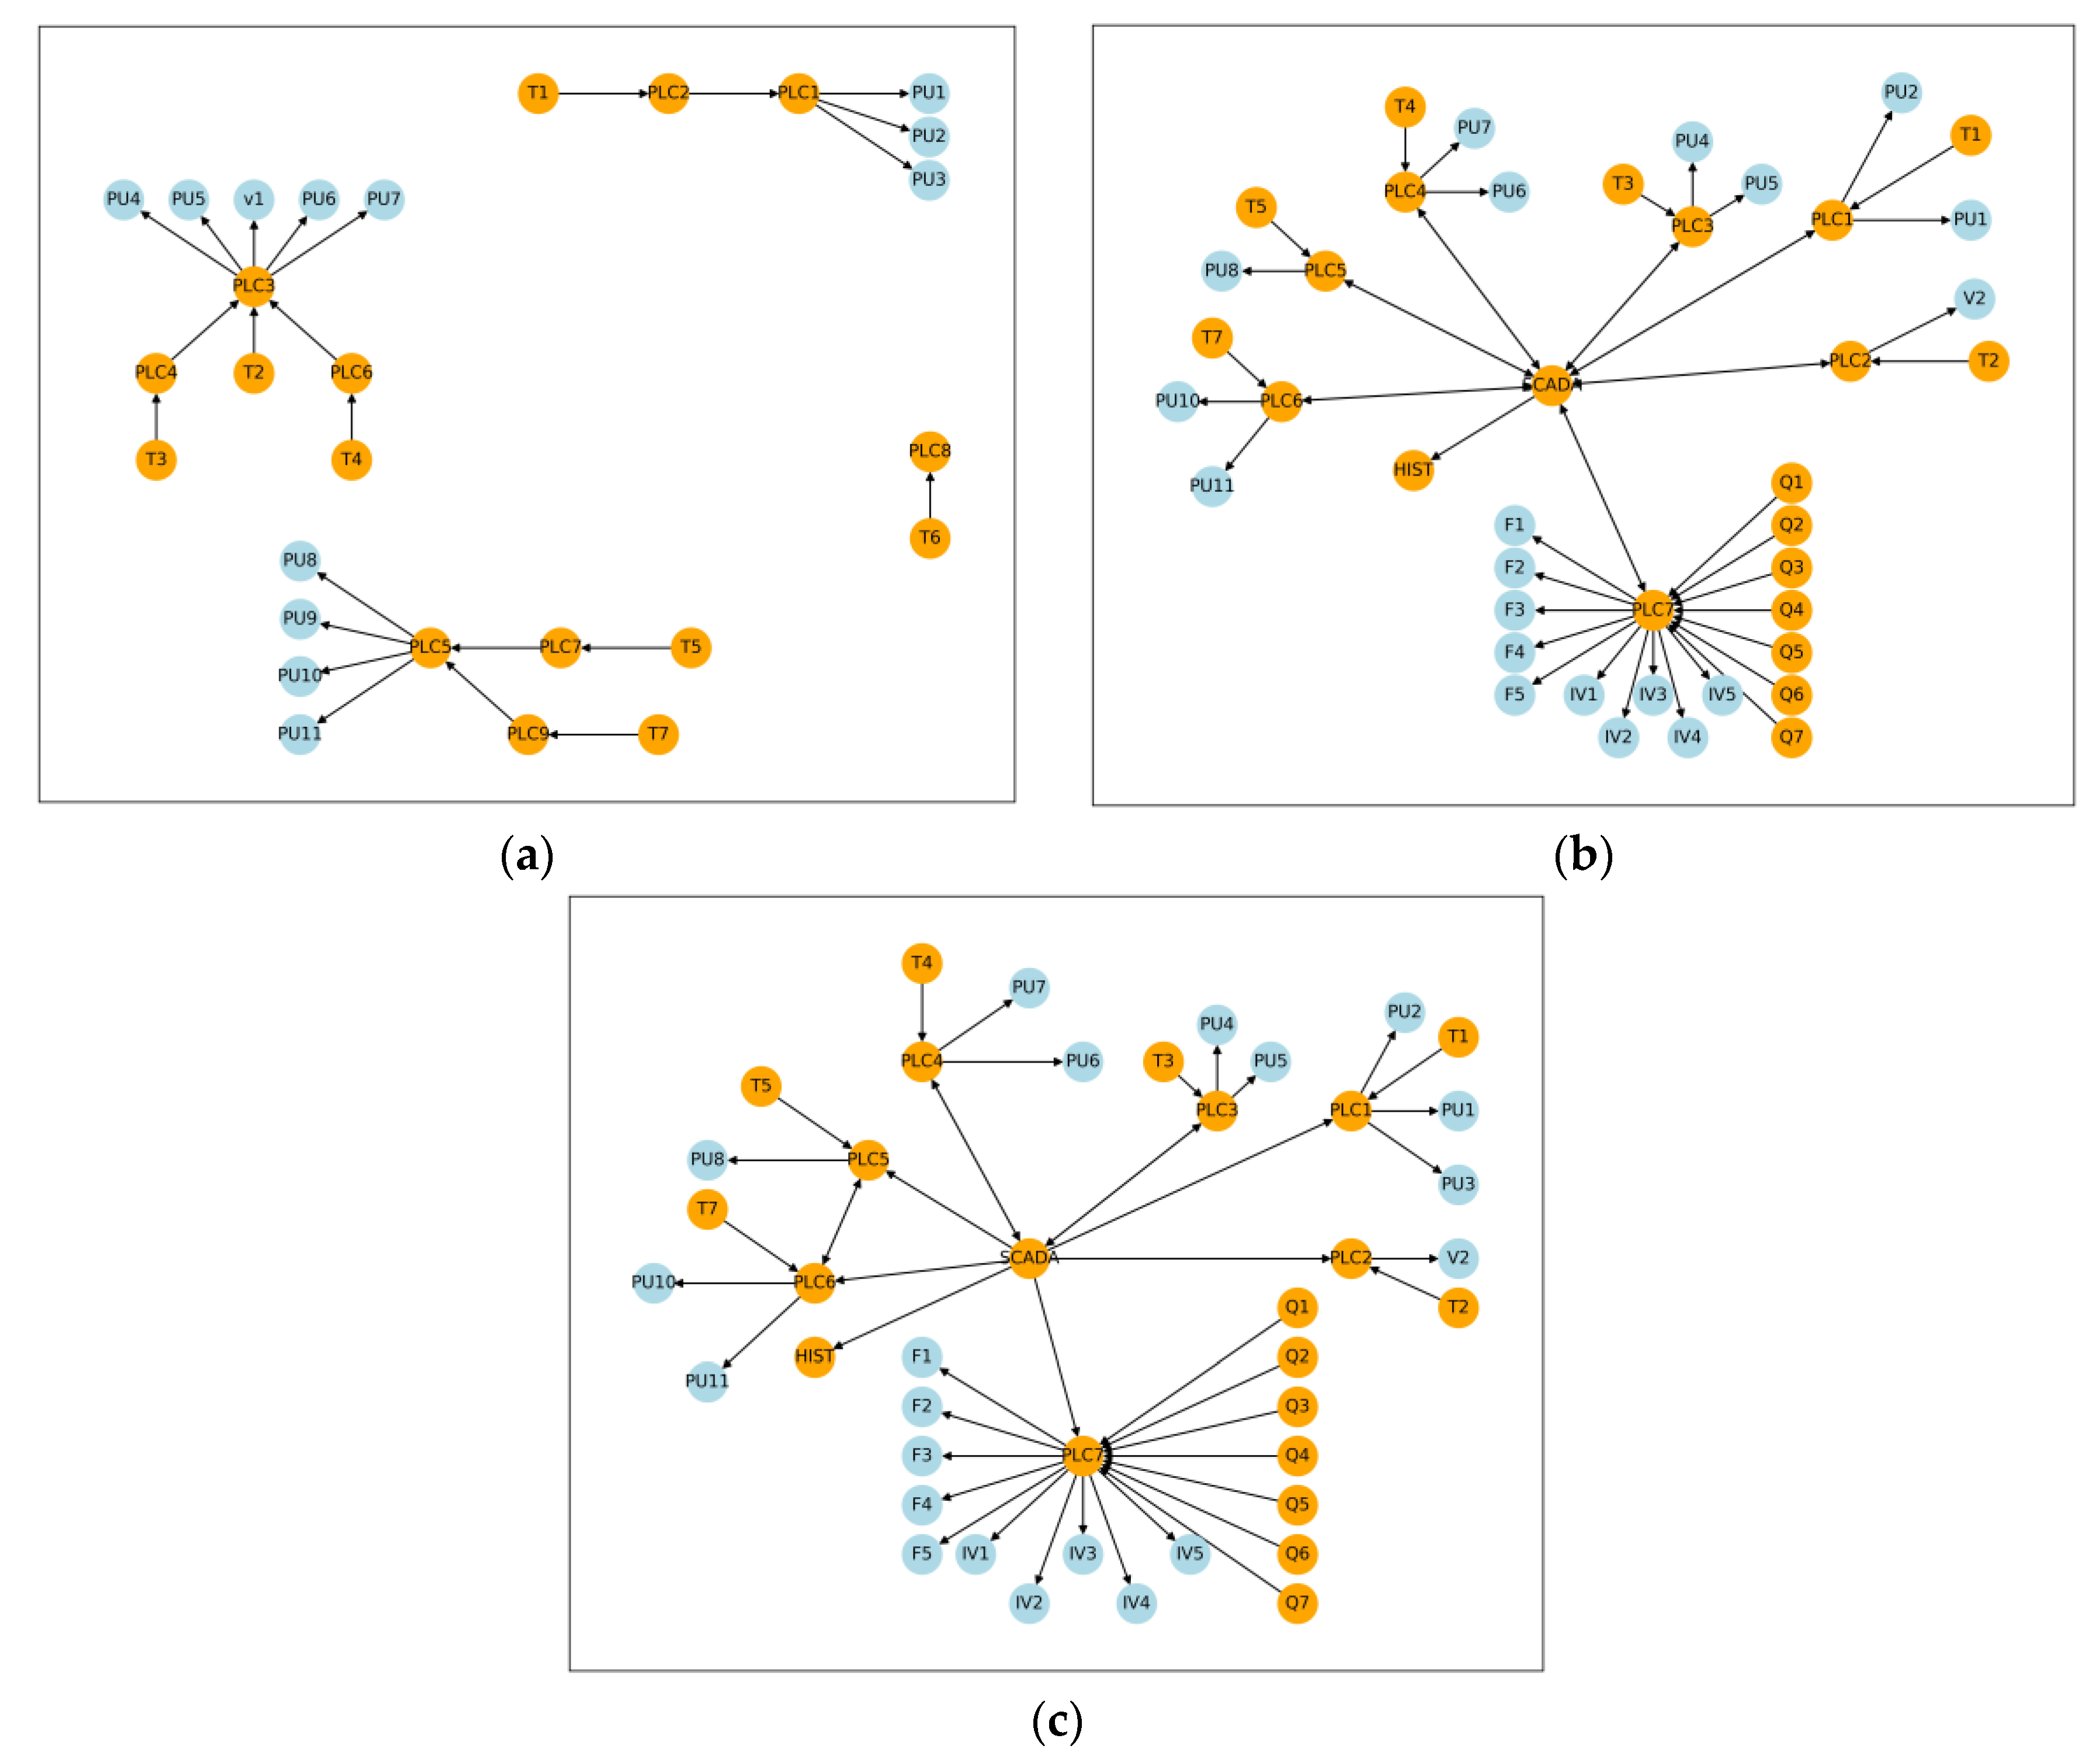
The application and potential benefits of the proposed approach are illustrated on a water distribution system case study from the literature for three different cyber network configurations (Objective 2):
Demonstrating how the approach can be used to obtain (a) quantitative estimates of the relative risk of physical assets due to their connection to cyber components and how they differ for different cyber network configurations (Objective 2a) and (b) the relative contribution of different cyber components to this risk and how they differ for different cyber network configurations (Objective 2b).
Illustrating how currently used risk assessment approaches can give misleading results, as determined by the relative risk rankings of the assets in the physical domain and the components in the cyber domain obtained using the proposed and more conventional approaches for the three different cyber network configurations considered, when determining (c) the relative vulnerabilities of cyber components in CPSs (Objective 2c) and (d) the relative impacts of physical assets in CPSs (Objective 2d).
The remainder of this paper is structured as follows: The proposed approach is introduced in
Section 2, followed by details of the case study and how the proposed approach is applied to it in
Section 3. The case study results are presented and discussed in
Section 4, before the conclusions are outlined in
Section 5.
2. Methodology
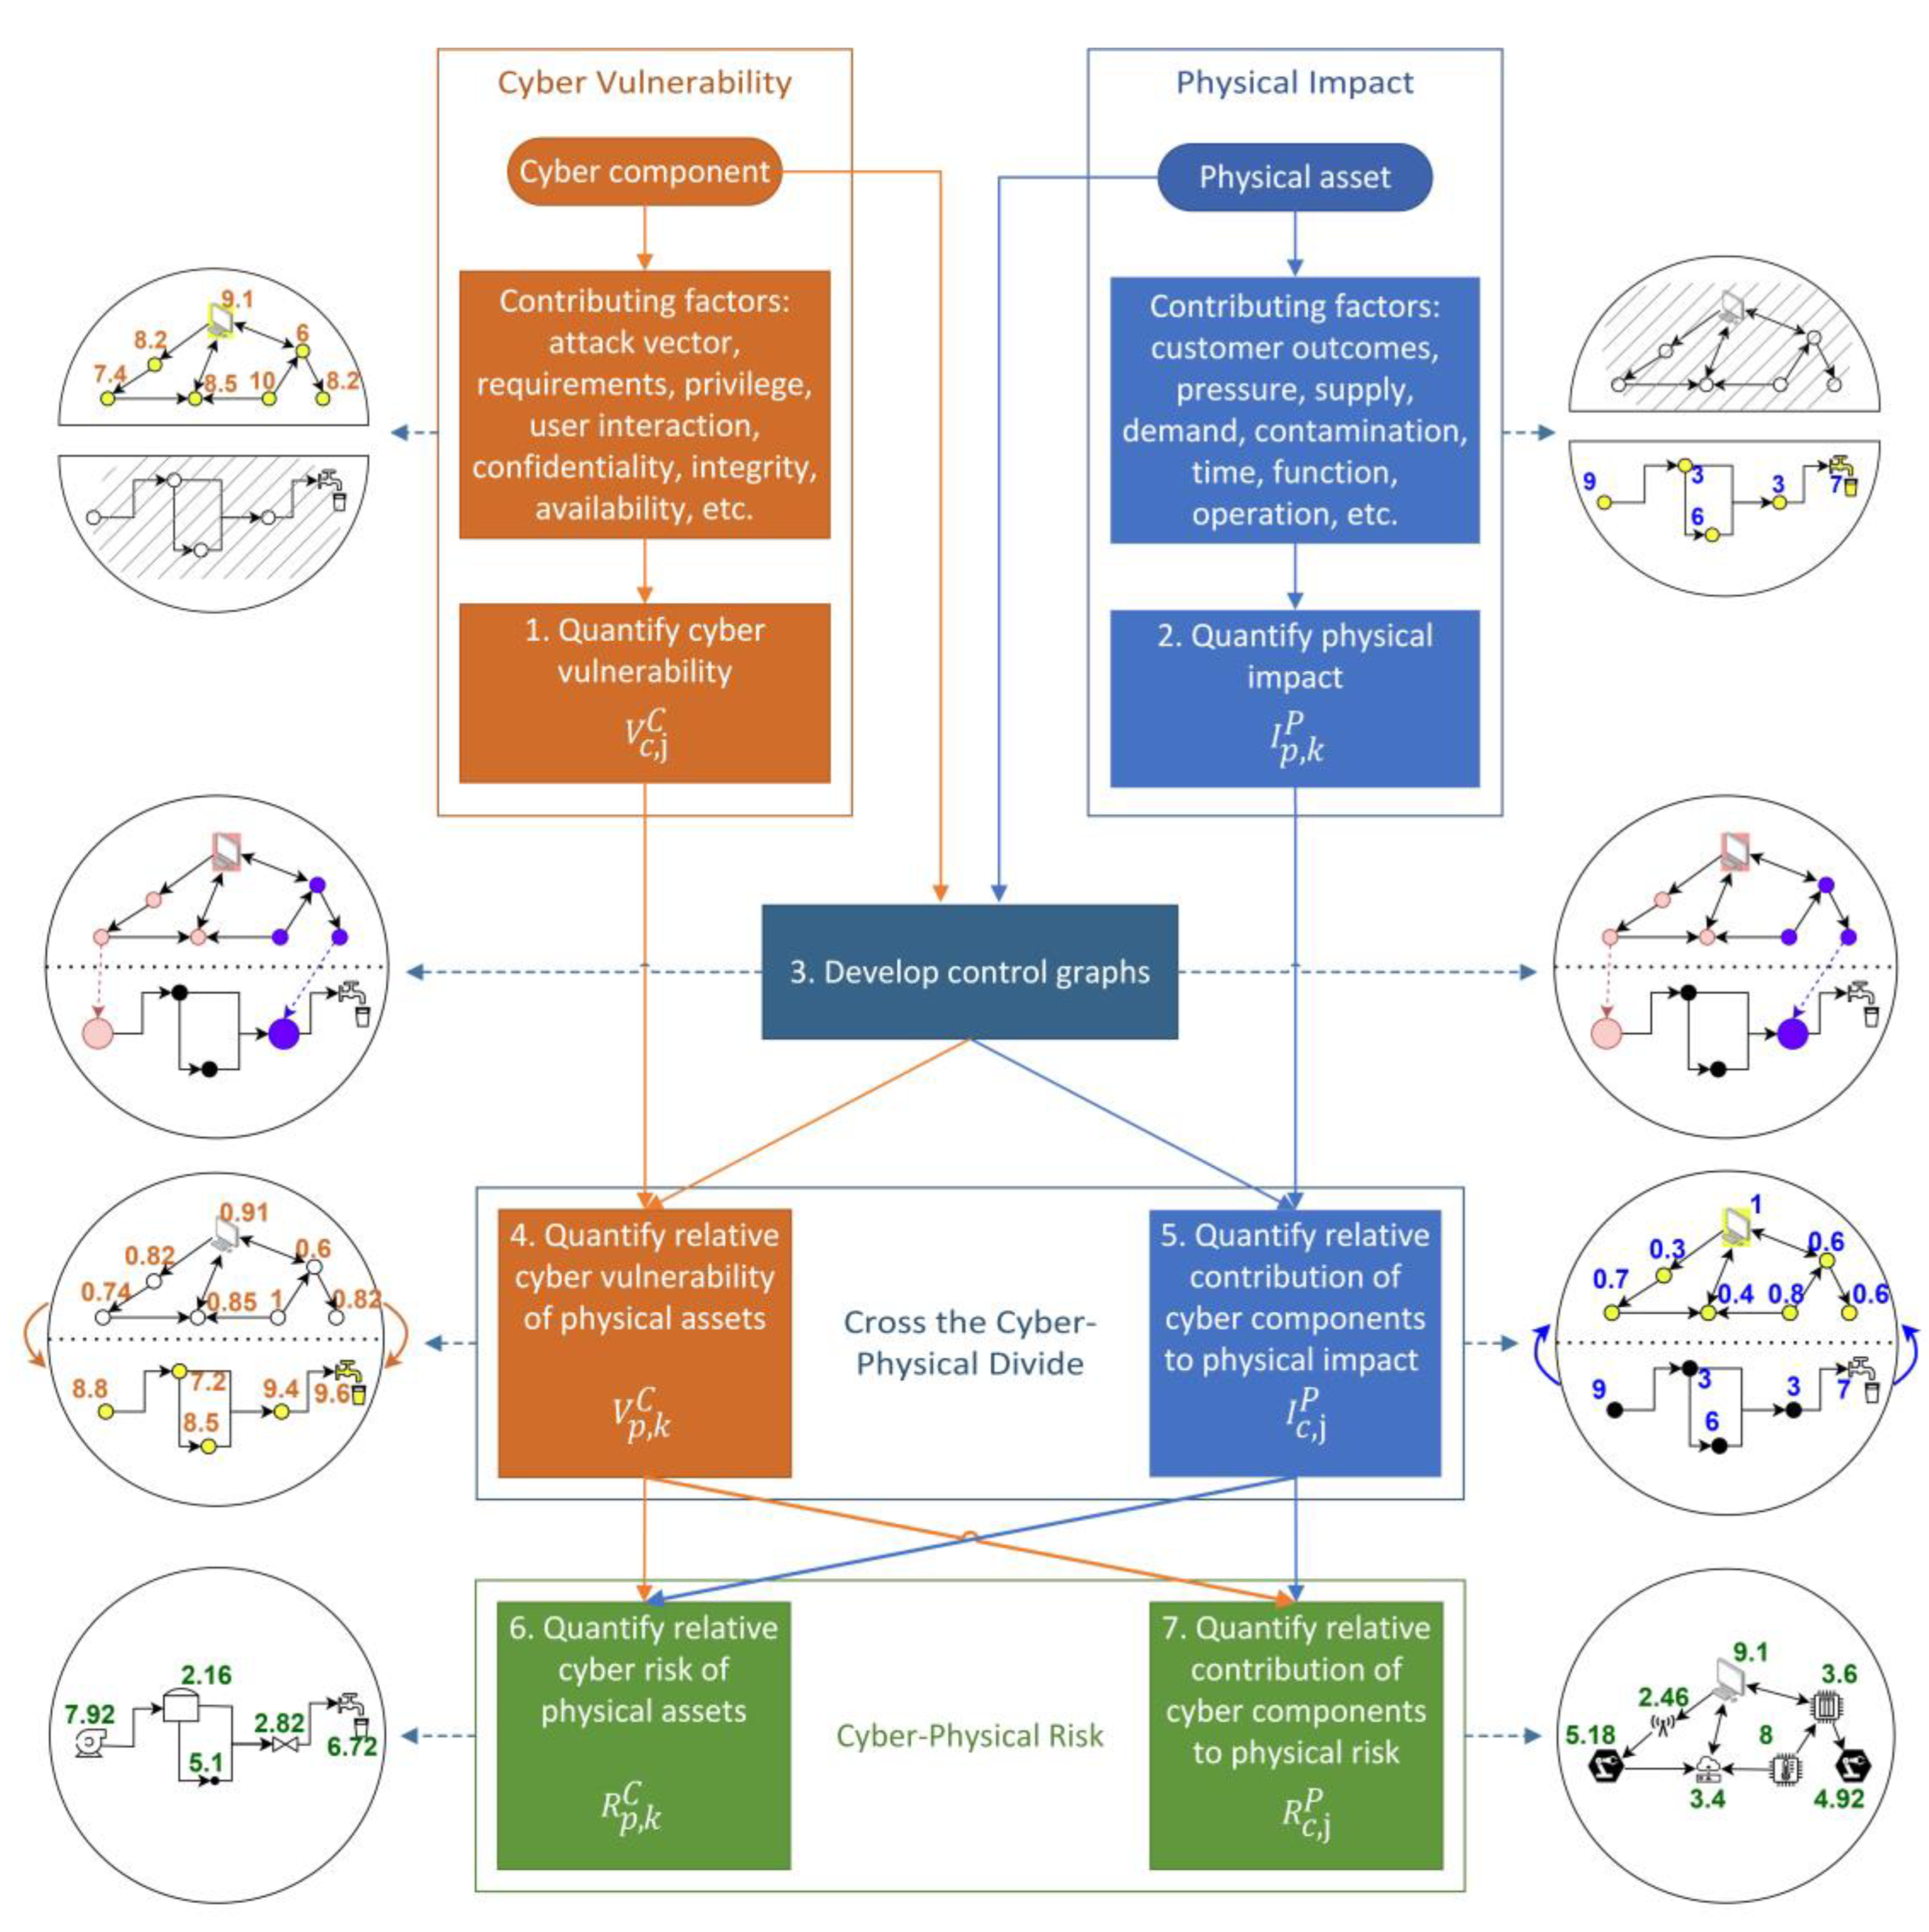
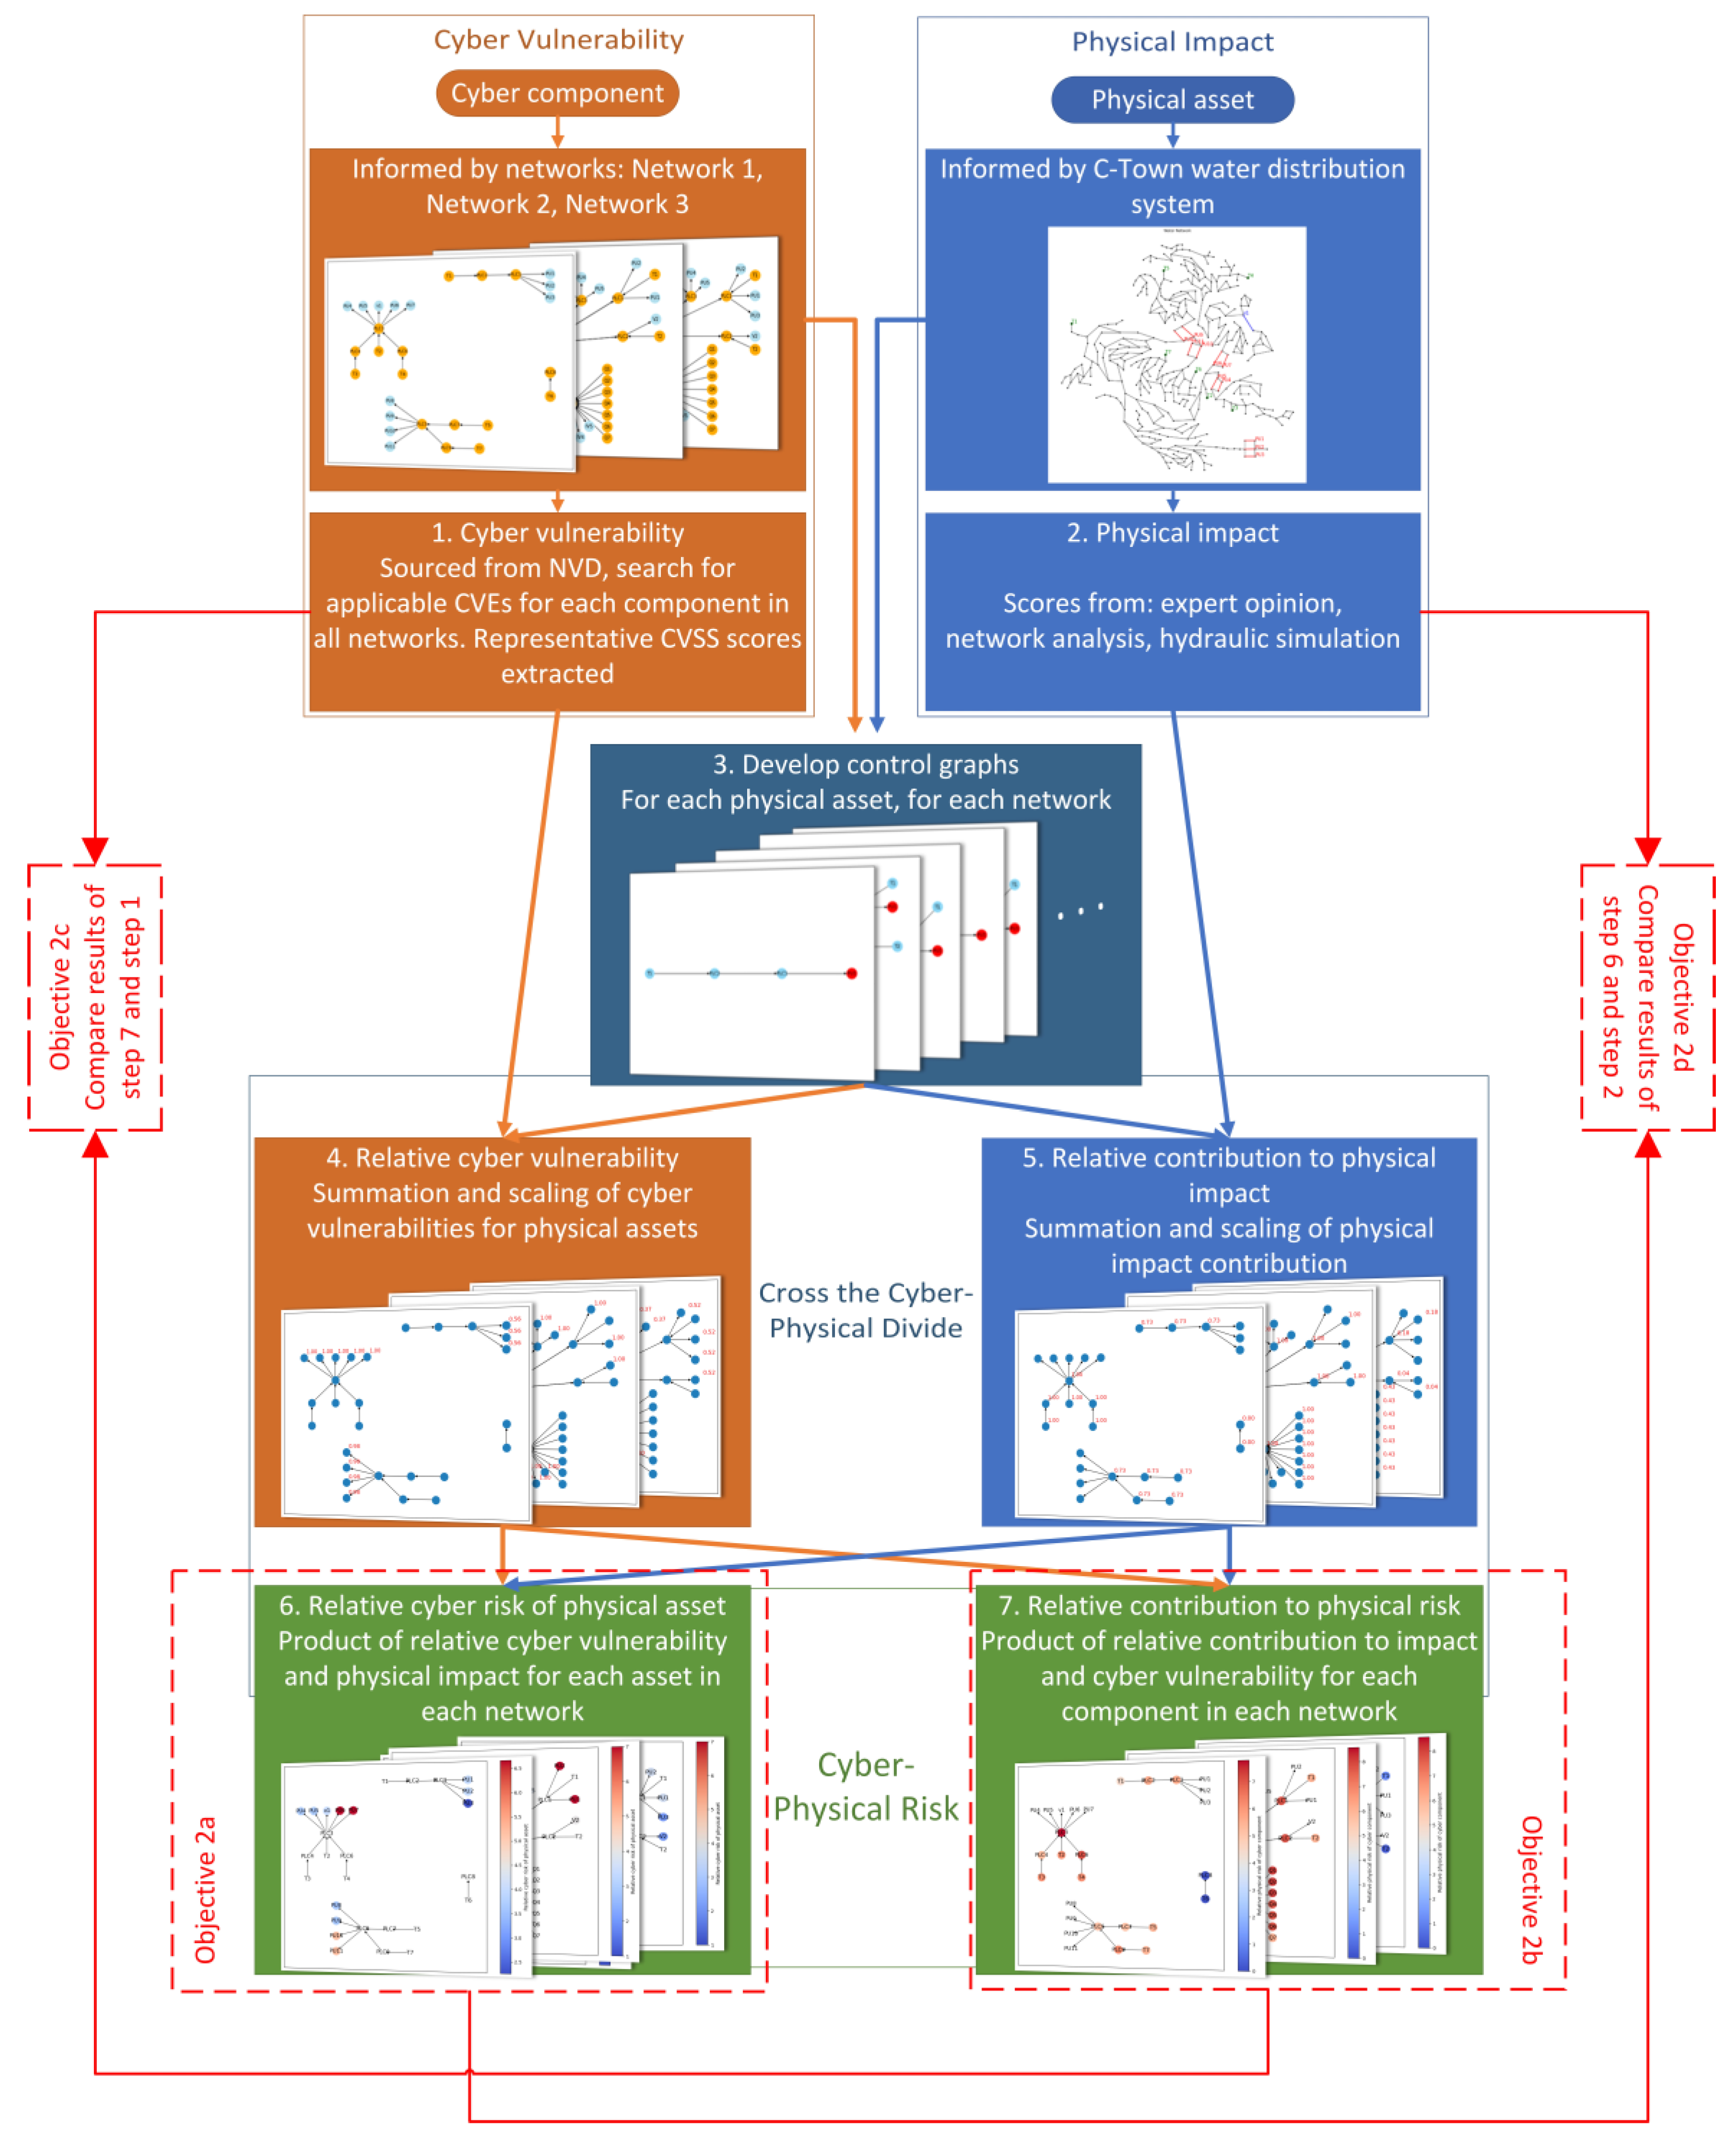
A conceptual representation of the proposed approach to assessing the relative systemic risk of cyber–physical systems by considering the interactions between the cyber and physical components of such systems explicitly (Objective 1) is given in
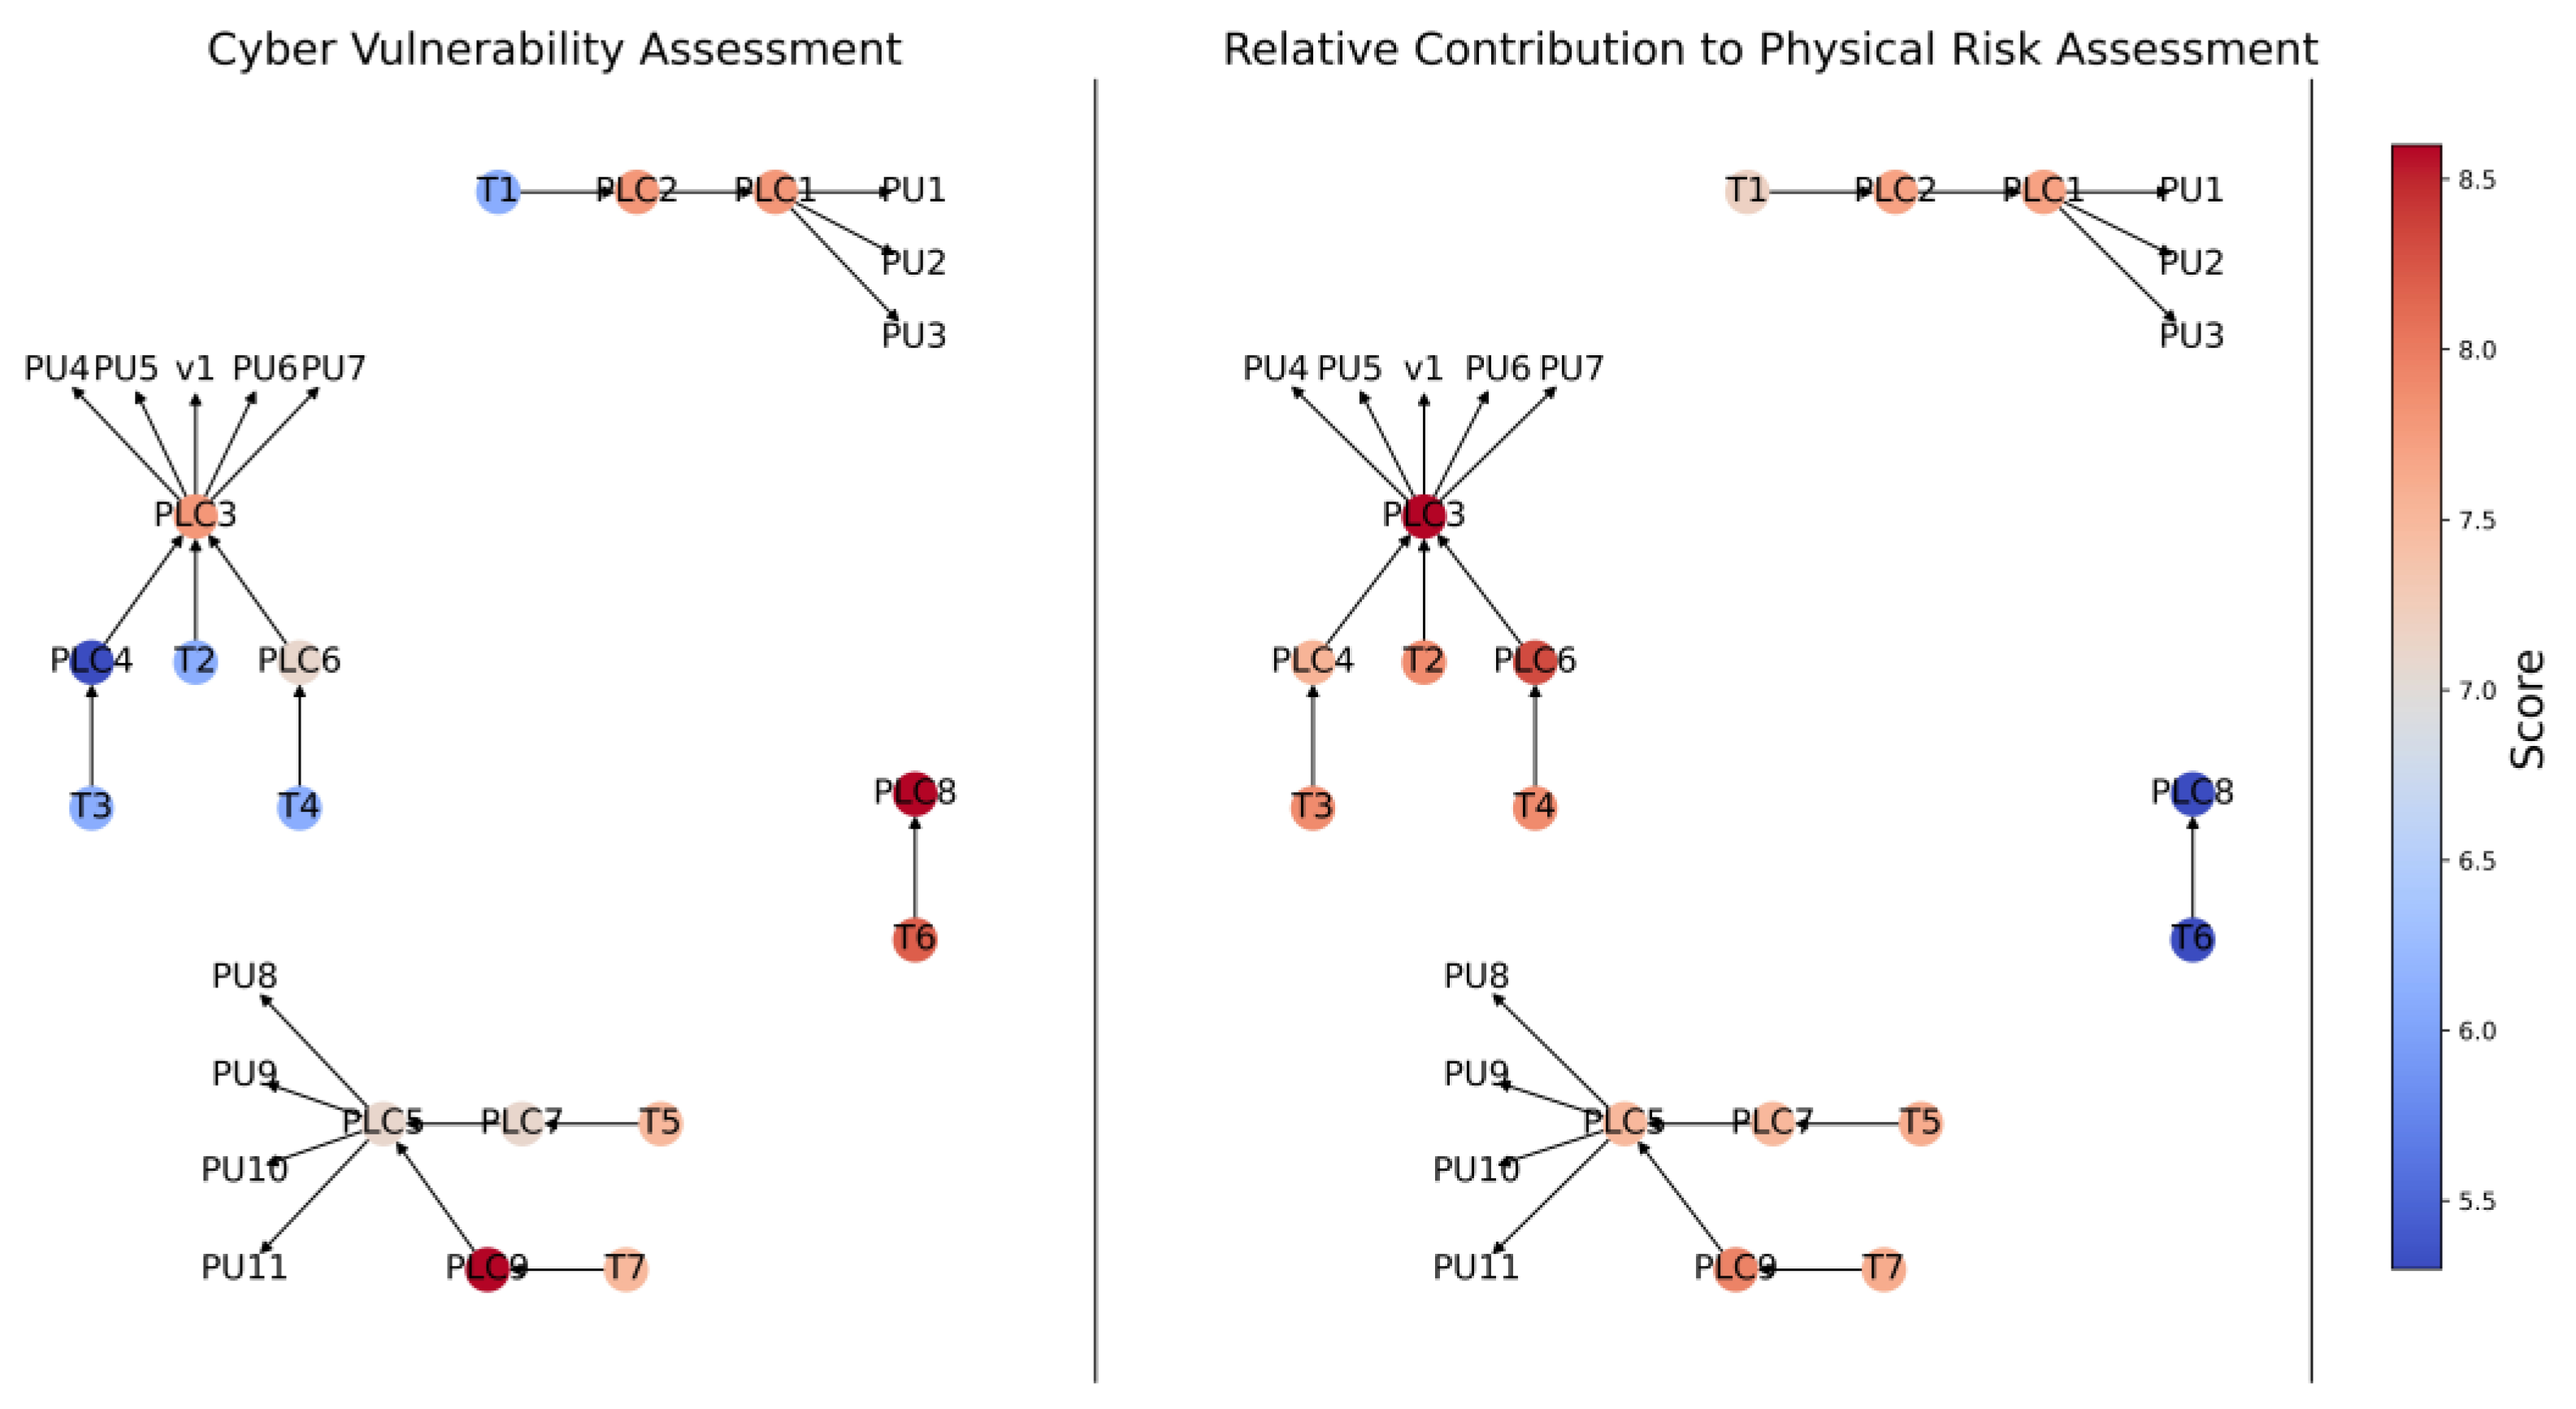
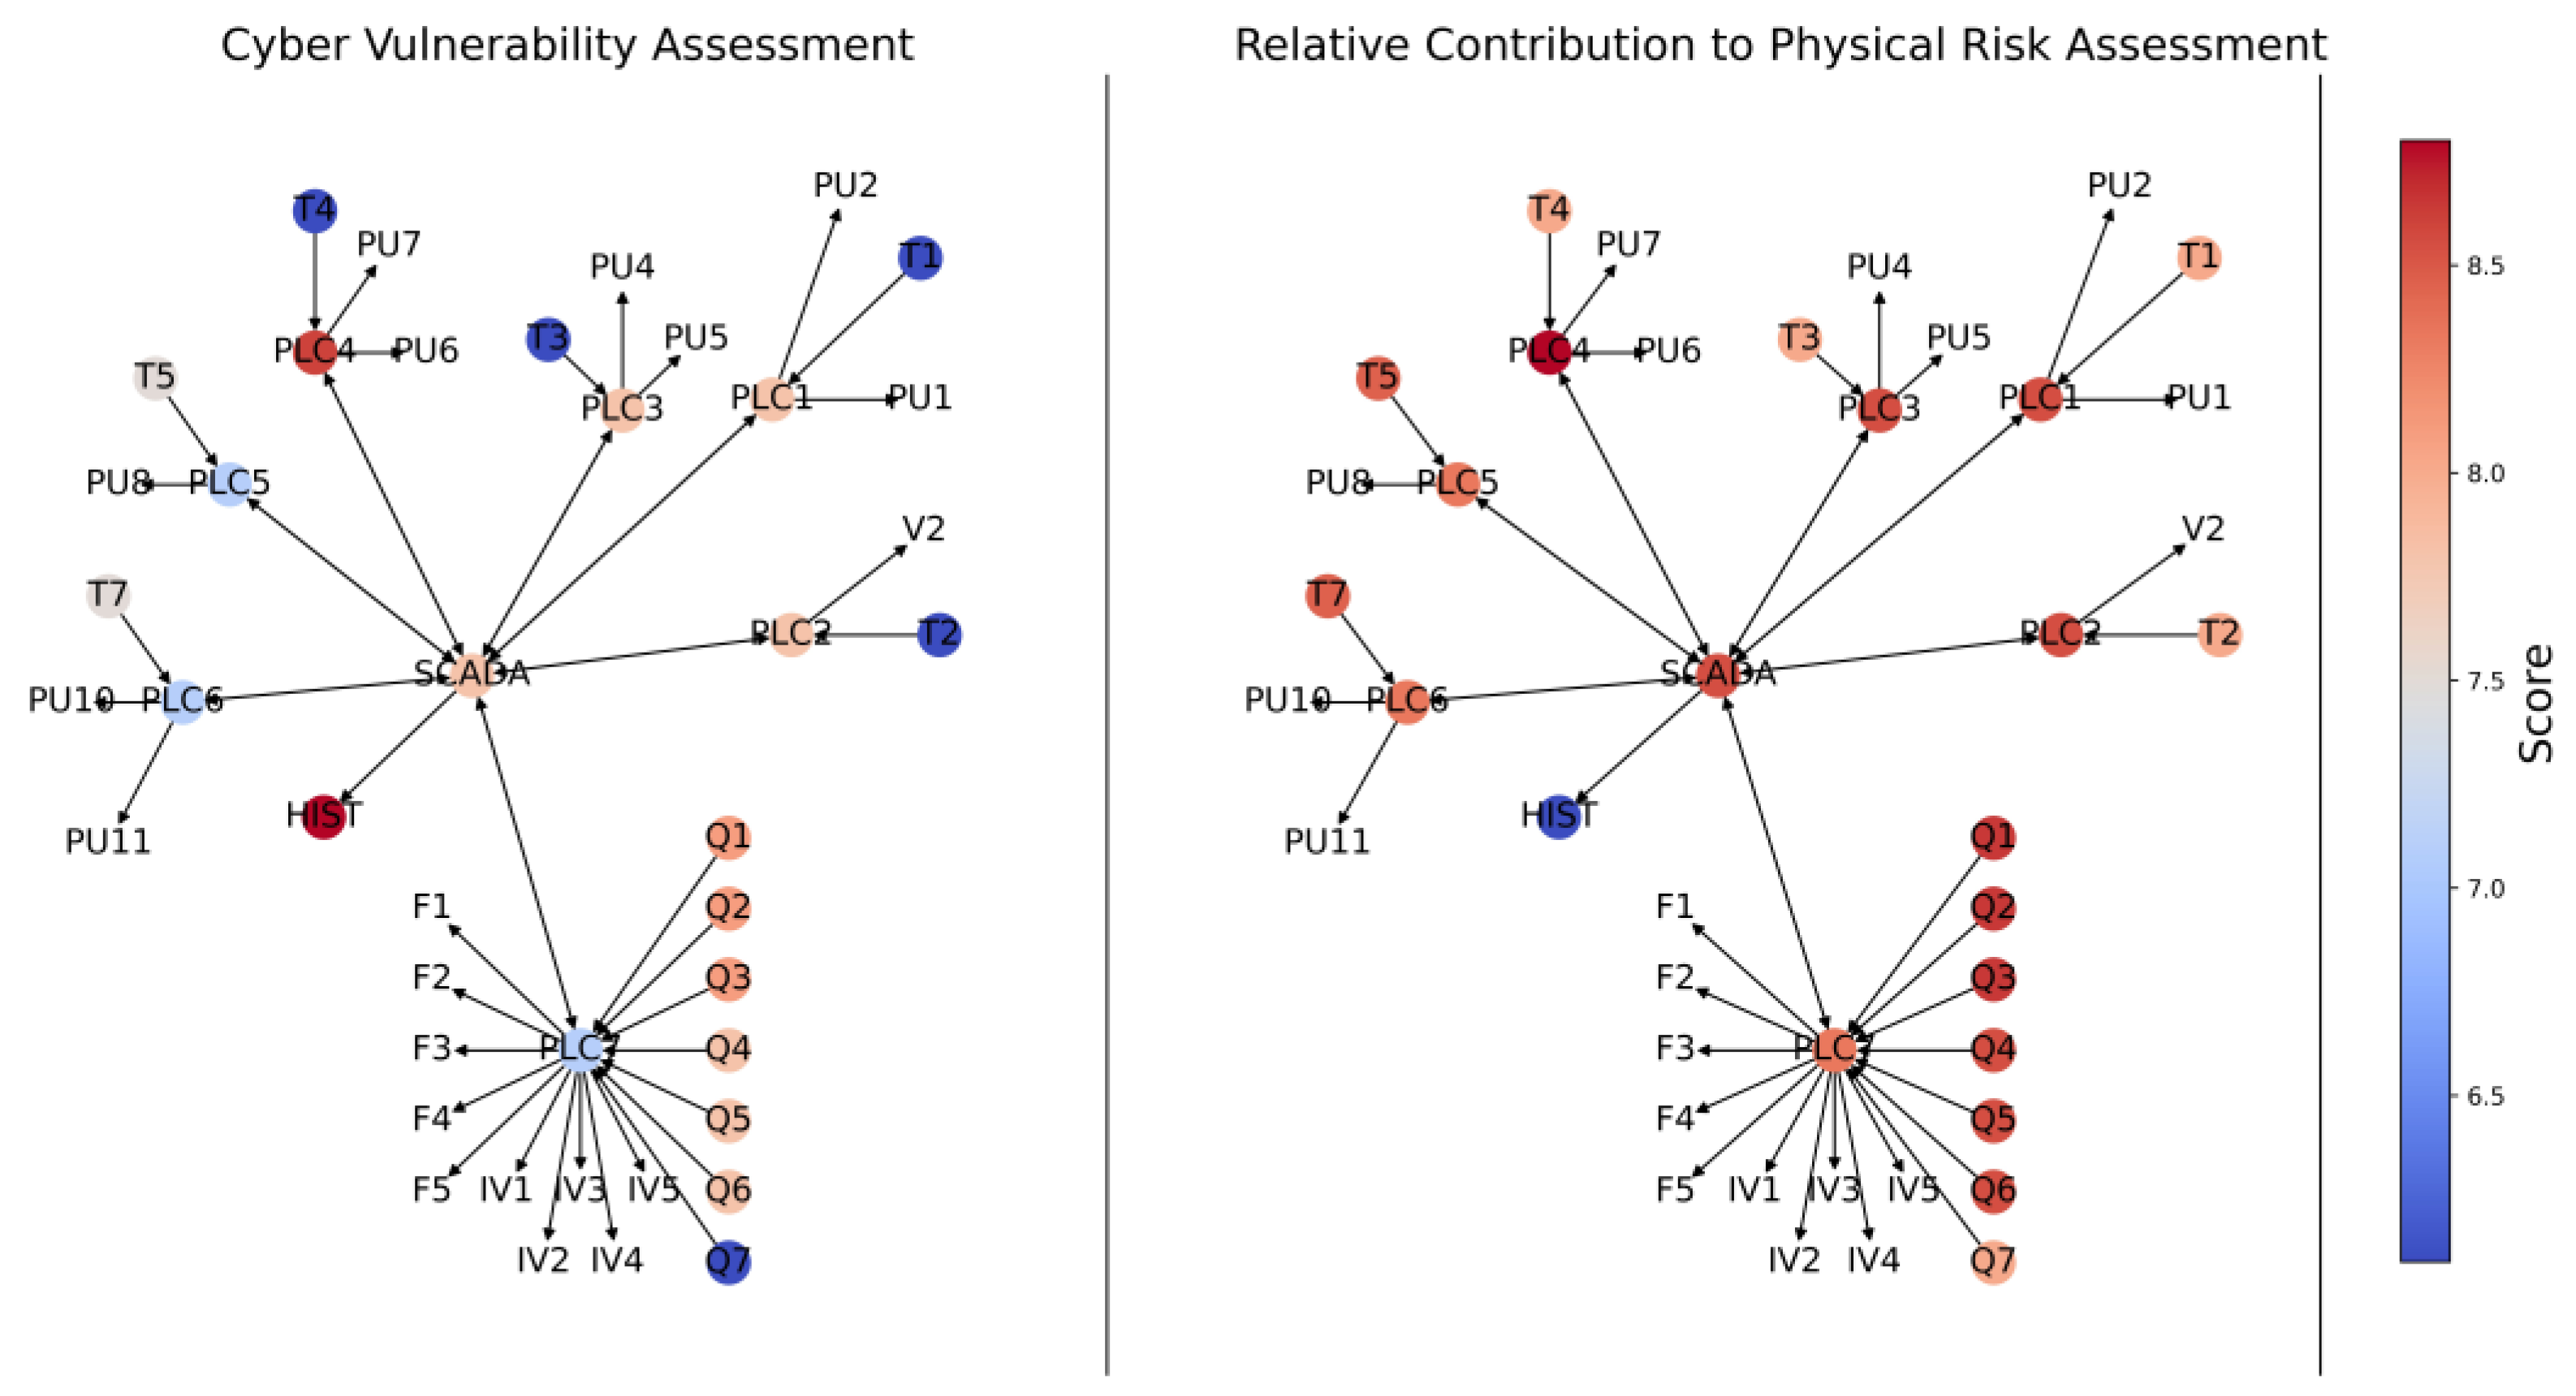
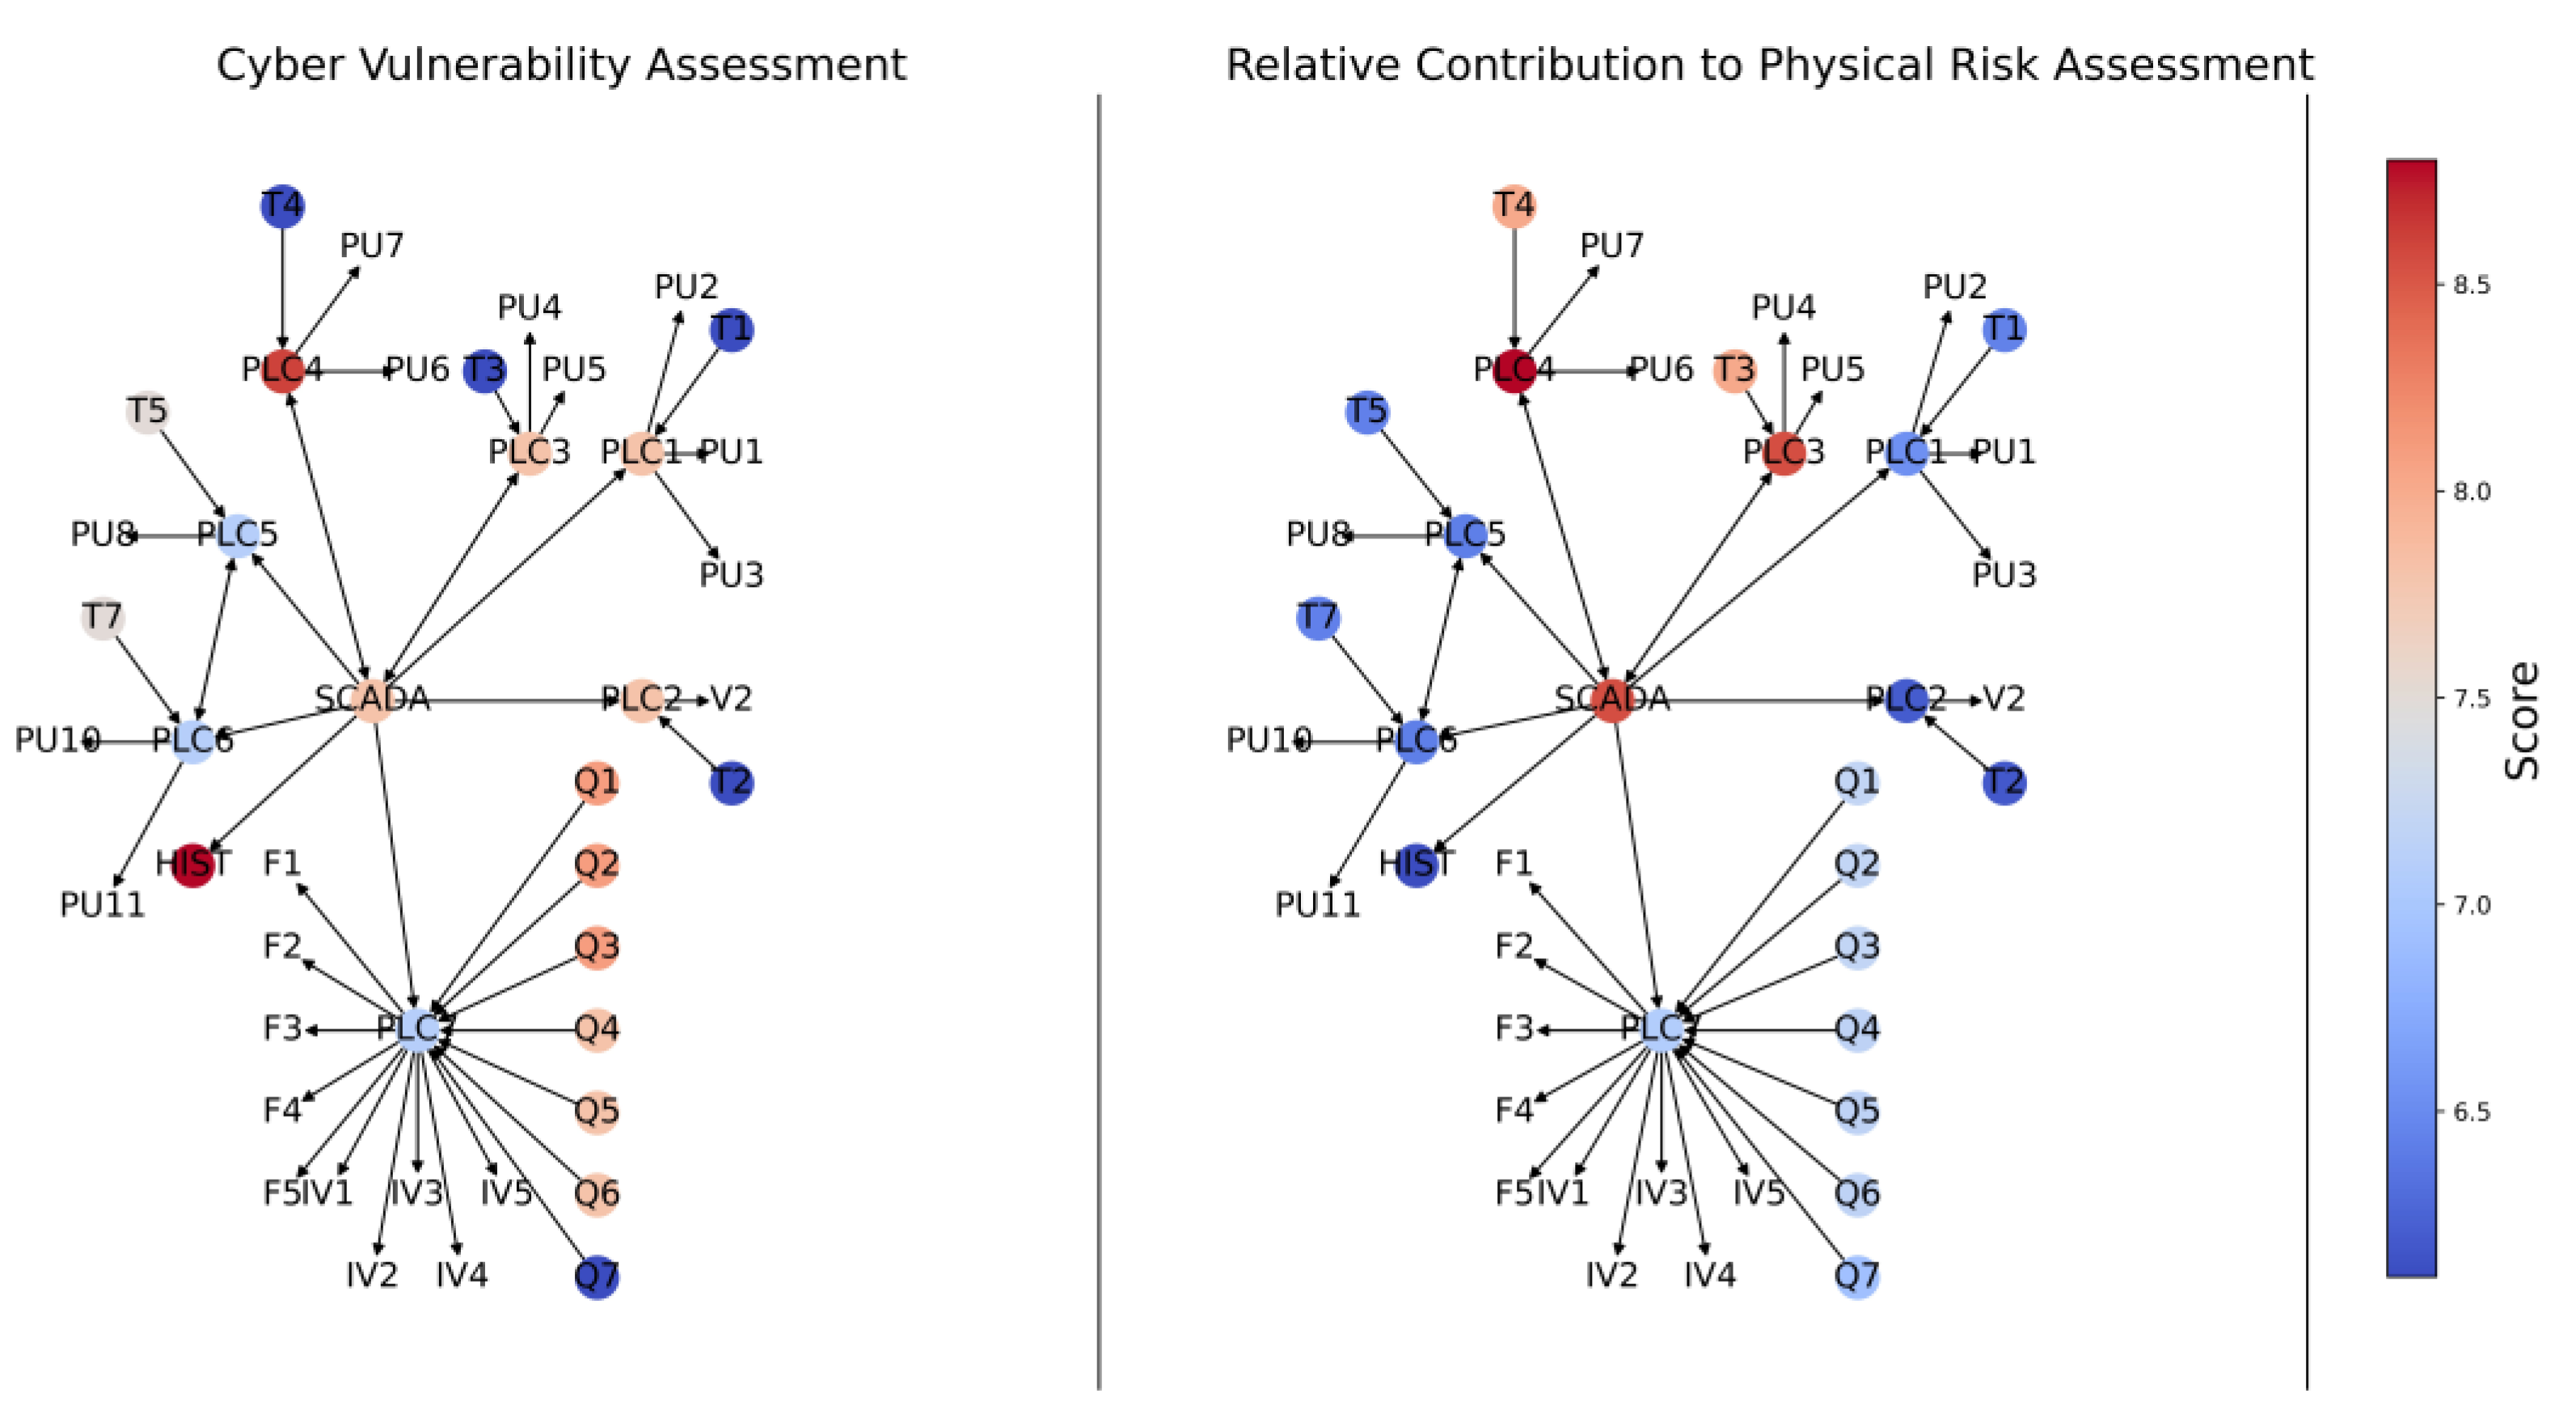
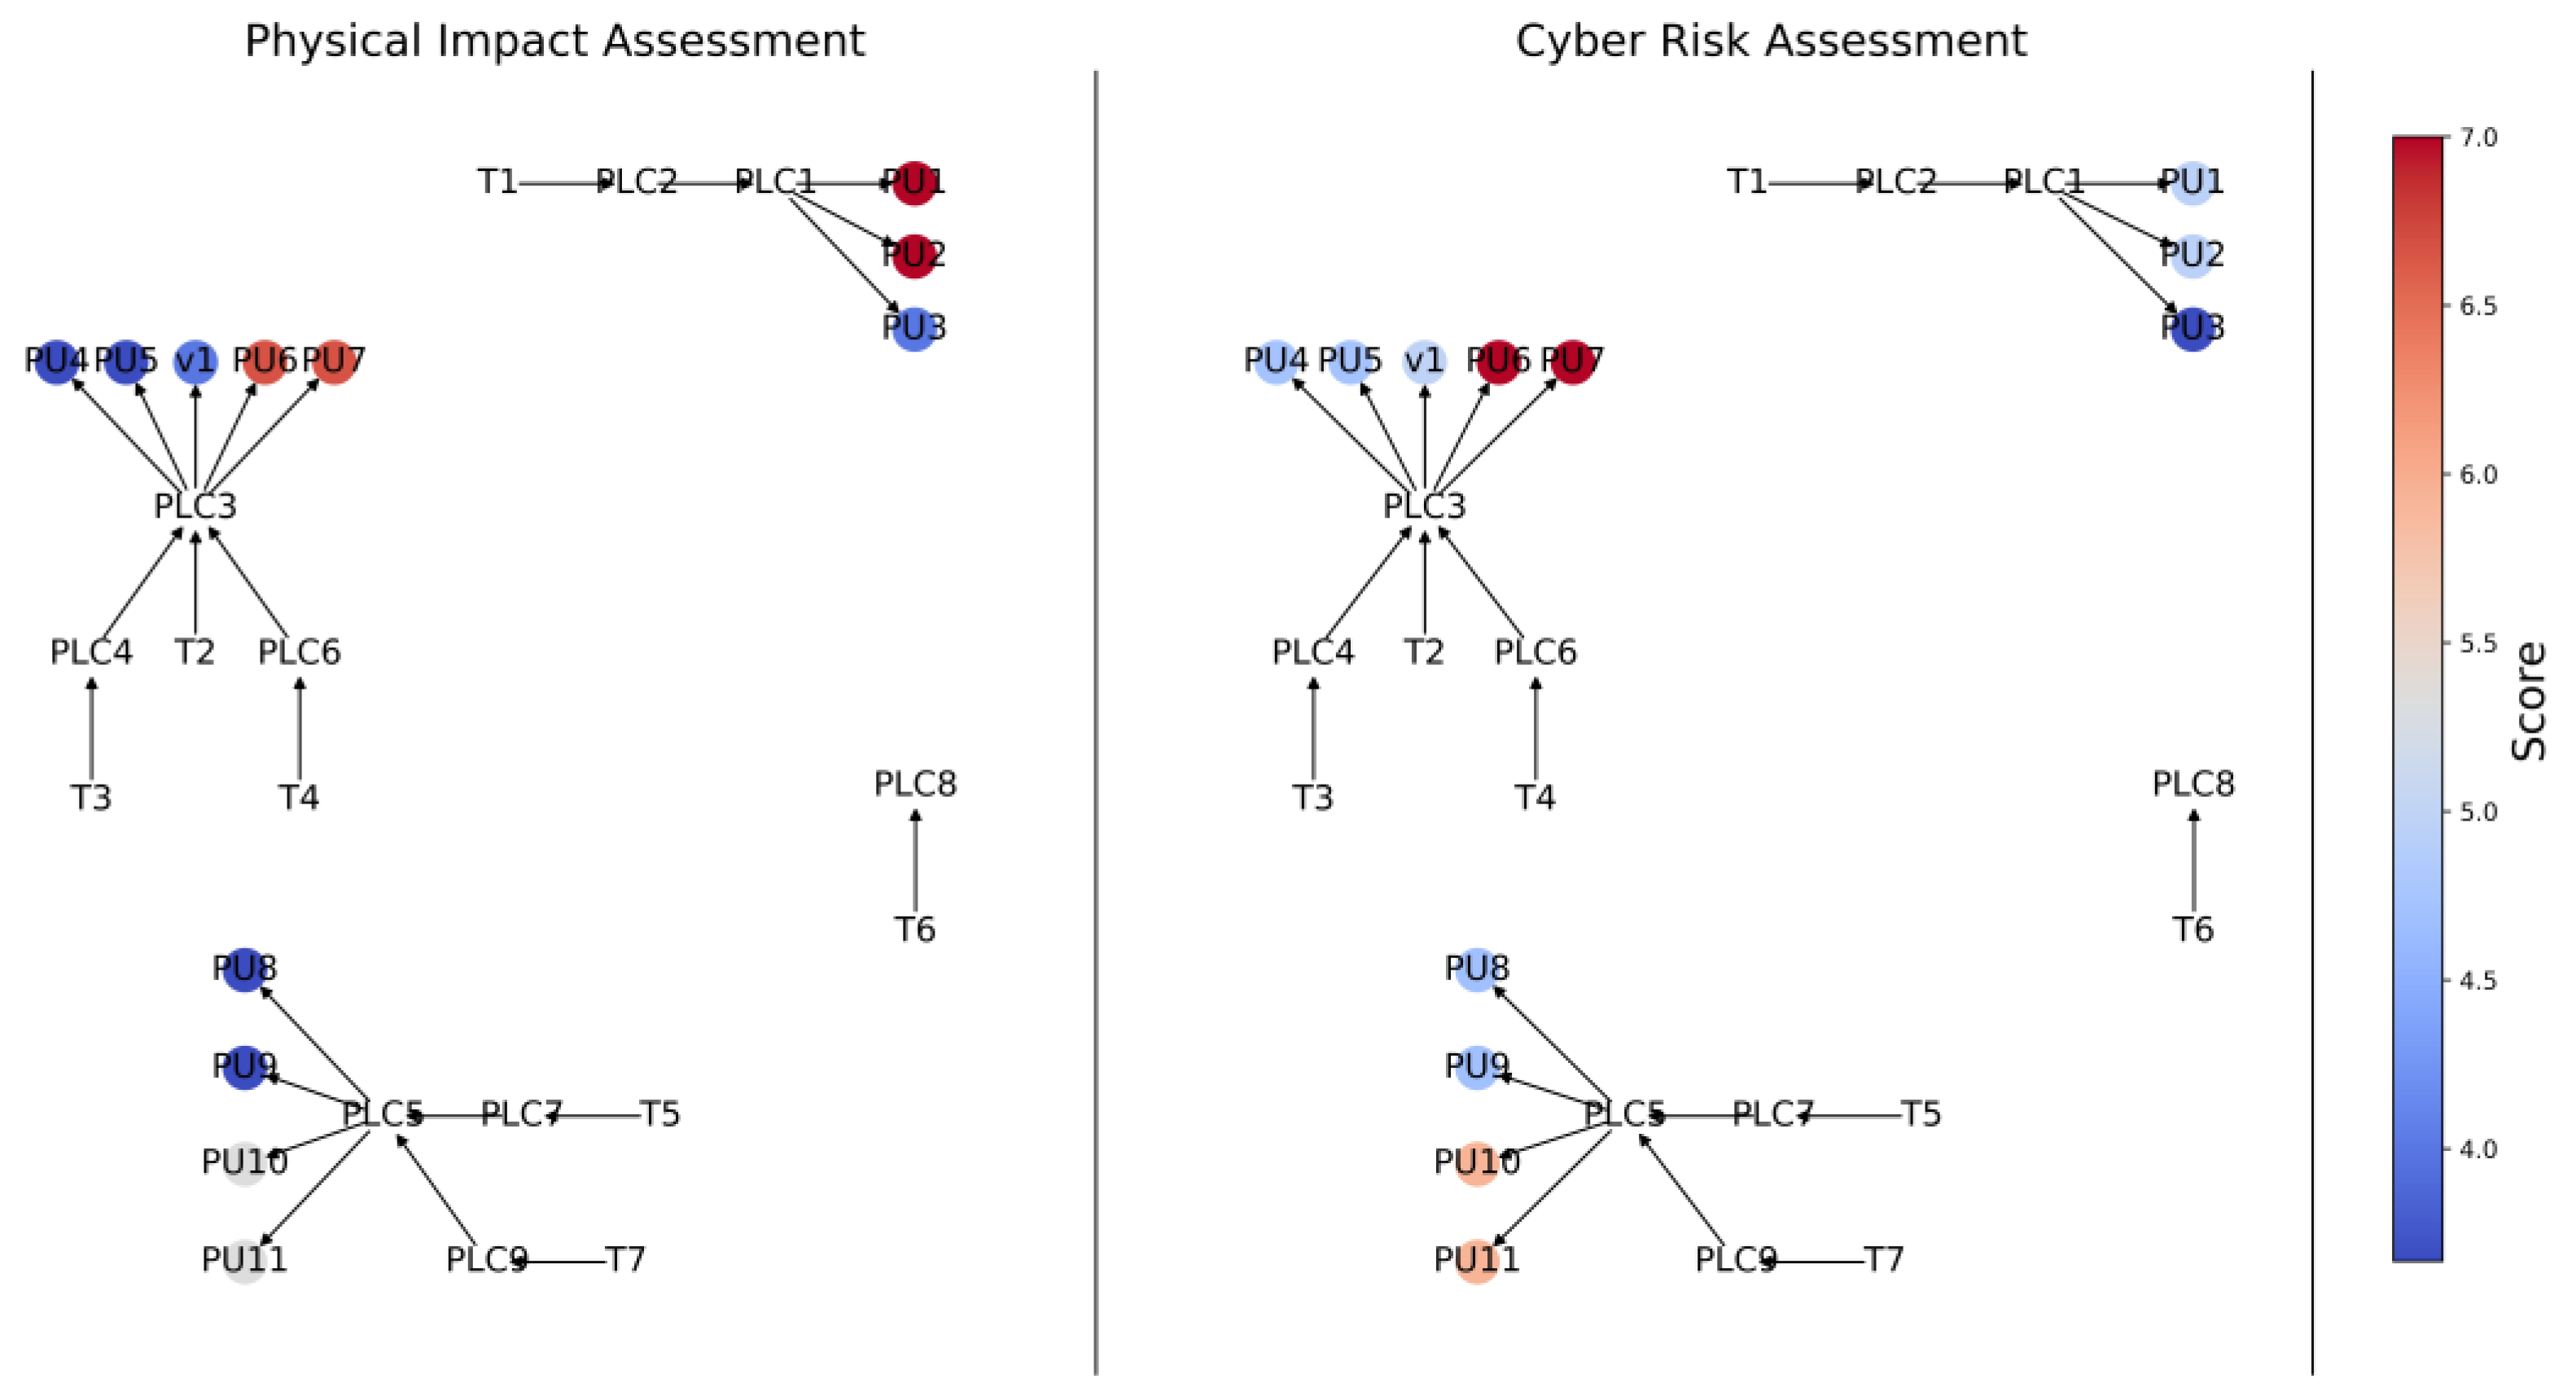
Figure 3. A key feature of the approach is that it uses information from both the cyber (Step 1) and physical (Step 2) domains, as well as the way these are connected (Step 3), to quantify the relative cyber vulnerability (i.e., the relative likelihood of being attacked) (Step 4) and risk (Step 6) of each component in the physical system, in addition to the relative contribution of each cyber component to the impact (i.e., the physical infrastructure response to the attack) (Step 5) and risk (Step 7) in the physical domain. Risk is defined as the product of the vulnerability (likelihood) and impact (consequence) [
35].
Another key feature of the proposed approach is that it has been designed to be easy to use, catering to users with differing degrees of expertise, knowledge, resources, and requirements. Consequently, it can be used either by generalists or specialists working to reduce the risks to physical infrastructure due to cyber threats. Furthermore, it can be easily modified to incorporate different types of data sources to suit the context of the assessment. The outputs produced can also be visualised in heat maps for improved understanding and communication of the risks to CPSs.
Details of each of the steps in the proposed approach (
Figure 3) are given in the following sub-sections. It should be noted that although the approach is illustrated here through an application to water infrastructure, it is designed as a generic approach applicable to all types of CPS infrastructure networks.
Figure 3.
Proposed approach to assessing the relative systemic risk of cyber–physical systems by considering the interactions between the cyber and physical components of such systems explicitly.
Figure 3.
Proposed approach to assessing the relative systemic risk of cyber–physical systems by considering the interactions between the cyber and physical components of such systems explicitly.
2.1. Step 1—Quantify Cyber Vulnerability
As shown in
Figure 3, the first step in the proposed approach involves the assignment of a vulnerability score
) to each of the
j components in the cyber network, as is generally performed when performing risk assessments that are restricted to the cyber domain. This score can be thought of as analogous to a probability of a successful attack at the component in question and is affected by contributing factors such as potential attack vectors, complexity, privileges required, user interaction needed, and effect on confidentiality, integrity, and availability.
Whilst this score can be informed by any metrics that may provide insight into the possibility of cyber compromise, the Common Vulnerability Scoring System (CVSS) described in
Section 1 is recommended [
34], as it is an existing scoring system that is used extensively in the literature [
36,
37,
38,
39] and industry [
40]. As mentioned in
Section 1, CVSS scores range from zero to ten and take account of a range of factors related to vulnerability and impact in the cyber domain. In cases where there are multiple common vulnerability exposures (CVEs) related to a cyber component, these can be combined through determining the mean CVSS score, taking the maximum of the vulnerability scores, or by using other score aggregation techniques, as considered most appropriate for the case study under consideration.
2.2. Step 2—Quantify Physical Impact
As shown in
Figure 3, the second step in the proposed approach involves the assignment of a physical impact score
) to each of the
k components in the physical network that could be susceptible to failure through a CPA. Such impacts are generally affected by contributing factors such as customer outcomes (pressure, supply), remediation requirements, and criticality to network function. While these impact scores can be obtained using a range of methods, such as hydraulic modelling in the case of water distribution systems [
18,
24], for the sake of simplicity and consistency, an approach that mirrors the development of CVSS 4.0 scores for individual cyber component vulnerabilities is proposed to determine the physical impact scores.
Following the CVSS 4.0 methodology, impact scores ranging from zero to ten are obtained for each physical asset by weighting scores from three metrics affecting the physical impact that are obtained for each asset using expert opinion (Equation (1)):
These metrics include time to failure (
TtF), severity of failure (
SoF), and time to remediation (
TtR), as these are simplified versions of commonly used performance-based measures when assessing the risk of failure of a water distribution system (WDS) (
Table 1) [
41,
42,
43]. Time to failure is defined as the expected time it takes until the system performance enters an unsatisfactory state. For example, should a pump fail, it is expected that customers will eventually have unmet demand. Despite this, water in holding tanks can be used to satisfy demand for a period of time, increasing the expected time to failure. Severity of failure is defined as the expected maximum potential impact of the failure of a physical asset and time to remediation is defined as the expected time it takes for a physical asset to return to a functional state following failure. As shown in
Table 1, each of these metrics is assigned a score of 1, 5, or 10 depending on the perceived severity of the impact. It should be noted that as is the case for the cyber vulnerability scoring, other information regarding the physical assets under consideration can also be used to inform the impact score, such as the results of CPA stress testing [
44].
Table 1.
Scoring matrix for the physical impact score of a physical asset.
Table 1.
Scoring matrix for the physical impact score of a physical asset.
| Metric | Score = 1 | Score = 5 | Score = 10 |
|---|
| Time to failure (TtF) | Slow | Medium | Fast |
| Severity of failure (SoF) | Low | Medium | High |
| Time to remediation (TtR) | Fast | Medium | Slow |
2.3. Step 3—Develop Control Graphs
As shown in
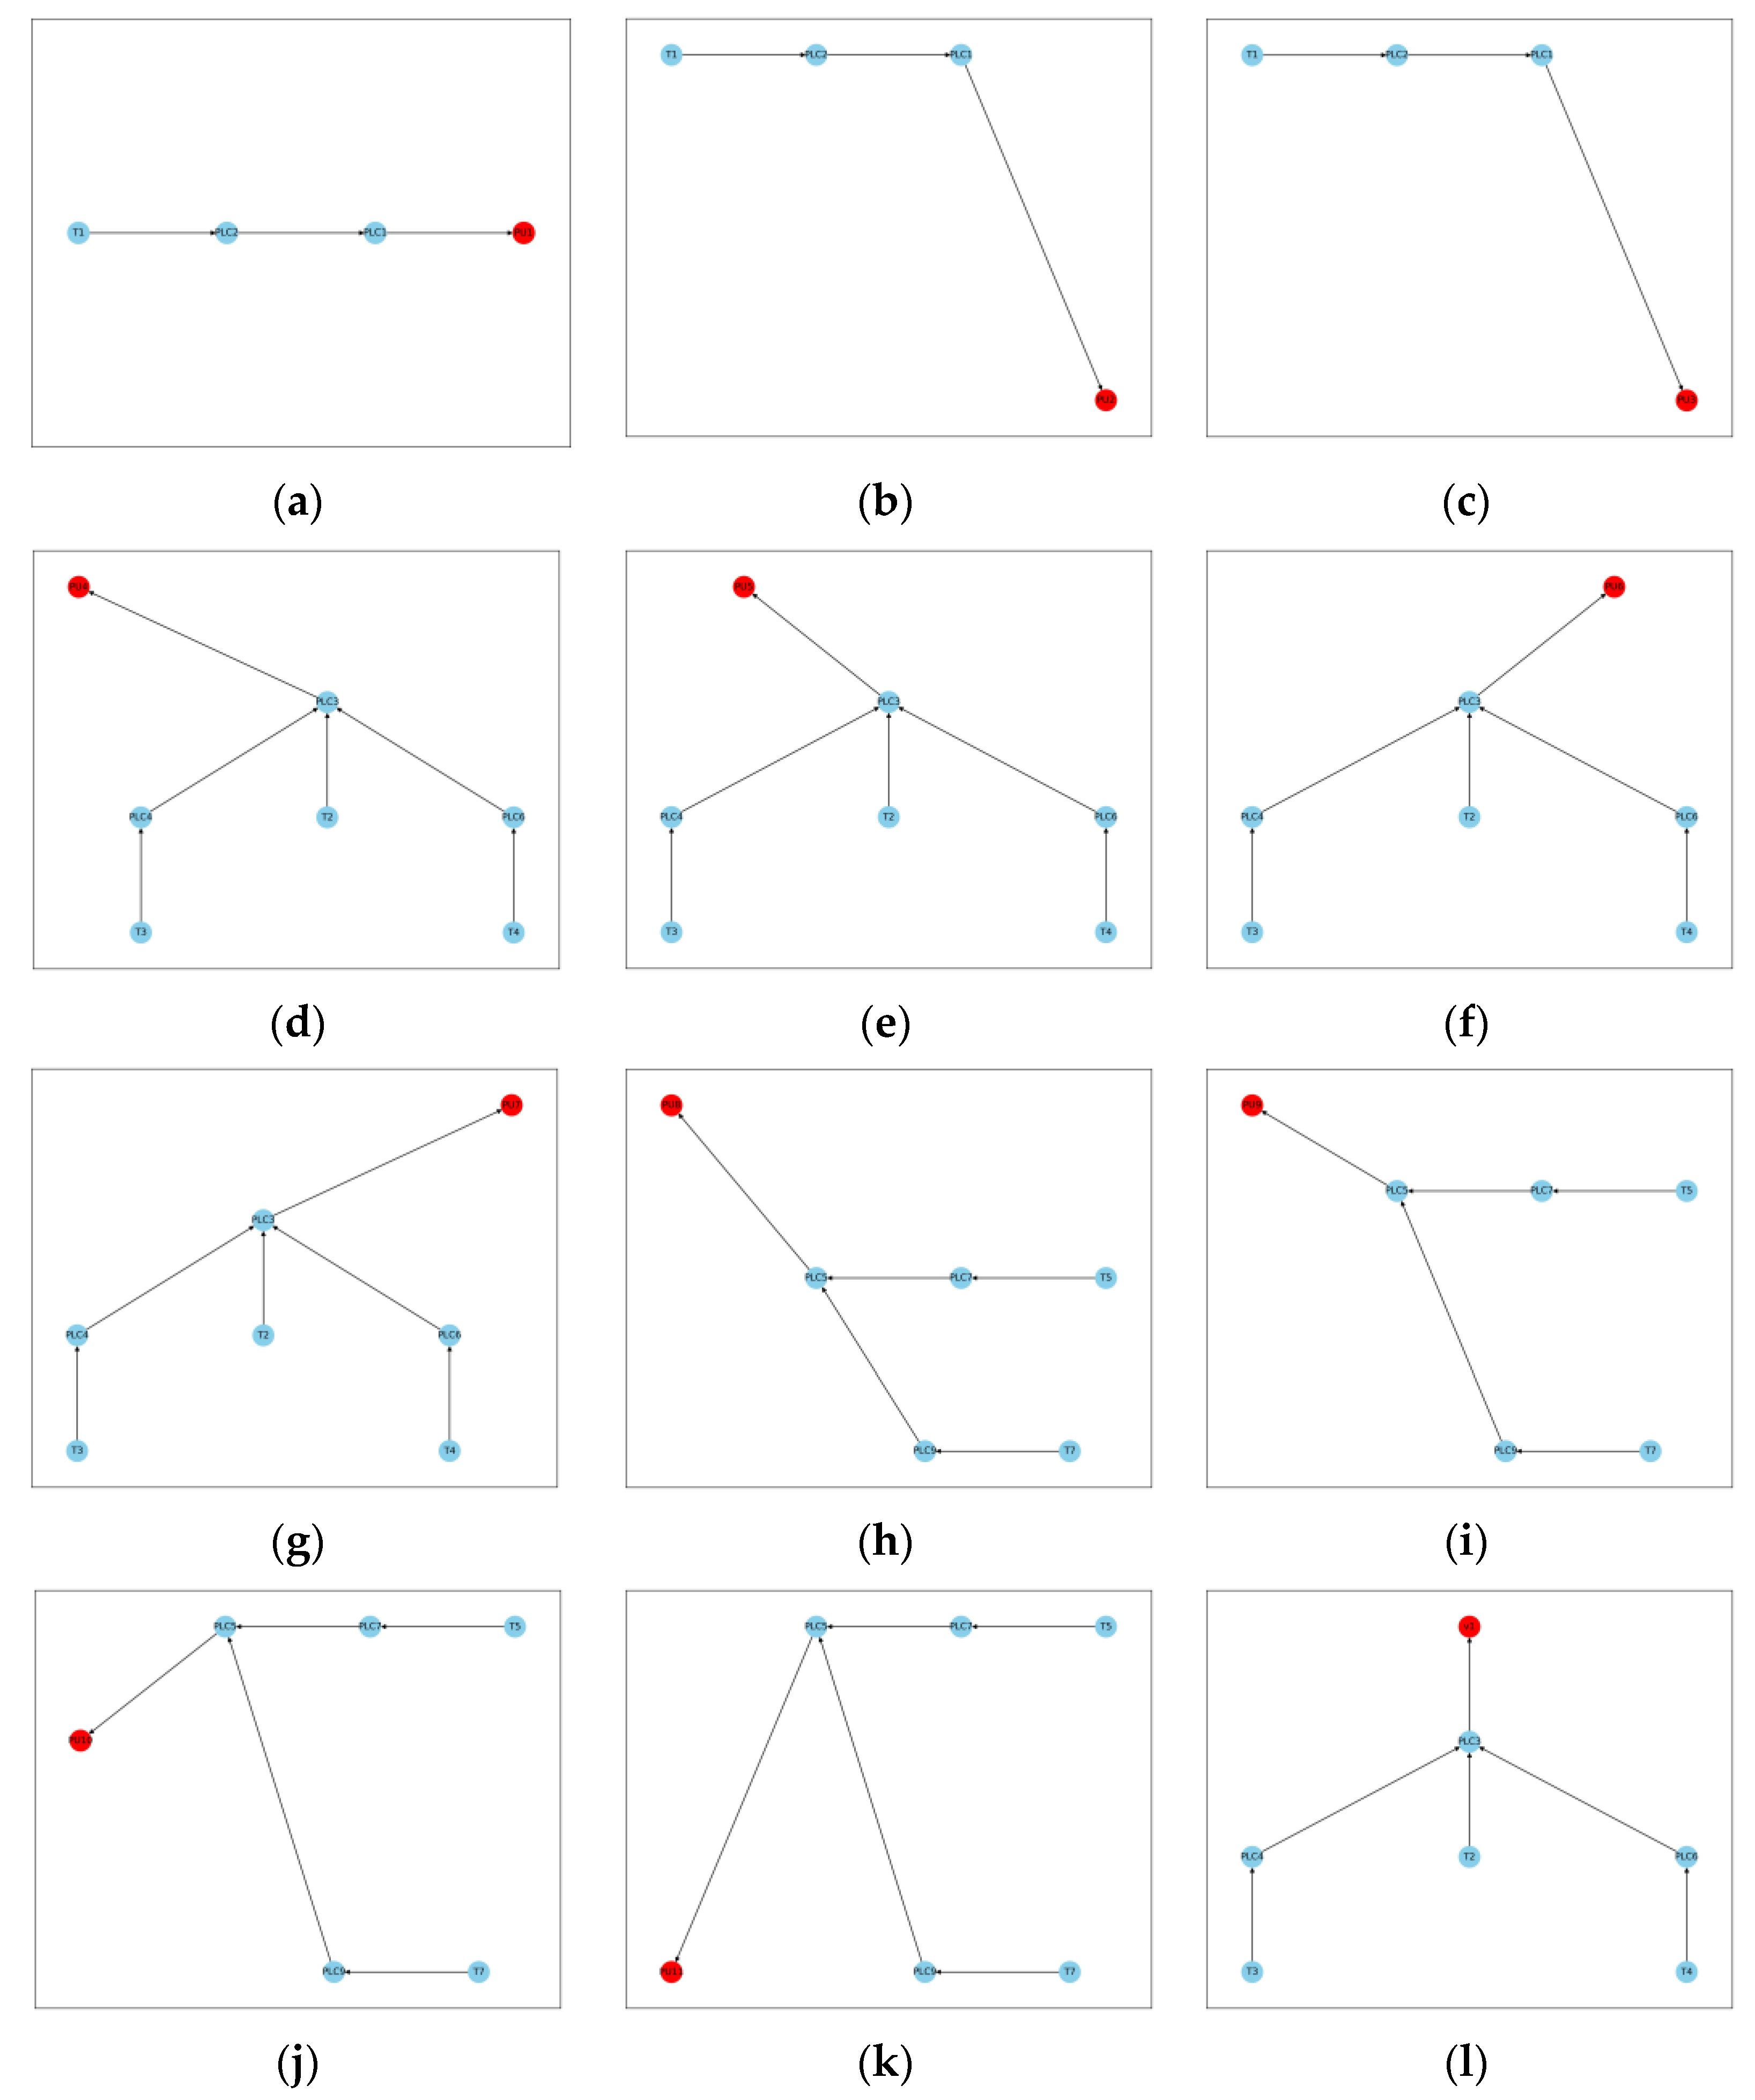
Figure 3, the third step in the proposed approach involves the determination of which cyber components are connected to, and therefore have an influence on, each of the physical assets. This is achieved by determining the control graph [
45] for each physical asset, which is defined as the connected sub-graph within the network that contains sensing and logic nodes (i.e., cyber components) that control the node of interest (i.e., physical asset). A key innovation is to utilise these cyber control graphs for each physical asset in risk assessment, directly connecting a set of cyber components to each physical asset. This enables the cyber risk of each asset in the physical realm to be quantified based on an assessment of the vulnerability of individual components in the cyber realm, and vice versa (see
Figure 3), thereby crossing the cyber–physical divide.
In order to determine the control graphs for each of the physical assets of interest, the entire CPS must first be represented as a directed graph, a common format for the depiction of a CPS [
46]. Within this graph, nodes represent cyber components and physical assets, and the edges indicate a flow of information or control between components/assets. These directed edge relationships are determined either by a manual process of investigating the network dynamics, implied from infrastructure control rules, or can be automated with the aid of active or passive network scanning tools [
10]. The nature of these directed edges can also be affected by cyber-security practices such as network segmentation and firewall rules that regulate the networks’ communication. Identifying the boundary for such assessments is a challenge given the potential number of connected components; however, this is not the focus of the proposed approach. Once the overall CPS graph has been developed, the connectivity of each cyber component to physical assets is defined as the sub-graph of the parent and ancestor nodes for each physical asset.
The cyber components that are grouped into their sub-graph by their connection to physical assets constitute the control graph for that physical asset. This establishes the relationship between the cyber and physical network, crossing the divide between the two domains. In this implementation, it is assumed that a compromise of any of these components within the control graph will cascade to cause the failure of the physical asset to which it is connected, thereby providing an upper bound to risk.
2.4. Step 4—Quantify Relative Cyber Vulnerability of Physical Assets
As shown in
Figure 3, the fourth step in the proposed approach involves the calculation of the relative cyber vulnerability of each of the physical assets under consideration
) (Equation (2)). As can be seen from Equation (2), these values represent the ratio of the cyber vulnerability of physical asset
k (see Equation (3)) to the maximum cyber vulnerability of any of the physical assets under consideration
, thereby providing information on the relative vulnerability of the different physical assets in the system under consideration to CPAs
and
As can be seen from Equation (3), the cyber vulnerability of physical asset k is the weighted sum of the cyber vulnerability scores ) of the m individual cyber components that are connected to physical asset k (i.e., the number of cyber components in the control graph of the physical asset under consideration). It should be noted that the vulnerability scores of the cyber components are determined in Step 1 and which m cyber components are connected to physical asset k is determined in Step 3. The weights used in the calculation of the cyber vulnerability of physical asset k (see Equation (3)) represent the relative perceived importance of each connected cyber component (e.g., based on its level of data traffic), thereby increasing the generality and flexibility of the proposed approach. In the absence of information on the relative importance of each cyber component, these weights should be set to 1.
It should be noted that the functional relationships used to calculate the cyber vulnerabilities of each of the physical assets under consideration (Equations (2) and (3)) can also be altered depending on user needs and preferences (see
Appendix A,
Table A1 for examples).
2.5. Step 5—Quantify Relative Contribution of Cyber Components to Physical Impact
As shown in
Figure 3, the fifth step in the proposed approach involves the calculation of the relative contribution of each cyber component
j to the impact in the physical domain
) (Equation (4)). As can be seen from Equation (4), these values represent the ratio of the physical impact contributed to by cyber component
j (see Equation (5)) to the maximum physical impact contributed by any of the cyber components under consideration
, thereby providing information on how important a particular cyber component is to the process function of the CPS
and
As can be seen from Equation (5), the contribution of cyber component
j to the impact in the physical domain
is the weighted sum of the impacts of each of the
n physical assets that cyber component
j is connected to. It should be noted that the impact scores of the physical assets are determined in Step 2 and which
n physical assets that cyber component
j connects to is determined in Step 3. The weights
used in the calculation of the contribution of cyber component
j to the impact in the physical domain
(see Equation (5)) represent the relative perceived importance of each connected physical asset (e.g., based on topological attributes of the assets [
47,
48]), thereby increasing the generality and flexibility of the proposed approach. In the absence of information on the relative importance of each physical asset, these weights should be set to 1.
It should be noted that the functional relationships used to calculate the relative contributions of each of the cyber components under consideration to the impact in the physical domain (Equations (4) and (5)) can be altered in the same way as Equations (2) and (3), depending on user needs and preferences (see
Appendix A,
Table A1 for examples).
2.6. Step 6—Quantify Relative Cyber Risk of Physical Assets
As shown in
Figure 3, the sixth step in the proposed approach involves the calculation of the relative cyber risk of each of the physical assets under consideration
) (Equation (6)). As can be seen from Equation (6), the relative cyber risk of physical asset
k is the product of its relative cyber vulnerability (i.e., likelihood of being attacked successfully)
) (Step 4—Equation (2)) and its physical impact score
) (Step 2—Equation (1)):
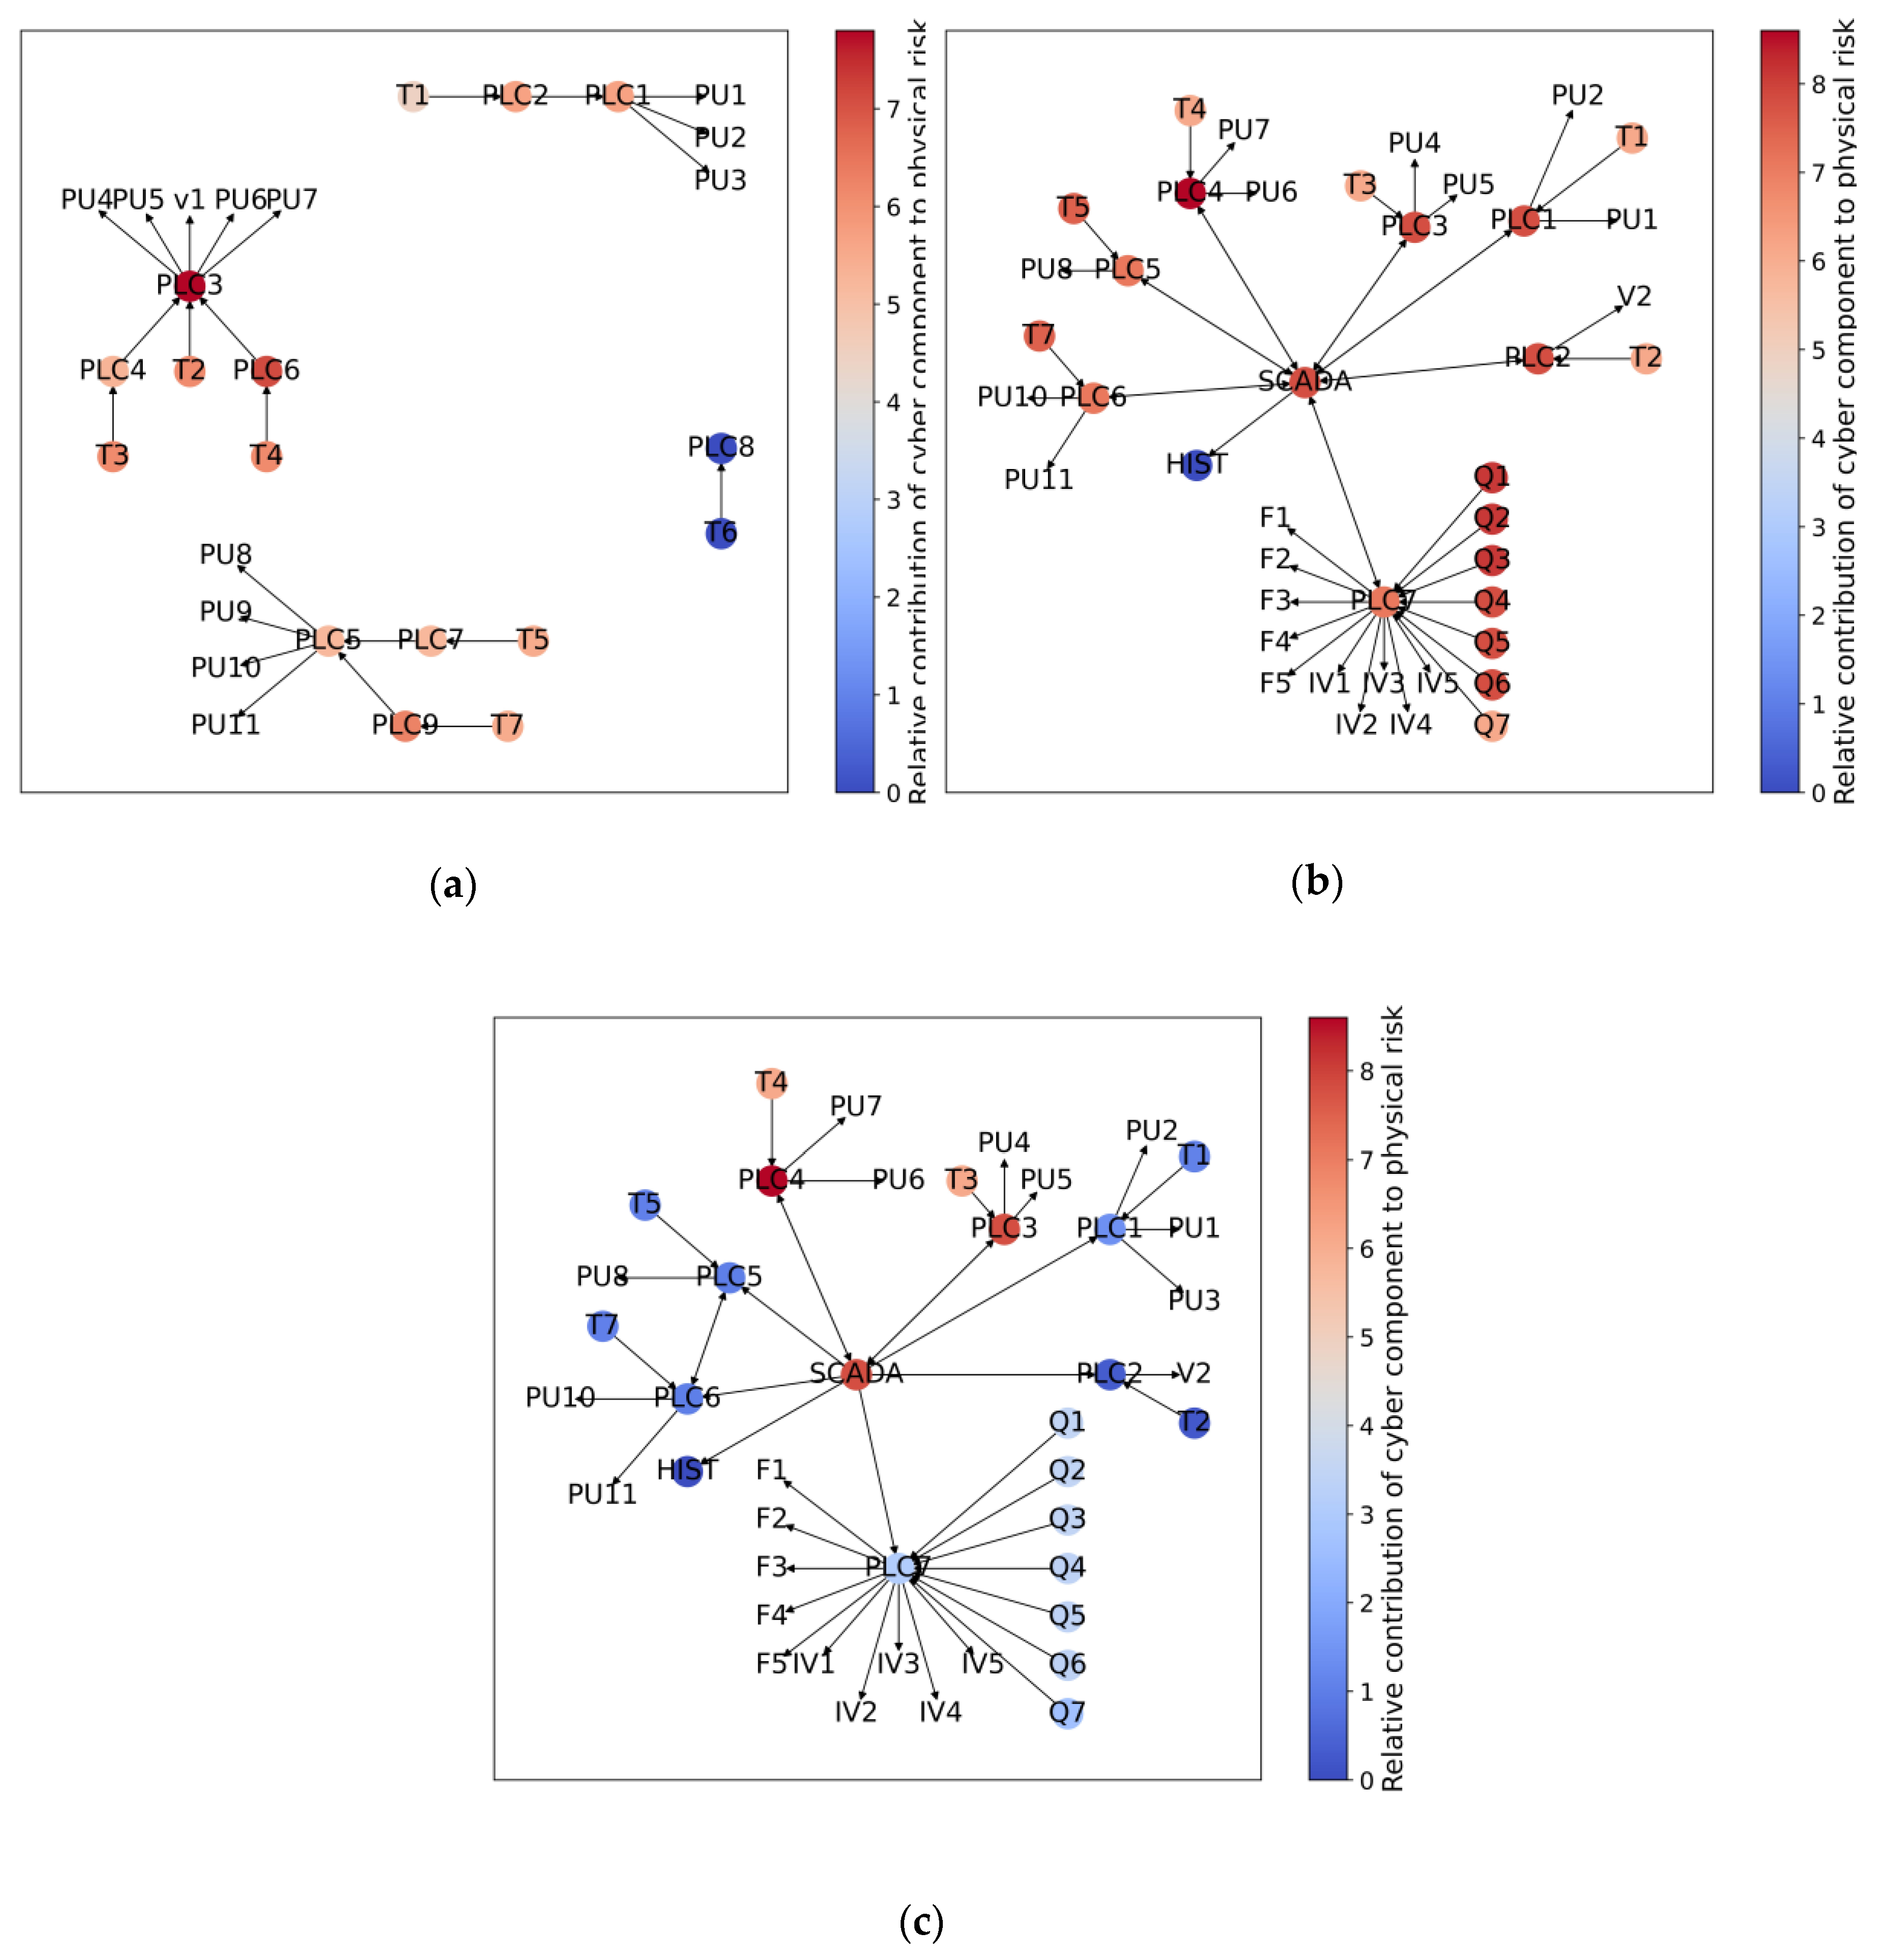
These relative risk values can provide invaluable information to network managers on the relative risks of different physical assets to CPAs. The relative cyber risk scores for different physical assets can be colour coded (e.g., low, medium, high) and represented in a heat map to better assist managers with the identification of cyber risk “hot spots”. This information can then be used in tandem with other asset management data (component criticality, asset life, etc.) to gain a more complete understanding of the risk of any connected physical asset and the topological distribution of risk. The use of a colour-coded visualisation is also a way to assess the relative effectiveness of different risk mitigation strategies. This type of output is intuitive and regularly used by physical asset managers, allowing the proposed approach to be incorporated into current physical risk assessment methods with ease. This interoperability afforded by a common output allows the outcomes of this methodology to be combined with existing infrastructure knowledge, such as that of physical performance and criticality analyses, to determine what the interplay between these different types of risk may be.
2.7. Step 7—Quantify Relative Contribution of Cyber Components to Physical Risk
As shown in
Figure 3, the seventh step in the proposed approach involves the calculation of the relative contribution of a particular cyber component
j to physical risk
(Equation (7)). As can be seen from Equation (7), the relative contribution of cyber component
j to the risk in the physical domain is the product of its vulnerability in the cyber domain (i.e., likelihood of being attacked successfully)
(Step 1) and its relative contribution to the impact in the physical domain
) (Step 5—Equation (4)):
These values of the relative contribution of different cyber components to the physical risk provide invaluable information to network managers on where to prioritise risk mitigation efforts. These values can also be visualised through a heat map, providing a rapid overview of which cyber components are of most concern.
5. Conclusions
Critical infrastructure systems around the world have become cyber–physical systems (CPSs). These systems are becoming more advanced, resulting in more interdependence within the system and leading to an increased risk of cyber–physical attacks (CPAs). Despite the close ties between the operation of cyber and physical networks, there exists a divide between these domains in the assessment and management of risk.
This paper presents a novel approach to quantifying the cyber risk faced by physical assets in a CPS and the physical risk of a cyber component being compromised. This assessment bridges the cyber–physical divide between the two domains. This is achieved by using control graphs, assigning scores to the relevant cyber components and physical assets, and aggregating the relevant information in the other domain at each physical asset or cyber component. Furthermore, this information can then be conveyed such that physical asset managers can understand the cyber risks across their network with a heat map of the cyber risk of physical assets. By mapping this risk spatially in the physical domain rather than at the cyber network, the proposed method can facilitate decision-making and mitigation in the physical network through redundancies and other methods.
When applied to a benchmark case study CPS from the literature, the water distribution system of C-Town, the results obtained using the proposed approach showed that the quantitative estimates of the relative risk of physical assets due to their connection to cyber components (Objective 2a) and the relative contribution of different cyber components to this risk (Objective 2b) varied significantly for the three different configurations of the cyber network considered, highlighting the importance of considering the connection between cyber and physical systems in risk assessments of cyber–physical systems. The importance of crossing the cyber–physical divide was reinforced further by the results of the comparison of the relative risk rankings obtained using the proposed and more conventional approaches to risk assessment (Objectives 2c and 2d), as there was a difference in risk prioritisation in almost all cases. In addition, the results of this comparison also showed that different network structures changed the risk posture of the CPS.
While the proposed approach is a novel way to assess cyber–physical risk within a CPS, which can provide insights that have previously not been possible, there are a number of potential issues that need to be overcome when the approach is applied in practice:
In the case study networks tested, a CVE and corresponding CVSS score is assumed to exist at every cyber component. In real networks, this may not be the case, or the CVEs may be distributed amongst the supporting firmware, software, and communication channels between the components, making them difficult to assign to a particular component. However, other cyber vulnerability information could be used instead of the CVE and CVSS system, which could address some of these potential issues. Alternatively, these issues can be dealt with using a participatory approach with networking professionals that understand the CPS network in detail. The proposed approach is sufficiently flexible to accommodate these alternatives.
The case study networks have simplified the sensor hardware, software, firmware, and supporting communications channels by assuming they exist as one cyber component sensor node, with an associated vulnerability. In practice, this may need to be expanded to better convey accurate information to cyber-security professionals looking to mitigate these risks.
The assumption has been made that any failure from a vulnerability at a component will cause a downstream failure of the physical asset. Whilst this is a necessary simplification to make for the assessment process, this does not hold true in all situations—some cyber vulnerabilities are specific to the confidentiality of data as opposed to the availability of the service that facilitates operations. Similarly, some cyber-related incidents may not be CPA events, but other forms of intrusion, such as to gain information or a foothold into the network for further exploitation. Despite this, the assumption that any vulnerability can cause a failure is a worst-case-scenario outlook and can be considered appropriate for a risk assessment for such critical infrastructure.
The proposed assessment methodology is difficult to validate in practice. Due to the human agency involved in a CPA, validation of a method such as this is impractical. In order to combat this, when using this approach, the individual parts of the method that can be validated should be. These include undertaking process and logic validation through consultation with peers [
55] regarding the scoring determined for each component and the development of the network graph, to ensure the correct flow of information and control.
Despite these potential limitations, the results obtained clearly demonstrate the need for and value of the proposed approach. By crossing the cyber–physical divide, the approach is able to provide more accurate assessments of the relative risk of physical assets that result from their connection to cyber components, as well as more accurate assessments of the relative contribution of different cyber components to this risk, showing promise in its ability to join the often disparate cyber and physical risk assessment methodologies. This also opens to the door to more effective ways of prioritising cyber risk mitigation strategies.

